Embed Size (px)
Citation preview
In pursuit of tax equity: lessons from VAT rate structure adjustment in Poland
ARTUR ŚWISTAK, M.A., M.P.S., PhD candidate*�SEBASTIAN WAWRZAK, M.A., PhD candidate*AGNIESZKA ALIŃSKA, PhD, Assoc. Prof.*
Article**�JEL: D12, H23, H24, K34doi: 10.3326/fintp.39.2.1
* The authors wish to thank Ruud de Mooji, Francisco Vazquez and Robert Sierhej (all IMF), and three anonymous referees for their valuable comments. All errors and omissions are the authors’ only. Research project is funded by National Science Centre, Poland (Grant No. DEC2013/09/B/HS4/03610).
** Received: May 20, 2014 Accepted: February 15, 2015A previous version of this paper was presented at the conference Tax Reforms: Experiences and Perspectives organized by the Institute of Public Finance, Faculty of Economics and Business, Zagreb and Faculty of Economics, Rijeka in Zagreb on June 20, 2014.Artur ŚWISTAKInternational Monetary Fund, Fiscal Affairs Department, 1900 Pennsylvania Ave NW, Washington, DC 20431, USA email: [email protected] WAWRZAKWarsaw School of Economics, al. Niepodległości 162, 02554 Warsaw, Polandemail: [email protected] ALIŃSKAWarsaw School of Economics, al. Niepodległości 162, 02554 Warsaw, Polandemail: [email protected]
artu
r śwista
k, seba
stian w
awr
zak, a
gn
ieszka a
lińsk
a:in pu
rsu
it of ta
x equ
ity: lesson
s fro
m vat rate str
uc
tur
e ad
justm
ent in po
lan
dfin
an
cia
l theo
ry an
d pr
ac
tice
39 (2) 115-137 (2015)
116 AbstractIn 2011, in the aftermath of the economic crisis, Poland increased its value added tax rates. Despite an already large VAT policy gap, further rate differentiation was used to address distributional concerns and to protect the most vulnerable households. We find that the changes to the VAT rate structure hardly improved the overall progressivity of the VAT and the tax system as a whole. While providing only minimal relief to the poor, taxation of food products at a super reduced rate greatly subsidized the richer households. With a small change to the income tax structure, the government could have secured more progressivity at a lower cost in terms of revenue foregone.
Keywords: value added tax, household consumption, income distribution, tax pro-gressivity, VAT reduced rates, Polish tax reform experience
1 INTRODUCTIONThe effectiveness of pursuing vertical equity objectives through value added tax (VAT) has been long questioned in economic literature (Cnossen, 1982; Tait, 1988; Ebrill et al., 2001; OECD, 2010). Yet policymakers invariably exhibit a particular liking for VAT rate differentiation. Even if desperate to raise revenue, they seem to prefer to increase the general VAT rate rather than to eliminate reduced rates and exemptions. This is the experience of the EU countries that undertook fiscal consolidation in response to the recent financial crisis (IMF, 2013). Most of them favored outright VAT rate increases over the much advocated base broadening and closing the gap between standard and reduced rates (Garnier et al., 2013).
The Polish experience has not been different. While seeking additional revenue the government opted for a universal VAT increase rather than abolition of reduced rates. In 2011 both the standard and the reduced rates were raised by one percentage point. At the same time, the rate on most food products was further lowered thus widening the VAT rate gap. Such rate adjustment was driven by the government desire to protect the most vulnerable and improve the overall progressivity of the tax regime (PRM, 2010). But the question is raised as to whether pursuing these objectives through VAT is the right policy choice. Can we afford to help the poor by subsidizing the rich?
The objective of this paper is to evaluate the distributional impact of the 2011 changes to VAT rate structure in Poland and assess whether the reform was successful in achieving distributional objectives or perhaps there might have been better alternatives to mitigate the impact of general VAT increases. We use data from the household budget survey and estimate the impact of VAT for households across the income distribution for the actual reform and an alternative scenario where the VAT rate on food is not reduced. In our analysis we measure VAT incidence in two ways: (1) relative to consumption which we take as a proxy for lifetime income, and (2) against annual income. We use gross rather than disposable
artu
r śwista
k, seba
stian w
awr
zak, a
gn
ieszka a
lińsk
a:in pu
rsu
it of ta
x equ
ity: lesson
s fro
m vat rate str
uc
tur
e ad
justm
ent in po
lan
dfin
an
cia
l theo
ry an
d pr
ac
tice
39 (2) 115-137 (2015)��7income in order to arrive at a comparable benchmark for VAT and income tax
burden.
There is no shortage of Polish literature analyzing the redistributive effects of indirect taxes (see for example: Nagel and Neneman, 1995; Radziukiewicz, 2011; Dobrowolska and Starzynska, 2011). Amongst foreign academics, perhaps the first insights into the Polish VAT rate structure and its implications were provided by Cnossen (1998). Only recently, with Poland’s accession to the EU has the coverage of the equity aspects of VAT in Poland improved. Many academics (e.g. Borselli et al., 2012) and various European institutions (e.g. European Commission, 2011) embarked on analyzing the structure, performance and redistributive impact of the Polish VAT, mostly as part of broader and comparative studies. To the best of our knowledge, however, the incidence of the recent adjustments of the VAT rates in Poland has not been subject to a rigorous analysis. This paper is aimed to partially fill this gap.
The remainder of the paper is divided into three parts. First, we briefly review theoretical aspects of VAT distributional impact, focusing on the rationale and effects of rate differentiation as well as measurement of VAT incidence. Then, we describe the Polish VAT structure and performance and explain in greater detail the VAT reform analyzed. Finally, we evaluate changes in VAT redistribution as a result of the reform.
2 VAT AND DISTRIBUTIONAL EQUITY 2.1 OBJECTIVES OF VAT RATE DIFFERENTIATION Value added tax is one of the most popular taxes. In one or another form it has now been implemented worldwide by an overwhelming majority of countries. The actual causes and consequences of the spread of VAT have been little investigated empirically (Keen and Lockwood, 2010). Yet countries find it a good replacement to their often obscure and less efficient production, trade or retail sales taxes. Once introduced, VAT becomes an inherent part of tax systems.�
VAT owes its remarkable popularity to its design. Many features are undeniably appealing. By taxing domestic consumption VAT raises significant amounts of revenue in an efficient and stable manner.� On average it raises revenue amounting to seven percent of GDP in high income countries and five percent of GDP in lowincome countries with an upward trend (Keen, 2013b). It serves as an effective replacement for trade taxes being now successively curtailed due to regional integration and ongoing trade liberalization. Most importantly, however, VAT raises revenue without hampering investment and savings. It is also fairly simple in
� There are only a few instances where it was abolished, e.g. Malta, Vietnam, Grenada; and this happened mostly due to poor planning and implementation, rather than VAT design per se (Grandcolas, 2005). Most of these countries have now reintroduced a form of VAT.� Although VAT revenue exhibits a pattern of procyclicality (see Ebeke and Vazquez, 2014) its fluctuation is less pronounced than income taxes.
artu
r śwista
k, seba
stian w
awr
zak, a
gn
ieszka a
lińsk
a:in pu
rsu
it of ta
x equ
ity: lesson
s fro
m vat rate str
uc
tur
e ad
justm
ent in po
lan
dfin
an
cia
l theo
ry an
d pr
ac
tice
39 (2) 115-137 (2015)
118 terms of compliance. If well designed it has most of the attributes of a “good” tax (IMF, 2011; Bird and Gendron, 2007).
Although there are plenty of reasons to praise VAT, its distributional impact raises a lot of concerns amongst policymakers.3 Over the years, VAT has gained a reputation as a regressive tax and this perception seems nowhere close to fading away. It does persist, at least at policymaker’s level, and results in various attempts to make VAT a more progressive tax (e.g., Matheson and Swistak, 2014). Rate differentiations and exemptions are used for this purpose. On the surface the policy argument seems to be straightforward – with lower VAT rates on basic products, e.g. food, the poorer households may consume more and their total VAT payments represent a smaller share of their incomes than would be the case if all goods were subject to the standard rate. Yet the richer households also benefit from reduced rates, in absolute terms even more – all at the cost of foregone revenue, efficiency loss and increased complexity (Tait, 1988; IMF, 2011; Matheson and Swistak, 2014).
There are only a handful of countries where VAT concessions are hardly used at all, New Zealand and Australia being commonly cited as flagship examples. These are countries with relatively new VATs and they managed to rely on economic and administrative logic rather than cultivating historical and compromised solutions (Cnossen, 2003). This is the experience of most EU member states, where VAT concessions continue to be widespread. Apart from a few notable exceptions, including Bulgaria and Denmark, most European countries rely on them heavily. The list of items commonly subject to reduced rates, including a zerorate, is lengthy and encompasses food products, medicines, housing, books and newspapers, and many others, not excluding clothing, energy products, and even alcoholic beverages.
Addressing distributional concerns is not the exclusive reason for the adoption of reduced VAT rates. They are also used, rightly or wrongly, to change the relative prices of goods and services and steer consumption in a direction conforming to other policy objectives. For example, lower taxation of labor intensive services in the EU, e.g. hairdressers, window cleaning or repair services, was meant to increase demand for these services, mostly selfsupplied at home rather than procured in the market, and thus boost employment (Copenhagen Economics, 2007). Norway used VAT rate differentiation to promote healthier diets (Gustavsen and Rickertsen, 2013). Many countries tax merit goods and services, e.g. medicines, textbooks, sport and cultural services, at a lower level (or exempt them) to encourage their consumption, as being in public interest and benefiting the whole society. Similarly, rate differentiation is used to correct externalities by way of applying reduced rates to energysaving appliances (OECD, 2010). The justification for
3 The other Achilles heel of VAT is the need for refunds of excess credits. In many countries, especially developing ones where the tax administration capacity is low, this feature of VAT raises a lot of concerns.
artu
r śwista
k, seba
stian w
awr
zak, a
gn
ieszka a
lińsk
a:in pu
rsu
it of ta
x equ
ity: lesson
s fro
m vat rate str
uc
tur
e ad
justm
ent in po
lan
dfin
an
cia
l theo
ry an
d pr
ac
tice
39 (2) 115-137 (2015)119VAT reduced rates is also offered on administrative grounds. Some countries, e.g.
France, the Netherlands, and Poland, tax construction services related to renovation and maintenance of private dwellings at a reduced rate, and others, e.g. Iceland, effectively zerorate them through reimbursement of VAT paid on such services, with a view, at least partially, to counteracting tax evasion in the construction sector. In 2013 Romania reduced its VAT rate on bakery products on the very same grounds – to tackle tax evasion.4
2.2 VAT INCIDENCE The focal point of the discussion of the vertical equity of VAT is the question of who bears the burden. Fairness requires taxes to take into account the taxpayers’ ability to pay, hence implying that the share of income taken in taxes increases as income rises (progressivity). Even though such a statement may be difficult to defend on efficiency grounds this is a strong political expectation: taxes should be progressive or at least not regressive. Measuring progressivity of VAT is challenging. The notion of income redistribution would imply that VAT incidence should be tested against income. Yet the VAT base is consumption and not income. Should the VAT incidence be assessed against consumption, as the nature of the tax implies, or income, as the incidence theory suggests? Below we briefly review conceptual arguments for using both metrics.5
In theory a uniform and comprehensive VAT imposes a flat burden on all consumption expenditure (Tait, 1988). In this sense, VAT is proportional – all taxpayers give up an equal share of their consumption to pay the tax. This is true regardless of their personal characteristics, consumption preferences or even source of income used to finance their spending. Whether they are rich or poor, single or with dependents, healthy or disabled all taxpayers forego a fixed percentage of their private spending to meet the VAT liability. The same holds true whether they buy staple food or lavish meals in expensive restaurants, rely on private cars or use public transport, rent or buy a house. Under a broadbased and uniform VAT, all taxpayers – as long as they spend – are equally burdened with VAT. Nevertheless, in practice achieving proportional distribution is hardly possible, for even under a welldesigned VAT a portion of spending escapes taxation.6
The actual distribution of VAT payments is, nevertheless, very sensitive to the rate structure and exemptions built into the VAT and to the patterns of consumer preferences (Ebrill et al., 2001). Relative to consumption the use of preferences may make VAT a progressive tax. In such a setting the share of VAT payment rises with
4 The Romanian authorities are currently looking to apply the same reduction to meat products to counteract fictitious imports and tax evasion in the meat industry (see news by Simona Bazavan on: http://businessreview.eu/featured/romanianauthoritiesconsidercuttingthevatformeatproductsto9pct/).5 The third possibility – at least in theory – would be to test VAT incidence against wealth. This discussion, however, goes beyond the scope of the paper.6 This happens for administrative reasons, e.g. exemption of small traders as a result of the VAT threshold. Such a design benefits mostly low income households as they are more likely to buy from nontaxed small businesses. They are also more likely to buy from individuals (e.g. used goods) and informal businesses.
artu
r śwista
k, seba
stian w
awr
zak, a
gn
ieszka a
lińsk
a:in pu
rsu
it of ta
x equ
ity: lesson
s fro
m vat rate str
uc
tur
e ad
justm
ent in po
lan
dfin
an
cia
l theo
ry an
d pr
ac
tice
39 (2) 115-137 (2015)
��0 the level of consumption as better off households spend more on fully taxed goods and services than those less affluent, where their spending on lightly taxed or zerorated basic products, e.g. food, constitutes a large proportion of their consumption.
An intuitive approach to the measurement of the distributional impact of any tax, including a VAT, would be to use income as denominator. Early empirical studies, including those by Musgrave et al. (1974) or Pechman (1985), favored the annual incidence approach, similar to that used for income tax evaluation. Such an approach renders VAT a regressive tax. This is inevitable. As poorer households save little and consume higher shares of their current income, VAT accounts for a larger proportion of their earnings than the VAT paid by the rich.
Some argue, however, that measurement of VAT incidence against annual income is misleading (Gaspersen and Metcalf, 1994; Metcalf, 1997; Creedy, 1998). This is because, in line with permanent income hypothesis and lifecycle considerations (Friedman, 1957), income levels tend to vary over time, with young and old households earning low incomes and middle aged households disproportionally higher, i.e. high enough to pay back past borrowing and save for future consumption. In anticipation of future changes in income levels households prefer to smooth their consumption so it is higher than income in the early years of a lifetime cycle, lower in the middle and again higher at the end.
In theory, given the above considerations, one could argue that all income is consumed over the lifetime. From this perspective any consumption tax, including VAT, is a proportional tax (Gaspersen and Metcalf, 1994; Athreya and Reilly, 2009). When rate differentiation is used the incidence of VAT shifts towards richer consumers as they tend to consume more goods and services taxed at a standard rate. Using the lifetime incidence Decoster et al. (2010) find that actual VATs in a number of European countries are slightly progressive. The same approach has been used in a number of individual VAT studies. For example, Arsic and Altiparmakov (2013) show that Serbian VAT is proportional. The same results may be found in Slintakova and Klazar (2010) for the Czech Republic, and in Braz and Correia da Cunha (2009) for Portugal.
Proponents of the lifetime approach argue that measuring VAT incidence at any given point in the lifecycle renders blurred results. In a lifetime sense, neither young nor old households are poor nor are highearners rich at their peak. Since consumption fluctuates less from year to year than income it is a better measure of household wellbeing than total annual income and constitutes a good proxy for its lifetime income (Poterba, 1989). This reinforces the logic, mentioned above, that incidence of consumption taxes should be measured against their base – consumption.

artu
r śwista
k, seba
stian w
awr
zak, a
gn
ieszka a
lińsk
a:in pu
rsu
it of ta
x equ
ity: lesson
s fro
m vat rate str
uc
tur
e ad
justm
ent in po
lan
dfin
an
cia
l theo
ry an
d pr
ac
tice
39 (2) 115-137 (2015)���Unfortunately, lifetime income or consumption incidence does not seem to be ap
pealing to policymakers. Indeed, not all households use up all their lifetime income and much of it is passed on to the next generations in bequests. In welfare states, not all households rely exclusively on their own income and later on their savings – a system of benefits and state funded pensions plays a significant role. Also, households’ sizes and compositions change over time and it is hardly possible to have a household that follows the lifecycle of an earning individual.
Finally and most importantly, the political economy argument has to be taken into account. The lifetime approach has a long horizon which is not attractive to policymakers and taxpayers. It hinges on the assumption that the incomes of younger households grow and exceed their needs in middle age allowing for savings to be used towards the end of the life cycle. This is too optimistic to convince currently poor individuals, with low skills, productivity and thus little potential for increased future earnings. It is not difficult to argue that the poor need help when they face life hurdles. And the governments provide it – either through transfers from the budget or taxation. Interestingly, in defining the beneficiaries of social programs, e.g. family allowances, housing benefits, etc., countries tend to rely on an annual income test. Income taxes are also annual – the tax scale is applicable to annual income and most of the allowances and credits apply annual ceilings. Examples where carryforward or carryback are used to smooth personal income over years are scarce. Given the above it is more reasonable to measure the incidence of consumption taxes against annual income.
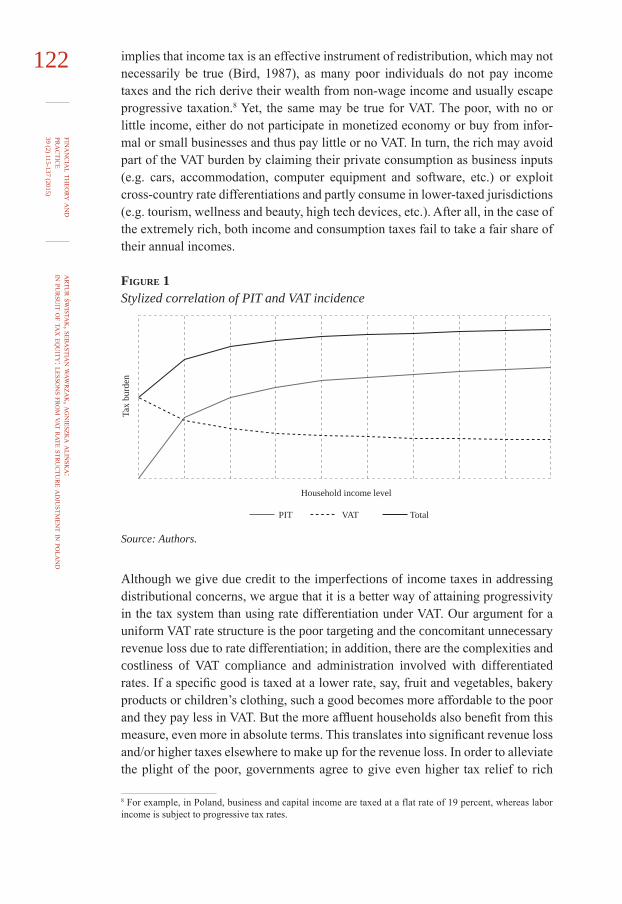
2.3 VAT AND INCOME TAXValue added tax, as an in rem and not personal consumption tax, is ill suited to pursue progressivity. Fortunately, VAT is not the only element of the tax system and its distributional impact should not be analyzed in isolation. If one is concerned about fairness of taxation as a whole then an assessment of the overall impact of taxes on income distribution should be made. An income tax, whose incidence is usually measured on annual basis, is an obvious candidate. The inherent regressivity of a broadbased and singlerated VAT may be mitigated by progressive personal income taxes. We show this correlation in a stylized way in figure 1.
All things being equal both taxpayers and governments are indifferent to the form in which taxes are raised. What is important is the change in disposable income as a consequence of overall taxation. As income level rises, a smaller proportion of income is taken in VAT but this is counterbalanced by higher shares of personal income tax, making the tax system progressive. As argued in Atkinson and Stiglitz (1976) and Cnossen (1982) as long as a country can flexibly choose the rate structure under the personal income tax, then it has no reason to choose differential tax rates on the consumption of different goods and services.7 Such argumentation
7 In addition, progressivity of the tax system may be further enhanced by welldesigned property taxes and government transfers.
artu
r śwista
k, seba
stian w
awr
zak, a
gn
ieszka a
lińsk
a:in pu
rsu
it of ta
x equ
ity: lesson
s fro
m vat rate str
uc
tur
e ad
justm
ent in po
lan
dfin
an
cia
l theo
ry an
d pr
ac
tice
39 (2) 115-137 (2015)
��� implies that income tax is an effective instrument of redistribution, which may not necessarily be true (Bird, 1987), as many poor individuals do not pay income taxes and the rich derive their wealth from nonwage income and usually escape progressive taxation.8 Yet, the same may be true for VAT. The poor, with no or little income, either do not participate in monetized economy or buy from informal or small businesses and thus pay little or no VAT. In turn, the rich may avoid part of the VAT burden by claiming their private consumption as business inputs (e.g. cars, accommodation, computer equipment and software, etc.) or exploit crosscountry rate differentiations and partly consume in lowertaxed jurisdictions (e.g. tourism, wellness and beauty, high tech devices, etc.). After all, in the case of the extremely rich, both income and consumption taxes fail to take a fair share of their annual incomes.
Figure 1 Stylized correlation of PIT and VAT incidence
Source: Authors.
Although we give due credit to the imperfections of income taxes in addressing distributional concerns, we argue that it is a better way of attaining progressivity in the tax system than using rate differentiation under VAT. Our argument for a uniform VAT rate structure is the poor targeting and the concomitant unnecessary revenue loss due to rate differentiation; in addition, there are the complexities and costliness of VAT compliance and administration involved with differentiated rates. If a specific good is taxed at a lower rate, say, fruit and vegetables, bakery products or children’s clothing, such a good becomes more affordable to the poor and they pay less in VAT. But the more affluent households also benefit from this measure, even more in absolute terms. This translates into significant revenue loss and/or higher taxes elsewhere to make up for the revenue loss. In order to alleviate the plight of the poor, governments agree to give even higher tax relief to rich
8 For example, in Poland, business and capital income are taxed at a flat rate of 19 percent, whereas labor income is subject to progressive tax rates.
Household income level
Tax
burd
en
PIT VAT Total
artu
r śwista
k, seba
stian w
awr
zak, a
gn
ieszka a
lińsk
a:in pu
rsu
it of ta
x equ
ity: lesson
s fro
m vat rate str
uc
tur
e ad
justm
ent in po
lan
dfin
an
cia
l theo
ry an
d pr
ac
tice
39 (2) 115-137 (2015)123taxpayers, an odd and costly manner of injecting progressivity into the tax system.
Adoption of reduced rates could yield equitable results only if applied to goods and services whose absolute consumption falls as income rises. Given the convergence of consumption patterns across all income levels, there are not many obvious candidates. Staple food, like rice, potatoes or flour may potentially conform to such a pattern.
Also, efforts required for a proper delineation between standard and lower taxed goods (e.g. children’s and adult clothing) drive up compliance and administration costs. Equity gains, once again, are likely to be outweighed by the increased administration costs resulting from cost of interpretation, classification rules, issuance of advanced rulings, complex filing, audits, disputes, etc.9
3 REDISTRIBUTIVE IMPACT OF VAT RATE DIFFERENTIATION IN POLAND3.1 VAT STRUCTURE AND REFORM OVERVIEWAfter reviewing theoretical considerations on the redistributive effects of VAT we turn now to an incidence analysis of Polish VAT. Our focus will be on the distributional impact of the 2011 adjustments to the VAT rate structure. We begin with a brief overview of VAT structure and performance, present details of the VAT reform and follow with our findings.
Value added tax is the main source of government revenues for Poland, accounting for almost 44 percent of total tax collection. In 2011 it raised PLN 120.8 billion (USD 40.8 billion�0) which totaled to 8.1 percent of GDP, around the average for EU member states. The revenue performance, measured as a ratio of actual and theoretical VAT collections��, at only 45 percent in 2011, was one of the lowest in the EU though (EU, 2013). One of the reasons for the relatively wide VAT gap is the rate structure.�� Borselli et al. (2012) estimates that more than 40 percent of final consumption is subject to reduced rates, bringing down the effective VAT to less than 15 percent, only twothirds of the standard rate of 23 percent.
Data from annual tax expenditure budgets prepared by the Polish Ministry of Finance confirms the generosity of VAT (MF, 2013). In 2011 they amounted to PLN 41.1 billion (or USD 13.9 billion), i.e. 2.7 percent of GDP and 34 percent of ac
9 In 2013 alone, the Polish tax administration issued over 2,000 advanced rulings regarding the application of the VAT rate. Inquiries for interpretation or clarification included the application of a proper VAT rate to takeaway meals, furniture assembling, certain construction services performed in dwellings, drinks with addition of coffee, latex gloves, magazine and CD/DVD bundles, etc. (Data received from Ministry of Finance, Poland.)�0 All PLN values cited in this paper were converted into USD at PLN/USD exchange rate at 2.96 (average for 2011). �� Assumes total final consumption taxed at standard VAT rate and perfect tax compliance (no evasion). �� The other important reasons are exemptions and tax compliance. The recent European Commission study on VAT compliance gap found that in 2011 Poland lost 15 percent of their VAT (theoretical tax liability of VAT as legislated) due to imperfect tax compliance (EC, 2013).
artu
r śwista
k, seba
stian w
awr
zak, a
gn
ieszka a
lińsk
a:in pu
rsu
it of ta
x equ
ity: lesson
s fro
m vat rate str
uc
tur
e ad
justm
ent in po
lan
dfin
an
cia
l theo
ry an
d pr
ac
tice
39 (2) 115-137 (2015)
124 tual VAT collections.13 The highest contributors to the overall value of tax expenditures in the VAT were residential construction services, food products and medicines. Among the food products the most costly were meat, dairy and bakery, totaling respectively to PLN 2.9 billion (USD 1 billion), PLN 1.7 billion (USD 0.6 billion) and PLN 1.1 billion (USD 0.4 billion).
Unlike revenue performance, the stability of rates has long been a signature feature of the Polish VAT, putting it at the forefront of the EU member states (see EC, 2014). On its adoption in mid1993 VAT in Poland was imposed at the standard rate of 22 percent. A number of goods and services, including certain food products, clothing and accessories for children, energy products for household consumption, telecommunication services and construction materials were taxed at a lower seven percent rate. In 2000, a second reduced rate of three percent was adopted to encompass previously exempted basic food products. Upon accession to the EU the list of goods and services subject to reduced rates as well as to exemptions was further revised. In spite of such reshuffling the main rates, however, remained unchanged.
Not until 2011, faced with the need to constrain public debt, did Poland decide to increase VAT rates. The adjustments of VAT rates were twofold. The standard and reduced rates rose by one percentage point – from 22 to 23 percent and from seven to eight percent respectively. The VAT increases coincided with the expiry of the preaccession derogatory regime. The concessional zerorate on books and periodicals (not newspapers) and the three percent rate on certain unprocessed food items, as being below the EU minimum of five percent required by the VAT Directive, were doomed for increases. The government, rather than use the reduced rate already in place decided to introduce a new one – a super reduced rate of five percent. Most of the food products, previously subject to the higher reduced rate (now at eight percent) were moved to the new lower five percent rate.
Interestingly, the government, even though faced with the need to collect more tax revenues, did not decide to rely on only one reduced rate, let alone abolishing reduced rates altogether. Adoption of the super reduced rate of five percent, compromising VAT revenue productivity, contradicted the objective of general VAT increases. Such a policy choice was geared to address equity concerns and improve progressivity of VAT. As stated in the justification to the bill introducing new rates, it was the Government’s desire to alleviate the impact of VAT increases on the poorer households via lower taxation of food which “constitutes significant part of spending by the less affluent part of the society” (PRM, 2010). The Government chose to achieve this explicitly by way of rate differentiation, a three
13 The actual cost of revenue foregone may be in fact higher since – in line with the adopted benchmark – only such VAT concession were considered to be a tax expenditure that deviates from the standard VAT design as provided in the EU VAT Directive. Hence, for example most of exemptions granted to services provided in public interest (e.g. public bodies, postal, broadcasting or social services) and financial, including insurance, services were not seen as VAT concessions and thus not estimated.
artu
r śwista
k, seba
stian w
awr
zak, a
gn
ieszka a
lińsk
a:in pu
rsu
it of ta
x equ
ity: lesson
s fro
m vat rate str
uc
tur
e ad
justm
ent in po
lan
dfin
an
cia
l theo
ry an
d pr
ac
tice
39 (2) 115-137 (2015)125percentage points lower taxation of food. No corresponding measures on the reve
nue side were proposed and adopted.
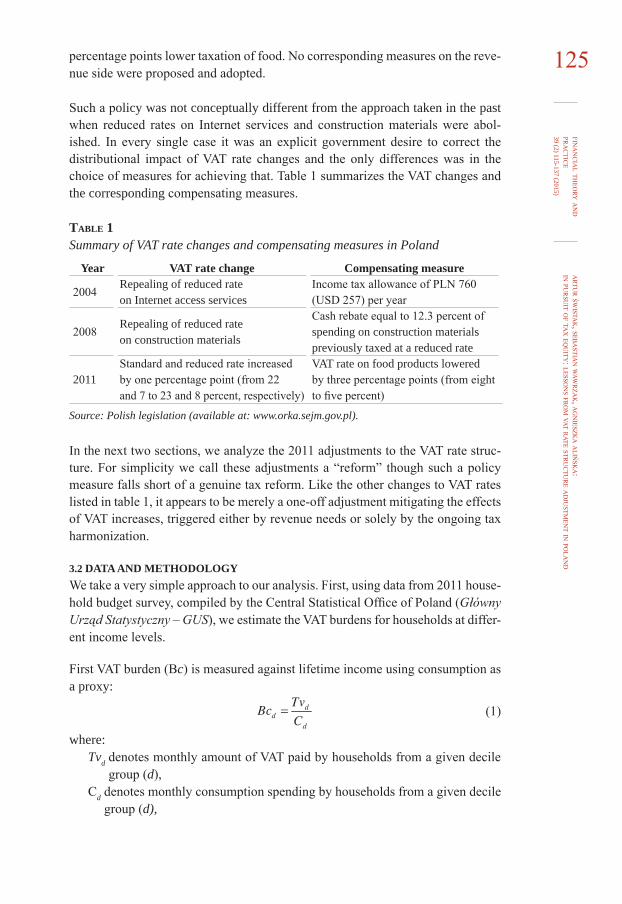
Such a policy was not conceptually different from the approach taken in the past when reduced rates on Internet services and construction materials were abolished. In every single case it was an explicit government desire to correct the distributional impact of VAT rate changes and the only differences was in the choice of measures for achieving that. Table 1 summarizes the VAT changes and the corresponding compensating measures.
Table 1 Summary of VAT rate changes and compensating measures in Poland
Year VAT rate change Compensating measure
2004Repealing of reduced rate on Internet access services
Income tax allowance of PLN 760 (USD 257) per year
2008Repealing of reduced rate on construction materials
Cash rebate equal to 12.3 percent of spending on construction materials previously taxed at a reduced rate
�0��Standard and reduced rate increased by one percentage point (from 22 and 7 to 23 and 8 percent, respectively)
VAT rate on food products lowered by three percentage points (from eight to five percent)
Source: Polish legislation (available at: www.orka.sejm.gov.pl).
In the next two sections, we analyze the 2011 adjustments to the VAT rate structure. For simplicity we call these adjustments a “reform” though such a policy measure falls short of a genuine tax reform. Like the other changes to VAT rates listed in table 1, it appears to be merely a oneoff adjustment mitigating the effects of VAT increases, triggered either by revenue needs or solely by the ongoing tax harmonization.
3.2 DATA AND METHODOLOGYWe take a very simple approach to our analysis. First, using data from 2011 household budget survey, compiled by the Central Statistical Office of Poland (Główny Urząd Statystyczny – GUS), we estimate the VAT burdens for households at different income levels.
First VAT burden (Bc) is measured against lifetime income using consumption as a proxy:
(1)
where:Tvd denotes monthly amount of VAT paid by households from a given decile
group (d),Cd denotes monthly consumption spending by households from a given decile
group (d),
artu
r śwista
k, seba
stian w
awr
zak, a
gn
ieszka a
lińsk
a:in pu
rsu
it of ta
x equ
ity: lesson
s fro
m vat rate str
uc
tur
e ad
justm
ent in po
lan
dfin
an
cia
l theo
ry an
d pr
ac
tice
39 (2) 115-137 (2015)
126 d represents decile group from 1 to 10.
Then VAT burden (Bi) is measured against annual gross income (GI):
(2)
The data set we obtained presents monthly consumption expenditure compiled from 37,584 representative households on a quarterly rotation basis. The survey excludes spending on purchases of residential property14, formally treated as investment spending.
The detailed information on consumption spending allows us to assign a VAT rate applicable to a given expenditure item and calculate the amount of tax. In cases where it was not readily apparent what rate (or exemption) should be used we made necessary assumptions and apportionment. For example, data on bread consumption does not allow for immediate distinction between fresh bread, defined as bread to be consumed within 14 days and taxed at five percent, and nonperishable bread with an expiration date longer than 14 days, taxed at eight percent. An important caveat has to be made here. Since the household budget survey does not allow us to establish from where all the goods and services were procured we assume that all nonexempt items are taxable. This does not necessarily have to be true, as part of the spending, especially on grocery, takes place at small establishments and greenmarkets, not to mention informal businesses, and as such is exempt. For the lack of data we did not make an attempt to correct those values and acknowledge that such an approach may overstate the actual VAT burden for the poorer households, as they are more likely to buy from nontaxed suppliers. In cases where consumption items are exempt from VAT, e.g. healthcare services, we assume that VAT paid on inputs is passed through to consumers in the final price of the exempt good or service. To derive the amount of VAT, for simplicity, we assume that taxable inputs constitute 40 percent of the final price and they all carry VAT at the standard rate.15 Taking these assumptions into account the amount of tax (Tvd) is derived as follows:
(3)
where:βd denotes the share of total consumption (Cd) subject to the standard VAT rate (sr), reduced VAT rate (rr), super reduced VAT rate (srr) or exempt from VAT (e),r denotes the applicable VAT rate – standard (sr), reduced (rr), or super reduced (srr).
14 Although this category includes spending on newly built houses and apartments, which are subject to VAT in Poland, it does not critically impact our analysis for the 2011 VAT reform as it entailed changes in taxation of food products and a few merit goods. Nevertheless, on an aggregate level, it understates the VAT burden falling mostly on the rich and not the poor who usually selfbuild. 15 The rigorous approach would dictate to use supplyuse (or inputoutput) tables to approximate for the value of input VAT.
artu
r śwista
k, seba
stian w
awr
zak, a
gn
ieszka a
lińsk
a:in pu
rsu
it of ta
x equ
ity: lesson
s fro
m vat rate str
uc
tur
e ad
justm
ent in po
lan
dfin
an
cia
l theo
ry an
d pr
ac
tice
39 (2) 115-137 (2015)��7For measurement of the VAT burden against annual income we choose to rely on
gross rather than net income. Gross income is the most sterile benchmark available and allows for comparisons of burdens generated by different taxes. Such an approach is motivated by a belief that taxes are interchangeable and this is the overall tax burden that matters for taxpayers.16 Reliance on disposable income, already adjusted for income tax payments, blurs and – in general – inflates the actual incidence of VAT.
Since incomes reported in the household budget survey for each decile are net amounts (NI), we calculate the gross (pretax) income (GI) that it would be necessary to earn, the difference being the amount of tax paid (Ti).
(4)
Two important qualifications apply. First, all income received by a household is labor income taxed at progressive rates (18 and 32 percent) with a basic tax allowance. Second, social security and health contributions are treated as taxes and form part of a tax wedge. This approach is not different from OECD Taxing Wages (OECD, 2013a) methodology and the European Commission and Eurostat’s Taxa-tion Trends publications (EU, 2013). This implies:
(5)where:
SSCd denotes the amount of social security contributions, HCd denotes the amount of health contributions,ITd denotes income tax payment.
Since (6)and (7)and
(8)where:
rssc denotes the rate of social security contributions,rhc denotes the rate of health contribution, rit denotes the applicable rate of income tax, A is the amount of personal basic tax allowance,γ denotes the share of health contribution allowed for deduction against income tax,CTC is the amount of child tax credit.
16 Naturally, the two general taxes – PIT and VAT – are not the only taxes falling on households. There are other, including property taxes and excise taxes, but these are ignored. The analysis of the progressivity is also limited to the tax system only and all government transfers aimed at helping the poor, e.g. family benefits, unemployment benefits, disability benefits, are not taken into account.
artu
rśw
istak, seb
astia
n waw
rza
k, ag
nieszk
a aliń
ska:
in pur
suit o
f tax eq
uity: lesso
ns fr
om vat r
ate stru
ctu
re a
dju
stmen
t in pola
nd
fina
nc
ial th
eory a
nd
pra
ctic
e39 (2) 115-137 (2015)
128 Equation (4) may be transformed as follows:
(9)
To derive the amount of gross income and tax paid we use a simple Excelbased micro simulation technique, similar to that employed by the OECD for estimates of the tax burden in Taxing Wages (OECD, 2013b). In calculation of income tax we made the following assumptions. Each wage earner has only one job and lives and works in the same city. Each works throughout the whole year and has no sick or maternity/paternity absence, nor does he or she benefit from any other social support. If there are children in a household the earning parent(s) live with them and have the right to benefit from the child tax credit. A loneparent allowance, but not family cash allowance�7, is included in the calculation where applicable. If there are two working adults in a household they are deemed a married couple and are taxed jointly. Unless specifically indicated, no tax allowances and further deductions are used. All income is earned in Poland and does not escape taxation.
Both data on expenditure and income are reported for one person. To arrive at household income and expenditure we use the modified OECD equivalent scale, which attributes a weight of 1 to the first household member, 0.5 to the remaining members over 14 years old and 0.3 to each child (below 14 years old).
Calculations for VAT and PIT tax burden are performed for a number of different households: (1) single adult household, (2) a married couple with two children, (3) a married couple with one child, and (4) a single parent household – one adult and one child. It is assumed that all the adults work and children do not.
To evaluate the distributional impact of the reform we compare two rate structures – the actual and a potential one, i.e. one the government could have chosen in the absence of equity concerns. The actual structure, as implemented in 2011, operates a standard rate of 23 percent, reduced rate of 8 percent and super reduced rate of 5 percent, applicable to food products and a few merit goods (actual scenario). The potential rate structure operates only two rates – 23 percent and the reduced 8 percent, implying that the government chooses not to “improve” VAT incidence (base scenario). VATexempt consumption is kept constant in our calculations.
We use the same consumption dataset for both scenarios. Our analysis is therefore static and it does not take into account any behavioral response to changes in the level of taxation. Also, a full passthrough of VAT burden in consumer prices is assumed.
�7 Family cash allowance is a social subsidy available to families with children, having very low income per family member. It is not a tax measure.
artu
r śwista
k, seba
stian w
awr
zak, a
gn
ieszka a
lińsk
a:in pu
rsu
it of ta
x equ
ity: lesson
s fro
m vat rate str
uc
tur
e ad
justm
ent in po
lan
dfin
an
cia
l theo
ry an
d pr
ac
tice
39 (2) 115-137 (2015)1293.3 FINDINGS
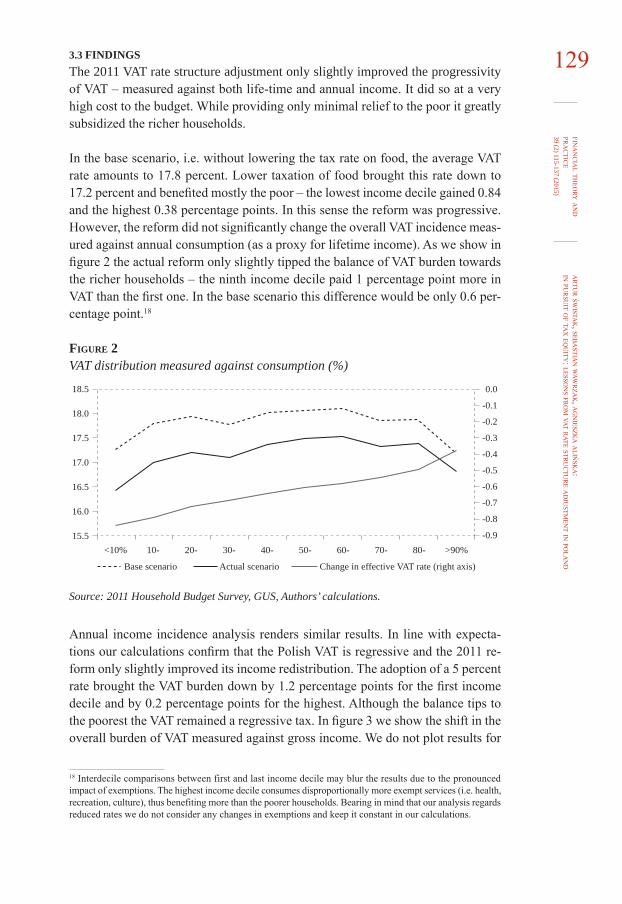
The �0�� VAT rate structure adjustment only slightly improved the progressivity of VAT – measured against both lifetime and annual income. It did so at a very high cost to the budget. While providing only minimal relief to the poor it greatly subsidized the richer households.
In the base scenario, i.e. without lowering the tax rate on food, the average VAT rate amounts to 17.8 percent. Lower taxation of food brought this rate down to 17.2 percent and benefited mostly the poor – the lowest income decile gained 0.84 and the highest 0.38 percentage points. In this sense the reform was progressive. However, the reform did not significantly change the overall VAT incidence measured against annual consumption (as a proxy for lifetime income). As we show in figure 2 the actual reform only slightly tipped the balance of VAT burden towards the richer households – the ninth income decile paid 1 percentage point more in VAT than the first one. In the base scenario this difference would be only 0.6 percentage point.18
Figure 2 VAT distribution measured against consumption (%)
Source: 2011 Household Budget Survey, GUS, Authors’ calculations.
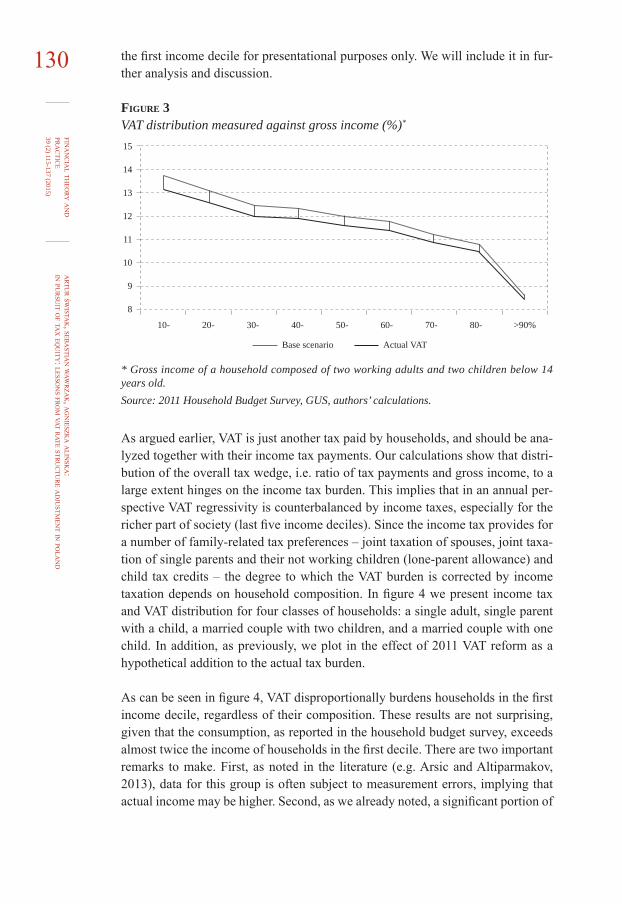
Annual income incidence analysis renders similar results. In line with expectations our calculations confirm that the Polish VAT is regressive and the 2011 reform only slightly improved its income redistribution. The adoption of a 5 percent rate brought the VAT burden down by 1.2 percentage points for the first income decile and by 0.2 percentage points for the highest. Although the balance tips to the poorest the VAT remained a regressive tax. In figure 3 we show the shift in the overall burden of VAT measured against gross income. We do not plot results for
18 Interdecile comparisons between first and last income decile may blur the results due to the pronounced impact of exemptions. The highest income decile consumes disproportionally more exempt services (i.e. health, recreation, culture), thus benefiting more than the poorer households. Bearing in mind that our analysis regards reduced rates we do not consider any changes in exemptions and keep it constant in our calculations.
Base scenario Actual scenario
10-<10% 20- 30- 40- 50- 60- 70- 80- >90%
18.5
18.0
17.5
17.0
16.5
16.0
15.5
-0.0
-0.1
-0.2
-0.3
-0.4
-0.5
-0.6
-0.7
-0.8
-0.9
Change in effective VAT rate (right axis)
artu
rśw
istak, seb
astia
n waw
rza
k, ag
nieszk
a aliń
ska:
in pur
suit o
f tax eq
uity: lesso
ns fr
om vat r
ate stru
ctu
re a
dju
stmen
t in pola
nd
fina
nc
ial th
eory a
nd
pra
ctic
e39 (2) 115-137 (2015)
130 the first income decile for presentational purposes only. We will include it in further analysis and discussion.
Figure 3 VAT distribution measured against gross income (%)*
* Gross income of a household composed of two working adults and two children below 14 years old.Source: 2011 Household Budget Survey, GUS, authors’ calculations.
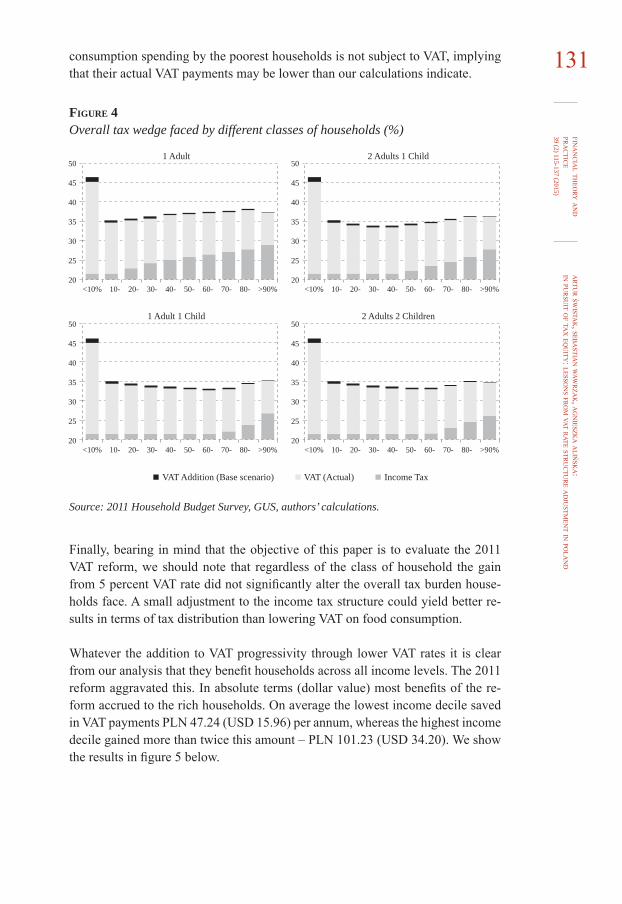
As argued earlier, VAT is just another tax paid by households, and should be analyzed together with their income tax payments. Our calculations show that distribution of the overall tax wedge, i.e. ratio of tax payments and gross income, to a large extent hinges on the income tax burden. This implies that in an annual perspective VAT regressivity is counterbalanced by income taxes, especially for the richer part of society (last five income deciles). Since the income tax provides for a number of familyrelated tax preferences – joint taxation of spouses, joint taxation of single parents and their not working children (loneparent allowance) and child tax credits – the degree to which the VAT burden is corrected by income taxation depends on household composition. In figure 4 we present income tax and VAT distribution for four classes of households: a single adult, single parent with a child, a married couple with two children, and a married couple with one child. In addition, as previously, we plot in the effect of 2011 VAT reform as a hypothetical addition to the actual tax burden.
As can be seen in figure 4, VAT disproportionally burdens households in the first income decile, regardless of their composition. These results are not surprising, given that the consumption, as reported in the household budget survey, exceeds almost twice the income of households in the first decile. There are two important remarks to make. First, as noted in the literature (e.g. Arsic and Altiparmakov, 2013), data for this group is often subject to measurement errors, implying that actual income may be higher. Second, as we already noted, a significant portion of
Base scenario Actual VAT
10- 20- 30- 40- 50- 60- 70- 80- >90%
15
14
13
12
11
10
9
8
artu
r śwista
k, seba
stian w
awr
zak, a
gn
ieszka a
lińsk
a:in pu
rsu
it of ta
x equ
ity: lesson
s fro
m vat rate str
uc
tur
e ad
justm
ent in po
lan
dfin
an
cia
l theo
ry an
d pr
ac
tice
39 (2) 115-137 (2015)131
2 Adults 1 Child1 Adult
2 Adults 2 Children1 Adult 1 Child
50
45
40
35
30
25
20
50
45
40
35
30
25
20
50
45
40
35
30
25
20
50
45
40
35
30
25
2010-<10% 20- 30- 40- 50- 60- 70- 80- >90% 10-<10% 20- 30- 40- 50- 60- 70- 80- >90%
10-<10% 20- 30- 40- 50- 60- 70- 80- >90% 10-<10% 20- 30- 40- 50- 60- 70- 80- >90%
VAT Addition (Base scenario) VAT (Actual) Income Tax
consumption spending by the poorest households is not subject to VAT, implying that their actual VAT payments may be lower than our calculations indicate.
Figure 4 Overall tax wedge faced by different classes of households (%)
Source: 2011 Household Budget Survey, GUS, authors’ calculations.
Finally, bearing in mind that the objective of this paper is to evaluate the 2011 VAT reform, we should note that regardless of the class of household the gain from 5 percent VAT rate did not significantly alter the overall tax burden households face. A small adjustment to the income tax structure could yield better results in terms of tax distribution than lowering VAT on food consumption.
Whatever the addition to VAT progressivity through lower VAT rates it is clear from our analysis that they benefit households across all income levels. The 2011 reform aggravated this. In absolute terms (dollar value) most benefits of the reform accrued to the rich households. On average the lowest income decile saved in VAT payments PLN 47.24 (USD 15.96) per annum, whereas the highest income decile gained more than twice this amount – PLN 101.23 (USD 34.20). We show the results in figure 5 below.
artu
r śwista
k, seba
stian w
awr
zak, a
gn
ieszka a
lińsk
a:in pu
rsu
it of ta
x equ
ity: lesson
s fro
m vat rate str
uc
tur
e ad
justm
ent in po
lan
dfin
an
cia
l theo
ry an
d pr
ac
tice
39 (2) 115-137 (2015)
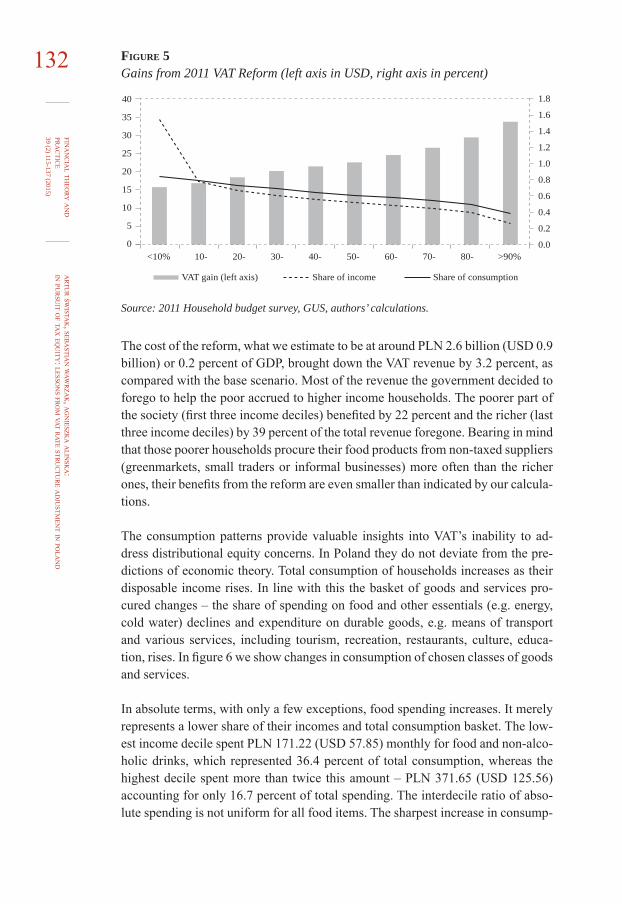
132 Figure 5 Gains from 2011 VAT Reform (left axis in USD, right axis in percent)
10-<10% 20- 30- 40- 50- 60- 70- 80- >90%
VAT gain (left axis) Share of consumptionShare of income
40
35
30
25
20
15
10
5
0
1.8
1.6
1.4
1.2
1.0
0.8
0.6
0.4
0.2
0.0
Source: 2011 Household budget survey, GUS, authors’ calculations.
The cost of the reform, what we estimate to be at around PLN 2.6 billion (USD 0.9 billion) or 0.2 percent of GDP, brought down the VAT revenue by 3.2 percent, as compared with the base scenario. Most of the revenue the government decided to forego to help the poor accrued to higher income households. The poorer part of the society (first three income deciles) benefited by 22 percent and the richer (last three income deciles) by 39 percent of the total revenue foregone. Bearing in mind that those poorer households procure their food products from nontaxed suppliers (greenmarkets, small traders or informal businesses) more often than the richer ones, their benefits from the reform are even smaller than indicated by our calculations.
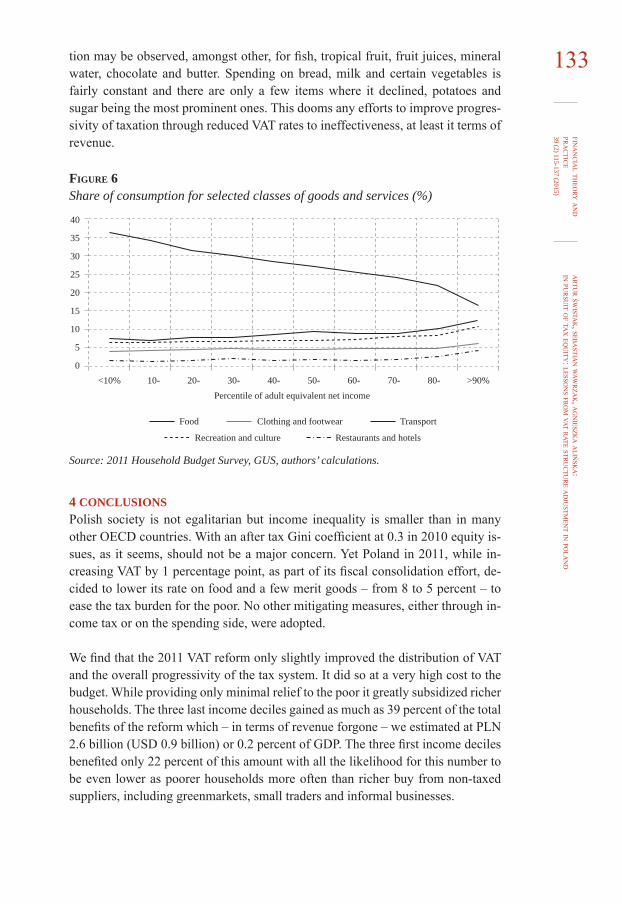
The consumption patterns provide valuable insights into VAT’s inability to address distributional equity concerns. In Poland they do not deviate from the predictions of economic theory. Total consumption of households increases as their disposable income rises. In line with this the basket of goods and services procured changes – the share of spending on food and other essentials (e.g. energy, cold water) declines and expenditure on durable goods, e.g. means of transport and various services, including tourism, recreation, restaurants, culture, education, rises. In figure 6 we show changes in consumption of chosen classes of goods and services.
In absolute terms, with only a few exceptions, food spending increases. It merely represents a lower share of their incomes and total consumption basket. The lowest income decile spent PLN 171.22 (USD 57.85) monthly for food and nonalcoholic drinks, which represented 36.4 percent of total consumption, whereas the highest decile spent more than twice this amount – PLN 371.65 (USD 125.56) accounting for only 16.7 percent of total spending. The interdecile ratio of absolute spending is not uniform for all food items. The sharpest increase in consump
artu
r śwista
k, seba
stian w
awr
zak, a
gn
ieszka a
lińsk
a:in pu
rsu
it of ta
x equ
ity: lesson
s fro
m vat rate str
uc
tur
e ad
justm
ent in po
lan
dfin
an
cia
l theo
ry an
d pr
ac
tice
39 (2) 115-137 (2015)133
10-<10% 20- 30- 40- 50- 60- 70- 80- >90%Percentile of adult equivalent net income
40
35
30
25
20
15
10
5
0
Restaurants and hotelsRecreation and culture
TransportClothing and footwearFood
tion may be observed, amongst other, for fish, tropical fruit, fruit juices, mineral water, chocolate and butter. Spending on bread, milk and certain vegetables is fairly constant and there are only a few items where it declined, potatoes and sugar being the most prominent ones. This dooms any efforts to improve progressivity of taxation through reduced VAT rates to ineffectiveness, at least it terms of revenue.
Figure 6 Share of consumption for selected classes of goods and services (%)
Source: 2011 Household Budget Survey, GUS, authors’ calculations.
4 CONCLUSIONSPolish society is not egalitarian but income inequality is smaller than in many other OECD countries. With an after tax Gini coefficient at 0.3 in 2010 equity issues, as it seems, should not be a major concern. Yet Poland in 2011, while increasing VAT by 1 percentage point, as part of its fiscal consolidation effort, decided to lower its rate on food and a few merit goods – from 8 to 5 percent – to ease the tax burden for the poor. No other mitigating measures, either through income tax or on the spending side, were adopted.
We find that the 2011 VAT reform only slightly improved the distribution of VAT and the overall progressivity of the tax system. It did so at a very high cost to the budget. While providing only minimal relief to the poor it greatly subsidized richer households. The three last income deciles gained as much as 39 percent of the total benefits of the reform which – in terms of revenue forgone – we estimated at PLN 2.6 billion (USD 0.9 billion) or 0.2 percent of GDP. The three first income deciles benefited only 22 percent of this amount with all the likelihood for this number to be even lower as poorer households more often than richer buy from nontaxed suppliers, including greenmarkets, small traders and informal businesses.
artu
r śwista
k, seba
stian w
awr
zak, a
gn
ieszka a
lińsk
a:in pu
rsu
it of ta
x equ
ity: lesson
s fro
m vat rate str
uc
tur
e ad
justm
ent in po
lan
dfin
an
cia
l theo
ry an
d pr
ac
tice
39 (2) 115-137 (2015)
134 The attempt to alleviate the plight of the poor does not seem to have been necessary. Measured against consumption, as a proxy for lifetime income, VAT would be anyway mildly progressive and the reform hardly changed that. When its annual incidence is considered – an approach favored by policymakers – VAT without further rate reduction on food would have imposed a higher burden on the poorer part of the society. Again, the rate adjustment did not change this regressive property of the VAT. A closer look at the combined income and VAT tax burden faced by households reveals that the regressive nature of VAT to a large extent is counterbalanced by progressive income tax. With a small change to the income tax structure the government could have secured more progressivity at a lower cost in terms of revenue foregone.
The Polish experience with VAT rate structure adjustment confirms that any efforts to pursue progressivity through reduced rates are doomed to be ineffective. There are several reasons for this, but consumption patterns are the underlying one, especially in the case of food. In line with economic theory, spending on food declines as income increases. It declines as a share of income but not in absolute terms. In such a setting the richer by definition benefit more, at a high cost of revenue forgone and loss of efficiency. There are only a few inferior food products whose consumption declines as income rises. The Polish household budget survey reveals only two – the potato and sugar.
Although consumption patterns differ with income, consumption per se does not constitute a good basis for addressing distributional concerns. This renders VAT the tax least suited for the pursuit of distributional equity objectives for they inherently relate to the income and personal characteristic of taxpayers. Reliance on a broadbased and singlerated VAT for revenue generation and use of progressive income taxes may yield far better results. As noted in Keen (2003a) “even poorly targeted [government] spending may be a better way to support the poor than a reduced rate.” Helping the poor by subsidizing the rich is one of the most imprudent and deceitful policies and one that no society can ever afford. Pursuing distributional equity through the differentiation of VAT rates is one such policy and should be avoided.
artu
r śwista
k, seba
stian w
awr
zak, a
gn
ieszka a
lińsk
a:in pu
rsu
it of ta
x equ
ity: lesson
s fro
m vat rate str
uc
tur
e ad
justm
ent in po
lan
dfin
an
cia
l theo
ry an
d pr
ac
tice
39 (2) 115-137 (2015)135REFERENCES
1. Arsic, M. and Altiparmakov, N., 2013. “Equity aspects of VAT in emerging European countries: A case study of Serbia”. Economic Systems 37, pp. 171186. doi: 10.1016/j.ecosys.2012.12.003
2. Athreya, K. B. and Reilly, D., 2009. “Consumption smoothing and the measured regressivity of consumption taxes”. Economic Quarterly, 95 (1), pp. 75100.
3. Bird, R. and Gendron, P., 2007. The VAT in Developing and Transitional Countries. Cambridge: Cambridge University Press. doi: 10.1017/CBO9780511619366
4. Bird, R., 1987. “A new look at indirect taxation in developing countries”. World Development, Vol. 15, No. 9, pp. 11511161. doi: 10.1016/0305750X(87)901847
5. Borselli, F., Chiri, S. and Romagnano, E., 2012. “Patterns of reduced rates in the European Union”. International VAT Monitor, January/February, pp. 1321.
6. Braz, C. and Correia da Cunha, J., 2009. “The redistributive effects of VAT in Portugal”. Economic Bulletin, Banco de Portugal, Winter, pp. 7186.
7. Business Review, 2013. Romanian authorities consider cutting the VAT for meat products to 9 pct. [online]. Available at: <http://businessreview.eu/featured/romanianauthoritiesconsidercuttingthevatformeatproductsto9pct/>.
8. Caspersen, E. and Metcalf, G., 1994. “Is a Value Added Tax regressive? Annual versus lifetime incidence measures”. National Tax Journal 47, pp. 731746.
9. Cnossen, S., 1982. “What rate structure for a valueadded tax?” National Tax Journal, 35, pp. 205214.
10. Cnossen, S., 1998. “VATs in CEE countries: A survey and analysis”. De Econ-omist, 146 (2), pp. 227255. doi: 10.1023/A:1003291011259
11. Cnossen, S., 2003. “How much tax coordination in the European Union?” International Tax and Public Finance, 10, pp. 625649. doi: 10.1023/A:1026373703108
12. Copenhagen Economics, 2007. Study on reduced VAT applied to goods and services in the Member States of the European Union, [pdf]. Available at: <http://ec.europa.eu/taxation_customs/resources/documents/taxation/vat/how_vat_works/rates/study_reduced_vat.pdf>.
13. Creedy, J., 1998. “Are consumption taxes regressive?” The Australian Eco-nomic Review, 31, pp. 107116. doi: 10.1111/14678462.00057
14. Decoster, A. [et al.], 2010. “How regressive are indirect taxes? A microsimulation analysis of five European Countries”. Journal of Policy Analysis and Management, 29, pp. 326350. doi: 10.1002/pam.20494
15. Dobrowolska, B. and Starzynska, W., 2011. Redystrybucyjne efekty opodatkowania konsumpcji gospodarstw domowych podatkiem VAT. In: A. Bor
artu
r śwista
k, seba
stian w
awr
zak, a
gn
ieszka a
lińsk
a:in pu
rsu
it of ta
x equ
ity: lesson
s fro
m vat rate str
uc
tur
e ad
justm
ent in po
lan
dfin
an
cia
l theo
ry an
d pr
ac
tice
39 (2) 115-137 (2015)
136 kowska and U. LagnowskaSzczesniak, eds. Spoleczno-Ekonomiczne Deter-minanty Konsumpcji w Polsce. Uniwersytet Opolski, pp. 113137.
16. Ebeke, C. and Vazquez, F., 2014. Cyclical Behavior of VAT Revenues in Europe. Selected Issues Paper, IMF (Forthcoming).
17. Ebrill, L. [et al.], 2001. The Modern VAT. International Monetary Fund. doi: 10.5089/9781589060265.07�
18. European Commission (EC), 2011. A retrospective evaluation of elements of the EU VAT system. TAXUD/2010/CC/104 [pdf]. Available at: <http://ec.europa.eu/taxation_customs/resources/documents/common/publications/studies/report_evaluation_vat.pdf>.
19. European Commission (EC), 2013. Study to quantify and analyse the VAT Gap in the EU-27 Member States. Final Report. TAXUD/2012/DE/316 [pdf]. Available at: <http://ec.europa.eu/taxation_customs/common/publications/studies/vatgap.pdf>.
20. European Commission (EC), 2014. VAT Rates Applied in the Member States of the European Union. Situation at 13th January 2014 [pdf]. Available at: <http://ec.europa.eu/taxation_customs/resources/documents/taxation/vat/how_vat_works/rates/vat_rates_en.pdf>.
21. European Union (European Commission and Eurostat), 2013. Taxation trends in the European Union. 2013 edition, Publication Office of the European Union, Luxemburg.
22. European Union Council Directive 2006/112/EC of 28 November 2006 on the common system of value added tax.
23. Friedman, M., 1957. A theory of consumption function. Princeton: Princeton University Press.
24. Garnier, G. [et al.], 2013. “Recent Reforms of Tax Systems in the EU: Good and Bad News”. Taxation Papers, Working Paper, No. 39. Available at: <http://ec.europa.eu/taxation_customs/resources/documents/taxation/gen_info/economic_analysis/tax_papers/taxation_paper_39.pdf>.
25. Grandcolas, C., 2005. “The Occasional Failure in VAT Implementation: Lessons for the Pacific”. Asia-Pacific Tax Bulletin, 12, pp. 613.
26. Gustavsen, G. and Rickertsen, K., 2013. “Adjusting VAT rates to promote healthier diets in Norway: A censored quantile regression approach”. Food Policy, 42, pp. 8895. doi: 10.1016/j.foodpol.2013.07.00�
27. IMF, 2011. Revenue Mobilization in Developing Countries. Board Paper, March 2013. Available at: <http://www.imf.org/external/np/pp/eng/2011/ 030811.pdf>.
28. IMF, 2013. Fiscal Monitor: Taxing Times, October 2013.29. Keen, M. and Lockwood, B., 2010. “The value added tax: Its causes and con
sequences”. Journal of Development Economics, 92 (2), pp. 138151. doi: 10.1016/j.jdeveco.2009.01.01�
30. Keen, M., 2013a. “Targeting, Cascading, and Indirect Tax Design”. IMF Working Paper, WP/13/57. Available at: <http://www.imf.org/external/pubs/ft/wp/2013/wp1357.pdf>.
artu
r śwista
k, seba
stian w
awr
zak, a
gn
ieszka a
lińsk
a:in pu
rsu
it of ta
x equ
ity: lesson
s fro
m vat rate str
uc
tur
e ad
justm
ent in po
lan
dfin
an
cia
l theo
ry an
d pr
ac
tice
39 (2) 115-137 (2015)13731. Keen, M., 2013b. “The anatomy of the VAT”. IMF Working Paper, WP/13/111.
Available at: < http://www.imf.org/external/pubs/ft/wp/2013/wp13111.pdf>.32. Matheson, T. and Swistak, A., 2014. “Modernizing the Icelandic VAT”. IMF
Country Report No. 14/291. Available at: <http://www.imf.org/external/pubs/ft/scr/2014/cr14291.pdf>.
33. Metcalf, G., 1997. “The National Sales Tax: Who Bears the Burden?” CATO Policy Analysis, No. 289.
34. Ministerstwo Finansów (MF), 2013. Preferencje podatkowe w Polsce, Nr. 3 [pdf]. Available at: <http://www.finanse.mf.gov.pl/documents/766655/8294824/20140401+preferencje+podatkowe+w+Polsce.pdf>.
35. Musgrave, R. A., Case, K. E. and Leonard, H., 1974. The distribution of fiscal burdens and benefits. Public Finance Quarterly, (2), pp. 251311.
36. Nagel, T. and Neneman, J., 1995. Effects of a Reform of Private Consumption Taxation in Poland. In: M. Belka and H.G. Peterson, eds. Economic Transfor-mation in Poland: reforms of Institutional Settings and Macroeconomic Per-formance. Frankfurt: Campus Verlag, pp. 212237.
37. OECD, 2010. “Choosing a Broad Base – Low Rate Approach to Taxation”. OECD Tax Policy Studies, No. 19. Paris: OECD.
38. OECD, 2013a. Methodology and limitations in Taxing Wages 2013. Paris: OECD.
39. OECD, 2013b. Taxing Wages 2013. Paris: OECD.40. Pechman, J. A., 1985. Who Paid the Taxes:1966-85? Washington: Brookings
Institution Press.41. Poterba, J. M., 1989. “Lifetime incidence and distributional burden of excise
taxes”. American Economic Review, 79 (2), pp. 325330.42. Prezes Rady Ministrów (PRM), 2010. Projekt ustawy o zmianie ustawy o fi-
nansach publicznych oraz niektórych innych ustaw. Uzasadnienie (Druk nr 3576) [doc]. Available at: <http://orka.sejm.gov.pl/Druki6ka.nsf/0/C9C153E 56DBDADA5C12577D7002BF9B1/$file/3576uzasadnienie.doc>.
43. Radziukiewicz, M., 2011. Redystrybucja dochodów. Kto zyskuje? Kto traci? Warszaw: Polskie Wydawnictwo Ekonomiczne.
44. Slintakova, B. and Klazar, S., 2010. “Impact of harmonization on distribution of VAT in the Czech Republic”. Prague Economic Papers, (2), pp.133149.
45. Tait, A. A., 1988. Value Added Tax. International Practice and Problems. Washington: International Monetary Fund.