Embed Size (px)
Citation preview

In-plane Shear Behaviour ofUnreinforced Masonry Panels
Strengthened with Fibre ReinforcedPolymer Strips
Robert Bruce PetersenBEng (Hons I)
A thesis submitted in partial fulfilment
of the requirements for the degree of
Doctor of Philosophy(School of Engineering)
October, 2009


I hereby certify that the work embodied in this thesis is the result oforiginal research and has not been submitted for a higher degree toany other University or Institution.
I hereby certify that the work embodied in this thesis contains a publi-
shed paper of which I am a joint author. The research work presented
in Chapter 3 of this thesis has been published in the Journal of Com-
posites for Construction:
R B Petersen, M J Masia, and R Seracino. Bond Behavior of NSM
FRP strips Bonded to Modern Clay Brick Masonry Prisms: Influence of
Strip Orientation and Compression Perpendicular to the Strip. Jour-
nal of Composites for Construction, 13(3), 169-178, 2009.I am solely responsible for the research presented in this joint pu-
blication, under the supervision of Mark Masia and Rudi Seracino.
(Signed):
Robert Petersen
(Signed):
Mark Masia (supervisor)


ACKNOWLEDGEMENTS
I would like to thank my supervisors Mark Masia and Rudi Seracino for their sup-
port and excellent supervision. Thanks Mark for always having the time for me
and carefully considering all of my questions. Thanks Rudi for your technical in-
put, kind reviews, and for looking after me during my stay at North Carolina.
I would also like to thank my family and friends. Most of all, I would like to
thank Alison for her love and support (and for doing all of the housework while I
was writing my thesis). I also need to make a special mention of the guys in room
EF120. Adrian, Sagy, Juan, Adam, Ang and Dan, thanks for putting up with my
annoying antics.
I gratefully acknowledge the support of the technical staff of the Civil, Sur-
veying and Environmental Engineering Laboratory. I acknowledge the financial
support provided by the Australian Research Council under DP0559706.
v


CONTENTS
1 Introduction 1
2 Literature Review 3
2.1 Unreinforced masonry shear walls . . . . . . . . . . . . . . . . . . . . . . 3
2.2 Repair, strengthening and retrofitting of masonry walls . . . . . . . . . 5
2.2.1 Motivation . . . . . . . . . . . . . . . . . . . . . . . . . . . . . . . . 5
2.2.2 Conventional strengthening/retrofitting techniques . . . . . . . 6
2.2.3 FRPs as a strengthening/retrofitting alternative . . . . . . . . . . 7
2.3 FRP application techniques . . . . . . . . . . . . . . . . . . . . . . . . . . 8
2.3.1 External bonding . . . . . . . . . . . . . . . . . . . . . . . . . . . . 8
2.3.2 Structural repointing . . . . . . . . . . . . . . . . . . . . . . . . . . 9
2.3.3 Near-surface mounting . . . . . . . . . . . . . . . . . . . . . . . . 10
2.4 FRP reinforcement mechanisms . . . . . . . . . . . . . . . . . . . . . . . 11
2.4.1 Resistance against sliding along a single bed joint . . . . . . . . 11
2.4.2 Resistance against diagonal cracking . . . . . . . . . . . . . . . . 12
2.4.3 Resistance against flexural failure and rocking . . . . . . . . . . 13
2.5 Past FRP strengthened wall tests . . . . . . . . . . . . . . . . . . . . . . . 13
2.5.1 Externally bonded reinforcement . . . . . . . . . . . . . . . . . . 13
2.5.2 Structurally repointed reinforcement . . . . . . . . . . . . . . . . 18
2.5.3 Near-surface mounted reinforcement . . . . . . . . . . . . . . . . 20
2.6 FRP-to-masonry bond characterisation tests . . . . . . . . . . . . . . . . 21
2.6.1 Pull tests . . . . . . . . . . . . . . . . . . . . . . . . . . . . . . . . . 21
2.6.2 FRP strengthened masonry triplets and assemblages . . . . . . 22
2.7 Finite element models for FRP reinforced masonry . . . . . . . . . . . . 24
2.7.1 Modelling masonry . . . . . . . . . . . . . . . . . . . . . . . . . . . 24
2.7.2 Modelling FRP and attachment to masonry . . . . . . . . . . . . 26
2.7.3 Examples of FRP strengthened masonry models from the lite-
rature . . . . . . . . . . . . . . . . . . . . . . . . . . . . . . . . . . . 26
2.8 Analytical models . . . . . . . . . . . . . . . . . . . . . . . . . . . . . . . . 30
2.8.1 Externally bonded discrete strips/sheets . . . . . . . . . . . . . . 30
2.8.2 Externally bonded sheets covering the whole wall surface . . . 34
2.8.3 Structurally repointed reinforcement . . . . . . . . . . . . . . . . 35
2.9 Research gaps and Proposed Work . . . . . . . . . . . . . . . . . . . . . . 37
2.9.1 Research gaps . . . . . . . . . . . . . . . . . . . . . . . . . . . . . . 37
2.9.2 Proposed Work . . . . . . . . . . . . . . . . . . . . . . . . . . . . . 39
vii

viii Contents
3 Pull tests 41
3.1 Introduction . . . . . . . . . . . . . . . . . . . . . . . . . . . . . . . . . . . 41
3.2 Experimental Program . . . . . . . . . . . . . . . . . . . . . . . . . . . . . 42
3.2.1 Pull test specimens . . . . . . . . . . . . . . . . . . . . . . . . . . . 42
3.2.2 Test setup and procedure . . . . . . . . . . . . . . . . . . . . . . . 45
3.3 Experimental Results . . . . . . . . . . . . . . . . . . . . . . . . . . . . . . 49
3.3.1 Failure modes: Series 1 . . . . . . . . . . . . . . . . . . . . . . . . 49
3.3.2 Failure modes: Series 2 . . . . . . . . . . . . . . . . . . . . . . . . 49
3.3.3 Effect of variables on bond strength . . . . . . . . . . . . . . . . . 54
3.3.4 FRP to masonry interface behaviour . . . . . . . . . . . . . . . . 57
3.4 Summary and conclusions . . . . . . . . . . . . . . . . . . . . . . . . . . 66
4 Experimental tests on FRP strengthened masonry wall panels 69
4.1 Introduction . . . . . . . . . . . . . . . . . . . . . . . . . . . . . . . . . . . 69
4.2 Experimental program . . . . . . . . . . . . . . . . . . . . . . . . . . . . . 70
4.3 Experimental results . . . . . . . . . . . . . . . . . . . . . . . . . . . . . . 73
4.3.1 Unreinforced masonry (URM) panels . . . . . . . . . . . . . . . . 73
4.3.2 FRP strengthened panels . . . . . . . . . . . . . . . . . . . . . . . 75
4.4 Comparisons between test specimens . . . . . . . . . . . . . . . . . . . 102
4.4.1 Load-displacement behaviour . . . . . . . . . . . . . . . . . . . . 102
4.4.2 Load increase due to strengthening . . . . . . . . . . . . . . . . . 107
4.4.3 Displacement ductility . . . . . . . . . . . . . . . . . . . . . . . . . 109
4.5 Comparison of results with similar tests from the literature . . . . . . . 110
4.6 Summary and conclusions . . . . . . . . . . . . . . . . . . . . . . . . . . 113
5 Finite element modelling 115
5.1 Introduction . . . . . . . . . . . . . . . . . . . . . . . . . . . . . . . . . . . 115
5.2 Masonry model . . . . . . . . . . . . . . . . . . . . . . . . . . . . . . . . . 115
5.2.1 Interface element non-linear behaviour . . . . . . . . . . . . . . 116
5.3 Masonry material characterisation tests . . . . . . . . . . . . . . . . . . 120
5.3.1 Bond wrench tests . . . . . . . . . . . . . . . . . . . . . . . . . . . 120
5.3.2 Compression tests on masonry prisms . . . . . . . . . . . . . . . 122
5.3.3 Torsion test . . . . . . . . . . . . . . . . . . . . . . . . . . . . . . . 126
5.3.4 Lateral modulus of rupture test . . . . . . . . . . . . . . . . . . . 135
5.4 FE model: URM panel specimens . . . . . . . . . . . . . . . . . . . . . . 136
5.5 FRP Reinforcement model . . . . . . . . . . . . . . . . . . . . . . . . . . 142
5.5.1 Attaching FRP to masonry in finite element model . . . . . . . . 142
5.5.2 Calibration of bond-slip model . . . . . . . . . . . . . . . . . . . . 143
5.5.3 Dowel action . . . . . . . . . . . . . . . . . . . . . . . . . . . . . . 147
5.5.4 Limitations of the FRP reinforced masonry FE model . . . . . . 151
5.6 FE model: FRP reinforced panel specimens . . . . . . . . . . . . . . . . 153
5.6.1 Panels V4A & V4B . . . . . . . . . . . . . . . . . . . . . . . . . . . . 156
5.6.2 Panel V2 . . . . . . . . . . . . . . . . . . . . . . . . . . . . . . . . . 166
5.6.3 Panels H4A & H4B . . . . . . . . . . . . . . . . . . . . . . . . . . . 169

Contents ix
5.6.4 Panels V2H2A & V2H2B . . . . . . . . . . . . . . . . . . . . . . . . 174
5.7 Summary and conclusions . . . . . . . . . . . . . . . . . . . . . . . . . . 187
6 Conclusions/Recommendations 191
6.1 Summary and conclusions . . . . . . . . . . . . . . . . . . . . . . . . . . 191
6.2 Limitations and proposed future work . . . . . . . . . . . . . . . . . . . 192
Bibliography 195


ABSTRACT
Inserting fibre reinforced polymer (FRP) strips into pre-cut grooves in the surface
of masonry walls is an emerging technique for the retrofit of unreinforced masonry
(URM) structures. This method, known as near surface mounting (NSM), provides
significant advantages over externally bonded FRP strips in that it has less of an ef-
fect on the aesthetics of a structure and can sustain higher loading before debon-
ding. As this technique is relatively new, few studies into the behaviour of masonry
walls strengthened using this technique have been conducted.
A combined experimental and numerical program was conducted as part of
this research project to study the in-plane shear behaviour of masonry wall pa-
nels strengthened with NSM carbon FRP (CFRP) strips. In this project the FRP
strips were designed to resist sliding along mortar bed joints and diagonal cracking
(through mortar joints and brick units). Both of these failure modes are common
to masonry shear walls. Different reinforcement orientations were used, including:
vertical; horizontal; and a combination of both.
The first stage of the project involved characterising the bond between the FRP
and the masonry using experimental pull tests (18 in total). From these tests the
bond strength, the critical bond length and the local bond-slip relationship of the
debonding interface was determined.
The second stage of the project involved conducting diagonal tension/shear
tests on masonry panels. A total of four URM wall panels and seven strengthe-
ned wall panels were tested. These tests were used to determine: the effectiveness
of the reinforcement; the failure modes; the reinforcement mechanisms; and the
behaviour of the bond between the masonry and the FRP in the case of a panel.
The third stage of the project involved developing a finite element model to
help understand the experimental results. The masonry was modelled using the
micro-modelling approach, and the FRP was attached to the masonry model using
the bond-slip relationships determined from the pull tests.
Reinforcement schemes in which vertical FRP strips were used improved the
strength and ductility of the masonry wall panels. When only horizontal strips
were used to reinforce a wall panel, failure occurred along an un-strengthened bed
joint and the increase in strength and ductility was negligible. The vertical reinfor-
cement prevented URM sliding failure by restraining the opening (dilation) of the
sliding cracks that developed through the mortar bed joints.
The finite element model reproduced the key behaviours observed in the expe-
riments for both the unreinforced and FRP strengthened wall panels. This model
would potentially be useful for the development of design equations.
xi

1
Introduction
Damages caused by earthquakes have highlighted the potential vulnerability of
unreinforced masonry (URM) buildings to earthquake loading. Previous investiga-
tions have identified the need to develop efficient techniques to retrofit (or streng-
then) existing masonry buildings against earthquake loading (Bruneau, 1994). A
strengthening technique with a low impact on function and appearance of the
building is of particular importance. During an earthquake, the walls in the lo-
wer storeys are likely to fail in shear (in the plane of the wall). In this thesis, a
technique to strengthen in-plane loaded shear walls is investigated.
The technique of bonding fibre reinforced polymer (FRP) materials to a URM
wall is a relatively new retrofit alternative. The FRP reinforcement is designed to
provide tensile strength to a wall and increase the wall strength and ductility. The
FRP material is either externally bonded (EB) to the surface of a wall (suitable tech-
nique for both fabrics, grids or thin strips) or inserted into grooves cut into the
surface of a wall using a technique known as near surface mounting (NSM) (this
technique is suitable for both thin rectangular strips and bars). The advantages of
using FRPs to strengthen/retrofit an existing masonry structure include the mate-
rials high strength/stiffness to weight ratio and corrosion insensitivity.
The NSM technique provides the following significant advantages over the EB
technique: it is protected from vandalism; it is protected to some extent from fire;
if detailed carefully it may not adversely affect the aesthetics of a structure; and
it can develop a higher strain in the FRP before debonding. As this technique is
relatively new (especially for masonry structures), few studies into the behaviour
of masonry walls strengthened using this technique have been conducted.
The objective of this research was to study the in-plane shear behaviour of
NSM FRP strengthened masonry wall panels. In particular, the objective was to
determine the effectiveness of the technique and also the fundamental shear rein-
forcement mechanisms. The specific aims for the current research were to:
1. Characterise experimentally the shear bond-slip behaviour of the interface
between the NSM FRP strip and masonry. The bond-slip behaviour repre-
sents the fundamental behaviour of the FRP-to-masonry interface. This re-
lationship is required in finite element models to predict the behaviour of an
FRP reinforced structure.
2. Study the in-plane shear behaviour of NSM FRP strengthened masonry by
1

2 1. Introduction
conducting laboratory experiments on strengthened wall panels; and
3. Study the in-plane shear behaviour of NSM FRP strengthened masonry wall
panels using a rationally based, representative finite element model. The
finite element model uses the bond-slip behaviour determined in Aim 1 and
is verified using the experiments from aim 2.
Scope and Limitations
The NSM FRP reinforcing system presented in this thesis may be used for both
the strengthening of undamaged walls and the repair/retrofit of damaged walls.
In this thesis the NSM reinforcing system is only used to strengthen undamaged
masonry panels.
Thesis outline
The next chapter provides a review of the literature related to the topic. At
the end of the chapter the proposed research work is detailed. The research work
is contained in Chapters 3 to 5. Chapter 3 details the experimental tests used to
characterise the shear bond-slip behaviour of the interface between the NSM FRP
strip and masonry; Chapter 4 details the experimental tests on strengthened wall
panels (Aim 2); and Chapter 5 details the development and verification of the finite
element model (Aim 3). Conclusions and recommendations for future work are
provided in Chapter 6.

2
Literature Review
2.1 Unreinforced masonry shear wallsUnreinforced masonry (URM) is used in buildings for load bearing walls, for in-
fill panels in framed construction, for veneers attached to backup frames, for piers
and columns, and for free standing walls. In load-bearing masonry construction
URM walls are required to act as shear walls to transfer lateral forces (from earth-
quake and wind) to the building supports. Also, infill panels in framed construc-
tion may interact with the surrounding frames to resist shear forces from lateral
load.
In load bearing masonry construction, masonry shear walls are subjected to
both vertical and lateral loads in the plane of the wall. The typical failure modes
of load-bearing masonry shear walls include: sliding, diagonal cracking and ro-
cking (Figure 2.1). The mechanisms depend primarily on the geometry of the wall
(height/length ratio), on the boundary conditions and on the magnitude of vertical
loads, and then on the masonry properties (Magenes and Calvi, 1997; Tomaževic,
1999; ElGawady et al., 2007).
(a) (b) (c)
Figure 2.1: Failure modes of URM shear wall: (a) sliding; (b) diagonal cracking
(through brick units and mortar joints); (c) rocking (with toe crushing)
1. Sliding: In a wall with poor mortar strength or low pre-compression, failure
is likely to occur by sliding along the bed joints. Sliding occurs when the fric-
3

4 2. Literature Review
tional resistance along the bed joints is overcome. Sliding planes may also be
formed by the connection of flexural tensile cracks that develop during cyclic
motions (Magenes and Calvi, 1997).
2. Diagonal cracking: In walls with low aspect ratios (height/length) and high
axial loads, failure is likely to occur by diagonal cracking. Diagonal cracking
may occur through the brick units or in a stepped pattern through the mor-
tar joints, depending on their relative strengths. Under reversing cycles of
lateral loading an X-type crack pattern develops (Figure 2.2).
3. Rocking: In walls with high moment/shear ratios or improved shear resis-
tance the wall may be set into a rocking motion, with a combination of uplift
at the heel and crushing at the toe.
Figure 2.2: Diagonal cracking under cyclic shear loads
The diagonal cracking failure mode is considered the least favourable failure
mode of a masonry shear wall. It is generally characterised by brittle behaviour
with a rapid decrease in capacity and limited deformations after reaching the peak
load (Magenes and Calvi, 1997; Marshall and Sweeney, 2002; Zhao et al., 2003).
Rocking and sliding (along a single horizontal bed joint), on the other hand, are
considered adequate failure mechanisms when considering deformation capacity,
stability and energy dissipation (Marshall and Sweeney, 2002; Corte et al., 2008;
Holberg and Hamilton, 2002). Two- to three-storey load-bearing masonry buil-
dings may be able to resist large displacements (and perform adequately during
an earthquake event) if the primary failure mode is rocking or bed-joint sliding
(Holberg and Hamilton, 2002).
Damage to shear walls, during an earthquake, is normally observed in the lo-
wer storeys of a load-bearing masonry building, where the shear loads and com-
pression loads are the greatest (Page, 1996; Bruneau, 1994). In these walls the most
common type of damage is the most brittle failure mode: diagonal cracking in an
X pattern. Unless major openings or discontinuities are present, damage does not
usually result in wall collapse. However, damage can cause a large reduction in
2.2 Repair, strengthening and retrofitting of masonry walls 5
capacity of the wall which adversely affects the response of the whole structure
(Page, 1996).
In walls with openings (for windows, doors, etc) damage (commonly diagonal X
cracking) is concentrated around the openings in the masonry piers and spandrels.
The consequences of this damage to the overall structural behaviour of the buil-
ding is often severe (Wakabayashi, 1986; Key, 1988; Page, 1996; Tomaževic, 1999).
Damage in the piers is the most common form of in-plane wall failure in a load
bearing masonry structure and can lead to soft storey effects, which are catastro-
phic during an earthquake (Tomaževic, 1999).
Infill panels in framed construction may interact with the surrounding frames
to resist shear forces from lateral loads (Tomaževic, 1999). The masonry acts as
a compressive strut and substantially stiffens the frame (Key, 1988). Typical fai-
lure of the infill masonry, due to in-plane loads, includes: failure of the diagonal
compression strut by diagonal cracking; and horizontal sliding failure of the panel
(see Figure 2.3). Once failure occurs the stiffening effect to the frame is reduced.
Framed construction with masonry infill walls is generally more effective against
earthquakes than load bearing masonry buildings (Wakabayashi, 1986).
Figure 2.3: Typical failure mechanisms of masonry infilled frames: (a) horizontal
sliding failure along a single bed joint; (b) horizontal sliding failures along multiple
bed joints; (c) diagonal cracking (Tomaževic, 1999)
2.2 Repair, strengthening and retrofitting of masonry
walls2.2.1 Motivation
Damages caused by earthquakes have highlighted the potential vulnerability
of unreinforced masonry buildings to earthquake loading (Bruneau, 1994; Klopp
and Griffith, 1998). The reasons for poor performance of masonry structures in
earthquakes are as follows (Wakabayashi, 1986):
1. The material itself is brittle, and strength degradation due to load repetition
is severe.
2. Heavy weight
3. Large stiffness, which leads to large response to earthquake waves of short
natural period.
6 2. Literature Review
4. Large variability in strength depending on quality of construction.
5. Poor detailing (connection and support) of walls.
Many load-bearing masonry buildings were constructed before the develop-
ment of rational design procedures and are under designed for earthquakes as
a result (Magenes and Calvi, 1997). For example, in Australia, before the New-
castle earthquake in 1989, there was a perception of low seismicity and buildings
were not designed for earthquakes. Particular attention was not given to building
layout, detailing, lateral loads on internal walls, or potential soft storey effects; all
critical to the structural performance of masonry buildings in earthquakes (Page,
1996). These buildings require strengthening. Masonry buildings may also require
strengthening due to deterioration of masonry walls, caused by either environ-
mental factors or past loading events.
2.2.2 Conventional strengthening/retrofitting techniques
Conventional techniques for the repair, strengthening and retrofitting of ma-
sonry walls were reviewed by ElGawady et al. (2004) and Chuang and Zhuge (2005).
Conventional techniques include (ElGawady et al., 2004):
1. Surface treatment using products such as ferrocement, reinforced plaster,
and shotcrete
2. Injecting grout or epoxy into pre-existing cracks or voids
3. Externally reinforcing the masonry with steel plates or tubes
4. Confining the masonry with reinforced concrete tie columns and tie beams
5. Post-tensioning the wall using steel tendons
6. Adding grouted steel reinforcement within cores drilled vertically through
the mid-thickness of the wall
7. Inserting steel bars into the edge of the mortar bed joints by a process known
as structural repointing.
These techniques have been proven effective, but they also have disadvantages.
Many of the techniques are expensive, time and labour intensive, reduce building
space (when thick surface treatments are used), adversely affect the aesthetics of a
structure, and can add significant mass to a structure. Adding significant mass to
a structure can significantly affect its dynamic response. Corrosion of steel rein-
forcement is also an issue.

2.2 FRPs as a strengthening/retrofitting alternative 7
2.2.3 FRPs as a strengthening/retrofitting alternative
The technique of bonding fibre reinforced polymer (FRP) materials to an un-
reinforced masonry wall is a relatively new strengthening/retrofitting alternative.
FRPs are a composite material that consist of high strength fibres (in tension) that
are embedded in a resin matrix. The fibres are typically carbon, glass, or aramid
and the resin is usually epoxy. The fibres are very strong in their longitudinal di-
rection, but weak in their lateral direction. For strengthening/retrofitting purposes,
FRPs are produced in fabric sheets, pre-formed pultruded strips, tendons (for pre-
tensioning or post-tensioning) and reinforcing bars or meshes (Shrive, 2006). In
strips, tendons and reinforcing bars the fibres are aligned in one direction and this
gives the composite anisotropic (or directional) properties. Sheets may be produ-
ced with all of the fibres aligned in one direction (uniaxial), aligned orthogonally
(bidirectional), or randomly. When the fibres are aligned orthogonally or randomly
the composite exhibits orthotropic properties.
Common FRP composites are completely elastic until failure. Attempts have
been made recently to introduce some ductility into the composite material by
using a combination of different modulus fibres (Wu, 2004). Typical mechani-
cal properties of some of the FRP reinforcement materials used by researchers to
strengthen masonry shear walls are shown in Table 2.1.
Table 2.1: Typical mechanical properties of FRP reinforcements used to strengthen
masonry shear walls
FRP reinforcement E (MPa) Ultimate Reference
stress (MPa)
fabric sheet (glass) 73300 986 Stratford et al. (2004)
pultruded strip (carbon) 147500 2000 Schwegler (1995)
reinforcing bar (glass) 50200 824 Li et al. (2005)
The FRP reinforcement is designed to provide tensile strength to a masonry
wall. This increases the strength and ductility of the masonry wall, which in turn
improves the behaviour of the wall during an extreme loading event. The FRP rein-
forcement is either externally bonded (EB) to the surface of a wall or inserted into
grooves cut into the surface of a wall (discussed in more detail in Section 2.3). The
FRP reinforcement may also be mechanically anchored at the ends of the wall or
into adjoining supports. In general, when mechanical anchors are used the FRP
reinforcement is also bonded to the wall. In these cases, the mechanical ancho-
rage is used to provide load transfer between the FRP and masonry after the FRP
debonds from the wall. In some cases, however, the FRP reinforcement is not bon-
ded to the wall and is only attached to the wall via the mechanical anchorage (El-
Gawady et al., 2005).
The advantages of using FRPs to strengthen/retrofit an existing masonry struc-
ture include the materials high strength/stiffness to weight ratio and high dura-
bility. The light weight of the material improves on-site handling, which reduces
8 2. Literature Review
labour costs and interruptions to existing services and building occupants. The
light weight is also advantageous from a seismic point of view, as an increase in
building mass increases the earthquake forces within a building.
The main disadvantage with using FRP for reinforcement is that it has brittle
failure modes. FRPs may fail by rupturing or, if no mechanical anchorage is pro-
vided, by debonding from the strengthened material. Tensile force in the FRP is
transferred through the adhesive (usually epoxy) to the masonry via shear. When
the shear strength of the adhesive or the superficial layer of brick is exceeded, de-
bonding occurs. Debonding may also occur along the interface between the brick
and adhesive or the interface between the adhesive and FRP. Both rupture and de-
bonding failure modes are brittle in nature, potentially leading to non-ductile be-
haviour and catastrophic collapse. However, because masonry walls are inherently
brittle to begin with, the addition of FRP reinforcement may not only increase the
strength but also increase the ductility, even though the FRP may eventually rup-
ture or debond. Other disadvantages of FRP include their limited fire resistance (of
the resin matrix and or epoxy adhesive) , sensitivity of some resins to direct sun-
light, and their impact on the aesthetics of a structure (e.g. when covering a wall
with an externally bonded fabric sheet) (Shrive, 2006).
2.3 FRP application techniques
2.3.1 External bonding
The external bonding (EB) technique is the most common form of application.
In this technique, preformed pultruded FRP strips or FRP fabric sheets are bonded
to the external surface of a wall typically using a two-part epoxy adhesive.
Before the FRP reinforcement is bonded to the wall the surface must be prepa-
red. Typically the masonry surface first needs to be cleaned using a combination
of abrasion and solvent, then a filler layer (typically also epoxy) may need to be ap-
plied to produce a flat surface for the FRP to be bonded to (Stratford et al., 2004).
FRP fabric sheets can be externally bonded to the surface of a wall using two
methods. The fabric sheets may first be impregnated within a layer of epoxy and
allowed to cure before being bonded to the wall. Alternatively, the fabric sheets can
be bonded to the wall using the wet lay-up technique. In the wet lay-up technique
the fabrics are first pressed into a layer of epoxy painted onto the surface of the
wall and are then covered with another layer of epoxy. The wet lay-up technique is
described in greater detail in Stratford et al. (2004).
Thin pultruded strips are usually oriented in diagonal patterns (e.g. Figure 2.8a)
or in vertical/horizontal grid patterns. Fabric sheets may be applied to the whole
surface of a wall (Stratford et al., 2004) or as discrete strips (e.g. Figure 2.8b).
No minimum requirements on the masonry material to be strengthened has
been reported in the literature. However, debonding of the FRP from the masonry
occurs via cracking through the surface of the masonry and is therefore related
to the tensile strength of the masonry. Therefore the stronger the masonry the
stronger the FRP-to-masonry bond.

2.3 Structural repointing 9
Externally bonded FRP sheets have the following advantages over the other ap-
plication techniques described in the following sections: wide sheets may provide
dowel resistance across sliding joints, and confinement to masonry in compres-
sion if applied on both sides of the wall (Section 2.4). The advantage of using FRP
sheets bonded to the whole surface of a wall is its simplicity (Stratford et al., 2004).
An anchored sheet that has its fibres aligned in the orthogonal directions of the
wall can resist sliding, diagonal cracking and rocking failure modes (Marshall and
Sweeney, 2002) (see Section 2.4).
Externally bonded FRP sheets and strips have the following disadvantages: they
have a large impact on the aesthetics of a wall, they are highly susceptible to de-
bonding failure modes, they may buckle from the surface of the wall in compres-
sion, and they are exposed (to vandalism or fire).
2.3.2 Structural repointingThe structural repointing (SR) technique involves inserting an FRP bar or thin
pultruded strip into a groove cut into the surface of the mortar joints. Typically
the reinforcement is placed horizontally in the mortar bed joints, but can also be
placed vertically in the mortar head joints in the case of stack bonded masonry.
A typical cross section through the masonry thickness showing a structurally
repointed FRP bar is shown in Figure 2.4. The FRP is usually embedded into the
mortar joint space using epoxy, but sometimes other adhesives have been used
such as a latex-modified cement paste (e.g. Turco et al. (2006)).
Figure 2.4: FRP bar structural repointing (cross section) from Li et al. (2005)
The grooves in the mortar joint are usually cut using a circular saw equipped
with a brick cutting blade. The process of cutting a groove into the wall is easier
than the surface treatment procedure that needs to be followed for the externally
bonded reinforcement. The other main advantage of structural repointing is that
the strengthening intervention is completely hidden once installed.
Structurally repointed FRP reinforcement is suitable for restraining diagonal
cracking failure modes, but has limited effectiveness in restraining sliding or in-
plane flexural cracking. In cases where the structural repointed reinforcement
is not placed in every bed joint, failure will occur along an unstrengthened bed
joint. Therefore it is usually necessary to structurally repoint all mortar bed joints.
The pull-out bond strength of structurally repointed reinforcement is less than the

10 2. Literature Review
bond strength of near-surface mounted reinforcement bonded into the brick (Sec-
tion 2.3.3).
2.3.3 Near-surface mountingThe near-surface mounting (NSM) technique is a relatively new retrofitting tech-
nique, and can be used as an alternative to EB FRP sheets or strips. The technique
involves bonding thin FRP strips or FRP bars into grooves cut into the surface of
a masonry wall (Figure 2.5). The grooves are cut with a circular saw fitted with a
brick cutting blade. The FRP reinforcement is then bonded into the groove using
a two-part epoxy. Note that the SR technique (discussed previously) is a specific
NSM case where the FRP is inserted into grooves cut along the mortar bed joint.
Figure 2.5: Illustration of the near-surface mounted technique (into one brick)
As for externally bonded FRP, the bond strength between the NSM FRP and
masonry is related to the tensile strength of the material the FRP is bonded to.
Therefore the bond strength of the NSM FRP strip is higher if bonded to the brick
rather than mortar or plaster render. The debonding resistance of NSM FRP is
larger than the debonding resistance of EB FRP strips due to the increased bond
surface area and extra confinement.
The grooves may be oriented in any direction. Some possible applications are
shown in a Figure 2.6. The schemes shown in the figure can restrain both diago-
nal cracking and sliding failure mechanisms. Vertical strips may be inserted into
grooves cut into brick units only (for high FRP-to-masonry bond strength, but in-
creased visual impact), or into alternating brick units and mortar head joints (for
reduced visual impact, but also a reduced bond strength). Similarly horizontal
strips may be bonded into grooves cut into brick units only, or into the mortar
bed joints only (structurally repointed reinforcement).
The aesthetic impact of the technique can be reduced by bonding the FRP into
the mortar joints. When bonded into the brick units, the aesthetic impact can be
reduced by choosing an epoxy colour that is close to the colour of the brick. The
NSM reinforcement may also be buried a little deeper than the wall surface and
a filler material with a colour similar to that of the brick could be pasted over the
embedded reinforcement.
The advantages of the NSM technique compared to the externally bonded tech-
nique include: reduced aesthetic impact, less exposure (to vandalism or fire), si-

2.4 FRP reinforcement mechanisms 11
(a) Grooves cut into brick (b) Grooves cut into mortar
Figure 2.6: Possible NSM reinforcement schemes
gnificantly increased debonding resistance, and an increased resistance to buck-
ling. A possible disadvantage of the technique is that it requires deep grooves to
be cut into the surface of the masonry which may cause cracking through the thi-
ckness of the wall.
The costs associated with the NSM technique are likely similar (or even poten-
tially less than) the costs associated with the EB technique. The NSM technique
would require less material (due to increased bond strength), and the installation
efforts and costs required for both techniques would be comparable.
2.4 FRP reinforcement mechanismsFRPs can be used to provide resistance against the three typical URM failure
modes: sliding; diagonal cracking; and rocking. The reinforcement mechanisms
are now discussed.
2.4.1 Resistance against sliding along a single bed joint
According to Marshall and Sweeney (2002), sliding along a single bed joint is
best resisted by placing the FRP reinforcement continuously vertically across the
specimen. The FRP is aligned so that no horizontal failure plane can develop wi-
thout passing through the FRP reinforcement. Vertical reinforcement restrains sli-
ding by providing dowel strength across the joint and also by resisting shear indu-
ced dilation.
The dowel strength of externally bonded, bidirectional FRP sheets across a sli-
ding joint has been demonstrated by Ehsani et al. (1997) (Section 2.6.2). In their
study 114 mmwide sheets were used. It is likely that the dowel strength of the rein-
forcement reduces as the width of the sheet reduces. For FRP strips with a small
width, the dowel resistance is usually considered negligible (Marshall and Swee-
ney, 2002). In fact, Triantafillou (1998) has ignored the dowel strength of EB FRP
sheets completely in a design model (see Section 2.8).
FRPs crossing a sliding joint can potentially restrict crack separation (normal to
the crack face) needed for sliding to occur. Crack opening during sliding is known

12 2. Literature Review
as dilation. Dilation occurs because the crack surfaces are uneven and one sur-
face needs to move up and over the other to facilitate sliding. Dilatational beha-
viour upon shearing is common in frictional cementitious materials and has been
observed in masonry joints (Van der Pluijm, 1998; Van Zijl, 2004). By resisting di-
lation with FRP the frictional force along the sliding interface increases, which in
turn increases the frictional sliding resistance (Figure 2.7). This mechanism is re-
lated to the shear bond behaviour between the FRP and the masonry, where the
FRP is loaded in tension (limited by debonding or rupture). It is also related to the
frictional and dilatational behaviour of the shear sliding joint. This mechanism is
generally not considered or recognised for FRP strengthened masonry structures.
It has, however, been shown to be a significant shear resisting mechanism of longi-
tudinal EB and NSM FRP reinforcement bonded to reinforced concrete beams and
slabs (Oehlers and Seracino, 2004).
Figure 2.7: Reinforcement mechanism in shear sliding: FRP resists dilation and in-
creases friction
2.4.2 Resistance against diagonal crackingReinforcement that spans the crack acts in tension to restrain the crack ope-
ning. Either horizontal or diagonal FRP reinforcement is generally used. Note that
horizontal reinforcement is effective at restraining diagonal cracks that develop in
both directions (X-cracking) as a result of reversing cycles of in-plane lateral loa-
ding. Whereas, diagonal reinforcement is effective at restraining diagonal cracks
that develop in one direction only. Therefore diagonal reinforcement needs to be
applied in an X-type pattern (or similar) to resist X-cracking. As the reinforcement
acts in tension, the reinforcement contribution is limited by rupture of the FRP or
debonding of the FRP from the masonry.
The presence of the reinforcement, which restrains the opening of the diago-
nal cracks, allows the average stresses within the wall to increase. This leads to
the development of more diagonal cracks (typically parallel to each other) and the
formation of diagonal struts within the masonry (Li et al., 2005). In this highly cra-
cked state the wall is said to resist shear by a truss type mechanism (or strut and
tie mechanism), with tension carried by the FRP and compression carried by the
masonry struts (Zhao et al., 2003; Stratford et al., 2004). Provided that the reinfor-
cement is strong enough, the shear stress within the wall can become high enough

2.4 Resistance against flexural failure and rocking 13
to cause crushing of the struts.
2.4.3 Resistance against flexural failure and rocking
Flexural failure within the wall is resisted with vertical reinforcement placed
along the vertical edges of the wall. The effectiveness of the reinforcement is again
limited by debonding or rupture. To prevent rocking the vertical reinforcement
is anchored at the corners of the wall. Crushing capacity at the toe can only be
improved through confinement (Marshall and Sweeney, 2002). Confinement can
be provided by bonding a bidirectional FRP sheet to both sides of the masonry wall
(Hamid et al., 2005).
Hall et al. (2002) recommended that FRP reinforcement not be used to prevent
rocking. Using FRP reinforcement to strengthen against rocking would increase
the lateral load capacity, but the dynamic energy dissipation provided by impact
during rocking would be sacrificed. Also, the FRP may fail by rupture or debon-
ding. According to Hall et al. (2002) failure of the FRP by rupture or debonding
would cause a sudden energy release which could cause catastrophic instability
in the wall. Hall et al. (2002) recommends that ductile elements (such as steel)
could be used to increase the strength and ductility across the connections (see
Section 2.5.1).
2.5 Past FRP strengthened wall tests
2.5.1 Externally bonded reinforcement
Discrete strips/sheets
Several researchers have used externally bonded FRP strips to improve the in-
plane shear resistance of unreinforced masonry walls (or panels), including: Schwe-
gler (1995); Tinazzi and Nanni (2000); Corradi et al. (2002); Valluzzi et al. (2002);
Marshall and Sweeney (2002); Holberg and Hamilton (2002);Chuang et al. (2003);
Zhao et al. (2003); Zhao et al. (2004); ElGawady et al. (2005); Maria et al. (2006);
Marcari et al. (2007); and Almusallam and Al-Salloum (2007).
Most of these researchers have used EB FRP strips and sheets to strengthen
against diagonal cracking. These researchers have aligned the FRP strips/sheets in
diagonal patterns, horizontal patterns, vertical patterns, and orthogonal grid pat-
terns. Some examples are shown in Figure 2.8. The results from these tests have
shown that EB FRP strips and sheets are effective at restraining the opening of
diagonal cracks and increasing the shear strength of the wall. The common fai-
lure modes of these tests were: debonding of the FRP from the wall; FRP rupture;
or failure of the masonry (provided that the reinforcement was strong enough).
Observed failure within the masonry has included: crushing of the masonry (ge-
nerally at the masonry toe) (Marcari et al., 2007; Corradi et al., 2002); crushing
of masonry wall flanges (Schwegler, 1995); and separation of masonry leaves in a
double-leaf masonry wall (Corradi et al., 2002). Failure has also been caused by
cracking outside of the FRP reinforcement (Zhao et al., 2003).
In tests where debonding was observed, debonding of the FRP from the ma-

14 2. Literature Review
(a) (b) (c)
(d) (e) (f)
Figure 2.8: Strengthening schemes used by researchers to prevent diagonal cra-
cking: a) Schwegler (1995), b) CFRP sheets Zhao et al. (2003), c)
CFRP sheets Zhao et al. (2004), d) CFRP sheets Maria et al. (2006), e)
CFRP/GFRP sheets Marcari et al. (2007), f) CFRP/GFRP sheets Valluzzi
et al. (2002)
sonry occurred through a thin layer of brick underneath the EB FRP (Schwegler,
1995; Valluzzi et al., 2002; Marcari et al., 2007; Maria et al., 2006). Debonding gene-
rally originated at the crack openings and propagated, along the strips, away from
the cracks (Marcari et al., 2007). The researchers have found that stiffer materials
(such as carbon FRPs) and thicker materials were more susceptible to debonding
(Valluzzi et al., 2002; Marshall and Sweeney, 2002; Marcari et al., 2007). When the
FRP was not anchored, debonding usually resulted in brittle failure with a sudden
decrease in wall load-carrying capacity (Valluzzi et al., 2002; Marshall and Swee-
ney, 2002; Maria et al., 2006). In some cases, however, debonding was progressive,
and resulted in a gradual loss of strength (Maria et al., 2006). In some cases the EB
FRP strips/sheets were anchored to the masonry or supporting structures. In these
cases debonding of the FRP from the masonry did not cause wall failure because
the load was still transferred through the end anchorages (Schwegler, 1995; Zhao
et al., 2003, 2004). In these cases significant increases in strength and also ductility
were achieved.
By externally bonding CFRP sheets in a diagonal X and Λ pattern to masonry
walls (Figure 2.8b and Figure 2.8c respectively), Zhao et al. (2003, 2004) improved
the in-plane lateral deformation of the masonry walls by 135-441% (depending on
the pattern and width of EB sheet used). They also found that the area within the
hysteresis curve (which reflects the energy dissipation capacity of the specimen)
was larger for the strengthened wall. The improved deformation and energy dissi-
2.5 Discrete strips/sheets 15
pation capacity was a result of the FRP strengthening spreading the damage throu-
ghout the wall. Schwegler (1995) doubled the ductility of a masonry wall using
diagonally aligned FRP strips that were mechanically anchored to concrete slabs
above and below the wall. The increase in ductility was a result of the FRP preven-
ting the brittle diagonal cracking failure mode, spreading damage throughout the
wall, and forcing failure to occur by crushing in the masonry wall flanges.
A number of researchers have also investigated the effect of single-sided (or
non-symmetric) strengthening. Detrimental effects of single-sided strengthening
have been observed by Valluzzi et al. (2002), who used the Diagonal Tension/Shear
Test (ASTM E519-93) ASTM Standards (1993) to test the specimens. A specimen
from Valluzzi et al. (2002) is shown in Figure 2.8f. Valluzzi et al. (2002) observed
that when the FRP reinforcement was applied to only one side of the wall, signifi-
cant out-of-plane deformation occurred. This out-of-plane deformation was cha-
racterised by bending about a single diagonal crack towards the reinforced side.
They found that in these cases, the FRP reinforcement provided an insignificant
increase in strength over the URM specimens. The out-of-plane displacement was
likely exaggerated by the little restraint that this test provided (only at the top and
bottom corners). In several other tests, however, where the walls had some form
of restraint along the top and bottom edges, the effect of the non-symmetric rein-
forcement was not as severe. In many tests (e.g. Marshall and Sweeney (2002)
and Chuang et al. (2003)) where single-sided reinforcement schemes were used, no
out-of-plane deformation was reported. Schwegler (1995) compared the behaviour
of a wall strengthened on only one side to the behaviour of a wall strengthened on
both sides of the wall. Note that both of these walls had the same reinforcement
ratio. Schwegler found that on the unreinforced side of the single side reinforced
wall, a single diagonal crack formed that stepped through the mortar joints. On
the strengthened side (of the single side reinforced wall) fine cracks perpendicular
to the reinforcement were observed throughout the wall. The same behaviour was
observed for the wall strengthened on both sides. The difference in strength and
ductility between the wall strengthened on one side only and the wall strengthe-
ned on both sides was found to be negligible.
Externally bonded FRP sheets are also susceptible to buckling, when subjected
to compression along their longitudinal axis. If the FRP is only externally bonded
to the surface of a masonry wall, lateral restraint against buckling is only provided
by the strength of the bond (perpendicular to the surface of wall). Once this bond
strength is overcome the FRP can buckle and debond from the wall. Buckling and
debonding of the FRP sheets in compression would adversely affect the behaviour
of the FRP sheet when it is required to act in tension under a reversing seismic
lateral load. For example: diagonal sheets are compressed when subjected to in-
plane lateral load in one direction and then they are stretched in tension when the
load reverses. Also, vertical sheets may be compressed near the toe of a wall when
subjected to an in-plane lateral load in one direction. These sheets are then loaded
in tension upon load reversal. Buckling of EB FRP sheets has been observed in
tests performed by Marcari et al. (2007). In these tests the FRP sheets were bonded

16 2. Literature Review
to the surface of the masonry wall in both an X and orthogonal grid arrangement.
FRP buckling in one of the tests is shown in Figure 2.9.
Figure 2.9: Buckling of a compressed EB FRP sheet from Marcari et al. (2007)
Holberg and Hamilton (2002) and Hall et al. (2002) designed a hybrid streng-
thening system to improve the in-plane shear behaviour of masonry walls and
piers. In their system FRP composites are designed to strengthen against in-plane
shear and flexural failures within the wall, and ductile steel is used to connect the
wall pier to the rest of the structure. To improve the in-plane behaviour of the wall
the steel connections were designed to yield before the FRP ruptured (or debon-
ded, if the FRP was not anchored into the steel connection). An example of the
system is shown in Figure 2.10.
Figure 2.10: Ductile connection from Holberg and Hamilton (2002)
Holberg and Hamilton (2002) tested their system on unreinforced concrete ma-
sonry walls designed to fail by a rocking mode. Note that rocking has been shown
to be an adequate failure mode of a masonry shear wall, considering ductility, sta-
bility and energy dissipation (Section 2.1). Holberg and Hamilton (2002) aimed
to improve the behaviour further. They strengthened four unreinforced masonry
walls with externally bonded GRFP sheets, used in combination with structural
steel and reinforcing steel connections. They used vertical FRP sheets to streng-
then against in-plane flexural failure within the wall and diagonally oriented FRP

2.5 FRP sheets covering the whole wall surface 17
sheets to strengthen against in-plane shear type failures (such as diagonal cracking
that developed as a result of the increased flexural strength). In general, the sys-
tem was effective. The structural steel and reinforcing steel connections yielded
and the in-plane rocking behaviour of the wall was improved, in terms of both
strength and ductility. They concluded that, although the system was effective,
further work was required on the design and detailing of the ductile connections.
FRP sheets covering the whole wall surface
The following researchers have strengthened masonry walls by externally bon-
ding FRP sheets to the entire surface of the wall: Marshall and Sweeney (2002); Al-
Chaar and Hasan (2002); Stratford et al. (2004); Hamid et al. (2005); and ElGawady
et al. (2006, 2007). The most common fabric material used by these researchers
has been GFRP. CFRP sheets have also been used by Marshall and Sweeney (2002)
and aramid FRP (AFRP) sheets have been used by ElGawady et al. (2006).
Stratford et al. (2004) increased the sliding resistance of masonry walls using
a bidirectional GFRP sheet bonded to the surface of the wall. In the strengthened
walls, Stratford et al. (2004) found that as cracks developed in the masonry, the FRP
sheet debonded from the surface of the masonry wall. The cracking through the
masonry developed primarily along the mortar joints in a diagonal stepping pat-
tern. The debonding progressed until the sheet was fully debonded and the FRP
load was then transferred to the masonry via the end anchorages. The strengthe-
ned wall then transferred the in-plane shear load via a truss mechanism: diagonal
tensile action through the GFRP reacted by vertical compression in the masonry
(Figure 2.11). Stratford noted that the vertical load carried through the masonry is
increased by truss action in the GFRP sheet. This increased vertical load increases
the friction and hence sliding resistance along the mortar joints. The GFRP streng-
thening increased the shear strength of the walls by approximately 65% (compared
to the URM walls). Both the unstrengthened and strengthened walls displayed the
same amount of ductility.
ElGawady et al. (2006) recommended full surface cover over X-type configura-
tions for retrofitting pre-damaged walls. They found that the existing cracks in the
pre-damaged walls influenced the results of the walls retrofitted with sheets in an
X-type pattern. The existing cracks did not, however, affect the results of the wall
retrofitted with FRP covering the full surface of the wall. In subsequent testing
programmes ElGawady et al. (2007) therefore only used FRP sheets bonded to the
entire surface of the wall.
ElGawady et al. (2006, 2007) retrofitted pre-damaged walls that originally fai-
led in either a rocking or shear (diagonal cracking) failure mode. ElGawady et al.
found that FRPs externally bonded to the whole surface of a wall improved the
specimens’ in-plane lateral resistance by a factor of 1.4 - 5.9 compared to URM. In
most cases the retrofitted specimens failed by a rocking mode, with rupture/tearing
of the FRP at the heel and crushing of the masonry at the toe. Sliding along the
flexural cracks that developed at the base of the wall usually accompanied rocking.
The energy dissipation of the retrofitted specimens was higher than the unrein-

18 2. Literature Review
Figure 2.11: Truss mechanism of debonded FRP sheet Stratford et al. (2004)
forced specimens. Most of the energy dissipation was due to rocking and sliding
friction at the base of the wall after the FRP ruptured. They found that the most
important function of the FRP retrofit was in holding the wall together, even at
high drifts. It would seem that the same favourable behaviour would have occur-
red if the FRP was not anchored into the foundations.
In the majority of tests the FRP strengthening was applied to one side of the
wall only (Marshall and Sweeney, 2002; Al-Chaar and Hasan, 2002; Stratford et al.,
2004; ElGawady et al., 2006, 2007). No out-of-plane effects were observed, ho-
wever, demonstrating the efficiency of a single side strengthening scheme for in-
plane lateral loads.
2.5.2 Structurally repointed reinforcement
Several researchers have structurally repointed (SR) the horizontal mortar joints
with FRP bars to prevent diagonal cracking in masonry shear walls. The results of
these tests are provided in: Tinazzi and Nanni (2000); Tumialan et al. (2001); Li
et al. (2005); and Turco et al. (2006). Turco et al. (2006) has also structurally re-
pointed the vertical mortar joints in a stack-bonded wall. In the tests reported,
GFRP bars with a diameter of 6.4 mm were used. The FRP bars were either inser-
ted into every bed joint or in every second bed joint, on one side or both sides of
the wall.
Tinazzi and Nanni (2000) strengthened clay brick masonry walls, whereas the
other researchers strengthened CMU walls. The wall specimens measured 0.6 m
by 0.6 m (Tinazzi and Nanni, 2000), and approximately 1.6 m by 1.6 m (Tumialan
et al., 2001; Li et al., 2005; Turco et al., 2006), respectively. Tinazzi and Nanni (2000)
tested their walls using the Diagonal Tension/Shear Test (ASTM E519-93) ASTM
Standards (1993). The other researchers used a similar test setup, except that the
wall specimens were tested in an upright position with the diagonal load applied

2.5 Structurally repointed reinforcement 19
using a hydraulic jack in a closed loop system.
The results from the tests have shown that SR GFRP bars are effective at re-
straining the opening of diagonal cracks in the walls. Failure of these walls was
commonly caused by debonding of the SR GFRP bars from the masonry, with de-
bonding occurring at the masonry-paste interface. Significant increases in shear
strength and ductility have been reported when the GFRP bars were inserted into
every bed joint. The following increases in shear strength were reported (compa-
red to URM): 45% (Tinazzi and Nanni, 2000); 100% (Tumialan et al., 2001); 80% (Li
et al., 2005); and 150% (Turco et al., 2006).
When SR GFRP bars were not inserted into every mortar joint, sliding failure
usually occurred along an unstrengthened joint. The researchers have therefore
recommended that the reinforcement be used in every bed joint. Even though the
SR GFRP reinforcement does not cross the mortar joint vertically, it does increase
the resistance to sliding along a single bed joint. This is because the bond between
the embedding paste (usually epoxy) and the masonry unit is stronger than the
bond between the mortar and the masonry unit. Sliding along a strengthened bed
joint may still occur, but at a higher load (Tinazzi and Nanni, 2000).
When the SR FRP reinforcement was not equally distributed on both sides of
the wall, out-of-plane deformation was observed. This out-of-plane deformation
was characterised by crack opening on the unreinforced side of the wall, and ben-
ding towards the reinforced side of the wall. Turco et al. (2006) observed significant
out-of-plane displacement when the GFRP bars were embedded in the epoxy; but
not when the bars were embedded in the modified cement paste. They suggested
that the lower bond strength and stiffness of the modified cement joint reduced
the out-of-plane effects. Li et al. (2005) reported that out-of-plane deformation
did not affect the maximum load-carrying capacity of walls strengthened with SR
GFRP in epoxy, but noted that the out-of-plane deformation affected the stability
of the walls.
Corte et al. (2008) used structurally repointed (SR) CFRP strips to strengthen
masonry in-fill panels in a real two storey reinforced concrete building. Corte et al.
performed two lateral-loading inelastic tests on this building. The lateral load was
distributed between the first and second floors and was applied in pushing and
pulling cycles. The first test was performed on the original building (unstrengthe-
ned) and resulted in extensive damage to the in-plane masonry in-fill panels and
reinforced concrete columns and staircase. The main failure mode observed in the
in-plane masonry panels was diagonal tension cracking. At the end of the test the
damage at the first storey was extensive, with out-of-plane collapse of almost all
of the in-plane masonry panels. Corte at al. then partially repaired the damaged
building. The perimeter columns were repaired and the external in-plane masonry
walls were rebuilt and strengthened with structurally repointed CFRP strips. The
CFRP strips were 1.5 mm thick and 5 mm wide and were structurally repointed
into every bed joint. The FRP strengthening changed the failure mode of the ma-
sonry infill panels from diagonal cracking to shear sliding. As the building was
only partially repaired the strengthening effect (in terms of an increase in load or

20 2. Literature Review
displacement) can not be isolated. The maximum lateral strength of the partially
repaired building (second test) was 60%/50% (pushing cycle/pulling cycle) lower
than the strength of the original building.
Tests on strengthening of masonry panels with structurally repointed FRP strips
have also been reported by De Lorenzis et al. (2004). They strengthened calca-
reous stone masonry panels with SR CFRP strips in every second bed joint (ap-
plied to one or both sides of the wall), and tested the panels in diagonal tension.
They found that the strengthening technique could be effectively used for the in-
plane strengthening of walls when sliding of the mortar bed joints (across several
courses) is the controlling mechanism of the URM wall. The strengthening tech-
nique provided an increase in strength, but did not provide an increase in the stiff-
ness nor ductility.
2.5.3 Near-surface mounted reinforcement
To the author’s knowledge, Marshall and Sweeney (2002) are the only resear-
chers that have used NSM FRP strips to improve the in-plane behaviour of a ma-
sonry wall. Note, however, that the tests on the walls strengthened with NSM FRP
strips were not the only focus of their investigation. They were only part of a much
larger investigation.
Marshall and Sweeney (2002) conducted 53 in-plane, cyclic shear tests on un-
reinforced double leaf masonry walls and lightly reinforced single leaf concrete
masonry unit (CMU) walls. Of the 53 walls tested, only four walls were strengthe-
ned with NSM reinforcement. Of these four walls, two (1 clay brick and 1 CMU)
were strengthened with NSM carbon strips, that were 2.3 mm thick and 15.2 mm
wide. The other two walls (clay brick and CMU) were strengthened with NSM glass
bars with a diameter of 6.4 mm. The majority of the walls (38 in total, leaving 11
URM walls) were strengthened with either discrete EB strips (arranged in different
patterns) or EB sheets covering the entire surface of the wall.
Marshall and Sweeney expected that the vertically aligned NSM reinforcement
(strips and bars) would not be effective at preventing diagonal cracking. They also
expected the improvement to bed joint sliding would be insignificant. They did,
however, expect that the vertically aligned NSM reinforcement would be effective
against rocking. They therefore arranged the NSM FRP reinforcement along the
vertical borders of the walls to prevent rocking.
The authors reported strength increases of approximately 20 kN (clay brick)
and 40 kN (CMU) when the CFRP strips were used. The authors reported a strength
increase of approximately 20 kN (clay brick) and a strength decrease of 10 kN
(CMU) when glass bars were used. Note that the authors did not report the strength
of the unreinforced specimens, nor did they report a percentage increase in load
compared to the unreinforced specimens. As these tests were part of a larger tes-
ting program, the individual failure modes of these walls were not reported. Given
that the failure mode of the URM specimens was either rocking or diagonal cra-
cking, it is likely that the NSM FRP strengthened walls failed by diagonal cracking.
As well as strengthening walls with SR bars (Section 2.5.2), Tinazzi and Nanni

2.6 FRP-to-masonry bond characterisation tests 21
(2000) also strengthened walls with vertical NSM GFRP bars. They found that this
strengthening method prevented bed joint sliding and diagonal cracking, and in-
creased the wall load capacity and ductility (by a similar amount as the horizontal
reinforcement). Unlike the horizontally reinforced wall, where damage was spread
throughout the wall, damage was localised with the development of one large dia-
gonal crack. Failure of this wall occurred by debonding of the FRP from the ma-
sonry at the epoxy-masonry interface (similar to horizontally reinforced walls),
which allowed the diagonal crack to open.
2.6 FRP-to-masonry bond characterisation tests2.6.1 Pull tests
The tensile behaviour of FRP reinforcement (be it EB laminates, NSM bars or
strips, or structurally repointed (SR) bars) is usually governed by the debonding
behaviour of the joint. To accurately predict the behaviour of an FRP strengthe-
ned/retrofitted URM wall subjected to in-plane (or out-of-plane) loads the beha-
viour of the FRP-to-masonry bond in shear needs to be determined. This is parti-
cularly the case where the FRP reinforcement is not mechanically anchored to the
wall or supporting structures.
The bond behaviour is generally characterised experimentally using the pull
test. The test involves subjecting the FRP reinforcement, which is bonded to a
masonry prism, to a direct tensile force (Figure 2.12). This results in the FRP-to-
masonry interface being loaded in shear. In Figure 2.12b lateral restraint provided
at the top and bottom. The restraint at the top is provided by friction from a plate
applying the compressive force. Some other alternatives to the pull test have also
been used by researchers to determine bond behaviour. These include double-lap
shear tests and modified beam tests (Chen and Teng, 2001; Yao et al., 2005).
(a) Front view (b) Side view
Figure 2.12: Typical pull test (NSM strip application shown)
The information that can be gathered from the pull test includes the bond
strength, the critical bond length and the local bond-slip relationship of the de-
bonding interface. Properties such as the bond strength and critical bond length

22 2. Literature Review
may be used directly in simple analytical models to predict the strength of struc-
tures that are reinforced with FRPs. The local bond-slip behaviour represents the
fundamental behaviour of the FRP-to-masonry interface. This relationship may be
used in finite element models to predict the behaviour of an FRP reinforced struc-
ture.
Examples of pull test investigations on EB FRP-to-masonry connections are
provided in: Aiello and Sciolti (2006, 2008); Camli and Binici (2007); Willis et al.
(2008). Willis et al. also studied the bond behaviour of NSM FRP-to-masonry
connections. In these investigations the FRP has been bonded to different ma-
sonry substrates, including: hollow clay bricks (from Australia and from Turkey);
and natural stones (Naples Tuff and Leccese Stone) used to construct masonry in
Italy. The variables investigated in these studies include: surface preparation; FRP
material and geometry; and location of FRP in relation to perpend joints and brick
cores.
In general, the majority of pull tests have been performed on FRP-to-concrete
joints. Research on the bond behaviour between the FRP and concrete is now at a
stage where analytical models have been developed to predict the important bond
properties such as bond strength, critical bond length and the local bond-slip rela-
tionship (Seracino et al., 2007b). Due to material similarities between concrete and
masonry (particularly comparable tensile strength and brittleness), results of pull
tests on FRP bonded to concrete are generally transferable to FRP bonded to ma-
sonry. In terms of a NSM FRP bond, the variables that affect the bond behaviour
include the: concrete strength; bond length; FRP reinforcement cross-section di-
mensions; material properties of the FRP reinforcement; strength of the adhesive;
distance between the FRP reinforcement and concrete edge; and distance between
multiple, parallel FRP reinforcement (Seracino et al., 2007a,b; Oehlers et al., 2008;
Rashid et al., 2008).
2.6.2 FRP strengthened masonry triplets and assemblages
Apart from the pull test, other tests on FRP strengthened masonry assemblages
have been used to characterise the composite behaviour between FRP and ma-
sonry. Ehsani et al. (1997) investigated the contribution of externally bonded FRP
sheets to the shear strength across a sliding joint. They conducted thirty-seven di-
rect shear tests on triplet specimens strengthened with bidirectional GFRP sheets
(Figure 2.13). They varied the strength, bonded length and fibre orientation. The
strength of the FRP sheet was varied by using different FRP materials with different
glass fibre densities. The fibres were orientated at either 0/90 degrees or 45/135
degrees, with respect to the loading direction. A lubricated piece of plywood was
placed between the bricks (instead of bonding the bricks together with mortar)
to simulate a frictionless joint. Also, no precompression was applied to the triplet
specimens, and therefore the shear resistance of the joint was only provided by the
GFRP laminate.
Ehsani et al. (1997) observed two failure modes: shear failure (of the GFRP)
along the bed joint; and/or debonding of the GFRP laminate in the middle brick

2.6 FRP strengthened masonry triplets and assemblages 23
Figure 2.13: Ehsani et al (1997) FRP strengthened triplet test specimen
region of the fabric edges. These failure modes were influenced by the strength
and bonded length of the GFRP sheets. For strong GFRP sheets debonding typi-
cally occurred, whereas for weak GFRP sheets, shear failure occurred. Weak GFRP
sheets with a short bonded length failed in a combination of shear and debonding.
The fibre orientation was shown to have an effect on the strength and stiffness
of the specimens. When the fibres were aligned at 45 degrees and 135 degrees a
stiffer response was observed with a higher load. When the fibres were aligned at
0 degrees and 90 degrees a more ductile response was observed. The shear capa-
city of the specimens was approximately 18 kN. This equated to an average shear
strength of 0.57 MPa for solid bricks with a contact area of 102 mm x 152 mm, used
in the tests (Ehsani and Saadatmanesh, 1996).
Hamid et al. (2005) conducted a variety of tests to study the in-plane behaviour
of URM wall assemblages strengthened with FRP laminates. The assemblages were
tested under different stress conditions present in masonry shear and infill walls.
The tests included prisms loaded in compression, with different bed joint orienta-
tions (on/off axis compression), diagonal tension specimens, and specimens loa-
ded under joint shear (Figure 2.14). The masonry wall assemblages were construc-
ted using face shell bedded hollow concrete blocks. The assemblages were streng-
thened on both sides with externally bonded GFRP sheets, covering the whole sur-
face.
Hamid et al. (2005) found that the behaviour of the masonry assemblages that
failed by shear sliding (specimens tested in direct shear, diagonal tension and 30
degrees/ 45 degrees off-axis compression) was significantly improved with FRP
strengthening. Instead of brittle shear sliding, the strengthened specimens failed
by crushing or web splitting of the masonry units (which was a more ductile failure
mode). The greatest increase in strength was that for the direct joint shear assem-
blages. The average joint shear strength of these strengthened specimens was eight
times greater than that of the unreinforced specimens. For the specimens tested
in diagonal tension an increase in strength of 4.6 times the unreinforced case was
reported. The assemblages that failed in compression (by web splitting) were least
improved using the FRP laminates in terms of strength. The FRP laminates did,

24 2. Literature Review
Figure 2.14: Assemblages tested by Hamid et al. (2005) as parts of a wall
however, provide stability to the shells of the masonry units after the webs had
split.
Similar investigations have been performed by El-Dakhakhni et al. (2004) (joint
shear and compression specimens) and Campanaro et al. (2005) (joint shear spe-
cimens).
2.7 Finite element models for FRP reinforced masonryAdvanced structural modelling (using numerical techniques) is necessary for
understanding the behaviour and damage of complex masonry constructions, un-
derstanding experimental testing programs and to assist in the development of
design rules (Lourenço, 2008). This is also the case for masonry structures that
are reinforced with FRPs. The displacement finite element method is the most
common numerical technique used to model the behaviour of masonry structures
(with and without FRP reinforcement). Other numerical approaches such as li-
mit analysis (Grande et al., 2008) and the discrete element method (Zhuge, 2008b)
have also been used.
To accurately model the behaviour of an FRP strengthened masonry wall, the
structural response and failure modes of the masonry, FRP reinforcement and the
interface between them (bond) need to be considered.
2.7.1 Modelling masonry
Masonry is a composite material that is composed of brick units and mortar
joints. Masonry displays distinct directional properties due to the presence of mor-
tar joints, which act as planes of weakness. The overall behaviour of masonry
is determined by the properties of the masonry components (unit, mortar and
unit/mortar interface) and the orientation of the unit/mortar interfaces (Sutcliffe
et al., 2001). The behaviour of masonry is therefore complex. Two different ap-
proaches are used to model masonry, depending on the level of simplicity and ac-
curacy desired. They are the micro-modelling approach and the macro-modelling

2.7 Micro-modelling 25
approach (Figure 2.15, Lourenço (2008)).
Figure 2.15: Modelling strategies for masonry structures (Lourenço 2008): a) de-
tailed micro-modelling; (b) simplified micro-modelling; (c) macro-
modelling
Micro-modelling
In the micro-modelling approach the individual components of the masonry
assemblage are modelled separately. Depending on the level of accuracy and sim-
plicity desired the following micro-modelling strategies may be used (Lourenço,
2008):
Detailed micro-modelling: in which the units and the mortar in the joints are re-
presented by continuum elements and the unit/mortar interface are repre-
sented by discontinuum elements;
Simplified micro-modelling: in which expanded units are represented by conti-
nuum elements and the behaviour of the mortar joints and the unit/mortar
interface is lumped into discontinuum elements. In this approach the units
are expanded to retain the initial geometry of the masonry assemblage.
Zero-thickness interface elements (a type of discontinuum element) are nor-
mally used for the interfaces. Interface elements relate the interface stresses (nor-
mal stress and shear stress) to the relative displacements across the interface (nor-
mal displacement and shear displacement). Contact elements, which are a special
kind of interface element, have also been used to model the interfaces (Han, 2008).
A complete micro-model needs to include all of the failure mechanisms of ma-
sonry including: joint cracking in tension; joint sliding; cracking of the units; and
crushing of the masonry. Micro-models that incorporate these failure mechanisms
(with post peak softening included) are able to reproduce crack patterns and the
complete load-displacement path of a masonry structure up to and beyond the
peak load (Lourenço, 2008).
The material properties required for the micro-model are determined from ex-
perimental tests on masonry joints and assemblages. A detailed description on the
types of tests used to determine the material properties is provided in Rots (1997).
Some recommendations on the typical material properties to use in a masonry
micro model are given in Lourenço (1996a, 2008).

26 2. Literature Review
Macro-modelling
In the macro-modelling approach all of the components of the masonry as-
semblage (the brick units, mortar joints, unit/mortar interface) are smeared into a
homogeneous continuum. The continuum is commonly modelled with orthotro-
pic material behaviour to account for the directional properties of masonry. The
material stress-strain behaviours are determined from experimental tests on ma-
sonry assemblages (for example the biaxial tests of Page (1983)), or using a pro-
cess known as homogenisation. Homogenisation involves using analytical micro-
models of small masonry assemblages to determine the combined response. A
review of homogenisation techniques is provided in Lourenço (2008).
The macro-modelling technique is unable to model local failure modes (un-
like the micro-modelling technique). The macro-modelling technique is, however,
suitable for modelling large sections of masonry, where only a simplified repre-
sentation of composite behaviour is required, and local failure modes are not so
important.
For FRP strengthened structures, local failure modes of the masonry (particu-
larly cracking) are important because debonding starts at the opening of cracks.
As such, a macro-model (which can not reproduce detailed local crack patterns)
may not be able to simulate local debonding behaviour (Grande et al., 2008). On
the other hand, a micro-model (which can capture detailed local crack patterns)
would be able to simulate local debonding behaviour.
2.7.2 Modelling FRP and attachment to masonry
FRP reinforcement can be modelled with tension only elements (such as truss
elements for thin reinforcements), or other continuum elements (such as typical
quadrilateral elements) for fabric sheets. To model debonding of the FRP from
the masonry a discontinous element (such as an interface element) is modelled
between them. The debonding behaviour of the interface element is characterised
by a local bond-slip relationship determined from pull tests (Section 2.6.1).
2.7.3 Examples of FRP strengthened masonry models from the li-
terature
Several authors have used finite element models (or related approaches - li-
mit analysis and the discrete element method) to predict the in-plane behaviour
of FRP strengthened masonry walls: Ascione et al. (2005); Van Zijl and de Vries
(2005); Verhoef and van Zijl (2002); Zhuge (2008b); Grande et al. (2008); Haroun
and Ghoneam (1996, 1997); Gabor et al. (2005, 2006); Farshchi and Marefat (2008);
Engebretson et al. (1996); Prakash and Alagusundaramoorthy (2006).
Debonding of the FRP from the masonry was considered in only a few of these
models (Ascione et al., 2005; Van Zijl and de Vries, 2005; Zhuge, 2008b; Grande
et al., 2008). Both Zhuge (2008b) and Grande et al. (2008) verified their models
with experiments where debonding was a failure mode (these investigations are
discussed in more detail below). Conversely, Ascione et al. (2005) and Van Zijl and
de Vries (2005) did not. Ascione et al. (2005) used their model to perform simula-

2.7 Examples of FRP strengthened masonry models from the literature 27
tions on hypothetical structures, including a 3-storey FRP strengthened masonry
wall with openings. As the model was not verified against experimental data, the
results of the analysis were qualitative in nature. The model results did, however,
highlight the importance of the bond strength between the FRP and the masonry.
On the other hand, Van Zijl and de Vries (2005) did verify their model with expe-
rimental results, but in both the experiment and the model debonding was not
observed.
Zhuge (2008b) used a micro-modelling approach, based on the distinct ele-
ment method (DEM) (a special version of the discrete element method), to simu-
late the behaviour of a masonry shear wall strengthened with EB CFRP strips (Fi-
gure 2.16a). To model the debonding interface between the masonry and the FRP,
Zhuge used an interface type element, with an elastic-perfectly plastic bond-slip
relationship. The bond-slip relationship used in the interface elements was ta-
ken from pull tests on CFRP-to-concrete joints conducted by Ueda and Dai (2004).
Zhuge used this data as there was not enough pullout test data available for ma-
sonry at the time the work was conducted. In general, Zhuge’s model was ca-
pable of simulating the behaviour of the experimental walls, well into the non-
linear range of the test (Figure 2.16b). Zhuge noted, however, that as the bond
strength was assumed to behave as an elastic-perfectly plastic material, the des-
cending branch of the load-displacement curve could not be simulated by the mo-
del. (It seems that Zhuge omitted the descending data from the experimental plot
in Figure 2.16b.)
(a) (b)
Figure 2.16: Zhuge (2008b): (a)FRP reinforced wall; (b)Lateral load-deflection dia-
gram comparison
Grande et al. (2008) used both a macro-modelling approach and a homogeni-
sed limit analysis to simulate the behaviour of un-strengthened and FRP streng-
thened masonry panels, supported on beams (Figure 2.17). They noted that the
limit analysis approach is based on the use of a perfectly plastic material response
of the masonry and the FRP-to-masonry interface. It therefore cannot model sof-
tening behaviour and may not be as suitable for the analysis of FRP strengthened
masonry structures as displacement FE methods. They did find, however, that the

28 2. Literature Review
loads and failure mechanisms, predicted by the limit analyses, were similar to the
experimental results in some cases (Figure 2.18).
Figure 2.17: Wall panels modelled by Grande et al. (2008)
In the finite element macro-model, Grande et al. (2008) attached the nodes of
the FRP elements (modelled using truss elements) perfectly to the corresponding
nodes of the masonry elements. To account for debonding of the FRP from the
masonry they treated the FRP truss elements as an elastic-brittle material. They
limited the tensile strength of the FRP truss elements, based on the maximum FRP
debonding strength given in CNR-DT200 (2006). The authors decided not to use
interface elements (with a local bond-slip relationship) because there was not en-
ough experimental data on the complex behaviour of the FRP-to-masonry inter-
face. In particular, there was not enough experimental data taking into account
the heterogeneity of the masonry. The authors agreed that a more representative
model would include the use of interface elements. They did, however, demons-
trate that their simplified approach was capable of reproducing the experimental
pre- and post-peak behaviour (including debonding) with a good level of accuracy
(Model MRB in Figure 2.18). They also performed simulations where debonding

2.7 Examples of FRP strengthened masonry models from the literature 29
was not accounted for. In these cases the model was found to over predict the
strength of the FRP strengthened walls (Model MRA in Figure 2.18).
Figure 2.18: Results of PAN-A1: MRA - no debonding; MRB - debonding. Grande
et al. (2008)
In the remaining modelling investigations (previously cited) debonding was
not accounted for in the model. However, in many cases it was not critical, be-
cause debonding was not a critical failure mode. Take for example the investi-
gation by Gabor et al. (2005, 2006). They did not include debonding of the FRP
in their models, but this did not affect their results. It did not affect their results
because debonding was not observed in the experimental tests that they used to
verify their models. In this case the authors fixed elastic FRP elements directly to
the elements of the underlying masonry walls (perfect bond).
Gabor et al. (2005, 2006) used their finite element model to simulate the beha-
viour of FRP strengthened walls that were tested in diagonal tension. To model the
masonry they used a micro-modelling approach. They modelled both the brick
units and the mortar joints separately, with continuum elements. They modelled
the bricks as fully elastic and used an elastic plastic model in the mortar joint to
represent the non-linear behaviour of the brick/mortar interface in shear. In gene-
ral, their model reproduced the key behaviours observed in the experimental tests,
including the strengthening effect of the EB FRP reinforcement schemes. In parti-
cular, the FRP restrained the opening of a single diagonal crack (unreinforced wall
failure mode), and changed the failure mode to crushing in the diagonal corners
of the wall. The load displacement response and the ultimate loads produced by
their model also compared well with the experiments. In one of the strengthened

30 2. Literature Review
wall tests, the wall failed once a crack formed outside of the reinforcement, in line
with the diagonal load. This failure mode was not reproduced by the model.
2.8 Analytical modelsSeveral design models have been proposed for the design of FRP strengthened
masonry shear walls. Models exist for walls strengthened with:
• Discrete EB sheets/strips: Triantafillou (1998); Triantafillou and Antonopou-
los (2000); Nanni et al. (2003); Zhao et al. (2003, 2004); CNR-DT200 (2006);
AC125 (2007)
• Bars: Li et al. (2005); Tinazzi and Nanni (2000); Tumialan et al. (2001), and
• Sheets covering the whole surface of a wall: Stratford et al. (2004).
The models are based on the truss analogy and assume the total in-plane shear
strength of an FRP strengthened wall is equal to the sum of the contributions of
the masonry wall (Vm) and the FRP reinforcement (V f ):
V =Vm +V f (2.1)
The contribution of the masonry wall (Vm) is assumed equal to the in-plane shear
strength of an unreinforced masonry wall. The contribution of FRP reinforcement
(V f ) is taken as the horizontal component of the FRP tensile force, which depends
on the failure mode (rupture or debonding) and the anchorage length. The contri-
bution of the vertical reinforcement is usually ignored (e.g. Triantafillou (1998)).
Stratford et al. (2004) does consider it, however (see Section 2.8.2).
The truss model is based on lower bound plasticity theory, and relies on stress
redistribution. If brittle reinforcement is used (such as FRP), with little or no stress
redistribution, the lower bound plasticity theory is no longer applicable (Strat-
ford and Burgoyne, 2003). Therefore the truss model may not be suitable for FRP
strengthened masonry structures.
A select number of models are discussed in more detail in the following sec-
tions. A review of some of the design models has also been given in Zhuge (2008a).
2.8.1 Externally bonded discrete strips/sheets
Triantafillou (1998); Triantafillou and Antonopoulos (2000) model
Triantafillou (1998) proposed a model to determine the in-plane shear resis-
tance of masonry walls strengthened with discrete strips arranged in an orthogo-
nal grid pattern (Figure 2.19).
In Triantafillou’s (1998) model the in-plane shear capacity of the FRP streng-
thened wall is limited by the shear/compressive strength of the masonry (as per
Eurocode 6 (1994)):
V =Vm +V f ≤0.3 fk td
γm(2.2)

2.8 Triantafillou (1998); Triantafillou and Antonopoulos (2000) model 31
Figure 2.19: FRP strengthened masonry wall subjected to in-plane shear with axial
force from Triantafillou (1998). Note VRD in figure is same as V in
Equation 2.1
.
where fk is the characteristic compressive strength of masonry, t is the thickness
of the wall, γm is a partial safety factor for masonry, and d is the effective depth of
the wall = 0.8 x the wall length (l ).
The contribution of masonry is determined using the URM shear strength equa-
tions given in Eurocode 6:
Vm =
fvk td
γm(2.3)
where fvk is the characteristic shear strength of the masonry, given by:
fvk = mi n[ fvk0+0.4NRd
l t,0.7 fvk,l i m ,0.7max(0.065 fb , fvk0)] (2.4)
where fvk0 is the characteristic shear strength of masonry under zero compressive
stress (between 0.1 and 0.3 MPa in the absence of experimental results), NRd is
the design vertical axial force acting on the wall, fvk,l i m is the limiting value of
fvk and depends on the type of masonry units and mortar strength, and fb is the
normalised compressive strength of the masonry units.
In Triantafillou’s (1998) model the contribution of vertical reinforcement to the
shear strength of the masonry wall is ignored. Triantafillou (1998) comments that
the vertical FRP reinforcement provides mainly a dowel action effect. The increase
in shear strength provided by the dowel action effect is negligable because of the
high flexibility of the FRP strips and local debonding in the vicinity of the shear
cracks. The shear resistance mechanism is therefore provided only by the horizon-
tal FRP strips.
The contribution of the horizontal FRP strips to the shear strength of the wall
is calculated using:
V f = ρhE f r p
(
ε f r p,e
γ f r p
)
t0.9d (2.5)

32 2. Literature Review
where ρh is the horizontal reinforcement ratio, defined as the total cross-sectional
area of horizontal FRP divided by the cross-sectional area of the wall in plan (t l ),
E f r p is the longitudinal elastic modulus of the FRP, γ f r p is a partial safety factor for
FRP in uni-axial tension (1.15, 1.2 and 1.25 for CFRP, AFRP and GFRP respectively),
and ε f r p,e is the effective FRP strain. The effective FRP strain ε f r p,e accounts for
the failure mode of the FRP (debonding or rupture) and depends on the FRP axial
rigidity (ρhE f r p). The effective FRP strain ε f r p,e is calculated using:
ε f r p,e = 0.0119−0.0205(ρhE f r p)+0.0104(ρhE f r p)2 (2.6)
Equation 2.6 was developed through regression analysis of experimental data for
concrete beams, and may not be suitable for masonry walls (Zhuge, 2008a). The
expression for the FRP effective strain was later improved by the same author in
Triantafillou and Antonopoulos (2000) to separate different failure modes (rupture
or debonding) and types of materials (CFRP or AFRP):
Fully wrapped CFRP (failure by rupture of FRP):
ε f r p,e = 0.17
(
f 2/3c
E f r pρh
)0.3
ε f r p,u (2.7)
Side or U-shaped CFRP jackets (failure by debonding, failure by rupture of FRP):
ε f r p,e = mi n
[
0.65
(
f 2/3c
E f r pρh
)0.56
×10−3, 0.17
(
f 2/3c
E f r pρh
)0.3
ε f r p,u
]
(2.8)
Fully wrapped AFRP (failure by rupture of FRP):
ε f r p,e = 0.048
(
f 2/3c
E f r pρh
)0.47
ε f r p,u (2.9)
where fc is the compressive strength of concrete and ε f r p,u is the ultimate FRP
strain in uni-axial tension (failure by rupture). Similar to Equation 2.6, these equa-
tions were determined for FRP strengthened concrete beams, and may not be sui-
table for FRP strengthened masonry walls.
Zhao et al. (2003, 2004) model
Zhao et al. (2003, 2004) proposed a model to determine the shear resistance of
masonry walls strengthened with externally bonded FRP sheets aligned in an X-
and Λ-type pattern (Figure 2.20).
The contribution of masonry to the shear strength of the wall is assumed equal
to the strength of a URM wall failing by diagonal cracking, which is calculated
using (Tomaževic, 1999):
Vm = 0.9f ′
tb
bAn
√
1+σn
f ′
tb
(2.10)
where f ′
tbis the tensile strength of masonry, b is a shear stress distribution factor
= 1.2, σn is the average compressive stress in the wall due to vertical load, and An
is the net cross sectional area of the masonry wall.

2.8 Zhao et al. (2003, 2004) model 33
(a) X-pattern strengthening (b) Analytical model
(c) Λ-pattern strengthening (d) Analytical model
Figure 2.20: Strengthening schemes and analytical models from Zhao et al. (2003,
2004)
The FRP sheets act as diagonal braces in a truss model. Only the sheets loa-
ded in tension are considered to contribute to the shear strength of the wall. The
tensile strength of biaxial FRP sheets in the transverse direction is also considered
(Figure 2.20). The FRP contribution to the shear strength (V f ) is calculated using:
• X-strengthening, Zhao et al. (2003):
V f x = nαc f sEt ′(ε1bLsi nθ+0.5ε2L′2)/h (2.11)
• Λ-strengthening, Zhao et al. (2004):
V f Λ = nEt ′(ε1bLsi nθ+0.375ε2L2o)/H (2.12)
where n is the number of FRP sheets, E is the elastic modulus of the FRP sheet, t ′
is the thickness of the FRP sheet, ε1 and ε2 are the strains in the longitudinal and
transverse directions of the FRP sheets, b is the width of the FRP sheet, L is the
length of the wall, L′(or Lo) is the length of the FRP sheet, and h(or H) is the height
of the wall. The term αc f s is a coefficient that takes into account the strength of
the brick, the quality of the bond between the FRP and the masonry and whether
anchors are used. No guidance on this coefficient is given, however. They assume
a value of 1.0. This term is only applied in Zhao et al. (2003).

34 2. Literature Review
These models were verified with experimental results by Zhao et al. (2003, 2004).
Reasonable agreement between the models and experiments were found when the
experimentally recorded strains in the FRP sheets were used in the model. Note
that these strains were not equal to the maximum tensile strains of the sheets. No
guidance was given in order to determine the strains in the FRP strips for design
purposes. These drawbacks strongly limit the models usefulness.
2.8.2 Externally bonded sheets covering the whole wall surfaceStratford et al. (2004) proposed a model for the design of masonry shear walls
strengthened with an FRP sheet that covers the whole surface of the wall and is
also mechanically anchored at the top and bottom. In Stratford et al. (2004)’s mo-
del it is assumed that the FRP is fully debonded from the wall and the forces in the
FRP are transferred to the masonry via the end anchorages. The debonded FRP
sheet acts in tension along a diagonal band (Figure 2.21).
Figure 2.21: Truss mechanism for carrying load through debonded strengthening
Stratford et al. (2004)
In Stratford et al. (2004)’s model the strengthened wall is designed to fail in
shear/compression (in the masonry) rather than by FRP rupture. This design stra-
tegy is used because shear/ compression failure in the masonry is a more ductile
failure mode than rupture of FRP. To ensure that FRP rupture does not occur be-
fore shear/compression failure in the masonry, the strain capacity in the FRP strip
must be greater than ε1:
ε1 =δ1
l cosθ(2.13)
where δ1 is the in-plane lateral displacement capacity of the unreinforced ma-
sonry, l is the unbonded length of the FRP (which is determined by the anchorage
arrangements), and θ is the angle of inclination of the FRP band acting in tension.
The anchorages must also be able to resist the load carried through the FRP at
failure of the masonry:VF
cosθ=
w t f E f θ
lδ1 (2.14)

2.8 Structurally repointed reinforcement 35
where w is the effective width of the FRP sheet active in carrying tension, t f is the
thickness of the FRP sheet, and E f θ is the elastic modulus of the sheet parallel to
the tensile diagonal.
The vertical component of the diagonal tensile force, through the FRP sheet,
increases the vertical compression through the masonry wall. This additional ver-
tical compression is:
NF =VF t anθ (2.15)
The additional compression acts to confine the masonry and increase the unrein-
forced masonry strength that contributes to the overall shear strength of the wall
(V ′
M ). The total shear strength of the wall is then:
V =V ′
M +VF (2.16)
2.8.3 Structurally repointed reinforcement
Li et al. (2005) proposed a model to determine the shear resistance of masonry
walls strengthened with horizontal structurally repointed (SR) FRP bars.
The contribution of masonry to the shear strength of the wall is based on the
URM failure envelope developed by Mann andMüller (1982), with revisions by Cri-
safulli et al. (1995) (Figure 2.22a). The failure envelope incorporates the possible
failure modes of URM walls subjected to a combination of shear and compression
stresses. These include sliding along a single bed joint, stepped shear sliding fai-
lure, diagonal tensile cracking through the brick units and compression failure of
the brick units.
The shear capacity due to sliding along a single bed joint (Vm,1) is determined
by Equation 2.17:
Vm,1 = (τ0+µσn)An (2.17)
where τ0 is the cohesive strength of the mortar joints, µ is the coefficient of inter-
nal friction, σn is the normal compressive stress on the wall, and An is the cross-
sectional net area of the masonry wall.
The shear capacity due to stepped shear sliding failure (Vm,2) is determined by
Equation 2.18:
Vm,2 = (τ∗0 +µ∗σn)An (2.18)
where the cohesion and coefficient of internal friction are modified to account for
the distribution of normal and shear stresses acting on a brick unit:
τ∗0 =τ0
1+1.5µb/d(2.19)
µ∗=
µ
1+1.5µb/d(2.20)
In these equations b and d are the length and height of the masonry unit, respec-
tively.

36 2. Literature Review
The shear capacity due to diagonal tension cracking through the brick units
(Vm,3) is determined by Equation 2.21:
Vm,3 =f ′
tb
2.3
√
1+σn
f ′
tb
An (2.21)
where f ′
tbis equal to the tensile strength of the masonry.
The shear capacity due to compression failure of the brick units (Vm,4) is deter-
mined using Equation 2.22:
Vm,4 = ( f ′
m −σn)2d
3bAn (2.22)
where f ′
m is equal to the compressive strength of the masonry. Note that this repre-
sents a limit on the shear strength of the masonry wall as the SR FRP bars cannot
prevent this type of failure.
(a) (b)
Figure 2.22: (a)Failure envelope of URM wall Li et al. (2005); (b)Effective bond
length of horizontal SR FRP bars Li et al. (2005)
The horizontal FRP reinforcement crossing a diagonal shear crack contributes
to the shear resistance of the wall. In Li et al. (2005)’s model the reinforcement
contribution of a horizontal bar depends on the bond strength between the paste
(used to embed the bar into the bed joint) and the brick unit. This is because
in experimental tests failure usually occurs by debonding along this interface (see
Section 2.5.2). It is assumed that the bond stress between the paste and the brick
unit is uniform along the length of the bar at ultimate bar stress. The force in
the FRP bar resisting diagonal crack opening is then the average bond strength
multiplied by the surface area between the paste and the masonry:
V f ,1bar = τb(2D + tm)L (2.23)
where τb is the bond strength between the paste and the masonry, D is the depth
of the groove, tm is the thickness of the mortar joint and L is the shortest bonded

2.9 Research gaps and Proposed Work 37
length of the bar intersected by the crack (Figure 2.4). In the model a 45◦ degree
diagonal shear crack is assumed in order to determine L (Figure 2.22b).
The tensile force in the bar is limited by using the principle of an effective
length Le , where L ≤ Le . The effective length is calculated using Equation 2.24:
Le =fu A f
(2D + tm)τb
(2.24)
where fu is equal to the maximum tensile stress in the FRP bar and A f is the cross-
sectional area of the FRP bars. In Li et al. (2005)’s model the maximum tensile
stress in the FRP bar is based on the results of pull tests. In the pull tests the ulti-
mate tensile stress in the FRP was related to cracking in the masonry unit (debon-
ding through the brick). The ultimate tensile stress in the FRP may also be due to
rupture.
It is assumed that the ultimate bond stress is reached in all of the bars at the
ultimate load. The total contribution of the horizontal reinforcement is then equal
to the sum of all the forces calculated in the bars crossing the shear crack:
V f = τb(2D + tm)n∑
i=1
Li , Li ≤ Le (2.25)
where n is the total number of bars intersected by the diagonal crack, and
Li is the effective bond length of the i-th bar intersecting the diagonal crack (Fi-
gure 2.22b).
Li et al. (2005) verified this model with the test results of walls tested in diago-
nal tension (see Section 2.5.2). In these tests the reinforcement was inserted into
every bed joint (on one side of the wall, or alternately on both sides of the wall) or
in every second bed joint (on one side of the wall). Li et al. (2005) found that the
model provided a reasonable fit to the experimental results, except that the model
tended to overpredict the experimental ultimate load when the reinforcement was
applied to one side only. For the walls strengthened with reinforcement in only
every second joint, where failure occurred by sliding along an unstrengthened bed
joint, the capacity of the wall was approximately equal to Vm,1 (Equation 2.17).
The model in Li et al. (2005) was also proposed in previous reports by some of
the common authors in Tinazzi and Nanni (2000) and Tumialan et al. (2001), with
some differences. In Tinazzi and Nanni (2000) rod pull-through failure was also
considered as a potential failure mode (in addition to bond failure between the
paste and epoxy). In Tumialan et al. (2001) rod pull-through failure was the only
bar debonding failure mode considered. Tinazzi and Nanni (2000) also considered
the effect of compressive stresses on the bond strength of the paste/unit sliding
interface.
2.9 Research gaps and Proposed Work2.9.1 Research gaps
The need to develop efficient techniques to retrofit (or strengthen) in-plane
masonry shear walls was identified. In particular, retrofit techniques are required

38 2. Literature Review
to increase the ductility and strength of walls failing by diagonal cracking (most
critical) and mortar joint sliding within the wall. Also, retrofit techniques should
have a low impact on function and appearance. Of the FRP application techniques
reviewed the NSM technique is the most suitable.
As the NSM technique is a relatively new retrofitting technique, very few in-
vestigations on masonry strengthened using the technique have been conducted.
Therefore, there is a need to do substantial experimental and numerical work to in-
vestigate the effectiveness of this new technique and to investigate the behaviour
of walls strengthened using this technique.
The specific research gaps are identified as follows:
Characterisation tests
Information on NSM FRP-to-concrete interfaces is well developed, with many
experimental pull test results and also design models. Such information and pull
test results are not available for NSM FRP bonded to masonry. Tests need to be
conducted to determine the effect of variables specific to masonry, such as the
orientation of the FRP strip, and the effect of mortar joints. Also, when NSM FRP
strips are used to horizontally reinforce walls the debonding properties may change
depending on the amount of compression acting vertically through the wall (see
Chapter 3). One set of pull tests have been conducted on NSM FRP bonded to
masonry Willis et al. (2008) but more tests are required to expand the database.
Experimental tests on strengthened wall panels
Only a very few studies have been conducted into the behaviour of masonry
shear walls retrofitted with NSM FRP reinforcement, and in particular where the
NSM FRP reinforcement is aligned vertically. Marshall and Sweeney (2002) have
used CFRP NSM strips to prevent heel uplift, occurring during rocking of masonry
shear walls, but they did not, however, use the strengthening technique to prevent
sliding or diagonal cracking failure. Tinazzi and Nanni (2000) strengthened URM
shear panels using NSM circular glass FRP bars, but still, only the results of a
few tests were reported and not enough information on the reinforcement me-
chanisms of the technique could be gained from such a limited amount of tests.
Experimental tests are required to determine: the effectiveness of the reinfor-
cement scheme (in terms of strength and ductility increase); the failure modes; the
reinforcement mechanisms; and the behaviour of the bond between the masonry
and the FRP within the strengthened panel/wall. In particular not much is known
about the effectiveness and the reinforcement mechanisms of vertical reinforce-
ment used to prevent sliding.
Finite element models
No numerical models have been developed to study the behaviour of NSM
strengthened masonry. The modelling strategies presented in Section 2.7 can po-
tentially be used to model the behaviour of NSM FRP strengthened masonry walls
subjected to in-plane loading.

2.9 Analytical design models 39
Analytical design models
The current design models presented in Section 2.8 are specific to particular
strengthening schemes and therefore cannot be applied generally to other streng-
thening schemes (such as NSM). Also, the models have been verified with only a
limited number of experimental results, strongly limiting their usefulness. None of
the current models can be used to design vertical FRP reinforcement.
2.9.2 Proposed WorkIn this project the in-plane shear behaviour of URM panels strengthened with
near-surface mounted CFRP strips was investigated. In this investigation thin rec-
tangular FRP strips were used. Using a thin rectangular strip maximises the confi-
nement around the strip, and increases the resistance to debonding. The FRP
strips were designed to prevent sliding along mortar bed joints (within the wall pa-
nel) and diagonal cracking (through mortar joints and brick units). Different rein-
forcement orientations were studied, including: vertical; horizontal; and a combi-
nation of both.
The project was divided into three stages (which form the basis of the following
three chapters). The first stage of the project involved characterising the bond bet-
ween the NSM CFRP and the masonry using experimental pull tests (18 in total).
From these tests the bond strength, the critical bond length and the local bond-
slip relationship of the debonding interface was characterised. The second stage
of the project involved conducting diagonal tension/shear tests on masonry pa-
nels. A total of four URM wall panels and seven strengthened wall panels were
tested. The third stage of the project involved developing a finite element model
to help understand the experimental results. The masonry was modelled using
the micro-modelling approach, and the FRP was attached to the masonry model
using the bond-slip relationships determined from the pull tests. The FE model
was not fitted to the results of the panel tests. Rather it was based on the pull tests
and other material characterisation tests (for the masonry) then used to predict
the panel behaviour.
It was considered outside the scope of this thesis to attempt to develop an ana-
lytical design model for the NSM strengthening scheme. However, the proposed
work aims to provide the understanding of the strengthening scheme required to
develop such a model.


3
Pull tests
3.1 IntroductionAs mentioned previously in the literature review (Chapter 2, Section 2.6.1) a
large database of pull test results exists for FRP-to-concrete joints. Variables that
affect the bond behaviour of an FRP-to-concrete joint include: concrete strength;
bond length; FRP reinforcement cross-section dimensions; material properties of
the FRP reinforcement; strength of the adhesive; distance between the FRP rein-
forcement and concrete edge; and distance between multiple, parallel FRP reinfor-
cement (Seracino et al. (2007a,b); Oehlers et al. (2008); Rashid et al. (2008)).
Including those previously mentioned, other variables need to be considered
when investigating the bond behaviour between FRP and masonry. Additional va-
riables that affect the behaviour include the alignment of FRP (vertical, horizontal,
+/- 45 degrees etc.), the distance between FRP reinforcement and parallel mor-
tar joints, and the presence of cores in some types of bricks. Also, when NSM
FRP strips are used to horizontally reinforce walls the debonding properties may
change depending on the amount of compression acting vertically through the
wall. Compression forces may arise (after the installation of NSM reinforcement)
due to: live loads; in-plane shear loads in load bearing and infill walls; and by
confinement with vertical FRP reinforcement. The effects of these variables need
to be quantified.
For a NSM FRP-to-masonry connection the effects of reinforcement position
relative to mortar head joints (also referred to as perpend joints) and brick cores
on the bond properties were investigated previously by Willis et al. (2008). In all
specimens the FRP was aligned in the vertical direction (i.e. perpendicular to the
mortar bed joints) and all of the clay brick units had cores. The current work ex-
pands upon the tests by Willis et al. (2008) using NSM FRP reinforcement. Firstly,
the tests on vertically aligned FRP strips are repeated with solid clay brick units to
remove cores as a variable when assessing the influence of mortar head joints on
the FRP-to-masonry interface properties. Secondly, a new pull test specimen is de-
veloped where the FRP is aligned parallel to the mortar bed joint. This specimen is
used to study bond behaviour of horizontally aligned NSM FRP reinforcement. For
these new specimens the effect of compression on the joint is considered. Testing
to investigate the effect of compression on FRP-to-masonry (or concrete) joints is
unique and it is shown to have a significant effect on the joint behaviour.
41

42 3. Pull tests
In this chapter the results of 18 pull tests, which include the bond strength, cri-
tical bond length and local bond-slip relationships are presented. The local bond-
slip relationships are used in the finite element model in Chapter 5. In this chapter
discussions on the failure modes, and the effects of the tested variables on the re-
sults are also provided.
3.2 Experimental Program
3.2.1 Pull test specimens
Pull test specimens used for this investigation are shown in Figure 3.1. All spe-
cimens were constructed using solid clay brick units with nominal dimensions 230
mm long, 110 mm wide and 76 mm high. The brick unit flexural tensile strength
was determined from lateral modulus of rupture tests (AS/NZS 4456.15) Standards
Australia (2003). See Section 5.3.4 in Chapter 5 for more information on this test.
The mortar used to construct the specimens was mixed in three batches, all with
a mix ratio of 1:1:6 (cement:lime:sand by volume) (type ’N’ in the USA). Bond
wrench tests to AS3700-2001 Standards Australia (2001c) were used as a quality
control measure between the batches. The mortar joints were 10 mm thick.
Pultruded CFRP strips were used in this study. The CFRP reinforcement was
provided in strips 50 mm wide and 1.4 mm thick. The strips were cut to a width
of 15 mm. The width of the CFRP strip was chosen to ensure full embedment in
typical Australian modern masonry walls. Also, the width was chosen to not be too
large, because of concerns of cracking through the thickness of the brick. Other
variables such as strip thickness and bonded length were selected to ensure that
the specimen failed by debonding, and the full bond-slip data could be derived.
Two 1.4 mm thick by 15 mm wide carbon FRP strips were glued together with
’Super Strength’ Araldite to make 2.8 mm thick by 15 mm wide carbon FRP strips.
Two strips were glued together to provide sufficient cross-sectional area of FRP
to ensure that failure of the joint occurred by debonding through the brick rather
than by FRP strip rupture. FRP rupture occurred in a preliminary test when only
one strip of CFRP was bonded to the masonry. The CFRP strip rupture in the trial
test also shows that a lower strength FRP (such as glass FRP) would not be suitable
in the current application. Debonding of the FRP from the masonry could also be
achieved by reducing the bonded length, however by doing this the full non-linear
bond-slip response could not be determined, nor could the actual maximum bond
strength of the interface.
The elastic modulus of the FRP strip was determined during the pull tests from
two strain gauges, placed on either side of the un-bonded portion of the strip, lo-
cated 21 mm above the top of the brick prism (strain gauges 9 and 10 in Figure 3.2).
The FRP strip was glued into a groove, previously cut with a brick-cutting saw, with
a two-part epoxy adhesive. The grooves were approximately 20 mm deep and 6
mm wide. The specimens were painted white to aid in the identification of cracks.
Material properties are shown in Table 3.1.
The specimens are separated into two series. In the first series of pull tests the

3.2 Pull test specimens 43
(a) Series 1
(b) Series 2
Figure 3.1: Pull test specimens
Table 3.1: Material properties
Material Property Mean Std dev Source
Masonry unit Lateral mod. of rupt. (MPa) 3.57 0.75 AS/NZS 4456.15
Mortar batch 1 Bond strength (MPa) 1.84 0.43
Mortar batch 2 Bond strength (MPa) 1.73 0.38 AS3700-2001
Mortar batch 3 Bond strength (MPa) 1.22 0.38
CFRP Elastic modulus (MPa) 207021 1951 Current pull tests
CFRP Rupture strain (µε) 12000 - Manufacturer’s data
Epoxy Flexural strength (MPa) >30 - Manufacturer’s data

44 3. Pull tests
FRP strip is aligned in the vertical direction (perpendicular to mortar bed joints).
As previously discussed, similar tests have already been performed by Willis et al.
(2008) on cored specimens. The first specimen, type ’1A’ (constructed in a stack
bond pattern), was constructed to be a control specimen. Specimen types ’1B’
and ’1C’ (constructed in a running bond pattern) were used to better represent the
masonry bonding pattern typically used in walls. Specimen type ’1B’ was tested to
investigate the effect on the bond in walls when the FRP passes through mortar
head joints. Specimen type ’1C’ was constructed to investigate the bond in walls
when the FRP is inserted into brick units only.
In the second series of tests the FRP strip was aligned in the horizontal direc-
tion (parallel to bed joints). The horizontal strips were bonded into the brick units
(as opposed to the mortar joints) to maximise the bond strength. Tests were per-
formed on this specimen using compression levels of 0 MPa, 0.5 MPa, and 1.0 MPa.
The bonded length (Lb) (and hence the height of the specimen) was selected to
be greater than the critical bond length (Le). The critical bond length is the mini-
mum anchorage length of FRP strip required to develop the maximum axial force
in the FRP strip. Also, any extra bond length greater than Le results in an insigni-
ficant increase in load (Oehlers and Seracino, 2004). The critical bond length was
initially approximated as 100 times the FRP strip thickness (Le = 280 mm). The
specimens were designed so that the bonded length was larger than 280 mm. The
bonded length (Lb) was 336 mm for series 1 specimens and 355 mm for series 2
specimens.
Different bonded lengths for each specimen type were not tested to reduce the
number of variables and number of tests. By testing specimens with different bon-
ded lengths the critical bonded length can be determined. The critical bonded
length can also be determined from the interface shear stress distribution (if the
bonded length is larger than the critical bond length), as demonstrated in Sec-
tion 3.3.4). It was therefore considered unnecessary to test specimens with dif-
ferent bond lengths.
In diagonal tension tests (ASTM Standards, 1993) (Chapter 4), the average nor-
mal stress in the vertical direction was in the order of 1.0 MPa. These tests were
performed on both unreinforced and FRP strengthened masonry wall panels. The
range of compression values here were therefore suitable.
To account for variability, each test was conducted 3 times. For one repeat
of each test strain gauges were sandwiched between the two FRP strips (used to
construct the reinforcement) to measure the strain distribution along its bonded
length. The strain gauges were spaced at 42 mm as shown in Figure 3.2. The strain
gauges were sandwiched between two FRP strips to eliminate the effect they may
have on the epoxy-FRP bonded interface.
The specimens in the testing program are identified as follows: the first term
denotes which series of tests the specimen is from (S1 or S2); the second term de-
notes the specimen type (A,B,or C) for series 1 specimens or the amount of com-
pression applied for series 2 specimens (e.g. P0, P0.5 and P1 for zero, 0.5 MPa, and
1 MPa compression respectively); the third term signifies whether strain gauges

3.2 Test setup and procedure 45
Figure 3.2: Pull test instrumentation
were attached along the bonded length (NG meaning no gauges and SG meaning
gauges); and the last term signifies the test number where more than one test was
performed with the same parameters (Table 3.2).
3.2.2 Test setup and procedure
The test setup is shown in Figure 3.3a and Figure 3.3b for FRP strips aligned
perpendicular to the bed joint (series 1) and Figure 3.4a and Figure 3.4b for FRP
strips aligned parallel to the bed joints (series 2). The specimens were restrained
and a direct tensile force (P) was applied to the FRP using an Instron Universal
Testing Machine under displacement control at a rate of 0.3 mm/min. Finite ele-
ment analysis was used to size the top and bottom restraining plates to ensure
negligible bending in these plates during testing. Before placing the specimens in
the testing apparatus a 12 mm thick specimen plate and a 5 mm thick piece of
plywood were placed on top of the specimen (see Figure 3.3). Both the specimen
plate and plywood had a small gap cut into the edge to allow the FRP strip to pass
through. The piece of plywood was used to ensure full contact between the top
of the masonry specimen and the 12 mm specimen plate. For Series 2 the com-
pression force was applied at the mid-points of two stiff universal beam sections
that bear on both sides of the specimen. Plywood boards (5 mm thick) were pla-
ced between the sides of the specimen and universal beam sections to ensure full
contact between them. The universal beam sections were designed to distribute
the compression force over the height of the specimen and thus produce a normal
stress along the FRP joint that was as uniform as possible. The compression force
was applied prior to the FRP tension force. The compression force was continually
logged with a load cell and was held constant throughout the test.

46 3. Pull tests
Table 3.2: Summary of pull test specimens
Specimen Mortar Batch Series Type Compression Strain gauges along
(MPa) bonded length
S1-A-NG-1 1 1 A - no
S1-A-NG-2 1 1 A - no
S1-A-SG 3 1 A - yes
S1-B-NG-1 1 1 B - no
S1-B-NG-2 1 1 B - no
S1-B-SG 1 1 B - yes
S1-C-NG-1 1 1 C - no
S1-C-NG-2 1 1 C - no
S1-C-SG 3 1 C - yes
S2-P0-NG-1 2 2 - 0 no
S2-P0-NG-2 2 2 - 0 no
S2-P0-SG 3 2 - 0 yes
S2-P0.5-NG-1 3 2 - 0.5 no
S2-P0.5-NG-2 3 2 - 0.5 no
S2-P0.5-SG 3 2 - 0.5 yes
S2-P1-NG-1 2 2 - 1.0 no
S2-P1-NG-2 2 2 - 1.0 no
S2-P1-SG 3 2 - 1.0 yes

3.2 Test setup and procedure 47
(a) Test schematic
(b) Photograph of test apparatus
Figure 3.3: Series 1 pull test setup

48 3. Pull tests
(a) Test schematic
(b) Photograph of test apparatus
Figure 3.4: Series 2 pull test setup

3.3 Experimental Results 49
3.3 Experimental Results
3.3.1 Failure modes: Series 1Most specimens failed by debonding through the brick. This failure mode star-
ted with small diagonal cracking in the masonry adjacent to the FRP strip at the
loaded end of the specimen (shown in Figure 3.5a for specimen S1-A-NG-1 with
black lines added to illustrate the angle of cracking). The cracking propagated
down the specimen as the load increased until the FRP strip completely debon-
ded (shown in Figure 3.5b). After debonding failure a layer of masonry, typically
between 1 mm and 5 mm thick, remained attached to the surface of the FRP strip.
This failure mode is common for adhesively bonded FRP-to-masonry connections
(see Willis et al. (2008)). When the FRP strip was bonded through a mortar joint
(S1-B-NG-1, S1-B-NG-2 and S1-B-SG) debonding occurred through the mortar joint
(shown in Figure 3.5c at the second brick course from the top). Minimal cracking
was observed in the brick adjacent to the mortar head joint.
In addition to debonding, specimen S1-B-SG failed by sliding along the epoxy-
FRP interface at the top of the specimen where the FRP strip was bonded into the
brick as shown in Figure 3.5d. Where the FRP was bonded into the mortar the
main failure mode was identified as debonding through the mortar joint. Sliding
failure within the top brick was likely caused by a reduction in bond strength at the
interface by the presence of strain gauges. Unlike all other specimens where strain
gauges were sandwiched between the FRP strips, gauges used for S1-B-SG were
attached to the outside of the FRP strips, and hence they were within the bonded
area between FRP strip and masonry. As a result, the bond-slip relationships de-
termined from this specimen, at positions where sliding has been identified, will
not represent the true debonding behaviour of the connection (i.e. the connection
without strain gauges). At the mortar joint, where the failure mode was debonding
and was similar to that seen in specimens S1-B-NG-1 & 2, the maximum shear
strength was estimated. Results from this specimen were kept for this reason.
After removing Series 1 specimens from the testing apparatus cracking was ob-
served in line with the FRP, extending through the thickness of the specimens. This
type of cracking was visible on the top of the specimen (Figure 3.6a). In some ins-
tances (e.g. specimen S1-A-NG-1) the cracking was also visible on the back of the
specimen, in line with the FRP. In both S1-C-NG-2 and S1-C-SG a vertical crack
had formed completely through the thickness of the specimens, following a path
through both mortar head joints and the FRP as shown in Figure 3.6b. This kind of
cracking in the direction of the reinforcement may have adverse effects in an FRP
retrofitted wall with through brick cracking potentially weakening the retrofitted
wall system.
3.3.2 Failure modes: Series 2Before debonding occurred for specimen S2-P0-SG, the middle course of bricks
was ’pulled-through’ the specimen. Figure 3.7a shows how the diagonal cracks that
formed during the debonding process in the middle course of bricks were inter-
cepted by cracking through the mortar bed joints. In the case of this specimen,

50 3. Pull tests
(a) Crack pattern (b) S1-A debonding
(c) S1-B debonding (d) S1-B-SG failure
Figure 3.5: Failure modes

3.3 Failure modes: Series 2 51
(a) Cracking at top of specimen in line with FRP
(b) Crack through thickness S1-C-SG
Figure 3.6: Cracking through thickness of series 1 specimens

52 3. Pull tests
cracking in the mortar bed joints developed fully at a load of 38 kN and the outer
brick courses separated from the middle course of the specimen. Surface irregu-
larities that prevented the middle course of bricks from bearing against the re-
straining plate securely may have also contributed to ’pull-through’ of the middle
course of bricks. That is the piece of plywood placed between the top of the spe-
cimen and the specimen plate may not have been able to adequately take up the
irregularities as shown schematically in Figure 3.7b. After the outer brick courses
separated, the specimen, now consisting of only the FRP and middle course of
bricks, continued to take load until the FRP debonded from the specimen at a load
of 54.6 kN (Figure 3.7c).
(a) Bed joint cracking (P=38 kN) (b) Pull through of middle course
(c) Debonding (P=54.6 kN)
Figure 3.7: ’Pull-through’ of middle course S2-P0-SG
Similar behaviour was observed for S2-P0-NG-1 and S2-P0-NG-2. In these two
specimens only one outer course of masonry separated from the specimen (ins-

3.3 Failure modes: Series 2 53
tead of both) (Figure 3.8a). Cracking was, however, observed through both mortar
bed joints. When testing S2-P0-NG-1 one outer course of masonry separated from
the specimen at ultimate load, when the FRP debonded from the masonry. When
testing S2-P0-NG-2 one outer course of masonry separated at approximately 50%
of the failure load. When specimens were loaded with compression (0.5 MPa or 1.0
MPa) no cracking was visible along the mortar bed joints. Diagonal cracking was
still, however, confined to the middle course of bricks indicating that bed joint
cracks were likely present (Figure 3.8b).
(a) Failure S2-P0-NG-1 (b) Failure S2-P1-SG
Figure 3.8: Typical failure modes for series 2 specimens
Surface irregularities played a major role in the observed behaviour of these
specimens. The combination of inadequate contact of masonry courses with the
reaction plate and the restraint effect of the confining steel plates may have chan-
ged the results. Therefore the results of the series 2 specimens are merely indica-
tive and could be incorrect. Capping or other methods could have been used to
reduce such affects.
Pull through failure is unlikely to be a failure mode in a URM wall retrofitted
with horizontal FRP reinforcement. Horizontal reinforcement would likely be used
for shear walls where diagonal cracking is the main failure mode. Diagonal cra-
cking usually occurs in walls with strong mortar or precompression, and these two
parameters would prevent a pull through type failure.
A summary of results is shown in Table 3.3 and includes: the critical bond
length (Le) (determined in Section 3.3.4); maximum strain in FRP (ǫmax); and the
bond strength. The bond strength is the maximum load resisted in the test. The

54 3. Pull tests
average bond strength and corresponding coefficient of variation (COV, shown in
brackets) is also included.
Table 3.3: Summary of test results
Specimen Lea εmax Bond Strength Avg Bond Strength
(mm) (µε) (kN) (kN)
S1-A-NG-1 - 9638 83.45
S1-A-NG-2 - 8094 71.09
S1-A-SG 300 8773 81.48 78.67 (COV 8.4%)
S1-B-NG-1 - 7974 70.36
S1-B-NG-2 - 6865 59.41
S1-B-SG NA 6490 56.60b 64.89 (COV 11.9%)
S1-C-NG-1 - 7416 63.88
S1-C-NG-2 - 7890 69.41
S1-C-SG 300 8963 84.50 72.60 (COV 14.7%)
S2-P0-NG-1 - 6245 54.00
S2-P0-NG-2 - 6228 53.59
S2-P0-SG NA 5793 54.62 54.07 (COV 1.0%)
S2-P0.5-NG-1 - NA 57.88c
S2-P0.5-NG-2 - 6748 58.55
S2-P0.5-SG 330 8047 68.45 63.50 (COV 11.0%)
S2-P1-NG-1 - 8496 78.63
S2-P1-NG-2 - 9272 78.49
S2-P1-SG 300 7741 68.31 75.14 (COV 7.9%)
a Determined visually from shear stress distribution (Section 3.3.4)b Sliding at epoxy-FRP interface (omitted from average bond strength)c Setup failure resulted in rupture (omitted from average bond strength)
3.3.3 Effect of variables on bond strength
Effect of mortar joints parallel to FRP strip
To demonstrate the effect that parallel mortar joints adjacent to the FRP strip
had on the behaviour of the FRP to masonry bond, the stack bonded specimens
(S1-A-NG-1&2, S1-A-SG) are compared to the running bond specimens (S1-C-NG-
1&2, S1-C-SG). In the S1-C specimens diagonal cracking in brick courses was in-
tercepted by cracking through mortar head joints (can be seen in Figure 3.6b).
Cracking in the mortar joints reduced the region of masonry effective in the load
transfer and reduced the bond strength by 8% when compared to S1-A specimens.
When the FRP strip passed through mortar head joints as well as units (S1-B-NG-

3.3 Effect of mortar joints parallel to FRP strip 55
1&2) the average bond strength was reduced by 11% when compared to the speci-
mens constructed using a running bond with the FRP bonded into brick unit only
(S1-C-NG-1&2, S1-C-SG). Note that the bond strength was reduced by 18% when
compared to the stack bonded specimen.
In a study similar to the current one, Willis et al. (2008) also performed pull
tests on clay brick masonry prisms strengthened with NSM FRP strips. As pre-
viously noted in the introduction, they used cored bricks and bonded the FRP
strips to the prisms in the vertical direction (perpendicular to the bed joints). They
investigated the effect of reinforcement position relative to the mortar head joints
and brick cores. Figure 3.9 shows the location of the brick cores and NSM strips.
The similarities between Willis et al.’s study and the current study include: the
specimen types (Specimen types ’1A’, ’1B’ and ’1C’); the CFRP strip width in many
tests (15 mm), the epoxy used; and the lateral modulus of rupture of the brick (≈
3.55 MPa). The main difference between the tests (apart from the brick cores) was
that the CFRP strips used by Willis et al. were thinner (1.2 mm thick) and had a
lower elastic modulus (162,000 MPa). These differences make it difficult to directly
compare the specimens tested in the current investigation to the specimens tested
by Willis et al. (2008). For this reason the results of their tests are not included in
this thesis. However, comparisons can be made based on the reduction of capacity
for different types of test specimens.
Figure 3.9: Position of cores and NSM strips, Willis et al. (2008) specimens
Willis et al. (2008) found when FRP was bonded to cored bricks there was no
difference between the bond strengths of S1-A type specimens and S1-C type spe-
cimens (unlike the 8% reduction observed for the solid brick specimens). It is likely
that cores in the brick units affected the region of masonry effective in the load
transfer more than the mortar joint, and cores in the brick units decreased the
bond strength of the joint. Willis et al. (2008) also found that when the FRP strip
passed through mortar head joints and cored units the average bond strength was
reduced by 8.5%. This reduction in bond strength is similar to that observed from
the presented results on solid brick units (reduction of 11%).
When the FRP strips were aligned parallel to the bed joints (S2-P0-NG-1&2, S2-
P0-SG), the region of masonry effective in the load transfer was confined to the

56 3. Pull tests
middle course of bricks. Compared to the stack bonded specimen (S1-A speci-
mens), the reduction in bond strength was 31%. The reduction in bond strength
can be attributed to the small edge distance (between the FRP and the edge of the
middle course) on both sides of the FRP, which for these specimens was equal to 38
mm. Reduction in bond strength due to reduction in edge distance has been pre-
viously investigated by Rashid et al. (2008) on NSM FRP-to-concrete joints. They
found that NSM strips interact strongly with the edge when the lateral spacing bet-
ween the NSM strip and the edge of the concrete was less than 3.5 times the depth
of the strip. Using their result, the minimum edge distance for 15 mm NSM CFRP
strips (used in the current study) would be 52.5 mm. Figure 3.10a shows the crack
pattern, after failure, on the side of the middle course of specimen S2-P0-NG-2,
with the outer brick course moved aside. Note that in specimens with adequate
edge distance cracking was not observed on the side of the specimen. The failure
mode shown in Figure 3.10a was similar to the results observed by Rashid et al.
(2008) (typical failure mode shown in Figure 3.10b).
(a) Specimen S2-P0-NG-2 (b) Specimen with 30 mm edge dis-
tance (Rashid et al 2008)
Figure 3.10: Interaction between FRP and specimen edge
Effect of compression applied normal to FRP strip longitudinal direction
The bond strength increased linearly with an increase in compression as shown
in Figure 3.11 (within the tested range of 0 to 1 MPa). Compression applied per-
pendicular to the joint prevented tensile cracks, that formed during the debon-
ding process, from opening and lead to an increase in bond strength. Applying a

3.3 FRP to masonry interface behaviour 57
compression stress of 0.5 MPa and 1 MPa to the specimens increased the average
failure loads by 17% and 39% respectively, compared to that of the specimens wi-
thout compression. Compression of 1 MPa increased the strength so that it was
similar to S1-A type specimens. Note that these results were likely affected by the
inadequate contact of the masonry courses with the reaction plate, and therefore
are indicative only.
Figure 3.11: Effect of compression on bond strength and maximum shear stress for
FRP aligned parallel to the bed joint
3.3.4 FRP to masonry interface behaviourThe distribution, along the bonded length, of axial strain in the FRP for increa-
sing increments of load, is shown in Figure 3.12 for specimen S2-P1-SG. The peak,
post-peak and failure loads indicated on Figure 3.12 are shown on a load versus
loaded end slip curve in Figure 3.14. Shear stress transferred from the FRP to the
masonry through the epoxy was determined from the strain distributions, for all
specimens with strain gauges, using Equation 3.1:
τav g =
(∆ε)Ep bp tp
(∆L)(2bp + tp)(3.1)
Where τav g is the average shear stress transferred from the FRP to the masonry
through the epoxy over the length ∆L, ∆ε is the change in axial strain in the FRP
over length ∆L, Ep is the elastic modulus of the FRP strip, bp is the width of the
strip, tp is the thickness of the strip, and ∆L is the incremental length along the
FRP (equal to strain gauge spacing).

58 3. Pull tests
Figure 3.12: Strain distribution S2-P1-SG
The distribution, along the bonded length, of shear stress through the epoxy
for increasing increments of load, is shown in Figure 3.13 for specimen S2-P1-SG
(typical). The shear stress distribution shows the transfer of the load from the FRP
to the masonry and how the region of masonry effective in the load transfer moved
away from the loaded end as the load increased and cracks developed. After the
peak load was reached, debonding cracks propagated towards the unloaded end,
whilst the specimen maintained an almost constant load.
For the brittle FRP-masonry interface the maximum FRP force is attained once
the bell-shaped shear-stress distribution shown in Figure 3.13 (at peak load) is de-
veloped. The bonded length required to develop such a distribution is the critical
bond length (Le) as indicated on Figure 3.13. For bonded lengths greater than Le
(the case here), the bell-shaped shear-stress distribution propagates away from the
loaded end as debonding occurs. Therefore any increase in bonded length (past
Le) does not increase the maximum axial force that can be developed in the FRP.
The critical bond length was estimated from the shear stress distribution (at
the maximum load) as the distance between the 2 points: i) where interface cracks
are fully developed and the shear stress is approximately equal to zero; and ii) in
the uncracked masonry where the shear stress is approximately equal to zero. For
specimen S2-P1-SG (Figure 3.13), these points were determined from the curve
plotted at 68.3 kN as: 0 mm (i) and 300 mm (ii). The critical bond length was
then 300 mm. The critical bond lengths for specimens S1-A-SG, S1-C-SG, and S2-
P0.5-SG were also around 300 mm and are included in Table 3.3. The critical bond

3.3 FRP to masonry interface behaviour 59
Figure 3.13: Shear stress distribution S2-P1-SG
length was not determined for specimens S1-B-SG because failure was by prema-
ture sliding and S2-P0-SG because of the premature sliding of the middle brick
course.
Local slip (of FRP relative to the masonry) distributions were calculated at in-
creasing load increments up to the failure load by numerically integrating the strain
distributions. It was assumed that the axial strain in the masonry was negligible
and the slip at the unloaded end was zero. Using the calculated slip, the load-slip
response at the loaded end was determined for all strain gauged specimens (shown
in Figure 3.15). The load-slip responses show that: stiffness reduced in all speci-
mens with increasing load (indicating progressive damage) after the point of first
cracking (load ≈ 20 kN); the displacement capacities of all specimens were similar;
the stiffness of specimens S1-A-SG and S1-C-SG were similar; the overall stiffness
reduced when FRP passed through mortar joint and when the width of masonry
section was reduced; and the stiffness increased when compression was applied.
All of these behaviours were expected. Note that the specimens had some ducti-
lity indicating that the bonded length was larger than the critical bond length. The
effect of the outer courses separating for specimen S2-P0-SG is also shown.
By combining the shear stress and the slip distributions the local shear stress-
slip (or bond-slip) relationship was determined. The bond-slip relationships for all
specimens with strain gauges along the bonded length are shown in Figure 3.16 to
Figure 3.21.
The average maximum shear strengths determined for specimens S1-A-SG and
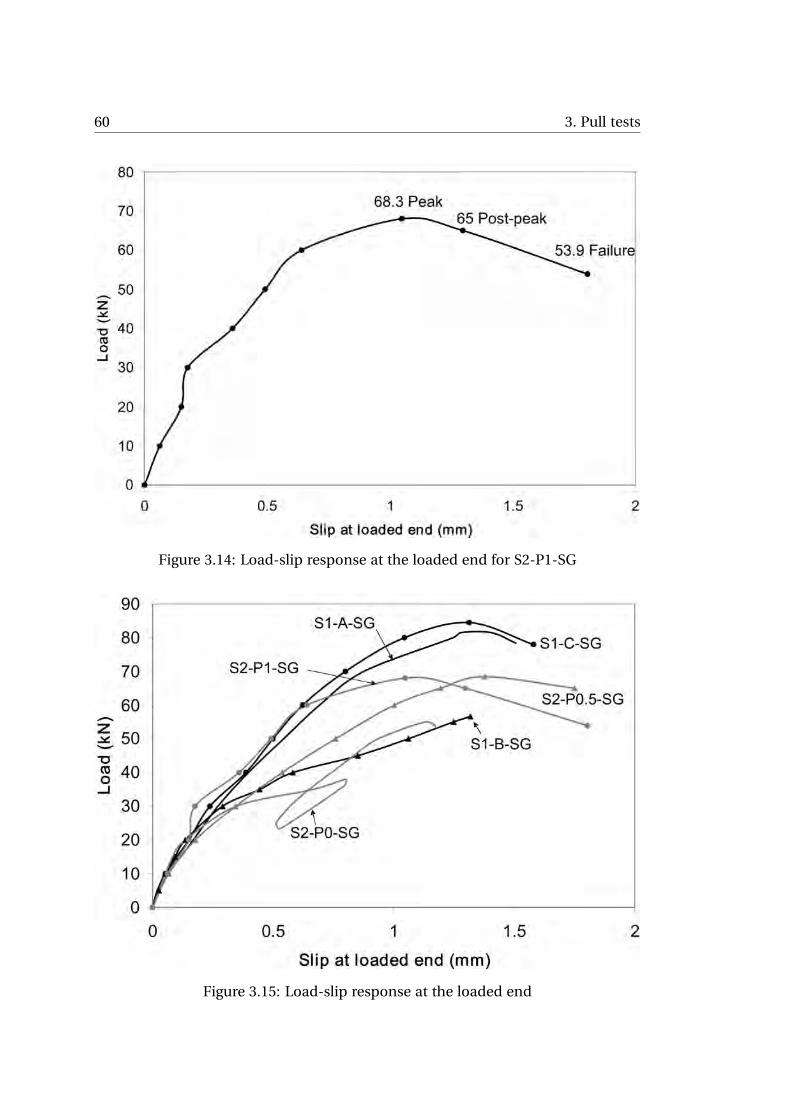
60 3. Pull tests
Figure 3.14: Load-slip response at the loaded end for S2-P1-SG
Figure 3.15: Load-slip response at the loaded end

3.3 FRP to masonry interface behaviour 61
Figure 3.16: Bond-slip curve S1-A-SG
Figure 3.17: Bond-slip curve S1-B-SG

62 3. Pull tests
Figure 3.18: Bond-slip curve S1-C-SG
Figure 3.19: Bond-slip curve S2-P0-SG

3.3 FRP to masonry interface behaviour 63
Figure 3.20: Bond-slip curve S2-P0.5-SG
Figure 3.21: Bond-slip curve S2-P1-SG

64 3. Pull tests
S1-C-SG were 12.2 MPa and 13.1 MPa, respectively. The bond-slip curves derived
for S1-B-SG (Figure 3.17) confirm the mixed failure modes observed during the test
(discussed previously). The maximum shear stresses at positions along the bonded
length, where the FRP was bonded to brick (10.5 mm, 42 mm, 84 mm, 168 mm,
and 210 mm from the loaded end), were constant, and were equal to approxima-
tely 9.0 MPa. This was lower than the average maximum shear strength determi-
ned for specimens S1-A-SG and S1-C-SG, where debonding occurred through the
brick. This reduction in bond strength for specimen S1-B-SG confirms that failure
through the adhesive had occurred. Significant residual shear strength plateaus
were also evident at these positions for S1-B-SG (unlike all other bond-slip curves)
providing further evidence that sliding was a significant failure mode. The curve
at 126 mm from the loaded end shows the bond-slip behaviour within the mortar
joint. The maximum shear stress within the mortar joint was 4.5 MPa and was si-
gnificantly lower than the maximum shear stress for debonding through brick or
adhesive. The maximum shear stress transferred from FRP to masonry was redu-
ced by approximately 64% when debonding occurred through the mortar joint (as
opposed to debonding through the brick).
The bond-slip curves for specimen S2-P0-SG (Figure 3.19) were separated into
curves before the break (i.e. when the two outer courses of masonry separated
from the middle, reinforced course at 38 kN) using solid lines, and after the break
using broken lines. The bond-slip curves derived from strain gauge readings recor-
ded before the break were likely affected by cracking along the bed joint and the
’pull through’ of the middle course of bricks. It can be seen from the curves before
the break that at the initial stages of loading, load transfer and failure was closest
to the loaded end (eg. 31.5 mm and 84 mm from the loaded end). The bond-slip
curves derived from strain gauge readings recorded after the break (until ultimate
failure) represent progressive damage of the specimen by cracking in the middle
course of bricks (brick debonding). After the break, masonry within 100 mm from
the loaded end was already damaged significantly and the majority of load trans-
fer was shifted further down the bonded length. As a result bond-slip curves at
126 mm and 168 mm show the brick debonding behaviour of the middle course
of masonry (a masonry section that is 76 mm wide). The average maximum shear
strength of the middle course of masonry was 8.2 MPa. Compared to the wider
masonry specimens (S1-A-SG and S1-C-SG) the maximum shear stress developed
was reduced by 35%.
The average maximum shear stresses for specimens S2-P0.5-SG and S2-P1-SG
were 10.0 MPa and 13.0 MPa respectively. Similar to bond strength, the average
maximum shear stress increased linearly with an increase in compression as shown
in Figure 3.11. Note that the bond-slip curve at 10.5 mm away from the loaded end
was discounted when calculating the average maximum shear stress. The bond-
slip curve at this location was not used because it was affected by the restraint
conditions at the loaded end. The same was done when calculating the average
maximum shear stresses for specimens S1-A-SG and S1-C-SG.
The bond-slip curves were not equal at all points along the bonded length for

3.3 FRP to masonry interface behaviour 65
each specimen, in large part due to the location of cracking relative to the strain
gauges. For future use in finite element and analytical models a single idealized
bilinear model was fitted to the experimental data. For each bilinear model the
maximum shear stress (τmax) and corresponding slip (δ1) were averaged from the
experimental bond-slip curves. Rather than estimating the final slip (δmax) from
the curves, δmax was determined by back calculation in Equation 3.2 using the ex-
perimentally determined bond strength for PIC . Equation 3.2 represents the theo-
retical strength model for a strip bonded to concrete (or masonry). The equation is
derived by considering equilibrium and compatibility of a strip-to-concrete joint
with a bilinear relationship to model the interface (Seracino et al., 2007b). Using
the bilinear model determined this way for the interface behaviour in a finite ele-
ment or analytical model, the experimental bond strength is reproduced. The bi-
linear bond-slip model determined in this way produced a reasonable fit (see Fi-
gure 3.16 to Figure 3.21).
PIC =
√
τmaxδmax
√
Lper (E A)p (3.2)
Where PIC is the bond strength of the specimen determined from the specific test
with the strain gauges, Lper is the bonded perimeter of FRP which was 33 mm,
(E A)p is the axial stiffness of the strip determined using the strain ǫmax in the FRP
at maximum load PIC for each specimen.
As mentioned previously a bond-slip relationship for S1-B-SG could not be de-
termined from the test data because of sliding at the interface. For specimen S2-
P0-SG an average of the maximum shear stresses after the break was used for τmax
so that the bond-slip curve represented debonding through the middle course of
bricks. δ1 was estimated as 0.2 mm by finding the intersection of the elastic part
of the bond-slip curve at 126 mm (after the break) with the x-axis (δ ≈ 0.16) and
subtracting from the slip at maximum stress (δ ≈ 0.36). For clarity the bilinear
relationship for specimen S2-P0-SG is not shown in Figure 3.19. The parameters
describing the bilinear bond-slip models are tabulated in Table 3.4, and defined in
Figure 3.22.
Table 3.4: Bilinear bond-slip parameters
Specimen δ1 (mm) τmax (MPa) δmax (mm)
S1-A-SG 0.34 12.2 1.71
S1-B-SG NA NA NA
S1-C-SG 0.40 13.1 1.77
S2-P0-SG 0.20 8.2 1.30
S2-P0.5-SG 0.28 10.0 1.64
S2-P1-SG 0.32 13.0 1.22

66 3. Pull tests
Figure 3.22: Bond slip model parameters
3.4 Summary and conclusionsA series of 18 pull tests was conducted on clay brick masonry prisms streng-
thened with NSM CFRP strips. The bond strengths, critical bond lengths and the
local bond-slip relationships were determined. Both vertically aligned FRP strips
(FRP perpendicular to bed joints) and horizontally aligned FRP strips (FRP parallel
to bed joints) were tested. For the vertically aligned FRP strips the tests included:
bonding FRP to a stack bonded specimen; bonding FRP to brick units in a running
bond specimen; and bonding FRP to alternating brick and mortar head joints in a
running bond specimen. For horizontally aligned FRP strips the effect of compres-
sion was investigated.
The main failure mode of the specimens was by debonding of the FRP from
the masonry prism. The behaviour of series 2 specimens was affected by surface
irregularities and therefore the results of these specimens were indicative only. It is
recommended that capping techniques or similar be used to reduce such affects.
Mortar joints parallel to the FRP reinforcement reduced the region of masonry
effective in load transfer, thus reducing the bond strength. The largest reduction
in bond strength was 31%, and occured for specimens where the FRP was aligned
horizontally and the distance between FRP and parallel mortar joint was the least.
For solid bricks a reduction in strength of 8% was observed between the stack
bonded and running bonded specimens (FRP inserted into brick only), and was
attributed to the presence of parallel mortar joints. When the FRP strip passed
through mortar head joints as well as units, the average bond strength was redu-
ced by 11% when compared to the specimens constructed using a running bond
with the FRP bonded into brick unit only. As this reduction in strength is not too
significant, it can be recommended that vertical NSM FRP reinforcement is bon-
ded into alternating brick unit and mortar joints to hide the retrofit.
Thin rectangular strips were selected in order to maximize the confinement
around the strip and increase the bond between the FRP and the masonry. The
use of thin rectangular strips required deep grooves to be cut into the surface of
the masonry prisms. For the prisms where the FRP was aligned vertically, the deep
grooves caused cracking through the thickness of the prism in line with the FRP.

3.4 Summary and conclusions 67
This type of cracking will potentially create a plane of weakness in a masonry wall
and adversely affect the overall behaviour of the wall. Through wall cracking is
therefore a potential problem when using NSM FRP strips, particularly for weak,
hollow and cored masonry. Extra confinement by the surrounding masonry in a
wall (compared to a prism) may help prevent through wall cracking. The results
suggest that minimizing the groove depth would be a key factor in enhancing the
overall behaviour of the strengthened masonry member.
The failure mode of the specimens involving transverse cracking was dependent
upon the out-of-plane thickness of the specimen. Therefore the related bond re-
sults are only representative of the behaviour of the strengthening system in walls
having the same thickness of the specimen (which was 110 mm).
Although the bond strength was reduced when aligning the FRP horizontally,
compression normal to the joint increased the bond strength significantly and at a
compression of 1.0 MPa the bond strength increased to a value similar to the verti-
cally aligned FRP. For the range of tested compression values, based on the typical
range found in a URM building, the bond strength, and interface shear strength
increased linearly with applied compression. Note that these results are indicative
only, due to the results of series 2 specimens being affected by surface irregulari-
ties.
The results of the pull tests conducted in this chapter illustrate the significant
difference between the bond behaviour for NSM FRP strips aligned vertically and
horizontally. It is important in design and analysis that the differences are taken
into account.


4
Experimental tests on FRP
strengthened masonry wall panels
4.1 IntroductionIn this chapter the results of the experimental tests on masonry wall panels
strengthened with NSM CFRP strips are presented. To investigate the in-plane
shear behaviour of masonry strengthened with NSM FRP strips, four unreinforced
masonry (URM) wall panels and seven strengthened wall panels were tested using
the Diagonal Tension/Shear Test (ASTM E519-93) ASTM Standards (1993). For the
strengthened panels, four different reinforcement schemes were used, and inclu-
ded: reinforcing one side of the panel with 2 vertical strips; reinforcing each side of
the panel with 2 vertical strips; reinforcing each side of the panel with 2 horizontal
strips; and reinforcing one side of the panel with 2 vertical strips and reinforcing
the other side with 2 horizontal strips.
The reinforcement strategies were designed to prevent sliding along mortar
bed joints (within the wall panel) and diagonal cracking (throughmortar joints and
brick units). The experimental tests were used to determine: the effectiveness of
the reinforcement scheme (in terms of strength and ductility increase); the failure
modes; the reinforcement mechanisms; and the behaviour of the bond between
the masonry and the FRP.
Of particular interest was the reinforcement mechanism of the vertical NSM
FRP strips. The vertical reinforcement can potentially restrain sliding along mor-
tar bed joints and diagonal cracking through the brick units. Marshall and Swee-
ney (2002) did not expect vertical NSM strips to be effective at increasing sliding
resistance or diagonal cracking. As described in the literature review (Section 2.4,
page 11), vertical reinforcement can potentially restrain crack sliding by two dif-
ferent mechanisms. These mechanisms are dowel action and restraining dilation.
The contribution of dowel strength is likely to be low, but it may contribute some
resistance due to confinement of the reinforcement with the brick. It was hypo-
thesized that the other mechanism, where the FRP resists crack separation upon
sliding (dilation), would be significant. The restraint of dilation would result in an
increased resistance to frictional sliding.
The test results presented in this chapter include: the load-displacement beha-
viour; crack patterns; failure modes; and FRP strain measurements. This chapter
69

70 4. Experimental tests on FRP strengthened masonry wall panels
also includes a comparison of the reinforcement schemes, and comparisons of the
results with other tests from the literature.
4.2 Experimental programThe Diagonal Tension/Shear Test involves subjecting a square section of ma-
sonry, with height and length both equal to 1.2 m, to a compressive load applied
along the diagonal. A schematic of the test is shown in Figure 4.1a. A photograph
of the test is shown in Figure 4.1b.
(a) Test schematic (b) Setup URM-1
Figure 4.1: The Diagonal Tension/Shear Test
The panels were constructed from solid clay masonry units with nominal di-
mensions 230 mm long, 110 mm wide and 76 mm high. Five batches of mortar
were used in the construction of the panels, all having a mix ratio of 1:1:6 (ce-
ment:lime:sand by volume). The mortar joints were 10 mm thick. These are the
same material specifications as used for the pull tests presented in Chapter 3.
The mortar batches used to construct each panel are presented in Table 4.1.
The flexural tensile bond strength of each mortar batch was determined using the
bond wrench test, AS3700-2001, Standards Australia (2001c). The bond wrench
test is described in further detail in Section 5.3.1. The average flexural tensile bond
strength (coefficient of variation in brackets) of each mortar batch is also presen-
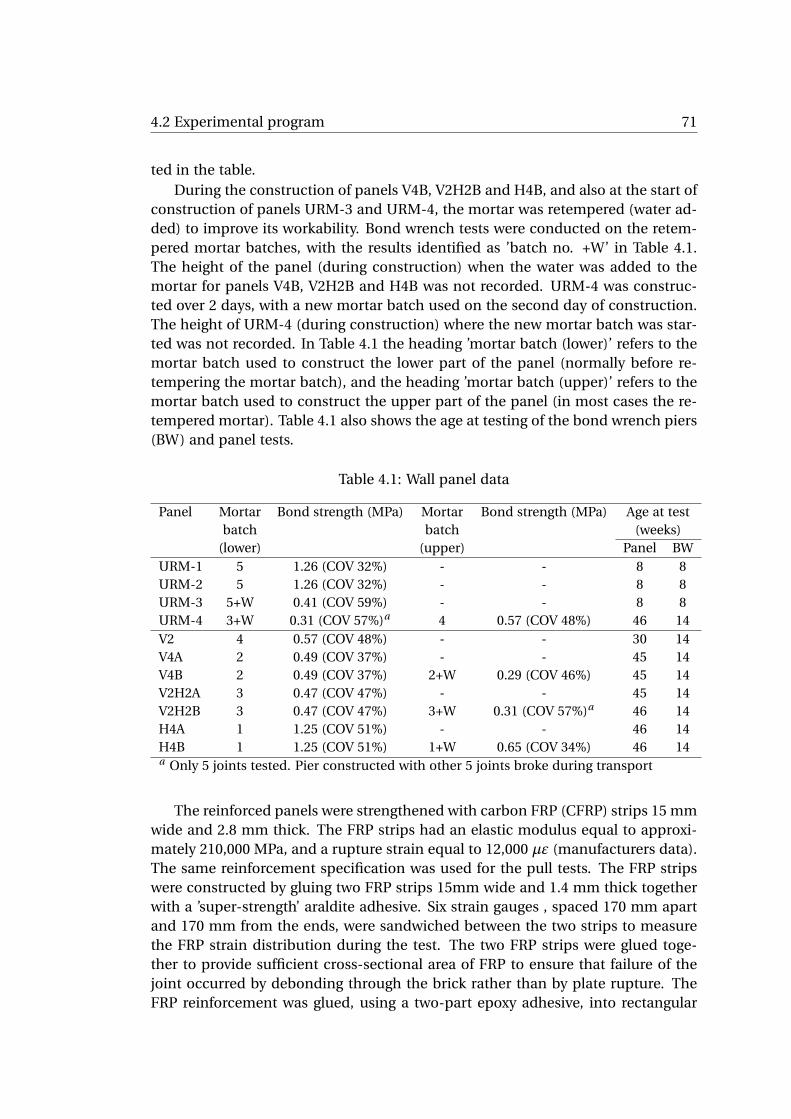
4.2 Experimental program 71
ted in the table.
During the construction of panels V4B, V2H2B and H4B, and also at the start of
construction of panels URM-3 and URM-4, the mortar was retempered (water ad-
ded) to improve its workability. Bond wrench tests were conducted on the retem-
pered mortar batches, with the results identified as ’batch no. +W’ in Table 4.1.
The height of the panel (during construction) when the water was added to the
mortar for panels V4B, V2H2B and H4B was not recorded. URM-4 was construc-
ted over 2 days, with a new mortar batch used on the second day of construction.
The height of URM-4 (during construction) where the new mortar batch was star-
ted was not recorded. In Table 4.1 the heading ’mortar batch (lower)’ refers to the
mortar batch used to construct the lower part of the panel (normally before re-
tempering the mortar batch), and the heading ’mortar batch (upper)’ refers to the
mortar batch used to construct the upper part of the panel (in most cases the re-
tempered mortar). Table 4.1 also shows the age at testing of the bond wrench piers
(BW) and panel tests.
Table 4.1: Wall panel data
Panel Mortar Bond strength (MPa) Mortar Bond strength (MPa) Age at test
batch batch (weeks)
(lower) (upper) Panel BW
URM-1 5 1.26 (COV 32%) - - 8 8
URM-2 5 1.26 (COV 32%) - - 8 8
URM-3 5+W 0.41 (COV 59%) - - 8 8
URM-4 3+W 0.31 (COV 57%)a 4 0.57 (COV 48%) 46 14
V2 4 0.57 (COV 48%) - - 30 14
V4A 2 0.49 (COV 37%) - - 45 14
V4B 2 0.49 (COV 37%) 2+W 0.29 (COV 46%) 45 14
V2H2A 3 0.47 (COV 47%) - - 45 14
V2H2B 3 0.47 (COV 47%) 3+W 0.31 (COV 57%)a 46 14
H4A 1 1.25 (COV 51%) - - 46 14
H4B 1 1.25 (COV 51%) 1+W 0.65 (COV 34%) 46 14a Only 5 joints tested. Pier constructed with other 5 joints broke during transport
The reinforced panels were strengthened with carbon FRP (CFRP) strips 15 mm
wide and 2.8 mm thick. The FRP strips had an elastic modulus equal to approxi-
mately 210,000 MPa, and a rupture strain equal to 12,000 µε (manufacturers data).
The same reinforcement specification was used for the pull tests. The FRP strips
were constructed by gluing two FRP strips 15mm wide and 1.4 mm thick together
with a ’super-strength’ araldite adhesive. Six strain gauges , spaced 170 mm apart
and 170 mm from the ends, were sandwiched between the two strips to measure
the FRP strain distribution during the test. The two FRP strips were glued toge-
ther to provide sufficient cross-sectional area of FRP to ensure that failure of the
joint occurred by debonding through the brick rather than by plate rupture. The
FRP reinforcement was glued, using a two-part epoxy adhesive, into rectangular

72 4. Experimental tests on FRP strengthened masonry wall panels
grooves cut into the surface of the masonry with a circular saw. The grooves were
20 mm deep and 6 mm wide and had the same dimensions as the grooves cut into
the pull test specimens. To cut vertical grooves near the base of the panels, the
panels were tilted and an angle grinder was used (shown in Figure 4.2). After in-
sertion, the FRP was flush with the surface of the panel (no brick or mortar pieces
were placed over the FRP).
Figure 4.2: Cutting grooves into specimens with angle grinder
The reinforcement schemes used for the strengthened panels are shown in Fi-
gure 4.3. Panel V2 was reinforced with 2 vertical NSM CFRP strips (i.e. aligned
perpendicular to the bed joints) on one side of the panel (shown in Figure 4.3a).
Panel V2 was tested to observe the effect of single sided strengthening. Panels V4A
and V4B were reinforced with 2 vertical NSM CFRP strips on each side of the panel
(shown in Figure 4.3b). Rather than aligning the FRP strips symmetrically on ei-
ther side of the panel the strips were staggered as shown to prevent through brick
cracking between the 2 strips. The distance between the staggered vertical rein-
forcement was 120 mm. Panels V2H2A and V2H2B were reinforced with 2 verti-
cal NSM CFRP strips on one side of the panel and 2 horizontal NSM CFRP strips
(i.e. aligned parallel to the bed joints) on the other side of the panel (shown in
Figure 4.3c). Panels H4A and H4B were reinforced with 2 horizontal NSM CFRP
strips on each side of the panel (shown in Figure 4.3d and Figure 4.3e). Sepa-
rate figures are shown because the strain gauge numbering was different for each
test. Similar to panels V4A and V4B the reinforcement in panels H4A and H4B was
staggered. The distance between the staggered horizontal reinforcement was 86

4.3 Experimental results 73
mm. The vertical reinforcement was located midway between mortar head joints
and the horizontal reinforcement was located midheight between the mortar bed
joints as shown in Figure 4.3. The FRP strips were bonded into the brick units to
maximise the bond strength and hence effectiveness of the reinforcement (see Sec-
tion 2.3.3). The vertical reinforcement was used to restrain sliding along the bed
joint, and the horizontal reinforcement was used to restrain diagonal cracking.
The load was applied with a hydraulic jack. The flow rate of the hydraulic fluid
was kept constant throughout all tests until failure. The hydraulic pressure caused
an initial loading rate (before cracking) of around 40 kN/min. The loading scheme
was not strict displacement control, but was able to capture the post-peak softe-
ning behaviour of the panel if the test did not become unstable.
Potentiometers were used to measure the vertical and horizontal displacement
on each side of the panel in accordance with ASTM E519-93 ASTM Standards (1993).
The gauge lengths were 1300 mm and 1400 mm for the vertical and horizontal di-
rections respectively. A potentiometer was also used to measure the displacement
of the hydraulic jack that was used to apply the load.
The debonding strain (FRP loaded in direct tension) of the vertical reinforce-
ment FRP to masonry connection used here was determined from pull tests (see
previous chapter). Of the pull test specimens, specimen type ’1C’ best represen-
ted the vertical connection used in the panel tests. The debonding strain of this
specimen ranged from 7416 µε to 8963 µε. The debonding strain of the horizontal
reinforcement was determined for a range of compression values. At zero com-
pression, the debonding strain ranged from 5793 µε to 6245 µε, and at 1 MPa
compression , the debonding strain ranged from 7741 µε to 8496 µε.
4.3 Experimental results
4.3.1 Unreinforced masonry (URM) panels
The experimental load-displacement responses of the 4 URM panels are shown
in Figure 4.4. The vertical displacement measurement was the average of the ver-
tical potentiometer gauge displacements on each side of the panel. In general, all
panels behaved approximately linearly until failure.
URM-1 and URM-2, panels constructed with the same strong mortar (high
flexural tensile bond strength as measured using bond wrench tests), both failed by
diagonal cracks that developed through both brick units and mortar joints (shown
for specimen URM-1 in Figure 4.5a). Multiple cracks were observed in both speci-
mens before failure (Figure 4.5a). The ultimate loads of panels URM-1 and URM-2
were measured as 237 kN and 290 kN respectively.
URM-3 and URM-4, panels constructed with weak mortar, both failed by sli-
ding along bed joints (Figure 4.5b–Figure 4.5d). During the testing of URM-4 a
crack developed through the mortar bed joints at the top of the panel, at a load of
163 kN. The load then dropped to 143 kN (Figure 4.4). The crack is shown in Fi-
gure 4.5c. The panel should have failed along this crack but the top support shoe
restrained the section of masonry and allowed the panel to transfer more load. The

74 4. Experimental tests on FRP strengthened masonry wall panels
(a) V2 (b) V4A and V4B
(c) V2H2A and V2H2B
(d) H4A (e) H4B
Figure 4.3: Reinforcement schemes

4.3 FRP strengthened panels 75
Figure 4.4: Load-displacement response of URM panels
panel eventually failed along another sliding crack at a load of 183 kN (shown in
Figure 4.5d).
The ultimate load of panel URM-3 was 65 kN which was considerably less than
the ultimate load of URM-4. A higher ultimate load for panel URM-4, compared to
URM-3, was reasonable given that failure occurred in the top half of panel URM-
4. The flexural bond strength of URM-4 was 0.57 MPa at the top of the panel.
This bond strength was larger than the bond strength of URM-3 (0.41 MPa). The
difference in ultimate strength was, however, greater than expected. Two out of the
ten joints tested to determine the bond strength of the mortar used to construct
URM-3 (batch 5+W) broke during test setup. This indicated that the bond strength
was essentially zero. It is possible that, in panel URM-3, joints with very little to no
bond strength were present, which could have led to the very low ultimate strength
observed.
4.3.2 FRP strengthened panels
Panel V2
The load versus the vertical displacement (average of potentiometer gauge dis-
placements on each side of the panel) of panel V2 is shown in Figure 4.6. The verti-
cal potentiometers used to measure the vertical displacement of the panel reached
their travel capacities shortly into the test. To show the load displacement beha-
viour of the whole test the load versus the vertical displacement of the hydraulic
jack (that was measured using a larger potentiometer) is plotted in Figure 4.7.
The panel behaved linearly until cracks began to form at a panel vertical dis-

76 4. Experimental tests on FRP strengthened masonry wall panels
(a) Failure URM-1 (b) Failure URM-3
(c) 1st crack URM-4 (P=163 kN) (d) Failure URM-4
Figure 4.5: Failure modes of URM specimens

4.3 Panel V2 77
Figure 4.6: Load versus panel displacement V2
Figure 4.7: Load versus jack displacement V2

78 4. Experimental tests on FRP strengthened masonry wall panels
placement of 0.3 mm (load equal to 125 kN). Note that the panel would have likely
failed at this point if the panel was unreinforced. The reinforced panel did not fail,
but instead the load increased as cracking developed and the stiffness of the panel
gradually decreased. The panel attained a maximum load of 160 kN (at a panel
vertical displacement of 0.59 mm) and at this point a large diagonal shear crack
had developed through mortar joints and some brick units. This crack is shown in
Figure 4.8a and Figure 4.8b.
After the diagonal crack formed through the panel the load reduced to approxi-
mately 100 kN. The capacity of the panel remained at approximately 100 kN (va-
rying between 88 kN and 115 kN) as the top section of the panel slid relative to the
bottom section of the panel along the crack. The panel also bent (out of plane)
about the crack towards the reinforced side of the panel. The out-of-plane displa-
cement (shown in Figure 4.8c) occurred during the test because the reinforcement
was applied to one side only. At the later stages of the test, after a large amount
of vertical displacement, the load gradually reduced to 60 kN. The load reduction
was likely caused by the large out-of-plane displacement. To avoid a potentially
dangerous out-of-plane failure the test was stopped at this stage.
A large amount of bending in the plane of the panel occurred in the FRP across
the shear cracks during the test (shown at the end of the test in Figure 4.9). For this
panel the shear transferred via dowel action (at this stage of damage) was likely to
be very small because the FRP, with small cross sectional area was bent over a large
length and about its weak axis. Given that the dowel strength would have been very
small the main mechanism of the reinforcement would have been the restraint of
dilation. The restraint of dilation increased the resistance to frictional sliding.
Plots of the tensile strain in the FRP at strain gauge locations versus the pa-
nel vertical displacement (measured by potentiometers within the panel) for pa-
nel V2 are shown in Figure 4.10 (for strain gauge locations refer to Figure 4.8b).
In Figure 4.8b gauges which were damaged prior to testing and yielded no data
are labelled with a lighter font. When the first diagonal crack formed (at a vertical
displacement of 0.3 mm) the tensile strain measured at strain gauges close to the
crack (SG3, SG5, SG11 and SG12) increased significantly. The FRP strains were hi-
ghest in the vicinity of the crack and reduced further away from the crack as the
load was transferred to the masonry. The tensile strain in the FRP strips increased
as the vertical displacement of the panel increased and cracking developed.
Plots of the tensile strain in the FRP at strain gauge locations versus the vertical
displacement of the hydraulic jack are shown in Figure 4.11. The figure shows that
strains in the FRP reached a maximum value after a significant amount of displa-
cement. The maximum strain recorded in the FRP strips was 3100 µε (in strip 1,
SG3) and was significantly lower than the FRP strain required to cause debonding
(range = 7416 µε - 8963 µε) or rupture (12,000 µε). Debonding or rupture of ei-
ther strip was not observed during the test. At the later stages of the test, the FRP
strains started to reduce as the load carrying capacity of the panel also reduced.

4.3 Panel V2 79
(a) Crack pattern (b) Crack schematic
(c) Out-of-plane bending
Figure 4.8: Test observations for panel V2
(a) Strip 1 (b) Strip 2
Figure 4.9: FRP bending across shear crack in panel V2

80 4. Experimental tests on FRP strengthened masonry wall panels
(a) Strip 1
(b) Strip 2
Figure 4.10: Strain in FRP strips vs panel vertical displacement V2

4.3 Panel V2 81
(a) Strip 1
(b) Strip 2
Figure 4.11: Strain in FRP strips vs jack vertical displacement V2

82 4. Experimental tests on FRP strengthened masonry wall panels
Panels V4A & V4B
The load-vertical displacement responses of panels V4A and V4B are shown in
Figure 4.12. For these tests (and the following tests) larger range potentiometers
were used to capture the full displacement. Both panels behaved approximately
linearly until a diagonal crack formed both through mortar joints and some brick
units. The diagonal crack is shown on the front side of panel V4A in Figure 4.13.
In Figure 4.13 the crack pattern and FRP strips are highlighted with black lines.
The first diagonal crack was observed in both panels at a vertical displacement
of 0.4 mm, with corresponding loads of 172 kN in V4A and 140 kN in V4B. The
FRP reinforcement restrained the opening of the diagonal crack, and prevented
immediate panel failure.
Figure 4.12: Load-displacement response of V4A and V4B
Both panels deformed under a reasonably constant load of approximately 200
kN, which was reached soon after the first cracks developed in the panel. The ul-
timate load of panel V4A was 210 kN, and the ultimate load of panel V4B was 205
kN. In both panels, more diagonal cracks developed and opening of and sliding
along the diagonal cracks occurred as the vertical displacement increased. During
the testing of panel V4A most sliding along the diagonal crack, next to strip 3, was
prevented, and instead cracks were forced to develop along the inside of strip 3
(between strips 3 and 4). Cracking along the inside of strip 3 started at the inter-
section of the diagonal crack and the FRP strip and progressed downwards. The
cracking developed through the thickness of the panel and is shown at failure in
Figure 4.14 on the front and back face of the panel. During the testing of panel
V4B sliding was not prevented along cracks intercepted by FRP, instead restrained

4.3 Panels V4A & V4B 83
Figure 4.13: Diagonal crack V4A (front side)
sliding occurred with local bending of the FRP. Most deformation of V4B was by
sliding along the major diagonal crack (seen at failure in Figure 4.15 on the front
and back face of the panel).
Failure of both panels was caused by debonding of the FRP strip from the ma-
sonry at the bottom of FRP strip 3. Debonding was caused by the opening of a
diagonal crack that intercepted strip 3 two brick courses up from the bottom of
the panel and, for panel V4A, was also caused by cracking along the inside of strip
3. After failure, debonding was also observed on the back face of the panels at the
top of strip 1 (V4A) and the bottom of strip 2 (V4B). Debonding can be seen in
Figure 4.14 and Figure 4.15.
In panel V4A some bending of FRP strip 4 (plus local damage of the masonry)
was observed near SG23 (shown in Figure 4.16a). The behaviour of strip 1, on the
back face of the panel, was not monitored during the test. At the end of the test
FRP strip 1 had debonded from the panel, and therefore it was unknown whether
strip bending occurred across a shear crack. Bending was not observed in FRP
strips 2 or 3, because of the presence of cracking along the edge of strip 3.
In panel V4B a large amount of bending occurred in all FRP strips across the
shear cracks during the test (as previously mentioned, and shown for strip 3 in
Figure 4.16b). Similar to panel V2, the shear transferred via dowel action (at this
stage of damage) was likely to be very small because the FRP, with small cross sec-
tional area was bent over a large length (approximately the height of one brick)

84 4. Experimental tests on FRP strengthened masonry wall panels
(a) Failure (front face) (b) Crack schematic at failure (front face)
(c) Failure (back face) (d) Crack schematic at failure (back face)
Figure 4.14: V4A failure

4.3 Panels V4A & V4B 85
(a) Failure (front face) (b) Crack schematic at failure (front face)
(c) Failure (back face) (d) Crack schematic at failure (back face)
Figure 4.15: V4B Failure

86 4. Experimental tests on FRP strengthened masonry wall panels
and about its weak axis.
(a) Panel V4A strip 4 (b) Panel V4B strip 3
Figure 4.16: FRP bending across shear cracks in panels V4A and V4B
Plots of tensile strain in the FRP at strain gauge locations versus vertical dis-
placement for panel V4A are shown in Figure 4.17 to Figure 4.20 (for strain gauge
locations refer to Figure 4.14b and Figure 4.14d). In Figure 4.14b and Figure 4.14d
damaged gauges are shown in a lighter font. When the first diagonal crack for-
med (at a vertical displacement of 0.4 mm) the tensile strain measured at strain
gauges close to the crack (SG2, SG3, SG8 and SG16) increased significantly. The
FRP strains were highest in the vicinity of the crack and reduced further away from
the crack as the load was transferred to the masonry. The tensile strain in the FRP
strips increased as the vertical displacement of the panel increased and cracking
developed. The tensile strain recorded at SG16 (strip 3) reduced after 4 mm vertical
displacement (and a maximum tensile strain of 3350 µε) due to cracking along the
inside of the strip. Cracking along the inside edge of strip 3 also limited further de-
formation on the outside of the panel (past strip 3), indicated by constant strain in
strip 2 at the onset of the cracking. The tensile strain increased in SG17 and SG18
because of the opening of a diagonal crack intercepting the FRP reinforcement 2
courses up from the base of the panel. A maximum strain of approximately 4000
µε was recorded before the bottom of FRP strip 3 debonded from the panel. This
was approximately half the maximum debonding strain recorded in pull tests on
the same type of FRP-to-masonry connection (debonding strain ranged from 7416
µε to 8963 µε). The bond was reduced by cracking along the edge of the FRP strip.
Plots of strain in the FRP versus vertical displacement for panel V4B are shown
in Figure 4.21 to Figure 4.24. Refer to Figure 4.15b and Figure 4.15d for the location
of the strain gauges. In Figure 4.15b and Figure 4.15d damaged gauges are shown
in a lighter font. Similar to V4A, the tensile strain in the FRP strips increased when
diagonal cracks formed. FRP strains were highest in the vicinity of the crack and
reduced further away from the crack as the load was transferred from the FRP into

4.3 Panels V4A & V4B 87
Figure 4.17: FRP strain vs in-plane vertical displacement (Panel V4A - Strip 1)
Figure 4.18: FRP strain vs in-plane vertical displacement (Panel V4A - Strip 2)

88 4. Experimental tests on FRP strengthened masonry wall panels
Figure 4.19: FRP strain vs in-plane vertical displacement (Panel V4A - Strip 3)
Figure 4.20: FRP strain vs in-plane vertical displacement (Panel V4A - Strip 4)

4.3 Panels H4A & H4B 89
the masonry. The first major increase in strain was recorded at the top of the panel
in SG23 and SG24 (in strip 4) at a vertical displacement of 0.2 mm. This was sooner
than increases recorded at the bottom of the panel (strains recorded at SG16 and
SG17 increased at 0.4 mm). This indicates that cracking formed at the top of the
panel first, which was expected as panel V4B was constructed with weaker joints
at the top of the panel. The maximum strain recorded in strip 3 before debonding
was 6242 µε. This was higher than the maximum strain recorded in panel V4A (be-
fore debonding), but was still less than the maximum debonding strain recorded
in pull tests. In both panels debonding was premature as it occurred at FRP tensile
strains that were lower than expected.
Figure 4.21: FRP strain vs in-plane vertical displacement (Panel V4B - Strip 1)
Panels H4A & H4B
The load-vertical displacement responses of panels H4A and H4B are shown in
Figure 4.25. H4A behaved linearly until the crack shown in Figure 4.26a started to
develop at a vertical displacement of approximately 0.5 mm (and a corresponding
load of 251 kN). The ultimate load of the panel, which was equal to 264 kN, was
reached shortly after, at a vertical displacement of 0.62 mm.
After the crack (shown in Figure 4.26a) formed, the horizontal FRP strip that
bridged the crack (strip 1) prevented the unsupported section of the masonry (out-
side of the crack) from falling off the panel (shown in Figure 4.26b). The cross
section of the compressive strut within the panel that supported the load redu-
ced (and hence the load carrying capacity of the panel reduced). More cracking

90 4. Experimental tests on FRP strengthened masonry wall panels
Figure 4.22: FRP strain vs in-plane vertical displacement (Panel V4B - Strip 2)
Figure 4.23: FRP strain vs in-plane vertical displacement (Panel V4B - Strip 3)

4.3 Panels H4A & H4B 91
Figure 4.24: FRP strain vs in-plane vertical displacement (Panel V4B - Strip 4)
Figure 4.25: Load-displacement response of H4A and H4B

92 4. Experimental tests on FRP strengthened masonry wall panels
(a) First crack in panel (front face) (b) FRP strip 1 (highlighted) holding onto sepa-
rated masonry section (back face)
(c) Cracking at end of test (d) Sliding crack in bed joints possibly supported
by timber wedge
Figure 4.26: H4A test observations

4.3 Panels H4A & H4B 93
(shown in Figure 4.26c) at a vertical displacement of approximately 2 mm redu-
ced the compressive strut and load further. At this point cracking along the bed
joint above the bottom support was also observed (shown in Figure 4.26d). The
bed joint crack should have caused the panel to fail by sliding immediately after
it formed but a timber wedge used to align the panel vertically during setup may
have provided enough capacity to prevent sliding at a low load.
The cracks that developed in panel H4A were intersected only by FRP strip 1
as shown in the crack schematic (Figure 4.27a). Note that in the crack schematic,
damaged gauges are not labelled, and FRP strips and gauges on the back side of
the panel are drawn in a lighter font. When the crack opened at a vertical displa-
cement of 0.5 mm the tensile strain at SG2 (closest to the crack) increased signi-
ficantly (shown in the plot of strain vs. vertical displacement - Figure 4.27b). The
strain in SG2 reached a value of 8900 µε before the test was stopped. This strain
value was close to the highest debonding strain observed in pull tests on horizontal
NSM FRP reinforcement (with 1 MPa of precompression = 8496 µε). Debonding,
however, was not observed in the test. The high value of strain recorded at SG2
was likely caused by cracking directly over SG2.
(a) Crack schematic (b) Strain in strip 1
Figure 4.27: Crack schematic and FRP strains vs vertical displacement in strip 1
(panel H4A)
Apart from the major cracking shown, no other cracks developed in the rest
of panel H4A and FRP strips 2, 3 and 4 remained inactive (no tensile strains were
recorded). As strip 1 was only effective in preventing the broken section of the
panel from falling off and did not contribute to the load carrying capacity of the
panel, it is likely that the load displacement response of the panel would have been
similar without the horizontal reinforcement.
Panel H4B behaved elastically until a diagonal crack (shown in Figure 4.28a
and in the crack schematic in Figure 4.28c) developed at a vertical displacement of
0.4 mm (load = 183 kN). Note that in the crack schematic the damaged gauges are
not labelled, and FRP strips and gauges on the back side of the panel are drawn
in a lighter font. The FRP restrained the opening of the diagonal crack and the

94 4. Experimental tests on FRP strengthened masonry wall panels
panel was able to deform further (to a vertical displacement of approximately 0.78
mm). At this point the panel failed by bed joint sliding at the top of the panel
above the horizontal strengthening (shown in Figure 4.28b and Figure 4.28c). The
maximum load of panel H4B was 185 kN, and was much lower than H4A because
of the weaker mortar joints used to construct the top half of the panel (Table 4.1).
Plots of strain in the FRP (at strain gauge locations) versus vertical displace-
ment are shown in Figure 4.29 to Figure 4.32 for panel H4B. In general all the FRP
strips activated once the diagonal crack (observed during the test) developed at a
vertical displacement of 0.4 mm (and in the vicinity of the diagonal crack). The
FRP strains increased until the panel failed. The maximum strain recorded before
failure was 1600 µε. No debonding cracks were observed adjacent to any of the
horizontal strips.
Panel V2H2A & V2H2B
The load-vertical displacement responses of V2H2A and V2H2B are shown in
Figure 4.33. Similar to other panels, the FRP reinforcement in panels V2H2A and
V2H2B prevented failure of the panel occurring upon first cracking. Both panels
behaved approximately linearly until the first diagonal cracks formed, and FRP in
the vicinity of the cracks was activated. Diagonal cracks were first observed in the
panels at a vertical displacement of 0.48 mm (load = 177 kN) for V2H2A and 0.4
mm (load = 120 kN) for V2H2B. The maximum loads of both specimens were rea-
ched shortly afterwards, and they were 206 kN for V2H2A and 158 kN for V2H2B.
The crack patterns and failure modes are shown in Figure 4.34 for panel V2H2A
and Figure 4.35 for panel V2H2B. In both panels diagonal cracking, through mortar
joints and brick units, spread throughout the panel as the vertical displacement in-
creased. The horizontal reinforcement on the back side of the panels intercepted
the diagonal cracking and forced further cracking to develop through bed joints,
between and outside of the horizontally reinforced brick courses. In both panels,
two large cracks developed; one crack below strip 1 and one crack above strip 2.
The sections of the panels separated by the cracks (outside the loaded diagonal)
rotated (about the crack) towards the front side of the panels. The cracks ope-
ned on the back side of the panels and were held together on the front side of
the panels by the vertical reinforcement. The out-of-plane deformation is shown
in Figure 4.36. Without the vertical reinforcement resisting crack opening on the
front side of the panels, the sections, separated from the crack, would have likely
fallen off and the panel would have failed completely. The masonry compression
strut was reduced by separation of sections undergoing out-of-plane deformation,
and hence the load carrying capacity of the panels was reduced. The cracking that
contributed to the out-of-plane bending spread throughout the panel during the
test and reduced the load carrying capacity further.
In both tests the bottom of strip 3 debonded from the panel. This occurred at a
vertical displacement of 12 mm for V2H2A and 10 mm for V2H2B. Opening of the
large crack below horizontal reinforcement strip 1 caused debonding. It is likely
that out-of-plane bending about this crack may have also influenced debonding.

4.3 Panel V2H2A & V2H2B 95
(a) Diagonal crack (b) Sliding failure plane along bed joints at top of
panel
(c) Crack schematic (major cracks)
Figure 4.28: Test observations H4B

96 4. Experimental tests on FRP strengthened masonry wall panels
Figure 4.29: FRP strain vs in-plane vertical displacement (Panel H4B - Strip 1)
Figure 4.30: FRP strain vs in-plane vertical displacement (Panel H4B - Strip 2)

4.3 Panel V2H2A & V2H2B 97
Figure 4.31: FRP strain vs in-plane vertical displacement (Panel H4B - Strip 3)
Figure 4.32: FRP strain vs in-plane vertical displacement (Panel H4B - Strip 4)
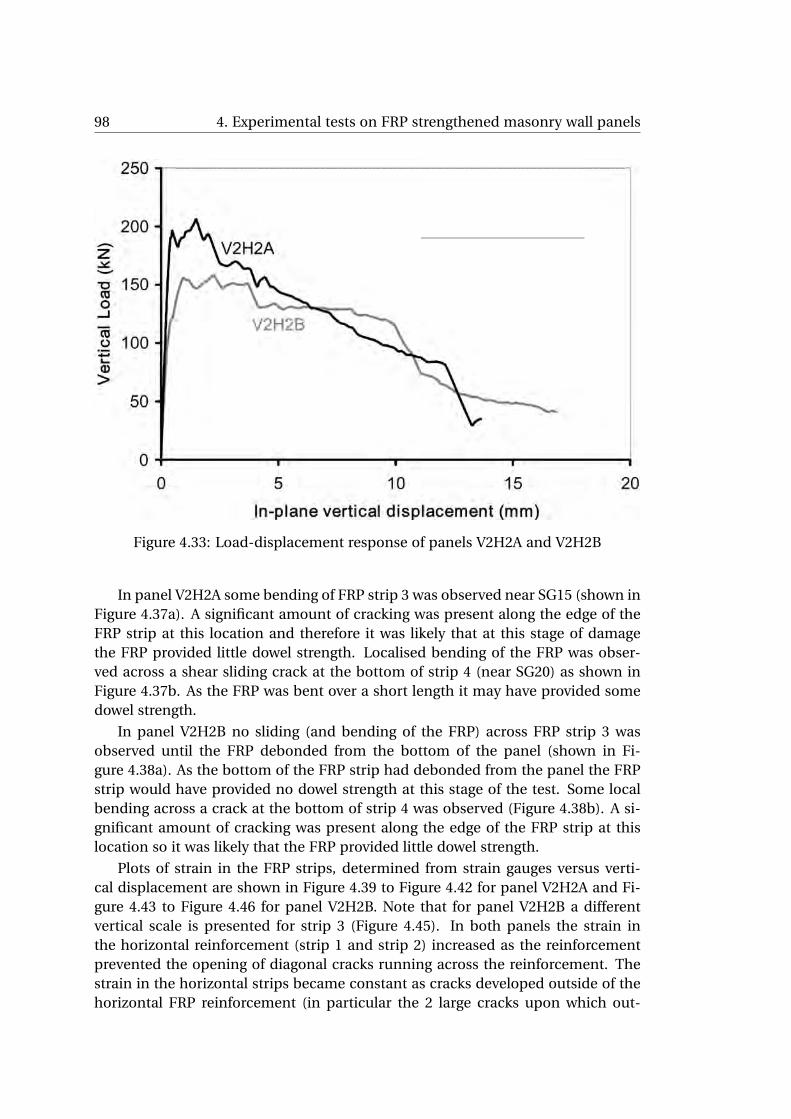
98 4. Experimental tests on FRP strengthened masonry wall panels
Figure 4.33: Load-displacement response of panels V2H2A and V2H2B
In panel V2H2A some bending of FRP strip 3 was observed near SG15 (shown in
Figure 4.37a). A significant amount of cracking was present along the edge of the
FRP strip at this location and therefore it was likely that at this stage of damage
the FRP provided little dowel strength. Localised bending of the FRP was obser-
ved across a shear sliding crack at the bottom of strip 4 (near SG20) as shown in
Figure 4.37b. As the FRP was bent over a short length it may have provided some
dowel strength.
In panel V2H2B no sliding (and bending of the FRP) across FRP strip 3 was
observed until the FRP debonded from the bottom of the panel (shown in Fi-
gure 4.38a). As the bottom of the FRP strip had debonded from the panel the FRP
strip would have provided no dowel strength at this stage of the test. Some local
bending across a crack at the bottom of strip 4 was observed (Figure 4.38b). A si-
gnificant amount of cracking was present along the edge of the FRP strip at this
location so it was likely that the FRP provided little dowel strength.
Plots of strain in the FRP strips, determined from strain gauges versus verti-
cal displacement are shown in Figure 4.39 to Figure 4.42 for panel V2H2A and Fi-
gure 4.43 to Figure 4.46 for panel V2H2B. Note that for panel V2H2B a different
vertical scale is presented for strip 3 (Figure 4.45). In both panels the strain in
the horizontal reinforcement (strip 1 and strip 2) increased as the reinforcement
prevented the opening of diagonal cracks running across the reinforcement. The
strain in the horizontal strips became constant as cracks developed outside of the
horizontal FRP reinforcement (in particular the 2 large cracks upon which out-

4.3 Panel V2H2A & V2H2B 99
(a) Failure (front face) (b) Crack schematic at failure (front face)
(c) Failure (back face) (d) Crack schematic at failure (back face)
Figure 4.34: V2H2A Failure

100 4. Experimental tests on FRP strengthened masonry wall panels
(a) Failure (front face) (b) Crack schematic at failure (front face)
(c) Failure (back face) (d) Crack schematic at failure (back face)
Figure 4.35: V2H2B Failure

4.3 Panel V2H2A & V2H2B 101
(a) V2H2A (b) V2H2B
Figure 4.36: Out-of-plane twisting
(a) Strip 3 (b) Strip 4
Figure 4.37: FRP bending across shear cracks in panel V2H2A

102 4. Experimental tests on FRP strengthened masonry wall panels
(a) Strip 3 (b) Strip 4
Figure 4.38: FRP bending across shear cracks in panel V2H2B
of-plane deformation occurred). The maximum strain reached in the horizontal
reinforcement was approximately 3800 µε. No debonding cracks were observed in
the brick adjacent to any horizontal FRP strip.
The strain in the vertical reinforcement (strip 3 and strip 4) increased (at a
similar rate to the horizontal reinforcement) as the reinforcement prevented the
opening of diagonal cracks running across the reinforcement. In panel V2H2A the
strain reduced in the vertical strips because of the formation of cracks along the
inside of the FRP strips (similar to V4A). At the end of the test the strains in strip
3 rapidly reduced to zero when the FRP debonded from the panel. For V2H2A the
maximum strain recorded in strip 3 before debonding was approximately 3800 µε
and was similar to strains recorded in vertical strips in panel V4A where cracking
along the inside edge of the strip was observed. In panel V2H2B the strain in verti-
cal reinforcement strip 3 increased until the FRP, between SG18 and the end of the
strip, debonded from the panel. For V2H2B the maximum strain before debonding
in strip 3 (at SG18) was 9850 µε and was slightly higher than the debonding strain
observed in pull tests on similar joints (ranged from 7416 µε to 8963 µε). Pull tests
are known to be lower bound (Oehlers and Seracino, 2004), so it was expected that
the FRP strains in the panel specimens would be higher (due to close-spaced cra-
cking and also bending).
4.4 Comparisons between test specimens
4.4.1 Load-displacement behaviour
The load displacement behaviours of all the panels tested are compared in Fi-
gure 4.47. The panels with the symmetrical arrangement of vertical reinforcement
(2 vertical strips on each side of the panel), V4A and V4B, performed the best. Pa-
nels with 2 vertical strips on one side, and 2 horizontal strips on the other side,
V2H2A and V2H2B, performed second best. They were worse than panels V4A and
V4B because the major cracks that developed at the top and bottom of the panel

4.4 Load-displacement behaviour 103
Figure 4.39: FRP strain vs in-plane vertical displacement (Panel V2H2A - Strip 1)
(horizontal strip)
Figure 4.40: FRP strain vs in-plane vertical displacement (Panel V2H2A - Strip 2)
(horizontal strip)

104 4. Experimental tests on FRP strengthened masonry wall panels
Figure 4.41: FRP strain vs in-plane vertical displacement (Panel V2H2A - Strip 3)
(vertical strip)
Figure 4.42: FRP strain vs in-plane vertical displacement (Panel V2H2A - Strip 4)
(vertical strip)
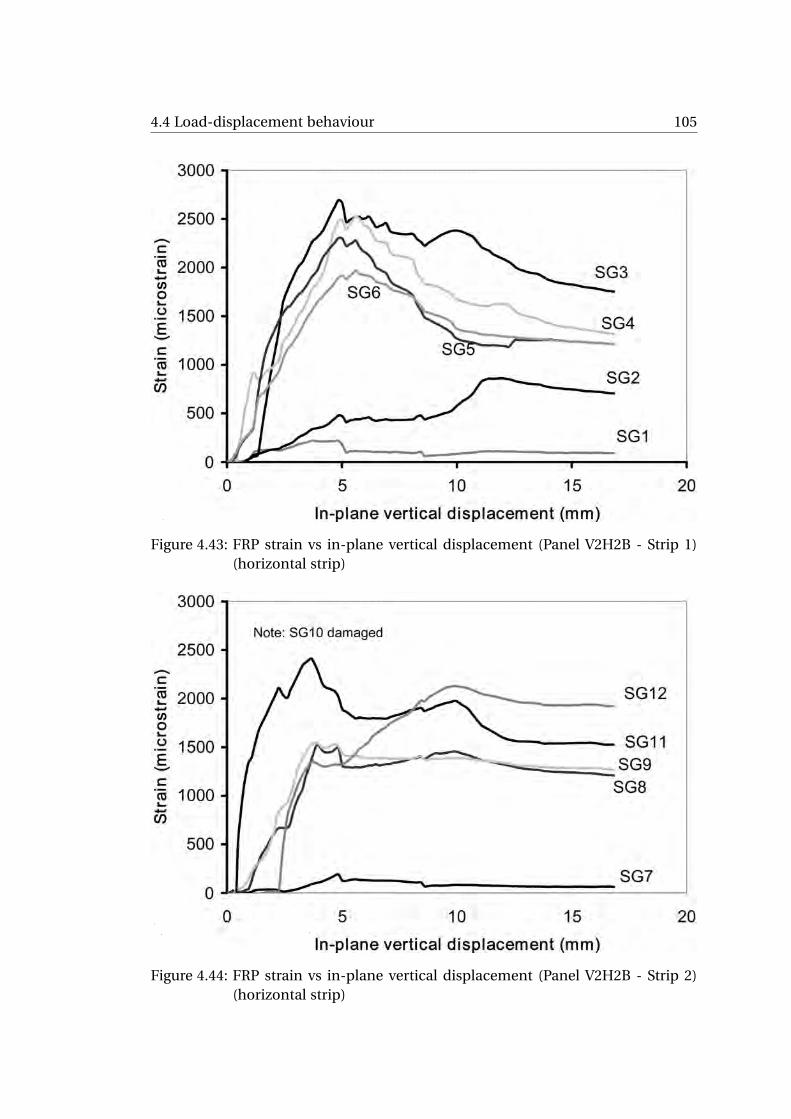
4.4 Load-displacement behaviour 105
Figure 4.43: FRP strain vs in-plane vertical displacement (Panel V2H2B - Strip 1)
(horizontal strip)
Figure 4.44: FRP strain vs in-plane vertical displacement (Panel V2H2B - Strip 2)
(horizontal strip)

106 4. Experimental tests on FRP strengthened masonry wall panels
Figure 4.45: FRP strain vs in-plane vertical displacement (Panel V2H2B - Strip 3)
(vertical strip)
Figure 4.46: FRP strain vs in-plane vertical displacement (Panel V2H2B - Strip 4)
(vertical strip)

4.4 Load increase due to strengthening 107
were only crossed by 2 vertical reinforcement strips (compared to 4 in V4A and
V4B). Also, out-of-plane twisting occurred about the major crack faces and redu-
ced the load capacity of the panels because the 2 vertical strips were on one side
of the panel only. The behaviour of panels V2H2A and V2H2B was better than V2
(which performed third best). The horizontal reinforcement on one side of the pa-
nel restrained the large out-of-plane displacement about the main diagonal crack
that occurred in panel V2. panels reinforced with only horizontal strips performed
the worst. The horizontal reinforcement in panel H4A did not contribute to the
load carrying capacity of the panel. In panel H4B failure occurred along an uns-
trengthened joint, after only a relatively small increase in the strength and ductility
of the panel.
In panel V4A the vertical FRP reinforcement reduced the development of dia-
gonal cracks across the FRP, and instead forced the cracks to develop along the in-
side edge of the FRP strip (facing the middle of the panel) through the brick. Un-
like V4A, in the similarly reinforced panel V4B, diagonal cracks developed across
the FRP strips and sliding deformation occurred. The difference in behaviour was
likely due to different mortar strengths between each panel, indicated in Table 4.1,
and also indicated by the initial stiffness and load at first crack of either panel. In
the stronger panel, V4A, the resistance to sliding was larger and made cracks de-
velop through the brick. This type of cracking created a failure plane (in V4A) and
reduced the bond between the masonry and one side of the FRP. This cracking re-
sulted in a reduced displacement capacity for panel V4A compared to panel V4B
(where this type of cracking was less severe).
4.4.2 Load increase due to strengthening
The ultimate loads of all panels are presented in Table 4.2. Unexpectedly, some
of the reinforced panels had lower ultimate loads than the unreinforced panels.
The deviations in the bond strength and the statistical variations in the material
properties were responsible for this result. Because of the large variation in ma-
terial properties, rather than compare the ultimate loads of the reinforced tests
with the URM tests, a less rigorous approach was used to estimate the increase in
strength due to the FRP strengthening. The load when the first diagonal crack de-
veloped in the reinforced panel was assumed equal to the unreinforced strength
of the panel. The load at first cracking was determined as the load when the FRP
strip strains increased significantly from zero. The assumption is shown to be rea-
sonable later in Chapter 5, Section 5.6.1 using the finite element model. The finite
element model also confirmed that the FRP increased the ultimate load.
The assumed URM load was compared to the ultimate load to estimate the
percentage load increase provided by the reinforcement scheme Table 4.2. Using 4
vertical FRP strips was the most effective reinforcement scheme for increasing the
ultimate load of the panel. The largest load increase was 46% for panel V4B.

108 4. Experimental tests on FRP strengthened masonry wall panels
Figure 4.47: Load-displacement responses of all tests
Table 4.2: Contribution of reinforcement to load carrying capacity of masonry pa-
nels
Specimen Approximate load at first crack (kN) Ultimate load (kN) % load increase
(Approximate URM load)
URM-1 237 - -
URM-2 290 - -
URM-3 65 - -
URM-4 183 - -
V2 125 160 28
V4A 172 210 22
V4B 140 205 46
H4A 251 264 5
H4B 183 185 1
V2H2A 177 206 16
V2H2B 120 158 32
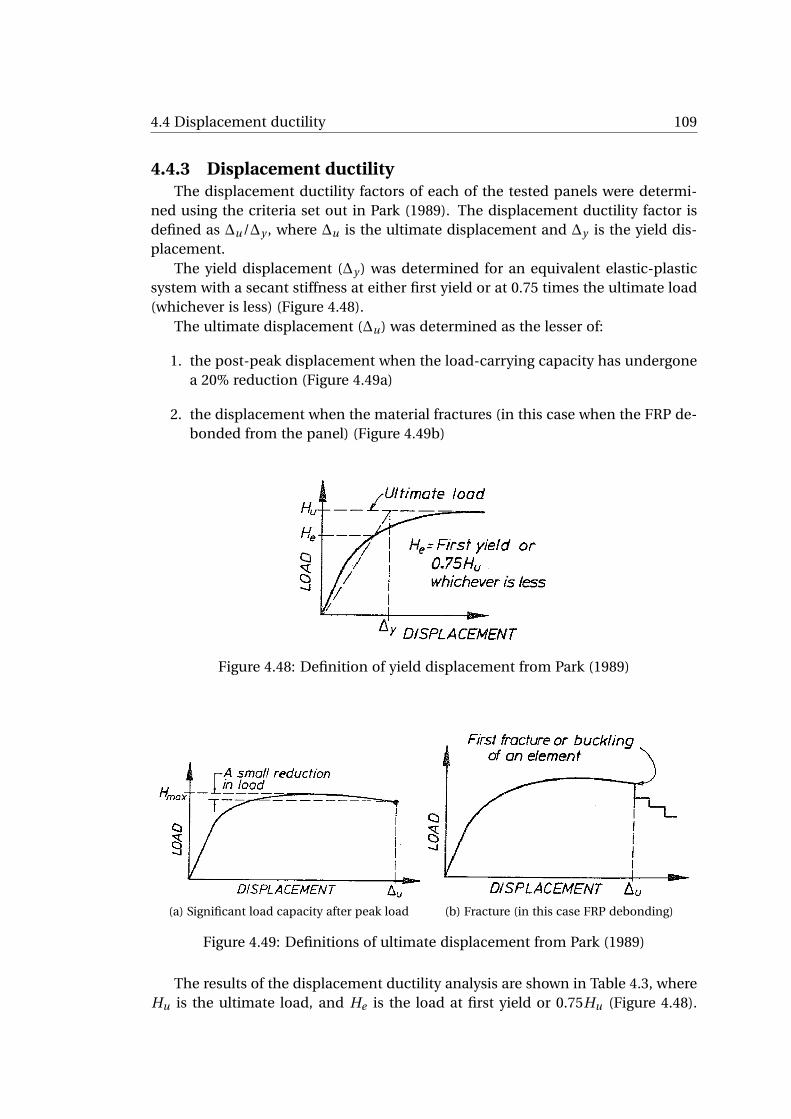
4.4 Displacement ductility 109
4.4.3 Displacement ductilityThe displacement ductility factors of each of the tested panels were determi-
ned using the criteria set out in Park (1989). The displacement ductility factor is
defined as ∆u/∆y , where ∆u is the ultimate displacement and ∆y is the yield dis-
placement.
The yield displacement (∆y ) was determined for an equivalent elastic-plastic
system with a secant stiffness at either first yield or at 0.75 times the ultimate load
(whichever is less) (Figure 4.48).
The ultimate displacement (∆u) was determined as the lesser of:
1. the post-peak displacement when the load-carrying capacity has undergone
a 20% reduction (Figure 4.49a)
2. the displacement when the material fractures (in this case when the FRP de-
bonded from the panel) (Figure 4.49b)
Figure 4.48: Definition of yield displacement from Park (1989)
(a) Significant load capacity after peak load (b) Fracture (in this case FRP debonding)
Figure 4.49: Definitions of ultimate displacement from Park (1989)
The results of the displacement ductility analysis are shown in Table 4.3, where
Hu is the ultimate load, and He is the load at first yield or 0.75Hu (Figure 4.48).

110 4. Experimental tests on FRP strengthened masonry wall panels
The yield and ultimate displacements used to determine the displacement ducti-
lity are illustrated for V4A in Figure 4.50 as an example. As expected, the panels
strengthened with two vertical strips on both sides of the panel had the largest
ductility factors. Also, the unreinforced specimens had ductility factors close to
1 indicating little ductility. Note that the wall panels have different boundary and
loading conditions to a wall in a building, so the determination of a ductility factor
may be premature. For instance, the ductility factor of an unreinforced wall failing
by sliding along a single horizontal bed joint would be much larger than the duc-
tility factor of an unreinforced panel tested in diagonal tension and failing in the
same way.
Table 4.3: Displacement ductility factor analysis
Specimen Hu (kN) He (kN) ∆y (mm) ∆u (mm) ∆u/∆y
URM-1 237 177.8 0.36 0.45 1.25
URM-2 290 217.5 0.52 0.58 1.11
URM-3 65 48.8 0.16 0.20 1.21
URM-4 183 137.3 0.30 0.38 1.28
V2 160 120.0 0.35 1.41 4.06
V4A 210 157.5 0.45 7.65 16.96
V4B 205 140.0 0.60 12.76 21.16
H4A 264 198.0 0.43 0.88 2.03
H4B 185 138.8 0.37 0.78 2.08
V2H2A 206 154.5 0.38 3.52 9.39
V2H2B 158 118.5 0.52 8.23 15.82
4.5 Comparison of results with similar tests from the
literatureThe results of the current tests were qualitatively compared with the results of
tests performed by Tinazzi and Nanni (2000). Tinazzi and Nanni (2000) streng-
thened URM panels using structurally repointed (SR) and NSM GFRP bars. The
masonry panels they tested were 600 mm x 600 mm (half the size of the panels
tested in the current study). They also used the Diagonal Tension Shear Test setup
to test the specimens.
Tinazzi and Nanni (2000) constructed their wall panels using cored clay brick
units with nominal dimensions 190 mm long, 90 mm wide, and 57 mm high. The
flexural tensile strengths of the bricks used ranged between 3.7 MPa and 4.9 MPa.
They used type N mortar (1:1:6). The flexural tensile bond strength of the mortar-
brick interface was 0.56 MPa. This bond strength is within the range of bond
strengths of the panels tested in the current study. The GFRP bars used had a
diameter of 6.4 mm and elastic modulus of approximately 50,000 MPa.
The specimens that were most similar to those in the current study are consi-
dered for comparison. The specimens are shown in Figure 4.51 and include:

4.5 Comparison of results with similar tests from the literature 111
Figure 4.50: Load-displacement graph of V4A showing yield and ultimate displace-
ments
• SR bars in every second bed joint on one side of the panel (Figure 4.51a)
• SR bars in every bed joint on one side of the panel (Figure 4.51b)
• Vertical NSM bars on one side of the panel (Figure 4.51c)
• SR bars in every bed joint on one side of the panel, vertical NSM bars on the
other side (Figure 4.51d)
In their investigation the URM control specimens failed in a brittle manner by
sliding along a diagonal crack that developed through the mortar joints. The ave-
rage strength of the URM specimens (2 tested) was 71 kN.
In the panel reinforced with SR bars in every second bed joint (Figure 4.51a),
failure occurred by sliding along an un-strengthened joint. This behaviour was
similar to panel H4B from the current investigation. In both Tinazzi and Nanni
(2000)’s panel and H4B the increase in strength due to strengthening was negli-
gible.
In the panel reinforced with SR bars in every bed joint (Figure 4.51b), sliding
along the mortar bed joints still occurred, but at a higher load. The increase in load
was 45% over the URM specimens. This strengthening method was effective, but
it seems cumbersome to insert reinforcement into every bed joint in large walls.
Tinazzi and Nanni used vertical NSM bars to prevent sliding failure along the
mortar joints (Figure 4.51c). They expected that dowel action of the bars would
help resist sliding. They observed the failure mode of the panel was by debonding

112 4. Experimental tests on FRP strengthened masonry wall panels
Figure 4.51: Tinazzi and Nanni (2000) specimens used for comparison

4.6 Summary and conclusions 113
of the FRP bars from the masonry. Debonding was caused by shear failure along
the masonry-epoxy interface, and was not related to dowel action. They did not
describe the mechanism in any further detail. The test results of this specimen
are comparable to the results of panel V2 from the current investigation. It seems
that the reinforcement mechanism was similar, with the FRP acting in tension to
restrain sliding. The crack patterns in both panels were also similar. In both panels
a large dominant crack developed through the panel, along the loaded diagonal.
Out-of-plane bending also occurred about this crack (with bending towards the
reinforced side).
The panel shown in Figure 4.51d was reinforced in a similar way to panels
V2H2A and V2H2B. Similar to panels V2H2A and V2H2B, the reinforcement allo-
wed a large amount of cracking to develop within the panel. The failure mode of
the panel shown in Figure 4.51d was not explicitly stated. It is likely that the large
amount of cracking and degradation was responsible for failure. Unlike the pa-
nels from the current study (V2H2A and V2H2B), Tinazzi and Nanni’s panel did
not bend out of the plane of the panel. This was likely because in their panels the
reinforcement was distributed more evenly across the surface of the panel.
Tinazzi and Nanni (2000) did not test a panel with vertical reinforcement ap-
plied to both sides of the panel. Therefore no test results were available to compare
with V4A and V4B.
4.6 Summary and conclusionsFour unreinforced masonry (URM) panels and seven panels strengthened with
near-surface mounted (NSM) fibre reinforced polymer (FRP) strips were tested
using the Diagonal Tension/Shear Test. The tests were conducted to investigate
the in-plane shear behaviour of NSM FRP strengthened masonry. Four different
reinforcement schemes were used, and included: reinforcing one side of the pa-
nel with 2 vertical strips; reinforcing each side of the panel with 2 vertical strips;
reinforcing each side of the panel with 2 horizontal strips; and reinforcing one side
of the panel with 2 vertical strips and reinforcing the other side with 2 horizontal
strips.
The URM panels failed in a brittle manner by either sliding along bed joints
(panels with weak mortar) or diagonal cracking through brick units and mortar
joints (panels with strong mortar). The FRP reinforcement prevented the URM
failure modes, increased the ultimate load and ductility of the panels, and also
increased the amount of cracks that developed in the panels. The vertical rein-
forcement prevented URM sliding failure by restraining the opening of the sliding
cracks that developed through the mortar bed joints. It was also likely (in some
cases) the vertical reinforcement provided some dowel action across the sliding
joint. The horizontal reinforcement restrained the opening of diagonal cracks that
developed through the brick units and the mortar joints.
The high variability of the material properties were a problem for the URM pa-
nels and it may be worth testing more panels in the future. The masonry varia-
bility was not such a problem for the reinforced panels, as the results were fairly

114 4. Experimental tests on FRP strengthened masonry wall panels
consistent both in terms of load-displacement behaviour and failure modes. The
results could be further improved by testing more than two repetitions per each
type of specimen.
The non-symmetrical reinforcement schemes caused out-of-plane deforma-
tion and therefore should be avoided (if possible). In some cases in practice there
may, however, be no choice. The out-of-plane behaviour may have been exagge-
rated by the test setup. In a real wall additional restraint would be provided along
the top and bottom edges (instead of only at the corners), which may reduce out-
of-plane twisting.
Debonding occurred in the vertical reinforcement when used (except panel
V2). It started at the intersection of the diagonal cracks and the FRP and propaga-
ted away from the crack towards the ends of the strip. Debonding cracks develo-
ped within the brick and were similar to the debonding cracks that were observed
in the pull tests. Complete debonding of the FRP strip from the masonry generally
caused failure of the panel. The maximum debonding strains in panels V4A, V4B,
V2H2A (3986 µε, 6242 µε, 3770 µε, respectively) were lower than expected. It was
expected that the debonding strain would be at least 7416 µε - 8963 µε (maximum
debonding strain from pull tests on a similar FRP-to-masonry connection). Cra-
cking along the edge of the FRP strip reduced the bond and hence the maximum
strains in the strips. The maximum debonding strain in panel V2H2B (9848 µε)
was similar to the pull test debonding strain.
Dowel action of the vertical reinforcement could not be directly measured in
the tests. In many of the panels, however, significant bending of the FRP occurred
suggesting that little dowel strength was contributed. This needs to be confirmed
with a finite element model. Note that the most significant improvements in beha-
viour were gained in panel V4B, where FRP bending was large and dowel strength
likely very insignificant. It is very likely that the major shear strengthening mecha-
nism of the vertical reinforcement was by acting in tension to provide confinement
to the masonry.
5
Finite element modelling
5.1 IntroductionIn this chapter the finite element (FE) model used to simulate the behaviour
of the experimental diagonal tension/shear tests (from Chapter 4) is described.
The material properties required for the masonry model were determined from
a number of experimental characterisation tests. These tests are also described in
this chapter. The bond between the FRP and the masonry was modelled using the
bond-slip relationships determined from the pull tests presented in Chapter 3.
The FE model was used to help understand the results of the diagonal ten-
sion/shear tests. In particular, the effect of dowel action was investigated. In some
of the diagonal tension tests, the shear resistance provided by dowel action of ver-
tical reinforcement was likely insignificant. The main shear resisting mechanism
would then be the action of the vertical FRP restraining the shear-induced dilation.
This case was modelled assuming that the dowel strength of the FRP across the
mortar joints was zero. In some of the diagonal tension/shear tests, dowel action
may have been present. However, as dowel action could not be directly measured
during the tests, the contribution of dowel strength to the shear strength of the
panel could not be established. The dowel strength contribution (across a mor-
tar joint) was estimated using another finite element model (described herein).
This estimate of the dowel strength was then included in the FRP strengthened
wall panel model in order to assess the contribution of dowel strength to the shear
strength of the wall panel.
From another perspective, the experimental diagonal tension/shear tests were
required to verify the proposed FE model. A representative model, that reproduces
the key behaviours of the FRP strengthened wall panel, could be used to investi-
gate a wide range of wall configurations and support conditions. This would re-
duce the number of full scale tests required to develop design guidelines.
5.2 Masonry modelThe FE analysis was performed using the commercial software package DIANA
9 (de Witte, 2005). To model the masonry the simplified micro-modelling ap-
proach was adopted. The mortar joint and the mortar/brick unit interface were
lumped into a zero thickness interface element. The interface element is a dis-
continuous element that relates the interface stresses (normal stress σn and shear
115

116 5. Finite element modelling
stress τ) to the interface relative displacements (normal displacement u and shear
displacement v). The brick units were modelled with continuum elements that
were expanded to maintain the overall geometry of the masonry. Interface ele-
ments were also used at the mid-length of the brick unit to model potential cra-
cking through the middle of the brick. The bricks were modelled elastically and all
of the non-linear behaviour (cracking, shear sliding and crushing) was modelled
in the interface elements.
The micro-modelling approach was adopted for the following reasons:
1. it is able to reproduce crack patterns and the complete load displacement
path of a masonry structure, and is therefore well suited for understanding
experimental results
2. it is considered more suitable (than the macro-model approach) for model-
ling FRP strengthened structures (see Section 2.7.1)
3. it allows dilation to be modelled along sliding interfaces
4. it allows FRP dowel strength to be easily modelled across sliding interfaces
(see Section 5.5)
The masonry modelling approach and the element divisions are shown in Fi-
gure 5.1. Note that in this figure the interface elements have been shown with thi-
ckness for illustrative purposes. The brick units were modelled using eight-node
quadratic, rectangular plane stress elements with a thickness of 110 mm. Each
half-brick unit section (surrounded by interface elements) was divided into two
elements across the height and two elements across the length (as shown in Fi-
gure 5.1b). The mortar joint interface element (lumped representation of mor-
tar joint and mortar/brick unit interface) and the potential brick crack interface
element were modelled with six-node quadratic, rectangular plane stress inter-
face elements. Two interface elements were used across each half-brick length,
to match the mesh division of the brick unit (shown in Figure 5.1b).
5.2.1 Interface element non-linear behaviourThe non-linear behaviour in the mortar joint interface elements was modelled
using the Crack-Shear-Crush material model. This model was developed by Lou-
renço and Rots (1997) and Van Zijl (2004), and is included in DIANA 9 (de Witte,
2005). For the potential brick crack interface element a linear tension softening
model was used.
The Crack-Shear-Crush material model is based on multi-surface plasticity and
incorporates a Coulomb-friction model (to describe joint sliding), a tension cut-
off model (to describe joint cracking), and an elliptical compression cap model (to
describe masonry compression and brick unit diagonal cracking). Softening acts
in each model, and is preceded by hardening in the compression cap model. The
failure surface of the model and the failure mechanisms it simulates are shown in
Figure 5.2 and Figure 5.3, respectively.

5.2 Interface element non-linear behaviour 117
(a) Masonry assemblage (b) FE model (interface elements shown having
thickness)
Figure 5.1: Masonry simplified micro-modelling approach adopted for study
Figure 5.2: Failure surface of Crack-Shear-Crush model (2D) (DIANA users manual,
de Witte (2005))

118 5. Finite element modelling
(a) (b) (c) (d)
Figure 5.3: Failure mechanisms described by Crack-Shear-Crush model (Lourenço,
1996b): a) joint cracking in tension, b) joint sliding with shear at low le-
vels of normal compressive stress, c) unit diagonal tension crack at high
levels of normal compressive stress and shear, d) masonry crushing
The coulomb friction model captures masonry joint sliding behaviour (inclu-
ding softening behaviour) observed in masonry joint shear tests at low levels of
normal stress. The Coulomb-friction criterion is:
|τ| ≤ c −σnΦ (5.1)
where c is the cohesion, Φ is the internal friction coefficient and compressive nor-
mal stresses (σn) are negative. Joint sliding occurs when the failure criterion is
reached. Both the cohesion (c) and internal friction (Φ) values soften as the joint
slides. The cohesion softens from an initial value c0 to zero and the internal fric-
tion value softens from an initial value Φi to a residual value Φr . The rate at which
the cohesion and the internal friction soften depends on the shear fracture energy
(G I If), which is the area under the shear stress-shear displacement curve. The be-
haviour of the non-linear model in shear is shown in Figure 5.4b.
The tension cut-off model captures the behaviour of masonry joint cracking in
direct tension. The tensile strength (or brick mortar bond strength) is limited by
Equation 5.2:
σn ≤σt (5.2)
where σt is the tensile, or brick-mortar bond strength, which softens exponentially
from the initial value of the brick-mortar bond strength ( ft ) to zero as the crack
opens. The softening behaviour depends on the tensile fracture energy (G If). The
behaviour of the non-linear model in tension is shown in Figure 5.4a.
The compression cap model describes the behaviour of masonry loaded in
compression and also sets a limit on the shear stress at high values of normal stress
due to diagonal cracking through the brick. The compression cap criterion is given
in Equation 5.3:
σ2n +Csτ
2≤σ2
c (5.3)

5.2 Interface element non-linear behaviour 119
where Cs is a parameter that controls the shear stress contribution to failure and
is equal to 9 (Lourenço, 1996b), and σc is the compressive strength. The com-
pressive strength (σc) is described by a parabolic hardening rule, until the peak
compressive strength of the masonry fc is reached at the plastic strain κp . Af-
terwards, the compressive strength softens. The softening is described by a pa-
rabolic/exponential softening rule and depends on the fracture energy Gc . The
behaviour of the non-linear model in compression is shown in Figure 5.4c.
(a) Tension (b) Shear (c) Compression
Figure 5.4: Behaviour of crack shear crush model (DIANA users manual, de Witte
(2005) and Lourenço (1996a))
Normal uplift due to sliding (dilation) is also included in the model. The dila-
tion is modelled using Equation 5.4 (Van Zijl, 2004):
up =
Ψ0
δ
[
1−σn
σu
]
(
1−e−δvp
)
(5.4)
where Ψ0 is the dilatancy gradient at zero normal confining (compressive) stress
and shear-slip, σu is the compressive stress at which the dilatancy becomes zero,
δ is the dilatancy shear-slip degradation coefficient, and up and vp are the plastic
components of the normal and shear displacements respectively. The three para-
meters (Ψ0, σu , δ) are obtained by least-squares fitting of experimental data.
Tensile cracking of the potential brick crack interface elements was modelled
using a linear tension softening model (shown in Figure 5.5). This model is similar
to the tension cut-off model in the Crack-Shear-Crush material model, except that
softening is linear instead of exponential. For these interface elements no failure
criteria was given in shear and compression. These interface elements were mo-
delled as being very stiff to ensure continuity of brick displacement across the in-
terface. This means that frictional sliding is not possible along the potential crack
line. The interface stiffness values of the potential brick crack interface elements
(normal interface stiffness kn , and shear interface stiffness ks) were set at a high
value of 106. After tensile cracking the interface element was assumed to have zero
shear resistance.
The properties required for the interface element non-linear material models
were determined from experimental joint and masonry characterisation tests (dis-
cussed in the next section). Experimental tests were also used to determine the

120 5. Finite element modelling
Figure 5.5: Linear tension softening model for potential brick crack interface ele-
ments
elastic modulus of the brick, and the elastic properties of the mortar joint inter-
face elements (normal interface stiffness kn , and shear interface stiffness ks).
5.3 Masonry material characterisation testsThis section details the experimental tests used to determine the material pro-
perties required for the masonry FE model described in Section 5.2.
5.3.1 Bond wrench testsBond wrench tests were conducted on all mortar batches used in this thesis
to determine the flexural tensile bond strength of the brick-mortar interface. The
results of the bond wrench tests were used as control tests to compare the general
bond strengths between different mortar batches. Where bond strength is referred
to in this thesis it means the flexural tensile bond strength as measured using the
bond wrench (unless otherwise specified).
Bond wrench tests were conducted in accordance with AS3700-2001, Standards
Australia (2001c). The bond wrench test involves subjecting a masonry bed joint
(in a prism) to a bending moment. The bending moment is applied to the joint
using a wrench. A schematic of the test is shown in Fig. 5.6. The standard specifies
that ten joints are tested.
The flexural tensile bond strength of the joint is calculated as:
fsp = (Msp/Zd )− (Fsp/Ad ) (5.5)
where
Msp = the bending moment about the centroid of the bedded area of the test joint
at failure = 9.81m2(d2− tu/2)+9.81m1(d1− tu/2)
Zd = the section modulus of the cross-section
Fsp = the total compressive force on the bedded area of the tested joint = 9.81(m1+
m2+m3)
Ad = the cross-sectional area

5.3 Bond wrench tests 121
Figure 5.6: Schematic of bond wrench test AS3700-2001, Standards Australia
(2001c)
m1 = mass of the wrench
m2 = mass applied to end of bond wrench lever to cause failure
m3 = mass of unit
d1 = the distance from the inside edge of the tension gripping block to the centre
of gravity
d2 = the distance from the inside edge of the tension gripping block to the loading
handle
tu = the width of the masonry unit
A summary of the bond wrench results on all of the mortars used in this thesis
is shown in Table 5.1.
The direct tensile strength of the mortar joint, rather than the flexural tensile
strength, was more appropriate as input into the model. Tests have shown that
the tensile strength of a mortar joint is less than the flexural bond strength (Van
der Pluijm, 1997). The difference is a result of the non-linear stress distribution in
a bending test at failure (explained in Van der Pluijm (1997)). In general a factor
of 1.5 can be assumed for the ratio between flexural and tensile strengths (Van
der Pluijm, 1997; Pina-Henriques et al., 2004). This estimate of the direct tensile
strength was used because direct tension tests were not performed on the mortar
joint interface. The direct tensile strengths used in the FE models are determined
later in Section 5.4 (unreinforced models) and Section 5.6 (reinforced models) for
the different strength mortars used in the analyses.

122 5. Finite element modelling
Table 5.1: Summary of all bond wrench results
Test Mortar batch Bond Strength (MPa) COV (%)
Compression test 1:1:6 mortar 1.22 31
(Section 5.3.2) Han (2008) specimens
(1:1:6 + air entrainer) 0.176 -
Torsion test Series 1 (1:1:6 + air entrainer) 0.14 26
(Section 5.3.3) Series 2 (1:1:6) 1.74 11
Pull tests 1 1.84 23
(Section 3.2.1) 2 1.73 22
3 1.22 31
Wall Panel tests 1 1.25 51
(Section 4.2) 1+W 0.65 34
2 0.49 37
2+W 0.29 46
3 0.47 47
3+W 0.31 57
4 0.57 48
5 1.26 32
5+W 0.41 59
5.3.2 Compression tests on masonry prisms
Compression tests on 7-brick high masonry prisms were used to determine the
elastic properties of the brick unit and mortar joint, as well as the compressive
strength of the masonry. Five prisms were constructed using the same clay brick
and mortar specification used to construct the pull test specimens and the wall
panels tested in diagonal tension/shear. The flexural bond strength of these speci-
mens was 1.22 MPa (COV 31%), determined using AS 3700 bond wrench test (Stan-
dards Australia, 2001c). This value was approximately equal to the bond strengths
of the strongest panels tested (URM-1, URM-2 and H4A - see Table 4.1 in Chap-
ter 4).
The compression specimens were constructed and tested in accordance with
AS3700 Appendix C (Standards Australia, 2001b). Specimens were constructed 7
bricks high to achieve a height-to-thickness ratio greater than 5 to minimise the
influence of platen restraint. A photograph of the test is shown in Fig. 5.7.
Potentiometers were placed on both sides of the specimen to measure the dis-
placement across a mortar joint and across 3 bricks to calculate the strain in the
mortar joint and masonry respectively (as recommended by Drysdale et al. (1994)).
Potentiometers were not used to measure the displacement within a single brick
unit because they were not sensitive enough to measure the small brick displa-
cement. Potentiometers were mounted onto brackets that were screwed onto the
specimen at fine target points to allow the gauge lengths for displacement measu-
rement to be determined accurately.
To improve the determination of the elastic modulus from the compression
test each specimen was loaded and then unloaded three times before being loa-

5.3 Compression tests on masonry prisms 123
Figure 5.7: Compression test setup
ded to failure. Specimens were loaded to approximately 40 % of their predicted
peak load, before unloading, to capture the elastic loading range and minimise
non-recoverable damage. Specimen 1 was loaded to 200 kN before unloading (ba-
sed on an estimate of Pc = 500 kN); specimens 2-4 were loaded to 260 kN before
unloading (40% of Pc specimen 1); and specimen 5 was loaded to 300 kN before
unloading (approximately 40% of average of Pc for first four specimens). The dis-
placements recorded from the second, third and final load cycles were averaged
and used in the calculations to determine the elastic modulus values of the ma-
sonry and the mortar (displacements recorded from the first load cycle were igno-
red). All of the compression tests were stopped once the ultimate load was reached
to avoid damaging the potentiometers.
All of the specimens failed by crushing in the mortar joint and vertical cracking
through the front and back faces of the brick units. The ultimate load (Pc) and cor-
responding maximum compressive stress ( fc), masonry strain at fc , and the elastic
modulus of the mortar (Emor ) and masonry (Emas) are shown in Table 5.2. The
elastic modulii of the mortar (Emor ) and masonry (Emas) were determined as the
gradients of the compressive stress-strain curves (for mortar and masonry respec-
tively) between 5 and 33% of the maximum compressive strength (Drysdale et al.,
1994).
The average elastic modulus of a single brick unit Euni t was determined indi-
rectly using the average values of Emor and Emas and by considering compatibility

124 5. Finite element modelling
of displacements between masonry, brick unit and mortar joint. This calculation
was required because brick unit displacement (used to calculate strain) was not re-
corded. The total masonry displacement is equal to the sum of the displacement
of the units and mortar. The masonry displacement across 3 bricks and 3 mortar
joint is equal to:
δmas = 3δuni t +3δmor (5.6)
The displacements are calculated using:
δmas =PLmas
Emas A(5.7)
δuni t =PLuni t
Euni t A(5.8)
δmas =PLmor
Emor A(5.9)
Where P=compression load, A=bedded area of prism, Lmas=258 mm, Luni t=76
mm, Lmor=10 mm. By substituting Equations 5.7, 5.8, and 5.9 into Equation 5.6,
Euni t was determined as 27592 MPa.
Table 5.2: Compression test results (bond strength = 1.22 MPa)
Specimen Pc (kN) fc (MPa) Masonry strain at fc Emor (MPa) Emas (MPa)
1 664.88 26.28 0.0013 4801 17698
2 651.73 25.76 0.0030 8047 18895
3 970.51 38.36 0.0027 5067 17909
4 894.86 35.37 0.0025 2650 18157
5 873.10 34.51 0.0023 4854 18415
Average 811.12 32.06 0.0025 5084 18215
The average shear modulus values of the brick unit (Guni t ) and mortar (Gmor )
were calculated as 11497 MPa and 2118 MPa respectively, using Equation 5.10 and
Equation 5.11. A Poisson’s ratio (ν) equal to 0.2 was adopted for both the brick unit
and the mortar (Lourenço, 1996a).
Guni t =Euni t
2(1+ν)(5.10)
Gmor =Emor
2(1+ν)(5.11)
The experimentally determined elastic properties of the brick unit and mortar
joint were valid for the actual dimensions of the unit and the joint. As expanded
units and zero-thickness mortar joints were used in the FE model, adjustments
to the elastic properties were required to achieve an equivalent overall elastic res-
ponse. A method that alters the elastic properties of the interface elements and

5.3 Compression tests on masonry prisms 125
leaves the enlarged unit properties untouched is described in Rots (1997) and Lou-
renço (1996a). The normal elastic stiffness (kn) and the shear elastic stiffness (ks)
of the mortar joint interface element were altered using Equation 5.12 and Equa-
tion 5.13, respectively, where hmor = thickness of mortar joint = 10 mm. The nor-
mal elastic stiffness (kn) was calculated as 623 N/mm3 and the shear elastic stiff-
ness (ks) was calculated as 260 N/mm3.
kn =
Euni t Emor
hmor (Euni t −Emor )(5.12)
ks =Guni tGmor
hmor (Guni t −Gmor )(5.13)
In addition to the maximum compressive stress ( fc), the equivalent plastic re-
lative displacement (κp) and the compressive fracture energy (Gc) were also re-
quired to model compression failure. The equivalent plastic relative displacement
(κp) was calculated using Equation 5.14 as 0.024 mm in order to obtain a total ma-
sonry strain of 0.25% at fc (Table 5.2) (Lourenço, 1996a). In Equation 5.14 huni t is
the height of the brick unit = 76 mm.
κp =
{
0.0025− fc
[
1
Euni t+
1
kn(huni t +hmor )
]}
fc (5.14)
As each compression test was stopped just after the ultimate load was reached the
compressive fracture energy was not recorded. The compressive fracture energy
was estimated as 25 N/mm using Equation 5.15 (Lourenço, 1996a).
Gc = 15+0.43 fc −0.0036 f 2c (5.15)
To estimate the elastic and compression properties for masonry panels with a
weaker bond strength (the average bond strength for some of the panels tested was
as low as 0.29 MPa) the results of Han (2008) were used. Han tested five masonry
prisms constructed using a similar clay brick (as the current investigation), but a
weaker mortar was used. This mortar consisted of cement:lime:sand in propor-
tions of 1:1:6 by volume with eight times the recommended dose of air entraining
agent added to deliberately create low bond strength. The bond strength of these
specimens was 0.176 MPa. The average values of the ultimate load (Pc), maximum
compressive stress ( fc), and the elastic modulus of the mortar (Emor ), masonry
(Emas) and brick unit(Euni t ) are shown in Table 5.3. The masonry strain at fc was
not reported.
Table 5.3: Compression test average results from Han (2008) (bond strength = 0.176
MPa)
Pc (kN) fc (MPa) Emor (MPa) Emas (MPa) Euni t (MPa)
516 20.0 2772 18135 35360

126 5. Finite element modelling
From these tests the values of fc = 20 MPa and Emor = 2772 MPa were adop-
ted to represent masonry with a bond strength of 0.176 MPa. For consistency, the
elastic modulus of the brick unit (Euni t ) from the previously described test series
(equal to 27592 MPa) was kept. The input properties required for the mortar joint
interface elements were calculated the same way as described previously, and are
shown in Table 5.4. For the calculation of κp , the masonry strain at fc was assu-
med as 0.2% (Lourenço, 1996a). The input properties required for the mortar joint
interface elements determined for masonry with a bond strength of 1.22 MPa, are
also shown in Table 5.4.
Table 5.4: FE model input properties determined from compression tests
Property Bond strength = 0.176 MPa Bond strength = 1.22 MPa
kn (N/mm3) 308 623
ks (N/mm3) 128 260
fc (MPa) 20 32
Gc (N/mm) 22 25
κp (mm) 0.010 0.024
5.3.3 Torsion testTo characterise the shear behaviour of the mortar joint the torsion test (shown
in Figure 5.8), developed by Masia et al. (2006, 2007), was used. In this test an
annular masonry specimen, which contains a single bed joint (Figure 5.8a), is sub-
jected to combined compressive stress (normal to the bed joint) and torsion. The
torsion test produces close to uniform distributions of normal and shear stress,
thus allowing the shear behaviour at a point to be characterised.
As part of the current investigation a set of torsion tests were performed on
specimens constructed using the same brick and mortar as the wall panel tests.
The specimens were prepared by coring a complete annular specimen through the
height of a pre-cast masonry couplet. These specimens were prepared differently
from previous torsion tests, reported in Masia et al. (2007). In Masia et al.’s tests the
specimens were prepared by coring annular sections from two separate solid units
first, and then bonding them together with mortar. After testing, and then analy-
sing the results of the current investigation (joints cast before coring) it was found
that the joint shear strengths were lower than expected when compared to joints
that were cast after coring (as in Masia et al. (2007)). The reduced joint strength
was thought to be caused by damage to the joint during the coring procedure. The
results from the current investigation were unreliable and therefore were not used
for the characterisation of the shear behaviour. The results of tests conducted by
Masia et al. (2007) were used instead.
Torsion tests by Masia et al. (2007)
This section outlines the specimens tested by Masia et al., the testing proce-
dure they used, and their results. Torsion tests were performed on specimens

5.3 Torsion tests by Masia et al. (2007) 127
constructed with two different types of mortar. The first set of specimens (se-
ries 1) were built using solid extruded clay bricks and mortar mixed in a ratio of
1:1:6 (cement:lime:sand). The mortar was overdosed with an air entraining agent
(eight times the recommended amount) to deliberately reduce the bond strength.
The bond strength of the mortar joint was determined as 0.14 MPa using the bond
wrench test. Eight of these specimens were tested. The second set of specimens
(series 2) were constructed using the same bricks and the mortar was mixed in a
ratio of 1:1:6 (cement:lime:sand) with no extra additives. The bond strength of this
mortar joint was determined as 1.74 MPa. Eleven of these specimens were tested.
The bricks and mortar used by Masia et al. for series 2 specimens were the
same as the bricks and mortar used in this thesis. The bricks used for series 1
specimens were not from the same batch, but were provided by the same brick
manufacturer, and were very similar. The mortar used in series 1 tests was different
to the mortar used in the current study due to the use of air entraining agent to
make the bond weaker.
The specimens were prepared by coring annular sections through the height of
two solid brick units and then bonding them together (on the bedding faces) with
a 10 mm thick mortar joint. All of the annular specimens had an inside radius ri =
36 mm and an outside radius ro = 47.5 mm.
The torsion test apparatus is shown in Figure 5.8b and Figure 5.8c. A circular
steel plate was glued onto each end of the specimen. Before the adhesive set, the
specimen was then placed on its side in the apparatus (as shown), with one end
of the specimen fixed in place and the other end attached to a rotating shaft. The
axis of rotation of the shaft was aligned with the axis of the specimen. The rotating
shaft was also free to displace along its length.
A hydraulic jack was used in a closed loop system (as shown) to apply precom-
pression to the joint. The precompression was applied under load control and was
held constant throughout the test. For the specimens constructed with the rela-
tively weak mortar (series 1) three nominal levels of precompression on the joint
were used: 0.14 MPa; 0.33 MPa; and 0.67 MPa. For the specimens constructed with
the relatively strong mortar (series 2) the three nominal levels of precompression
on the joint used were: 0 MPa; 0.68 MPa; and 1.33 MPa (Table 5.5).
The test apparatus was mounted in a Universal Testing Machine (UTM). The
UTM cross-head was used to displace a lever, that was attached to the rotating
shaft. The end of the specimen (attached to the shaft) was caused to rotate and this
rotation created torsion through the specimen. A load cell was used to measure
the force, applied by the cross-head, required to displace the lever. The torque (T )
through the specimen was then equal to this force multiplied by the lever length.
Potentiometers were used to measure the shear displacement across the mortar
joint (from which the relative rotation (φ) was calculated) and the normal separa-
tion across the mortar joint.
Equation 5.16 and Equation 5.17 were used to convert the experimentally re-
corded torque (T ) versus rotation (φ) into shear stress (τ) versus shear displace-
ment (v) behaviour (required for derivation of joint shear properties at a material

128 5. Finite element modelling
(a) Torsion test specimen (b) Setup (view 1)
(c) Setup (view 2)
Figure 5.8: Torsion test setup and annular specimen

5.3 Torsion tests by Masia et al. (2007) 129
point). In Equation 5.17 r was the average radius of the annular section = 41.75
mm. The derivation of these equations are provided in detail in Masia et al. (2007).
Equation 5.16 is only applicable when failure occurs through the mortar joint (not
through the brick). Masia therefore only used the results of the specimens where
failure occurred through the joint (brick cracking not present) to derive the joint
shear properties. The shear stress (τ) versus shear displacement (v) behaviour of
a typical specimen is shown in Figure 5.9.
τ= 3T /(2π(r 3o − r 3
i )) (5.16)
v = rφ (5.17)
Figure 5.9: Typical derived shear stress versus shear displacement response, Masia
et al. (2007)
Many specimens did fail within the joint, with cracks developing along the
brick mortar interfaces and in many cases, diagonal cracks extending across the
mortar joint were observed. A summary of the torsion test results are given in
Table 5.5. The ultimate shear stress (τu), the residual shear stress (τr esi dual ), the
shear fracture energy (G I If) and the elastic shear modulus (G) were determined
for each specimen from the shear stress versus shear displacement curves. The
shear fracture energy (G I If) was determined as the area under the curve, above
τr esi dual . The elastic shear modulus (G) was determined for each test by com-
puting the slope of the loading branch of the τ versus v response using a secant
drawn between 5% and 33% of τu . Note that the value of G determined by Masia
et al. (2007) was not used in the current study.

130 5. Finite element modelling
Table 5.5: Experimental results from Masia et al. (2007)
Test Series 1
Units:extruded solid clay, Mortar: 1:1:6 + overdose (8 x recommended) air entrainer
Mean flexural bond strength = 0.14 MPa, COV 26%
Test σn τu τr esi dual G I If
G Failure mode
No. (MPa) (MPa) (MPa) (N/mm) (MPa)
1 -0.66 NA 0.49 NA NA Joint cracked prior to test
2 -0.68 1.03 0.40 0.45 1860 Joint
3 -0.68 0.61 NA NA 730 Joint crushing after peak T
4 -0.34 0.49 0.29 0.11 1700 Joint
5 -0.34 1.30 0.32 0.24 5500 Joint
6 -0.14 0.34 0.13 0.06 1800 Joint
7 -0.14 0.31 0.14 0.03 5860 Joint
8 -0.33 0.60 0.31 0.05 350 Joint
Cohesion c0 = 0.22 MPa, Initial friction Φi = 0.90, Residual friction Φr = 0.56
Test Series 2 (specimen 8 was unsuccessful)
Units:extruded solid clay, Mortar: 1:1:6
Mean flexural bond strength = 1.74 MPa, COV 11%
Test σn τu τr esi dual G I If
G Failure mode
No. (MPa) (MPa) (MPa) (N/mm) (MPa)
1 0 1.28 0 - 1540 Joint
2 0 0.72 0 - 1500 Joint
3 0 0.85 0 - 2470 Joint
4 -0.69 1.46 0.55 0.60 1180 Joint
5 -0.67 2.44 0.58 0.38 36860 Joint and brick
6 -0.67 1.63 0.75 0.19 1360 Joint
7 -1.33 1.59 1.21 0.07 6450 Joint and brick
9 -1.34 2.04 0.70 0.92 48610 Joint and brick
10 -1.34 2.05 1.38 0.25 5310 Joint
11 -0.68 2.06 0.81 0.31 2140 Joint
Cohesion c0 = 1.00 MPa, Initial friction Φi = 0.90, Residual friction Φr = 1.03

5.3 Torsion tests by Masia et al. (2007) 131
The ultimate shear stresses (τu) were plotted against the normal stresses (σn)
and a linear trend line was fitted to the results to determine the cohesion (c0) and
the initial friction (Φi ) values (Figure 5.10 and Figure 5.11). The cohesion and ini-
tial friction values are summarised in Table 5.5.
Figure 5.10: Shear stress versus normal stress (Series 1), Masia et al. (2007)
The residual shear stresses (τr esi dual ) were plotted against the normal stresses
(σn) and a linear trend line was fitted to the results to determine the residual fric-
tion (Φr ) values (Figure 5.10 and Figure 5.11). Note that a negative value of σn is a
compressive normal stress.
The shear fracture energies (G I If) were also plotted against the normal stress
(σn), shown in Figure 5.12 and Figure 5.13. Masia observed that for the series
1 specimens G I If
increased with σn (as was expected). In general, however, they
could not establish a sensible relationship between G I If
and σn due to the large
amount of variability in the data.
The average normal uplift (dilation) versus the shear displacement relation-
ships are shown in Figure 5.14 (series 1) and Figure 5.15 (series 2) for the speci-
mens that failed within the joint. In Figure 5.14 the dilation response of speci-
mens 2 and 3 were not plotted because the mortar crushed during the test. Dila-
tion could not be recorded for specimens with no precompression because they
fell apart after failure.
It is shown in Figure 5.14 and Figure 5.15 that the rate of increase of the nor-
mal uplift (with respect to the shear displacement) decreased as the shear displa-
cement increased. Also, the amount of dilation reduced with increasing normal
stress on the joint. This behaviour is consistent with other published results ( Van
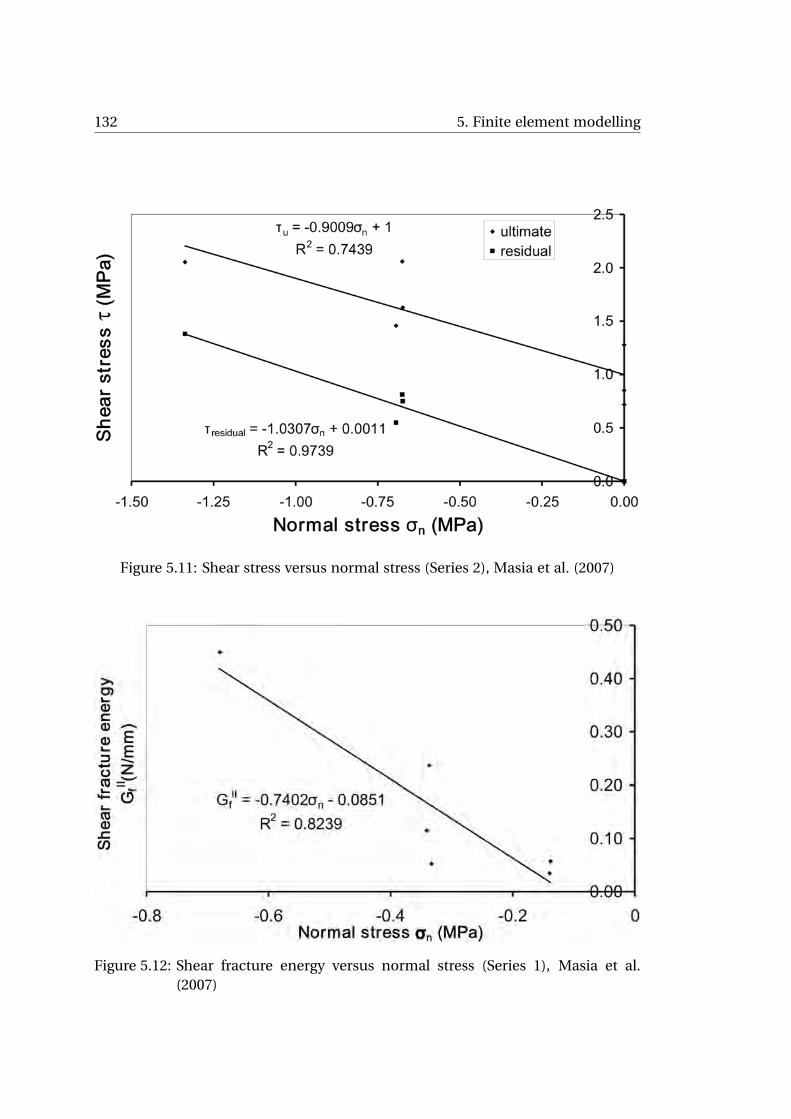
132 5. Finite element modelling
Figure 5.11: Shear stress versus normal stress (Series 2), Masia et al. (2007)
Figure 5.12: Shear fracture energy versus normal stress (Series 1), Masia et al.
(2007)

5.3 Torsion tests by Masia et al. (2007) 133
Figure 5.13: Shear fracture energy versus normal stress (Series 2), Masia et al.
(2007)
Figure 5.14: Series 1 dilation versus shear displacement including model (Ψ0=0.5,
σu=-0.75 MPa, δ=1.8)

134 5. Finite element modelling
Figure 5.15: Series 2 dilation versus shear displacement including model (Ψ0=0.7,
σu=-1.8 MPa, δ=2.2)
Zijl (2004)).
The dilation model (described in Section 5.2) was fitted to the experimental
dilation results to estimate the properties for the FE analysis. The properties were
the initial dilatancy coefficient (Ψ0), stress at which the dilatancy is zero (σu), and
a degradation coefficient (δ). The models are shown in Figure 5.14 and Figure 5.15
(with the experimental results) using broken lines. The parameters used to define
the models for both series are summarised in Table 5.6. The model response with
no precompression is also shown (even though it could not be recorded during the
tests) and indicates the maximum normal uplift of the joint in the FE model due
to shear induced dilation.
Table 5.6: FE model dilation input properties
Property Series 1 Series 2
(bond strength = 0.14 MPa) (bond strength = 1.74 MPa)
Ψ0 0.5 0.7
σu(MPa) -0.75 -1.8
δ 1.8 2.2

5.3 Lateral modulus of rupture test 135
5.3.4 Lateral modulus of rupture testThe flexural tensile strength of the brick units was determined using 4 point
bending tests on brick unit specimens (shown in Figure 5.16) in accordance with
AS/NZS 4456.15: 2003 (Standards Australia (2003)). Ten specimens were construc-
ted by gluing three bricks together end to end with epoxy. Before the bricks were
glued together the rough, friable ends of the bricks were removed by cutting ap-
proximately 5 mm from the ends of the bricks with a circular saw. This was done to
prevent failure at (or near) the joint, which occurred in preliminary tests. A sche-
matic of the test, showing the span length and distance between loading points, is
shown in Figure 5.17.
Figure 5.16: Lateral modulus of rupture test
The flexural tensile strength ( fut ) was determined from the tests where fai-
lure occurred in the central brick unit (constant moment and zero shear). Fai-
lure occurred in the central unit of only four tests. The failure loads are shown in
Table 5.7. The flexural tensile strength was calculated as the moment divided by
the section modulus. The average fut was 3.57 MPa with coefficient of variation of
0.21.
The direct tensile strength of the unit was not determined using a test. The
direct tensile strength is equal to the flexural tensile strength divided by 1.5. This
reduction is implied for concrete (similar material to brick unit) in AS3600-2001
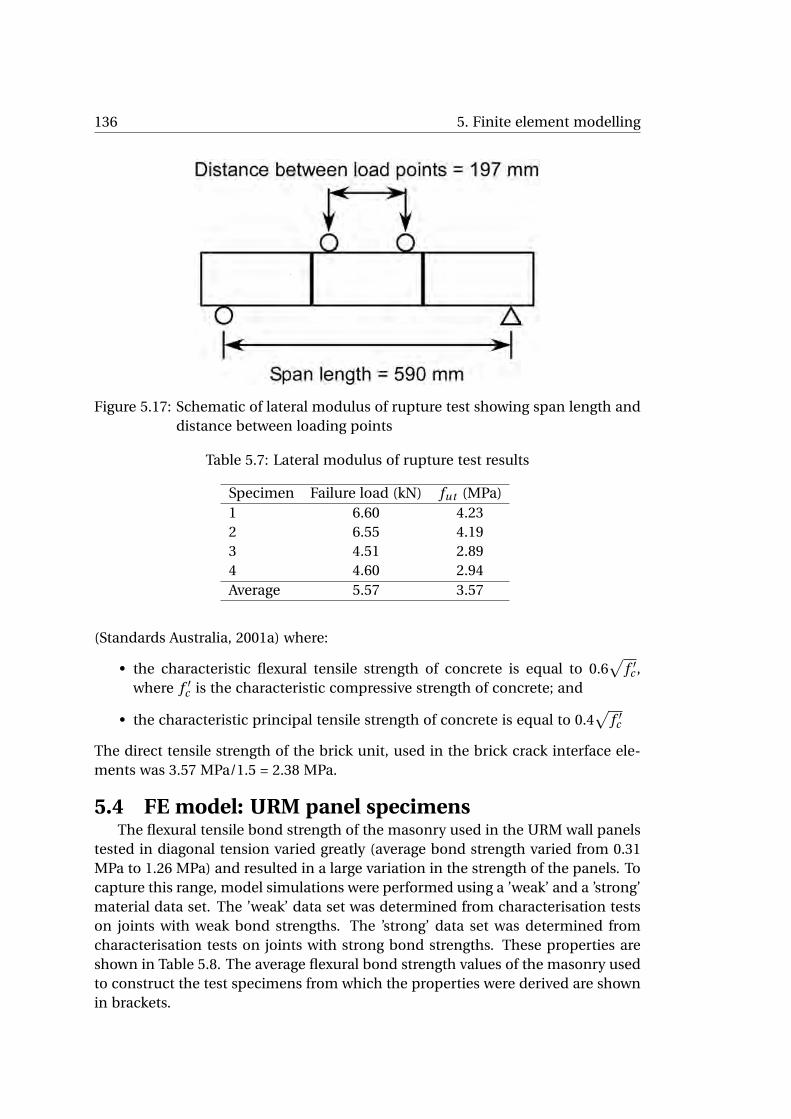
136 5. Finite element modelling
Figure 5.17: Schematic of lateral modulus of rupture test showing span length and
distance between loading points
Table 5.7: Lateral modulus of rupture test results
Specimen Failure load (kN) fut (MPa)
1 6.60 4.23
2 6.55 4.19
3 4.51 2.89
4 4.60 2.94
Average 5.57 3.57
(Standards Australia, 2001a) where:
• the characteristic flexural tensile strength of concrete is equal to 0.6√
f ′
c ,
where f ′
c is the characteristic compressive strength of concrete; and
• the characteristic principal tensile strength of concrete is equal to 0.4√
f ′
c
The direct tensile strength of the brick unit, used in the brick crack interface ele-
ments was 3.57 MPa/1.5 = 2.38 MPa.
5.4 FE model: URM panel specimensThe flexural tensile bond strength of the masonry used in the URM wall panels
tested in diagonal tension varied greatly (average bond strength varied from 0.31
MPa to 1.26 MPa) and resulted in a large variation in the strength of the panels. To
capture this range, model simulations were performed using a ’weak’ and a ’strong’
material data set. The ’weak’ data set was determined from characterisation tests
on joints with weak bond strengths. The ’strong’ data set was determined from
characterisation tests on joints with strong bond strengths. These properties are
shown in Table 5.8. The average flexural bond strength values of the masonry used
to construct the test specimens from which the properties were derived are shown
in brackets.

5.4 FE model: URM panel specimens 137
The tensile strength of the mortar joint interface element ( ft (m)) was estimated
as equal to the flexural tensile bond strength of the joint/1.5 (Section 5.3.1). For
the property sets used here, the bond strength values of the torsion test specimens
from Masia et al. (2007) were used (weak = 0.14 MPa, and strong = 1.74 MPa). As
the tensile fracture energy of the mortar joint (G If (m)
) was not determined by ex-
periment it was assumed as 0.005 N/mm for the weak mortar and 0.012 N/mm for
the strong mortar based on results of tests from the literature (Van Zijl, 2004).
Table 5.8: Material properties adopted for mortar joint interface elements
Property Units Weak mortar Strong mortar
kn(m) N/mm3 308 (0.176) 623 (1.22)
ks(m) N/mm3 128 (0.176) 260 (1.22)
ft (m) MPa 0.09 (0.14) 1.16 (1.74)
G If (m)
N/mm 0.005 0.012
c0 MPa 0.22 (0.14) 1.0 (1.74)
Φi - 0.9 (0.14) 0.9 (1.74)
Φr - 0.56 (0.14) 0.9 (1.74)
Ψ0 - 0.5 (0.14) 0.7 (1.74)
σu MPa -0.75 (0.14) -1.8 (1.74)
δ - 1.8 (0.14) 2.2 (1.74)
fc MPa 20 (0.176) 32 (1.22)
Cs - 9 9
Gc N/mm 22 (0.176) 25 (1.22)
κp mm 0.010 (0.176) 0.024 (1.22)
G I If
(1) N/mm 0.16 (0.14) 0.34 (1.74)
G I If
(2) N/mm 0.02-0.17σn 0.02-0.17σn
G I If
(3) N/mm 0.05-0.80σn 0.05-0.80σn
As no sensible result between the normal compressive stress (negative σn) and
the shear fracture energy (G I If) was established for the joints tested by Masia et al.
(2007), three different inputs for the shear fracture energy were adopted. The sen-
sitivity of the model to the inputs was assessed. A constant shear fracture energy
and two linear relationships that approximately bounded the results from Masia’s
torsion tests (Figure 5.18) were used. The constant shear fracture energy was taken
as: the average shear fracture energy of series 1 specimens for the weak property
set; and the average shear fracture energy of series 2 specimens for the strong pro-
perty set.
The brick unit had an elastic modulus equal to 27600 MPa and Poissons ra-
tio of 0.2 (see Section 5.3.2). The tensile strength of the potential brick crack ele-
ment was taken as 2.38 MPa (Section 5.3.4) and a tensile fracture energy of 0.025
N/mm was assumed based on recommendations from Lourenço (1996a). The in-
terface stiffness values of the potential brick crack elements were set at a high va-
lue (kn=ks=106) to maintain continuity of brick displacement across the interface.

138 5. Finite element modelling
Figure 5.18: Upper and lower bound G I If
relationships fitted to torsion test data
from Masia et al. (2007)

5.4 FE model: URM panel specimens 139
The finite element model is shown in Figure 5.19. As described previously in
Section 5.2, rectangular quadratic plane stress elements were used for the majority
of the brick units. At the support and loaded ends, however, some triangular ele-
ments were used to accommodate the boundary conditions (to keep the boundary
condition symmetrical).
Figure 5.19: FE model of URM Diagonal Tension/Shear Test (mesh shown in cut-
away)
Nodes at the base of the model were fixed in both the x and y directions to
simulate a fixed boundary condition at the bottom loading shoe. At the top corner
of the model the loading shoe was modelled with a very stiff section. At the top of
this section a roller support was used to restrain movement in the x direction. The
top and bottom corners of the model were aligned vertically as in the experiments.
The panel self-weight was not included in the model. The total panel self weight
was calculated as less than 3 kN. The extra load due to self weight was considered
insignificant compared to the applied load.
In most models vertical displacement was applied incrementally (displacement
control) on the top corner of the model (as shown) to simulate loading on the pa-
nel. To solve the nonlinear problem an incremental-iterative solution procedure
was used. The displacement was increased by 0.01 mm for each increment and
a linear iteration scheme was used to solve for equilibrium at each increment. In
the model with strong mortar and G I If
= 0.34 N/mm an applied load was used with
arc-length control . This method was used because of convergence issues using
displacement control alone. The load was applied in steps of 10 kN and arc-length
control was applied to all nodes in the x direction.
The load-vertical displacement behaviour of the three models with strong mor-
tar properties are plotted in Figure 5.20 with the load displacement relationships of

140 5. Finite element modelling
the URM experiments. The behaviours of the URM FEmodels (with strong mortar)
were similar to the experimental panels constructed with strong mortar (URM-1
and URM-2) up to the peak load.
Figure 5.20: Load displacement behaviour of strong mortar FE model plotted
against experimental URM results
All of these models failed by sliding along a diagonal crack that formed through
mortar head and bed joints (shown in Figure 5.21). In the two strongest models
(with G I If
(1) and G I If
(3)) some other smaller cracks (through the mortar bed and
head joints) formed as well (shown in Figure 5.21). This failure mechanism was
similar to the failure mechanism of URM-1 and URM-2.
The ultimate loads of the models were 274 kN (G I If
(1)), 248 kN (G I If
(2)), and
282 kN (G I If
(3)), and were all within the range of the experimental panels with
strong mortar URM-1 (237 kN) and URM-2 (290 kN). After the ultimate load was
reached and the diagonal crack formed in the model the load capacity dropped
suddenly. The load did not, however, drop to zero (as in the experiments), ins-
tead the model displayed some residual capacity as the panel slid along the crack.
Some of the possible reasons why the FE model had some residual capacity and
the experiments did not include:
1. The model is strict displacement control, but the experiment is not. The
experiment might speed up as the load drops off and therefore not allow
friction to slowly occur.

5.4 FE model: URM panel specimens 141
Figure 5.21: Typical failure mode of URM model with strong mortar (G I If
(3))
2. The top loading shoe in the experiment might move slightly in the negative x
direction, which would tilt the panel and allow collapse to occur more easily.
In the model the strict roller support may allow some locking together.
3. It is possible that the experiment does have residual capacity as it collapses
but the data recording frequency is not high enough to log it.
Shear fracture energy had an effect on the ultimate load and the residual capa-
city of the panels. The variation in the ultimate loads of the models with different
shear fracture energies was within the range of the experimental panels construc-
ted with strong mortar (as previously mentioned). The two models where G I If
in-
creased linearly with compressive normal stress had larger residual capacities than
the model with the constant G I If, due to larger frictional fracture energies. Some
minor cracking within the panels was also different but the major crack (as shown
in Figure 5.21) was the same in all models.
The load displacement relationships of the three models with weak mortar pro-
perties are shown in Figure 5.22 with the URM experiments. The ultimate loads of
the models were 85 kN (G I If
(1)), 79 kN (G I If
(2)), and 98 kN (G I If
(3)), and were all
higher than the ultimate load of the weakest panel URM-3, which was 65 kN. All
models did, however, represent an approximate lower bound on the range of all of
the URM results as shown in Figure 5.22.
All of the models with weak mortar properties failed by sliding along a diagonal
crack that developed through the mortar joints (shown in Figure 5.23). This failure
mode was similar to the failure mode of URM-3, but different to the failure mode
of URM-4. Panel URM-4 failed by sliding along only three bed joints (with sliding
occurring primarily along one bed joint). It is possible that in the model the strict
roller support at the top loading shoe made it more difficult for the model to fail

142 5. Finite element modelling
by sliding along a single bed joint. In the experiment the top loading shoe may
have been able to move slightly and allow such a failure.
The load displacement behaviours of the models were similar to URM-3, until
the failure of URM-3. The weak mortar models had some residual capacity after
the crack formed, which was affected by the shear fracture energy (similar to the
strong mortar models).
Figure 5.22: Load displacement behaviour of weak mortar FE model
5.5 FRP Reinforcement model
5.5.1 Attaching FRP to masonry in finite element modelThe FRP strips were modelled using 2-noded linear truss elements. These ele-
ments were assigned a cross sectional area of 42 mm2 (FRP was 15 mm wide and
2.8 mm thick), and an elastic modulus of 210000 MPa. The Poisson’s ratio was as-
sumed to be 0.3 (Hussain et al., 2008).
To represent the NSM joint (shown in Figure 5.24a) in the FE model the FRP
was attached to the brick unit using zero-thickness, 6-noded quadratic, interface
elements (Figure 5.24b). The relationship between shear traction (or bond, τ) and
shear relative displacement (or slip, δ) of the interface element, in the longitudi-
nal/tensile direction of the reinforcement, was defined using the local bond-slip
relationship determined from the experimental pull tests (Chapter 3). An example
bond slip relationship used to attach the vertical reinforcement is shown in Fi-
gure 5.24c. This relationship was determined from pull test specimen S1-C-SG. By

5.5 Calibration of bond-slip model 143
Figure 5.23: Typical failure mode of URM model with weak mortar (G I If
(1))
modelling the FRP-to-masonry interface in this way, debonding of the FRP from
the masonry (caused by longitudinal tension in the FRP) was accounted for.
The bonded area of the FRP strip in the model is equal to the length of the
interface element times its plane stress thickness. In reality the bonded area of
the NSM FRP strip is equal to the length of the strip times the bonded perimeter
(=15x2+2.8 = 32.8 mm). The plane stress thickness of the interface element the-
refore corresponds to the bonded perimeter and was set equal to 32.8 mm. The
plane stress thickness direction of this element is indicated in Figure 5.24b.
To connect the FRP truss elements across the mortar joint and potential brick
crack interface elements, a zero-thickness node interface element was used (Fi-
gure 5.24d). In the longitudinal direction a high stiffness was given to the node
interface element to make the FRP continuous across the joint. In the transverse
direction (i.e. the direction of mortar joint or brick crack sliding) a dowel relation-
ship was used, which will be discussed in Section 5.5.3.
5.5.2 Calibration of bond-slip model
A simple pull test was modelled (using finite elements, shown in Figure 5.25)
to verify the bond-slip input data and modelling strategy. The masonry prism was
modelled with plane stress brick elements only (no mortar joints were included)
and had a height of 330 mm, a width of 230 mm and a thickness of 110 mm. The
masonry prism was restrained fully along the top surface in the model. The FRP
was attached to the model as described in the previous section. The bonded length
of the FRP (equal to the height of the model) was approximately equal to the bon-
ded length of the pull test specimens from test series 1 (equal to 336 mm). The
FRP was pulled from the masonry in the model by applying a displacement to the
top node of the FRP as shown. The mesh was divided into 16 elements across
the height and 4 elements across the width of the masonry prism, as shown (Note

144 5. Finite element modelling
(a) NSM FRP reinforcement (b) FE model representation
(c) Bond-slip model (pull test S1-C-SG) (d) Connection across interface
Figure 5.24: FRP attachment in FE model
that this mesh had twice the refinement, along the height, of the regular masonry
model used for the URM model). The model results were verified with the experi-
mental results of pull test specimen C.
In Chapter 3, δ1 (slip corresponding to maximum shear stress in the bilinear
bond slip model) was defined as 0.4 mm for specimen S1-C-SG. Here, however, a
closer match between the experiment and FE model was produced when a value
of δ1 = 0.2 mm was adopted. By adopting this value for δ1 the initial portion of
the bilinear curve matches the linear elastic region of the experimental bond slip
curves (Figure 5.26). This change was made to get a better fit to the pre-peak be-
haviour of the bond-slip response, because debonding was not observed in many
cases.
The load-slip response at the loaded end of the finite element model and the
experimental results of specimen S1-C-SG are shown in Figure 5.27. The FE mo-
del reached an ultimate load of 81 kN, which was approximately 96% of the expe-
riment (84.5 kN). The difference between the simulated and experimental ultimate
loads was likely due to rounding of the area and elastic modulus of the FRP. The
FE model matched the initial load-slip response of the experiment but displayed a
larger slip at the loaded end before debonding occurred. The experimental load-
slip response (at the loaded end) was determined from integration of the strain
distribution (see Section 3.3.4, Chapter 3). For the integration is was assumed that
the slip at the unloaded end was zero. Near the ultimate load this assumption may

5.5 Calibration of bond-slip model 145
Figure 5.25: FE model of pulltest (interface element shown with thickness)
Figure 5.26: Bond-slip curve S1-C-SG with refined bilinear bond slip curve

146 5. Finite element modelling
be inaccurate (the slip at the loaded end may be higher than zero). The actual slip
at the loaded end would then be higher (and closer to the FE result). In the model,
when the loaded end slip was 2.24 mm, the slip at the unloaded end was 0.28 mm.
The difference in slip along the interface was then 1.96 mm, and was closer to the
slip estimated from the experiments (1.58 mm) assuming the slip at the unloaded
end was zero.
Note that any extra displacement capacity of the debonding joint could lead
to issues in the panel model. Extra displacement capacity of the debonding joint
would mean larger cracks before debonding and greater stress redistribution. This
would lead to an overestimation of the displacement capacity.
Figure 5.27: Load-slip response at the loaded end of FE model and S1-C-SG
Distributions of strain in the FRP at increasing levels of loaded end slip (LES)
(up to the experimental maximum of 1.58 mm ) are shown in Figure 5.28 for the
FE model and specimen S1-C-SG. The distributions of shear stress between the
FRP and masonry are shown at increasing levels of LES in Figure 5.29. The figure
was split to improve clarity. Both Figure 5.28 and Figure 5.29 show that the stress
transfer from the FRP to the masonry (through the epoxy), and the progression
of damage of the bond, with increasing LES, was similar between model and ex-
periment. Based on these results it was decided that the bilinear bond-slip rela-
tionship, for a given FRP orientation, was a suitable approximation to use with the
modelling strategy to model the NSM FRP to masonry bond.

5.5 Dowel action 147
Figure 5.28: Strain distributions of FE model and S1-C-SG at increasing LES
5.5.3 Dowel action
For FRP reinforcement crossing a sliding crack two mechanisms of sliding re-
straint were identified:
1. reinforcement restrains dilation and results in increased resistance to frictio-
nal sliding
2. reinforcement acts as a dowel to increase sliding resistance
The first mechanism is automatic in the model because dilation is included and
the FRP is modelled continuous across the mortar joints. However, the dowel
strength needed to be estimated and defined in the model. In this section the
dowel strength of the FRP is estimated.
Two models were used to estimate the dowel strength contributed by the FRP
reinforcement across a single sliding crack. The models were based on the beha-
viours observed during the diagonal tension/shear tests and represented a lower
and an upper bound estimate of the dowel strength.
The first model represented the dowel behaviour observed in the diagonal ten-
sion/shear tests where large cracks developed adjacent, and parallel, to the NSM
FRP and allowed the FRP (that crossed the sliding cracks) to bend over a large
length of the FRP. The shear cracking adjacent to the FRP generally allowed ben-
ding of the FRP to occur over the length of one brick height (shown in Figure 5.30a).

148 5. Finite element modelling
(a) LES = 0.24 and 0.62
(b) LES = 1.31 and 1.58
Figure 5.29: Stress distributions of FE model and S1-C-SG at increasing LES

5.5 Dowel action 149
(a) Strip 1 Panel V2 (b) Dowel lower bound idealisation
Figure 5.30: FRP bending in panels
The shear force transferred across the bent FRP (as a function of the shear dis-
placement δ) was calculated using Equation 5.18. This equation is based on the
idealised model shown in Figure 5.30b. This equation comes from the stiffness
method used for beam analysis (Hibbeler (1997)).
V =
12E Iδ
L3(5.18)
where E is the elastic modulus of the FRP (= 210 000 MPa), I is the moment of
inertia of the FRP cross section, bending about its weak axis (= 27.44 mm4), L is
the length of FRP between fixed supports which was the brick height (= 76 mm).
At 1 mm of shear displacement the shear force transferred by the FRP was
equal to 0.16 kN, and at 10 mm the shear force transferred by the FRP was equal
to 1.6 kN. This amount of dowel force would not have contributed to the load car-
rying capacity of the panels and was considered equal to zero. Note that these
values represent the dowel strength after a significant amount of deformation and
cracking had occurred. To model zero dowel strength in the FRP reinforced ma-
sonry FE model, a very low transverse stiffness was assigned to the node interface
element that connected the FRP elements across a mortar joint interface element
(refer to Section 5.5.1).
In some panels cracks adjacent to the FRP were not as large as previously des-
cribed and the FRP was bent over a shorter length (less than the brick height). This
suggests that some dowel resistance may have been provided. To estimate the do-
wel resistance of these cases an FE model (shown in Figure 5.31) was used.
A section of masonry was modelled with an FRP strip crossing a shear sliding
crack perpendicularly. The crack was positioned in the middle of a 10 mm thick
mortar joint and was modelled 1 mm thick. The thickness of the crack gap was
selected based on observations from the diagonal tension experiments. Above and
below the crack the FRP was attached (in this model with perfect bond) to 50 mm
of brick unit with 1 mm of epoxy as shown. The width of the masonry section mo-
delled was equal to 104.8 mm. The sliding crack was made frictionless so that the
shear force was transferred across the crack by dowel action only. The thickness of

150 5. Finite element modelling
Figure 5.31: Dowel action FE model geometry, boundary conditions and loading
the section was taken as 15 mm (FRP width).
The masonry, mortar and epoxy were all modelled with 8 node quadratic plane
stress elements. Each brick section (4 in total) was divided into 20 x 20 elements.
Each mortar section (4 in total) was divided into 20 elements across the width and
2 elements across the height. Each epoxy section (4 in total) was divided into 1 ele-
ment across the width and 22 elements across the height. The FRP was modelled
using 2 node linear beam elements with cross section properties depth = 2.8 mm
and width = 15 mm (bending occurred about weak axis). The FRP was divided into
44 elements above and below the crack, and 4 elements across the crack.
The masonry section below the crack was fixed along the edges. Roller supports
were used along both crack faces to fully restrain vertical movement because, rea-
listically, the surfaces would likely be touching. The top edge of the model was
also fully fixed in the vertical direction to model confinement from the rest of the
panel above the modelled section. A displacement was applied to the top section
to cause shear displacement along the crack as shown.
The elastic properties used for each material are shown in Table 5.9. The elas-
tic properties of the epoxy adhesive were estimated using data from Adams et al.
(1997), because they were not experimentally determined, nor were they provided
within the manufacturer’s material data sheets. Apart from being an epoxy adhe-
sive, there is no other indication that the adhesive from Adams et al. (1997) and
the adhesive used in the experiments are similar. This did not matter so much,
because only an estimate of the dowel strength was desired. The purpose of mo-
delling dowel action was to investigate whether it would be significant (or not).
Damage was modelled in the brick, mortar and epoxy using the Rankine/Von
Mises material model in DIANA 9. The compressive behaviours of the brick, mor-
tar and epoxy were modelled as ideally plastic (no hardening or softening) after
the compressive strength was reached. The compressive strength of the brick was

5.5 Limitations of the FRP reinforced masonry FE model 151
conservatively assumed as 35 MPa, based on the manufacturer’s data (compressive
strength ≥ 35 MPa) as it was not experimentally determined. The mortar com-
pressive strength was assumed equal to 5 MPa (Type N mortar, Drysdale et al.
(1994)). The epoxy compressive strength was 60 MPa (from the manufacturer’s
data sheets). The tensile behaviours of the brick and mortar were modelled with
exponential softening after the tensile strength was reached. The tensile strengths
and fracture energies used for the brick crack and mortar joint interface elements
(Section 5.4) were used in this model and are shown in Table 5.9. Cracking was not
included in the epoxy as cracks typically develop in the adjacent masonry instead.
Table 5.9: Material properties used for FE dowel analysis
Property FRP Brick Mortar Epoxy
Elastic modulus (MPa) 210000 26000 5000 2800
Poissons ratio 0.3 0.2 0.2 0.4
Compressive strength (MPa) - 35 5 60
Tensile strength (MPa) - 2.38 0.5 -
Tensile fracture energy (N/mm) - 0.06 0.01 -
A plot of the shear force transferred across the crack versus the shear displa-
cement is shown in Figure 5.32. The stiffness of the joint reduced as crushing
and cracking occurred adjacent to the FRP and the sliding crack as shown in Fi-
gure 5.33. Figure 5.33a is a plot of the equivalent von mises plastic strain (at 2.8
mm shear displacement), which indicates plastic damage (compression and cra-
cking). Figure 5.33b is a plot of the normal crack strain at the element integration
points (at 2.8 mm shear displacement) and illustrates the crack pattern.
At 2.8 mm shear displacement (shear force ≈ 7 kN) the tensile stress in the FRP
reached the rupture stress of the FRP (2400 MPa). Rupture of the FRP was not, ho-
wever, observed in the diagonal tension/shear tests. This model therefore repre-
sents an upper bound estimate of the dowel behaviour. To model this behaviour
the relationship shown in Figure 5.32 (but limited to 7 kN) was used to describe
the transverse behaviour of the node interface element.
The maximum shear stress in the FRP was approximately 270 MPa. It was unk-
nown whether this shear stress would cause shear failure across the FRP because
the shear strength of the FRP was unknown (not provided by the manufacturer). It
was assumed that the FRP does not fail in shear, as shear failure was not observed
in the diagonal tension/shear experiments. Whether the FRP failed in shear was
not so important, however, because the purpose of modelling dowel action was to
investigate whether it would likely be significant.
5.5.4 Limitations of the FRP reinforced masonry FE modelThe FRP reinforced masonry model had the following limitations:
• out-of-plane effects caused by non-symmetrical reinforcement placement
on both sides of the panel (such as twisting or bending), were not accounted
for because a two-dimensional model was used,

152 5. Finite element modelling
Figure 5.32: FE model shear force transferred across crack versus shear displace-
ment
(a) Plastic damage (crushing and cracking) (b) Crack pattern
Figure 5.33: FE dowel model damage behaviour

5.6 FE model: FRP reinforced panel specimens 153
• cracking along the inside edge of the FRP as observed experimentally (e.g.
V4A), and the resulting reduction of bond strength of the FRP was not inclu-
ded.
5.6 FE model: FRP reinforced panel specimensA material property set based on a flexural bond strength of 0.5 MPa was used
in the V4, V2, and V2H2 models. The material properties were determined by li-
near interpolation of the ‘weak’ and ‘strong’ properties used previously in the URM
models. The direct tensile strength was estimated as the flexural bond strength
divided by 1.5 = 0.33 MPa (Section 5.3.1). To model panel H4A, the ‘strong’ mor-
tar joint material data set was adopted. To model panel H4B, a material data set
based on a bond strength of 0.8 MPa was used. The direct tensile strength for
H4B was estimated as the flexural bond strength divided by 1.5 = 0.53 MPa (Sec-
tion 5.3.1). For all of the reinforced models a linear relationship was adopted for
G I If(= 0.035−0.49σn). This relationship was in between the lower and upper bound
relationships used for the URM models. The material properties adopted for the
mortar joint interface elements for the FRP reinforced models (and also the URM
models) are shown in Table 5.10.
To model the bond of the vertical FRP reinforcement the bilinear bond slip
relationship determined from pull test specimen S1-C-SG was used in the bond
interface elements (shown in Figure 5.24c). To model the bond of the horizon-
tal reinforcement in the V2H2 model the bond slip relationships determined for
the joint with both zero and 1.0 MPa precompression, determined from pull test
specimens S2-P0-SG and S2-P1-SG respectively, were used. This was done ins-
tead of modelling precompression dependent bond-slip. The behaviour of both
models was the same (i.e. choice of bond slip model made no difference to the
behaviour of the panel). This was because no debonding was observed in the ho-
rizontal strips (see Section 5.6.4). Therefore, to model the bond of the horizontal
reinforcement in the H4 model, only the bond-slip relationship determined for
the joint with 1.0 MPa of compression was used. The parameters describing the
bilinear bond-slip models used in the FE analysis are tabulated in Table 5.11 (see
Figure 3.22, Chapter 3). Note that in all of the bond slip models the value of δ1
was changed (reduced) so that the initial slope of the of the bond slip model was
similar to the linear region of the experimental bond slip curves.
The finite element models of the FRP reinforced panels are shown in Figure 5.34.
The FE mesh representing the masonry and the boundary conditions were the
same as the URM model described previously. In these models a vertical displa-
cement was applied incrementally (displacement control) on the top corner of the
model to simulate loading on the panel.
In all the panel models with vertical reinforcement a model was analysed with
zero dowel strength and another model was analysed with the upper bound esti-
mate of the dowel strength (determined in Section 5.5.3). This was done to inves-
tigate the significance of dowel action.

154
5.Finiteelementmodelling
Table 5.10: Material properties adopted for mortar joint interface elements
Property Units URM(weak) URM(strong) V4, V2, V2H2 H4A H4B
kn(m) N/mm3 308 623 406 623 496
ks(m) N/mm3 128 260 169 260 207
ft (m) MPa 0.09 1.16 0.33 1.16 0.53
G If (m)
N/mm 0.005 0.012 0.007 0.012 0.008
c0 MPa 0.22 1.0 0.40 1.0 0.54
Φi - 0.9 0.9 0.9 0.9 0.9
Φr - 0.56 0.9 0.67 0.9 0.75
Ψ0 - 0.5 0.7 0.55 0.7 0.58
σu MPa -0.75 -1.8 -1.0 -1.8 -1.2
δ - 1.8 2.2 1.9 2.2 2.0
fc MPa 20 32 24 32 27
Cs - 9 9 9 9 9
Gc N/mm 22 25 23 25 24
κp mm 0.010 0.024 0.014 0.024 0.018
G I If
(1) N/mm 0.16 0.34 0.035-0.49σn 0.035-0.49σn 0.035-0.49σn
G I If
(2) N/mm 0.02-0.17σn 0.02-0.17σn - - -
G I If
(3) N/mm 0.05-0.80σn 0.05-0.80σn - - -

5.6 FE model: FRP reinforced panel specimens 155
(a) V4A & V4B (b) V2
(c) H4A & H4B (d) V2H2A & V2H2B
Figure 5.34: FE models of FRP reinforced masonry Diagonal Tension/Shear Tests

156 5. Finite element modelling
Table 5.11: Bilinear bond-slip parameters used in FE model
Specimen Pull test δ1 τmax δmax
specimen (mm) (MPa) (mm)
V4A & V4B S1-C-SG 0.20 13.1 1.77
V2 S1-C-SG 0.20 13.1 1.77
V2H2 (vertical strips) S1-C-SG 0.20 13.1 1.77
V2H2 (horizontal strips - model 1) S2-P0-SG 0.10 8.2 1.30
V2H2 (horizontal strips - model 2) S2-P1-SG 0.10 13.0 1.22
H4 S2-P1-SG 0.10 13.0 1.22
5.6.1 Panels V4A & V4B
In Figure 5.35 the load vertical displacement behaviours of the reinforced FE
models (with and without dowel strength), the URM FE model, and the experi-
ments (V4A and V4B) are plotted. The URM FE model had the same mortar pro-
perties as the reinforced FE models (flexural bond strength = 0.5 MPa).
Figure 5.35: Load displacement behaviour of V4 FE model
URM model (bond strength = 0.5 MPa)
The ultimate load of the URM FE model was 126 kN and the failure mode was
by sliding along a major diagonal crack through the mortar head joints and mor-
tar bed joints. The failure mode was the same as those observed for the URM FE
models in Section 5.4, as shown in Figure 5.21.

5.6 V4 model without dowel strength 157
V4 model without dowel strength
The first significant diagonal crack developed in the model, through the mor-
tar joints, at a vertical displacement of 0.45 mm and a corresponding load of 126
kN (shown in Figure 5.36a). This behaviour was closest to experiment V4B, where
the first crack developed at a vertical displacement of 0.4 mm and a load of 140
kN (compared to 0.4 mm and 172 kN for panel V4A). The initial stiffness of the
model was therefore also more similar to V4B. This suggests that the material pro-
perties used in the model best represented an average of the actual mortar pro-
perties in panel V4B. Also note that the first diagonal crack that developed in this
model was the crack that caused failure in the URM model. This result confirms
what was supposed in the last chapter: that the unreinforced masonry strength of
the strengthened masonry panels is approximately equal to the load when the first
diagonal crack is observed (when tested in diagonal tension/shear).
The FRP reinforced FE model (without dowel strength) reached an ultimate
load of 191 kN, equal to 152% of the URM FE model prediction. This increase in
load carrying capacity shows the significant contribution of reinforcement to the
model. Also, more importantly, the ultimate load of the FE model was very close to
the experimental ultimate loads, being 91% of V4A (210 kN) and 93% of V4B (205
kN). Note that if stronger mortar properties were used to model V4A (to match
the load when the first crack developed) the ultimate load predicted by the model
would likely be larger than the experimental load. This would be reasonable be-
cause the ultimate load of V4A was limited by cracking along the edge of strip 3,
which was not accounted for in the model.
In the model cracks developed through mortar joints throughout the panel as
the vertical displacement increased. This was similar to the experiments except
that in the experiments some brick cracking was also observed. The crack pattern
produced throughout the panel, after a significant amount of damage had occur-
red is shown in Figure 5.36b at 7 mm vertical displacement. The majority of cracks
developed within the middle panel of the panel (between the 2 inside strips - strip
1(S1) and strip 3(S3)). Cracks also extended outside of the FRP strips and created
a sliding plane, starting two courses from the top of the panel and finishing two
courses from the bottom. The behaviour, including the crack development and
the load displacement response, of the model was most similar to V4B. The beha-
viour of the model was also similar to V4A, except that the model did not include
brick cracking along the edge of the FRP strips, which contributed to the failure of
V4A.
Rather than fail by debonding of FRP from the masonry, as observed in both
V4A and V4B, the reinforced panel model (without dowel strength) failed by sliding
along bed joints at the top of the panel. Some crushing of the masonry at the top
corner was also present(shown in Figure 5.36c at 13 mm vertical displacement).
The sliding/crushing failure mechanism developed after 7.5 mm (Figure 5.35), at
a displacement before debonding was observed in the experiments. Once this fai-
lure mechanism had developed the load gradually decreased as the vertical displa-
cement increased.

158 5. Finite element modelling
(a) First crack (vertical disp.=0.45 mm) (b) Distributed cracks (7 mm)
(c) Sliding/compression failure (13 mm)
Figure 5.36: Crack patterns at increasing vertical displacement of FE V4 without
dowel strength

5.6 V4 model without dowel strength 159
The strain distributions along the FRP strips at a vertical displacement of 7 mm
are shown in Figure 5.37 to Figure 5.40. In the figures the strains produced by the
model and recorded during the experiments are compared. The strain distribution
produced by the FE model is also shown superimposed on the crack pattern in
Figure 5.36b. The simulated strain distribution along both inside strips (strip 1 and
strip 3) compared well with the strains recorded in the experiments. The simulated
strain distributions along the outside strips (strip 2 and strip 4), however, were
less than the strains recorded in the experiments. In the model the inside strips
took a greater proportion of the load (see Figure 5.36b). It is likely that the inside
strips reduced crack growth to the outer strips. In the experiments, however, the 2
strips that were next to each other (strip 1 and strip 4, strip 2 and strip 3) were on
opposite sides of the panel and therefore shared more load than was predicted by
the plane stress model.
Plots of strain in the FRP (at strain gauge locations) versus panel vertical dis-
placement produced by the model (without dowel strength) are compared with
results recorded during the experiments in Figure 5.41 to Figure 5.43 (V4A) and
Figure 5.44 to Figure 5.46 (V4B). V4A-strip 4 and V4B-strip 1 were not included
because most of the strain gauges on these strips were damaged during the expe-
riments.
Similar to the experiments the FRP remained inactive until cracks formed (at
approximately 0.4 mm). After the cracks formed the tensile strain in the FRP, in the
vicinity of the cracks, increased. The simulated tensile strains (at strain gauge lo-
cations) in the outside strips (strip 2 and strip 4) increased at a lower rate than the
experiments, due to the model being analysed in two dimensions only (as discus-
sed previously). The simulated tensile strains in strip 3 (an inside strip) increased
at a similar rate to the strains recorded in test V4B, until the sliding failure occurred
at approximately 7.5 mm vertical displacement. Once the sliding plane developed
(in the model) the strain stopped increasing. In the model the strain at SG24 de-
creased and became negative (indicating compressive strain) as the top corner of
the panel crushed. The simulated tensile strains in strip 3 also increased at a simi-
lar rate to the strains recorded in test V4A, however, they should have been higher
because the experimental strains were reduced by cracking along the inside edge
of the strip (which was not accounted for in the model). In general, the simulated
tensile strains in strip 1 increased at a similar rate to the strains recorded in test
V4A, except for the strain at SG3, which was significantly higher in the experiment.
The simulated strains of all the FRP strips were slightly lower than strains recorded
in the experiment (on average).
FRP debonding did not occur in the model. The maximum shear slip in the
bond interface elements, caused by crack opening and tension in the FRP, was
0.195 mm, and was still in the elastic bond range, before δ1 = 0.2. Debonding did
not occur in the model because the tensile strain reached in the FRP in the model
was too low. The debonding behaviour observed in V4A did not occur in the model
because inside cracking, that reduced the bond, was not accounted for.

160 5. Finite element modelling
Figure 5.37: FRP strain distributions at 7 mm vertical displacement (FE model wi-
thout dowel strength, V4A & V4B - Strip 1)
Figure 5.38: FRP strain distributions at 7 mm vertical displacement (FE model wi-
thout dowel strength, V4A & V4B - Strip 2)
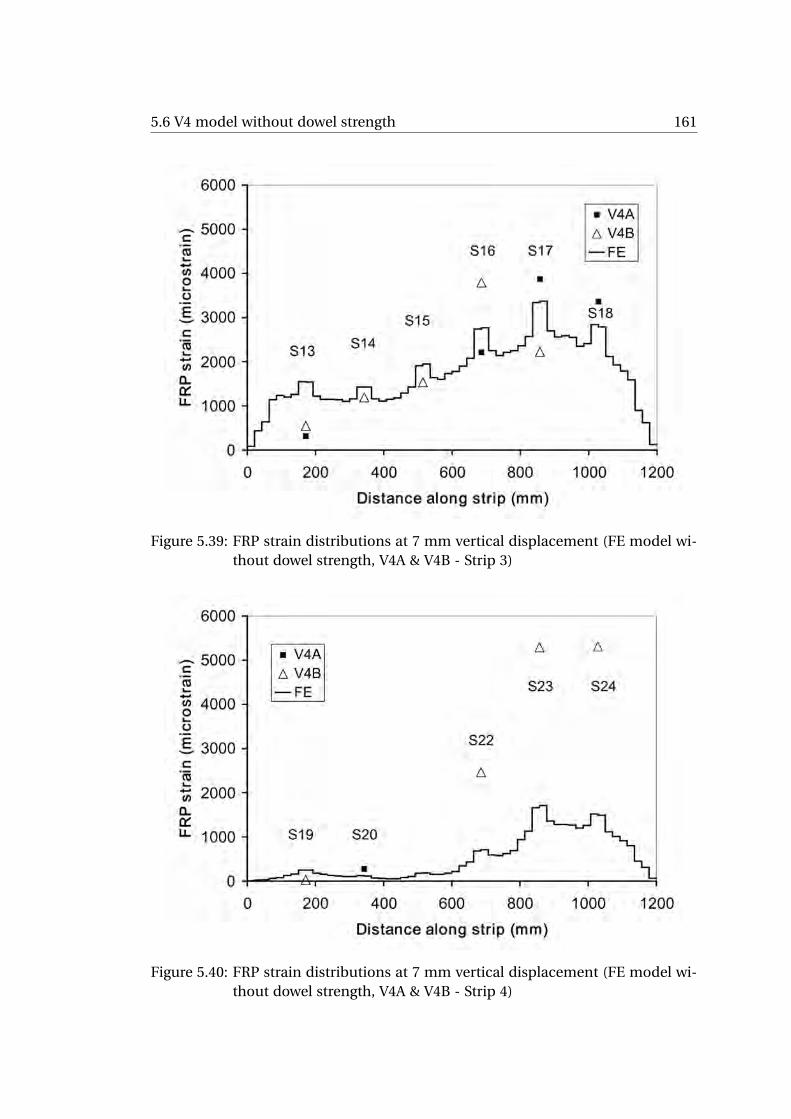
5.6 V4 model without dowel strength 161
Figure 5.39: FRP strain distributions at 7 mm vertical displacement (FE model wi-
thout dowel strength, V4A & V4B - Strip 3)
Figure 5.40: FRP strain distributions at 7 mm vertical displacement (FE model wi-
thout dowel strength, V4A & V4B - Strip 4)

162 5. Finite element modelling
Figure 5.41: FRP strain versus vertical displacement (V4A and FE model without
dowel strength - Strip 1)
Figure 5.42: FRP strain versus vertical displacement (V4A and FE model without
dowel strength - Strip 2)
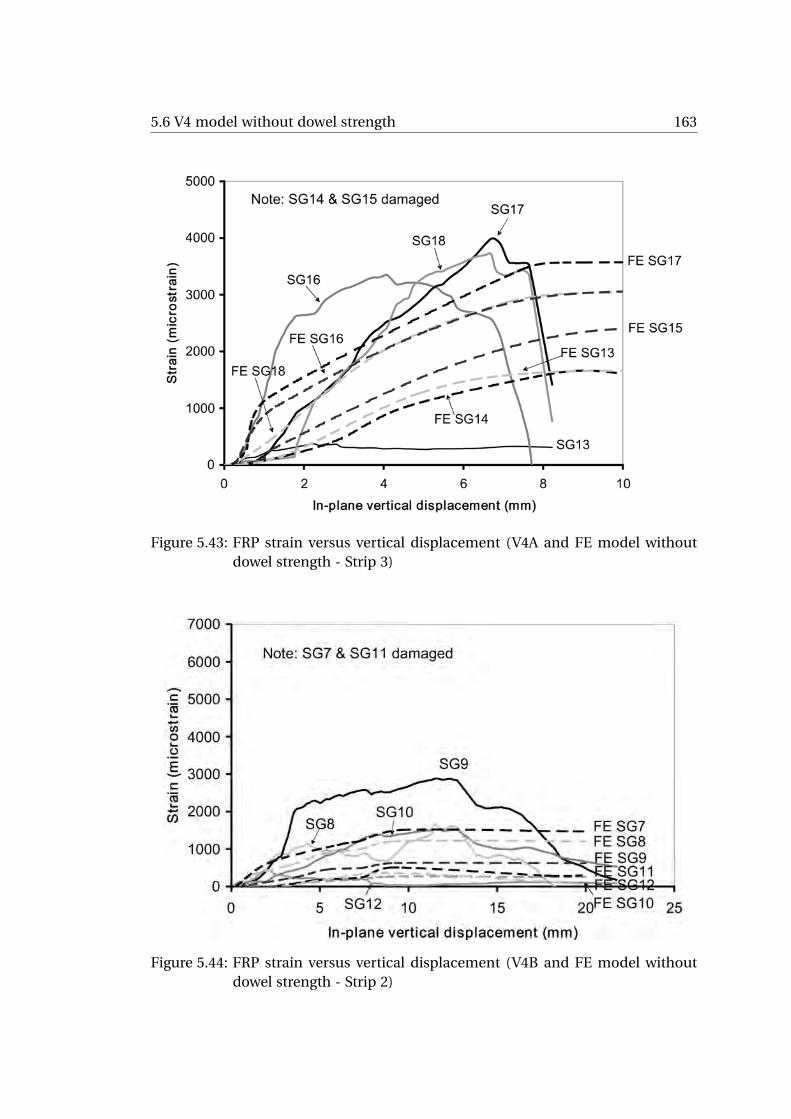
5.6 V4 model without dowel strength 163
Figure 5.43: FRP strain versus vertical displacement (V4A and FE model without
dowel strength - Strip 3)
Figure 5.44: FRP strain versus vertical displacement (V4B and FE model without
dowel strength - Strip 2)

164 5. Finite element modelling
Figure 5.45: FRP strain versus vertical displacement (V4B and FE model without
dowel strength - Strip 3)
Figure 5.46: FRP strain versus vertical displacement (V4B and FE model without
dowel strength - Strip 4)

5.6 V4 model with dowel strength 165
V4 model with dowel strength
The load displacement behaviour of the FE model with dowel strength is shown
in Figure 5.35. With dowel strength included the model attained an ultimate load
of 205 kN, which was 98% of the ultimate load of V4A and 100% of the ultimate
load of V4B. The sliding failure that occurred in the model without dowel strength
was prevented (by the increased shear resistance), and instead the model failed
by crushing at the top corner of the masonry (as shown in Figure 5.47 at 13 mm
vertical displacement). This resulted in a gradual drop in load. Before crushing
occurred the crack pattern and behaviour was similar to the FE model without
dowel strength (and therefore also panel V4B).
Figure 5.47: Crack pattern of V4 model with dowel strength (in-plane vertical dis-
placement = 13 mm)
As the top corner of the panel crushed, cracks through the mortar joints conti-
nued to develop, and the tensile strains in the FRP continued to increase. This is
shown in Figure 5.48, where the tensile strain at SG17 (maximum strain in strip 3
in FE model) is plotted against the vertical displacement for the models with do-
wel strength and without dowel strength. The experimental results at SG17, and
the results of SG16 from V4B (maximum recorded strain in the test) are also plot-
ted. The strain at SG17 increased at a similar rate in both FE models (with and
without dowel strength) until sliding failure occurred in the model without dowel
strength and caused the tensile strain in the FRP to stop increasing. As the dowel
strength prevented the sliding failure, the tensile strain continued to increase, si-
milar to experiment V4B. The maximum strain in strip 3 in the model (with dowel
strength) was, however, lower than the maximum strain recorded in experiment
V4B (at SG16).
The strain in the FRP was still not high enough to cause complete debonding
of the FRP from the masonry in this model. The maximum shear slip in the bond
interface elements (caused by tensile loading in the FRP) was 0.362 mm, which
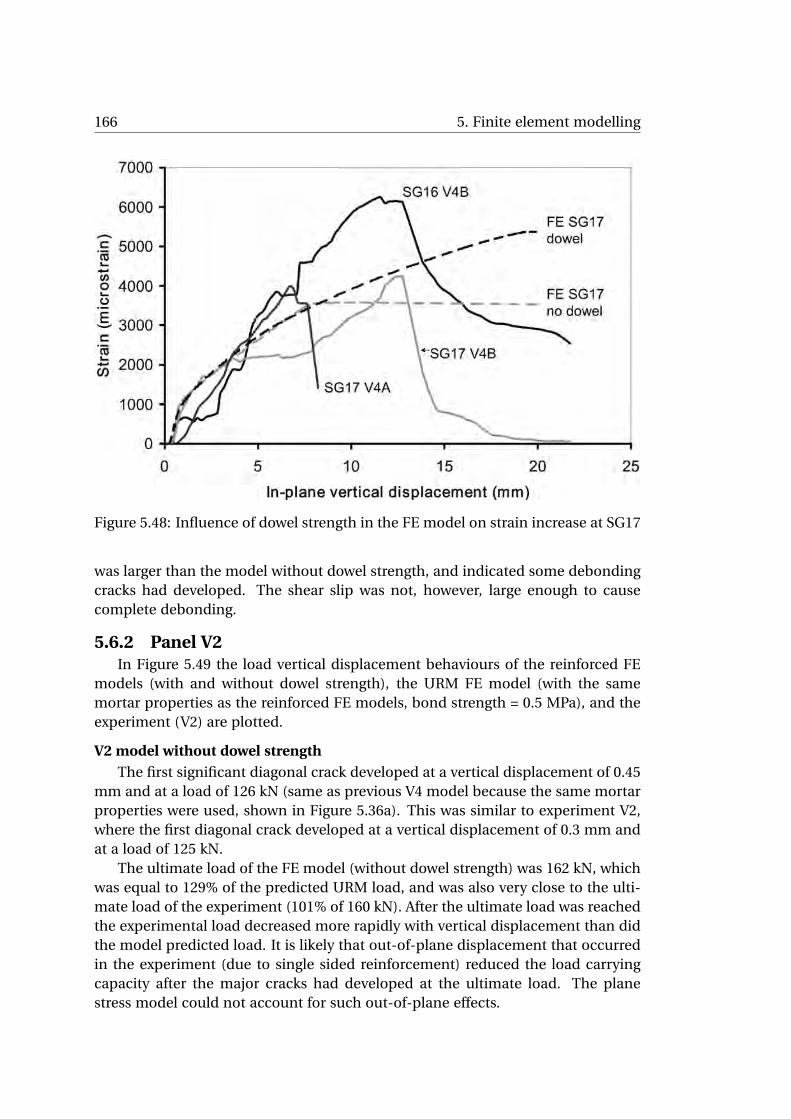
166 5. Finite element modelling
Figure 5.48: Influence of dowel strength in the FE model on strain increase at SG17
was larger than the model without dowel strength, and indicated some debonding
cracks had developed. The shear slip was not, however, large enough to cause
complete debonding.
5.6.2 Panel V2In Figure 5.49 the load vertical displacement behaviours of the reinforced FE
models (with and without dowel strength), the URM FE model (with the same
mortar properties as the reinforced FE models, bond strength = 0.5 MPa), and the
experiment (V2) are plotted.
V2 model without dowel strength
The first significant diagonal crack developed at a vertical displacement of 0.45
mm and at a load of 126 kN (same as previous V4 model because the same mortar
properties were used, shown in Figure 5.36a). This was similar to experiment V2,
where the first diagonal crack developed at a vertical displacement of 0.3 mm and
at a load of 125 kN.
The ultimate load of the FE model (without dowel strength) was 162 kN, which
was equal to 129% of the predicted URM load, and was also very close to the ulti-
mate load of the experiment (101% of 160 kN). After the ultimate load was reached
the experimental load decreased more rapidly with vertical displacement than did
the model predicted load. It is likely that out-of-plane displacement that occurred
in the experiment (due to single sided reinforcement) reduced the load carrying
capacity after the major cracks had developed at the ultimate load. The plane
stress model could not account for such out-of-plane effects.

5.6 V2 model without dowel strength 167
Figure 5.49: Load displacement behaviour of V2 FE model
In the model cracks developed through mortar joints throughout the panel as
the vertical displacement increased. The predicted crack pattern at 4 mm vertical
displacement is shown in Figure 5.50a, and was similar to the experiment. The
cracks were more distributed in the model, but a sliding plane developed, that was
similar to that observed in the experiment. The sliding plane started two courses
from the top and ended two courses from the bottom. It is likely that the reason
why cracks did not spread in the experiment (as predicted in the model) was be-
cause the out-of-plane deformation reduced the redistribution of forces within the
panel, and that reduced further crack development. Like the model for V4 with no
dowel strength, this model eventually failed by sliding failure along the bed joints
after approximately 7.5 mm vertical displacement (Figure 5.50b). Debonding did
not occur in the FE model (similar to the experiment).
The tensile strain distribution along FRP strips in the model and experiment
are shown in Figure 5.51 and Figure 5.52 (at 4 mm vertical displacement). The FE
model strain distributions were slightly higher than the strains recorded during the
experiments, but otherwise matched well. The tensile strains were at a maximum
at locations where the FRP crossed major cracks, and reduced along the length of
the FRP (away from those cracks) as the load was transferred into the masonry.
As previously discussed, after the peak load was reached the experimental pa-
nel bent in the out-of-plane direction. This out-of-plane deformation in the ex-
periment would likely result in less crack opening (on the reinforced side of the
panel) and thus less strain in the FRP compared to the model. Also, the redu-

168 5. Finite element modelling
(a) Distributed cracks (4 mm vert. disp.) (b) Sliding failure (13 mm vert. disp.)
Figure 5.50: Crack patterns at increasing vertical displacement of FE V2 without
dowel strength
Figure 5.51: FRP strain distributions at 4 mm vertical displacement (FE model, V2
- Strip 1)

5.6 V2 model with dowel strength 169
ced tensile strain in the FRP may explain the lower peak load in the experiment
compared to the model. Figure 5.51 and Figure 5.52 show the experimental FRP
strains were less than the model FRP strains, so the results are reasonable. It can
be concluded that, for reinforcement on one side only, the model assumption of
in-plane behaviour is not entirely correct but the error is small.
Plots of tensile strain in the FRP strips (at strain gauge locations) versus panel
vertical displacement produced by the model are compared with results recorded
during the experiment in Figure 5.53 and Figure 5.54. The results of the experiment
were only plotted to 4.5 mm, because the potentiometers ran out of range as dis-
cussed in Chapter 4. The tensile strain in the model started increasing at approxi-
mately the same displacement (when the first crack formed) and increased at a
rate slightly greater than the experiments (up to 4.5 mm). Again, this is likely a re-
sult of out-of-plane bending in the experiment. Out-of-plane bending reduced the
FRP strain in the experiment compared to the model (which ignores out-of-plane
effects).
V2 model with dowel strength
The load displacement behaviour of the V2 model with dowel strength is shown
in Figure 5.49. In general the behaviour of this model was very similar to the V2
model without dowel strength. The model was stronger, however, with an ultimate
load of 173 kN (108% of V2), and some crushing at the top corner of the model
occurred with sliding along the bed joints at the top of the panel. Adding dowel
strength to this model did not change the strains in the FRP strips.
The results of the model without dowel strength were closer to the results of
V2. This was reasonable because large bending of both FRP strips was observed in
V2, indicating the dowel contribution of the reinforcement was close to zero.
5.6.3 Panels H4A & H4B
In Figure 5.55 the load vertical displacement behaviours of the reinforced FE
model (with strong mortar properties, see Table 5.10), the URM FE model (strong
mortar) and the experiments, H4A and H4B, are plotted. Note that dowel strength
was not modelled for the case of horizontal reinforcement since the FRP strips are
aligned parallel to sliding planes.
The behaviour of the model was different to the behaviour of panel H4A. In the
reinforced model, the horizontal FRP restrained the opening of a diagonal crack
that formed through mortar joints, along the loaded diagonal. The panel even-
tually failed by sliding along an unstrengthened bed joint at the top of the panel
(see Figure 5.56a). In the FE model the horizontal reinforcement did not signifi-
cantly increase the ultimate load of the panel. It did, however, change the failure
mode and increase the ductility. The ultimate load of the FE model was 283 kN,
and was close to the ultimate load of panel H4A (264 kN).
The model crack pattern and resulting FRP strains were unlike those observed
in H4A. In H4A a diagonal crack did not form along the loaded diagonal, but ins-
tead the crack shown in Figure 5.56b formed. The crack was only intersected by

170 5. Finite element modelling
Figure 5.52: FRP strain distributions at 4 mm vertical displacement (FE model, V2
- Strip 2)
Figure 5.53: FRP strain versus vertical displacement (V2 and FE model without do-
wel strength - Strip 1)

5.6 Panels H4A & H4B 171
Figure 5.54: FRP strain versus vertical displacement (V2 and FE model without do-
wel strength - Strip 2)
Figure 5.55: Load displacement behaviour of H4 FE model (with ‘strong’ mortar
properties)

172 5. Finite element modelling
one FRP strip. This strip acted to keep the section of masonry outside the crack
from falling off the panel, but likely did not contribute significantly to the load
carrying capacity of the panel. It was thought that the behaviour of panel H4A
would have been similar without the horizontal reinforcement.
(a) Crack pattern of reinforced model (b) Crack pattern of H4A
Figure 5.56: Comparison of failure modes between H4A and H4 FE model with
bond strength = 1.11 MPa (strong mortar)
The load displacement behaviours of the URM model (bond strength = 0.8
MPa), the reinforced model (bond strength = 0.8 MPa) and panel H4B are shown
in Figure 5.57.
The URM model reached an ultimate load of 159 kN and failed by sliding along
a diagonal crack through the mortar joints (same as URM models in previous sec-
tions). The sliding crack first developed at a panel vertical displacement of ap-
proximately 0.4 mm.
The behaviour of the reinforced model with bond strength = 0.8 MPa was si-
milar to H4B. The horizontal reinforcement restrained the opening of the diago-
nal crack that developed at 0.4 mm (the crack which caused failure in the URM
model). This diagonal crack is shown in Figure 5.58a at 0.78 mm vertical displace-
ment. The panel eventually failed by sliding along an unstrengthened bed joint at
the top of the panel (shown in Figure 5.58b at 2 mm vertical displacement).
The horizontal reinforcement (in the FE model) increased the ultimate load of
the panel to 186 kN (117% of the FE URM model). This was different from the
experiment where the maximum load (185 kN) was not significantly higher than
the load at the formation of the first crack (183 kN ≈ unreinforced strength of the
panel). In the model the vertical displacement before sliding occured was 1.7 mm.
This was larger than the experiment where sliding occurred after 0.78 mm panel
vertical displacement.

5.6 Panels H4A & H4B 173
Figure 5.57: Load displacement behaviour of H4 FE model (bond strength = 0.8
MPa)
(a) Diagonal crack restrained by FRP (b) Failure along unstrengthened bed joint
Figure 5.58: Behaviour of H4 FE model (bond strength = 0.8 MPa)

174 5. Finite element modelling
The tensile strain distributions along the FRP strips, calculated by the model
and recorded during the testing of H4B, at a panel vertical displacement of 0.78
mm (immediately before the failure of experiment H4B) are shown in Figure 5.59
to Figure 5.62. The corresponding crack patterns of the model and experiment
were already shown at this vertical displacement in Figure 5.58a and Figure 4.28c,
respectively. In the FE model some secondary cracks developed next to the main
diagonal crack, as indicated by the two peaks in the strain distribution (most no-
ticeable in strip 1). These cracks can be seen in Figure 5.58a. Some secondary
cracks also developed in the experiment that were not present in the model at 0.78
mm vertical displacement at strain gauge locations 9 and 14. These cracks did,
however, develop in the model at a later stage.
Plots of the tensile strain in the FRP strips (at strain gauge locations) versus ver-
tical displacement produced by the FE model are compared with the results of H4B
in Figure 5.63 to Figure 5.66. The strain in the FRP was constant after the sliding
crack developed at the top of the panel because the FE model did not completely
fall apart (unlike the experiments , where the test was stopped after failure along
the unstrengthened joint). The model strain results matched the experimental re-
sults well. Note that the strain increased at different points along the FRP strips in
some cases because cracks developed in different places (e.g. in the model a crack
developed at SG 23, whereas in the experiment it developed at SG24). As mentio-
ned previously the strain at SG9 and SG14 increased in the model after 0.78 mm
vertical displacement as cracks developed in the panel.
Debonding did not occur in the model (it was not observed in the experiment
either). The maximum slip of the bond-slip interface elements was 0.09 mm, and
was still within the elastic range.
5.6.4 Panels V2H2A & V2H2B
V2H2 models without dowel strength
The V2H2 model was simulated with two different FRP-to-masonry bond-slip
relationships, representing the bond-slip relationships of a horizontal strip with 0
and 1 MPa of applied compression (Section 5.6). The behaviours of both of these
models were very similar. The similarity is shown in the load displacement graph
(Figure 5.67). The model with the bond-slip relationship determined for a hori-
zontal strip with 1 MPa applied compression is used for the following discussions.
The load displacement behaviours of the experiments (V2H2A and V2H2B), and
the URM model are also shown in Figure 5.67.
The behaviour of the model was similar to both experiments (but not including
the out-of-plane effects). The first diagonal crack developed at 0.4 mm and 126
kN (similar to other models) and was close to experiment V2H2B, where the first
crack developed at approximately 0.4 mm and 120 kN. The initial stiffness of the
FE model also closely matched the initial stiffness of panel V2H2B.
The ultimate load of the reinforced model was 189 kN. This was equal to 150%
of the URM ultimate load (126 kN), and was within the variability of the experi-
ments (92% of V2H2A (206 kN) and 120% of V2H2B (158 kN)).
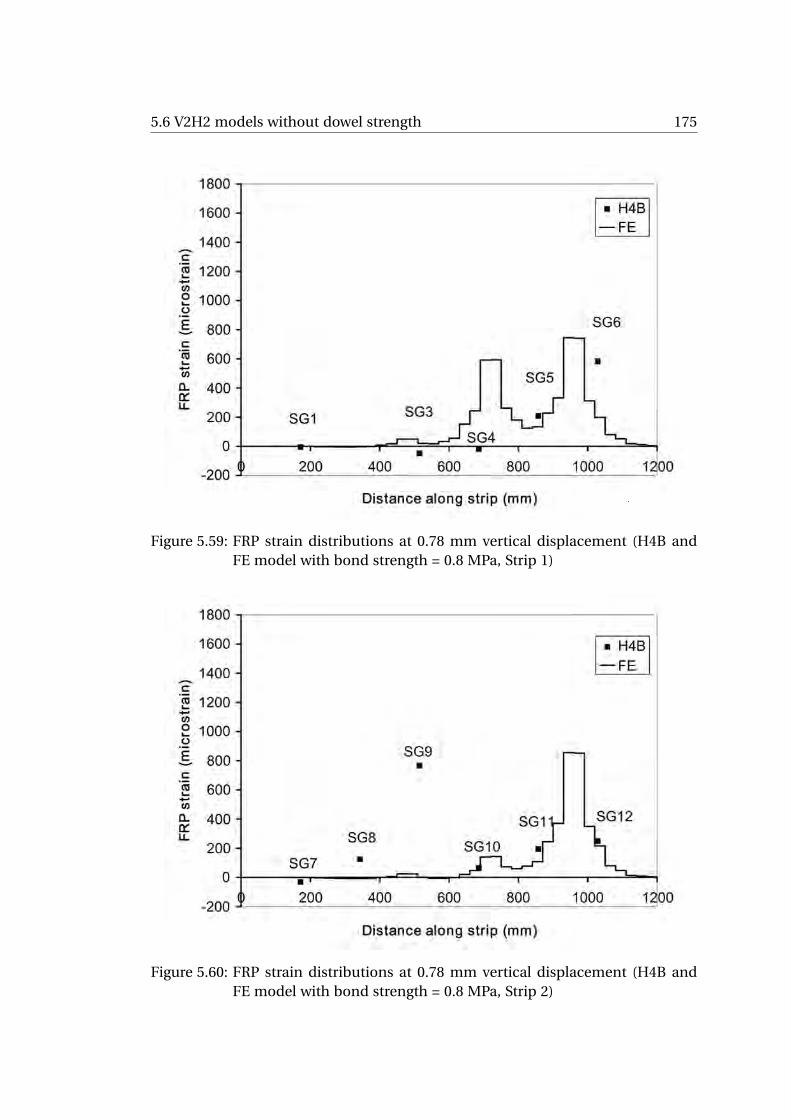
5.6 V2H2 models without dowel strength 175
Figure 5.59: FRP strain distributions at 0.78 mm vertical displacement (H4B and
FE model with bond strength = 0.8 MPa, Strip 1)
Figure 5.60: FRP strain distributions at 0.78 mm vertical displacement (H4B and
FE model with bond strength = 0.8 MPa, Strip 2)

176 5. Finite element modelling
Figure 5.61: FRP strain distributions at 0.78 mm vertical displacement (H4B and
FE model with bond strength = 0.8 MPa, Strip 3)
Figure 5.62: FRP strain distributions at 0.78 mm vertical displacement (H4B and
FE model with bond strength = 0.8 MPa, Strip 4)

5.6 V2H2 models without dowel strength 177
Figure 5.63: FRP strain versus vertical displacement (H4B and FE model with bond
strength = 0.8 MPa, Strip 1)
Figure 5.64: FRP strain versus vertical displacement (H4B and FE model with bond
strength = 0.8 MPa, Strip 2)

178 5. Finite element modelling
Figure 5.65: FRP strain versus vertical displacement (H4B and FE model with bond
strength = 0.8 MPa, Strip 3)
Figure 5.66: FRP strain versus vertical displacement (H4B and FE model with bond
strength = 0.8 MPa, Strip 4)

5.6 V2H2 models without dowel strength 179
Figure 5.67: Load displacement behaviour of V2H2 FE model (no dowel strength)
The crack pattern of the FE model at a vertical displacement of 4 mm is shown
in Figure 5.68a. The crack pattern produced by the model was similar to the crack
patterns observed in the experiments, except that in the model most of the cracks
developed in the mortar joints, whereas some cracks through the bricks were ob-
served in the experiments. The FE model failed by sliding along a crack formed
along bed joints above horizontal FRP strip 2, which developed after approxima-
tely 3.9 mm vertical displacement (failure mode shown in Figure 5.68b at a vertical
displacement of 15 mm). A similar crack also developed in the experiments, about
which the out-of-plane twisting of the top section of the panel occurred.
The strain distributions in the FRP strips for the FE model and experiments at
a panel vertical displacement of 4 mm (before significant out-of-plane behaviour
occurred in the experiments) are shown in Figure 5.69 to Figure 5.72. In general,
the strain distribution in the horizontal FRP strips (strip 1 and strip 2) produced
by the model matched the experimentally recorded strains. Some of the peaks in
the model occurred at different locations along the strip compared to the experi-
ments because in the experiments some cracks developed through the brick units
(e.g. next to SG5), whereas in the model all the cracks developed through the mor-
tar joints. The strain distributions in the vertical FRP strips (strip 3 and strip 4),
produced by the model, were lower (in most cases) than the experimentally recor-
ded strains, but the locations of the maximum strains were similar (along the main
diagonal crack). Although most of the predicted strain distributions in the vertical
strips were lower than the experiment, the predicted strain distribution in strip 4
matched the results of V2H2B well.

180 5. Finite element modelling
(a) Crack pattern (4 mm) (b) Sliding failure at top of panel (15 mm)
Figure 5.68: Crack patterns of FE V2H2 with no dowel strength
Figure 5.69: FRP strain distributions at 4 mm vertical displacement (FE model,
V2H2A & V2H2B - Strip 1)

5.6 V2H2 models without dowel strength 181
Figure 5.70: FRP strain distributions at 4 mm vertical displacement (FE model,
V2H2A & V2H2B - Strip 2)
Figure 5.71: FRP strain distributions at 4 mm vertical displacement (FE model,
V2H2A & V2H2B - Strip 3)

182 5. Finite element modelling
The FRP strains versus the vertical displacement (at gauge locations) produced
in the model are compared to the results of experiment V2H2A in Figure 5.73 and
Figure 5.74 (horizontal strips), and Figure 5.75 and Figure 5.76 (vertical strips). The
FRP strains versus the vertical displacement produced in the model are also com-
pared to the results of experiment V2H2B in Figure 5.77 and Figure 5.78 (horizontal
strips) and Figure 5.79 and Figure 5.80 (vertical strips). The strain recorded at SG5
in both experiments was higher than predicted by the model because a crack deve-
loped through the brick and was intersected by the horizontal reinforcement close
to the gauge. For a better comparison between the model and the experiment the
strain in the FRP crossing the mortar joint between SG5 and SG6 (where the crack
developed in the model) was also plotted.
The strain behaviour in the horizontal strips, predicted by the model, was si-
milar to the experiments. In the model the strains in the horizontal reinforcement
increased as cracks (that were intersected by the reinforcement) developed, at a
similar rate to that observed in the experiments. The predicted strains in the hori-
zontal strips became constant once the crack developed above horizontal strip 2,
through the mortar bed joints, and sliding occurred. In the experiments the strains
in the horizontal reinforcement also stopped increasing once significant cracking,
that was not intersected by the horizontal reinforcement, developed. In the experi-
ments this cracking occurred above horizontal strip 2 and below horizontal strip 1,
and allowed out-of-plane deformation to occur. In V2H2A the strains in both ho-
rizontal strips became constant and in V2H2B the strain in strip 1 decreased and
the strain in strip 2 became constant. The maximum strain in the horizontal rein-
forcement in the FE model and experiment were similar. The strains were similar
because the failure cracks developed at approximately the same vertical displace-
ment.
In the model the strains in the vertical reinforcement increased as cracks (that
were intersected by the reinforcement) developed. When the sliding crack develo-
ped in the model the strain in the FRP close to the crack decreased and the strain
in the FRP away from the crack became constant. The behaviour of the vertical
reinforcement in the model was different than the behaviour of the vertical rein-
forcement in the experiments. In the experiments the strains recorded in most
of the vertical strips were larger than the strains produced by the FE model. The
strain in FRP strip 3 in panel V2H2B was large enough to cause debonding of the
FRP strip from the bottom of the panel (near SG18), which did not occur in the FE
model. Also, the simulated tensile strains in the vertical strips should have been
higher than the strains recorded in panel V2H2A because the experimental strains
were reduced by cracking along the inside edge of the strip (which was not ac-
counted for in the model).
In both the experiments debonding occurred at the bottom of strip 3 at the
later stages of the test (vertical displacement = 12 mm for V2H2A and vertical dis-
placement = 10 mm for V2H2B). Debonding was not, however, observed in the FE
model.

5.6 V2H2 models without dowel strength 183
Figure 5.72: FRP strain distributions at 4 mm vertical displacement (FE model,
V2H2A & V2H2B - Strip 4)
Figure 5.73: FRP strain versus vertical displacement (V2H2A and FE model with no
dowel strength, Strip 1)

184 5. Finite element modelling
Figure 5.74: FRP strain versus vertical displacement (V2H2A and FE model with no
dowel strength, Strip 2)
Figure 5.75: FRP strain versus vertical displacement (V2H2A and FE model with no
dowel strength, Strip 3)
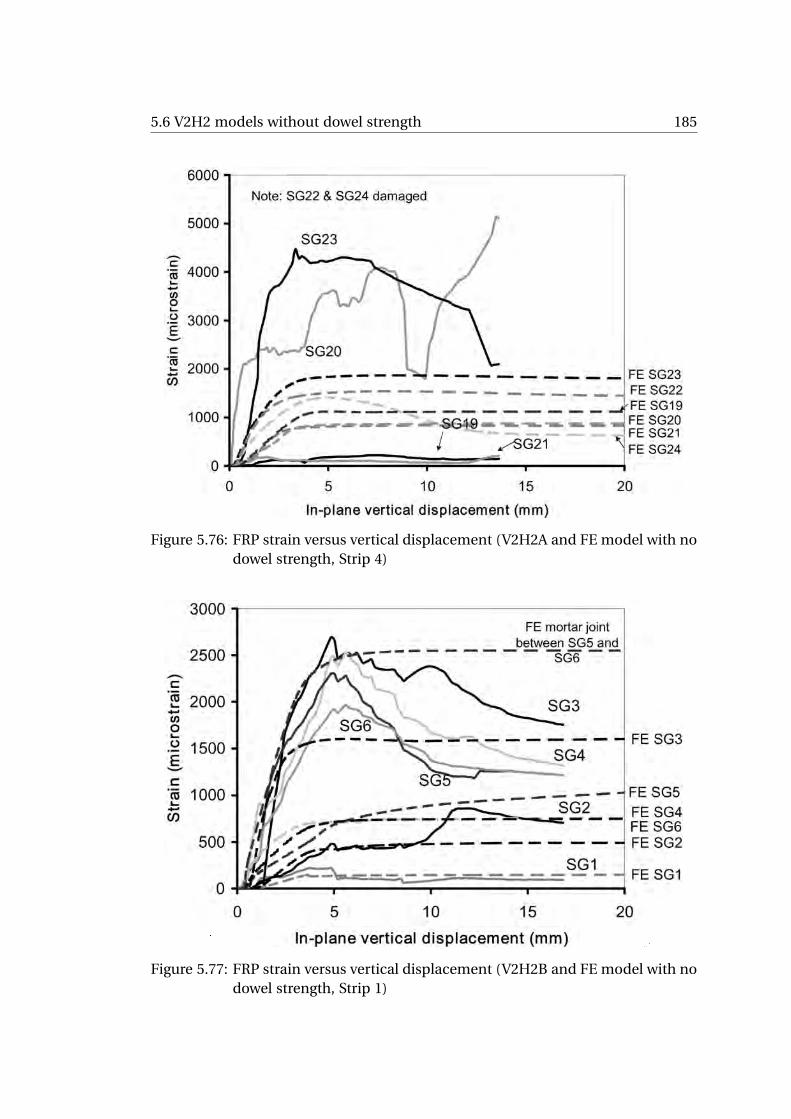
5.6 V2H2 models without dowel strength 185
Figure 5.76: FRP strain versus vertical displacement (V2H2A and FE model with no
dowel strength, Strip 4)
Figure 5.77: FRP strain versus vertical displacement (V2H2B and FE model with no
dowel strength, Strip 1)

186 5. Finite element modelling
Figure 5.78: FRP strain versus vertical displacement (V2H2B and FE model with no
dowel strength, Strip 2)
Figure 5.79: FRP strain versus vertical displacement (V2H2B and FE model with no
dowel strength, Strip 3)

5.6 V2H2 model with dowel strength 187
V2H2 model with dowel strength
Dowel strength was provided to the vertical reinforcement in the FE model. In
this model the node interface elements used for the horizontal and vertical strips
shared the same material data set. As a result the horizontal reinforcement also
had dowel strength. The addition of dowel strength to the horizontal strip was
unlikely to significantly affect the results, as the horizontal strips are parallel to sli-
ding planes. The load displacement behaviour of the model with dowel strength
is plotted alongside the load displacement behaviours of the model without do-
wel strength, the URM FE model, and the experiments (V2H2A and V2H2B) in Fi-
gure 5.81. The masonry material property set with flexural bond strength = 0.5
MPa was used for all models.
In general the behaviour of the V2H2 model with dowel strength was very si-
milar to the V2H2 model without dowel strength. The model with dowel strength
was stronger, however, with an ultimate load of 201 kN (98% of V2H2A (206 kN)
and 127% of V2H2B (158 kN)), and some crushing at the top corner of the model
occurred with sliding along the bed joints at the top of the panel. Also, adding do-
wel strength to this model did not change the strains in the FRP strips significantly.
The model with dowel strength did not provide a better match to the results of the
experiments.
5.7 Summary and conclusionsA finite element (FE) model was used to simulate the behaviour of the unrein-
forced and strengthened panel tests reported in the previous chapter. The ma-
sonry was modelled using the micro-modelling approach, with material properties
determined from experimental characterisation tests. The FRP was attached to the
masonry in the FE model using the bond-slip relationships derived from the pull
tests (Chapter 3).
The unreinforced masonry model, simulated with material properties determi-
ned from the characterisation tests on both the weak and strong mortar joints, en-
veloped the experimental load-displacement results well. The failure mode of the
unreinforced panel model was sliding along diagonal cracks through the mortar
joints. This failure mode matched the observed failure modes from the experi-
ments.
The FRP strengthened masonry FE models compared very well with the expe-
rimental behaviour. The load-displacement, crack development and the FRP rein-
forcement contribution was similar until either sliding/crushing failure occurred
in the FE model or out-of-plane effects became significant in the experiment (due
to non-symmetric reinforcement).
The effect of dowel strength on the behaviour of the strengthened panels was
investigated by running analyses with and without dowel strength. The dowel
strength contribution was determined using a simple finite element model and es-
timated material properties. Including dowel strength in the V2 and V2H2 models
increased the load capacity of the panel models only slightly and did not change
the overall behaviour of the panels. The panel models without dowel strength pro-

188 5. Finite element modelling
Figure 5.80: FRP strain versus vertical displacement (V2H2B and FE model with no
dowel strength, Strip 4)
Figure 5.81: Load displacement behaviour of V2H2 FE model (dowel strength mo-
del included)

5.7 Summary and conclusions 189
vided a better match to the experimental results. By providing dowel strength in
the V4 model the sliding failure was prevented. The increased sliding resistance
increased the load capacity of the panel until crushing occurred at the top corner.
The results of all the FE models suggest that dowel action is a secondary shear
resisting mechanism. The primary shear resisting mechanism is the increase in
friction from the FRP resisting dilation.
In Chapter 4 the unreinforced masonry strength of the strengthened panels was
estimated as the load when the first cracks were observed. This assumption was
confirmed with the FE model, by comparing the results of the unreinforced and
strengthened models with the same masonry bond strength. The effectiveness
of the FRP strengthening was demonstrated by comparing the unreinforced and
strengthened models.
Different bond-slip models were used for the horizontal reinforcement, based
on the amount of precompression applied to the joint. The difference in panel be-
haviour was insignificant because debonding of the horizontal strips did not occur
in the model (or experiment).
Complete debonding of the FRP strips from the masonry did not occur in any
of the FE models (unlike in the experiments). In some of the experiments debon-
ding was premature due to cracking parallel to the interface. Therefore the ex-
perimental debonding resistance was reduced. This was not accounted for in the
idealised FE model. Also, in the idealised model, debonding only occurred by the
FRP being loaded in direct tension. Other (unknown) factors not accounted for in
the idealised model may have also influenced debonding in the experiments.


6
Conclusions/Recommendations
6.1 Summary and conclusionsA combined experimental and numerical investigation was conducted in this
thesis to investigate the in-plane shear behaviour of NSM FRP strengthened ma-
sonry panels. The work involved: characterising the shear bond behaviour bet-
ween NSM FRP strips and masonry using experimental pull tests, conducting ex-
perimental tests on FRP strengthened wall panels, and modelling the results of the
experimental wall panel tests with a finite element model.
The work carried out in this thesis contributes to the discussion on the use of
NSM FRP strips for the in-plane shear strengthening of masonry wall panels. The
specific contributions made in this thesis include:
1. Experimental results of pull tests with vertically or horizontally aligned FRP
strips bonded to clay brick masonry. In the case of pull tests with horizontal
reinforcement, results for specimens with different levels of compression ap-
plied perpendicular to the strip were used to simulate vertical compression
loading in walls.
2. Experimental test results for NSM FRP strengthened masonry panels subjec-
ted to in-plane shear load (using the same masonry and FRP specification as
in 1 above). Reinforcement orientations included: vertical, horizontal, and a
combination of both.
3. The development of a unique finite element modelling strategy, which was
designed to explicitly model the reinforcement mechanism of the NSM FRP
reinforcement.
4. In depth analysis on failure modes and reinforcing mechanisms of NSM FRP
strengthened masonry wall panels using the combination of experimental
results and advanced finite element modelling.
In summary, the main findings are as follows:
1. The behaviour of the NSM FRP-to-masonry bond is affected by the orienta-
tion of the strip, the presence of mortar joints parallel to the FRP strip and
the amount of compression applied perpendicular to the strip. The bond
191

192 6. Conclusions/Recommendations
strength of a vertically aligned FRP strip is higher than the bond strength of
a horizontally aligned FRP strip. The presence of mortar joints parallel to the
FRP strip reduces the region of masonry effective in load transfer and thus
reduces the bond strength. Compression applied perpendicular to horizon-
tally aligned FRP strips increases the bond strength.
2. NSM FRP strips are an effective shear strengthening technique. Vertical strips
bonded into the brick units are effective at restraining both the opening of
diagonal cracks and sliding along mortar joint cracks, resulting in increases
in strength and ductility. Horizontal strips bonded into the brick units are
only effective at restraining the opening of diagonal cracks. Horizontal rein-
forcement is most effective when combined with vertical reinforcement that
is designed to restrain mortar bed joint sliding.
3. The main failure modes of wall panels strengthened with vertical reinforce-
ment are: debonding of the FRP from the surface of the masonry, and cra-
cking through the thickness of the panel, parallel to the FRP-brick interface.
Cracking through the thickness of the panel, parallel to the FRP-brick inter-
face reduces the bond between the FRP and the masonry and reduces the
expected debonding resistance. It seems that the groove depth (required for
the NSM strip) is a key factor influencing the development of these cracks.
The results suggest that minimising groove depth would be a key factor in
enhancing the overall behaviour of a strengthened masonry wall.
4. The main failure mode of wall panels strengthened with only horizontal rein-
forcement was by sliding along a mortar bed joint. Vertical reinforcement is
required to control sliding failure (see above).
5. The main shear-resisting mechanism of the vertical NSM strips is the in-
crease in friction resulting from FRP reinforcement resisting shear-induced
dilation. Dowel strength of the vertical NSM FRP reinforcement is a negli-
gible, or possibly a secondary shear-resisting mechanism.
6. Non-symmetrical strengthening schemes cause out-of-plane twisting in the
diagonal tension/shear test. However, in a wall the additional edge restraint
will reduce the out-of-plane deformation.
7. The proposed finite element modelling strategy is able to predict the full
non-linear response of NSM FRP strengthened masonry panels.
6.2 Limitations and proposed future work1. The model was limited in that it was two-dimensional and it did not account
for the three-dimensional effects resulting from the non-symmetric streng-
thening. A three-dimensional model is needed to capture this behaviour.
Another limitation of the model was that it did not account for cracking
through the thickness of the wall panel, parallel to the FRP-brick interface.

6.2 Limitations and proposed future work 193
A model that is able to predict the initiation and propagation of these cracks
is needed.
2. In this project only monotonic loading was considered. As most walls re-
quire strengthening against earthquake loads, future research needs to be
extended to include cyclic loading. This research would include: quantifying
the effect of cyclic loading on the shear bond behaviour between NSM FRP
strips and masonry; testing strengthened walls under cyclic loading; and ma-
king further additions to the FE model to include load reversals.
3. Current analytical models used to determine the strength of FRP strengthe-
ned shear walls were reviewed in Section 2.8 on page 30. These methods are,
however, unsuitable for use as general design methods because they are spe-
cific to certain strengthening procedures and have been verified with only
a limited number of experimental results. These models are based on the
truss analogy, which assumes plastic stress redistribution, and therefore may
be unsuitable for FRP strengthened structures. Also, none of the models in-
clude the main strengthening mechanism observed in the current research:
that the vertical FRP increases the friction along a sliding joint by resisting
dilation.


BIBLIOGRAPHY
AC125. Acceptance criteria for concrete and reinforced and unreinforced masonry
strengthening using externally bonded fiber-reinforced polymer (FRP) compo-
site systems. ICC Evaluation Services, Whittier, CA, 2007.
R D Adams, J Comyn, and W C Wake. Structural Adhesive Joints in Engineering.
Springer, 1997.
M A Aiello and M S Sciolti. Bond analysis of masonry structures strengthened with
CFRP sheets. Construction and Building Materials, 20:90–100, 2006.
M A Aiello and M S Sciolti. Analysis of bond performance between FRP sheets and
calcarenite stones under service and ultimate conditions. Journal of the British
Masonry Society Masonry International, 21(1):15–28, 2008.
G K Al-Chaar and H A Hasan. Dynamic response and seismic testing of CMU walls
rehabilitated with composite material applied to only one side. Structures and
Buildings, 152(2):135–146, 2002.
T H Almusallam and Yousef A Al-Salloum. Behaviour of FRP strengthened infill
walls under in-plane seismic loading. Journal of Composites for Construction, 11
(3):308–318, 2007.
L Ascione, L Feo, and F Fraternali. Load carrying capacity of 2D FRP/strengthened
masonry structures. Composites Part B: Engineering, 36(8):619–626, 2005.
ASTM Standards. ASTM E 519–93: Standard Test Method for Diagonal Tension
(Shear) in Masonry Assemblages, 1993.
M Bruneau. State-of-the-art report on seismic performance of unreinforced ma-
sonry buildings. Journal of Structural Engineering, 120(1):230–251, 1994.
U S Camli and B Binici. Strength of carbon fiber reinforced polymers bonded
to concrete and masonry. Construction and Building Materials, 21:1431–1446,
2007.
F Campanaro, R Drysdale, and A Hamid. Use of fiber reinforced polymer to en-
hance the shear resistance of unreinforced concrete masonry. In Proceedings of
the Tenth Canadian Masonry Symposium, University of Calgary, Banff, Alberta,
Canada, June 2005.
J F Chen and J G Teng. Anchorage strength models for FRP and steel plates bonded
to concrete. Journal of Structural Engineering, 127(7):784–791, 2001.
195
196 Bibliography
S W Chuang, Y Zhuge, T Y Wong, and L Peters. Seismic retrofitting of unreinforced
masonry walls by FRP strips. In 2003 Pacific Conference on Earthquake Enginee-
ring, Christchurch, New Zealand, February 2003.
Y Chuang and Y Zhuge. Seismic retrofitting of unreinforced masonry-a literature
review. Australian Journal of Structural Engineering, 6(1):25–36, 2005.
CNR-DT200. Guide for the design and construction of externally bonded FRP sys-
tems for strengthening existing structures. CNR, National Research Council,
Italy, 2006.
M Corradi, A Borri, and A Vignoli. Strengthening techniques tested on masonry
structures struck by the Umbria-Marche earthquake of 1997-1998. Construction
and Building Materials, 16:229–239, 2002.
G D Corte, L Fiorino, and F M Mazzolani. Lateral-loading tests on a real RC buil-
ding including masonry infill panels with and without FRP strengthening. Jour-
nal of materials in civil engineering, 20(6):419–431, 2008.
F J Crisafulli, A J Carr, and R Park. Shear strength of unreinforced masonry pa-
nels. In Pacific Conference on Earthquake Engineering, pages 77–86, Melbourne,
Australia, November, 20-22 1995.
L De Lorenzis, N Galati, and L Ombres. In-plane shear strengthening of natural
masonry walls with NSM CFRP strips and FRCM overlay. In Proceedings of the
Fourth International Seminar on Structural Analysis of Historical Constructions,
pages 847–856, Padova, Italy, November 2004.
F C de Witte. DIANA 9 users manual, 2005.
R G Drysdale, A A Hamid, and L R Baker. Masonry structures : behavior and design.
Prentice Hall, Englewood Cliffs, N.J., 1994.
M Ehsani and H Saadatmanesh. Seismic retrofit of URM walls with fiber compo-
sites. Journal of The Masonry Society, 14(2):63–72, 1996.
M R Ehsani, H Saadatmanesh, and A Al-Saidy. Shear behavior of URM retrofitted
with FRP overlays. Journal of Composites for Construction, 1(1):17–25, 1997.
W W El-Dakhakhni, A A Hamid, and M Elgaaly. In-plane strengthening of URM
infill wall assemblages using GFRP laminates. Journal of The Masonry Society,
22(1):6–50, 2004.
M ElGawady, P Lestuzzi, and M Badoux. A review of conventional seismic retrofit-
ting techniques for URM. In 13th International Brick and Block Masonry Confe-
rence, Amsterdam, July 2004.
M A ElGawady, P Lestuzzi, and M Badoux. In-plane seismic response of URM walls
upgraded with FRP. Journal of Composites for Construction, 9(6):524–534, 2005.

Bibliography 197
M A ElGawady, P Lestuzzi, and M Badoux. Aseismic retrofitting of unreinforced
masonry walls using FRP. Composites Part B: Engineering, 37:148–162, 2006.
M A ElGawady, P Lestuzzi, and M Badoux. Static cyclic response of masonry walls
retrofitted with fiber-reinforced polymers. Journal of Composites for Construc-
tion, 11(1):50–61, 2007.
D Engebretson, R Sen, G Mullins, and A Hartley. Strengthening concrete block
walls using carbon fiber. In Proceedings of the Materials Engineering Conference
- Materials for the New Millenium, volume 2, pages 1592–1600, Washington, DC,
USA, Nov 10-14 1996.
Eurocode 6. Design of Masonry Structures. Comité Euro-International du Béton,
Lausanne, 1994.
D M Farshchi and M S Marefat. Numerical study of in-plane behavior of masonry
walls strengthened by vertical CFRP strips. In Fourth International Conference
on FRP Composites in Civil Engineering (CICE2008), Zurich, Switzerland, July,
22-24 2008.
A Gabor, E Ferrier, E Jacquelin, and P Hamelin. Analysis of the in-plane shear
behaviour of FRP reinforced hollow brick masonry walls. Structural Engineering
and Mechanics, 19(3):237–260, 2005.
A Gabor, A Bennani, E Jacquelin, and F Lebon. Modelling approaches of the in-
plane shear behaviour of unreinforced and FRP strengthened masonry panels.
Composite Structures, 74:277–288, 2006.
E Grande, G Milani, and E Sacco. Modelling and analysis of FRP-strengthened
masonry panels. Engineering Structures, 30:1842–1860, 2008.
J D Hall, P M Schuman, and H R Hamilton. Ductile anchorage for connecting FRP
strengthening of under-reinforced masonry buildings. Journal of Composites for
Construction, 6(1):3–10, 2002.
A A Hamid, W W El-Dakhakhni, Z H R Hakam, and M Elgaaly. Behaviour of com-
posite unreinforced masonry-fiber-reinforced polymer wall assemblages under
in-plane loading. Journal of Composites for Construction, 9(1):73–83, 2005.
Y Han. A study of two-way bending in unreinforced masonry. PhD thesis, The
University of Newcastle, Australia, 2008.
M A Haroun and E H Ghoneam. Nonlinear finite element analysis of masonry-
infilled reinforced concrete frames. Proceedings of Engineering Mechanics, 2:
1022–1025, 1996.
M A Haroun and E H Ghoneam. Seismic Performance Testing of Masonry-infilled
Frames Retrofitted by Fiber Composite. In Society of Photo-Optical Instrumen-
tation Engineers (SPIE) Conference Series, volume 3089, pages 1650–1656, 1997.

198 Bibliography
R C Hibbeler. Structural analysis, 3rd edition. Prentice Hall International, Upper
Saddle River, NJ, 1997.
A M Holberg and H R Hamilton. Strengthening URM with GFRP composites and
ductile connections. Earthquake Spectra, 18(1):63–84, 2002.
S A Hussain, B S Reddy, and V N Reddy. Prediction of elactic properties of FRP
composite lamina for longitudinal loading. ARPN Journal of Engineering and
Applied Sciences, 3(6):70–75, 2008.
D Key. Earthquake design practice for buildings. Thomas Telford Ltd, London,
1988.
G M Klopp and M C Griffith. Seismic analysis of unreinforced masonry buildings.
Australian Journal of Structural Engineering, 1(2):121–131, 1998.
T Li, N Galati, G Tumialan, and A Nanni. Analysis of unreinforced masonry
concrete walls strengthened with glass fiber-reinforced polymer bars. ACI Struc-
tural Journal, 102(4):569–577, 2005.
P B Lourenço. Structural masonry analysis: Recent developments and prospects.
In 14th International Brick and Block Masonry Conference, Sydney, Australia, Fe-
bruary, 17-20 2008. Keynote paper.
P B Lourenço. A user/programmer guide for the micro-modeling of masonry struc-
tures. TU-DELFT report no. 03.21.1.31.35, Delft University of Technology, 1996a.
P B Lourenço. Computational strategies for masonry structures. PhD thesis, Delft
University of Technology, Stevinweg 1, 2628 CN Delft, The Netherlands, 1996b.
P B Lourenço and J G Rots. A multi-surface interface model for the analysis of
masonry structures. Journal of Structural Engineering, 123(7):660–668, 1997.
G Magenes and G M Calvi. In-plane seismic response of brick masonry walls. Ear-
thquake Engineering and Structural Dynamics, 26:1091–1112, 1997.
W Mann and H Müller. Failure of shear-stressed masonry - an enlarged theory,
tests and application to shear walls. Proceedings of the British Ceramic Society,
30:223–235, 1982.
G Marcari, G Manfredi, A Prota, and M Pecce. In-plane shear performance of ma-
sonry panels strengthened with FRP. Composites Part B: Engineering, 38:887–
901, 2007.
H S Maria, P Alcaino, and C Luders. Experimental response of masonry walls exter-
nally reinforced with carbon fiber fabrics. In Proceedings of the 8th U.S. National
Conference on Earthquake Engineering, San Francisco, California, USA, April 18-
22 2006.

Bibliography 199
O S Marshall and S C Sweeney. In-plane shear performance of masonry walls
strengthened with FRP. In 47th International SAMPE Symposium and Exhibi-
tion, pages 929–940, Long Beach, CA, USA, May 12-16 2002.
M J Masia, Y Han, and M R S Correa. Torsion testing for the characterisation of
the shear behaviour of mortar joints in masonry. Journal of the British Masonry
Society Masonry International, 19(2):77–88, 2006.
M J Masia, Y Han, C J Player, M R S Correa, and A W Page. Torsion shear test
for mortar joints in masonry: Preliminary experimental results. In Tenth North
American Masonry Conference, St Louis, Missouri, U.S.A., June 2007.
A Nanni, N Galati, and J G Tumialan. Outline of provisional design protocols and
field applications of strengthening of URM walls. In Advancing with Composites,
Plast 2003, pages 187–197, Milan, Italy, May 7-9 2003.
D J Oehlers and R Seracino. Design of FRP and Steel Plated RC Structures: Retrofit-
ting Beams and Slabs for Strength, Stiffness and Ductility. Elsevier, Oxford, 2004.
D J Oehlers, R Rashid, and R Seracino. IC debonding resistance of groups of FRP
NSM strips in reinforced concrete beams. Construction and Building Materials,
in press, doi:10.1016/j.conbuildmat.2007.03.021, 2008.
A W Page. The strength of brick masonry under biaxial compression-tension. In-
ternational Journal of Masonry Construction, 3(1):26–31, 1983.
A W Page. Earthquakes and unreinforced masonry structures: an Australian over-
view. Research report; no. 136.4.1996, Department of Civil Engineering and Sur-
veying, University of Newcastle, NSW, Australia, 1996.
R Park. Evaluation of ductility of structures and structural assemblages from la-
boratory testing. Bulletin of the New Zealand National Society for Earthquake
Engineering, 22(3):155–166, 1989.
J Pina-Henriques, P B Lourenço, L Binda, and A Anzani. Testing and modelling of
multiple-leaf masonry walls under shear and compression. In Proceedings of the
Fourth International Seminar on Structural Analysis of Historical Constructions,
pages 299–310, Padova, Italy, November 2004.
S S Prakash and P Alagusundaramoorthy. Numerical study on masonry load bea-
ring walls retrofitted with GFRP composites. In Third International Conference
on FRP Composites in Civil Engineering (CICE 2006), pages 399–403, Miami, Flo-
rida, USA, December 13-15 2006.
R Rashid, D J Oehlers, and R Seracino. IC debonding of FRP NSM and EB retrofitted
concrete: plate and cover interaction tests. Journal of Composites for Construc-
tion, 12(2):160–167, 2008.

200 Bibliography
J G Rots. Structural masonry: an experimental/numerical basis for practical design
rules. Balkema, Rotterdam, 1997.
G Schwegler. Masonry construction strengthened with fiber composites in seismi-
cally endangered zones. In 10th European Conference on Earthquake Enginee-
ring, Balkema, Rotterdam, 1995.
R Seracino, N M Jones, M S M Ali, M W Page, and D J Oehlers. Bond strength of
near-surface mounted FRP strip-to-concrete joints. Journal of Composites for
Construction, 11(4):401–409, 2007a.
R Seracino, M R Raizal Saifulnaz, and D J Oehlers. Generic debonding resistance
of EB and NSM plate-to-concrete joints. Journal of Composites for Construction,
11(1):62–70, 2007b.
N G Shrive. The use of fibre reinforced polymers to improve seismic resistance of
masonry. Construction and Building Materials, 20:269–277, 2006.
Standards Australia. AS 3600-2001 Concrete Structures. ASI, Sydney, Australia,
2001a.
Standards Australia. AS 3700-2001 Masonry Structures: Appendix C - Method of
test for compressive strength. ASI, Sydney, Australia, 2001b.
Standards Australia. AS 3700-2001 Masonry Structures: Appendix D - Method of
test for flexural strength. ASI, Sydney, Australia, 2001c.
Standards Australia. AS/NZS 4456.15:2003: Masonry units, segmental pavers and
flags-Methods of test. Method 15: Determing lateral modulus of rupture. ASI,
Sydney, Australia, 2003.
T Stratford and C Burgoyne. Shear analysis of concrete with brittle reinforcement.
Journal of Composites for Construction, 7(4):323–330, 2003.
T Stratford, G Pascale, O Manfroni, and b Bonfiglioli. Shear strengthening ma-
sonry panels with sheet glass-fiber reinforced polymer. Journal of Composites
for Construction, 8(5):434–443, 2004.
D J Sutcliffe, H S Yu, and A W Page. Lower bound limit analysis of unreinforced
masonry shear walls. Computers and Structures, 79:1295–1312, 2001.
D Tinazzi and A Nanni. Assessment of technologies of masonry retrofitting with
FRP. Technical report, Center for Infrastructure Engineering Studies, University
of Missouri-Rolla, 2000.
M Tomaževic. Earthquake-Resistant design of Masonry Buildings. Imperial College,
River Edge, NJ, 1999.

Bibliography 201
T C Triantafillou. Composites: a new possibility for the shear strengthening of
concrete, masonry and wood. Composites Science and Technology, 58:1285–1295,
1998.
T C Triantafillou and C P Antonopoulos. Design of concrete flexural members
strengthened in shear with FRP. Journal of Composites for Construction, 4(4):
198–205, 2000.
G Tumialan, P C Huang, A Nanni, and P Silva. Strengthening of masonry walls by
FRP structural repointing. In Non-Metallic Reinforcement for Concrete Structures
- FRPRCS-5, Cambridge, July 16-18 2001.
V Turco, S Secondin, A Morbin, M R Valluzzi, and C Modena. Flexural and shear
strengthening of un-reinforced masonry with FRP bars. Composites Science and
Technology, 66:289–296, 2006.
T Ueda and J G Dai. New shear bond model for FRP-concrete interface-from mo-
delling to application. In Proceedings of the Second International Conference on
FRP Composites in Civil Engineering - CICE 2004, pages 69–81, Adelaide, Austra-
lia, December 8-10 2004.
M R Valluzzi, D Tinazzi, and C Modena. Shear behavior of masonry panels streng-
thened by FRP laminates. Construction and Building Materials, 16:409–416,
2002.
R Van der Pluijm. Non-linear behaviour of masonry under tension. Heron, 42(1):
25–54, 1997.
R Van der Pluijm. Overview of deformation controlled combined tensile and shear
tests. Report, rep.tue/cco/98.20, Eindhoven Univ. of Technology, Eindhoven, The
Netherlands, 1998.
G P A G Van Zijl. Modeling masonry shear-compression: Role of dilatancy high-
lighted. Journal of Engineering Mechanics, 130(11):1289–1296, 2004.
G P A G Van Zijl and P A de Vries. Masonry wall crack control with carbon fiber
reinforced polymer. Journal of Composites for Construction, 9(1):84–89, 2005.
L G W Verhoef and G P A G van Zijl. Re-strengthening of brickwork to reduce crack
width. Advances in Engineering Software, 33:49–57, 2002.
M Wakabayashi. Design of Earthquake-Resistant Buildings. McGraw-Hill, New
York, 1986.
C R Willis, Q Yang, R Seracino, and M C Griffith. Bond behavior of FRP-to-clay
brick masonry joints. Engineering Structures, (revised manuscript submitted
04/08), 2008.

202 Bibliography
Z S Wu. Structural strengthening and integrity with hybrid FRP composites. In
Proceedings of the Second International Conference on FRP Composites in Civil
Engineering - CICE 2004, pages 93–106, Adelaide, Australia, December 8-10 2004.
J Yao, J G Teng, and J F Chen. Experimental study on FRP-to-concrete bonded
joints. Composites Part B: Engineering, 36:99–113, 2005.
T Zhao, C J Zhang, and J Xie. Experimental study on earthquake strengthening of
brick walls with continuous carbon fibre sheet. Masonry International, 16(1):
21–25, 2003.
T Zhao, C J Zhang, and J Xie. Shear behavior of UCMW using CFRP sheet: A case
study. TMS Journal, September:87–95, 2004.
Y Zhuge. FRP retrofitted URM walls under inplane shear - a review of available de-
sign models. In 14th International Brick and Block Masonry Conference, Sydney,
Australia, February, 17-20 2008a. Paper no. 105.
Y Zhuge. Numerical study of URM walls retrofitted with cable and FRP. In 14th
International Brick and Block Masonry Conference, Sydney, Australia, February,
17-20 2008b. Paper no. 106.