Embed Size (px)
Citation preview

WELLINGTON NORTH
BUSINESS RETENTION AND EXPANSION
PROJECT
FINAL REPORT
APRIL 2011
Prepared by:
Wellington North BR+E Project Coordinator Leah Holliday
(519) 848-3620 ext.30
In Partnership with:
Ontario Ministry of Agriculture,
Food and Rural Affairs
Saugeen Economic
Development Corporation
TD Canada Trust
Mount Forest & District Chamber
of Commerce
Arthur & District Chamber of Commerce

~ 2 ~
BR+E Final Report
FROM THE COORDINATORS DESK
As the Business Retention and Expansion Program Coordinator (BR+E) I recognized
immediately that BR+E was and will continue to be a very important project for the future of
Wellington North. By addressing the Action Plans and recommendations, both the business
community and the community at large will benefit from the results achieved. The willingness of
local businesses to participate in this project is excellent proof that the Wellington North
Business Community cares, not only about its future, but for the future of the community.
Members of the Economic Development Committee, Wellington North Council and the business
community who participated in this project should be recognized for their efforts. It is
imperative that we move forward with the implementation of the Action Plan outlined in the
latter part of this report; and that Council and the community move forward with this project. I
would like to thank the following organizations for sponsoring this project, the Ontario Ministry
of Agriculture, Food and Rural Affairs (OMAFRA), the Township of Wellington North, Saugeen
Economic Development Corporation, Mount Forest & District Chamber of Commerce, the
Arthur & District Chamber of Commerce and TD Canada Trust. Without their sponsorship,
BR+E may have not been the success it was!
Thank you,
Leah Holliday

~ 3 ~
BR+E Final Report
TABLE OF CONTENTS_________________________
1.0 Preface……………………………………….4,5 2.0 Methodology…………………………………6,7 3.0 Economic Development Committee…………8 4.0 Surveys……………………………………….9 5.0 Red Flag Issue………………………………..10 6.0 Project Analysis……………………………...11-59 7.0 Local Community Questions…………………60-62 8.0 Action Plans…………………………………..63-67 9.0 Conclusion……………………………………68

BR+E Fina
Ton the businesNorth. econom70% oenviron
T
question
TWellingLeah HEconom
TsurveyeIndustrynext ful
al Report
The TownsBusiness ses in the The Busin
my and encof new jonment is im
The BR+E
nnaire in a
The BR+Egton NorthHolliday, umic Manag
The informed, and dy businessell number f
ship of WeRetentionConstructi
ness Retencourage groobs come
mportant.
Program w
one on on
E project wh for a posiunder the er and Al R
mation conto not refes opinionfor ease of
PR
ellington Nn and Expion and Mntion + Exowth and s
from ex
was develo
ne interview
was sponsition of a B
guidanceRawlins, B
tained in thflect the rns and concf reading.
~ 4 ~
REFACE
North has pansion (B
Manufacturixpansion Pstability of
xisting bu
oped by th
w format.
sored by Business R of Dale
Business Re
his report aremaining cerns. Perc
prepared thBR+E) surving/ IndustProject helf local bussinesses;
he Ontario Food (OMARetentresultseconomhelpingboth tand opportbusineapproaconfid
OMAFRARetention +
Small, thetention an
applies to Construc
centages h
he followinvey comptry sectors lps to impsinesses. Aso a hea
Ministry oand R
AFRA). tion ands in job mic prog communthe barrier
the tunities esses. ach codential
A and the + Expansiohe Townsnd Expansi
the businection or Mhave been r
ng report bleted by lof Wellin
prove the lApproximaalthy busi
of AgriculRural Af
Busid Expan
growth osperity nities idenrs to surv
expanfacing lThe BR
ombines su
Townshipn Coordin
ships Busiion Champ
esses that wManufacturrounded to
based local
ngton local ately iness
ture, ffairs iness nsion
and by
ntify vival nsion local R+E
a urvey
p of nator, iness pion.
were ring/ o the

~ 5 ~
BR+E Final Report
Thank you to all the businesses who participated in the survey. Your input was invaluable to the success of this project. It is important for local businesses to take an active role in building a better business community!
Wellington North is an amalgamated township, consisting of the former Village of Arthur, the Town of Mount Forest and the Townships of Arthur, West Luther, West Garafraxa and Peel. The current population according to Stats Canada is 11,300 people residing over approximately 550km.
The quality of life available in Wellington North is second to none! Clean air and clean water, quiet tree lined streets, abundant recreational facilities, excellent shopping opportunities, convenient health care and educational facilities all provide a fulfilling lifestyle for the citizens of the Township.
We have much to be proud of in Wellington North. A new high school was built in 2004 for the students from Mount Forest and Arthur, as well as surrounding hamlets. In 2008 the Mount Forest Fireworks Festival was named one of the top 100 festivals in all of Ontario and has carried on this title through 2011.
The Village of Arthur is proud of being known as “Canada’s Most Patriotic Village”. Boasting a new Library and Health Facility, Arthur provides a safe and growing environment in which to live. The Luther Marsh is one of Southern Ontario’s most significant wetlands and wildlife habitat areas, located northeast of Arthur.
Old established neighborhoods are complimented by new residential development, and small urban centers by rural countryside. The Township provides a variety of lifestyle choices for its workforce, residents, and their guests.

BR+E Fina
Sthe answand the Since thDevelop
T
Ltime reManufacommun
O33% resend of t
al Report
Some peoplwer would findings fr
hen howevpment Com
There was a
Leah beganestraints aacturing/ Innities large
Of the thirtysponse ratethe surveys
le may askbe; becaus
from this wer, many e
mmittee fou
a contract
n by reviewand quanndustry anest employ
y-four selee. The datas.
METH
k the questise it has be
were used foeconomic cund it cruc
agreement
wing the Wntity, two nd Construyers. Busin
ected, a tota was ente
~ 6 ~
HODOLO
ion “Why Been done bfor key Ecoconditions cial to re-la
t between taPCinin
SMPTa
Wellington NSectors
uction, becnesses were
al of nine bered in bet
GY
BR+E in Wbefore in 20onomic Devhave chan
aunch the p
the Townshand OMAFProject Coordinaton Septembn April of
UndeSmall, Manager anProject CTownship, and the proj
North’s Buwere sel
cause thesee randomly
businessestween surv
Wellington002 and agvelopmentged and thprogram.
hip of WelFRA for th
Coordinr, Leah Ho
ber of 20102011.
er the guidBusiness
nd Leah HCoordinatoa Work Plject began
usiness Dirlected fore sectors ay selected.
s completedvey visits, a
n North?”, again in 200t programs
he Econom
llington Nohe hiring
nator. olliday, sta0, and fini
dance of DEcono
Holliday, BRor for an was for
n.
rectory. Dur the proare among
d the surveand also at
and 5,
s. mic
orth, of a The
arted shed
Dale omic R+E
the rmed
ue to oject; g the
ey or t the

~ 7 ~
BR+E Final Report
Beginning in October Media Releases were sent out to local papers to gain coverage on the project. At the start of November letters were sent to businesses attached with a survey, and they had the option to fill it out and return it back to the Township office or to contact either Dale Small or Leah Holliday to come and complete an interview.
Information packages were sent to area businesses who had requested it during the surveys.
In January, the remaining survey data was entered, the project information was analyzed, and a Preliminary Report was developed. The Preliminary Report was presented by the BR+E Coordinator at the February Economic Development Committee Meeting and a “brainstorming of ideas” session was held at to develop future Action Plans based on the results.
Action plans based on the ideas from the Economic Development Committee was decided upon with the Economic Development Committee Meeting in both February and March. The results from the surveys were presented at the Wellington North Showcase on March 28th/29th, 2011. The Action Plan was finalized at the beginning of April and was taken to the April Economic Development Committee for approval and the next steps for BR+E were finalized.

~ 8 ~
BR+E Final Report
ECONOMIC DEVELOPMENT COMMITTEE
Business Retention & Expansion in Wellington North was made possible by the Economic Development Committee and their list of priorities for the Township’s Economic Development Strategies. The Township of Wellington North Economic Development Committee is comprised of Six Public Members, Five Council Members and the Business Economic Manager, they are the following:
Mayor Ray Tout Jim Taylor (Public)
Councillor Andy Lennox Steven Dineen (Public)
Councillor Mark Goetz Alan Rawlins (Public)
Councillor Dan Yake Dale Small (Business Economic Manager)
Councillor Sherry Burke
Three additional public members will be joining in April of 2011.
The Economic Development Committee is currently focused on the following six priorities for Wellington North:
1. Downtown Revitalization 2. Business Retention and Expansion 3. Marketing and Promotion 4. Professional Medical Recruitment 5. Land Development 6. Rural Revitalization

~ 9 ~
BR+E Final Report
SURVEYS
There were 23 businesses contacted for the Manufacturing/ Industry Sector, and of the 23 contacted, five completed the survey. From the Construction sector, 11 businesses were contacted, and four completed the survey. With both sectors combined there was there was only one “Red Flag Issue” and this was found most prominently in the Construction Sector. The “Red Flag Issue” will be acknowledged on page ten of this report.
Total completed surveys: 33% Response Rate
There were two businesses that requested information from the various issues in the survey.
The survey was divided in to seven sections: Business Climate, Future Plans, Company Information, Business Development, Business Development- Markets, Workforce Development and Local Community.
The majority of information requests were on Development Charges.
Throughout the survey, businesses had the option of “skipping” any questions they wanted to, so the percentages listed in this report, are based on the number of businesses who answered that particular question.
Thank you to all the businesses who participated in the survey. Your input was a key part to the success of this project.

~ 10 ~
BR+E Final Report
RED FLAG ISSUE
Overall, the survey results were positive. There was
only one Red Flag Issue. Development Charges was raised
as a Red Flag Issue in the Construction Industry Sector.
Development Charges is also a known issue with the Township of Wellington
North. To date, meetings have been held with both the Construction and Real-
Estate Sectors chaired by Councillor Dan Yake and the Building Committee. The
Economic Development Committee’s expectation is that out of these meetings a
resolution will go to Council.

~ 11 ~
BR+E Final Report
PROJECT ANALYSIS
Business Climate
BC1. What is your general impression of this community as a place in which to do business?
Response Count PercentExcellent 2 22%
Good 6 67%
Fair 1 10%
Poor 0 0% BC3a. What is your general impression of the Province of Ontario as a place in which to do business?
Response Count PercentExcellent 1 10%
Good 3 33%
Fair 4 44%
Poor 1 10% BC4. Which, if any, of the following factors are barriers to the expansion of existing businesses and the development of new businesses in the community?
Response Count PercentWater/sewage capacity 2 22%
Water/sewer fees 3 33%
Serviced land 3 33%
Resistance from local business 0 0%
Lack of proactive new business recruitment 0 0%

~ 12 ~
BR+E Final Report
Availability of properly zoned and designated land 3 33%
Availability of variety of different sized parcels of land 1 10%
Approval processes 4 44%
Development charges 6 67%
Business taxes 4 44%
Business insurance 3 33%
Availability of skilled labour 2 22%
Availability of unskilled labour 2 22%
Availability of financing 2 22%
Road & highway system 0 0%
Inadequate waterway identification 0 0%
Water access 0 0%
Availability of water moorings 0 0%
Trucking & distribution 0 0%
Public transit 0 0%
Information technology capacity 1 10%
Security/policing & fire service 0 0%
Availability of natural gas 1 10%
Availability of space for rent or lease 1 10%
Availability of training opportunities 0 0%
Health & medical services 1 10%
Other (Specify): 1 10%BC5a. What is your level of satisfaction with each of the following services provided by local government and community organizations? ‐ Planning, engineering, zoning, and building permits
Response Count PercentVery satisfied 1 10%
Somewhat satisfied 5 55%
Somewhat dis‐satisfied 1 10%

~ 13 ~
BR+E Final Report
Very dis‐satisfied 1 10%
No contact 1 10% BC5a. What is your level of satisfaction with each of the following services provided by local government and community organizations? ‐ Health department/health unit approvals
Response Count PercentVery satisfied 3 33%
Somewhat satisfied 5 55%
Somewhat dis‐satisfied 0 0%
Very dis‐satisfied 0 0%
No contact 1 10% BC5a. What is your level of satisfaction with each of the following services provided by local government and community organizations?– Policing
Response Count PercentVery satisfied 5 55%
Somewhat satisfied 3 33%
Somewhat dis‐satisfied 0 0%
Very dis‐satisfied 0 0%
No contact 0 0% BC5a. What is your level of satisfaction with each of the following services provided by local government and community organizations? ‐ Fire prevention and services
Response Count PercentVery satisfied 6 67%
Somewhat satisfied 2 22%
Somewhat dis‐satisfied 0 0%
Very dis‐satisfied 0 0%
No contact 0 0%

~ 14 ~
BR+E Final Report
BC5a. What is your level of satisfaction with each of the following services provided by local government and community organizations? ‐ Public utilities
Response Count PercentVery satisfied 3 33%
Somewhat satisfied 4 44%
Somewhat dis‐satisfied 2 22%
Very dis‐satisfied 0 0%
No contact 0 0% BC5a. What is your level of satisfaction with each of the following services provided by local government and community organizations? ‐ Street repairs
Response Count PercentVery satisfied 5 55%
Somewhat satisfied 3 33%
Somewhat dis‐satisfied 1 10%
Very dis‐satisfied 0 0%
No contact 0 0% BC5a. What is your level of satisfaction with each of the following services provided by local government and community organizations? ‐ Snow removal
Response Count PercentVery satisfied 6 67%
Somewhat satisfied 3 33%
Somewhat dis‐satisfied 0 0%
Very dis‐satisfied 0 0%
No contact 0 0%

~ 15 ~
BR+E Final Report
BC5a. What is your level of satisfaction with each of the following services provided by local government and community organizations? ‐ Public transit
Response Count PercentVery satisfied 1 10%
Somewhat satisfied 0 0%
Somewhat dis‐satisfied 0 0%
Very dis‐satisfied 0 0%
No contact 8 89% BC5b. What is your level of satisfaction with each of the following services provided by local government and community organizations? ‐ Medical and health services
Response Count PercentVery satisfied 5 55%
Somewhat satisfied 4 44%
Somewhat dis‐satisfied 0 0%
Very dis‐satisfied 0 0%
No contact 0 0% BC5b. What is your level of satisfaction with each of the following services provided by local government and community organizations?– Library
Response Count PercentVery satisfied 4 44%
Somewhat satisfied 1 10%
Somewhat dis‐satisfied 0 0%
Very dis‐satisfied 0 0%
No contact 4 44%

~ 16 ~
BR+E Final Report
BC5b. What is your level of satisfaction with each of the following services provided by local government and community organizations? ‐ Child care services
Response Count PercentVery satisfied 4 44%
Somewhat satisfied 1 10%
Somewhat dis‐satisfied 1 10%
Very dis‐satisfied 0 0%
No contact 3 33% BC5b. What is your level of satisfaction with each of the following services provided by local government and community organizations? ‐ Cultural facilities
Response Count PercentVery satisfied 2 22%
Somewhat satisfied 1 10%
Somewhat dis‐satisfied 0 0%
Very dis‐satisfied 0 0%
No contact 6 67% BC5b. What is your level of satisfaction with each of the following services provided by local government and community organizations? ‐ Recreational facilities
Response Count PercentVery satisfied 5 55%
Somewhat satisfied 4 44%
Somewhat dis‐satisfied 0 0%
Very dis‐satisfied 0 0%
No contact 0 0%

~ 17 ~
BR+E Final Report
BC7a. Listed below are a number of provincial, federal and business organizations. Please rate where applicable, your level of satisfaction with the services provided. ‐ Ministry of Economic Development & Trade
Response Count PercentVery satisfied 0 0%
Somewhat satisfied 3 33%
Somewhat dis‐satisfied 0 0%
Very dis‐satisfied 0 0%
No contact 4 44% BC7a. Listed below are a number of provincial, federal and business organizations. Please rate where applicable, your level of satisfaction with the services provided. ‐ Ontario Exports Inc.
Response Count PercentVery satisfied 0 0%
Somewhat satisfied 1 10%
Somewhat dis‐satisfied 0 0%
Very dis‐satisfied 0 0%
No contact 6 67% BC7a. Listed below are a number of provincial, federal and business organizations. Please rate where applicable, your level of satisfaction with the services provided.‐ Ministry of Tourism & Recreation
Response Count PercentVery satisfied 0 0%
Somewhat satisfied 1 10%
Somewhat dis‐satisfied 0 0%
Very dis‐satisfied 0 0%
No contact 6 67%

~ 18 ~
BR+E Final Report
BC7a. Listed below are a number of provincial, federal and business organizations. Please rate where applicable, your level of satisfaction with the services provided. ‐ Ministry of Training, Colleges & Universities, Business Training and Adjustment Services
Response Count PercentVery satisfied 1 10%
Somewhat satisfied 2 22%
Somewhat dis‐satisfied 0 0%
Very dis‐satisfied 0 0%
No contact 4 44%
Future Plans
FP1a. Within the next 3 years, which of the following do you plan to undertake at this site?
Response Count PercentRemain the Same 6 67%
Downsize 0 0%
Relocate 0 0%
Expand 2 22%
Close 0 0%FP2a. Will the downsizing result in a reduced workforce?
Response Count PercentYes 0 0%
No 0 0%

~ 19 ~
BR+E Final Report
FP3a. Do you plan to relocate this business within the next 3 years?
Response Count PercentYes 0 0%
No 0 0%
Exploring 0 0%FP4. Where do you plan to relocate this business?
Response Count PercentWithin the Community 0 0%Outside municipality but within County/District/Regional Municipality (Specify)
0 0%
Elsewhere in Ontario (Specify) 0 0%
Another Province (Specify) 0 0%
Outside Canada (Specify) 0 0%FP5. Why are you planning to relocate the business?
Response Count PercentHead office decision 0 0%
Inadequate facilities in terms of building space 0 0%
Change in markets 0 0%
Distance to markets and suppliers 0 0%
Availability of appropriate labour 0 0%
Expansion limitations 0 0%
Utility infrastructure is inadequate 0 0%
Local regulations too restrictive 0 0%
Business tax incentives in other locations 0 0%
Other (Specify): 0 0%

~ 20 ~
BR+E Final Report
FP6. Has a business case been made to head office to justify your company remaining at this site?
Response Count PercentYes 0 0%
No 0 0%FP7. What assistance, if any, could help to prevent the relocation of this business?
Response Count PercentNothing, decision is made 0 0%
Finding an appropriate site location 0 0%
Financing 0 0%
Assistance with the approval process 0 0%
Finding and securing adequate labour 0 0%
Securing training services 0 0%
Accessing appropriate research and development 0 0%Infrastructure upgrades (roads, telecommunication, fibre optics, energy supply, energy type)
0 0%
Changes to tax structure 0 0%
Assistance in making business case to remain 0 0%
Other (Specify): 0 0%FP8. Within the next 3 years, do you plan to undertake a building expansion at this site?
Response Count PercentYes 2 22%
No 0 0%

~ 21 ~
BR+E Final Report
FP9. Is your expansion plan based on innovation?
Response Count PercentYes 1 10%
No 1 10% FP10. Will your expansion lead to….
Response Count PercentAn increase in work force 1 10%
An increase in floor space 0 0%
Additional product line(s) 1 10%
Additional services for customers 1 10%
Additional investment in equipment and technology 1 10%
Importing goods or services to Canada 0 0%
An increase in export of goods or services 1 10%
Process improvements 1 10%
An increase in demand for skills training 1 10%
Other (Specify): 0 0%FP11. Is your business experiencing difficulties with its expansion plan?
Response Count PercentYes 0 0%
No 0 0%FP12. Please identify difficulties you are experiencing with the expansion plans. ‐ Financing
Response Count PercentFinancing 1 10%
Developing a marketing plan 0 0%
Developing a business plan 0 0%
Labour availability 0 0%
Land availability 0 0%

~ 22 ~
BR+E Final Report
Labour force training 0 0%
Availability of buildings 0 0%
Importing of goods and services 0 0%
Exporting of goods and services 0 0%
Road & highway system 0 0%
Highway and Roadside signs 0 0%
Trucking & distribution 0 0%
Warehousing 0 0%
Electrical supply 0 0%
Water infrastructure 1 10%
Waste water infrastructure 1 10%
Sewer capacity 1 10%
Finding/developing strategic alliances 0 0%
Local by‐laws 0 0%Other
0 0%
FP13. Within the next 3 years, do you plan to close this business? That is, close the business at this location and not reopen in some other location.
Response Count PercentYes 0 0%
No 0 0%FP14a. What are the reasons for closing this business?
Response Count PercentHead office decision 0 0%
Facilities, e.g., buildings to small, too old, etc. 0 0%
Loss or change of customer/clients 0 0%
Distance to markets and inputs 0 0%
Labour supply 0 0%
Management ‐ Labour relations 0 0%

~ 23 ~
BR+E Final Report
Local infrastructure 0 0%
Expansion limitations 0 0%
Profitability 0 0%
Health/environmental regulations 0 0%
Unable to find purchaser 0 0%
Retirement 0 0%
Loss/or change of export/product mandate 0 0%Other (Specify):
0 0%
FP15. What assistance, if any, could help to prevent the closure of the business? ‐ Nothing, decision is made
Response Count PercentNothing, decision is made 0 0%
Finding new site 0 0%
Financing 0 0%
Approval Process 0 0%
Succession planning 0 0%
Employee purchase 0 0%
Improvement to local infrastructure 0 0%
Identifying prospective purchaser 0 0%
Export assistance 0 0%
Business planning 0 0%
Marketing 0 0%
Other 0 0%

~ 24 ~
BR+E Final Report
Company Information
C1. What is the legal form of this business?
Response CountPercentCorporation 8 89%
Sole Proprietorship 1 10%
Non‐Profit Corporation 0 0%
Branch Plant 0 0%
Partnership 0 0%
Cooperative 0 0%
Other (Specify): 0 0% C2. Is this business a franchise?
Response CountPercentYes 0 0%
No 4 44% C3. What primary activity is conducted by your business?
Response CountPercent11 ‐ Agriculture, Forestry, Fishing and Hunting 0 0%
21 ‐ Mining, Quarrying, and Oil and Gas Extraction 0 0%
22 ‐ Utilities 0 0%
23 ‐ Construction 4 44%
31 ‐ Manufacturing, (food, beverage, etc.) 1 10%
32 ‐ Manufacturing, (wood, paper, etc.) 0 0%
33 ‐ Manufacturing, (primary and fabricated metal, etc.) 2 22%
42 ‐ Wholesale Trade 0 0%

~ 25 ~
BR+E Final Report
44 ‐ Retail Trade, (motor vehicle, furniture, etc.) 0 0%
45 ‐ Retail Trade, (sporting goods, book, music, etc.) 0 0%
48 ‐ Transportation and Warehousing, (air, rail, truck, etc.) 0 0%49 ‐ Transportation and Warehousing, (postal service, couriers, etc.)
0 0%
51 ‐ Information 0 0%
52 ‐ Finance and Insurance 0 0%
53 ‐ Real Estate and Rental and Leasing 1 10%
54 ‐ Professional, Scientific, and Technical Services 0 0%
55 ‐ Management of Companies and Enterprises 0 0%56 ‐ Administrative and Support and Waste Management and Remediation Services
0 0%
61 ‐ Educational Services 0 0%
62 ‐ Health Care and Social Assistance 0 0%
71 ‐ Arts, Entertainment, and Recreation 0 0%
72 ‐ Accommodation and Food Services 0 0%
81 ‐ Other Services (except Public Administration) 0 0%
92 ‐ Public Administration 0 0%
No NAICS Code 0 0% C5. Is the owner (or at least one of the owners) involved in the day‐to‐day operation of the business?
Response CountPercentYes 8 89%
No 1 10% C6. Is the owner (or at least one of the owners) of the business a resident of the community?
Response CountPercentYes 7 77%
No 2 22%

~ 26 ~
BR+E Final Report
C7. Where is the headquarters for the business?
Response CountPercentMunicipality (Specify) 8 89%
Elsewhere in Ontario (Specify) 0 0%
Outside of Ontario (Specify) 0 0%
Outside of Canada (Specify) 1 10%
C8. How many years has this business been in operation in this community?
Response CountPercentLess than 1 year 0 0%
1 to 3 years 0 0%
4 to 10 years 0 0%
11 to 25 years 4 44%
26 to 35 years 8 89%
Over 35 years 0 0% C9. Is this a family‐owned business?
Response CountPercentYes 7 77%
No 2 22% C10. Does the business have a succession plan?
Response CountPercentYes 7 77%
No 2 22%

~ 27 ~
BR+E Final Report
C11. Does your business have a business plan?
Response CountPercentYes 8 89%
No 1 10% C12. Does your business have a marketing plan?
Response CountPercentYes 8 89%
No 1 10%
C13. How many employees work at this location?
Response CountPercentOwner(s) 0 0%
1 ‐ 4 3 33%
5 ‐ 9 2 22%
10 ‐ 14 0 0%
15 ‐ 19 1 10%
20 ‐ 29 0 0%
30 ‐ 49 0 0%
50 ‐ 99 0 0%
100 ‐ 299 3 33%
300 or more 0 0% C14. What percentage of your employees at this location live...Within the municipality
Response Avg PercentWithin the municipality 50%
Outside the municipality but within county/district/regional 50%

~ 28 ~
BR+E Final Report
municipality
Outside county/district/regional municipality 0% C16. Is your workplace...
Response CountPercentUnionized 1 10%
Non‐unionized 8 89%
Business Development
BD1. Is this business location the only location?
Response Count PercentYes 6 67%
No 3 33% BD2. Is this location the headquarters?
Response Count PercentYes 0 0%
No 0 0% BD3. Where are the other locations for this business?
Response Count PercentThis municipality (Specify): 1 10%Outside this municipality but in county/district/regional municipality (Specify):
0 0%
Elsewhere in Ontario (Specify): 2 22%
Another Province (Specify): 0 0%
Outside Canada (Specify): 1 10%

~ 29 ~
BR+E Final Report
. BD4. How satisfied are you with the current site of this business in this community? Would you say you are...
Response Count PercentCompletely satisfied 6 6%
Somewhat satisfied 1 10%
Somewhat dissatisfied 1 10%
Very dissatisfied 0 0%
BD5. Why are you not completely satisfied with this site?
Response Count PercentSite is too small 0 0%
Site is too large 0 0%
No opportunity for expansion 2 22%
Condition of building 0 0%
General appearance of site 0 0%
Utilities/energy, that is the type, level or quantity available 0 0%
Location is inconvenient for customers 0 0%
Access to research and development in the area 0 0%
Availability of skilled labour 2 22%
Availability of unskilled labour 0 0%
Location is inconvenient for employees 0 0%
Roads & highway system 0 0%
Trucking & distribution 0 0%
Public transit 0 0%
Policing/security/fire protection 0 0%
Business taxes 1 10%
Community business support 0 0%

~ 30 ~
BR+E Final Report
General appearance of community 0 0%
Other (Specify): 0 0%BD6a. Is this a home‐based business operated from the owner's residence?
Response Count PercentYes 2 22%
No 7 77%
BD6b. Is this a home‐based business operated from the owner's residence? Does the owner of this business own or lease the facility?
Response Count PercentOwn 5 55%
Lease 2 22% BD7. When does the lease expire?
Response Count PercentMonth to month 0 0%
This calendar year 0 0%
Next year 0 0%
In 2 to 3 years 0 0%
Over 3 years from now 2 22% BD8a. Do you anticipate any problems in renewing the lease?
Response Count PercentYes 0 0%
No 2 22%

~ 31 ~
BR+E Final Report
BD9. Which of the following energy sources does this business use and prefer? By prefer, I mean the one you would like to use, whether or not you currently use it. ‐ Electricity/hydro
Response Count PercentUse 9 100%
Prefer 0 0%
BD9. Which of the following energy sources does this business use and prefer? By prefer, I mean the one you would like to use, whether or not you currently use it. ‐ Natural gas
Response Count PercentUse 9 100%
Prefer 0 0%BD9. Which of the following energy sources does this business use and prefer? By prefer, I mean the one you would like to use, whether or not you currently use it. ‐ Fuel oil
Response Count PercentUse 2 22%
Prefer 0 0%BD9. Which of the following energy sources does this business use and prefer? By prefer, I mean the one you would like to use, whether or not you currently use it.– Propane
Response Count PercentUse 2 22%
Prefer 0 0%

~ 32 ~
BR+E Final Report
BD9. Which of the following energy sources does this business use and prefer? By prefer, I mean the one you would like to use, whether or not you currently use it. ‐ Wind
Response Count PercentUse 0 0%
Prefer 0 0%
BD9. Which of the following energy sources does this business use and prefer? By prefer, I mean the one you would like to use, whether or not you currently use it. ‐ Bio‐diesel
Response Count PercentUse 0 0%Prefer
0 0%
BD9. Which of the following energy sources does this business use and prefer? By prefer, I mean the one you would like to use, whether or not you currently use it. ‐ Other alternative energy (Specify)
Response Count PercentUse 0 0%
Prefer 0 0%BD9. Which of the following energy sources does this business use and prefer? By prefer, I mean the one you would like to use, whether or not you currently use it. ‐ No preference
Response Count PercentUse 0 0%
Prefer 0 0%.

~ 33 ~
BR+E Final Report
BD10. Why don't you use the type of energy you prefer?
Response Count PercentNot available in this community 0 0%
Not available to my site 0 0%
Insufficient/inadequate availability of supply 0 0%
Price 1 10%
Cost of installation 1 10%
Other (Specify): 0 0%
BD11. Do you have any concerns with respect to energy supply, management or efficiency? ‐ What are your concerns with respect to your current energy supply, management or efficiency?
Response Count PercentInconsistent supply/periodic brownouts 2 22%
Unusually high‐energy consumption 0 0%
Loss of productivity 0 0%
Cost of energy 0 0%
Other (Specify): 0 0%. BD12. Would your business benefit from engineering or technical support with respect to energy conservation and efficiency?
Response Count PercentYes 0 0%
No 1 10% BD13a. Please provide us with some insight into the use and importance of IT in your business by indicating which you A) Use; B) Prefer and ... rate the importance of these technologies to your business. – Use
Response Count PercentDial‐up 0 0%

~ 34 ~
BR+E Final Report
High Speed: Cable 2 22%
High Speed: DSL 2 22%
High Speed: Wireless 5 55%
High Speed: Satellite 0 0%
High Speed: T1 2 22%
Internet ready devices (blackberry) 2 22%BD13a. Please provide us with some insight into the use and importance of IT in your business by indicating which you A) Use; B) Prefer and ... rate the importance of these technologies to your business.
Response Count PercentDial‐up 0 0%
High Speed: Cable 1 10%
High Speed: DSL 2 22%
High Speed: Wireless 4 44%
High Speed: Satellite 0 0%
High Speed: T1 2 22%
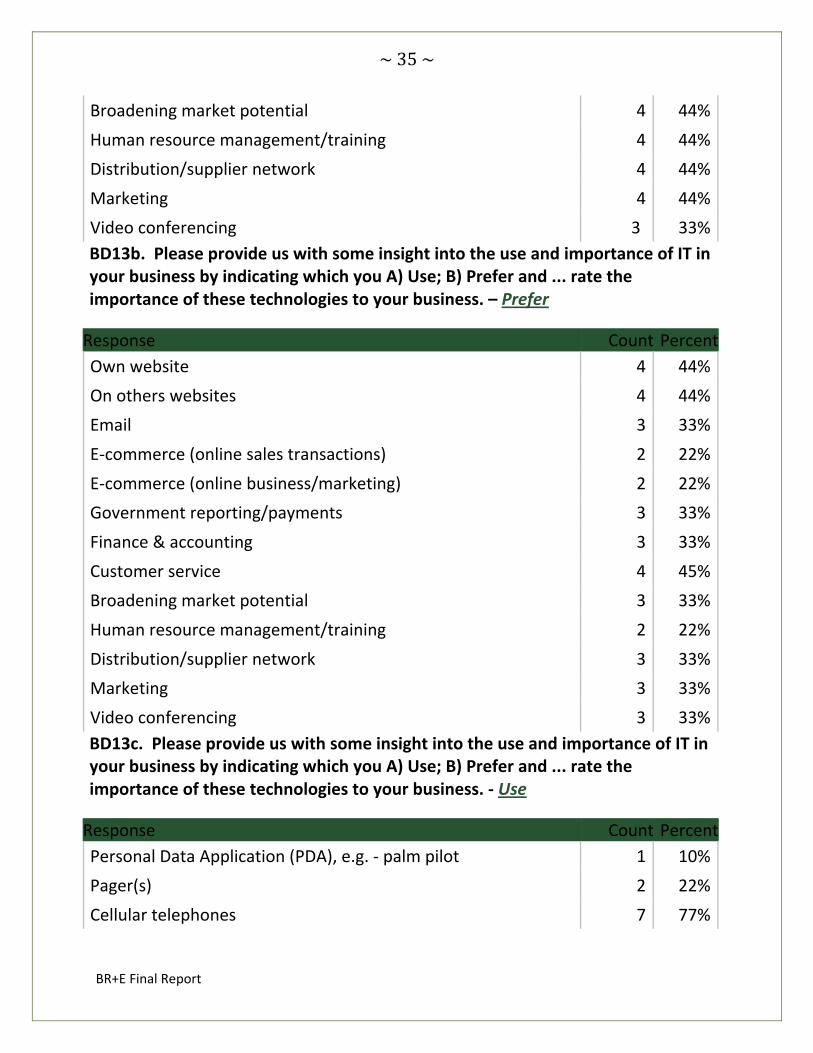
Internet ready devices (blackberry) 0 0%BD13b. Please provide us with some insight into the use and importance of IT in your business by indicating which you A) Use; B) Prefer and ... rate the importance of these technologies to your business. ‐ Use
Response Count PercentOwn website 6 67%
On others websites 7 77%
Email 8 89%
E‐commerce (online sales transactions) 3 33%
E‐commerce (online business/marketing) 3 33%
Government reporting/payments 6 67%
Finance & accounting 5 55%
Customer service 6 67%
~ 35 ~
BR+E Final Report
Broadening market potential 4 44%
Human resource management/training 4 44%
Distribution/supplier network 4 44%
Marketing 4 44%
Video conferencing 3 33%BD13b. Please provide us with some insight into the use and importance of IT in your business by indicating which you A) Use; B) Prefer and ... rate the importance of these technologies to your business. – Prefer
Response Count PercentOwn website 4 44%
On others websites 4 44%
Email 3 33%
E‐commerce (online sales transactions) 2 22%
E‐commerce (online business/marketing) 2 22%
Government reporting/payments 3 33%
Finance & accounting 3 33%
Customer service 4 45%
Broadening market potential 3 33%
Human resource management/training 2 22%
Distribution/supplier network 3 33%
Marketing 3 33%
Video conferencing 3 33%BD13c. Please provide us with some insight into the use and importance of IT in your business by indicating which you A) Use; B) Prefer and ... rate the importance of these technologies to your business. ‐ Use
Response Count PercentPersonal Data Application (PDA), e.g. ‐ palm pilot 1 10%
Pager(s) 2 22%
Cellular telephones 7 77%

~ 36 ~
BR+E Final Report
Digital telephones (touch phone) 5 55%
Voice over internet protocol 0 0%
Other 0 0%BD14. What, if anything, is keeping you from implementing any of these telecommunication technologies?
Response Count PercentTelecommunications infrastructure in community 0 0%
Start‐up cost of service 0 0%
Ongoing cost of service 0 0%
Privacy and/or security concerns (e‐commerce) 1 10%Experience with telecommunication applications within the business
0 0%
Local training opportunities for staff 0 0%Effectiveness or usefulness of the technology & potential business application unknown
0 0%
Have what is needed 0 0%
Other (Specify): 0 0%BD15. Looking forward to the next 3 years, indicate how important each of these factors will be in ensuring that this business remains competitive. Product research and development
Response Count PercentVery important 5 55%
Somewhat important 0 0%
Not at all important 1 10%
Not applicable 0 0% BD15. Looking forward to the next 3 years, indicate how important each of these factors will be in ensuring that this business remains competitive. Market development, locally
Response Count PercentVery important 3 33%

~ 37 ~
BR+E Final Report
Somewhat important 2 22%
Not at all important 2 22%
Not applicable 0 0%
BD15. Looking forward to the next 3 years, indicate how important each of these factors will be in ensuring that this business remains competitive. Market development, outside local area
Response Count PercentVery important 6 67%
Somewhat important 0 0%
Not at all important 0 0%
Not applicable 0 0% BD15. Looking forward to the next 3 years, indicate how important each of these factors will be in ensuring that this business remains competitive. Access to exporting and international markets
Response Count PercentVery important 1 10%
Somewhat important 1 10%
Not at all important 1 10%
Not applicable 2 22% BD15. Looking forward to the next 3 years, indicate how important each of these factors will be in ensuring that this business remains competitive. Access to importing of products & services
Response Count PercentVery important 3 33%
Somewhat important 3 33%
Not at all important 0 0%

~ 38 ~
BR+E Final Report
Not applicable 0 0%
BD15. Looking forward to the next 3 years, indicate how important each of these factors will be in ensuring that this business remains competitive. Add or change in products or services
Response Count PercentVery important 3 33%
Somewhat important 3 33%
Not at all important 0 0%
Not applicable 1 10% BD15. Looking forward to the next 3 years, indicate how important each of these factors will be in ensuring that this business remains competitive. Strategic alliances (joining with other businesses)
Response Count PercentVery important 2 22%
Somewhat important 1 10%
Not at all important 3 33%
Not applicable 0 0% BD15. Looking forward to the next 3 years, indicate how important each of these factors will be in ensuring that this business remains competitive. Improving worker productivity
Response Count PercentVery important 6 67%
Somewhat important 0 0%
Not at all important 0 0%
Not applicable 0 0%

~ 39 ~
BR+E Final Report
BD15. Looking forward to the next 3 years, indicate how important each of these factors will be in ensuring that this business remains competitive. ISO 9000/14000 or HACCP management standards
Response Count PercentVery important 4 44%
Somewhat important 1 10%
Not at all important 1 10%
Not applicable 0 0% BD15. Looking forward to the next 3 years, indicate how important each of these factors will be in ensuring that this business remains competitive. Industry/professional standards
Response Count PercentVery important 5 55%
Somewhat important 0 0%
Not at all important 1 10%
Not applicable 0 0% BD15. Looking forward to the next 3 years, indicate how important each of these factors will be in ensuring that this business remains competitive. Availability of labour
Response Count PercentVery important 6 67%
Somewhat important 0 0%
Not at all important 0 0%
Not applicable 0 0%

~ 40 ~
BR+E Final Report
BD15. Looking forward to the next 3 years, indicate how important each of these factors will be in ensuring that this business remains competitive. Workforce health and safety
Response Count PercentVery important 6 67%
Somewhat important 0 0%
Not at all important 0 0%
Not applicable 0 0% BD15. Looking forward to the next 3 years, indicate how important each of these factors will be in ensuring that this business remains competitive. Workforce skill development
Response Count PercentVery important 4 44%
Somewhat important 6 67%
Not at all important 0 0%
Not applicable 0 0% BD15. Looking forward to the next 3 years, indicate how important each of these factors will be in ensuring that this business remains competitive. Energy costs
Response Count PercentVery important 7 77%
Somewhat important 1 10%
Not at all important 0 0%
Not applicable 0 0%

~ 41 ~
BR+E Final Report
BD15. Looking forward to the next 3 years, indicate how important each of these factors will be in ensuring that this business remains competitive. Water/sewer availability
Response Count PercentVery important 7 77%
Somewhat important 0 0%
Not at all important 0 0%
Not applicable 0 0% BD15. Looking forward to the next 3 years, indicate how important each of these factors will be in ensuring that this business remains competitive. Water/sewer costs
Response Count PercentVery important 6 67%
Somewhat important 1 10%
Not at all important 0 0%
Not applicable 0 0% BD15. Looking forward to the next 3 years, indicate how important each of these factors will be in ensuring that this business remains competitive. Improved customer service
Response Count PercentVery important 6 67%
Somewhat important 0 0%
Not at all important 1 10%
Not applicable 0 0%

~ 42 ~
BR+E Final Report
BD15. Looking forward to the next 3 years, indicate how important each of these factors will be in ensuring that this business remains competitive. Availability of telecommunication services
Response Count PercentVery important 6 67%
Somewhat important 0 0%
Not at all important 0 0%
Not applicable 0 0% BD15. Looking forward to the next 3 years, indicate how important each of these factors will be in ensuring that this business remains competitive. Exchange rate for Canadian dollar
Response Count PercentVery important 2 22%
Somewhat important 4 44%
Not at all important 0 0%
Not applicable 0 0% BD15. Looking forward to the next 3 years, indicate how important each of these factors will be in ensuring that this business remains competitive. Resolution of cross border issues
Response Count PercentVery important 1 10%
Somewhat important 2 22%
Not at all important 2 22%
Not applicable 1 10%

~ 43 ~
BR+E Final Report
BD15. Looking forward to the next 3 years, indicate how important each of these factors will be in ensuring that this business remains competitive. Accessing capital
Response Count PercentVery important 2 22%
Somewhat important 4 44%
Not at all important 0 0%
Not applicable 0 0% BD15. Looking forward to the next 3 years, indicate how important each of these factors will be in ensuring that this business remains competitive. Business planning
Response Count PercentVery important 6 67%
Somewhat important 1 10%
Not at all important 0 0%
Not applicable 0 0% BD15. Looking forward to the next 3 years, indicate how important each of these factors will be in ensuring that this business remains competitive. Strategic marketing
Response Count PercentVery important 4 44%
Somewhat important 2 22%
Not at all important 0 0%
Not applicable 0 0%

~ 44 ~
BR+E Final Report
BD15. Looking forward to the next 3 years, indicate how important each of these factors will be in ensuring that this business remains competitive. Other (Specify)
Response Count PercentVery important 0 0%
Somewhat important 0 0%
Not at all important 0 0%
Not applicable 0 0% BD16. Does the business import products or services from... ‐ Outside the municipality
Response Count PercentYes 5 55%
No 1 10% BD16. Does the business import products or services from... ‐ Outside Ontario but within Canada
Response Count PercentYes 4 44%
No 2 22% BD16. Does the business import products or services from... ‐ Outside Canada
Response Count PercentYes 5 55%
No 1 10%

~ 45 ~
BR+E Final Report
BD18a. Do you participate in a product and/or service buyer‐supplier network?
Response Count PercentYes 3 33%
No 6 67% BD18b. Do you participate in a product and/or service buyer‐supplier network? ‐ Would a product and/or service buyer‐supplier network be of benefit to your business?
Response Count PercentYes 3 33%
No 3 33% BD18c. Do you participate in a product and/or service buyer‐supplier network? ‐ Is there a concentration of firms in your area that could provide complementary products or services?
Response Count PercentYes 2 22%
No 5 55%
Business Development- Markets
MA1. Are you interested in pursuing any of the following with other businesses in your community?
Response Count PercentJoint product purchasing 1 10%
Joint marketing 0 0%
Collaboration/networking/information sharing 2 22%
Other (Specify): 0 0%

~ 46 ~
BR+E Final Report
None
3 33%
MA2. During the past 3 years, what has been your total dollar sales trend at this location?
Response Count PercentIncreased 1 10%
Decreased 1 10%
Uneven sales pattern 1 10%
Same/no significant change 0 0% MA3. What are your expectations for next year's total dollar sales compared to last year?
Response Count PercentHigher 1 10%
Lower 1 10%
Same 1 10%
Not sure 0 0% MA4. Is the competition in your market...
Response Count PercentIncreasing 5 55%
Decreasing 1 10%
Staying the same 2 22% MA5. Is your market share...
Response Count PercentIncreasing 1 10%
Decreasing 2 22%
Staying the same 2 22%

~ 47 ~
BR+E Final Report
MA6. Do you receive market research and/or trend information regarding your sector from any of the following?
Response Count PercentIndustry/sector/association newsletters 4 44%
Industry/sector/association websites 4 44%
Government publications 5 55%
Government websites 6 67%
Consultants 1 10%
Trade Shows 4 44%
Economic Development Office 1 10%
Business networking 6 67%
Suppliers 6 67%
Other (Specify): 0 0%MA7. How do you identify your customer's needs?
Response Count PercentCustomer surveys 3 33%
Customer comment cards 1 10%
Informal customer contact 6 67%
Customer complaints 6 67%
Customer database management 5 55%
Sales calls 4 44%
Trade or industry publications 4 44%
Marketing publications 4 44%
Electrical communications (Internet, web page) 0 0%
Other (Specify): 0 0%

~ 48 ~
BR+E Final Report
MA8. How do you market your products/services? – Internet
Response Count PercentOntario/Canada 4 44%
Outside Canada 0 0%MA9. How do you market your products/services? ‐ Trade Show Attendance
Response Count PercentOntario/Canada 4 44%
Outside Canada 0 0%MA10. How do you market your products/services? ‐ General Publications
Response Count PercentOntario/Canada 3 33%
Outside Canada 0 0%MA11. How do you market your products/services? – Distributor
Response Count PercentOntario/Canada 3 33%
Outside Canada 0 0%MA12. How do you market your products/services? ‐ Sponsorship of events
Response Count PercentOntario/Canada 3 33%
Outside Canada 0 0%MA12. How do you market your products/services? ‐ Business cards
Response Count PercentOntario/Canada 3 33%
Outside Canada 0 0%MA12. How do you market your products/services? ‐ Other (Specify)
Response Count PercentOntario/Canada 0 0%
Outside Canada 0 0%

~ 49 ~
BR+E Final Report
Workforce Development
WD1. During the past 3 years, has the number of employees in this business increased, decreased or stayed the same? Please indicate the number if an increase or a decrease occurred.
Response Count PercentIncreased 3 33%
Decreased 0 0%
Remain the same 6 67%
Don't know 0 0% . WD2. What factors are responsible for this change?
Response Count PercentBusiness did not exist before 0 0%
Technological changes in your business 0 0%
Increase or decrease in market competition 0 0%
Management effectiveness 0 0%
Corporate decision or policies 1 10%
More or less subcontracting 0 0%
Renovation or expansion 0 0%
Increase or decrease in sales 3 33%
New products or services introduced 3 33%
Entered new market 1 10%
Increase or decrease in market share 0 0%
Contracts/outsourcing 0 0%
Other (Specify): 0 0%

~ 50 ~
BR+E Final Report
WD3. During the next 3 years, do you think the number of employees in this business will increase, decrease or stayed the same? If you anticipate an increase or a decrease, please write in the number you will gain or lose.
Response Count PercentIncrease 3 33%
Decrease 0 0%
Remain the same 5 55%
Don't know 0 0% WD4. What factors are responsible for this change?
Response Count PercentTechnological changes in your business 0 0%
Increase or decrease in market competition 0 0%
Management effectiveness 1 10%
Corporate decision or policies 0 0%
More or less subcontracting 0 0%
Renovation or expansion 1 10%
Increase or decrease in sales 2 22%
New products or services introduced 2 22%
Entered new market 1 10%
Increase or decrease in market share 1 10%
Contracts/outsourcing 0 0%
Other (Specify): 0 0%
WD5a. How do you rate the availability of workers in this area for your business needs?
Response Count PercentExcellent 1 10%
Good 5 55%

~ 51 ~
BR+E Final Report
Fair 4 44%
Poor 0 0% WD6a. How do you rate the quality of the workforce in this area for your business needs?
Response Count PercentExcellent 1 10%
Good 6 67%
Fair 2 22%
Poor 0 0% WD7a. How do you rate the stability of the workforce in this area for your business needs?
Response Count PercentExcellent 0 0%
Good 4 44%
Fair 4 44%
Poor 0 0% WD8. What are the A) current and B) 3‐year projected employee needs of your business? ‐ Skilled trades (Specify)
Response Count PercentSkilled trades (Type) 0 0%
Unskilled labour (Type) 0 0%
Industry specialists (Type) 0 0%
Manufacturing technology (Type) 0 0%
Computer technology/programming (Type) 0 0%
Environmental technology/management (Type) 0 0%
Electronic engineering (Type) 0 0%
Clerical (Type) 0 0%

~ 52 ~
BR+E Final Report
Sales (Type) 0 0%
Business Administration (Type) 0 0%
Product development (Type) 0 0%
Market development (Type) 0 0%
Other (Type) 0 0%
Other (Type) 0 0%
Other (Type) 0 0%
Other (Type) 0 0%
Other (Type) 0 0%
Apprenticeship (Type) 0 0%
None (Type) 0 0%WD9. Are you able to recruit sufficient qualified employees for this location?
Response Count PercentYes 6 67%
No 2 22% WD12a. Does this business have difficulty retaining employees?
Response Count PercentYes 2 22%
No 6 67% WD12b. What are the reasons for these difficulties?
Response Count PercentWages 1 10%
Competition 0 0%
Seasonal 0 0%
Other (Specify): 0 0%

~ 53 ~
BR+E Final Report
WD12c. Would you like information on employee retention strategies?
Response Count PercentYes 0 0%
No 2 22% WD13. Does your workforce need to improve skills in any of the following areas?– Reading
Response Count PercentYes 1 10%
No 2 22% WD13. Does your workforce need to improve skills in any of the following areas?– Numeracy
Response Count PercentYes 1 10%
No 2 22% WD13. Does your workforce need to improve skills in any of the following areas? Oral Communication
Response Count PercentYes 1 10%
No 1 10% WD13. Does your workforce need to improve skills in any of the following areas? Written communication
Response Count PercentYes 1 10%
No 2 22%

~ 54 ~
BR+E Final Report
WD13. Does your workforce need to improve skills in any of the following areas?– Supervisory
Response Count PercentYes 5 55%
No 2 22% WD13. Does your workforce need to improve skills in any of the following areas? ‐ Computer software
Response Count PercentYes 4 44%
No 1 10% WD13. Does your workforce need to improve skills in any of the following areas? ‐ Computer hardware
Response Count PercentYes 1 10%
No 2 22% WD13. Does your workforce need to improve skills in any of the following areas? ‐ Sales & marketing
Response Count PercentYes 0 0%
No 3 33% WD13. Does your workforce need to improve skills in any of the following areas? ‐ Financial management
Response Count PercentYes 1 10%
No 2 22%

~ 55 ~
BR+E Final Report
WD13. Does your workforce need to improve skills in any of the following areas? ‐ Customer Service
Response Count PercentYes 4 44%
No 1 10% WD13. Does your workforce need to improve skills in any of the following areas? ‐ Working with others
Response Count PercentYes 1 10%
No 2 22% WD13. Does your workforce need to improve skills in any of the following areas? ‐ Health & safety
Response Count PercentYes 2 22%
No 3 33% WD13. Does your workforce need to improve skills in any of the following areas? ‐ Quality assurance
Response Count PercentYes 0 0%
No 1 10% WD13. Does your workforce need to improve skills in any of the following areas? ‐ Other (Specify)
Response Count PercentYes 0 0%
No 0 0%

~ 56 ~
BR+E Final Report
WD14. Where do your employees receive training, and does this training meet your needs?
Response Count PercentLocal Community College 4 44%
Distance Education 3 33%
In‐house 8 89%
Customized training 3 33%
University 2 22%
Outside of the area (Specify): 1 10%
Other (Specify): 0 0%WD14. Where do your employees receive training, and does this training meet your needs? ‐ Local Community College
Response Count PercentYes 3 33%
No 1 10% WD14. Where do your employees receive training, and does this training meet your needs? ‐ Distance Education
Response Count PercentYes 3 33%
No 0 0% WD14. Where do your employees receive training, and does this training meet your needs? ‐ In‐house
Response Count PercentYes 3 33%
No 0 0%

~ 57 ~
BR+E Final Report
WD14. Where do your employees receive training, and does this training meet your needs? ‐ Customized training
Response Count PercentYes 4 44%
No 0 0% WD14. Where do your employees receive training, and does this training meet your needs? ‐ University
Response Count PercentYes 2 22%
No 0 0% WD14. Where do your employees receive training, and does this training meet your needs? ‐ Outside of the area
Response Count PercentYes 1 10%
No 0 0% WD15. What are the most significant barriers to your employees receiving the necessary training?
Response Count PercentCost 1 10%
Awareness of existing training programs 1 10%
Awareness of training support programs 0 0%
Relevant training is not offered at community college 0 0%
Distance to training facility 0 0%
Availability of training locally 0 0%
Unable to release employees 2 22%
Losing trained employees to other businesses 1 10%
Awareness of legislated training 0 0%

~ 58 ~
BR+E Final Report
Loss of productivity during training period 1 10%
Other (Specify): 0 0%WD16a. Would a mentoring program benefit the businesses in this community? This would involve meeting and working with other businesses as a way of sharing and learning new skills.
Response Count PercentYes 3 33%
No 2 22%
Not sure 0 0% WD16b. Would your business benefit from a mentoring program in any one of the following areas?
Response Count PercentBusiness planning 0 0%
Marketing 1 10%
Financial 0 0%
Technical 0 0%
Human Resources 1 10%
Production 0 0%
Logistics (distribution) 0 0%
Other (Specify): 0 0%WD16c. Would your business benefit from a mentoring program in any one of the following areas? ‐ Would you or your company be willing to participate as a mentor in a mentoring program? In which area could you or your company provide mentorship?
Response Count PercentBusiness planning 0 0%
Marketing 0 0%
Financial 0 0%
Technical 0 0%

~ 59 ~
BR+E Final Report
Human Resources 0 0%
Production 0 0%
Logistics (distribution) 0 0%
Other (Specify): 0 0%

BR+E Fina
The follocompiledsurvey. TCoordinato choossuited Wanswers answers.to some reflection
1.Whatcore? A
Address
A need
A need
more ac
2. Whatfuture? Municip Business
al Report
owing quesd for the LThis sectioator and the question
Wellington Nthat are sh. Because textent, then of the ma
t are the toAnswers:
s buildings
for more n
for a “big
ccessibility
t is your biAnswers:
al Costs an
s and prope
L
stions wereocal Comm
on allowed he Businesss based onNorth as a
hown were this sectione answers pajority of r
op FOUR
s in poor co
niche mark
box” store
y for the di
iggest con
nd Charges
erty taxes
OCAL C
e created amunity secthe BR+E
s Economin what was
communitthe most c
n was a “frprovided beresponses.
things you
ondition
kets
e/ anchor st
sabled in t
cern with
s EX. wate
~ 60 ~
COMMU
and ction of theE
c Manger felt well
ty. The consistent ree for all” elow are a
u feel shou
tores
he downto
doing bus
er and sewe
UNITY
e
uld be don
own
siness in th
er costs
ne to the d
he
downtown

~ 61 ~
BR+E Final Report
3. What is the one positive consistent comment from your customers about doing business in this community? Answers: How beautiful this area is and how nice the people are! 4. Within the past five years what would you say your biggest complaint from your customers would be in the area? Answers: Water and Sewer costs Property taxes 5. Which new suppliers of products or services would you like to see added to this community? Answers: Indoor Pool Live Theatre Chain Restaurant

~ 62 ~
BR+E Final Report
6.Please describe how local business associations and/or economic development offices could assist your business sector.
Response Count PercentMarketing seminars 0 0%
Access to capital seminars 0 0%
Trade shows 2 22%
Business networking sessions 4 44%
Export development programs and services 0 0%
Joint advertising and marketing 4 44%
Attraction of related supply & services businesses 0 0%
Workforce planning, employee training and attraction 4 44%Identification of opportunities for shared use of buildings, infrastructure etc.
0 0%
Productivity improvement workshops 0 0%
Website development 0 0%
E‐marketing 0 0%

~ 63 ~
BR+E Final Report
ACTION PLANS
Upon completion of the surveys, all of the data collected was compiled into readable raw data format. The raw data was then analyzed in detail by the Business Retention and Expansion Coordinator (BR+E Coordinator) and the Economic Development Committee (EDC). As a result of this analysis, the BR+E Coordinator and the EDC identified potential project areas that need addressed or initiated to meet long- term goals of the project. By addressing the issues and potential projects identified as action items, it will ultimately ensure that positive benefits are received in the community from this BR+E process.
For each of the potential projects identified, an Action Plan was developed to be utilized in achieving the stated project. Each Action Plan proposed includes the following components:
Definition of the project
Action item
Actions to be taken
Potential project partners
Time frame for completion
Short Term= under one year
Medium Term= one to two years
Long Term-=two + years
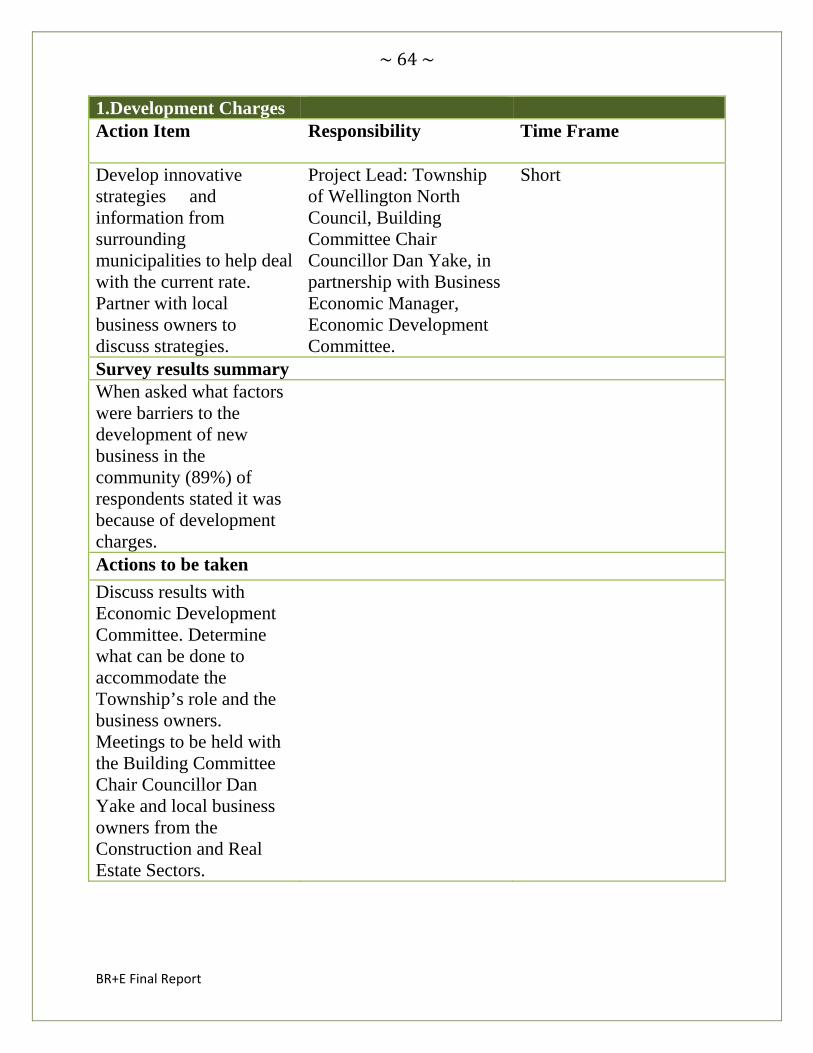
Action Plan 1- Development Charges
Action Plan 2- Cross Sharing of Company Resources and Information
Action Plan 3- Community Improvement Plan (CIP)
Action Plan 4- Business &/ or Industry Networking Sessions
~ 64 ~
BR+E Final Report
1.Development Charges Action Item Responsibility
Time Frame
Develop innovative strategies and information from surrounding municipalities to help deal with the current rate. Partner with local business owners to discuss strategies.
Project Lead: Township of Wellington North Council, Building Committee Chair Councillor Dan Yake, in partnership with Business Economic Manager, Economic Development Committee.
Short
Survey results summary When asked what factors were barriers to the development of new business in the community (89%) of respondents stated it was because of development charges.
Actions to be taken
Discuss results with Economic Development Committee. Determine what can be done to accommodate the Township’s role and the business owners. Meetings to be held with the Building Committee Chair Councillor Dan Yake and local business owners from the Construction and Real Estate Sectors.

~ 65 ~
BR+E Final Report
2. Cross Sharing of Company Resources and Information
Action Item Responsibility Time Frame Encourage local business to network and communicate on a regular basis to capitalize on joint training and company resource sharing opportunities. For example. WHMIS & Health and Safety training.
Project Lead: Business Economic Manager and the Economic Development Committee
Short to Medium
Survey results summary During a debrief section of the interview process, businesses were asked to provide ideas for future recommendations. The majority of businesses said that cost and distance were barriers to employees receiving training and that local joint training should be considered for the future.
Actions to be taken Create partnerships to capitalize on training opportunities and resource sharing between businesses.

~ 66 ~
BR+E Final Report
3. Community Improvement Plan
Action Item Responsibility Time Frame To promote and encourage commercial and industrial revitalization.
Project Lead: Business Economic Manager and Economic Development Committee Champion.
Medium to Long
Survey results summary (89%) of respondents indicated in the “Local Community” section that the Township of Wellington North would benefit from a community improvements.
Actions to be taken Implement a Community Improvement Plan which includes a Façade Improvement Loan and Grant Program and a Signage Improvement Grant Program for local owners of commercial and industrial buildings.

~ 67 ~
BR+E Final Report
3. Business &/ or Industry Networking Sessions
Action Item Responsibility Time Frame To promote and encourage local Business &/ or Industry Networking Sessions.
Project Lead: Business Economic Manager and Economic Development Committee.
Short to Medium
Survey results summary (44%) of respondents indicated in the “Local Community” section that they would benefit from the Township of Wellington North Economic Development offices assisting and providing Business &/ or Industry Networking Sessions. For example. Business After Five, Wellington North Showcase.
Actions to be taken Create a partnership with local businesses to promote and implement Business &/ or Industry Networking Sessions either on a monthly or bi-monthly basis.

~ 68 ~
BR+E Final Report
CONCLUSION
The Business Retention and Expansion Action Plan will become a key element of the Township of Wellington North’s local Economic Development efforts. The objectives of this project were to:
Short Term Objectives
• Build relationships with local businesses • Demonstrate and provide community support for local business • Address urgent business concerns and issues • Improve communication between the community, local government and
business • Promotion of a positive attitude to work towards a solution
Long Term Objectives
• Increase the competitiveness of local businesses • Support an improved working relationship between the Arthur Chamber,
Mount Forest Chamber and Township of Wellington North • Strong viable local economy
While some of these objectives have been achieved through this project to date, many are longer term and will require committed resources from Council, the Economic Development Committee, the business community and the community at large.
The Final Report and Action Plan set the stage for business development within the community. Beyond resources, the most important element to the successful implementation of the Action Plan will be patience. The results from the plan will not be recognized overnight, however, the benefits will be realized through commitment and hard work, something the Economic Development Committee has proved time and time again. A number of exciting initiatives and plans are underway or are in the midst of being considered for Wellington North, so stay tuned for BR+E has only just begun!

BR+E Fina
al Report
TakinWing CarWelling
~ 69 ~
re of Bngton N
BusinesNorth!
ss in !