Embed Size (px)
Citation preview

Marijuana BusinessFactbook 2015Exclusive Financial Data For Cannabusinesses & Major Investors
ComplimentaryExcerpt
Excerpt Includes:• Letter from the Publisher• Executive Summary: 13 Key Charts & Findings• Complete Table of Contents
For your printed copy of the entire 200-page Factbook, with 154+ Tables & Charts, go to:MJBizFactbook.com
Ships within one business day by Priority Mail!
Published April 2015ISBN 798-1-938219-15-3
MarijuanaBusiness DailyThe most trusted cannabusiness news source since 2011
NOW IN OUR 4th YEAR!

Order at MJBizFactbook.com
© Copyright 2015, Marijuana Business Media, a division of Anne Holland Ventures Inc. You may distribute copies of this Executive Summary as PDFs or in print BUT ONLY if they are reproduced in their entirety! For permissions or service, contact [email protected] or call (401) 354-7555 x1.
Page 1
From the PublisherWelcome to the third edition of our bestselling Marijuana Business Factbook, from the
editorial team behind Marijuana Business Daily.
What’s new? Everything.
Every single chart, financial stat, legal note and data table has been re-researched and created anew for this edition. Given how quickly and dramatically the marijuana industry changes, you can imagine how many of the numbers of this Factbook have changed over the past year. (Note: If you own an older edition – and thousands of you do – please don’t use it anymore. The world has changed – to the tune of nearly a billion dollars in the past year alone.)
This year more than 1,000 business owners and their financial backers took our extensive Mari-juana Business Survey, which much of the exclusive data in this Factbook is based on. They revealed more of their financials than ever before, in an effort to help create benchmarks for the community to rely on for planning, forecasting and raising money.
Data you won’t find anywhere else includes:
• Revenues, operational costs and profitability data for six key sectors: retail, growers, infused products, testing labs, ancillary goods and ancillary services.
• Detailed profiles for each of 23 U.S. states, plus Canada, with legal info, patient and customer stats, sales potential and our exclusive analysis of the business opportunities and concerns for each region.
• An entire chapter of data around loans and equity investments specific to privately held cannabusinesses, including investor ROI, interest rates and more.
Our goal, as always, is to provide you with moderate numbers that are grounded in reality. We don’t lobby, offer investments, or have any other reason to publish hype. Unlike other indus-tries, there are very, very few publicly available financial facts on the marijuana industry. The fed-eral government doesn’t track the industry, nor do many state governments. Only 2%, at most, of marijuana-related companies are public, and these rarely offer detailed financial reports. In short, you won’t find this critical business information anywhere else.
As business journalists, and as a core value for our company, we are focused on bringing you the best and most unbiased information to help you make sound business decisions and be successful.
Lastly, if you have suggestions or ideas on future research data, we are always looking forward to hearing from you. After all, this is your industry benchmark data, developed and designed for your needs. Contact us at [email protected] or call (401) 354-7555 x1.
Best wishes for the coming year.
George Jage President & Publisher
Order at MJBizFactbook.com
© Copyright 2015, Marijuana Business Media, a division of Anne Holland Ventures Inc. You may distribute copies of this Executive Summary as PDFs or in print BUT ONLY if they are reproduced in their entirety! For permissions or service, contact [email protected] or call (401) 354-7555 x1.
Page 2
Executive Summary: 13 Key Tables & Charts
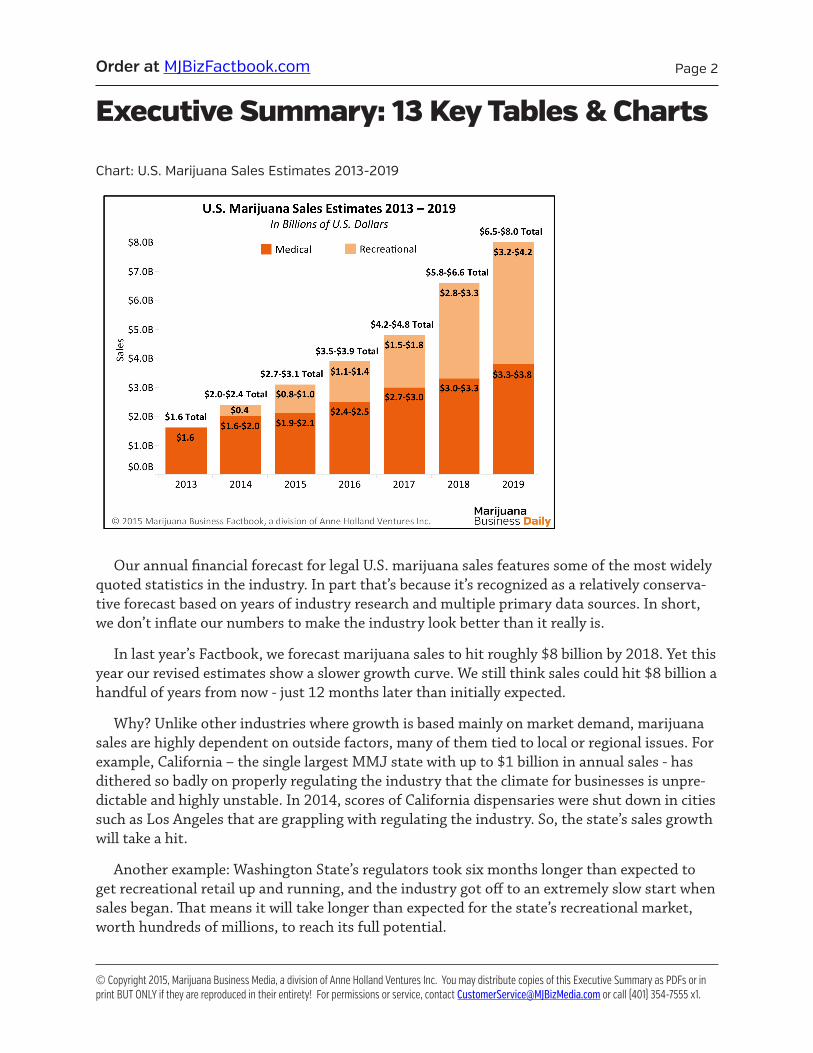
Chart: U.S. Marijuana Sales Estimates 2013-2019
Our annual financial forecast for legal U.S. marijuana sales features some of the most widely quoted statistics in the industry. In part that’s because it’s recognized as a relatively conserva-tive forecast based on years of industry research and multiple primary data sources. In short, we don’t inflate our numbers to make the industry look better than it really is.
In last year’s Factbook, we forecast marijuana sales to hit roughly $8 billion by 2018. Yet this year our revised estimates show a slower growth curve. We still think sales could hit $8 billion a handful of years from now - just 12 months later than initially expected.
Why? Unlike other industries where growth is based mainly on market demand, marijuana sales are highly dependent on outside factors, many of them tied to local or regional issues. For example, California – the single largest MMJ state with up to $1 billion in annual sales - has dithered so badly on properly regulating the industry that the climate for businesses is unpre-dictable and highly unstable. In 2014, scores of California dispensaries were shut down in cities such as Los Angeles that are grappling with regulating the industry. So, the state’s sales growth will take a hit.
Another example: Washington State’s regulators took six months longer than expected to get recreational retail up and running, and the industry got off to an extremely slow start when sales began. That means it will take longer than expected for the state’s recreational market, worth hundreds of millions, to reach its full potential.

Order at MJBizFactbook.com
© Copyright 2015, Marijuana Business Media, a division of Anne Holland Ventures Inc. You may distribute copies of this Executive Summary as PDFs or in print BUT ONLY if they are reproduced in their entirety! For permissions or service, contact [email protected] or call (401) 354-7555 x1.
Page 3
Then there’s Massachusetts, which legalized medical marijuana in 2012 but has taken much longer than expected to get its industry up and running - leaving roughly $50 million per year on the table. And that’s just $50 million to start – the state’s revenues could be much larger once the market matures.
It’s sometimes a case of two steps forward, one step back.
Happily, progress is being made in many markets across the country, and overall the outlook is extraordinarily bright. For a look at how each state’s revenues are playing out, turn to our State-by-State profiles in Chapter Three. In the meantime, this next chart illustrates why that progress is so very important.
Chart: U.S. Marijuana Industry’s Economic Impact: 2013 - 2019
Marijuana sales are just the tip of the economic iceberg. The legal marijuana industry con-tributes far more to America’s gross national product than retail sales alone. According to our extensive research and calculations, for every $1 of legally sold marijuana, at minimum an ad-ditional $2.60 of economic value enters the American economy.
Where is that $2.60 from?
Our exclusive estimate includes revenues made by other businesses in the industry rang-ing from cultivators to testing labs. It also includes the revenue generated by companies sell-ing specialist goods and/or services to these businesses, from security services to seed-to-sale

Order at MJBizFactbook.com
© Copyright 2015, Marijuana Business Media, a division of Anne Holland Ventures Inc. You may distribute copies of this Executive Summary as PDFs or in print BUT ONLY if they are reproduced in their entirety! For permissions or service, contact [email protected] or call (401) 354-7555 x1.
Page 4
software. And it includes the salaries of the staffers who work for all of these companies. If legalized marijuana were to disappear tomorrow, all of these goods, services and jobs would disappear completely (or fold into the black market where they would not be taxed or properly regulated.)
Perhaps the most impressive thing about our $2.60 calculator is that it is LOW. For example, we didn’t include paraphernalia sales to consumers (a $1 billion industry in and of itself), nor business taxes (which are unusually high), nor patient card applications, or associated visits to the doctor to obtain recommendations, or consumer-focused entertainment such as tourism and TV shows. Nor did we include the millions donated to relevant political causes.
In short, if the marijuana industry is not allowed to continue along current trends, tens of billions are at stake for the U.S. economy as a whole over the next five years and beyond.
Table: Cannabis Vs Other Industries
How does marijuana measure up compared to other industries in terms of sales? Remark-ably well. We’ve included stats for this year’s estimated retail sales as well as a general number of $40 billion-$45 billion for the estimated “true” market size of the industry if marijuana was legalized for recreational adult sales nationwide.
Much of that $40-45 billion is currently going to the black market, which represents an eco-nomic loss on multiple levels. For example, the black market generally doesn’t generate taxes. Plus, the black market does not support other sectors of the cannabis-related economy such as testing labs. And, policing the black market costs taxpayer dollars.

Order at MJBizFactbook.com
© Copyright 2015, Marijuana Business Media, a division of Anne Holland Ventures Inc. You may distribute copies of this Executive Summary as PDFs or in print BUT ONLY if they are reproduced in their entirety! For permissions or service, contact [email protected] or call (401) 354-7555 x1.
Page 5
Table: Estimated Employment in the Cannabis Industry
These jobs are for marijuana-touching companies such as growers, retailers, testing labs and infused product makers. So, this total does not include anyone on the ancillary products or ser-vices sector. If we added those jobs to the total, it could increase by as much as 50%.
Perhaps more to the point, if the industry were allowed to reach its true $45 billion poten-tial, it could mean more than a quarter of a million new U.S. jobs.
Some of these jobs are for low-skilled labor such as trimmers. At a retail level though, typical counter staff (aka budtenders) require more training and knowledge than their peers in many other industries. Other skilled positions in the industry include scientists for testing labs, cultivators with large-scale commercial experience, bookkeepers with cash-business experience, specialist insurance agents, etc.
Perhaps best of all, given the nature of the industry, many of these jobs can never be out-sourced to other states or countries. New jobs created within your state tend to stay within your state.
Chart: Average Sales Per Retail Square Foot: Marijuana Vs Other Industries

Order at MJBizFactbook.com
© Copyright 2015, Marijuana Business Media, a division of Anne Holland Ventures Inc. You may distribute copies of this Executive Summary as PDFs or in print BUT ONLY if they are reproduced in their entirety! For permissions or service, contact [email protected] or call (401) 354-7555 x1.
Page 6
To our knowledge, this is the first time anyone has ever published sales per square foot data for the marijuana industry. The ability to reveal such basic business metrics – just like any other normal industry – is another signal that the industry is at last coming of age. We calculated this data based on typical monthly marijuana sales volumes and retail store size.
Marijuana retailers – an umbrella term that includes both medical cannabis dispensaries and recreational retail stores – represent an unusual category because they are largely not a self-serve environment. To purchase cannabis you must give the counter staff your order, often after consulting with their expertise, much like in a high-end jewelry store. The bulk of the re-tail space is not packed with inventory, but rather largely left open with a few minor displays of T-shirts and paraphernalia. Increasing sales per square foot therefore is largely a matter of in-creasing foot traffic, as well as having enticing counter displays and knowledgeable budtenders.
However, many marijuana retailers are strictly limited by local laws as to how and where they can locate and advertise. This, in turn, may lead to ferocious battles for PR, social and mo-bile media optimization, and customer loyalty.
Chart: Average Cultivator Startup Costs Per Square Foot By Operation Type
Despite higher startup costs, more growers are considering moving to greenhouses or out-side grows to help mitigate out-sized utility bills.
Marijuana cultivation is perhaps the hottest area of the industry today. In many states culti-vators are required to be operated by a dispensary or retail store, meaning one business grows, processes and sells cannabis. In other states, cultivation sites can be – or are required to be – run as stand-alone businesses that sell wholesale to retailers.
Either way, today’s cultivators are deeply interested in grow efficiencies. The industry is shaking off the traditions of its past, when what mattered most about a grow was how to hide it. Now, cultivators are considering how to lower utility bills, use fewer pesticides, minimize water usage and streamline crop management. For more data on cultivator financials, see Chap-ter Four.
Order at MJBizFactbook.com
© Copyright 2015, Marijuana Business Media, a division of Anne Holland Ventures Inc. You may distribute copies of this Executive Summary as PDFs or in print BUT ONLY if they are reproduced in their entirety! For permissions or service, contact [email protected] or call (401) 354-7555 x1.
Page 7
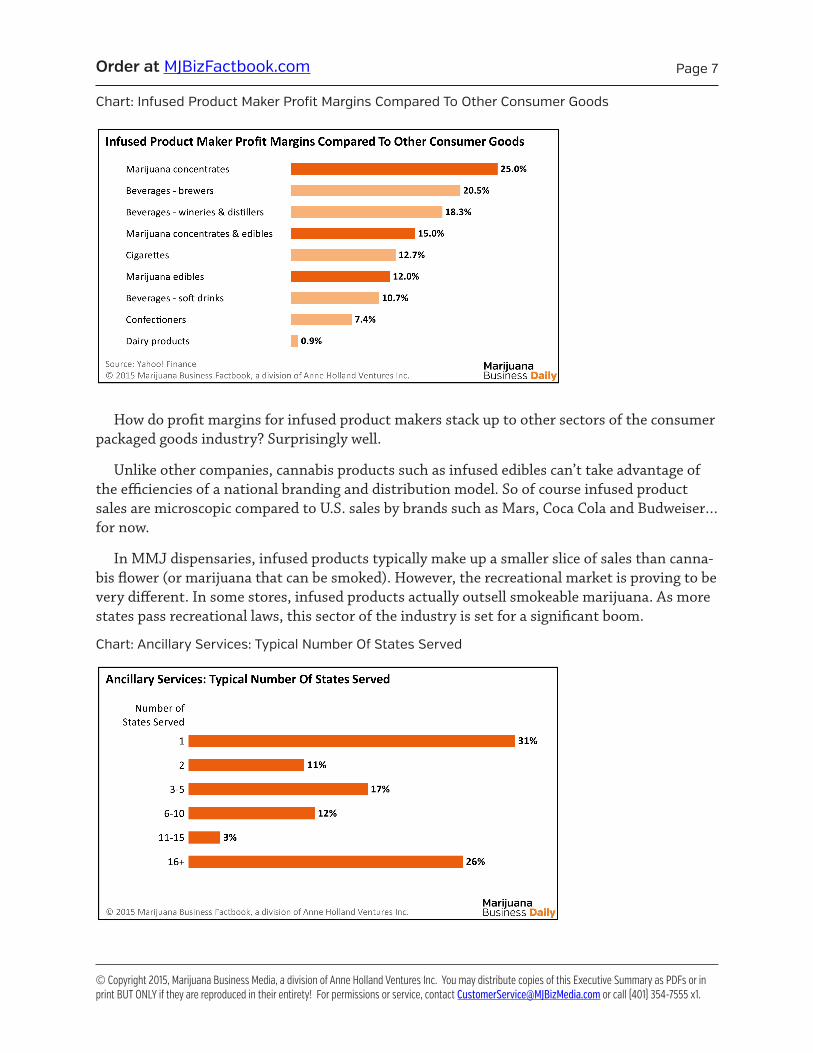
Chart: Infused Product Maker Profit Margins Compared To Other Consumer Goods
How do profit margins for infused product makers stack up to other sectors of the consumer packaged goods industry? Surprisingly well.
Unlike other companies, cannabis products such as infused edibles can’t take advantage of the efficiencies of a national branding and distribution model. So of course infused product sales are microscopic compared to U.S. sales by brands such as Mars, Coca Cola and Budweiser… for now.
In MMJ dispensaries, infused products typically make up a smaller slice of sales than canna-bis flower (or marijuana that can be smoked). However, the recreational market is proving to be very different. In some stores, infused products actually outsell smokeable marijuana. As more states pass recreational laws, this sector of the industry is set for a significant boom.
Chart: Ancillary Services: Typical Number Of States Served

Order at MJBizFactbook.com
© Copyright 2015, Marijuana Business Media, a division of Anne Holland Ventures Inc. You may distribute copies of this Executive Summary as PDFs or in print BUT ONLY if they are reproduced in their entirety! For permissions or service, contact [email protected] or call (401) 354-7555 x1.
Page 8
Ancillary services are one of the top six sectors of the marijuana industry. Unlike companies that touch marijuana in the course of business, generally ancillary services are not limited by law to doing business in a single state.
True, some service firms - such as HVAC specialists and realtors - are tied to a particular locality. Others, such as lawyers, can only practice in states where they’ve passed the bar. How-ever, a wide swath of firms including accountants, marketing services, financial services and specialist business consultants can expand as aggressively as they want to. This chart demon-strates that opportunity.
This is why most of the first national brands in the legal marijuana industry are likely to be business-to-business service and product providers, instead of consumer brands.
Table: Sampling of State Business Stability & Opportunity Rankings
Although marijuana is be-coming a national industry, each state has very different laws, regulations and business oppor-tunities. Which states are best for cannabusiness and which are worst? We’ve completely updat-ed our exclusive, annual ranking system to help you figure this out.
Our rankings are based on many factors including local laws, competition, customer demand and current sales. Here are our rankings for three states to illustrate the potential range. (You can see the rankings and details for all the rest of legal states, plus Canada, detailed in Chapter Three.)
Arizona: With an aging population of health-seekers and nearly $100 million in estimated dispensary sales, Arizona’s dispensaries have weathered legal challenges and their first years in business fairly well. The state has a fairly large cap on then number of allowable dispensaries and grows, providing ample business opportunities and plenty of room for continued growth.
California: This state is both massive and massively messy. It’s home to some of America’s largest dispensaries and most established commercial growers. It’s also almost completely unregulated at the state level, and despite federal and local crackdown efforts over the years it hasn’t been able to push through regulations. Do business in California at your peril.
Illinois: After legalizing medical marijuana in 2013, Illinois has at last started licensing dispensaries and cultivation sites. The business outlook is strong given the large number of dispensaries and grows allowed – but there are concerns over the long-term viability of the market given that the law only calls for a four-year pilot program. Whether it will be extended is anyone’s guess.
Order at MJBizFactbook.com
© Copyright 2015, Marijuana Business Media, a division of Anne Holland Ventures Inc. You may distribute copies of this Executive Summary as PDFs or in print BUT ONLY if they are reproduced in their entirety! For permissions or service, contact [email protected] or call (401) 354-7555 x1.
Page 9
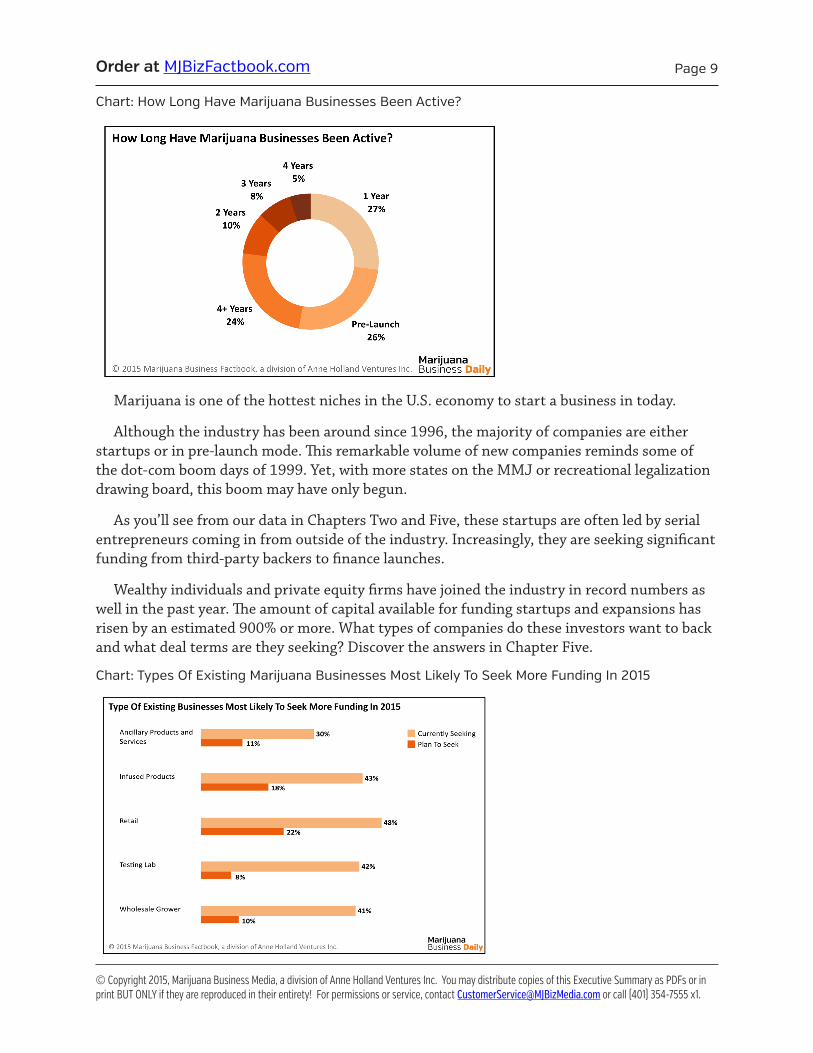
Chart: How Long Have Marijuana Businesses Been Active?
Marijuana is one of the hottest niches in the U.S. economy to start a business in today.
Although the industry has been around since 1996, the majority of companies are either startups or in pre-launch mode. This remarkable volume of new companies reminds some of the dot-com boom days of 1999. Yet, with more states on the MMJ or recreational legalization drawing board, this boom may have only begun.
As you’ll see from our data in Chapters Two and Five, these startups are often led by serial entrepreneurs coming in from outside of the industry. Increasingly, they are seeking significant funding from third-party backers to finance launches.
Wealthy individuals and private equity firms have joined the industry in record numbers as well in the past year. The amount of capital available for funding startups and expansions has risen by an estimated 900% or more. What types of companies do these investors want to back and what deal terms are they seeking? Discover the answers in Chapter Five.
Chart: Types Of Existing Marijuana Businesses Most Likely To Seek More Funding In 2015

Order at MJBizFactbook.com
© Copyright 2015, Marijuana Business Media, a division of Anne Holland Ventures Inc. You may distribute copies of this Executive Summary as PDFs or in print BUT ONLY if they are reproduced in their entirety! For permissions or service, contact [email protected] or call (401) 354-7555 x1.
Page 10
Good news for potential investors: The majority of existing cannabusinesses in every sector, except those that provide ancillary products or services, are either currently seeking financial backing or expect to shortly.
These existing businesses have licenses where required and are already doing business. Ac-cording to our survey data most are willing to consider either a high-interest loan or offer eq-uity in return for expansion capital. Want more specifics on interest rates and equity positions? Check out our data in Chapter Five.
In the meantime, here’s what major investors themselves told us about what they DON’T want to see from entrepreneurs.
Chart: Investors Reveal #1 Mistake Made by Marijuana Businesses Seeking Funding
This data offers a lesson on the importance of a thorough business plan, which must include financials based in research. (In fact, this Factbook is created annually in large part to help the industry access financial benchmark data.) Major investors are not naïve enough to believe a business plan will play out exactly as predicted in reality. Instead, they look to your plan to learn about your team’s business acumen, professionalism and strategic thinking.

Order at MJBizFactbook.com
© Copyright 2015, Marijuana Business Media, a division of Anne Holland Ventures Inc. You may distribute copies of this Executive Summary as PDFs or in print BUT ONLY if they are reproduced in their entirety! For permissions or service, contact [email protected] or call (401) 354-7555 x1.
Page 11
Chart: Marijuana Entrepreneurs Forecast Next 12 Months
Here’s a final look at what active businesses themselves in each of the major sectors are pre-dicting for the next 12 months. It’s encouraging to see how tiny that sliver of those who expect to do worse is overall, despite the industry’s banking and regulatory headaches.
Every single sector expects, on average, to do at least slightly better this year, if not a whole lot better. We know of very few industries in this country where roughly 50% of companies expect booming growth over the next 12 months.
As the very first chart in this Executive Summary revealed, even the world’s top experts can’t predict the future of the marijuana industry down to the last million. The industry is continu-ally changing and buffeted by external forces.
We predict someday that many companies will look back at this time and think “those were the good old days.” The days when you could bet big and win. The days when national brands emerged that would dominate the future. The days when a formerly stigmatized industry be-came scientific, professional, efficient and respected.
Those days are now. It’s a terrific time to be in the marijuana industry, and a terrific industry to be in.
Note: Want to publish or use our charts and numbers somewhere else? The charts and tables in our Executive Summary are yours to use, with proper attribution, as long as you don’t alter them in any way. However, the rest of the 150+ charts and tables in this Factbook are for your personal use only and may not be reproduced. We take copyright seriously – after all it is our livelihood. Thank you for understanding.

Order at MJBizFactbook.com
© Copyright 2015, Marijuana Business Media, a division of Anne Holland Ventures Inc. You may distribute copies of this Executive Summary as PDFs or in print BUT ONLY if they are reproduced in their entirety! For permissions or service, contact [email protected] or call (401) 354-7555 x1.
Page 12
Table of ContentsIntroductionFrom the PublisherExecutive Summary: 13 Key Tables & Charts Chapter 1: The Year In ReviewRise of Rec in Colorado & WashingtonElection Gains… and One Big LossMMJ Makes Big StridesChart 1.1: Change in Percent of U.S. Population Living in States
With DispensariesCalifornia, Massachusetts StruggleFederal LegislationBoost in Public PerceptionChart 1.2: Trend - America’s Support For Legalizing Marijuana Improvements on the Banking FrontCredibility and Investment BoostA Look Ahead
Chapter 2: National Marijuana Industry Facts & FiguresNATIONAL MARKET SIZE & FORECASTSChart 2.01: U.S Marijuana Sales Estimates: 2013-2019Chart 2.02: U.S. Marijuana Industry Gross National Product: 2013 - 2019Chart 2.03: U.S. Marijuana Industry Gross National Product 2015
By NicheTable 2.1: Cannabis Vs Other IndustriesChart 2.04: Distribution Of Marijuana Business Conference &
Expo Attendees: Fall 2014Table 2.2: Estimated Number of Marijuana Businesses In The US: 2015Chart 2.05: Year Over Year Average Annual Revenues By SectorChart 2.06: What Percent Of Marijuana-Touching Businesses Are
Profitable?Chart 2.07: What Percent Of Ancillary Businesses Are Profitable?Chart 2.08: Sampling Of Profit Margin & Annual Revenue By NicheChart 2.09: How Far Off Is Profitability?Table 2.3: How 280E Affects Marijuana Business TaxationTable 2.4: Estimated Employment in the Cannabis Industry: 2015Chart 2.10: Typical Cannabusiness Staff SizeChart 2.11: Typical Cannabusiness Revenue Per EmployeeREGULATORY OUTLOOK FOR MMJ & RECREATIONAL RETAIL Chart 2.12: Increasing Pace of Recreational & Medical Marijuana
LegalizationTable 2.5: States Most Likely to Pass Marijuana Measures NextChart 2.13: Voter Support For Medical Marijuana In Florida Vs
Other MMJ StatesChart 2.14: Time Lapse From MMJ Legalization to Dispensary
OpeningsChart 2.15: Time Lapse From Recreational Legalization to Store
OpeningsMMJ MARKETPLACE DATATable 2.6: Medical Marijuana Pricing Per GramTable 2.7: A Sampling Of MMJ Patient DemographicsChart 2.16: Nationwide MMJ Patient Counts: 2013-2015
Chart 2.17: Which Medical Marijuana States Currently Have Dispensaries?
RECREATIONAL MARKETPLACE DATATable 2.8: A Sampling Of Recreational Marijuana Pricing Per Gram
(Before Taxes)Chart 2.18: First 6 Months Of Recreational Marijuana Sales In CO Vs WAChart 2.19: The Impact of a Holiday on Washington State
Marijuana SalesTHE NEXT WAVE OF CANNABUSINESSES: STARTUPS ON THE
LAUNCHING PADChart 2.20: How Long Have Marijuana Businesses Been Active?Chart 2.21: How Close Are Typical Startups To Launching?Chart 2.22: Top 5 Marijuana Startup StatesChart 2.23: Pre-Launch Plans Vs Financial RealityChart 2.24: Typical Startup Estimated Launch CostsChart 2.25: A Sampling Of Build-Out Costs For Dispensaries,
Grows In Western MMJ MarketsChart 2.26: How Much Of Their Launch Funding Have Startups
Raised?Chart 2.27: Have Startup Founders Launched Businesses Before?Chart 2.28: Do Typical Startup Founders Have Legal
Cannabusiness Experience?Chart 2.29: Do Typical Startups Have Formal Business Plans?Chart 2.30: Startup Founders Reveal The #1 Challenge To Their
Business’ SuccessMOVING FORWARD: WHAT THE FUTURE HOLDSChart 2.31: Marijuana Entrepreneurs Reveal The #1 Challenge To
Their Business’ Success NowChart 2.32: Commercial Real Estate For Marijuana-Touching
Firms: Rent Vs OwnChart 2.33: Cannabis-Touching Sectors Most Likely To Forecast A
“Booming” Business: 2013-2014Chart 2.34: The Challenging Banking Climate for Marijuana
Businesses Chart 2.35: Marijuana Entrepreneurs Forecast Next 12 Months
Chapter 3: State-by-State: Legal Facts, Market Stats and Outlook
Table 3.1: State Stability and Opportunity RankingsMap 3.1: US Marijuana Laws and Dispensary NumbersALASKA - Medical MarijuanaALASKA - RecreationalARIZONA - Medical MarijuanaCALIFORNIA - Medical MarijuanaCOLORADO - Medical MarijuanaCOLORADO - RecreationalCONNECTICUT - Medical MarijuanaDELAWARE - Medical MarijuanaHAWAII - Medical MarijuanaILLINOIS - Medical MarijuanaMAINE - Medical MarijuanaMARYLAND - Medical MarijuanaMASSACHUSETTS - Medical MarijuanaMICHIGAN - Medical Marijuana

Order at MJBizFactbook.com
© Copyright 2015, Marijuana Business Media, a division of Anne Holland Ventures Inc. You may distribute copies of this Executive Summary as PDFs or in print BUT ONLY if they are reproduced in their entirety! For permissions or service, contact [email protected] or call (401) 354-7555 x1.
Page 13
MINNESOTA - Medical MarijuanaMONTANA - Medical MarijuanaNEVADA - Medical MarijuanaNEW HAMPSHIRE - Medical MarijuanaNEW JERSEY - Medical MarijuanaNEW MEXICO - Medical MarijuanaNEW YORK - Medical MarijuanaOREGON - Medical MarijuanaOREGON - RecreationalRHODE ISLAND - Medical MarijuanaVERMONT - Medical MarijuanaWASHINGTON DC - Medical MarijuanaWASHINGTON DC - RecreationalWASHINGTON STATE - Medical MarijuanaWASHIINGTON STATE - RecreationalCANADA - Medical Marijuana
Chapter 4: Niche-by-Niche Financial DataINTRODUCTIONRETAILERS: MMJ & RECREATIONAL STORE DATATable 4.1: A Sampling of State Medical Marijuana Application &
License FeesChart 4.01: A Sampling Of Retail Startup Costs Chart 4.02: Top 3 States’ Retail Startup Costs: CA, CO, WAChart 4.03: Breakdown Of Startup Costs For Retailers With GrowsChart 4.04: Breakdown Of Startup Costs For Retailers Without
GrowsChart 4.05: Allocation Of Monthly Operating Costs For Retailers
Without Grows: 2014Chart 4.06: Allocation Of Monthly Operating Costs For Retailers
With Grows: 2014Chart 4.07: Percent Of Retailers’ Monthly Budget Spent On
Marketing: Dispensary Vs Recreational StoreChart 4.08: Typical Retailer Staff Size: With & Without Grow
OperationsChart 4.09: Typical Number Of Store Locations Per RetailerChart 4.10: Typical Retail Store Square Feet: Dispensary Vs
Recreational StoreChart 4.11: How Retail Revenues Break Down By Product TypeChart 4.12: Typical Monthly Retail Revenues Per Store LocationChart 4.13: Customers Served Per Retail Location Per Day:
Dispensary Vs RecreationalChart 4.14: MMJ Retail Data For New Jersey’s 3 Operational
Dispensaries: 2014Table 4.2: Average Transaction Amount Per Retail CustomerChart 4.15: Sampling Of MMJ Dispensary Annual Revenue Per
Location By State: 2014Chart 4.16: A Sampling Of Recreational Store Annual Revenue Per
LocationChart 4.17: Average Retailer Annual Revenue Per Square Foot By
Operation TypeTable 4.3: Sampling Of Average Profit Margin By Type Of
Dispensary/StoreChart 4.18: Dispensary With Grow Typical Year Over Year
Profitability: 2013-2014Chart 4.19: Dispensary Without Grow Typical Year Over Year
Profitability: 2013-2014GROWERS: COMMERCIAL CULTIVATION FINANCIAL DATA Chart 4.20: Where Is Cannabis Cultivated: Indoor, Greenhouse Vs
OutdoorChart 4.21. Average Cultivator Startup Costs Per Square Foot By
Operation Type Table 4.4: A Sampling Of How Cultivation Costs Relate To
Cultivation Type & SizeChart 4.22: Breakdown Of Startup Costs For Indoor CultivatorsChart 4.23: Breakdown Of Startup Costs For Greenhouse,
Outdoor & Combo CultivatorsChart 4.24: Average Cultivator Monthly Expenses Per Square
Foot: 2014Chart 4.25: Allocation Of Monthly Operating Costs For Wholesale
CultivationChart 4.26: Breakdown Of Energy Use At A Commercial Cannabis
Cultivation SiteChart 4.27: Typical Size Of Grow SpaceChart 4.28: Average Number Of Staff Per Wholesale GrowerChart 4.29: Typical Wholesale Cultivator Staff Size By Size Of
Grow SpaceChart 4.30: Typical Number Of Strains Grown By Operation TypeChart 4.31: Is Cannabis Being Grown Organically?Chart 4.32: Average Annual Revenue: Wholesale CultivatorsChart 4.33: Typical Profit Margin Of Established Wholesale
CultivatorsChart 4.34: Average Grower Profit Margin By Cultivation MethodChart 4.35: How Long Does It Take Wholesale Cultivators To Hit
Profitability?Chart 4.36: Arizona’s Cannabis Cultivation Over-CapacityChart 4.37: Wholesale Grower Typical Year Over Year Profitability:
2013-2014INFUSED PRODUCTS: EDIBLES & CONCENTRATE MAKER
FINANCIALSTable 4.5: 5 Infused Product Makers Reveal Their Business StatsChart 4.38: Infused Product Startup Costs For CO & CAChart 4.39: Detailed Startup Costs For Infused Product MakersChart 4.40: Infused Product Maker Monthly Operating CostsChart 4.41: Allocation Of Monthly Operating Costs For Infused
Product MakersChart 4.42: Typical Infused Product Maker Production Facility SizeChart 4.43: Infused Product Maker’s Typical Monthly Facility CostChart 4.44: Number Of Products Infused Brands Typically OfferChart 4.45: Relationship Between Profitability & Number Of
Product OfferingsChart 4.46: Typical Infused Product Staff Size By RevenueChart 4.47: Infused Product Maker Profit Margins Compared To
Other Consumer GoodsChart 4.48: How Long Does It Take Infused Product Makers To Hit
Profitability?Chart 4.49: Infused Product Maker Typical Year Over Year
Profitability: 2013-2014

Order at MJBizFactbook.com
© Copyright 2015, Marijuana Business Media, a division of Anne Holland Ventures Inc. You may distribute copies of this Executive Summary as PDFs or in print BUT ONLY if they are reproduced in their entirety! For permissions or service, contact [email protected] or call (401) 354-7555 x1.
Page 14
TESTING LAB FINANCIALSChart 4.50: Testing Lab Startup Costs By Year LaunchedChart 4.51: Breakdown Of Startup Costs For Testing LabsChart 4.52: Allocation Of Monthly Operating Costs For Testing LabsChart 4.53: Typical Testing Lab Facility SizeChart 4.54: Typical Testing Time TurnaroundChart 4.55: Number Of Samples Tested Per Month Per LabChart 4.56: Testing Method Primarily Used By LabsChart 4.57: Percent Of Retailers Offering Lab-Tested CannabisChart 4.58: Why Retailers Don’t Offer Tested CannabisTable 4.6: 4 Testing Labs Reveal Their Business StatsChart 4.59: How Long Does It Take Testing Labs To Hit Profitability?ANCILLARY PRODUCTS & SERVICES: BUSINESSES THAT SERVE
MARIJUANA-TOUCHING COMPANIESChart 4.60: Top 5 States for Ancillary Company HeadquartersDATA ON ANCILLARY SERVICESChart 4.61: Most Common Types Of Ancillary ServicesChart 4.62: Ancillary Services That Solely Serve Marijuana BusinessesChart 4.63: Revenue Mix For Ancillary Services Who Do Not
Solely Serve Marijuana IndustryChart 4.64: Ancillary Services: Typical Number Of States ServedChart 4.65: Ancillary Services: Typical Number Of Marijuana
Business Clients ServedChart 4.66: Typical Ancillary Service Firm Annual RevenueChart 4.67: Profit Margin For Ancillary Service FirmsANCILLARY PRODUCT MAKERS’ DATAChart 4.68: Most Common Types Of Ancillary ProductsChart 4.69: Ancillary Product Companies That Solely Serve
Marijuana BusinessesChart 4.70: Revenue Mix For Ancillary Products Who Do Not
Solely Serve Marijuana IndustryChart 4.71: Ancillary Product Companies: Typical Number Of
States ServedChart 4.72: Ancillary Product Companies: Typical Number Of
Marijuana Business Clients ServedChart 4.73: Typical Ancillary Product Company Annual RevenueChart 4.74: Profit Margin For Ancillary Product Companies
Chapter 5: Marijuana Business Funding & InvestingChart 5.1: Percent of Marijuana Companies Backed By Founders’
Savings & Personal DebtDATA ON THE OPPORTUNITY: PRIVATELY HELD COMPANIES
SEEKING FUNDINGChart 5.2: Types Of Existing Marijuana Businesses Most Likely To
Seek More Funding In 2015Chart 5.3: Startup Financing Sources: 2014 Vs 2015Chart 5.4: Marijuana Businesses Requiring Post-Launch FundingChart 5.5: Typical Marijuana Business Post-Launch Funding
SourcesDATA ON INVESTORS FUNDING PRIVATELY HELD MARIJUANA
BUSINESSESChart 5.6: Current ROI For Active Cannabis InvestorsChart 5.7: How Long Typical Investors Have Been Funding
Marijuana Businesses
Table 5.1: A Sampling Of VC, Angel & Private Equity Funds Targeting Cannabusinesses
Chart 5.8: Comparison Of 2014 Investment Activity In Marijuana Vs. Other Industries
Chart 5.9: Typical Number Of Private Companies Active Investors Are Already Funding
Chart 5.10: Number Of Private Companies Typical Investors Plan On Funding In 2015
Chart 5.11: Active Investors’ Typical Investment Per CompanyChart 5.12: How Much New Investors Are Looking To InvestChart 5.13: How Active Investors Find Private Companies To Invest
InChart 5.14: Who Attends The National Marijuana Business
Conference & Expo?Chart 5.15: Primary Consideration When Selecting An InvestmentChart 5.16: Which Types Of Privately Held Marijuana Businesses Do
Investors Prefer?Table 5.2: A Sampling Of Cannabusiness Top Funding Deals Chart 5.17: Investors Reveal #1 Mistake Made by Marijuana
Businesses Seeking FundingChart 5.18: Top Problems That Would Stop Investors From
Funding Marijuana BusinessesChart 5.19: How Do Investors Prefer To Fund Private Marijuana
Businesses?Chart 5.20: What Are Canna-Entrepreneurs Offering In Exchange
For Funding?Chart 5.21: A Sampling Of How Much Money Businesses Are
Currently Seeking DATA ON MARIJUANA BUSINESS EQUITY DEALSChart 5.22: Percent Of Entrepreneurs Who Gave Angels Equity For
FundingChart 5.23: How Much Equity Investors Currently Get For Funding
Marijuana BusinessesChart 5.24: Amount Of Equity Marijuana Businesses Are Currently
Giving Up For FundingDATA ON MARIJUANA BUSINESS LOANSChart 5.25: Portion of Marijuana Businesses Requiring LoansChart 5.26: Average Interest Rates Investors Require For Loans To
Marijuana BusinessesChart 5.27: Interest Rates Existing Marijuana Businesses Pay On LoansDATA ON THE CANNABIS-RELATED STOCK MARKETChart 5.28: 2014 Performance of Cannabis Stocks By QuarterChart 5.29: 2014 Return Of Viridian Cannabis Index Versus Other
Market IndexesChart 5.30: Portion Of Active Private Company Investors Who Also
Buy Public StocksTable 5.3: Top 10 Companies In The MJIC Marijuana Index By Market
CapitalizationChart 5.31: What’s The Impact Of Trading On A Stock Being Suspended?Chart 5.32: Just How Low Is The Trading Volume Of Marijuana Stocks?
AppendixFinCEN Marijuana Related Banking MemoMethodology

Grab Your Complete 200-page Copy Now at:MJBizFactbook.com
The bestselling annual Factbook from the editors of Marijuana Business Daily™ includes:
• 154+ Tables & Charts
• Financial data on retail,
growing, edibles & ancillaries
• 24 State profiles with business
opportunities, including DC
and Canada
• 100% revised
Order now for Priority Mail Shipping! MjBizFactbook.com
Published April 2015 byMarijuana Business Daily™ISBN 798-1-938219-15-3
ALL NEW!