Embed Size (px)
Citation preview

. COMMISSION OF THE EUROPEAN COMMUNITIES COfl Cl9) .138 final
COitiSSIOR UPOifTO DE -IL
ON· FORESEEABLE TRDDS IN IRE PLANTIIG AID UPLAiliS OF VIBYD
IN m c•rrr AND ON THE BALANCE OF PRODUCTION AND COISllniOI' II DE VIII SECTOR
(1985/86 aad 1986/17)

, .,
REPORT ON FORESEEABLE TRENDS IN TIE PLANTING AND REPLANTING OF VINEYARDS IN TIE COMMUNITY AND ON THE BALANCE OF PRODUCTION
AND CONSUMPTION ~- "E WINE SECTOR
INTRODUCTION (p. 1)
PART ~ : AREA UNDER VINES IN THE COMMUNITY
A. Total Community area under vines
1. Vines for wine arapes (p. 2)
2. Other vineyards (p. 7)
B. Areas under wine-grape vines in the •in producer countries:
1. Germany . steady (p.S) . 2. France . decline (p.9) . 3. Italy . decline (p. 11) •
4. Luxemboura . steady (p. 13) . s. Greece . decline (p. 15) •
c. Structural policy (p. 17)
PART 2 : THE MAIUCET
2.1. Production and overall demand for vine in· the eo-mity (p. 26)
2.1.1. Production (p. 26) 2.1.2. Demand (p. 29)
2.2. Community prices and intervention (p. 30)
2.2.1. Prices (p. 30) 2.2.2. Community intervention {p. 3%)
2.3. Prospects for wine consumption up to 1993 (p. 36)
2.4. Conclusion (p. 37)

- 2 -
PART 3 INTRA-cOMMUNITY TRADE AND EXTERNAL TRADE (p. 39) '---------------
3.1. Intra-Community trade (p. 40)
3.2. External trade (p. 41)
3.2.1. Imports (p. 41) 3.2.2. Exports (p. 42)
Conclusions (p. 43)
PART 4 : DISPOSAL OF WINE ALCOHOL (p. 46) ------------------------------------~----
PART 5 : CONCLUSIONS (p. 49) ----------------------------
Annexes

. ..
• . r
- 1 -
INTRODUCTION
Under Article 9 of the basic Regulation - Council Regulation (EEC) No 822/87 of 16 March 1987 (1)- the Member States must report to the Commission annually, normally by 1 September, on trends in their wine-growing potential.
Their reports are based primarily on two sets of statistics:
information collect·ed by Member States from the decl•J;'ations by wine growers, referred to in Article 8 of the basic Regulation, onsrubbins operations, new plantings and replanting& actually carried out;
the results of the annual statistical surveys of areas under vines provided for in Council Regulation (EEC) No 357/79 of 5 February 1979 (2).
Using the information supplied by the Member States,, the Conaission is required to report to the Council each year, normally by 1 Dece•ber, on the development of the Community's wine-growing potential, assessing the relationship between pr.oduction potential (area of vineyards in production and yield per hectare) and consumption and to forecast foreseeable trends in thia relationship.·
That is the purpose of this report, which covers mainly the 1985/86 and 1986/87 wine years. Sqme Member S·tates·, however, have .either been late in sending in, or have failed to send in at all, various dat• needed to draw up this· report within the time limit laiddown; there are also difficulties in comparing. figures· which neither refer to the same things nor cover the •periods, and this means that any forecasting of trends in the Community's wine-producing potential is very uncertain.
The report will deal in turn with developments in the area under vines in the Community, the market, intra-community and external trade, and the disposal of wine alcohol •
(1) OJ No L 84, 27.3.1987, p. 1. (2) OJ No L 54, 5.3.1979, p. 124.

- 2-
1. AREA UNDER VINES IN THE CO!IIJNITY
The following will be examined in turn:
(a) trends in the overall area under vines in the Community, by major categories of arape (wine grapes, table grapes, grapes for drying);
·(b) the area under wine grapes in each of the producer countries, as shown by the figures supplied by the Member States to the Statistical Office of the European CoJDUDities (EUROSTAT) or the Coaaission, under the various reporting procedures provided for in Community rules, including the statement of wine resources and the annual statistical surveys of areas under vines; ·
(c) the results of the Community's structural policy since 1976.
A. Total Community area under vines
1. Vines for wine grapes
Before Council Regulation (EEC) No 357/79 came into force in April 1979, statistical surveys of areas under vines were based mainly on the reports from Member States for the purposes of the final statement of Community resources (Article 31 of Regulation (EEC) No 822/87).
The first basic survey of areas under vines, designed to assess the changing situation on the CoiiiiiUDity wine market, under Resulation (EEC) No• 357/79, took place in 1979 in three Member States (Germany, Frattce, Luxembourg) and was extended in 1982 to the two other producer Member States, Italy and Greece.
Spain carried out an initial basic survey in 1987, on the situation after grubbing and planting in the 1986/87 wine year.
A first survey will be carried out in Portugal in 1989, on the situation after grubbing and planting in the 1988/89wine year.
~ - .

- 3 -
tb• ba•ic s~rv~y• cove~ all boldi~l' h&vins·• cvltivated area under vines normally intended for the production for sale of grapes, grape must, wine or vegetative propagation material for vines. The basic survey is to be carried out every ten years and to· record the following particulars:
A. agricultural area in use; B. area under vines cultivated, broken down according to its normal
production use into:
(a) the area under wine grape varieties, further broken down into: - quality wines psr, - other wines: - including wine compulsorily intended for the manufacture of
certain potable spirits with a registered designation of origin;
(b) the area under table grape varieties; (c) the area planted with root-stock for future arafting; (d) the area cultivated solely for the production of vegetative
propagation material for vines, subdivided into: - nurseries, - parent vines for foot-stock;
(e) the area under varieties of grapes for drying.
The results of the first basic survey were published in May 1985 (1).
In addition, annual intermediate surveys have been carried out on areas grubbed/abandoned, replanted or newly planted with wine grape vines. These surveys were carried out for the first time in 1981 in Germany, France and Luxembourg and cover the two wine years 1979/80 and 1980/81. From 1982/83 annual intermediate surveys have been carried out for all the producer countries, the most recent being for 1986/87.
The latest figures available show the total area under vine-grape vines in the Community of Ten to be 2 081 766 hectares for 1986/87 and ·2 097 747 hectares for 1985/86 (as against 2 124 639 hectares previously). Taking Spain and Portugal into account, and adopting the figures in the final statement of resources, the total area for the Community of Twelve in 1985/86 was 4·126 434 hectares.
For the CoiiiDU!lity of Ten, the total area under vines in 1985/86 had fallen by some 27 000 hectares, or 1.31, as against 1984/85, owing to the setting-up of a structures policy. Together with the new approach adopted to market policy, the fall since 1979/80 is now some 345 000 hectares.
(1) La vigne dans la Communaute europeene, Eurostat, ISEN 92-825-5255-1, 1985.

- 4-
This significant fall in the area under vines, as indicated by the figures reported by the Member States under the procedure for drawing up the statement of Coamunity resources, is confirmed by the results of the annual statistical survey of areas under vines, as the comparative table below demonstrates.
Area in production, broken down by Member State
(in hectares) ----------
: Source . . F . . • . D
: I : L . . Gr EEC
: ------_-, :------.:--------:-----:-------: ---·-----:~--------: -------.-: . . Final
: statement . . . .
: of resources: 1 177 771 : 95 578 : l 159 678
.. . 1 283
. . . • 104 701 : 2 539 018
: 1979/1980:-------~-----:-----~----:---------:-----------:-----------:-----------:-----------: : Reg. 357/79 : 998.715 : 93.858 : survey 1.273 : survey
: : : postponed : : postponed :
:-~--------------------------------------------------------------------------------------~----: :
. .
. .
Final : statement : of resources: 1.138.784
. . . . 95.686
. . 1.157.530 : 1~313 : 101.395
. . 2.494.715
. .
1980/1981:-------------:-----------:---------:-----------:-----------:-----------:-----------: : Reg. 357/79 : 978.003 : 95.511 : survey 1.313·: survey ·:
: postponed : : postponed : . . :-------------------------------------------------------------------------------------: . •
Final : statement : of resources: 1.121.110
. . . . 97.797
. . 1.141.748 1.309
. . 95.557 2.457.528
1981/1982:-------------:-----------:---------:-----------:-----------:----.-------:-----------: : :, Reg. 357./79 : 960.636 : 96.728 : 1.031.229 : 1.309 : 90.143 : 2.180.09.9 : . . : . . :-~--------~-------~--------------------------------~------------------~-------------------~-:
. . • .
Final : statement
. . . . :
. . : of resources: 1.102.000 : 97.822 : 1.123.034 : 1.316 94.223 : 2.418.402
1982/1983:-------------:-----------:----.-----:-----------:-----------:-----------:-----------: : Reg. 357/79 : 954.397 : 98.294 : 1.031.229 : 1.306 : 89.631 : 2.174.857 : : . . . • . . . • . . . • : _______ , _____________ ,..,_...._. ____________ _.. _______________________ _.....____________ ~ . -:
. • . . . •
: Final : . • .. . statement : : : : : of resources: 1.069.000 : 100.763 : 1.053.630 : 1.306 :
. • . . • • 90.248 : 2.314.947 :
: 1983/1984 :-.·--------: ---------;...-: --------:--------:-----:-----:-------: : • •
: Reg. 357/79 : 947.700 : 99.529 : 1.014.793 : 1.334 : : . • . . 89.518 : 2.152.874 : . • . . :-------------------------------------------' ____________ _.;. ___ -.....--.,.. _______ ... ___ ~: . .
: Final . . . . . • : : . . . .
,. ..
: : statement : : : : of resources: 1.082.000 : 101.387 : 1.048.314 : 1.334 89.242 : 2.322~715~~-
1984/1985:-------------:-----------:--------:-----------:-----------:-----------:------------: : : Reg. 357/79 : 940.031 : 99.730 : 994.643 : 1.322 : 88.913 : 2.124.639.-.: : : : : : : : :~
-~-------------------------------------~-----~-----------~------------~-----------~~-------

,,.,_
- 5-
~-~-~------------·-------------------· ---------------------~--~ . ' . . . -:
Source ' : F D I
: L
: : Gr • • . . CEE
----:-----:----·-:------:-------:-----.--:-----Final statement
: .. . . . :
. . • .
of resources: 1.079.000 : 93.020 1.022.310 :
. . • .
1.322 : 87.739
. . • • • 2.283.791 •
: 1985/1986:----- ---- :---------:----:------:-----: . . :
: Reg. 357/79 : . .
• 927.720 : 99.230 : . . 981.596 :
0 . 1.318 : . . 87.882 • 2.097.746 • :
:------~:------- -:-----:------:------:----:-----:-·-------. . : Final : . .
: statement : : : : . . . .
: of resources: 1.020.202 93.059 1.012.685 : 1.318 : 87.144 : 2.214.408 : 1986/1987 :-----· ---:-----------:-------:---------:------:-----:----: : Reg. 357/79 : 923.634 : 99.262 : 970.468 1.326 : . . : :
87.074 : 2.os1.16e . . -------------------------------------------------------- -----------
Although some of these figures are partial or provisional, a comparison of the results of the two methods - the final statement of resources on the one hand and the basic and intermediate surveys on the other (Regulation 357/79) - shows a definite discrepancy between the figures for the area under vines. This is because the survey under Regulation (EEC) No 357/79 is limited to areas for production for sale, thus excluding very small vineyards producing wine for consumption by the growers' families; also excluded are vines under glass and vineyards in Member States with a total area of less than 500 hectares. Annual reporting of wine-growing potential as provided for in Article 9 of Regulation (EEC) No 822/87 covers all areas under vines, whatever the purpose of production and irrespective of who it is produced by.

- 6 -
Wine suryey (Regulation 357/79) : intermediate suryeys of wine graoe y1nes
---------------------------~------------------------------------------------------------------------------------------------------------------------------: in : 1.9.1984- 1.9.1985 in 1.9.1985 au 1.9.1986 in 1.9.1986 au 1.9.1987 in produc- :-------------------------------- produc- -------------------------------- produc- -------------------------------- produc-tion :Grubbing/ :Re- :New tion Grubbing/ : Re- :New tion Grubbing/ : Re- :New tion
1.9.84 :Abandonment :planting :plantings 1.9.85 · Abandonment: planting :planting 1.9.86 Abandonment: planting :planting 1.9.87 --------------:---------:------------:---------:---------:---------:-----------:----------:---------:---------:-----------:----------:---------:---------
EB YJIDDY 0 . quality wines 99.529 : 4.263 4.165 299 99.730 4.328 3.737 91 99.230 4.097 4.054 75 99.262 psr - : - - - - - - - - - - -total 99.529 : 4.263 4.165 299 99.730 4.328 3.737 91 99.230 4.097 4.054 75 99.262
:--------------:---------:------------:---------:---------:---------:-----------:----------:---------:---------:-----------:----------:---------:---------: ~ quality wines 488.199 8.061 8.835 2.955 491.928 psr 459.501 18.047 6.551 93 448.103 total 947.700 26.108 15.386 3.048 940.031
8.935 19.443 28.378
9.107 2.308 494.408 4.578 74 433.312
13.685 2.382 927.720
8.833 16.222 25.055
11.555 3.347 500.477 5.980 92 423.157
17.635 3.439 923.634 :--------------:---------:------------:---------:---------:---------:-----------:----------:---------:---------:-----------:----------:---------:---------: ~ quality wines 210.570 psr 804.223 total 1.014.793
. 6.190 :
23.891 30.081
. 4.900 1.934 211.214 : 1.437 1.660 783.429 : 6.337 3.594 994.649 :
6.564 17.530 24.094
1.109 4.623 210.382 1.073 4.242 771.214 2.182 8.865 981.596
5.121 14.566 19.687
3.558 364 209.183 2.395 2.242 761.285 5.9&3 2.606 970.468
--------------:---------:------------:---------:---------:---------:-----------:----------:---------:---------:-----------:----------:---------:---------LU2Silmi:!I!LII:a quality wines .1.334 40 28 - 1.322 63 1 58 1.318 32 40 - 1.326 psr - - - - - - - - - - - -total 1.334 40 28 - 1.322 63 1 58 1.318 32 40 - 1.326
:--------------:---------:--·----------:---------:---------:---------:-----------:----------:---------:---------:-----------:----------=-~-------:---------: ~ quality wines 31.109 psr 58.409 total 89.518
. 362 :
1. 252 : 1.614 :
. 301 : 708 :
1.009 :
- 31.048 - 57.865 - 88.913
286 1.770 2.056
117 909
1.026
- 30.879 - 57.004 - 87.882
. 254 :
1. 305 : 1.559 :
. 153 : 598 : 751 :
- 20.778 - 56.298 - 87.074
:--------------:---------:------------:---------:~--------:---------:-----------:----------:---------:---~-----:-----------:----------:---------:---------: ~ quality wines 830.741 18.916 18.229 5.188 835.242 psr 1.322.133 43.190 8.696 1.753 1.289.397 total 2.152.874 62.106 26.925 6.671 2.124.639
20.176 38.743 58.919
14.071 7.080 836.217 6.560 4.316 1.261.530
20.631 11.396 2.097.747
. 18.337 : 32.093 : 50.430 :
19. 360 3 • 786 841. o·26 8.973 2.334 1.240.774
28.333 6.120 2.081.766
~
';

- 7 -
As average yield of wine-grape vineyards in the Community of Twelve has recently been·around 46.6 hectolitres per hectare, a decrease in vineyard area of 100 000 hectares may be estimated as involving a fall in production of some 4.7 million hectolitres (see Table 2).
This is confirmed if we look only at areas not yet in production. These amounted in 1985/86 to 134 073 hectares (see Table 1).
2. Other vineyards
2.1 For table grapes
Table 3 shows the area under table grape vines in the Community to be falling gently.
In 1971/72 it amounted to some 134 374 hectares (including 6 512 not yet in production) and by 1982/83 it was only 124 489 hectares. Since then the figure for France has continued to fall: 32 526 hectares in 1981/82 and 26 000 in 1985/86. In Italy, however, there was a distinct rise over the same period, from 72 015 to 80 477 hectares.
In Greece there was a slight fall from 20 498 hectares in 1981/82 to 20 433 in 1982/83 and 20 237 in 1985/86.
In the Community of Eleven, including Spain, the area of land under vines for table grape production in 1985/86 was 196 636 hectares, of which 69 922 were in Spain.
2.2 Grapes for drying
Table 4 shows that, rather like other areas under vines, that under vines for grapes for drying is tending to fall.
The main producer country in 1985/86 was Greece, with 59 645 hectares, the figure for Spain being 15 977 (including 15 895 in production).
Portugal's output of grapes for drying is very much less than even its own market requires. Average production in 1983/1985 was 48 000 kg, and imports in 1983, 1984 and 1985 amounted to 439, 362 and 283 tonnes respectively, the corresponding export figures being 4, 33 and 5.4 tonnes.

- 8-
B. Areas under wine-grape vines in the main producer countries
1. Germany : steady
The basic survey and subsequent intermediate surveys show the total area under wine-grape vines, at 1 September 1986t to be 99 230 hectares, as against 99 730 in 1985, a fall of 0.51. This was the first time since 1979 that there ~d been a fall compared with the previous year.
The figures for 1986/87 show a very small rise of 32 hectares.
. . . . . .
. . . .
Quality wines psr :-----------------------------------------------:
Yield classes (hl/ha) Total :-------------~---------------------------------:
I < 30 : II 30-70 :III 70-110 : IV>llO :-----------:-----------:-----------:-----------:-----------:
1 2 3 4 5
:----------------------:-------~--:-----------:-----------:-------~---:-----------: 1.9.1979 93 .. 851 .. .. 19.979 38.753 35.121
:---------------~------:-------~--:-----~-----:-----------:-----------:-----------: Grubbing/Abandonment
: Replanting · : New planting
3.821 3.843
693
851 1.618
.. . 1.352
:----------------------:-----------:-----------:-----------:-----------:-----------: 1.9.1980 94.572 7 .. 742 66.772 19.916 233
:----------------------:-----------:-----------:-----------:-----------:-----------: : Grubbing/Abandonment : Replanting : New planting
4.384 4 .. 307 1.016
381 3.104 815 24
:----------------------:-----------:-----------:-----------:-------~---:-----------: 1.9.1981 95.511 2 .. 020 26.899 59.364 7.329
:----------------------:--------~--:-----------:-----------:-----------:-----------: : Grubbing/Abandonment : Replanting : New planting
3.361 3- .. 654
984
95 977 1.937 358
:----------------------:-------~---:-----------:-~---------:-----------:-----------: 1.9.1982 96 .. 782 5 20 . . 3-.469 93.379
:---~------------------:-----------:-----------:---------~:-----------:---~-------: Grubbing/Abandonment
: Replanting : New planting
3.580 4.024 1.068
5 . . 417 . . . . 3.158
:----------------------:-----------:-----------:-----------:-----------:-----------: 1.9.1983 98.294 95 . . 11.060 87.107
:----------------------:------~----:-----------:-----------:-----------:-----------: . : Grubbing/ Abandonment : Replanting : New planting
3.428 3.776
887
2 515 586 . . 2.326
:----------------------:-----------:------~----:-----------:-----------:-----------: . . 1.9.1984 99.529 46 18 .. 933 69.480 11.049 :----------------------:----~------=--~--------:-----------:-------~---:-----------:
~ ,

- 8 a-
Quality wines par . . . . : ---------.-..--------··· ----------·------: Y~~l4 ~lasses (hl/ba) • . . . Total :--- ·--------~~~------------------------:
I < 30 : II 30-70 :III 70-110 : IV>l10 • . . . :------:-----:---~--- -----:-----: . . . 1 2 3 4 . . 5 . . --------------: --------~----: ·------:~------.:----------:----------: Grubbing/Abandonment
: Replanting New planting
4.263 4.165
299
2 731 • . • . :
2.926 • . . • . •
604 . . : :
:-----..-----·-------:--------:------: _ __... _ _..._.....: -·-------:----------: . . 1.9.1985 : 99.730 14.370 53.773 : 31.569 . . • • :-----------------:---------:-------:-----Grubbing/Abandonment
: Replanting : New planting
4.328 3.137
91
983 . .
:---------------:---------:-----------:--: 1.9.1986 99.230 1 : __ ..., _________ . --..-....:--------:-.... -------: ---: Grubbing/Abandonment : : Replanting : New planting.
4.097 15
4.054
4
2.457
393
169
:.----------------:----------:--.......---:-----. . 1.9.1987 99.262 84 . . 7.270 :-----~---------:-------:------:-----
:--- :------: . 888 : . . . : : • . . . • . . • . :-----~: • • 60.042 • 38.777 • . • .
-:-------: • 2.666 • 1.258 . • . • . . . . . . . . . . . . :--- :- • . . 63.744 . 28.164 . • . . . :-~--: .

- 9 -
2. France : decline
The data in the basic statistical survey updated from the interim surveys with regard to quality wines psr and other wines show an expansion since 1987 in the area under quality wines psr of 6% but a contraction for other wines of 16.3%.
Quality wines psr :---------------------------------------_.--------:
Yield classes (hl/ha) Total :--------------------------------------:
Situation on : I < 30 II 30-70 : III 70-110 : :-----------------------------:------------:------------:------------:------------:
1.9.1981 472.339 44.486 388.477 39.376 :-------~---------------------:------------:------------:------------:.------------:
Grubbing/Abandonment Replanting New plantin~
9.376 9.828 2.940
988 597 83
7.364 8.527 2.167
1.024 704 690
.:--------~--------------------:------------:------------:----------~-:------------: 1.9.1982 475.731 44.178 391.807 39.746
:----~-~--~-------------------:------------:---------~--:----------~-:------------: Grubbing/Abandonment Replanting New planting
7.938 10.275
3.298
645 750
93
6.455 8.505 2.257
838 1.020
948 :-----------------------------:------------:----------~-:------------:------------:
1.9.1983 481.366 44.376 396.114 40.876 :-----------------------------:------------:------------:------------:------------:
Grubbing/Abandonment Replanting New planting
8.788 11.780
3.841
793 714 131
7.346 10.300 3.046
649 766 664
:-----------------------------:------------:------------:------------:------~-----: 1.9.1984 488.199 44.428 402.114 41.657
:-----------~-----------------:------------:------------:------------:------------:
. . Grubbing/Abandonment Replanting New planting
8.061 8.835 2.955 :
695 686
95
6.405 7.423 2.069
961 726 791
:----------~------~-----------:------------:-----~------:------------:------------: 1.9.1985 491.928 44.514 . . 405.201 . . 42.213
:------------------~----------:---~--------:------------:------------:------------: Grubbing/Abandonment Replanting New planting
8.935 9.107 2.308
512 306
24 . . 7 .• 126 7.743 1.713
1.297 1.058
571 :-----------------------------:------------:------------:------------:------------:
1.9.1986 494.408 . . 44.332 407.531 42.545 :~----------------------------:------------:-------~----:------~-----:------------:
Grubbing/Abandonment Replanting New planting
8.833 11.555 3.347 :
549 265
30 . . 7.296
9.888 2.480
988 1.402
837 :-~------------~--------------:------------:~-----------:------------:-~----------:
1.9.1987 500.477 44.078 412.603 43.796

. .
' - .
''.
. . . : : Situation on: • . . •
Total
. .
- 10-
Unit : hectar4
Other wine
:-------------------------------------------------: . . Yield classes (hl/ba)
:---------:---------------------------------------: I < 40 : II 40-70 :III 70-100 IV 100-130 : V>130 :----------------------:---------:---------:---------:---·------ ---------:---------: 1.9.1981 : 505.664 : 8.952 : 99.149 : 274.516 68.508 : 54.539 :--------------:----:-----:----- ----- -------:-----: Grubbing/Abandonment : Replanting : New planting
. • . . 28.279 :
7.400 : 120 :
397 : 24 : 1 : .
6.142 : 1.070 :
35
15.015 4.578
84
3.838 : 1.072 : . •
2.887 656
:---------- ·---:---·-:-----:---·---:----.-----:-----484.905 : 8.580 : 94.112 : 264.163 : 65.742 : 52.308
:-----------------: ---·--: --·----:----·-:-___._,--:-------·--: I -·· ------
: Grubbing/Abandonment : : Replanting : New planting . .
19.268 : 7.265 :
129 :
253 : 36 :
1 :
3.996 : 1.018 :
39 :
9.567 : 4.696 :
88 :
3.246 : 1.008 :
1 :
2.206 507.
-----------------:----------:--------: .. ·- . --:- - --··----:-----:----1.9.1983 : 473.036 : 7.815 : 91.722 : 259.380 : 63.510 : 50.609
:---------------_.:..: ------------:..._-------:-·--------:------:-----: --- , I --- ·-
Grubbing/Abandonment : Replanting : New planting
21.896 : 8.203 :
163 :
273 : 42 : 14 :
4.517 : 1.347 :
36
12.085 : 5.419 :
109 :
2.844 : 962 :
4 :
2.177 433
:-----------------:------:-----:-----:-----:----·--:---· ------: 1.9.1984 : 459.506 : 7.598 : 88.588 : 252.823 : 61.632 : 48.865 =~---------------:-------:-----:----=·· -------:---· --:----~-~ : Grubbing/Abandonment : Replanting : New planting
. . 18.047 : 6.551 :
93
194 : 22 :
1 :
4.114 : 909 : 43 :
9.954 : 4.094 :
49 :
1.928 : 910 : - :
1.857 616
:-------- ---:--·--- -----:-----:-------· -:-----:---· : 1.9.1985 : 448.103 7.427 : 85.426 : 247.012 : 60.614 •: 47.624 :----....._--. ---·----:----- -----:-----:----:---- -----:-----------: Grubbing/Abandonment : 19.443
4.578 74 :
169 : 9 :
3.914 : 804 :
23
13.562 : 3.465 : . 51 :
1.666 : 260 :
132 40 : Replanting
:New planting : ----· -------·---
1.9.1986
. . . . - : - : :------:------:--- ----:-- ~ ·----.--:-- - . --·----: 433.312 : 7.267 : 82.339 : 236.966 : 59.208
:---·--------:---------=-··-. ----:---·--:..-:----·-------:-----47.532
1.422 568
: Grubbing/Abandonment : 16.222 : 5.980 :
311 : 11 :
2 :
3.263 : 906 : 46 :
9.796 I" 3.716 :
44 :
1.430 779 : Replanting
: New planting . . 92 : :- :--------:--·---:--------:-------:----- -----: 1.9.1987 : 423.162 : 6.969 : 80.028 : 230.930 : 58.557 46.678
-----------------------·---------------------------The total area in production in France at 1.9.1987 was, according to the statistical surveys, about 924 000 ba, while the reports under the final est~te indicate an area of 1 020 202 ba, giving a discrepancy of about 96 000 ha, which ahould nomally represent. that area producing wine not for sale.
The tendency to a decline in total area is confirmed by the seriea for the final estimates (Table 1 of the Annex).

. . :
- 11 -
3. Italy : decline
In Italy, the first basic survey was carried out in 1982, and updated by the first interim survey in 1984. The results show:
Quality wines psr
:---------~-------~----------------------------------------------: Yield classes (hl/ha)
Total :-----~----------------------~~-------------------: Situation on : I < 30 II 30-70 : III 70-110 : V > 110
·:--------:------------:-------:-----~-----:------------: 2 3 4 5 6
:~----------------------~-----:------------:------------:------------:------------:------------: 1.9.1982 205.997 37.361 124.620 44.016
:~-~---------~~~~------------:------~-----:------------:-------~----:-~----------:---~-----~--: Grubbing/Abandonment Replanting New planting
6.859 7.317 4.115
1.343 4.238 1.278
: ----~---------------.:..-------: ------------: ------·--~----: ---------. --: ---~-----: ------------: 1.9.1984 210.570
:---------------~-------------:--~---~-----:------------:------------:-------~----:--~---------:
. . Grubbing/Abandonment Replanting New planting
6.190 4.900 1.934
1.361 2.200 2.485 144
=~----------~----~------~~--~-:------------:-----~------:~-----------:------------:------------: 1.9.1985 211.214
:---~-------------------------:------------:-----~------:------------:------------:---------~--: Grubbing/Abandonment 6.564 1.280 1.209 2.986 1.089 Replanting 1.109 New planting 4.623 : : : : . '
:-----------------------~-----:_-------~----:------------:------------:------------:------------: 1.9.1986 210.382
:-----------------------------:------------:------------:------------:------------:------------Grubbing/Abandonment Replanting
: New planting . . 5.121 3.558
364
493
. . 1.862
. . 2.672 94
: -~-_, ____ ..;. ___________ ~---: _______ ..;;. __ : ------------~: -----------:-------: -------------: 1.9.1987 209.183
------------..--~--------------. --------------------.------------------------------
.. -
j.

.
. - . • f
. . . . . .. . . . . .
Situation on
. .
: . . Total
7
. .
. .
. .
- 12 -
Other wine --------------------------:
: Yield classes (hl/ha) -----:~ -------------------:
I ( 40 . . II 40-70
---------:---------8 . . 9
:III :--. .
70-100 :IV 100-130 . V>l30 . :-- --:--------------:
10 11 12 :-~-------------: -----:~------:-------: -: ~-----: ---------: . . 1.9.1982 : 825.232 : 243.570 371.931 : 142.150 39.768 27.813 : -------------· ----:-------: __ ...;. ____ : ----· ---:----:----------:-----------:
Grubbing/Abandonment : : Replanting : New planting . .
30.187 5.777 3.401 . .
8.692 14.127
. •
5.165 . . 1.686 517
:----------~----------:-----------:-----------:-----------:-- ·---: --------:-----------: 1.9.1984 804.223 : :
:------------------:----------:---------:-------:--------:----------:--------~-: Grubbing/Abandonment :
: Replanting : New planting
23.891 1.437 1.660
6.065 6.451
. •
2.875 1.096 7.404 . . :--------------------:-----------:------: ------:-....--·---: --:------: ------~--.--:
1.9.1985 783.429 :--------------------:-----------:--------:---:---- -:-----------:-----------:
Grubbing/Abandonment : Replanting : New planting
17.530 1.073 4.242
5.037 . . 4.395 5.671 . . 1.854 573
: :----------------------:-----------:-----------:----------:----------:-----------:-~---------:
1.9.1986 771.214 :----------------------:-----------:
Grubbing/Abandonment : : Replanting : New planting
. . 14.556 2.395 2.242
:--------~-------:-------: . . 1.9.1987 761.285 -----------------------------
4.376 . . -------:--------:----------:---------: 3.438 . . . .
3.680 :
. . 753 2.319
---:--------:---------:------------:-----------:
In 1986/87 the survey gave 761 285 hectares under other wine and 209 183 hectares under quality wine psr, a total fall of 11 000 heetares since 1985/86 •

- 13 -
4. Luxembourg : steady
According to the wine surveys, areas changed between 1979 and 1986 as follows:
Unit : hectare -----------------------------~-----------------------------------------~----
Quality wine psr :----....------- ----------------------:~.;
Situation on Yield classes (hl/ba) Total :~----------------------------·~-------------~~----:
I < 30 II 30-70 : III 70-110 : V > 110 : -~----..;---------------:~---------:----------:----------: --~-----: -------:
1.9.1980 1.283 . . 400 883 : -------------------~-----: --. -----: ---·----: -----------:------------:-----------:
Grubbing/Abandonment Replanting New planting
47 72
5
. . . . . . . . 16 26
2
31 46
3 :-----------------..... ---------:---------~--:--------:---------:---------:-------------:
1.9.1981 1.313 . . :-----------------------------: -------~----: -------:
Grubbing/Abandonment Replanting New planting
47 39
4
. . . •
. • 419 894. . . ---·---: -------:----~~~----:
16 13
1
31 26
3 :------------------~---------:------------:-----------:-----------:----------~:--~---------:
1.9.1982 1.309 : 422 887 :-----------------------------:------------:------------:------------:~----,------:------------:
Grubbing/Abandonment Replanting New planting
46 35 8 . .
8 12
2
38 23
6 . . :--~-~------------------------:------------:----------~:-----------:-----------:------~-~~:
1.9.1983 1.306 . . 428 878 . . =~---------------------------:------------:------------:-------------:-------~----:------------:
Grubbing/Abandonment Replanting New planting
37 45 20
. . . . . . 8
17 2
29 28 18
. .
:--------~-----------------:------------:-~----------:-----------~:------------:-------~-: 1.9.1984 1.334 . . 439 895
:-------------------~---------:------------:------------:~-----------:~----------:------------: Grubbing/Abandonment Replanting New planting
40 28 . . .. .
15 12
25 16
. . :-. -· --------· ----------:-----:--------:-------: _ _. __________ : -----~~-:
1.9.1985 :-----------------------• •
Grubbing/Abandonment Replanting New planting
. .
. .
1.322 • . . . • •
63 . • 1 . .
58 .. . :------....-----------------:--------:------------:-----
1.9.1986 1.318 ·• .
. • . •
436 . : 886 . . -:----------:
14 49 . . 1 . .
29 29 . :---------:------------:
451 867 : ___ ..,_..,_. ______ ... _. _____________ : -------. --:---------: ------·--: --------: ---------~-:
Grubbing/Abandonment Replanting New planting
32 40
• • . . • .
3 16
29· -: 24
:--------------~-------------:-------:---------:---------:------------: .... ---------.-.; 1.9.1987 1.326 . . 464 862
-------~------------~---------------------------------------------------------------------------
Thus, the data on the basis of the final estimate, given in Table 1 in the Annex, confirm the stability of wine~growing areas in Luxembourg.

...
Vl/4623/18-EI CPVII-2531) - 14 -
WINE SURVEY - INTERMEDIATE SURVEYS (Reg. 357/79) CHAIGES II REGIOitAL FIGURES 1982-1985
- ha -
--------------------------------------------------------------------·--------------------------------------------------------------------------------TOTAL WINE GRAPES
:--19ii---;-~-;-;;;;t;;-;--;;i;---;-,;;b;;;-;-;;;;t;d-;--19ii---;-G;;;;;d-;-;1~i;;-;--;;i6---;-G;;b;;;-;-;;;;t;;-;--;;i;---: :-----------------:---------:---------:---------:---------:---------:---------:---------:---------:---------:---------:---------:---------:---------: : LUXDaMIRG
lEW PLMTIIIG
1.309 : IS : 108 : 1.134 : 40 : 28 : 1.122 :
WINE SUIVEY (leg. 357/79) lnte~1ate survey
- ha-
63:
: 1979/80 : 1980/11 : 1981/82 : 1982/81 : 1981/84 : 1984/85 : 1985/86 : 1986/17 : :-----------------:---------:---------:---------:---------:---------:---------:---------:---------: : LUXDmiRG 7 : I : 4 : 8 : 20 : 58 :
59 : 1.318 : 32: 40: 1.326 :
- 15 -
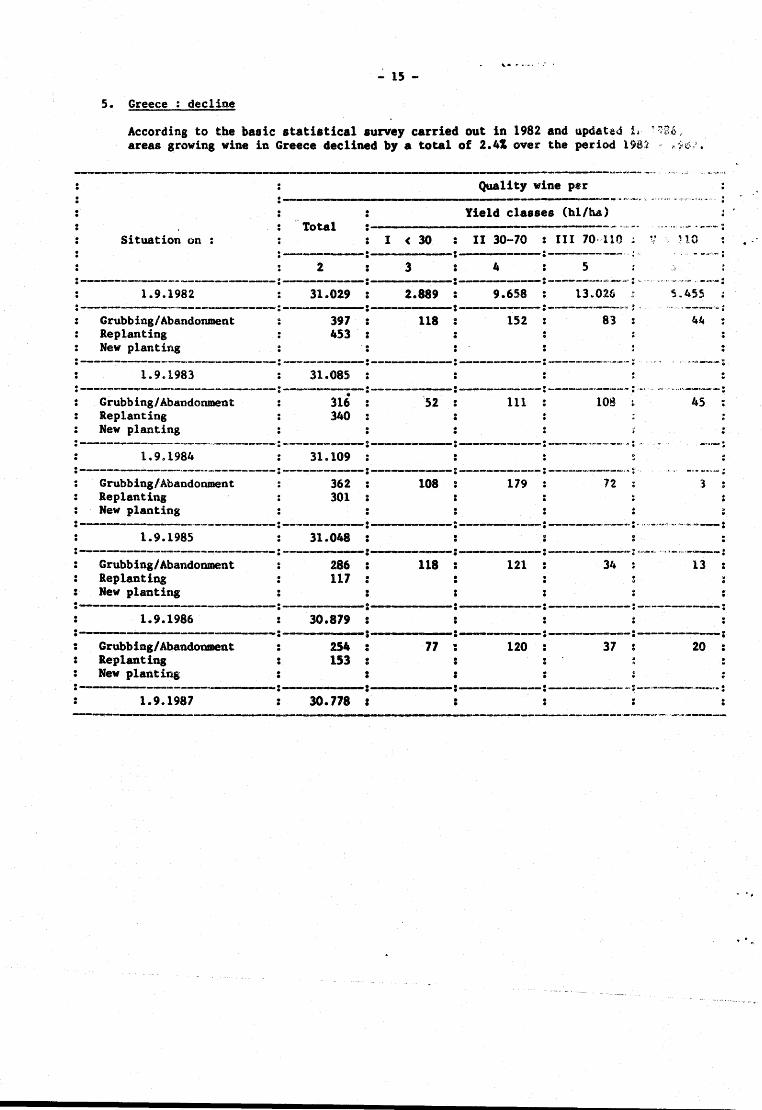
5. Greece : decline
According to the basic statistical survey carried out in 1982 and updat~J L • ~l% .. areas growing wine in Greece declined by a total of 2.41 over the period l9iU ·· ,..-~~-'.
-------------·-------------· ·--------·------------···--- ·~······ ..
Quality wine per ·-----------·-----------··~··••<• ·, ...... ><. ~''""'·"""·""" :
Yield classes (bl/ha) ---------------------- ·-~~· ........... - ·--·-: Situation on I < 30 II 30-70 : III 70··110
:---: ·----- -------:-------·--··-:-- ... __ :., .. , ..... :
2 3 4 5 : _______ ,.. _______ ----------:-------.--:---- :------: ________ ,. ... l"o- ___ ,,.,.: •••• '. ~ ~ ........ ··-~~..:!t •. -~--:
1.9.1982 : ------------·~----------: --
Grubbing/Abandonment Replanting New planting
31.029
397 453
2.889 9.658 13 .. 026 S.455 :--·----:-------:-------..---....... ,.,. ~"'. ·- ""' ~----·:w.:
118 152 81 44
: ---------------------------: --------:----------: ------------: --------.... ·~ .. -...... _: ......... -·-··-: 1.9.1983 31.085
: ________ ...,... ___________________ : -------.-:--------:-----------: ______ ....... --·--·- : '..... ~·· ..... t···--·-·---: Grubbing/Abandonment 316 52 111 108 45 Replanting 340 New planting
: ------------------··· .. --------: ----------:---------: --------·---: ______ , .. .._._,,.,.., •-M.l•"-N: .~ _,.,..__:
31.109 : -----------·--... -.. -----~--------: ------------:--------:-----..-----: ------... --·---..... : ·. . . -·- -.. - ... ~ ..... . :
Grubbing/Abandonment Replanting New planting
362 301
108 179 12
:--------------------------:----------: -~-------: ---------: ______ d .. _>IIUI __ ._: ... ,r,~~-.. ·-4.<#•~~ ...... ,.. •.• .., •• ____ :
1.9.1985 31.048 :----------------------------: ------:--- :------:-----------.. : ""'"'',_,.;., ,. ~ .. -.. ... ,.-~...--:
Grubbing/Abandonment 286 118 121 34 13 Replanting 117 . New planting .
:---------------- :----- -----------:------------:------------:-~----------: 1.9.1986 30.879
:------------ :-.... -----------:------------:------------:-----------~: . Grubbing/Abandonment 254 . . . 77 : 120 37 20 Replanting 153 : New planting :
:---.----------... ------ ______ ....,_: -------·-·--lfll·: -·-·--~-----.......... "' .. : 1.9.1987 30.778 . .
-------·--------------------------------- ·----·------------------·-----.. -~~---~··-·"·--·-----
. -
. " .
. .

- 16 -
--------------·------------------------.--. . Other wine . .. :--- -----------------------·---------------------~: . . Situation on . . Total
I
Yield classes (hl/ha) ---·------- ~-~-------. :
( 40 II 40-70 :III 70-100 :IV 100-130 : V>l30 :--..-----: ·~----- ----------:--------, ~~~: . 7 .
:---·---· ------:-----: 1.9.1982 59.114
8 9 . . ·----:-------:
18.078 15.482 :
10 11 . . 12 ·----:-----·-:-------: 11.677 . . 7.362 6.515
:--- ---------------:-----------:------ : _.._ _______ :- :--------.---:-----------: Grubbing/Abandonment
: Replanting ·: New plantin~
1.250 682 . . 127 . . 237 : 171 647 69
: : : :---- ~----: -------:---------:---------: -----~-~-:------~---: ----------:
1. 9. 1983 ' ' 58. 546 : --------. ...!.~-----: ---------:----------:---------:---------: -------~: -------~~:
Grubbing/Abandonment : Replanting : New planting
922 786
: -----------~--_..;.: -----1.9.1984 58.410 . .
:------------------:-------: Grubbing/Abandonment
: Replanting : ·New planting :
1/
1.252 708
211 350 215 80 . . 67
---·-:---------: --------=--~-------: -------: : : . .
·---·--:---------: --------:----------:---------: 575 350 267 ., . 53 . . 7
: ------------------;r-------:----·--: ---------:--------:---------:----------: : 1.9.1985 /: 57.866:
I :------------------."-: ---- --:-----------:-----------:-----------:------~----:-----------: Grubbing/Abandonment
: Replanting : New planting
1.770 909
815 564 . . . .
279 . •
. . 96 • . 16
:----------------------:-----------:-----------:----------:---·-------:-----------=--~--------: 1.9.1986 57.005
:----------------------:-----------:-----------:----------:-----------:-----------:-----------: Grubbing/Abandonment
: Replanting : New planting
1.305 598 . .
643
. . 261 . .
. . 263 : . .
• . 52 . . . .
87
:-------------:--------:- -----:----........_:-------: ------:-----------: 1.9.1987 56.298 : : •· . . .
There is a 1.51 fall in the area under other wine in Greece as against the previous year.

- 17 -
c. Structural policy
The structural policy in effect since 1976 breaks down into two basic aspects: measures to restructure vineyards, and the grubbing-up of vineyards ..
(ha)
=================================================--- --==========================~=== Types of measure Legal instrument 1983
Area concerned in hectares by end of 1984 1985 19866 1987
:---------......... -------...,---:-------.-------:-.-.-----.... -.--:-------:-~-.-..---:-~-"*-........ ~-----: : Conversion premium : Regulation 1163/76
. . .. . .. ..
:----------~------------:----~---~--:-~------~-:-~-~----:-~---~~-:---~~--~~~~; Special premium for - restructuring - conversion - irrigation Directive 78/627/CEE
9 .. 461,07 11 .. 357,96
396,71
12 .. 813,7 14 .. 777,5
820,7
20 .. 043,13 : 18.306,30
1 .. 167,13 . . ..
28 .. 652,60 19.037,38
1 .. 517,77
31 .. 152,84 19 .. 169,25
1 .. 517,77
:-----------------~-----:-----------:-~------~-:----~-----:----. -------;-~--------~:
. .
.. . . .
Abandonment of vineyards - temporary - permanent - renunciation of
replanting Regulation 456/80
23.810,51 32 .. 514,74 26.965,09 34.237,52
7 .. 128,96 7.134,74 :
: . .. . ., 42.043,28 52 .. 367,30 54 .. 343,98 41 .. 554,96 51.765,55 54 .. 444~92
7.134,74 7 .. 134,74 7 .. 134,14 . .. :----------------~~-~-~-:~--~-------:-----------:-----------:--~-----~--:~~~-~-~~~~:
Vineyard : restructuring 606,41 : 2.526,17 : 6.866,48 : 13.309,90 : 18.817,83 ~ : Regulation 458/80 :---------~-~----~-----~:-------~~--:-----------:-----------:~--~-~~~~--:~~~~-~~~~~:
Permanent abandonment : premium : Regulation 111/85
. . .. . ======================================================================~==============
The aim of the measures provided for in Regulation (EEC) No 1163/76 was to remove from the market inferior products from wine-grape vin~ vari~ties. By 1983 a total of 78 041.9 hectares had been converted.
Directive 78/627/EEC provided for special premiums for restructuringt conversion and irrigation in Languedoc-Roussil1on and some -peighb01:1ring areas. Up to the end of 1987, 31 152.84 hectares had been restructured, 19 169.25 had been converted and 1 517 .. 77 hectares devoted to crops other than the vine. Under Regulation (EEC) No 456/80, 115 923.5 hectares of vineyard had by 1987 been abandoned, the figure for Regulatio~ (EEC) No 458/80 being 18 817.3 hectares.
This rather modest fall in area under vines is confirmed by the intermediate surveys under Regulation (EEC) No 357/79: between 1982 a11d 1986 the area under wine grape vines fell by only 83 352 hectares (approx. 3.71).

- 18 -
Despite the financial incentives for the abandonment of vineyards adopted in 1980 (Regulations 458/80 and 456/80) the imbalance on the Community market in table wine persisted, and this led to the existing socio-structural instruments for reducing the Community's wine-producing potential to be reinforced, given also the worries about the consequences of the enlargement of the EEC to include Spain and Portugal:
- implementation of Regulation 456/80 was brought to an early end, and provision was made for increased aid to growers .who quickly changed their commitment for temporary abandonment to permanent abandonment;
- a new system of incentives for the permanent abandonment of vine-growing was introduced, to apply from 1985/86 to 1989/90 inclusive.
These new provisions were contained in Council Regulations (EEC) Nos 776/85 and 777/85 of 26 March 1985. The former derogated from the arrangements laid down in Regulation 456/80 and brought the joint measure to a close with the 1984/85 wine year as regards the temporary abandonment premium and 1992/93 as regards the permanent abandonment premium.
Council Regulation (EEC) No 777/85 on the granting, for the 1985/86 to 1989/90 wine years, of permanent abandonment premiums in respect of certain areas under vines provides for higher incentives, which are modulated for yield and vine variety.
In order to implement the Regulation in Spain, from 1 January 1986, the premiums were fixed at a level taking into account the return from vine-growing in Spain and the objectives determined by the extent of the Spanish vineyard (Council Regulation (EEC) No 3775/85). This legislation envisages the permanent abandonment of about 300 000 hectares (including Spain, to 1990). .The new rules include the following innovations on the previous system:
- an abatement, with compensation; of the right to replant originating from any grubbing-up carried out on the residual vine-growing area on the holding, in order that a reduction in
. production through the permanent abandonment of certain areas is not cancelled out in reality by an increase in the productivity of the remaining areas of the holding;
- 19 -
- compensation to wine cooperatives and other associations of vine-growers for increases in processing costs due to a significant reduction in their activity·because of their being left by members receiving the permanent abandonment premium;
- new rules for financing by the EAGGF Guidance Section to facilitate execution by national administrations, through a system of advances on premiums;
- an increase in the amount of the abandonment premiums, the level of which, proportional to the size of the areas under vines grubbed up on a given holding and to the average declared yield per hectare on the holding, this being designed to compensate not only for the cost of the actual grubbing operation itself and the loss of the corresponding entitlement to replant, but also for the loss of future income;
- extension of the scheme to include not only areas for the production of table wine but also those for table grapes, grapes for drying, wines suitable for production of wine spirit of Cognac d~signated origin, and areas used as root-stock nurseries.
Some specific features of vineyards in Greece and Portugal led to difficulties in implementing the above schemes in those two countries, and the Council adopted specific regulations, for Greece in 1985 and Portugal in 1986.
Regulation (EEC) No 895/85 on a common measure to improve the structures of the wine-making sector in Greece includes a programme for the ~estructuring of certain areas under vines in Greece.
Regulation (EEC) No 2239/86 on a specific common measure to improve vine-growing structures in Portugal breaks down into two main aspects: restructuring of vineyards and permanent abandonment.
However, following the decisions taken· at the Council meeting of Ministers of Agriculture on 28 and 29 March 1988, agrfcultural stabilizers were set up in the wine sector, involving the two aspects of markets and structures. In the latter case, a new grubbing scheme has replaced that provided for in Regulation (EEC) No 777/85, applying - notwithstanding that Regulation - to all areas under vines, both those producing table wines and those producing quality wines psr (Council Regulation (EEC) No 1442/88 of 24 May 1988 on the .granting, for the 1988/89 to 1995/96 wine years, of permanent abandonment premi~ in respect of wine-growing areas).

- 20 -
Jq. ord@Ji to Allow fgr Pftf~i~'-~«'f -~~~tiona; and specifically the proble~ Qf dtpPpql~t·~· ~bt ~'~ §~I~!~ may ~@ authorize~ not t~ implement the-arubbina-up syst• in certain parts of their wine-growing territory, up to a max~ of 101 of their wine-growing potential. The Commission is to propose criteria for authorizing such derogations.
In order to make permanent abandonment more attractive, arowers reducina their area aianificantly will enjoy total or partial exemption from compulsor,r distillation (Article 39 of Reaulation (EEC) No 822/87), which. under the new syst- of prices, will involve a areater dearee of disincentive.
Exemption may be total if the holding's potential for producina table wine is reduced by more than 501, with partial exemption at one or more levels if the reduction is between 20 and 501.
The degree of exemption will be detenained by .ultiplyins the yield, fixed on the basis of an averaae yield·declared for the J"ecipient's holdina. the productive capacity of the vineyard to be grubbed-up being verified by on-the-spot assessment, by tbe area arubbed-up.
The possibility of the arubbina-up arranaementa beina modified durins implementation of the scheme is provided for.
The new Reaulation provides for the Council to re-examine the grubbina-up arranae.enta as a whole by 1 April 1990, on the basis of an exhaustive report from the C~isaion.
Experience shows that structural measures have an inherent tendency not to set under way easily, but they are nonetheless an essential instrument for settina to the heart of problema and a necessary component of the Community's armoury of measures for achieving balance on the wine market.
~e Commission remains convinced that reducina areas under vines is one of the main ways in which balance on the wine market can be achieved.

- 21 -
REGULATION,(EEC) No 1163/76
Conversion premium (1)
============----===========================------ =-====~ . . . . . . : Number of recipients . . . .
Area : : concerned
(ba) :-------:---. ---:----------:- ---:
1979 . Belgium • 62 . 3,42 . • , . : France : 22.326 25.381,40 :
TOTAL 22.388 25.384,82 :--------:--------...---:----------:------------:
1980
TOTAL
Belgium :. France :
147 '34. 760
34.907
8,94 42.241,41
42.250,35 :----~---:-------------:--~-----------:-------------:
1981 Belgium 233 13,64. : . France 35,. 708 43.540,89 . . . Italy 16.888 . 21.563,39 . . ·•
TOTAL 52.829 65.117,92 : -.--------: -------------: --------------:------------:
1982
. : TOTAL
:· Belgium Fran'ce Italy
259 35.776 16.781
52.816
16,30 43.706,90 22.560,52
66.283,73 :---------: -----:-------~: ----------~---.:-~-------~--: : 1983
. . TOTAL
Belgium France Italy
262 35.805 24.991
61.058
16,52 43.757,25 34.268,15
78.041,92 ===~========~=-===-==-================================
(1) Figures based on applications for reimbursement by the EAGGF Guidance Section.

- 22 -
PIUC~!B .. ,l,.lPI.!.l~!~ Special premium for restructurins, conversion and irrisation (1)
= =·····--=-·· ••• ===- --====· •• . . . Number·of . Area . . . • • . recipients • concerned . . • . . : • (ba) . . • . • :- :-. • : 1980 : France . 1.513 • 927,6 . • • • : • • • • • 1981 • France • . • • • • • . - Restructurins . 4.152 . 2.751,8 • • • . . • - Conversion . 481 • 1.139,0 . • . • . : . . . . • : 1982 . France . • . . • : : - Restructurins . 7.764 • 5.307,5 . • . : - Conversion • 2.692 • 6.271,6 . . . . . - Irrisation • • • . . . . . . . . • • • : 1983 : France : : . . . . - Reatructurins . 12.966 . 9.461.07 . . . • . • . . - Conversion . 5.600 • 11.357,96 • . . . . . . - Irrisation • 19 • 396,71 . . . . . . . . . • . 1984 . France • . . • : : - Restructurina 16.786 • 12.813,7 • : • - Conversion 7.713 • 14.777,5 . . . . - Irriaation 52 . 820,7 . • • • . • • . • • . 1985 • France • • . . . • - Restructurina 24.639 20.043,13 • . . . • - Conversion 9.994 .18.306,30 . . . . - Irriaation 204 1.167,13 • . . . . • . 1986 : ·France • : . - Restrueturina 34.947 28.652,60 . . . - Conversion 10.591 19.037,38 . • . • - Irriaation 232 1.517,77 . . . . • • . • . • . 1987 • France • . • • . . • • : - Restructurins • 37.931 • 31.152,84 • . • . . - Conversion • 10.659 • 19.169,25 .. . • . . . - Irriaation . 232 . 1.517,77 • • • • ··=···=·· ........... •• 1111 •••••• I •••••••••••••••••••
(1) Fiaures based on applications for reimbursement by the EAGGF Guidance Section.
- 23 -
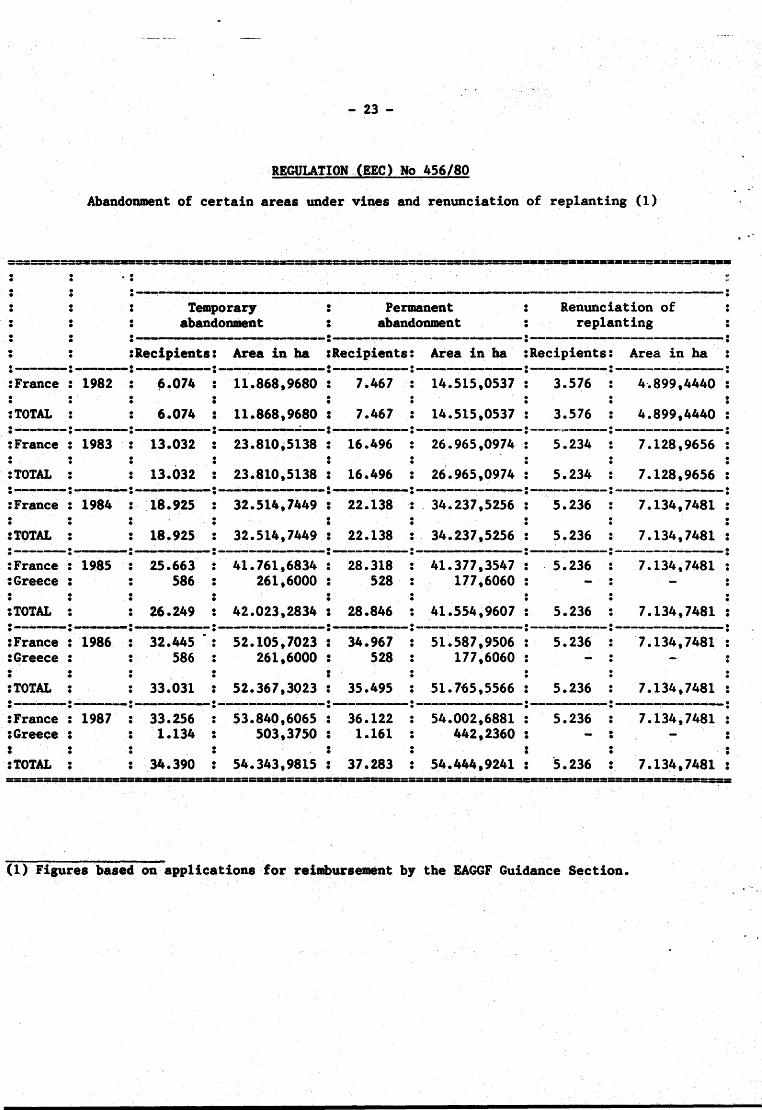
REGULATION (EEC) No· 456/80
Abandonment of certain areas under vines and renunciation of replanting (1)
==========-=-==-=-======--=====-======•=-=-==============-=·-~=========--====================== . . : . • . :---- ----------- --------------------------: . . . . : Temporary • Permanent . Renunciation of . • . . . abandonment • abandonment : replanting • . . : . . --...-..:-----~-------· --~:--------------------: . . . : :Recipients: Area in ha :Recipients: Area in ha :Recipients: Area in ha . :-------:-------:-~ -:-~------------:----------:-----~--------:----------:--------------: :France . 1982 . ~.074 11.868,9680 . 7.467 14.515,0537 3.576 4·.899,4440 . . .
• . . . . • :TOTAL 6.074 : 11.868,9680 . 7.467 14.515,0537 3.576 4.899,4440 • .: ------:----: : -----.---· --:----------:----------. -: ----... ~------: --------------: :France . 1983 . 13.032 : 23.810,5138 . 16.496 26.965,0974 5.234 . 7.128,9656 . . . . . . . : . . . :TOTAL . 13.032 . 23.810,5138 . 16.496 26.965,0974 5.234 7.128,9656 . . • :....,_----: :----. --·-:---~--------:----------:---------~-:-------~-:--------------: :France 1984 18.925 32.514,7449 . 22.138 . . ' 34.237,5256 5.236 7.134,7481 . . : . . : . . . . :TOTAL : . 18.925 . 32.514,7449 22.138 . 34.237,5256 5.236 7.134,7481 . . . :--..;.._-: :--- :----.--... ------:---------:--------:--------:------------: :France . 1985 25.663 41.761,6834 28.318 41.377,3547 5.236 7.134,7481 • :Greece . . 586 : 261,6000 528 177,6060 . . . . . . . . . . . . :TOTAL . . 26.249 . 42.023,2834 . 28.846 41.554,9607 . 5.236 : 7.134,7481 . . . . • . . :-----: ---:~------:--------------:~---------:--------------:----------:-----------~--: :France 1986 32.445 52.105,7023 . 34.967 51.587,9506 5.236 7.134,7481 . :Greece . • 586 261,6000 . 528 177,6060 . . . • : . : • . :TOTAL . 33.031 : 52.367,3023 . 35.495 51.7-65,5566 5.236 7.134,7481 . . : ---~--: ----:---------: ----------~-: _,... ____ : ----------: --------·-: --------------: :France 1987 33.256 53.840,6065 36.122 54.002,6881 5.236 7.134,7481 :Greece . . 1.134 . 503,,3750 . 1.161 . 442,2360 • . . • . . . . . • . • . . . . . . . . . . . • • :TOTAL . 34.390 . 54.343,9815 . 37.283 54.444,9241 • 5.236 • 7.134,7481 • . . • • . . ======--===========----==-==================··==================-:.·--========================··
(1) Figures based on applications for reimbursement by the EAGGF Guidance Section.

- 24 -
REGULATION (EEC} No 458/80
Restructuring of vineyards (1)
--·==·= =·========·=·---===--=---·= ······===··==-R I II I I • . . !lumber of . Area • . .
: : . recipients . restructured . . . . . : • • in ha . . . :- :--------- . . . . . 1983 . France • 23 • 606,4176 . . . • • • • :--- : . . . . 1984 . Germany • 2 • 600,4634 . . • • . • • • France 46 • 1.925,7096 • . . . . :. : :
• TOTAL 48 2.526,1730 . . • :-----~---:~------- :-----. 1985 . Germany 4 1.131,5752 . . . • France 83 • 4.733,6677 . . • : : Italy 1 . 1.001,2400 . : . . • • : • TOTAL 88 • 6.866,4829 . . :--- .. --: .- • • . 1986 • Germany • 5 • 1.722,9630 • . • • . • : . France • 121 • 9.557,1840 • . • . . : : Italy . 7 • 2.029,7595 • • . . • • . . • • • . . : TOTAL . 133 . 13.309,9065 . . . . . :- :----- :- . . • • • 1987 . Germany • 7 • 3.017,6964 : . . • • . . France . 214 . 12.918,4752 • . . . . . . • Italy • 12 • 2.881,6650 . • . • • . . • • • . . . • • . . . . TOTAL 233 . 18.817,8366 • . . . • =--==-=--=-=·===·--·--------················------------------
(1) Figures based on applications for reimbursement by the EAGGF Guidance Section.

- .25 -
REGULATION (EEC) No 777/85
Premium for permanent abandonment of certain areas under vines (1)
==--===--================----=.:..====---======================= . •
. . Number of recipients
Area abandoned in ha
:----: -------~-------. -:----------:--.....----------: 1987 Greece
France
TOTAL
. . 1.930 8.001
9.931
. . . . 859,58
15.995,14
16.854,72 . . =============--========·===================--==============--=--=
(1) Figures based on applications for reimbursement by the EAGGF Guidance Section.

- 26 -
This section examined· first trends. in production and overall demand for wine in the CoiiiDUility, as shown by the 1985/86 and 1986/87 forward estimates, then prices and Coaaunity intervention fo-r the same years, and finally the prospects for wine consumption by. 1992.
2.1. Production and overall demand for wine in the Community
2.1.1. Production
Table 5 shows that average world production of wine over the last five years has been 333.9 million hectolitres, the average for 1974/79 being 319.2 million. Average total production in the .Community of Twelve in 1982/87 was 205.6 million hectolitres, _the figure for 1974/79 being 197.8 million.
Over the five years 1974/79 the Community of Twelve accounted for 621 of total world production, the figure for the period 1982/87 being approxima.tely 61.61.
Table 6 shows that the Community of. Twelve's average output over the last three years has been 194.8 million hectolitres, whereas that of the Community of Ten for the three years 1980/83 was 158.6 million, the average over the years 1971/80 being 154 million.
From 1984/85 to 1985/86 production in .the.Community of Twelve fell overall by 4.8 millionhectolitres, or 2.51. However, output in 1986/87 was up by some 22.6 million on 1985/86 (a rise of 12.161), at a total of 208.3 million hecto1itres.
Table 7 (Community of Twelve, 1985/86) shows that production breaks down into 651 ta~le wine, 241 quality wines psr and 111 other wines. Of all wines, 58.51 were red and rose and 41.5M white. Of table wines, 33.81 were white and 66.21 red and rose.

- 27-
Of quality wines psr, 54.61 were red and rose and 45.41 white. Other wines were 78.41 white and 21.61 red and rose.
The same table shows that, for 1986/87, 66.91 of wine was table wine, 25.61 quality wines psr and 7.51 other wines. Overall 56.91 of wine was red and rose and 43.11 white, whereas 651 of table wine was red and rose and 351 white.
As reaards quality wines par, there is a balance between red/rose and white.
Of other wines, 921 is white and 81 is red and rose.
In Italy, Tables 8 and 9 show wine production in 1985/86 to have been 61.7 million hectolitres, a sizeable 8.5 million less t~n in 1984/85. This was due to the larae fall in the output of table wine, amounting to only 48.6 million hectolitres (a fall of 10.7 million) while output of other wine and quality wine par rose by 1.1 and 1.2 million hectolitres respectively.
Output in 1986/87 amounted to 76.2 million hectolitres, an increase of 14.5 million, or 23.51, on 1985/86. This is due to an increase in both table wine, to 64.6 million hectolitres (an increase of 16 million), and quality wines par (41 up at 22.3 million). Other wines fell by 1.7 aaillion hectolitres.
In France, the 1985/86 harvest, at 70 million hectolitres, was 6.7 million up on the previous year. The increase was both in quality wines (up 4.1 million) and in other wines (up 2.6 million), whereas output of table wines was steady (39.5 million). ·
The 1986/87 harvest in France was 72.7 million hectolitres (up 2.7 million), the increase beina due to areater production of quality wines psr (up 2.4 million.) and of table wines (up 520 000 hectolitres), while output of other wines fell by about 200 000 hectolitres.

- 28 -
In Germany, after the record harvest of 15.l.million hectolitres in 1982, production in 1985/86 was 6.1 million, this being 2.8 million less than the 1984/85 figure of 8~9 million. The fall is accounted for by quality wines being 1.6 million hectolitres down and table wines 1.1 million.
In 1986/87 the German harvest was 4.8 million hectolitres more than in 1985/86: quality wines psr were 4.3 million hectolitres up and table wines 460 000 hectolitres.
In Greece, there was a fall in production in 1985/86 of 243 000. hectolitres as against 1984/85, with a further 448 000 hectolitres in 1986/87 as compared with 1985/86. These are falls of 4.8 and 9.41 respectively.
In Luxembourg, production in 1985/86 fell to 107 000 hectolitres (as against 152 000 in 1984 and 185 000 in 1983), while the figure for 1986/87 is 160 000 hectolitres, 49.51 more than in 1985/86.
In Spain, production in 1985/86 was 33.1 million hectolitres; a fall of 4.11 against the previous year, accounted for by a 1.8 million hectolitre fall in production of table wine, with increases in both quality wines psr (1.2 million hectolitres) and other wines (0.6 million hectolitres). Production in 1986/87 was 35.8 million bectolitres, 8.11 more than in 1985/86, this being due to an increase in table wines (up by 3.3 million hectolitres), quality wines psr (up by 2.2 million hectolitres) and other wines (up by 2.7 million hectolitres).
In Portugal, production in 1985/86 was 9.9 million hectolitres, an increase of 1.2 million over 1984/85. In 1986/87 Portuguese output fell by 1.9 million bectolitres to 8 million.
The above figures show both that wine production fluctuates widely from one wine year to another and from area to area and that· it is rather difficult to lay down any precise quantitative and/or qualitative medium-term production objectives or to make any worthwhile forecasts for the wine sector.

- 29 -
Technical progress has led to a steady increase in vineyard yields and production of wine will thus continue to increase despite the reduction in vineyard area brought about by the structural measures adopted by the Community in 1985, to cut vineyard areas by granting aid for abandonment and so redress the situation of imbalance on the market.
2.1.2. Demand(*)
Table 24 reveals that since the period 1971/80 internal consumption in the Community of Ten has been falling markedly, from 144.9 million hectolitres in 1970/80 to 115.4 million in 1985/86 and 123.1 million in 1986/87*. Total internal consumption in the Community of Twelve is 150.6 million hectolitres.
These figures do not include quantities of wine distilled: according to reports from the Member States these amounted in 1985/86 to 24.3 million hectolitres, an appreciable fall of )some 5.9 million as against 1984/85, but rose by 15.7 million to 40 million in 1986/87.
Table 30 on the trend shown by the statement of resources reveals that in 1985/86 direct hwnan consumption in the Community of Ten fell to 107.4 million hectolitres (7 million less than in 1984/85) and rose by 5 million hectolitres in 1986/87*, to 112 million.
The figure for the Community of Eleven in 1986/87 was 131.6 million hectolitres, and for the Community of Twelve it was 137.8 million.
This sizeable fall in direct human consumption is accounted for mainly by the steady decrease in consumption per head of population in the two main producing Member States, France and Italy, which is not made up for by small increases in the non-producing countries.
Table 25 shows that average per capita consumption of wine in the Community of Twelve was 41 litres in 1985/86 and 42 litres in 1986/87. The German figure rose from 23 litres per head in 1985/86 to 26 Litres in 1986/87, while consUmption in France fell from 80 litres per head in 1985/86 to ·76 litres in 1986/87. In Italy consumption fell considerably in 1985/86 as against 1984/85 and rose again in 1986/87,
* All figures for 1986/87 are provisional.

- 30 -
to 66 litres per head. Consumption in the Netherlands is steady at 14 litres per head. In Belgium consumption fell in 1985/86 but in 1986/87 it exceeded the level of 1984/85 (18 litres). Consumption in Luxembourg increased slightly in 1986/87 to 60 litres per head. Consumption is increasing in the United Kingdom, with figures of 9 litres in 1985/86 and 10 in 1986/87. The figures for Ireland and Denmark in 1986/87 are 3 and 19 litres respectively. Consumption in Greece is increasing, from 29 litres in 1985/86 to 34 litres in
· 1987/88. Consumption in Spain fell slightly, to 48 litres, in 1986/87, while in Portugal the amount of wine drunk is falling, representing 60 litres per head in 1986/87.
Table 30 shows that, for the Community of Ten, non-community distillation involved 6.5 million hectolitres in 1985/86 as against. 6.1 mi1~ion in 1984/85 (up 7.91). The amount in 1986/87 was 9.2 million hectolitres (up 41.51 on 1985/86). For the Community of Twelve in 1986/87, non-community distillation involved 10.2 million hecto1itres.
On the other band, quantities distilled with Community aid, which in 1985/86 amounted to 24.3 million hectolitres for the Community of Ten, rose in 1986/87 to 32.7 million hectolitres, an increase of 34.51. For the Community of Eleven, 44.5 million hectolitres were distilled in 1986/87.
2.2 Community prices and intervention
2.2.1. Prices
For 1985/86 and 1986/87 guide prices for the various types of table wine were unchanged as against 1984/85.
As regards table wines of type R I, French prices were stable throughout 1985/86, at around 791 of the guide price. From the beginning of 1986/87 they weakened, falling to 711 of the guide price at the end of the wine year.
Italian prices firmed progressively until April 1986 and then began to weaken, falling to 831 of the guide price in August. In 1986/87 they . fluctuated in line with French prices, the level at the end of the year being 751 of the guide price.

- 31 -
A few prices from Greece were recorded: they were around 891 of the guide price in 1985/86 and around 94% the year after.
The few Spanish prices communicated, from 1 March 1986, were at an average of 721 of the guide price. Quotations became more frequent in 1986/87, and prices, having fallen to 591 of the guide price, recovered to end the wine year at 72%. The representative Community price followed French levels very closely. Spanish prices were multiplied by a correcting coefficient corresponding to the ratio between Community and Spanish guide prices. This coefficient was set at 1.81 as from 1 March 1986, and 1.62 for the 19~7/88 wine year.
For red table w~nes of type R II, the only French price quoted, Bastia, was fairly stable over both years, at between 68 and 75% of the guide price, which was about 5% higher than the average for 1984/85.
The very few prices available from Italy firmed up at the beginning of 1985/86 and then weakened again from June 1986, to fluctuate markedly throughout 1986/87, ending down at 641 of the guide price.
No Greek prices were included.
Spanish prices, communicated from 1 March 1986, remained fairly stable at more than 821 of the guide price, but collapsed at the beginning of 1986/87 to 661, before recovering to 791 in August 1987.
The trend in the representative Community price was irregular, but since Spanish prices were included it has tended to follow them.
As regards white table wines of type A I, prices in France weakened at the beginning of 1985/86, falling to 831 of the guide price, before recovering in early 1986 to end the wine year at 89%. During 1986/87 they·were steady at around 84%·of the guide price.

. . .
- 32 -
Italian prices were slightly lower than those in France, varying between 75 and 861 of the guide price at the end of 1985/86, but they fell as the next wine year began, to a low of 721 of the guide price.
A very few prices were reported from Greece during 1985/86. The average was 951 of the guide price, 201 higher than the previous wine year. This situation continued in 1986/87, with an average of 911 of
· the guide price.
Spanish prices, reported from 1 March 1986, remained low, at an average of 631 of the guide price •. During 1986/87 they fell even further to a trough of 521 in January, before recovering to end the wine year at 731. The Community representative price was much affected by Italian prices over both wine years.
As regards German table wines, prices for white wines began well before weakening towards the end of 1985/86. They peaked in December at 1281 of th~ guide price for wines of type A II and 1041 for A III, before collapsing to 651 for A II and 791 for A III in August 1986. They continued to fall during 1986/87, finally steadying at around 501 for type A II and 681 for A III.
Red wine prices were much steadier: the average for 1985/86 was well above that of the previous year (+ 361), at 2161 of the guide price. Prices fell back slightly during the following wine year, but were still high at 1861 of the guide price.
2.2.2. Community intervention
Most intervention in the wine sector is covered by Community legislation (Regulation (EEC) No 822/87) and concerns the following products: grape juice and must (with or without added sugar), grape must in fermentation, table wine produced from fresh grapes, fresh grapes other than table grapes, wine vinegar, etc.
1. Export refunds
Refunds may be granted to aid exports. They may be varied according to destination •
·- 33-
For the financial year 1985 export refunds amounted to ECU 18.9 million (2% of expenditure in the wine sector). In 1986 refunds amounted to ECU 11.1 million, 41.3% less than in 1985.
Appropriations for refunds in 1987 amounted to ECU 46 million, or 3.6M of wine sector expenditure.
2. Private storage aid and aid for re-storage of table wine and grape must
------------------------------ ---------------·---·
The aim here ~s to freeze availabilities on the market for a certain time, by encouraging growers to store products in return for aid.
There are two kinds of private storage.contract:
* long-term contracts: these are possible when, at the beginning of the wine year, availabilities exceed likely requirements by four months' supply. Table 28 shows that in 1985/86 long-term ·contracts were included for 14.6 million hectolitres, and in 1986/87 for 18.7 million (Spain now being included), an increase of 28%;
* four-month contracts, complementary to long-term contracts: these are possible at the expiry of long-term contracts if market prices remain below the activating price for three consecutive weeks. In 1985/86 four-month contracts covered a total of 1.9 million hectolitres and in 1986/87 only 0.5 million, a decrease of 73%.
In financial terms, private storage aid in 1985 represented ECU 87.6 million and, in 1986, ECU 65.9 million, a fall of 24.8%. It accounted for 9.5% of total wine sector expenditure in 1985 and 10.3% in 1986.
3. Distillation
Quantities available at the beginning of the wine year (carry-over stock of 99 million hectolitres in 1985/86 in the Community of Ten and 123.7 million hectolitres in 1986/87 for the Community of Eleven, together with a harvest of 142.7 million hectolitres in 1985/86 and 200.1 million in 1986/87) and the high levels of availabilities resulting therefrom led the CoDIDUnity to have recourse, as in 1984/85 for the Community of Ten, to ttie distillation measures provided for in Community rules.
...

- 34 -
The amounts of wine distilled with Community aid, as reported by the Member States, totalled 24.3 million heetolitres in 1985/86 and 40 million in 1986/87, an increase of 64.61. Among the main market-regulating measures, a distinction should be made between compulsory and optional distillation (see Table 29).
- Compulsory distillation
- Compulsory distillation of the by-products of winemaking ("prestations viniques"
This compulsory distillation of marc and·wine lees is designed to avoid the overpressing thereof and the marketing of poor quality wines with a low natural alcoholic strength. In 1985/86 a total of 2.4 million hectolitres of wine were thus distilled, and in 1986/87 some 3 million hectolitres, including lees in Spain.
~ Compulsory distillation of wines other than table wines
This concerns surplus wine in the Cognac area and wine produced from table grapes and from dried grapes etc. Over the last two wine years the volume concerned has been 3 million hectolitres of wine.
- Compulsory distillation of table wines
This is the distillation provided for in Article 39 of Regulation (EEC) No 822/87. The total quantity to be distilled is shared between the various wine-growing regions of the Conmunity, grouped together by Member State, on the basis of the difference between production in each region during the year in question and 851 of average production in 1981/82, 1982/83 and 1983/84. Each producer liable to compulsory distillation distils a quantity which varies with his yield, ·allowing for difference between the various parts of the Community. In 1985/86 the aDiount of wine distilled under Article 9 of the basic Regulation on wine was 3 million hectolitres; in 1986/87 it was 10.3 million hecto1itres, an increase of 2451.

- 35 -
- Optional distillation
- "Garantie de bonne fin" distillation for long-term storage contract holders
The aim here is to guarantee growers that their wine will not be disposed of at less than the activating price, if they have concluded long-term storage contracts.
This was introduced in 1976/77 as a temporary support measure but it has since become a permanent fixture.
It provides guaranteed price support and· has now been limited to a percentage of the contract-holder's total production of table wines (15% for 1984/85, 13% for 1985/86 and 10% for 1986/87).
In 1985/86 this form of distillation accounted for 9.5 million hectolitres, and in 1986/87 for 7.2 million, a fa).l of 241.
- Preventive distillation
At the beginning of each wine year the Commission may introduce this form of distillation, at 651 of the guide price for each type of table wine. In 1985/86 this accounted for 6 million hectolitres and in 1986/87 for almost 13 million.
Since 1984/85 quantity limits have been imposed on each producer, the present limit being 131 of ~st producers' output.
- Support distillation
During any wine year in which compulsory distillation has been resorted to, the Commission is to provide automatic access to distillation at a fixed guaranteed price of 821 of the guide price for each type of wine.
In 1985/86 this form of distillation accounted for 1.8 million hectolitres and in 1986/87 for 3.6 million.
Distillation is the main way of disposing of wine surpluses in the Community. Surpluses amounted in 1985/86 to 21.3M, and in 1986/87 to 26.81, of total output of table wine. They are liable to persist if not increase in coming years.

- 36-
T4})lt 2,.7 •bQWf t.M~ tptal £AGGF (;garantee Section expenditure on the wine sector ffi)~ t,_e fi~ncial '''" ~~$§ amounted to ECU 635.6 million as against 921.4 million in 1985, a fall of 451. These figures represent 2.87 and 4.641 in 1986 and 1985 respectively of total Guarante• Section expenditure, ignoring any reductions in expenditure after clearance of the 1986 accounts. The various measures adopted have thus led to a fall in expenditure on the vine sector.
On 8 December 1986, following the serious crisis in the wine sector in Italy because of the scandal concerning wine adulterated with methanol, the Council adopted a decision on the aranting of certain national aid for distillation in the wine sector in Italy, ~P to a max~ quantity of 2.5 million hectolitres of table wine and 170 000 hectolitres of white table wine, resulting from the downgrading of MOscato d'Asti. D.o.c. wines.
2.3. Prospects for wine consumption up to 1992
Export strategies cannot be based on too global a view of the world wine market but rather on an analysis, if not by country, then at leut by major consumption area.
World consumption of vine over the next few years would seem to be due to fall steadily. In the major consumer countries there is an appreciable diminution- by between 1 and 4lper year in Italy, France, Spain and Portugal. The same is the case in South America (Arseatina, Chile).
In much of western Europe consumption is steady or rising slightly: between 0.3 and 11 per year in Belgium, Luxembourg, Ger.any, Switzerland and Austria. In the monopoly countries of northern Europe - Sweden, Norway, Finland - consumption is rising slowly but surely, by 3 to 41 per year.
In Denmark and the Netherlands consumption •Y well con.tinue to expand .at its present rate of 41 and 4.11 per year respectively. In the United Kingdom the prospects are generally excellent (a rise of 6.41 per year).
In other English-speaking countries, consumption is still low, as the habit of drinking wine has only recently caught on, during the 1970s. Consumption in these markets is likely to increase distinctly, at annual rates between now and 1992 of 3.31 in the United States, 4.31 in Canada and 61 in Australia.
- 37 -
In Asia the markets are as yet very small but consumption is rising steadily and will continue to do so over the years to come: Japan-0~7 litres per head per year in 1982, 0.85 litres in 1984.
Consumption is still high in the traditional producer countries of southern Europe, where until the last few years wine was always considered as an absolute staple, just like bread. Since 1975. however, the amount, particularly of table wine drunk has tended to fall across the board. There are a number of reasons for this:
the spread of sedentary employment;
- a change in consumption habits particularly amongst the young ~expansion of soft fizzy drinks and mineral waters);
the ~pact of campaigns against alcoholism.
Thus, total consumption in France and Italy has fallen over the last ten years by more than 21 million hectolitres, and in Spain by about 6 million. The trend in Portugal is less clear cut.
2.4 Conclusion
On the basis of total domestic consumption, taking the various Community-financed distillation measures into account, the Community's degree of self-sufficiency was 102.21 in 1985/86 and 102.3% in 1986/87, as against 97.11 in 1984/85.
If we disregard these distillation measures, the rate becomes 123.6% in 1985/86 and 145.2% in 1986/87, as against 121.21 in 1984/85. This is
·less than the figure for 1979/80, when production reached an all-time high.
The outlook is thus very worrying. If we extrapulate the above trends - a steady fall in consumption per head of table wine in the main producer countries, and a limited rise in the other Member States, with a considerable surplus of supply over demand - we have to conclude that overall demand for wine in the Community of Twelve, including net exports and quantities processed without Coauunity aid1 is likely to be, by 1993/94, something like 155 million hectolitres.

- 38 -
ProcJllCtion at levels of 210 to 2l5 million bectolitres would thus exceed consumption by some 55 to 60 million hectolitres and, unless it were possible to expand consumption in the countries where it is at present low, to stem the fall in consumption in the producer countries or to increase exports, large quantities of wine would still have to be distilled.
· On 28 and 29 March 1988 the Council meeting on agriculture adopted a number of decisions aimed at bringing wine-growing potential more in line with requirements. There were two aspects to these decisions:
- one concerning markets, involving amendments· to Regulation (EEC) No 822/87 as regards two points concerning compulsory distillation . (Article 39):
1. a harmonization of the scales to be applied in the various regions of production enabling high yields to be penalized more in all Member States and laying down a yield threshold which may be varied depending on the volume to be distilled and the quality policy of the Member State concerned;
2. a reduction in the price paid in the event of compulsory distillation;
- one concerning structures, with the introduction of new arrangements for grubbing-up (Regulation (EEC) No 1442/88).
A link has also been established between compulsory distillation and the grubbing-up of vineyards: in order to make permanent abandonment of vineyards more attractive, growers who reduce their area under vines significantly are to be exempt from the obligation to distill.

- 39-
3. INTRA-cOMMUNITY TRADE AND EXTERNAL TRADE
During 1985/86 the Community of Ten's internal trade and its trade with the outside world in wine continued previous trends in two respects:
- intra-community trade still dominated overall trade (82.7%- see Table 13);
- imports persisted at a level in line with the 1970-1980 average (4.16 million hectolitres - see Table 15).
Exports, however, which had made steady progress from 1976/77 onwards to reach 10.2 million.hectolitres in 1984/85, fell back by 16.2% in 1985/86 to 8.5 million (see Table 18).
The external trade figures for 1985/86 show a positive balance of 4.4 milliQn hectolitres against 5.7 million in 1984/85, a fall of 23%. The reduction is accounted for mainly by the United States and the Soviet Union, and is mainly caused by the effects of the system of export refunds, which lose the Community a significant share of the world market, specifically as regards the Soviet Union and certain countries in Africa.
During 1986/87 trade within the Community of Twelve increased substantially to 23 million hectolitres, from 19.8 million in 1985/86, a rise of 16.2%.
Intra-Community trade in 1986/87 was distintly higher as a percentage of total imports than in 1985/86 (93.9% against 82.7%).
Imports of wine from outside the Community fell considerably, by 64.2% as against 1985/86, to 1.5 million hectolitres in 1986/87. This is because Spain and Portugal were no longer considered as non-Community countries (see Table 15). ·
Exports of wine to destinations outside the Community rose to nearly 11 million hectolitres in 1986/87 against 8.5 million in 1985/86, a rise of 29.4% (see Table 18).

- 40 -
N'~ ~JPprt,s in 1986/87 amounted to 9,S million hectolitres, as agai~st : 4.4 million in 1985/86. The increase w•s acc~unte4 fr>.t: mainly by ·
Scandinavia, Switzerland, Austria: Canada and Japan. On the other hand, exports to the Soviet Union, which bad begun to fall in 1984/85, went down further, from 84 162 bectolitres in 1985/86 to 1 611 hectolitres in 1986/87. Exports to the United States also fell, from 3.8 million hectolitres in 1985/86 to 3.2 million in 1986/87, a fall of 15.61.
3.1. Intra-community trade
Tables 10 and 11 show that in 1985/86 total trade between the countries of the Coaaunity of Ten fell to 19.8 million bectolitres as against 23.2 million in 1984/85, a fall of 14.51, this being mainly due to lower shipments from Italy, which went froa 12.2 million hectolitres in 1984/85 to 8.4 million in 1985/86.
In 19~6/87, trade within the Community of Twelve amounted to 23 million hectolitres, much the same as in 1984/85 and an increase of 16.11 on 1985/86 •.
Since 1985/86 France bas been the main supplier country for intra-community trade, by winning the market share lost by Italy because of the methanol affair.
Shipments from France increased from 7.8 million hectolitres in 1984/85 to 8.7 million in 1985/86, a rise of 10.81. They represented 43.61 of exports within the Community of Ten.
In 1986/87 French exports increased to 9.5 million hectolitres, a further rise of 9.91 on 1985/86 and 41.31 of the market of the Community of Twelve.
France's main customers in 1985/86, in decreasing order, were Germany (3.7 million hectolitrs or 421) followed by the United Kingdom (2.0 million or 231) and the BLEU (1.22 million or 131). All these increased their purchases appreciably.

- 41 -
In 1986/87 French shipments to other Community countries broke down as follows: Germany - 4.1 million hectolitres or 43.61; United Kingdom -2.1 million ~ectolitres or 22.71; BLEU - 1.3 million hectolitres or 13. 71; the Netherlands - 1. million hectolitres or 10. 71; Denmark - 0.6 million hectolitres or 6.51; Italy - 0.2 million hectolitres or 21. Italian shipments in 1986/87 amounted to 7.9 million hectolitres, a fall of 51 as against 1985/86. They broke down as follows: France -3.4 million hectolitres or 42.51; Germany - 3.2 million hectolitres or
. 411; United Kingdom ""!' 0.9 million hectolitres or 11.21; BLEU - 0.2 million hectolitres or 2.71; Netherlands - 0.1 million hectolitres or 1.71.
As regards German shipments to other Community countries, there was a particularly large decrease in 1985/86 as against 1984/85, from 1.99 to 1.7 million hectolitres, a fall of 131.
The figure for 1986/87 was 1.8 million hectolitres, goi~g mainly to the United Kingdom (1.4 million hectolitres or 75%), the Netherlands (0.2 million hectolitres or 14.21) and Denmark (0.1 million hectolitres or 61) •.
In 1986/87 intra-Community trade in wine broke down as follows by importing state: Germany - 8.1 million hectolitres or 35.4%; United Kingdom ""!' 5.3 million hectolitres or 23.31; France - 4 million hectolitres or 17.51; Netherlands - 2 million hectolitres or 9%; BLEU -1.8 million hectolitres or 8.11; Denmark - 0.95 million hectolitres or 4.1%; Italy - 0.4 million hectolitres or 1.91; Ireland - 0.1 million hectolitres or 0.6%; Spain - 0.029 million hectolitres or 0.11. Imports by Greece and Portugal are almost insignificant.
3.2. External trade
3.2.1. Imports
In 1985/86 Spain and Portugal were still the Community's main suppliers with 2.7 million hectolitres (Spain 1.8 million, Portugal 0.9 million), accounting for 651 of total imports. They were followed by Yuguslavia (575 000 hectolitres or 141), Hungary (181 000 hectolitres or 41), Bulgaria (104 000 hectolitres or 2.51) and Romania (75 000 hectolitres or 1•81). Imports from the Maghreb coUntries (Algeria, Morocco, Tunisia) were 212 000 hectolitres or Sl of the total.
. .

- 42 -
Table 10 show• that 1.-,o.-t• of wt.B• frPIQ ou~iid.e the Cf.>I8Utlity amounted in 1986/87 to 1.5 million hectolitres, as against 4.2 million in 1985/86. This is due to the inclusion of Spain and Portugal in the Community of Twelve.
The breakdown by country in 1986/87, as revealed by Table 17, is as follows: the main importer is Ge~ny (762 594 hectolitres), followed by the United Kingdom (427 171 hectolitres), France (132 840 hectolitres), the BLEU (92 567 hectolitres), Denmark (39 102 hectolitres), the Netherlands (25 174 hectolitres), Italy (5 018 hectolitres), Ireland (2 070 hectolitres), Spain (1 381 hectolitres), Greece (159 hectolitres) and Portugal (119 hectolitres).
In 1986/87 Yugoslavia became the Community's main supplier, with 582 829 hectolitres or 39.11 of the total, followed by Hungary (157 000 hectolitres or 10.51), and Bulgaria (146 000 hectolitres or 9.81). Noteworthy was the fall in imports from Austria, from 321 000 hectolitres in 1984/85 to 25 796 in 1986/87, following the diethylene glycol affair. The Maghreb countries accounted for 203 313 hectolitres, 13.61 of the total.
3.2.2. Exports
Table 19 shows that exports by the Co.-unity of Ten, rising regularly since 1976/77, reached a record of 10.5 million bectolitres in 1981/82, followed by a fall to 8.6 million in 1982/83 and so•tbing of a recovery in 1983/84 (9 •illion). This increase continued in 1984/85 (10.2 million), but in 1985/86 Community exports were falling back again by 16.21 to 8.5 •illion hectolitres in 1984/85.
By country, France became the main exporter on to the world market in 1985/86, with 3.8 million hectolitres, Italy falling to 3.6 million (from 4.8 million in 1984/85, a 25.21 fall). Germany fell by 26.21 (804 000 hectolitres as against 1 090 000 in 1984/85). Then came Greece, falling by 31.41 from 430 000 hectolitres in 1984/85 to 295 000 in 1985/86. ·
In 1986/87 exports from the Community of Twelve amounted to 10.9 million hectolitres.

- 43 -
In 1985/86 Japanese purchase amounted to 139.478 hectolitres, strongly down on the previous year (226 605 hectolitres), but in 1986/87 the trend reversed and Japanese imports rose to 298 932 hectolitres.
Community exports to the Soviet Union fell from 658 247 hectolitres in 1984/85 to 84 162 hectolitres in 1985/86, and then again to 1 611 bectolitres in 1986/87. This was a consequence of the anti-alcohol campaign adopted by the Soviet authorities in May 1985.
France remained the leading exporter, with 3.6 million hectolitres; Spain accounted for 3 million, while the position of Italy continued to fall on export markets, with 2.8 million hectolitres, 22.2% down on 1985/86. Germany fell by 18.3% (656 690 hectolitres), while Portugal's
. exp9rts amounted to 557 842 hectolitres and those of Greece to 146 157 bectolitres.
The United States remained the Community's main customer, with 3.2 million hectolitres, but this was 15.61 do.wn on 1985/86 (3.8 million). Switzerland, with 1.6 million, was appreciably up (421) on the preceding year. It was followed by Canada, with 1. 2 million . bectolitres, 4.2% up on 1985/86 (1.1 million), and Sweden, with 0."8 million (up 41%).
Conclusions
Although since 1976 Community exports had been r1s1ng at an average annual rate of 8.3%, reaching 10.2 million hectolitres in 1984, the figure for 1985/86 fell back to 8.5 million hectolitres. In 1986/87 Spain and Portugal having joined the Community, exports amounted to 10.9 million hectolitres - Spanish and Portuguese exports may be seen as compensating for the collapse in Italian shipments following the discovery of methanol in certain Italian wines, necessitating strict quality control measures on exports.
It is nonetheless necessary to refer to the main exp~ariations which have been put forward for the poor results achieved on external markets.

- 44 -
Firstly, trade in wine is concentrated strongly on the OECD countries; it makes up a commercial system based on reciprocal free trade, which alone is not enough to trigger growth in export flows. Secondly, there are appreciable difficulties in making sound forward estimates, because of a number of unforeseeable factors and also the uncertainty as regards sales up to 1992.
In addition, trade in wine is handicapped by slackening demand from our commercial partners and also by protectionist measures. These include tariff barriers (Eastern bloc, developing countries) and ad valorem customs duties (Eastern block, developing countries, Japan) and domestic taxation systems which are so applied as to discriminate against imported products in favour of home-produced ones. The prohibitive level of customs and excise duties in certain countries serves as a brake on consumption and thus on imports, either for reasons of public health (Scandinavia) or of religion (Islamic countries), or simply for protectionist reasons.
Indirect protectionism and non-tariff barriers include the following:
quality control measures;
health standards;
import quotas of wines above a certain price;
quantitative restrictions on certain types of wine, or during certain period;
cumbersome administrative procedures and bureaucratic delays;
anti-alcohol campaigns directed at consumers.
The result is often that Community wine is not competitive, especially with new beverages. This is frequently exacerbated by inadequate marketing and promotion of Community wines.
The Community's main customer is the United States, and auy increase in exports to it will depend on the exchange rate of the dollar, and on whether any American trade legislation is implemented involving protectionist aspects reinforcing the possibilities for ecourse to unilateral measures. The Trade Bill allows unilateral application of retaliatory measures on purely American criteria. A further risk which must be mentioned is that su~h measures might become automatic, so that the Community's negotiating margin would be reduced by the door being opened to lobby pressure. The main issue, however, is the current GATT negotiations, especially their agricultural aspect.

- 45 -
In addition to all these obstacles there are also those deriving from such practices as improper use of famous designations of origin or traditional geographical ascriptions. This is particularly common in Australia, South Africa and Japan, and somewhat less so in the United States (some progress has been made with the latter country under the Wine Accord of 1984).
We must not give the impression that if obstacles to trade were removed the problem of Community surplus production would be resolved. While these obstacles should indeed be eliminated, it is nonetheless true that consumption habits are rooted in sociological, climatic and indeed religious features o'f the lives of our trading partners, and they constitute a major brake on the expansion of the Community's trade.
- 46-
4. DISPOSAL OF WINE ALCOHOL
When in 1982 the Council revised the intervention system in the wine sector, introducing compulsory distillation at a fairly low price, it made the Community responsible for disposing of the alcohol from compulsory distillation of wine (under Articles 35, 36 and 39 of Regulation (EEC) No 822/87) held by intervention agencies. Disposal of wine alcohol from voluntary distillation remained a national responsibility. Quantities of alcohol held by intervention agencies by virtue of voluntary distillation are not yet liable to be reported to the Commission. It is possible, however, to form an appropriate idea of them:
Quantities of wine distilled under voluntary distillation, in hectolit.res:
1983-1984 1984-1985 1985-1986 1986-1987 1987-1988
32 495 000 20 375 000 17 288 000 23 734 000 27 714 000
Assuming average yield of alcohol to be 101, total quantities for the five wine years can be estimated at 12 160 000 hl of alcohol, plus undisposed-of stocks from previous years.
The quantities to be disposed of each year other than through normal channels amount to a total of between 2 and 3 million hl, but this figure will fall with the changes currently being made to the system.
As regards wine alcohol the disposal of which is a national responsibility, attitudes vary between Member States. In France, the Government, through the Societe des Alcools Viticoles, puts up for sale and is able to sell, depending on market openings, amlost all the alcohol produced in France, though admittedly this is because the State budget assumes any losses. In Italy, AlMA succeeded at the third try in selling for export, at a very low price of 4 to 7 ECU/ha, a large batch of some 5.2 million hl, but since then has been accumulating stocks of wine alcohol. In Spain stocks built up before accession have been disposed of but the Government has not yet taken a decision for the sale of wine alcohol which 1ts intervention agency is authorized to buy, and stocks are therefore now accumulating.
National sales, particularly by France, on a small and saturated world market are bound to cause problems for such sales as the Community has to organize.

- 47-
The heart of the problem is thus that the Member States have every opportunity to reduce to the minimum the Commission's freedom to sell Community stocks, as they themselves have alcohol-producing industries to protect and large stocks to sell, both of these factors obtaining together in some cases.
It was, however, only in 1986 that the Council adopted a Regulation laying down general rules for the disposal of this alcohol (1). Although these rules were only for a limited period (until the end of 1986),.tbey gave the Commission the opportunity to acquire a certain experience by twice trying to sell some of the stock of alcohol.
Although the·experience bore no fruit, it did show how cumbersome were the mechanisms set up, and specifically the procedure for selling alcohol from compulsory distillation under Article 39 of Regulation (EEC) No 822/87, which made it impossible to dispose of even small quantities on the normal markets for alcohol at the price ruling on those markets.
When, at. the meeting of the European Council in Brussels in February 1988, it was decided to introduce agricultural stabilizers, a number of changes were decided upon in the rules governing the wine sector. Intervention was made more restrictive, by a significant reduction in the price for compulsory distillation, and specifically distillation of table wines. At the same time, grubbing up premiums were increased, in order to reduce wine-growing potential.
In the medium term at least, this should guarantee a better balance between supply and demand in the wine sector, where for several years now the trend has been for output of table wine to increase while demand for it has been falling markedly.
The Community has to deal with a burden inherited from the past in the form of existing accwnulated stocks of alcohol from the various compulsory distillation measures provided for in the way of market support in the existing rules.
(1) Regulation (EEC) No 139/86 - OJ No L 19, 25.1.1986, p. 1.

- 48 -
The problem of alcohol stocks is going to get wor$e for some time. At end September 1988 stocks amounted to so~ 9.2 million hl, increasing by 2.5 million per year, and falling into two categories:
(a) purely "public" stocks (end August 1988: 2.5 million hl), produced under compulsory distillation (Article 39 of Regulation 822/87) and thus qualifying for an EAGGF contribution to all expenditure (technical, financial, disposal) on storage of such alcohol;
(b) mixed stocks (end August 1988: 6.7 million hl), from distillation measures provided for in Articles 35 (deliveries of by-products of wine-maing) and 36 (distillation of wine other.than table wine), where the EAGGF defrays only disposal costs.
In July 1988 the Commission put to the Council a proposal for a Regulation laying down general rules on the disposal of wine alcohol (COM(88)422). The burden of that proposal is that alcohol from both of the above types of stock~ be treated alike as regards disposal procedures.
Provision is made for the award of tenders by the management committee procedure, in order to ensure equality of treatment of interested parties, wherever they are established in the Community.
In order not to disturb the market the disposal measures laid down in the rules now proposed would have to cover further end-uses, which in the case of the Community means fuel, without excluding sale for other purposes.
The rules provide for no min~ price, but the Commission reserves the right not to accept any of the offers made.
- 49 -
5. CONCLUSIONS
The surplus we now see on the table wine market is due to two main ~ factors, which have acted in turn. First, until about the end of the 1970s, c·onsumption was practically level while production was increasing substantially, disturbing the precarious balance which obtained when the market organization was set up. This rise in production has now been cut back, almost to vanishing point, and the main reason for the imbalance is now the fall in. consumption. This is likely to continue, with consumers preferring quality to quantity.
Extrapolating from current trends*, we have on the· one hand a fall in the total area under vines, leading to a total area of less than 3.5 million ha in the Community of Twelve by 1993, and on the other hand, a constant total production level, due to an increase in average yield.
If we look at the trend in total internal consumption of winet ignoring quantities distilled under the various intervention measures, the annual fall emerging from the figures available is some 2 to 3% per year. For the Community of Twelve, this gives a total of some 110 or 120 million hl in 1993, as against production of some 180 million hl. ·
There are of course projections on the basis of currently available figures and thus do not allow for the effect of the measures adopted within the framework of the agricultural stabilizers, the purpose of which is precisely to stem these trends.
If we look at total internal consumption, includ~ng wi~e 4l,stilled, the Community,'s degree of self-sufficiency was 102.31 in 1986t~7 as against 102.21 in 1985/86. Ignoring wine distilled, the figures are 145.21 in 1986/87 and 123.6% in 1985/86.
* Obtained by linear regression from figures for 1980/81 to 1986/87. For Spain the same rate of fall in areas under vines as in the Community of Ten has been assumed from 1985/86, while in the case of Portugal, where structural measures for grubbing-up vineyards do not apply, areas have been considered constant.
. .
-50-
Per capita consumption ia falling in the main producer countries and there is only limited expansion of consUmption in the other Member States, so that supply is well in excess of demand. We have to conclude from this that, unless consumption is expanded in countries where it is still low and exports are increased, large quantities of wine will still have to be distilled.
Tbis means that we need to review our wine-growing potential in order to bring it in li~e with requirements. The structural surplus in table wine may currently be estimated at more than 301, and this can only increase if there are no changes in market management and the control of production potential. This last is the main point on which efforts should be concentrated, as it is high yields which lead to structural surplus and poor quality.
At the end of this report on foreseeable trends in the planting and replanting of vineyards in the Community and on the balance. of production and consumption in the wine sector, for 1985/86 and 1986/87, we may draw a number of conclusions.
The alterations to short-term market management measures decided upon by the Dublin European Council in 1984, involving intervention distillation (preventive distillation, "garantie de bonne fin" distillation, compulsory distillation, "support" distillation), has not led to any permanent rebalancing of the market, as the effect of these measures bas been countered by factors working in the opposite direction which have been too large: constantly increasing yields from areas under vines, an increase in output of wine through technical progress and a continual fall in consumption in certain producer countries, which over the last 10 years bas not any more been made up for by any increase in.the other Member States. The principal instrument for regulating the table vine market is distillation, and in 1985/86 a total of 24.3 million hectolitrea were distilled. In 1986/87 the figure was 39.6 •illion hectolitrea.
The structural measures adopted by the Council since 1976 (granting of premiums for temporary and permanent abandonment and premiums for renouncing replanting rights, premiums for cessation of wine~rowing in France and Italy, measures to restructure vineyards as part of joint operations) have had only modest results and have not really achieved any qualitative or quantitative redirection of Community vine production. The persistent imbalance on the wine market led the Council to reinforce its structural policy by means of Regulation (EEC) No 777/85, but experience in trying to reduce production in line with de .. nd baa made it absolutely necessary to implement new meas~res.

- 51 -
The new approaches decided upon at the European·Council meeting in Brussels on 11, 12 and 13 February 1988,and the decisions by the Council which followed, are for the introduction of new stabilizers and the strengthening of existing ones in order to re-establish the balance between supply and demand on the Community market. The aim is to achieve better coordination between measures providing generalized support for markets and prices and measures of a structural nature.
As regards the stabilizers, an initial series of measures was to reinforce the arrangements for definitive abandonment (Regulation (EEC) No 1442/88); a second series was to penalize excessive yields by making compulsory distillation sufficiency unattractive.
Council Regulation (EEC) No 1442/88 of 24 May 1988 is one of the measures to reinforce permanent abandonment, in that it provides for extending the possibility to all areas under vines (including quality wines psr). It provides for differentiation according to yields and an increase of up to 201 in grubbing premiums for vineyards with high yields, preferential distillation arrangements leading to partial or total exemption from compulsory distillation for growers subject to the new grubbing arrangements - total exemption if the area grubbed represents more than 501 of the holding's wine-growing potential - and a system. of advances allowing payment of premiums to producers to be speeded up.
For 1988/89 the Council kept the same price levels as before, and it introduced amongst the related measures a ban on national a.id for the planting of vines.
Reform of the market must be brought about rapidly but in a lasting way: this can be achieved only if measures to discourage high yields and structural measures are integrated. Measures to discourage high yields must' necessarily be accompanied by a decrease in·areas under vines. There is no way we can avoid the need to strengthen and adapt the measures for voluntary abandonment, which have not so far yielded the results anticipated.
The Commission remains convinced that a solution must be found for a situation which is becoming intolerable, not only because of the growing budgetary burden represented by the wine sector, but also fora reason internal to that sector: the very great downward pressure on prices which the surplus exercises is very damaging, especially to producers of wines of higher quality, production of which should on the contrary be encouraged.

't '
~· .
I "
-52-
There is, in addition, every reason for anticipating already measures to get rid of the ''burden of the past", that is to say, existing stocks of alcohol from the various distillation measures provided for in the existing rules for purposes of market support.


![Bridges pinoy_akoworld[1].com_](https://img.dokumen.tips/doc/110x75/55648159d8b42a361d8b4aca/bridges-pinoyakoworld1com.jpg)


