Embed Size (px)
Citation preview

Quarterly Newsletter December 2015
From the CIO’s Desk ....................... 2
Unit Linked Equity Fund .................. 3
Unit Linked Equity II Fund ................ 4
Unit Linked Growth Fund ................. 5
Unit Linked Growth II Fund .............. 6
Unit Linked Growth Plus Fund ......... 7
Unit Linked Balanced Fund .............. 8
Unit Linked Balanced II Fund ........... 9
Unit Linked Balanced Plus Fund .... 10
Unit Linked Debt Fund ................... 11
Unit Linked Debt Plus Fund ........... 12
Unit Linked Liquid Fund .................. 13
Unit Linked NAV Guarantee Fund ... 14
Investment TrackerCONTENTS
IN LINKED INSURANCE PRODUCTS, THE INVESTMENT RISK IN INVESTMENT PORTFOLIO IS BORNE BY THE POLICYHOLDER.
THE LINKED INSURANCE PRODUCTS DO NOT OFFER ANY LIQUIDITY DURING THE FIRST FIVE YEARS OF THE CONTRACT. THE POLICYHOLDER WILL NOT BE ABLE TO
SURRENDER/WITHDRAW THE MONIES INVESTED IN LINKED INSURANCE PRODUCTS COMPLETELY OR PARTIALLY TILL THE END OF THE FIFTH YEAR

From the CIO's desk
2Investment Tracker December 2015
Dear Policyholder,
In our assessment, equity markets by nature are volatile in the
short term while over the medium to long term they generate
good returns. Indian equity markets also have been very volatile
this year and have generated a negative 5% returns. This has
been due to sluggish growth in profits of companies during the
year. In our assessment, earning growth of companies should
remain low for next few quarters before recovering in the year
2016. Equity markets are trading at 16.5 times FY17 estimated
earnings currently and are at average valuations, we believe
that corporate profit growth recovery would drive sustainable
market performance over the medium term.
In our view, the downside in the markets in the meantime
appears limited as valuations are at average levels and any
decline leads to markets becoming attractively valued.
Also, strong support from domestic investors having invested
Rs. 66500 crores during the year against Rs. 19100 crores
invested by the Foreign Investors is also providing downside
support.
Our investment approach is to invest in good quality businesses
which have sustainable and reasonably high profitability.
Our task is to find businesses that are expected to grow at
20% for the next 4-5 years and pay a reasonable price for them.
We have a team of highly qualified and experienced analysts
We wish you a very happy and prosperous 2016. We sincerely
hope that the year ahead fulfills all your aspirations and takes
you closer to your financial goals. We at Canara HSBC
Oriental Bank of Commerce Life Insurance Company Limited (hereafter referred as 'CHOICe') endeavor to be by your side
and help you in achieving your desired milestones. Your policy
continues to offer firstly, the most important life cover for you
and your family, together with an opportunity to grow your
savings for the future. As a life insurance company, our focus
is always on the longer term investment horizon, as we are
helping our customers achieve their long term goals and, as
such, our investment philosophy looks beyond the short-term
political and economic events in the market. focused on this job, who keep on looking at businesses across
large and mid-sized companies for investing. This approach
helps us to tide over market volatility in the short term and
generate good sustainable returns for the policyholders..
RBI has reduced interest rate by 125bps during the year 2015
followed by interest rate cuts by the banks as well. This is a big
positive from medium to long term perspective and should help
drive consumption and investment by bringing down Equated
Monthly Installment(EMI) of individuals and borrowing cost of
Companies. Debt market has generated a healthy 7.4% return
The year 2015 has been a momentous and eventful year
marred with a lot of volatility in financial markets globally
leading to sharp swings across emerging world. Global growth
weakened leading to a deepening slowdown in emerging and
developing economies. China’s effort to rebalance its economy
and devaluation of the currency disturbed the financial markets
across the world and led to stocks, commodities and currencies
falling sharply across. This also resulted in capital flight from
emerging markets into mature markets. More recently the US
Federal Reserve increased interest rates from zero, for the first
time in 10 years adding to the volatility.during the year 2015. We believe that conditions are ripe for
Indian economy on the other hand strengthened during the further interest rate cuts by the RBI in the year 2016 which year 2015 with fall in inflation, control on fiscal and current would provide opportunity to generate capital gains in the fixed account deficit and 125bps reduction in interest rates. While, income funds. Our portfolios are positioned for a steady reduction GDP and corporate growth remained sluggish during the year, in interest rate over the medium term to capture the benefits of base is being built by both the Government and Reserve Bank falling interest rates and benefit policyholder returns. of India (RBI) for sustainable long term growth in the economy.
In our view, it is a prudent time to invest and build portfolio Another healthy trend has been that domestic investors have
from medium to long term perspective. Your regular and moved away from physical savings (gold and real estate) to
disciplined premium payment in volatile markets enables us financial savings which would provide support to equity and fixed
to invest your premiums at lower prices and benefit when income markets.
the markets bounce back. In both equity and fixed income We expect the year 2016 to be a much better year as the various markets, we invest in high quality, large cap and good corporate steps being taken by the govt. to boost investment in the governance companies with long term focus. This generates economy and the interest rate cuts done by the RBI start to show superior returns for our policyholders. We continuously strive to results. Global uncertainty has also eased with clarity on US generate good returns on the policyholders’ savings, to enable interest rates and global growth is also expected to improve. our policyholders to attain their financial goals.We should see improvement in domestic GDP and corporate
growth rates which would drive both equity and fixed income
markets in the year 2016.
Equity Market update
Fixed Income Market update
Data Sources: TThe factual information mentioned above pertaining to market performance has been taken from National Stock Exchange (NSE) website, CRISIL Customized debt index, Reserve Bank of India (RBI) NDS-OM, Bloomberg.
Ritu Arora
Chief Investment Officer,
Canara HSBC Oriental Bank
of Commerce Life Insurance
Company Limited

NAV Movement
The Fund's primary objective is to have high capital appreciation through investment in equities. To maintain liquidity, the Fund will invest in
cash and money market instruments.
Risk Profile – High
PORTFOLIO AS ON , 2015DECEMBER 31 %
Asset Allocation Pattern
60% - 100%Equity and Equity Related Instruments
0% - 40%Money Market
Unit Linked Equity Fund
EQUITY 98.42
OTHER NET CURRENT ASSETS 1.58
TOTAL 100.00
Infosys Ltd 9.04
Tata Motors Ltd 6.71
Maruti Suzuki India Ltd 4.90
HDFC Bank Ltd 4.45
Larsen N Toubro Ltd 4.41
IndusInd Bank Ltd 4.09
Kotak Banking ETF 3.91
Reliance Industries Ltd 3.76
R * Shares Banking ETF 3.68
ICICI Bank Ltd 3.52
Sun Pharmaceutical Industries Ltd 3.49
ITC Ltd 3.27
HCL Technologies Ltd 3.05
YES Bank Ltd 2.74
Housing Development Finance Corporation Ltd 2.64
Tech Mahindra Ltd 2.31
Kotak Mahindra Bank Ltd 2.11
Axis Bank 1.78
Oil and Natural Gas Corp Ltd 1.75
Glenmark Pharmaceuticals Ltd 1.64
Ultratech Cement Ltd 1.64
Bosch Limited 1.61
Divis Laboratories Limited 1.56
Zee Entertainment Enterprises Ltd 1.53
Cipla Limited 1.50
Bharti Airtel Ltd 1.42
Bajaj Finance Ltd 1.27
Bharat Petroleum Corp Ltd 1.18
Syngene International Ltd 1.18
BEML Ltd 1.13
Rural Electrification Corp Ltd 1.04
Bharat Electronics Ltd 0.99
Century Plyboards (India) Ltd. 0.96
United Spirits Ltd 0.91
Hindustan Unilever Ltd 0.84
Hitachi Home & Life Solutions (India) Ltd 0.63
Indraprastha Gas Ltd 0.62
Ashoka Buildcon Ltd 0.56
Bharat Heavy Electricals Ltd 0.55
Tata Consultancy Services Ltd 0.50
Godrej Consumer Products Ltd 0.49
Coal India Ltd 0.46
Tata Motors Limited DVR 0.46
IFB Industries Ltd 0.42
Britannia Industries Ltd 0.42
GAIL (India) Ltd 0.34
Ambuja Cements Ltd 0.32
Greenply Industries Ltd 0.29
Sadbhav Engineering Ltd 0.23
IL & FS Transportation Networks Ltd 0.13
3Investment Tracker December 2015
Fund Performance as on , 2015 (%)st31 December
Equity Fund benchmark is CNX Nifty Index.
Past performance is not indicative of future performance.
The SFIN for Equity Fund is ULIF00116/06/08EQUITYFUND136.
Equity Sector Exposure
nMETALS FINANCIAL SERVICES
ELECTRICAL ENERGY FMCG
ELECTRONIC COMPONENTS & INSTRUMENTS PHARMA & HOSPITALS
TELECOM CONSTRUCTION
MEDIA AUTO & ANCILLIARIES
GAS PRODUCTION &TRANSPORTATION INFORMATION TECHNOLOGY
OIL & OTHER PETROLEUM PRODUCTS BANKING
n
n
n
nn
n
n
n
n
n
n
n
n
Date of Inception: 16 June 2008 thNAV as on 31 December, 2015: 18.506stBenchmark: CNX Nifty Index
0.460.551.061.421.532.71
4.944.955.93
9.3710.66
13.6714.91
26.28
0.00
5.00
10.00
15.00
20.00
25.00
30.00
0
5
10
15
20
25
Jun
-08
Au
g-0
8O
ct-0
8D
ec-0
8Fe
b-0
9A
pr-
09
Jun
-09
Au
g-0
9
Oct
-09
Dec
-09
Feb
-10
Ap
r-1
0
Jun
-10
Au
g-1
0
Oct
-10
Dec
-10
Feb
-11
Ap
r-1
1
Jun
-11
Au
g-1
1 O
ct-1
1 Dec
-11
Feb
-12
Ap
r-1
2 Ju
n-1
2
Au
g-1
2
Oct
-12
Dec
-12
Feb
-13
Ap
r-1
3
Jun
-13
Au
g-1
3
Oct
-13
Dec
-13
Feb
-14
Ap
r-1
4
Jun
-14
Au
g-1
4O
ct-1
4D
ec-1
4Fe
b-1
5A
pr-
15
Jun
-15
Au
g-1
5O
ct-1
5D
ec-1
5
Equity
18.506
Equity
0.4%
-6.3%
-3.9%
15.2%
10.5%
12.8%
6.7%
7.9%
18.1%
8.5%
-0.1%
-6.3%
-5.2%
13.7%
9.6%
12.2%
7.0%
8.6%
16.4%
7.6%
-10.0% -5.0% 0.0% 5.0% 10.0% 15.0% 20.0%
3 M
6 M
1 Yr
2 Yr
3 Yr
4 Yr
5 Yr
6 Yr
7 Yr
Inception
Benchmark
CHOICe

Investment Tracker December 2015
The Fund's primary objective is to have high capital appreciation through investment in equities. To maintain liquidity, the Fund will invest in
cash and money market instruments.
Unit Linked Equity II Fund
PORTFOLIO AS ON , 2015DECEMBER 31 %
EQUITY 98.06
OTHER NET CURRENT ASSETS 1.94
TOTAL 100.00
Infosys Ltd 9.12
Tata Motors Ltd 6.60
Maruti Suzuki India Ltd 4.85
HDFC Bank Ltd 4.41
Larsen N Toubro Ltd 4.41
Kotak Banking ETF 4.33
IndusInd Bank Ltd 4.19
Reliance Industries Ltd 3.76
ICICI Bank Ltd 3.48
Sun Pharmaceutical Industries Ltd 3.47
ITC Ltd 3.28
HCL Technologies Ltd 3.06
YES Bank Ltd 3.01
R * Shares Banking ETF 2.92
Housing Development Finance Corporation Ltd 2.62
Tech Mahindra Ltd 2.32
Kotak Mahindra Bank Ltd 2.03
Oil and Natural Gas Corp Ltd 1.77
Axis Bank 1.76
Ultratech Cement Ltd 1.63
Glenmark Pharmaceuticals Ltd 1.62
Bosch Limited 1.60
Divis Laboratories Limited 1.56
Zee Entertainment Enterprises Ltd 1.53
Cipla Limited 1.49
Bharti Airtel Ltd 1.44
Bajaj Finance Ltd 1.27
Bharat Petroleum Corp Ltd 1.19
Syngene International Ltd 1.18
BEML Ltd 1.16
Rural Electrification Corp Ltd 1.05
Century Plyboards (India) Ltd. 0.96
Bharat Electronics Ltd 0.94
United Spirits Ltd 0.91
Hindustan Unilever Ltd 0.83
Hitachi Home & Life Solutions (India) Ltd 0.62
Indraprastha Gas Ltd 0.57
Ashoka Buildcon Ltd 0.55
Tata Consultancy Services Ltd 0.50
Godrej Consumer Products Ltd 0.50
Bharat Heavy Electricals Ltd 0.49
Britannia Industries Ltd 0.48
Coal India Ltd 0.46
Tata Motors Limited DVR 0.44
IFB Industries Ltd 0.41
GAIL (India) Ltd 0.38
Greenply Industries Ltd 0.30
Ambuja Cements Ltd 0.29
Sadbhav Engineering Ltd 0.23
IL & FS Transportation Networks Ltd 0.12
Risk Profile – High
4
Asset Allocation Pattern
60% - 100%Equity and Equity Related Instruments
0% - 40%Money Market
NAV Movement
stFund Performance as on 31 December, 2015 (%)
Equity Fund benchmark is CNX Nifty Index.
Past performance is not indicative of future performance. The SFIN for Equity II Fund is ULIF00607/01/10EQUTYIIFND136
Equity Sector Exposure
thDate of Inception: 7 January 2010 NAV as on , 2015: 15.13st31 December 0Benchmark: CNX Nifty Index
Equity II
0.460.491.031.441.53
2.72
4.94
4.94
5.99
9.32
10.59
13.49 15.00
26.11
0.00
5.00
10.00
15.00
20.00
25.00
30.00
nMETALS FMCG
ELECTRICAL ENERGY PHARMA & HOSPITALS
ELECTRONIC COMPONENTS & INSTRUMENTS CONSTRUCTION
TELECOM AUTO & ANCILLIARIES
MEDIA INFORMATION TECHNOLOGY
GAS PRODUCTION &TRANSPORTATION BANKING
FINANCIAL SERVICES
OIL & OTHER PETROLEUM PRODUCTS
n
n
n
n
nn
n
n
n
n
n
n
n
0
2
4
6
8
10
12
14
16
18
Jan
-10
Mar
-10
May
-10
Jul-
10
Sep
-10
No
v-1
0Ja
n-1
1M
ar-1
1M
ay-1
1Ju
l-1
1Se
p-1
1N
ov
-11
Jan
-12
Mar
-12
May
-12
Jul-
12
Sep
-12
No
v-1
2Ja
n-1
3M
ar-1
3M
ay-1
3Ju
l-1
3Se
p-1
3N
ov
-13
Jan
-14
Mar
-14
May
-14
Jul-
14
Sep
-14
No
v-1
4Ja
n-1
5M
ar-1
5M
ay-1
5Ju
l-1
5Se
p-1
5D
ec-1
5
Equity II
15.130
0.5%
-6.0%
-3.5%
15.8%
11.0%
13.2%
7.2%
7.2%
-0.1%
-6.3%
-5.2%
13.7%
9.6%
12.2%
7.0%
7.1%
-10.0% -5.0% 0.0% 5.0% 10.0% 15.0% 20.0%
3 M
6 M
1 Yr
2 Yr
3 Yr
4 Yr
5 Yr
Inception
Benchmark
CHOICe

5Investment Tracker December 2015
This Fund invests in listed equities and high quality fixed income and money market instruments. The Fund intends to adopt a relatively
aggressive approach towards bonds and equities with the objective of achieving capital appreciation.
Unit Linked Growth Fund
Risk Profile – Medium to High
PORTFOLIO AS ON , 2015DECEMBER 31 %
All rated fixed income instruments are AAA/P1+ or equivalent except *which is AA+
EQUITY 82.81
GOVERNMENT SECURITIES 11.36
CORPORATE BONDS/DEBENTURES 4.05
OTHER NET CURRENT ASSETS 1.78
TOTAL 100.00
Infosys Ltd 7.51
Maruti Suzuki India Ltd 5.75
Tata Motors Ltd 5.42
HDFC Bank Ltd 4.26
Larsen N Toubro Ltd 4.14
IndusInd Bank Ltd 3.59
Reliance Industries Ltd 3.50
ICICI Bank Ltd 3.45
Sun Pharmaceutical Industries Ltd 2.97
YES Bank Ltd 2.73
ITC Ltd 2.63
HCL Technologies Ltd 2.47
Tech Mahindra Ltd 2.20
Housing Development Finance Corporation Ltd 2.13
Kotak Mahindra Bank Ltd 1.82
Kotak Banking ETF 1.77
Oil and Natural Gas Corp Ltd 1.73
Axis Bank 1.69
Ultratech Cement Ltd 1.43
R * Shares Banking ETF 1.40
Others 20.24
8.97% Govt. of India 2030 3.79
8.13% Govt. of India GOI 2045 2.40
9.23% Govt. of India 2043 1.63
8.17% Goverment of India GSEC 2044 1.17
8.60% Government of India 2028 0.61
8.30% Govt. of India 2042 0.59
8.53% Tamilnadu State Dev. Loan 2020 0.30
8.28% Govt. of India 2027 0.30
7.80% Govt. of India 2020 0.29
8.83% Government of India 2041 0.17
Others 0.12
10.40% Reliance Ports & Terminals Ltd. 2021 0.95
9.75% Rural Electrification Corp. Ltd. 2021 0.93
9.18% Power Fin Corp. Ltd. NCD 2021 0.78
9.00% Power Fin Corp. Ltd. NCD 2028 0.61
Export Import Bank of India FRN Annual Reset 5y 2016 0.35
10.25% Reliance Gas Transport Infrastructure Ltd 2021 0.31
8.7% Power Fin Corp. Ltd. NCD 2020 0.12
Equity Sector Exposure
Asset Allocation Pattern
Equity and Equity Related Instruments
Debt Securities
Money Market
50% - 90%
10% - 50%
0% - 40%
stFund Performance as on 31 December, 2015 (%)
NAV Movement
Growth Fund benchmark is 80% CNX Nifty Index and 20% CRISIL Composite Bond Fund Index.
Modified Duration (in years): 6.2
Past performance is not indicative of future performance. The SFIN for Growth Fund is ULIF00216/06/08GROWTHFUND136.
Growth
thDate of Inception: 16 June 2008 stNAV as on 31 December, 2015: 18.443Benchmark:
CRISIL Composite Bond Fund Index
CNX Nifty Index and
0.370.390.510.831.27
2.673.74
4.504.51
7.78
9.58
12.58 12.74
21.33
0.00
5.00
10.00
15.00
20.00
25.00
n
n
ELECTRONIC COMPONENTS & INSTRUMENTS FMCG
METALS PHARMA & HOSPITALS
ELECTRICAL ENERGY CONSTRUCTION
TELECOM INFORMATION TECHNOLOGY
MEDIA AUTO & ANCILLIARIES
GAS PRODUCTION & TRANSPORTATION BANKING
FINANCIAL SERVICES
OIL & OTHER PETROLEUM PRODUCTS
n
n
n n
n
n
n
n
n
n
n
n
0
5
10
15
20
25
Jun
-08
Au
g-0
8O
ct-0
8D
ec-0
8Fe
b-0
9A
pr-
09
Jun
-09
Au
g-0
9
Oct
-09
Dec
-09
Feb
-10
Ap
r-1
0
Jun
-10
Au
g-1
0
Oct
-10
Dec
-10
Feb
-11
Ap
r-1
1
Jun
-11
Au
g-1
1 O
ct-1
1 D
ec-1
1 Fe
b-1
2 A
pr-
12
Ju
n-1
2
Au
g-1
2
Oct
-12
Dec
-12
Feb
-13
Ap
r-1
3
Jun
-13
Au
g-1
3
Oct
-13
Dec
-13
Feb
-14
Ap
r-1
4
Jun
-14
Au
g-1
4O
ct-1
4D
ec-1
4Fe
b-1
5A
pr-
15
Jun
-15
Au
g-1
5O
ct-1
5D
ec-1
5
Growth
18.443
0.5%
-4.5%
-2.2%
14.2%
10.2%
12.1%
7.2%
8.0%
16.2%
8.5%
0.1%
-4.3%
-2.8%
12.8%
9.1%
11.3% 7.2%
8.3%
14.9%
7.5%
-10.0% -5.0% 0.0% 5.0% 10.0% 15.0% 20.0%
3 M
6 M
1 Yr
2 Yr
3 Yr
4 Yr
5 Yr
6 Yr
7 Yr
Inception
BenchmarkCHOICe
6Investment Tracker December 2015
Equity Sector Exposure
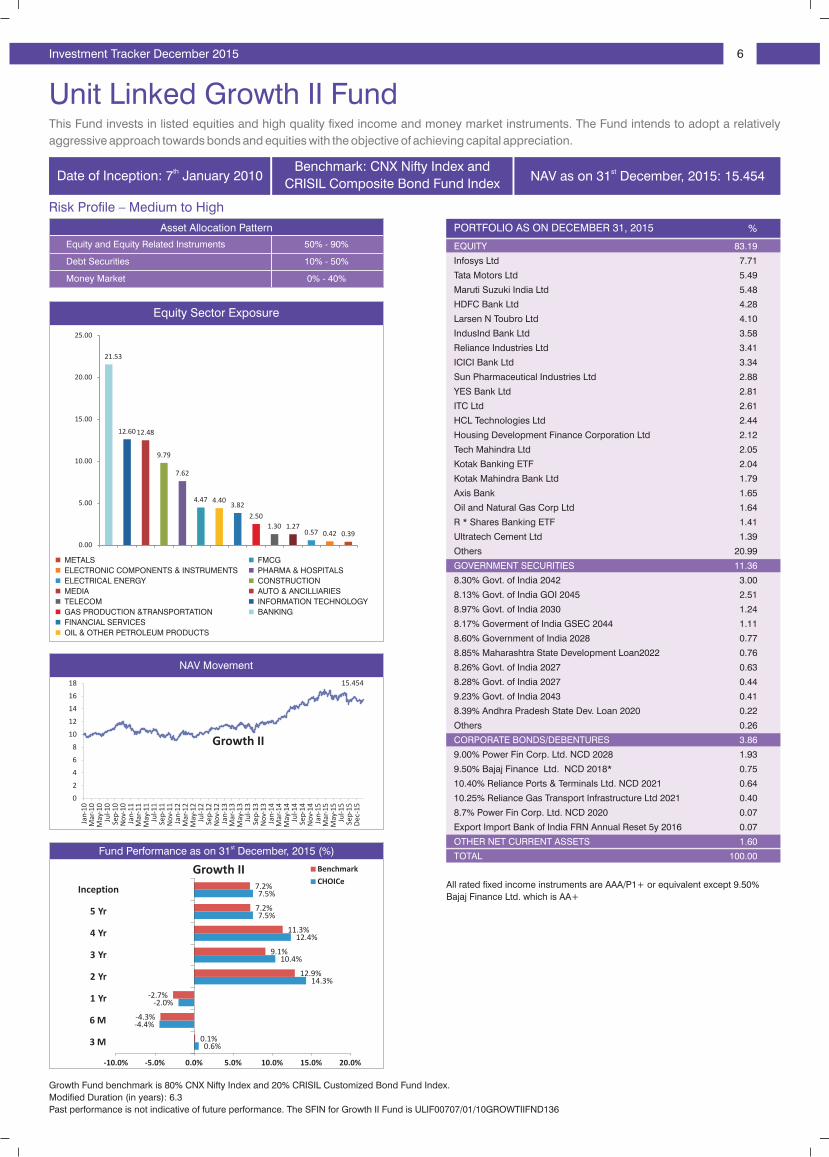
This Fund invests in listed equities and high quality fixed income and money market instruments. The Fund intends to adopt a relatively
aggressive approach towards bonds and equities with the objective of achieving capital appreciation.
Unit Linked Growth II Fund
Risk Profile – Medium to High
PORTFOLIO AS ON , 2015DECEMBER 31 %
All rated fixed income instruments are AAA/P1+ or equivalent except 9.50%
Bajaj Finance Ltd. which is AA+
EQUITY 83.19
GOVERNMENT SECURITIES 11.36
CORPORATE BONDS/DEBENTURES 3.86
OTHER NET CURRENT ASSETS 1.60
TOTAL 100.00
Infosys Ltd 7.71
Tata Motors Ltd 5.49
Maruti Suzuki India Ltd 5.48
HDFC Bank Ltd 4.28
Larsen N Toubro Ltd 4.10
IndusInd Bank Ltd 3.58
Reliance Industries Ltd 3.41
ICICI Bank Ltd 3.34
Sun Pharmaceutical Industries Ltd 2.88
YES Bank Ltd 2.81
ITC Ltd 2.61
HCL Technologies Ltd 2.44
Housing Development Finance Corporation Ltd 2.12
Tech Mahindra Ltd 2.05
Kotak Banking ETF 2.04
Kotak Mahindra Bank Ltd 1.79
Axis Bank 1.65
Oil and Natural Gas Corp Ltd 1.64
R * Shares Banking ETF 1.41
Ultratech Cement Ltd 1.39
Others 20.99
8.30% Govt. of India 2042 3.00
8.13% Govt. of India GOI 2045 2.51
8.97% Govt. of India 2030 1.24
8.17% Goverment of India GSEC 2044 1.11
8.60% Government of India 2028 0.77
8.85% Maharashtra State Development Loan2022 0.76
8.26% Govt. of India 2027 0.63
8.28% Govt. of India 2027 0.44
9.23% Govt. of India 2043 0.41
8.39% Andhra Pradesh State Dev. Loan 2020 0.22
Others 0.26
9.00% Power Fin Corp. Ltd. NCD 2028 1.93
9.50% Bajaj Finance Ltd. NCD 2018* 0.75
10.40% Reliance Ports & Terminals Ltd. NCD 2021 0.64
10.25% Reliance Gas Transport Infrastructure Ltd 2021 0.40
8.7% Power Fin Corp. Ltd. NCD 2020 0.07
Export Import Bank of India FRN Annual Reset 5y 2016 0.07
Asset Allocation Pattern
50% - 90%Equity and Equity Related Instruments
10% - 50%Debt Securities
0% - 40%Money Market
NAV Movement
stFund Performance as on 31 December, 2015 (%)
Growth Fund benchmark is 80% CNX Nifty Index and 20% CRISIL Customized Bond Fund Index.
Modified Duration (in years): 6.3
Past performance is not indicative of future performance. The SFIN for Growth II Fund is ULIF00707/01/10GROWTIIFND136
Growth II
thDate of Inception: 7 January 2010 NAV as on , 2015: 15.454st31 DecemberBenchmark:
CRISIL Composite Bond Fund Index
CNX Nifty Index and
0.390.420.571.271.30
2.50
3.82
4.40
4.47
7.62
9.79
12.48 12.60
21.53
0.00
5.00
10.00
15.00
20.00
25.00
nMETALS FMCG
ELECTRONIC COMPONENTS & INSTRUMENTS PHARMA & HOSPITALS
ELECTRICAL ENERGY CONSTRUCTION
MEDIA AUTO & ANCILLIARIES
TELECOM INFORMATION TECHNOLOGY
GAS PRODUCTION &TRANSPORTATION BANKING
FINANCIAL SERVICES
OIL & OTHER PETROLEUM PRODUCTS
n
n
n n
n
n
n
n
n
n
n
n
n
0
2
4
6
8
10
12
14
16
18
Jan-
10
Mar
-10
May
-10
Jul-1
0Se
p-1
0N
ov-
10
Jan-
11
Mar
-11
May
-11
Jul-1
1Se
p-1
1N
ov-
11
Jan-
12
Mar
-12
May
-12
Jul-1
2Se
p-1
2N
ov-
12
Jan-
13
Mar
-13
May
-13
Jul-1
3Se
p-1
3N
ov-
13
Jan-
14
Mar
-14
May
-14
Jul-1
4Se
p-1
4N
ov-
14
Jan-
15
Mar
-15
May
-15
Jul-1
5Se
p-1
5D
ec-1
5
Growth II
15.454
0.6%
-4.4%
-2.0%
14.3%
10.4%
12.4%
7.5%
7.5%
0.1%
-4.3%
-2.7%
12.9%
9.1%
11.3%
7.2%
7.2%
-10.0% -5.0% 0.0% 5.0% 10.0% 15.0% 20.0%
3 M
6 M
1 Yr
2 Yr
3 Yr
4 Yr
5 Yr
Inception
Benchmark
CHOICe

7Investment Tracker December 2015
This Fund invests in listed equities and high quality fixed income and money market instruments. The Fund intends to adopt a relatively
aggressive approach towards bonds and equities with the objective of achieving capital appreciation.
Unit Linked Growth Plus Fund
PORTFOLIO AS ON , 2015DECEMBER 31 %
Risk Profile – Medium to High
EQUITY 81.69
GOVERNMENT SECURITIES 13.37
CORPORATE BONDS/DEBENTURES 2.31
OTHER NET CURRENT ASSETS 2.63
TOTAL 100.00
Infosys Ltd 7.79
Maruti Suzuki India Ltd 5.31
Tata Motors Ltd 5.30
HDFC Bank Ltd 4.19
Larsen N Toubro Ltd 4.11
IndusInd Bank Ltd 3.51
ICICI Bank Ltd 3.43
Reliance Industries Ltd 3.39
Sun Pharmaceutical Industries Ltd 2.96
YES Bank Ltd 2.74
ITC Ltd 2.62
Kotak Banking ETF 2.50
HCL Technologies Ltd 2.48
Housing Development Finance Corporation Ltd 2.10
Tech Mahindra Ltd 1.94
Kotak Mahindra Bank Ltd 1.78
Oil and Natural Gas Corp Ltd 1.61
Axis Bank 1.60
Ultratech Cement Ltd 1.40
Glenmark Pharmaceuticals Ltd 1.32
Others 19.59
9.23% Govt. of India 2043 2.80
8.13% Govt. of India GOI 2045 2.06
8.83% Government of India 2023 1.87
8.97% Govt. of India 2030 1.31
8.30% Govt. of India 2042 1.22
8.27% Government of India 2020 1.05
8.17% Goverment of India GSEC 2044 1.03
7.88% Govt. of India GSEC 2030 0.76
7.80% Govt. of India 2020 0.69
8.60% Government of India 2028 0.36
Others 0.22
9.00% Power Fin Corp. Ltd. NCD 2028 0.68
9.28% Rural Electrification Corporation Ltd 2017 0.52
9.50% Bajaj Finance Ltd. NCD 2018* 0.35
10.40% Reliance Ports & Terminals Ltd. NCD 2021 0.26
10.25% Reliance Gas Transport Infrastructure Ltd 2021 0.18
9.75% Rural Electrification Corp. Ltd. 2021 0.15
9.61% Power Fin Corp. Ltd. NCD 2021 0.07
9.18% Tata Sons Ltd. NCD 2020 0.07
Housing Dev. Fin. Corp. Ltd. FRN Annual Reset 5y 2016 0.03
Asset Allocation Pattern
50% - 90%Equity and Equity Related Instruments
10% - 50%Debt Securities
0% - 40%Money Market
NAV Movement
Equity Sector Exposure
All rated fixed income instruments are AAA/P1+ or equivalent except *9.50%
Bajaj Finance Ltd. which is AA+
stFund Performance as on 31 December, 2015 (%)
Growth Fund benchmark is 80% CNX Nifty Index and 20% CRISIL Customized Bond Fund Index.
Modified Duration (in years): 6.23
Past performance is not indicative of future performance. The SFIN for Growth Plus Fund is ULIF00913/09/10GROWTPLFND136.
Growth Plus
thDate of Inception: 13 September 2010 NAV as on , 2015: 13.342st31 DecemberBenchmark:
CRISIL Composite Bond Fund Index
CNX Nifty Index and
0.340.390.391.251.27
2.40
3.80
4.39
4.47
7.74
9.46
12.14 12.62
21.03
0.00
5.00
10.00
15.00
20.00
25.00
0
2
4
6
8
10
12
14
16
Sep-
10
No
v-1
0Ja
n-1
1M
ar-1
1M
ay-1
1Ju
l-11
Sep-
11
No
v-1
1Ja
n-1
2M
ar-1
2M
ay-1
2Ju
l-12
Sep-
12
No
v-1
2Ja
n-1
3M
ar-1
3M
ay-1
3Ju
l-13
Sep-
13
No
v-1
3Ja
n-1
4M
ar-1
4M
ay-1
4Ju
l-14
Sep-
14
No
v-1
4Ja
n-1
5M
ar-1
5M
ay-1
5Ju
l-15
Sep-
15
Dec
-15
Growth Plus
13.342
0.6%
-4.4%
-1.8%
14.4%
10.3%
12.3%
7.4%
5.6%
0.1%
-4.3%
-2.7%
12.9%
9.1%
11.3%
7.2%
6.5%
-10.0% -5.0% 0.0% 5.0% 10.0% 15.0% 20.0%
3 M
6 M
1 Yr
2 Yr
3 Yr 4 Yr
5 Yr
Inception
Benchmark
CHOICe
nELECTRONIC COMPONENTS & INSTRUMENTS FMCG
METALS PHARMA & HOSPITALS
ELECTRICAL ENERGY CONSTRUCTION
TELECOM AUTO & ANCILLIARIES
MEDIA INFORMATION TECHNOLOGY
GAS PRODUCTION & TRANSPORTATION BANKING
FINANCIAL SERVICES
OIL & OTHER PETROLEUM PRODUCTS
n
n
n n
n
n
n
n
n
n
n
n
n

NAV Movement
8Investment Tracker December 2015
This Fund adopts a relatively balanced approach towards bonds and equities exposure with the objective of achieving capital appreciation
with minimal short-term performance volatility.
Unit Linked Balanced Fund
Risk Profile – Medium
%PORTFOLIO AS ON , 2015DECEMBER 31Asset Allocation Pattern
30% - 70%Equity and Equity Related Instruments
30% - 70%Debt Securities
0% - 40%Money Market
EQUITY 53.22
GOVERNMENT SECURITIES 23.52
CORPORATE BONDS/DEBENTURES 20.43
OTHER NET CURRENT ASSETS 2.83
TOTAL 100.00
Infosys Ltd 4.86
HDFC Bank Ltd 3.69
Tata Motors Ltd 3.35
ICICI Bank Ltd 3.06
Maruti Suzuki India Ltd 2.58
Larsen N Toubro Ltd 2.35
IndusInd Bank Ltd 2.34
Reliance Industries Ltd 2.19
YES Bank Ltd 1.86
ITC Ltd 1.68
Sun Pharmaceutical Industries Ltd 1.60
HCL Technologies Ltd 1.56
Tech Mahindra Ltd 1.39
Axis Bank 1.38
Kotak Mahindra Bank Ltd 1.35
Housing Development Finance Corporation Ltd 1.35
Ultratech Cement Ltd 1.10
Oil and Natural Gas Corp Ltd 1.04
Divis Laboratories Limited 0.91
Bosch Limited 0.86
Others 12.74
9.23% Govt. of India 2043 4.61
8.83% Government of India 2041 3.60
8.30% Govt. of India 2042 2.81
8.13% Govt. of India GOI 2045 2.30
8.97% Govt. of India 2030 2.21
8.17% Goverment of India GSEC 2044 2.05
8.83% Government of India 2023 1.65
9.12% Gujarat State Development Loan 2022 1.32
8.27% Government of India 2020 1.04
8.85% Maharashtra State Development Loan 2022 0.78
Others 1.15
9.00% Power Fin Corp. Ltd. NCD 2028 5.59
10.40% Reliance Ports & Terminals Ltd. NCD 2021 2.21
Housing Dev. Fin. Corp. Ltd. FRN Annual Reset 5y 2016 2.06
9.75% Rural Electrification Corp. Ltd. 2021 1.94
9.18% Tata Sons Ltd. NCD 2020 1.70
10.10% HDB Financial Services Ltd. NCD 2017 1.69
10.25% Reliance Gas Transport Infrastructure Ltd 2021 1.37
8.68% National Cap Reg Plan NCD 2020 0.82
9.36% Power Fin Corp. Ltd. NCD 2021 0.42
9.70% Housing Dev. Fin. Corp. Ltd. NCD 2016 0.38
Others 2.25
Equity Sector Exposure
Balanced Fund benchmark is 50% CNX Nifty Index and 50% CRISIL Customized Bond Fund Index.
Modified Duration (in years): 5.8
Past performance is not indicative of future performance.
The SFIN for Balanced Fund is ULIF00316/06/08BLNCEDFUND136.
stFund Performance as on 31 December, 2015 (%)
All rated fixed income instruments are AAA/P1+ or equivalent except 9.50%
Bajaj Finance Ltd. NCD, 9.45% Bajaj Finance Ltd. NCD, *10%
Sundaram Finance Ltd 2017 which is AA+
Balanced
thDate of Inception: 16 June 2008 NAV as on , 2015: 19.375st31 DecemberBenchmark:
CRISIL Composite Bond Fund Index
CNX Nifty Index and
0.250.300.630.690.76
1.56
2.522.82
3.17
4.57
6.65
7.02
8.06
14.21
0.00
2.00
4.00
6.00
8.00
10.00
12.00
14.00
16.00
0
5
10
15
20
25
Jun
-08
Au
g-0
8O
ct-0
8D
ec-0
8Fe
b-0
9A
pr-
09
Jun
-09
Au
g-0
9
Oct
-09
Dec
-09
Feb
-10
Ap
r-1
0
Jun
-10
Au
g-1
0
Oct
-10
Dec
-10
Feb
-11
Ap
r-1
1
Jun
-11
Au
g-1
1 O
ct-1
1 Dec
-11
Feb
-12
Ap
r-1
2 Ju
n-1
2
Au
g-1
2
Oct
-12
Dec
-12
Feb
-13
Ap
r-1
3
Jun
-13
Au
g-1
3
Oct
-13
Dec
-13
Feb
-14
Ap
r-1
4
Jun
-14
Au
g-1
4O
ct-1
4D
ec-1
4Fe
b-1
5A
pr-
15
Jun
-15
Au
g-1
5O
ct-1
5D
ec-1
5
Balanced
19.375
nMETALS FMCG
ELECTRICAL ENERGY PHARMA & HOSPITALS
ELECTRONIC COMPONENTS & INSTRUMENTS CONSTRUCTION
TELECOM AUTO & ANCILLIARIES
MEDIA INFORMATION TECHNOLOGY
GAS PRODUCTION &TRANSPORTATION BANKING
FINANCIAL SERVICES
OIL & OTHER PETROLEUM PRODUCTS
n
n
n n
n
n
n
n
n
n
n
n
n
0.4%
-1.7%
1.1%
13.2%
9.3%
10.7%
7.7%
7.9%
13.0%
9.2%
0.4%
-1.3%
0.9%
11.7%
8.4%
10.0% 7.4%
7.9%
12.3%
7.4%
-5.0% 0.0% 5.0% 10.0% 15.0%
3 M
6 M
1 Yr
2 Yr
3 Yr
4 Yr
5 Yr
6 Yr
7 Yr
Inception
Benchmark
CHOICe

9Investment Tracker December 2015
This Fund adopts a relatively balanced approach towards bonds and equities exposure with the objective of achieving capital appreciation
with minimal short-term performance volatility.
Unit Linked Balanced II Fund
Risk Profile – Medium
Asset Allocation Pattern
30% - 70%Equity and Equity Related Instruments
30% - 70%Debt Securities
0% - 40%Money Market
PORTFOLIO AS ON , 2015DECEMBER 31 %
EQUITY 53.04
GOVERNMENT SECURITIES 27.54
CORPORATE BONDS/DEBENTURES 16.49
OTHER NET CURRENT ASSETS 2.94
TOTAL 100.00
Infosys Ltd 4.86
HDFC Bank Ltd 3.67
Tata Motors Ltd 3.39
ICICI Bank Ltd 2.98
Maruti Suzuki India Ltd 2.54
IndusInd Bank Ltd 2.35
Larsen N Toubro Ltd 2.34
Reliance Industries Ltd 2.21
YES Bank Ltd 1.80
ITC Ltd 1.67
Sun Pharmaceutical Industries Ltd 1.56
HCL Technologies Ltd 1.55
Axis Bank 1.40
Tech Mahindra Ltd 1.35
Kotak Mahindra Bank Ltd 1.35
Housing Development Finance Corporation Ltd 1.34
Ultratech Cement Ltd 1.07
Oil and Natural Gas Corp Ltd 1.05
Divis Laboratories Limited 0.92
Glenmark Pharmaceuticals Ltd 0.85
Others 12.77
8.30% Govt. of India 2042 7.31
8.97% Govt. of India 2030 3.65
9.23% Govt. of India 2043 3.38
8.13% Govt. of India GOI 2045 2.64
8.28% Govt. of India 2027 1.75
9.12% Gujarat State Development Loan 2022 1.36
8.15% Govt. of India 2026 1.33
7.88% Govt. of India GSEC 2030 1.24
8.91% Maharashtra State Development Loan 2022 1.03
8.17% Goverment of India GSEC 2044 0.66
Others 3.19
9.00% Power Fin Corp. Ltd. NCD 2028 3.57
10.40% Reliance Ports & Terminals Ltd. NCD 2021 1.65
8.7% Power Fin Corp. Ltd. NCD 2020 1.25
9.09% Indian Railways Fin. Corp. NCD 2026 1.11
10.10% HDB Financial Services Ltd. NCD 2017 1.07
10.25% Reliance Gas Transport Infrastructure Ltd 2021 0.99
9.18% Power Fin Corp. Ltd. NCD 2021 0.81
9.02% Rural Electrification Corporation Ltd 2022 0.81
9.75% Rural Electrification Corp. Ltd. 2021 0.67
8.83% Indian Railways Fin. Corp. NCD 2023 0.64
Others 3.90
Equity Sector Exposure
Balanced Fund benchmark is 50% S&P CNX Nifty Index and 50% CRISIL Customized Bond Fund Index.
Modified Duration (in years): 6.3
Past performance is not indicative of future performance. The SFIN for Balanced II Fund is ULIF00807/01/10BLNCDIIFND136.
NAV Movement
All rated fixed income instruments are AAA/P1+ or equivalent except *9.50%
Bajaj Finance Ltd. NCD which is AA+
stFund Performance as on 31 December, 2015 (%)
Balanced II
thDate of Inception: 7 January 2010 NAV as on , 2015: 15.512st31 DecemberBenchmark:
CRISIL Composite Bond Fund Index
CNX Nifty Index and
0.250.340.600.760.85
1.60
2.482.83
3.17
4.52
6.52
6.99
8.02
14.10
0.00
2.00
4.00
6.00
8.00
10.00
12.00
14.00
16.00
0.5%
-1.7%
1.3%
13.3%
9.4%
10.9%
7.9%
7.6%
0.4%
-1.2%
1.1%
11.8%
8.5%
10.1%
7.5%
7.2%
-4.0% - 2.0% 0.0% 2.0% 4.0% 6.0% 8.0% 10.0% 12.0% 14.0% 16.0%
3 M
6 M
1 Yr
2 Yr
3 Yr
4 Yr
5 Yr
Inception
Benchmark
CHOICe
nMETALS FMCG
ELECTRICAL ENERGY PHARMA & HOSPITALS
ELECTRONIC COMPONENTS & INSTRUMENTS CONSTRUCTION
MEDIA AUTO & ANCILLIARIES
TELECOM INFORMATION TECHNOLOGY
GAS PRODUCTION &TRANSPORTATION BANKING
FINANCIAL SERVICES
OIL & OTHER PETROLEUM PRODUCTS
n
n
n n
n
n
n
n
n
n
n
n
n
0
2
4
6
8
10
12
14
16
18
Jan
-10
Mar
-10
May
-10
Jul-
10
Sep
-10
No
v-1
0
Jan
-11
Mar
-11
May
-11
Jul-
11
Sep
-11
No
v-1
1
Jan
-12
Mar
-12
May
-12
Jul-
12
Sep
-12
No
v-1
2
Jan
-13
Mar
-13
May
-13
Ju
l-1
3
Sep
-13
No
v-1
3
Jan
-14
Mar
-14
May
-14
Jul-
14
Sep
-14
No
v-1
4
Jan
-15
Mar
-15
May
-15
Jul-
15
Sep
-15
Dec
-15
Balanced II
15.512
Investment Tracker December 2015 10
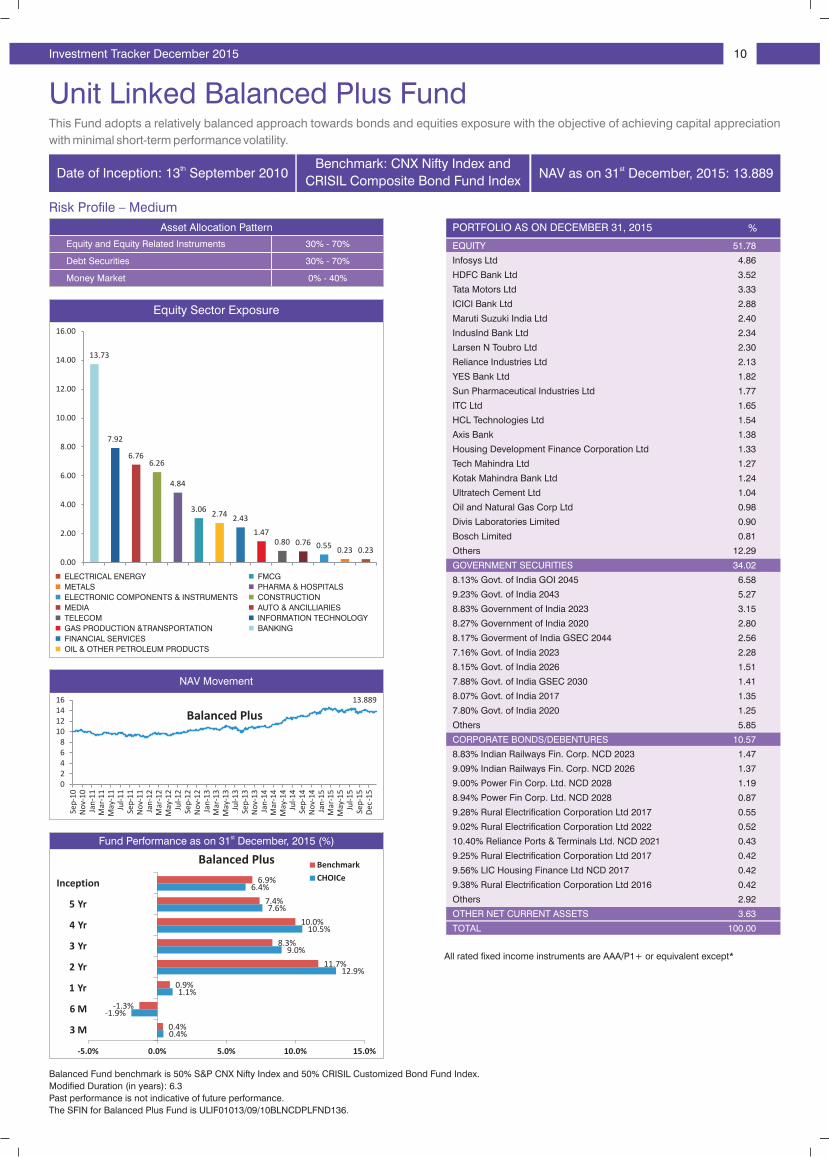
This Fund adopts a relatively balanced approach towards bonds and equities exposure with the objective of achieving capital appreciation
with minimal short-term performance volatility.
Unit Linked Balanced Plus Fund
Risk Profile – Medium
PORTFOLIO AS ON , 2015DECEMBER 31 %Asset Allocation Pattern
30% - 70%Equity and Equity Related Instruments
30% - 70%Debt Securities
0% - 40%Money Market
Balanced Fund benchmark is 50% S&P CNX Nifty Index and 50% CRISIL Customized Bond Fund Index.
Modified Duration (in years): 6.3
Past performance is not indicative of future performance.
The SFIN for Balanced Plus Fund is ULIF01013/09/10BLNCDPLFND136.
EQUITY 51.78
GOVERNMENT SECURITIES 34.02
CORPORATE BONDS/DEBENTURES 10.57
OTHER NET CURRENT ASSETS 3.63
TOTAL 100.00
Infosys Ltd 4.86
HDFC Bank Ltd 3.52
Tata Motors Ltd 3.33
ICICI Bank Ltd 2.88
Maruti Suzuki India Ltd 2.40
IndusInd Bank Ltd 2.34
Larsen N Toubro Ltd 2.30
Reliance Industries Ltd 2.13
YES Bank Ltd 1.82
Sun Pharmaceutical Industries Ltd 1.77
ITC Ltd 1.65
HCL Technologies Ltd 1.54
Axis Bank 1.38
Housing Development Finance Corporation Ltd 1.33
Tech Mahindra Ltd 1.27
Kotak Mahindra Bank Ltd 1.24
Ultratech Cement Ltd 1.04
Oil and Natural Gas Corp Ltd 0.98
Divis Laboratories Limited 0.90
Bosch Limited 0.81
Others 12.29
8.13% Govt. of India GOI 2045 6.58
9.23% Govt. of India 2043 5.27
8.83% Government of India 2023 3.15
8.27% Government of India 2020 2.80
8.17% Goverment of India GSEC 2044 2.56
7.16% Govt. of India 2023 2.28
8.15% Govt. of India 2026 1.51
7.88% Govt. of India GSEC 2030 1.41
8.07% Govt. of India 2017 1.35
7.80% Govt. of India 2020 1.25
Others 5.85
8.83% Indian Railways Fin. Corp. NCD 2023 1.47
9.09% Indian Railways Fin. Corp. NCD 2026 1.37
9.00% Power Fin Corp. Ltd. NCD 2028 1.19
8.94% Power Fin Corp. Ltd. NCD 2028 0.87
9.28% Rural Electrification Corporation Ltd 2017 0.55
9.02% Rural Electrification Corporation Ltd 2022 0.52
10.40% Reliance Ports & Terminals Ltd. NCD 2021 0.43
9.25% Rural Electrification Corporation Ltd 2017 0.42
9.56% LIC Housing Finance Ltd NCD 2017 0.42
9.38% Rural Electrification Corporation Ltd 2016 0.42
Others 2.92
Equity Sector Exposure
NAV Movement
All rated fixed income instruments are AAA/P1+ or equivalent except*
stFund Performance as on 31 December, 2015 (%)
Balanced Plus
thDate of Inception: 13 September 2010 Benchmark:
CRISIL Composite Bond Fund Index
CNX Nifty Index andNAV as on , 2015: 13.889st31 December
0.230.230.550.760.80
1.47
2.432.74
3.06
4.84
6.26
6.76
7.92
13.73
0.00
2.00
4.00
6.00
8.00
10.00
12.00
14.00
16.00
0 2 4 6 8
10121416
Sep
-10
No
v-1
0Ja
n-1
1M
ar-1
1M
ay-1
1Ju
l-1
1
Sep
-11
No
v-1
1
Jan
-12
Mar
-12
May
-12
Jul-
12
Sep
-12
No
v-1
2 Ja
n-1
3
Mar
-13
M
ay-1
3 Ju
l-1
3
Sep
-13
N
ov-
13
Jan
-14
Mar
-14
May
-14
Jul-
14
Sep
-14
No
v-1
4
Jan
-15
Mar
-15
May
-15
Jul-
15
Sep
-15
Dec
-15
Balanced Plus
13.889
0.4%
-1.9%
1.1%
12.9%
9.0%
10.5%
7.6%
6.4%
0.4%
-1.3%
0.9%
11.7%
8.3%
10.0%
7.4%
6.9%
-5.0% 0.0% 5.0% 10.0% 15.0%
3 M
6 M
1 Yr
2 Yr
3 Yr 4 Yr
5 Yr
Inception
Benchmark
CHOICe
nELECTRICAL ENERGY FMCG
METALS PHARMA & HOSPITALS
ELECTRONIC COMPONENTS & INSTRUMENTS CONSTRUCTION
MEDIA AUTO & ANCILLIARIES
TELECOM INFORMATION TECHNOLOGY
GAS PRODUCTION &TRANSPORTATION BANKING
FINANCIAL SERVICES
OIL & OTHER PETROLEUM PRODUCTS
n
n
n n
n
n
n
n
n
n
n
n
n
Investment Tracker December 2015 11
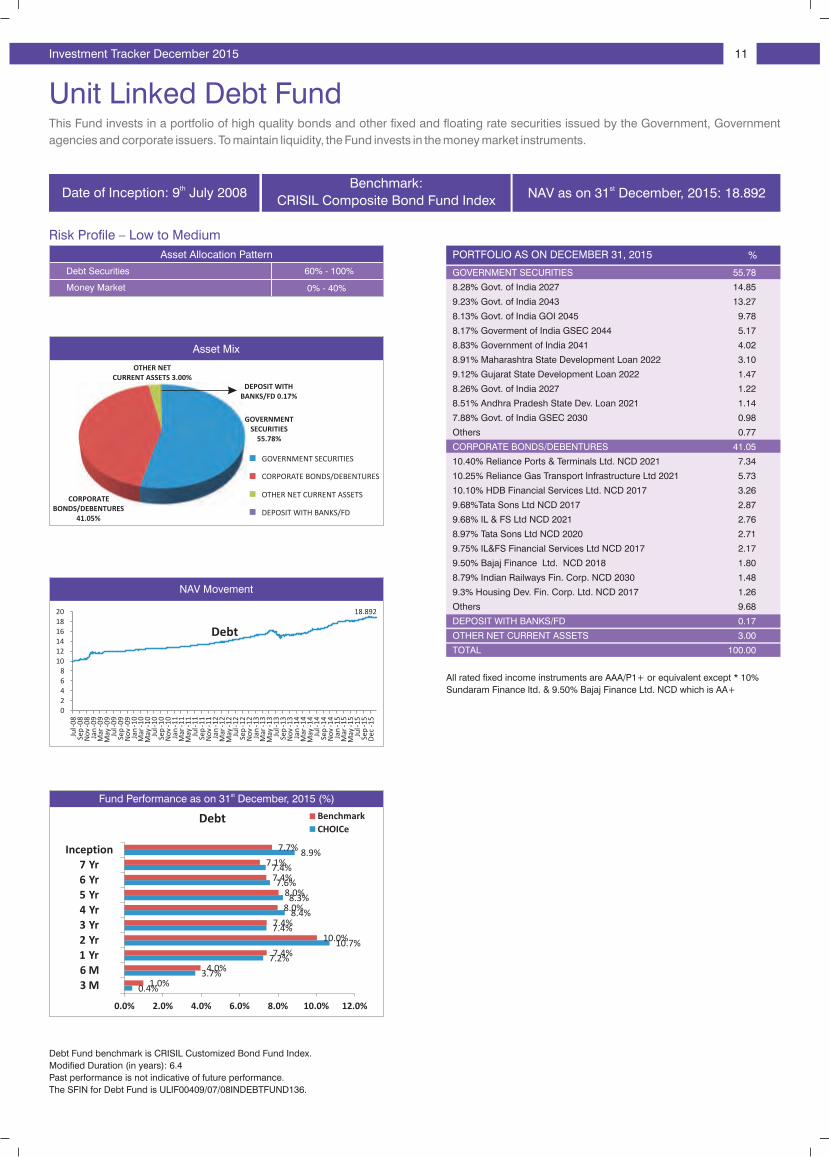
This Fund invests in a portfolio of high quality bonds and other fixed and floating rate securities issued by the Government, Government
agencies and corporate issuers. To maintain liquidity, the Fund invests in the money market instruments.
Unit Linked Debt Fund
Risk Profile – Low to Medium
Asset Allocation Pattern
60% - 100%Debt Securities
0% - 40%Money Market
Asset Mix
Debt Fund benchmark is CRISIL Customized Bond Fund Index.
Modified Duration (in years): 6.4
Past performance is not indicative of future performance.
The SFIN for Debt Fund is ULIF00409/07/08INDEBTFUND136.
PORTFOLIO AS ON , 2015DECEMBER 31 %
All rated fixed income instruments are AAA/P1+ or equivalent except * 10%
Sundaram Finance ltd. & 9.50% Bajaj Finance Ltd. NCD which is AA+
GOVERNMENT SECURITIES 55.78
CORPORATE BONDS/DEBENTURES 41.05
DEPOSIT WITH BANKS/FD 0.17
OTHER NET CURRENT ASSETS 3.00
TOTAL 100.00
8.28% Govt. of India 2027 14.85
9.23% Govt. of India 2043 13.27
8.13% Govt. of India GOI 2045 9.78
8.17% Goverment of India GSEC 2044 5.17
8.83% Government of India 2041 4.02
8.91% Maharashtra State Development Loan 2022 3.10
9.12% Gujarat State Development Loan 2022 1.47
8.26% Govt. of India 2027 1.22
8.51% Andhra Pradesh State Dev. Loan 2021 1.14
7.88% Govt. of India GSEC 2030 0.98
Others 0.77
10.40% Reliance Ports & Terminals Ltd. NCD 2021 7.34
10.25% Reliance Gas Transport Infrastructure Ltd 2021 5.73
10.10% HDB Financial Services Ltd. NCD 2017 3.26
9.68%Tata Sons Ltd NCD 2017 2.87
9.68% IL & FS Ltd NCD 2021 2.76
8.97% Tata Sons Ltd NCD 2020 2.71
9.75% IL&FS Financial Services Ltd NCD 2017 2.17
9.50% Bajaj Finance Ltd. NCD 2018 1.80
8.79% Indian Railways Fin. Corp. NCD 2030 1.48
9.3% Housing Dev. Fin. Corp. Ltd. NCD 2017 1.26
Others 9.68
NAV Movement
stFund Performance as on 31 December, 2015 (%)
GOVERNMENT SECURITIES
55.78%
CORPORATEBONDS/DEBENTURES
41.05%
OTHER NETCURRENT ASSETS 3.00%
GOVERNMENT SECURITIES
CORPORATE BONDS/DEBENTURES
OTHER NET CURRENT ASSETS
DEPOSIT WITH BANKS/FD
thDate of Inception: 9 July 2008 NAV as on , 2015: 18.892st31 DecemberBenchmark:
CRISIL Composite Bond Fund Index
0 2 4 6 8
101214161820
Jul-
08
Sep
-08
No
v-0
8Ja
n-0
9M
ar-0
9M
ay-0
9Ju
l-0
9Se
p-0
9N
ov
-09
Jan
-10
Mar
-10
May
-10
Jul-
10
Sep
-10
No
v-1
0Ja
n-1
1M
ar-1
1M
ay-1
1Ju
l-1
1Se
p-1
1N
ov
-11
Jan
-12
Mar
-12
May
-12
Jul-
12
Sep
-12
No
v-1
2Ja
n-1
3M
ar-1
3M
ay-1
3Ju
l-1
3Se
p-1
3N
ov
-13
Jan
-14
Mar
-14
May
-14
Jul-
14
Sep
-14
No
v-1
4Ja
n-1
5M
ar-1
5M
ay-1
5Ju
l-1
5Se
p-1
5D
ec-1
5
Debt
18.892
Debt
DEPOSIT WITHBANKS/FD 0.17%
0.4%
3.7%
7.2%
10.7%
7.4%
8.4% 8.3%
7.6% 7.4%
8.9%
1.0%
4.0%
7.4%
10.0%
7.4%
8.0% 8.0%
7.4%
7.1%
7.7%
0.0% 2.0% 4.0% 6.0% 8.0% 10.0% 12.0%
3 M6 M1 Yr2 Yr3 Yr4 Yr5 Yr6 Yr7 Yr
Inception
Benchmark
CHOICe
Investment Tracker December 2015 12
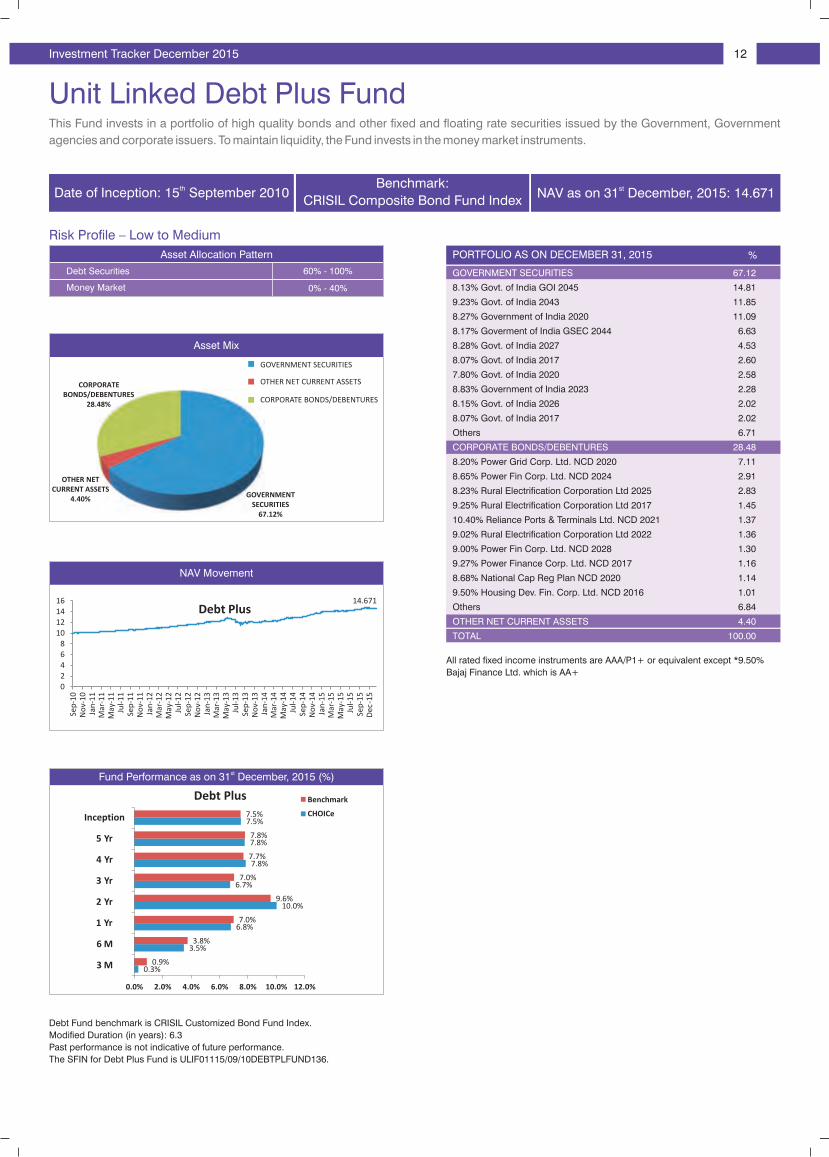
This Fund invests in a portfolio of high quality bonds and other fixed and floating rate securities issued by the Government, Government
agencies and corporate issuers. To maintain liquidity, the Fund invests in the money market instruments.
Unit Linked Debt Plus Fund
Risk Profile – Low to Medium
PORTFOLIO AS ON , 2015DECEMBER 31 %
All rated fixed income instruments are AAA/P1+ or equivalent except *9.50%
Bajaj Finance Ltd. which is AA+
GOVERNMENT SECURITIES 67.12
CORPORATE BONDS/DEBENTURES 28.48
OTHER NET CURRENT ASSETS 4.40
TOTAL 100.00
8.13% Govt. of India GOI 2045 14.81
9.23% Govt. of India 2043 11.85
8.27% Government of India 2020 11.09
8.17% Goverment of India GSEC 2044 6.63
8.28% Govt. of India 2027 4.53
8.07% Govt. of India 2017 2.60
7.80% Govt. of India 2020 2.58
8.83% Government of India 2023 2.28
8.15% Govt. of India 2026 2.02
8.07% Govt. of India 2017 2.02
Others 6.71
8.20% Power Grid Corp. Ltd. NCD 2020 7.11
8.65% Power Fin Corp. Ltd. NCD 2024 2.91
8.23% Rural Electrification Corporation Ltd 2025 2.83
9.25% Rural Electrification Corporation Ltd 2017 1.45
10.40% Reliance Ports & Terminals Ltd. NCD 2021 1.37
9.02% Rural Electrification Corporation Ltd 2022 1.36
9.00% Power Fin Corp. Ltd. NCD 2028 1.30
9.27% Power Finance Corp. Ltd. NCD 2017 1.16
8.68% National Cap Reg Plan NCD 2020 1.14
9.50% Housing Dev. Fin. Corp. Ltd. NCD 2016 1.01
Others 6.84
Asset Mix
Asset Allocation Pattern
60% - 100%Debt Securities
0% - 40%Money Market
Debt Fund benchmark is CRISIL Customized Bond Fund Index.
Modified Duration (in years): 6.3
Past performance is not indicative of future performance.
The SFIN for Debt Plus Fund is ULIF01115/09/10DEBTPLFUND136.
NAV Movement
CORPORATEBONDS/DEBENTURES
28.48%
OTHER NET CURRENT ASSETS
4.40%
OTHER NET CURRENT ASSETS
4.40%GOVERNMENT
SECURITIES67.12%
GOVERNMENT SECURITIES
OTHER NET CURRENT ASSETS
CORPORATE BONDS/DEBENTURES
stFund Performance as on 31 December, 2015 (%)
thDate of Inception: 15 September 2010 NAV as on , 2015: 14.671st31 DecemberBenchmark:
CRISIL Composite Bond Fund Index
Debt Plus
0 2 4 6 8
10121416
Sep
-10
No
v-1
0Ja
n-1
1M
ar-1
1M
ay-1
1Ju
l-1
1Se
p-1
1
No
v-1
1
Jan
-12
Mar
-12
May
-12
Jul-
12
Sep
-12
No
v-1
2 Ja
n-1
3
Mar
-13
M
ay-1
3 Ju
l-1
3
Sep
-13
No
v-1
3
Jan
-14
Mar
-14
May
-14
Jul-
14
Sep
-14
No
v-1
4
Jan
-15
Mar
-15
May
-15
Jul-
15
Sep
-15
Dec
-15
Debt Plus14.671
0.3%
3.5%
6.8%
10.0%
6.7%
7.8%
7.8%
7.5%
0.9%
3.8%
7.0%
9.6%
7.0%
7.7%
7.8%
7.5%
0.0% 2.0% 4.0% 6.0% 8.0% 10.0% 12.0%
3 M
6 M
1 Yr
2 Yr
3 Yr
4 Yr
5 Yr
Inception
Benchmark
CHOICe

Investment Tracker December 2015 13
This Fund primarily invests in a portfolio constituted of money market and high quality debt securities.
Unit Linked Liquid Fund
Risk Profile – Low
PORTFOLIO AS ON , 2015DECEMBER 31 %Asset Allocation Pattern
0% - 60%Debt Securities
40% - 100%Money Market
Liquid Fund benchmark is CRISIL Liquid Fund Index.
Modified Duration (in years): 0.4
Past performance is not indicative of future performance.
The SFIN for Liquid Fund is ULIF00514/07/08LIQUIDFUND136.
stFund Performance as on 31 December, 2015 (%)
NAV Movement
Asset Mix
DEPOSIT WITH BANKS
OTHER NET CURRENT ASSETS
CORPORATE BONDS/DEBENTURES
DEPOSIT WITH BANKS 64.56%
CORPORATE BONDS/DEBENTURES
13.51%
DEPOSIT WITH BANKS/FD 64.56
CORPORATE BONDS/DEBENTURES 13.51
OTHER NET CURRENT ASSETS 21.93
TOTAL 100.00
thDate of Inception: 14 July 2008 NAV as on , 2015: 17.832st31 DecemberBenchmark: CRISIL Liquid Fund Index
Liquid
OTHER NET CURRENT ASSETS
21.93%
OTHER NET CURRENT ASSETS
21.93%
0
2
4
6
8
10
12
14
16
18
20
Jul-
08
Sep
-08
No
v-0
8Ja
n-0
9M
ar-0
9M
ay-0
9Ju
l-0
9Se
p-0
9N
ov
-09
Jan
-10
Mar
-10
May
-10
Jul-
10
Sep
-10
No
v-1
0
Jan
-11
Mar
-11
May
-11
Jul-
11
Sep
-11
No
v-1
1
Jan
-12
Mar
-12
May
-12
Ju
l-1
2
Sep
-12
No
v-1
2
Jan
-13
Mar
-13
May
-13
Jul-
13
Sep
-13
No
v-1
3
Jan
-14
Mar
-14
May
-14
Jul-
14
Sep
-14
No
v-1
4Ja
n-1
5M
ar-1
5M
ay-1
5Ju
l-1
5Se
p-1
5D
ec-1
5
Liquid fund
17.832
1.8%
3.8%
7.9%
8.3%
8.4%
8.6% 8.5%
8.1%
7.9%
8.1%
1.6%
3.3%
7.1%
7.7%
7.9%
8.1%
8.1%
7.7%
7.2%
7.4%
0.0% 2.0% 4.0% 6.0% 8.0% 10.0%
3 M
6 M
1 Yr
2 Yr
3 Yr
4 Yr
5 Yr
6 Yr
7 Yr
Inception
BenchmarkCHOICe
Investment Tracker December 2015 14
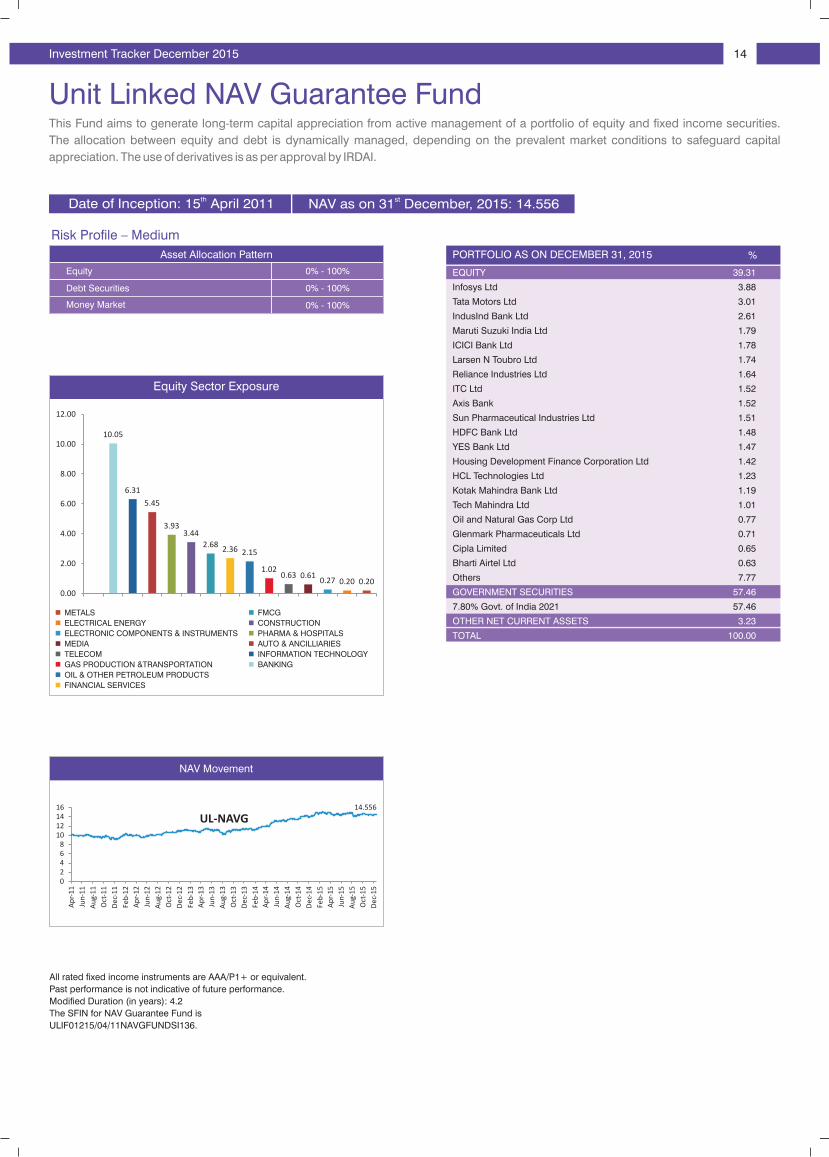
Unit Linked NAV Guarantee Fund
Risk Profile – Medium
This Fund aims to generate long-term capital appreciation from active management of a portfolio of equity and fixed income securities.
The allocation between equity and debt is dynamically managed, depending on the prevalent market conditions to safeguard capital
appreciation. The use of derivatives is as per approval by IRDAI.
PORTFOLIO AS ON , 2015DECEMBER 31 %
EQUITY 39.31
GOVERNMENT SECURITIES 57.46
OTHER NET CURRENT ASSETS 3.23
TOTAL 100.00
Infosys Ltd 3.88
Tata Motors Ltd 3.01
IndusInd Bank Ltd 2.61
Maruti Suzuki India Ltd 1.79
ICICI Bank Ltd 1.78
Larsen N Toubro Ltd 1.74
Reliance Industries Ltd 1.64
ITC Ltd 1.52
Axis Bank 1.52
Sun Pharmaceutical Industries Ltd 1.51
HDFC Bank Ltd 1.48
YES Bank Ltd 1.47
Housing Development Finance Corporation Ltd 1.42
HCL Technologies Ltd 1.23
Kotak Mahindra Bank Ltd 1.19
Tech Mahindra Ltd 1.01
Oil and Natural Gas Corp Ltd 0.77
Glenmark Pharmaceuticals Ltd 0.71
Cipla Limited 0.65
Bharti Airtel Ltd 0.63
Others 7.77
7.80% Govt. of India 2021 57.46
Asset Allocation Pattern
0% - 100%Equity
0% - 100%Money Market
0% - 100%Debt Securities
All rated fixed income instruments are AAA/P1+ or equivalent.
Past performance is not indicative of future performance.
Modified Duration (in years): 4.2
The SFIN for NAV Guarantee Fund is
ULIF01215/04/11NAVGFUNDSI136.
Equity Sector Exposure
NAV Movement
thDate of Inception: 15 April 2011 NAV as on , 2015: 14.556st31 December
nMETALS FMCG
ELECTRICAL ENERGY CONSTRUCTION
ELECTRONIC COMPONENTS & INSTRUMENTS PHARMA & HOSPITALS
MEDIA AUTO & ANCILLIARIES
TELECOM INFORMATION TECHNOLOGY
GAS PRODUCTION &TRANSPORTATION BANKING
OIL & OTHER PETROLEUM PRODUCTS
FINANCIAL SERVICES
n
n
n n
n
n
n
n
n
n
n
n
n
0.200.200.270.610.63
1.02
2.15
2.36
2.68
3.44
3.93
5.45 6.31
10.05
0.00
2.00
4.00
6.00
8.00
10.00
12.00
0 2 4 6 8
10121416
Ap
r-1
1
Jun-
11
Au
g-1
1
Oct
-11
Dec
-11
Feb-
12
Ap
r-1
2
Jun-
12
Au
g-1
2
Oct
-12
Dec
-12
Feb-
13
Ap
r-1
3
Jun-
13
Au
g-1
3
Oct
-13
Dec
-13
Feb-
14
Ap
r-1
4
Jun-
14
Au
g-1
4
Oct
-14
Dec
-14
Feb-
15
Ap
r-1
5
Jun-
15
Au
g-1
5
Oct
-15
Dec
-15
14.556
UL-NAVG
15
Canara HSBC Oriental Bank of Commerce Life Insurance Company Limited (IRDA Regn. No.136)
Registered Office: C31 & C32, First Floor, Connaught Circus, New Delhi-110001
Corporate Office: 2nd Floor, Orchid Business Park, Sector-48, Sohna Road, Gurgaon-122018, Haryana, India
Corporate Identity No. : U66010DL2007PLC248825
Website: www.canarahsbclife.com, Call: 1800-103-0003/1800-180-0003, Missed Call: 0124-6156600, SMS: 9779030003
E-mail: [email protected]
I
Investment Tracker December 2015
BEWARE OF SPURIOUS PHONE CALLS AND FICTITIOUS/FRAUDULENT OFFERS. IRDAI clarifies to public that: • IRDAI or its officials do not involve in activities like sale of any kind of insurance or financial products nor invest premiums. • IRDAI does not announce any bonus. Public receiving such phone calls are requested to lodge a police complaint along with details of phone call, number.
Purchase of any insurance products by a bank's customer is purely voluntary and is not linked to availment of any other facility from the bank.
Trade Logo of Canara HSBC Oriental Bank of Commerce Life Insurance Company Limited is used under license with Canara Bank, HSBC Holdings plc and Oriental Bankof Commerce.
The premiums & funds are subject to certain charges related to the fund or to the premium paid.

SAVE TAX*Under Sec 80C/80CCC
Trade Logo of Canara HSBC Oriental Bank of Commerce Life Insurance Company Limited is used under license with Canara Bank, HSBC Holdings plc and Oriental Bank of Commerce. The insurance products are offered and underwritten by Canara HSBC Oriental Bank of Commerce Life Insurance Company Ltd. (IRDAI Regn. No. 136) 2nd Floor, Orchid Business Park, Sector-48, Sohna Road, Gurgaon-122018, Haryana, India. For more details on risk factors, terms and conditions please read the sales brochure carefully before concluding a sale. Corporate Identity No.: U66010DL2007PLC248825. Website: www.canarahsbclife.com. Call: 1800-103-0003/1800-180-0003. SMS: 9779030003. Missed Call 0124-6156600 Email: [email protected] various funds offered under this contract are the names of the funds and do not in any way indicate the quality of these plans, their future prospects and returns. The premium shall be adjusted on the due date even if it has been received in advance. Linked Insurance products are different from traditional insurance products and are subject to the risk factors. Linked Funds are subject to market risks and there is no assurance or guarantee that the objective of the investment fund will be achieved. Past performance of the investment funds do not indicate the future performance of the same. Investors in the Scheme are not being offered any guaranteed/assured returns. The premium paid in Linked Insurance policies are subject to investment risks associated with capital markets and the NAVs of the units may go up or down based on the performance of the fund and factors influencing the capital market and the insured is responsible for his/her decisions. The premiums & funds are subject to certain charges related to the fund or to the premium paid. Please know the associated risks and the applicable charges, from your insurance agent or the intermediary or policy document issued by the insurance company.IRDAI Regn. No. 136 NLMSCNJINVJAN16 ENG
THE LINKED INSURANCE PRODUCTS DO NOT OFFER ANY LIQUIDITY DURING THE FIRST FIVE YEARS OF THE CONTRACT. THE POLICYHOLDER WILL NOT BE ABLE TO SURRENDER/ WITHDRAW THE MONIES INVESTED IN LINKED INSURANCE PRODUCTS COMPLETELY OR PARTIALLY TILL THE END OF THE FIFTH YEAR.
BEWARE OF SPURIOUS PHONE CALLS AND FICTITIOUS/FRAUDULENT OFFERS. IRDAI clarifies to public that: • IRDAI or its officials do not involve in activities like sale of any kind of insurance or financial products nor invest premiums. • IRDAI does not announce any bonus. Public receiving such phone calls are requested to lodge a police complaint along with details of phone call, number.
Purchase of any insurance products by a bank’s customer is purely voluntary and is not linked to availment of any other facility from the bank.
IN LINKED INSURANCE PRODUCTS, THE INVESTMENT RISK IN INVESTMENT PORTIFOLIO IS BORNE BY THE POLICYHOLDER.
A life insurance policy not only allows you to grow your savings but also provides valuable tax benefits in addi on to financial security to your loved ones in case of an unfortunate event. So add that extra bit to your savings & plan for a secured future with policies from CHOICe Life Insurance.
NO MORE TAXING TIMESInvest in a life insurance policy to protect your loved ones and save tax
*Tax benefits/savings are subject to provisions under Section 80C, 80CCC, 80CCE, 80D, 10(10A), 10(10D) and other sections of the Income Tax Act, 1961. These provisions are subject to amendments made by the Income Tax authorities from time to time. Please consult your independent tax advisor for details.
A deduc on is available from taxable income of an individual for the premium paid towards life insurance policies of himself/spouse/ children subject to the limits, condi ons and provisions of Sec on 80C / other sec ons of Income tax Act, 1961.
The amount received as maturity benefit and bonus is exempt from income tax subject to condi ons and provisions as prescribed in sec on 10(10D) and other sec ons of Income tax Act, 1961.
Deduc on under Sec on 80C * Exemp on under Sec on 10(10D)*More Savings, More Happiness
CHOICe Life Insurance stands for Canara HSBC Oriental Bank of Commerce Life Insurance Company Limited