Embed Size (px)
Citation preview

STUDY ON PRIVATE-INITIATIVE INFRASTRUCTURE PROJECTS
IN DEVELOPING COUNTRIES IN FY2011
STUDY ON THE NEW CEBU CONTAINER PORT AND THE
REDEVELOPMENT OF THE EXISTING CEBU PORT
IN THE REPUBLIC OF THE PHILIPPINES
FINAL REPORT
February 2012
Prepared for:
The Ministry of Economy, Trade and Industry
Prepared by:
Oriental Consultants Co., Ltd.
Ides Co., Ltd.


PREFACE
This report shows the results of the “Study on Private-Initiative Infrastructure Projects in Developing Countries in
FY2011” contract awarded by The Ministry of Economy, Trade and Industry to Oriental Consultants Co., Ltd and
Ides Co., Ltd.
This study, “Study on the New Cebu Container Port and the Redevelopment of the Existing Cebu Port in the
Republic of the Philippines” deals with the issue of a new container terminal development project to cope with the
problems caused by the congestion of the existing Cebu port and the shallow water depth of the Cebu international
container berths. The feasibility to realize the project for construction of the New Cebu Container Port and for
Redevelopment of the Existing Cebu Port are studied to ensure the success of this Project. The total cost of the
project is estimated as Japanese Yen 17.8 billion (equivalent 9.9 billion pesos) including VAT.
We, all members of the Study Team, hope this study will contribute to putting the plan into practice, and will be
gratified if the result helps the relevant government officials understand and drive the Project forward.
February 2012
Oriental Consultants Co., Ltd.
Ides Co., Ltd.

Project Site Map (1)
Manila
Key Plan of Philippines
Cebu Base Port Mactan Island
Location Map
Cebu Island
0 25 50 km
(Source: Study Team)
Project Site Map (2)
Proposed Site of New Port
(Consolacion)
Mactan North Mactan South
Cebu South
Minglanilla
Cebu Baseport
(Source: Study Team)
0 5km 10km

List of Abbreviations Abbreviation Description
AASHTO American Association of State Highway and Transportation Officials
ADB Asian Development Bank
AO Presidential Administration Order
APL American President Lines
ARMM Autonomous Region in Muslim Mindanao
ATI Asian Terminal Incorporation
BLT Build Lease Transfer
BOD Biochemical Oxygen Demand
BOO Build Own Operate
BOT Build Operate Transfer
BTO Build Transfer Operate
BT Build Transfer
CAR Cordillera Administrative
CENRO Community Environment and Natural Resource Office
CFS Container Freight Station
CIA Cebu Integrated Arrastre
CIP Cebu International Port
COD Chemical Oxygen Demand
CPA Cebu Port Authority
CY Container Yard
dB Decibel
DAO Department Administration Order
DENR Department of Environmental and Natural Resources
DMC Department Memorandum Circular
DO Dissolved Oxygen
DOTC Department of Transportation and Communications
DPI Dubai Port International
DPWH Department of Public Works and Highways
DWT Dead Weight Tonnage
ECA Environmentally Critical Area
ECC Environmental Compliance Certificate
EIA Environmental Impact Assessment
EIRR Economic Internal Rate of Return
EIS Environmental Impact Statement
EMB Environmental Management Bureau
EN Exchange of Note
EO Presidential Executive Order
EPRMP Environmental Performance Report and Management Plan
ERIA Economic Research Institute for Asean and East Asia
FIRR Financial Internal Rate of Return
FS Feasibility Study
GDP Gross Domestic Products
GRDP Gross Regional Domestic Products
GRT Gross Registered Tonnage
GWEN Good Roads and Bridges, Water and Electrification Now Program
GWT Gross Weight Ton
HSH High Standard Highway
ICC Investment Coordination Committee
ICTSI International Container Terminal Service Incorporation
IMF International Monetary Fund
IRR Internal Rate of Return
JBIC Japan Bank for International Corporation
JETRO Japan External Trade Organization
JICA Japan International Cooperation Agency
JICA Study The Study on the Cebu Integrated Port Development Plan
LA Loan Agreement
LOA Length of Overall
MC EMB Memorandum Circular
METI Ministry of Economy, Trade and Industry
MICT Manila International Container Terminal
MO Management Office
MO Memorandum Order
MOF Ministry of Finance
MOFA Ministry of Foreign Affairs
MPN Most Probable Number
NCR National Capital Region
NEDA National Economic and Development Authority
NEPC National Environmental Protection Council
NEPC National Environmental Protection Council (Now DENR)
NGO Non-Governmental Organization
NPPD National Plan for Port Development
NPV Net Present Value
ODA Official Development Assistance
OECD Organization for Economic Cooperation and Development
OPASCOR Oriental Port & Allied Services Corporation
Panamax Panama Maximum size
PDP Philippine Development Plan
PD Presidential Decree
PDPFD Provincial Development and Physical Framework Plan
PEISS Philippine Environmental Impact Statement System
PENRO Provincial Environment and Natural Resource Office
PEZA Philippine Economic Zone Authority
PMO Project Management Office
PMO Port Management Office
Post-Panamax Post-Panama Maximum size
PPA Philippine Ports Authority
PPOSS Philippine Port System Strategy
PPP Public Private Partnership
PSA PSA international
PSP Private Sector Participation
QC Quay Gantry Crane
RA Regional Act
RGDP Regional Gross Domestic Products
RORO Roll On / Roll Off
ROO Rehabilitate Own Operate
ROT Rehabilitate Operate Transfer
RRTS Road Ro-Ro Terminal System
RTG Rubber Tire Mounted Gantry Crane
SCMB Subic, Clark, Manila and Batangas Corridor
SER Shadow Exchange Rate
SPS Salala Port Service
STEP Special Term for Economic Partnership
SWR Shadow Wage Rate
TEU Twenty Foot Equivalent Unit
TOS Terminal Operation System
USDI United South Dock Handlers Incorporated
WACC Weighted Average Cost of Capital
WEO World Economic Outlook

Table of Contents
Executive Summary
(1) Background and Necessity of the Project .......................................................................................... 1
(2) Basic Policy Concerning Decisions on Project Content .................................................................... 3
(3) Description of the Project .................................................................................................................. 18
(4) Implementation Schedule ................................................................................................................... 25
(5) Feasibility of Implementation ............................................................................................................ 27
(6) Possible Japanese Firms’ Participation in the Proposed Project ........................................................ 29
(7) Concrete Schedule for Realizing the Project and Risks Inhibiting Its Realization ................................ 30
(8) Project Location Map ......................................................................................................................... 32
Chapter 1 Overview of the Host Country and Sectors
(1) Economic and Financial Conditions of Republic of Philippines ....................................................... 1-1
(2) Overview of Port Sector ..................................................................................................................... 1-3
(3) Present Situation of Cebu Region and Port ........................................................................................ 1-5
Chapter 2 Study Methodology
(1) Contents of the Study ......................................................................................................................... 2-1
(2) Method of Study / Organization ......................................................................................................... 2-4
(3) Schedule of the Study ............................................................................................................................ 2-7
Chapter 3 Justification, Objectives and Technical Feasibility of the Project
3.1 Demand Forecast ............................................................................................................................... 3-1
3.2 Cebu New Port ..................................................................................................................................... 3-9
(1) Background of the Project .................................................................................................................. 3-9
(2) The Study for Determination of the Project Contents ........................................................................ 3-11
(3) Description of the Project .............................................................................................................. 3-17
3.3 Cebu Existing Port ................................................................................................................................. 3-38
(1) Background of the Project .............................................................................................................. 3-38
(2) The Study for Determination of the Project Contents ........................................................................ 3-40
(3) Description of the Project .............................................................................................................. 3-62
3.4 Public-Private Partnership (PPP) of the Project ................................................................................. 3-77
Chapter 4 Evaluation of Environmental and Social Impacts
(1) Environmental and Social Considerations ......................................................................................... 4-1
(2) Environmental Effects Due to Project Implementation ..................................................................... 4-8
(3) Social Impacts of Project Implementation ..................................................................................... 4-12
(4) Governing Laws of the Philippines on Environmental and Social Impacts ....................................... 4-15
(5) Action Plan for the Government of Philippines ................................................................................. 4-19

Chapter 5 Financial and Economic Evaluation
(1) Cost Estimate for New Cebu Container Port and Redevelopment of Existing Port ........................... 5-1
(2) Outline of Preliminary Financial and Economic Analysis ................................................................. 5-7
Chapter 6 Planned Project Schedule
(1) New Cebu Container Terminal ........................................................................................................ 6-1
(2) Cebu Baseport .................................................................................................................................... 6-3
Chapter 7 Implementation Organization
(1) Capability of the Project Implementation by CPA ............................................................................. 7-1
Chapter 8 Technical Advantages of Japanese Companies
(1) Possible Japanese Firms’ Participation in the Proposed Project ........................................................ 8-1
(2) Advantages for Japanese Private Firms on the Project ...................................................................... 8-5
(3) Necessary Measures to Promote Participation of Japanese Firms ..................................................... 8-6
Chapter 9 Financial Outlook
(1) Analysis of Financing Plan ................................................................................................................ 9-1
(2) Possibility and Availability of Funds ............................................................................................. 9-2
(3) Cash Flow Analysis ............................................................................................................................... 9-3
Chapter 10 Action Plan and Issues
(1) Actions of Private Sectors .................................................................................................................. 10-1
(2) Actions of Public Sector .................................................................................................................... 10-5
(3) Legal and Financial Constraints of CPA ............................................................................................ 10-7
(4) Requirement of Additional Detailed Studies ..................................................................................... 10-10

Executive Summary


1
(1) Background and Necessity of the Project
The Study of the development of Cebu Port was started with the JICA report, ”The Study on the Cebu Integrated
Port Development Plan in the Republic of the Philippines” in 2002 In the JICA Study the short-term and
long-term development plans were proposed including preliminary design, cost estimate, economical/financial
analysis and environmental and social impacts assessment.
After the JICA report in 2002, a study on the feasibility of Japan’s ODA loan, which focused particularly on
STEP ODA in 2003, was conducted by the study group which was commissioned by the Ministry of Economy,
Trade and Industry in Japan.
In the study report made by JICA in 2004, “The Study on the Master Plan for the Strategic Development of the
National Port System in the Republic of the Philippines,” PPOSS (Philippine Port System Strategy) worked out a
strategic national port master plan with the target year 2024 and an urgent development plan with the target year
2009. Cebu Port is designated as one of six major national gateway ports (major ports for international container
trade) in this national plan.
In addition, Economic Research Institute for ASEAN and East Asia (ERIA) issued a report in 2010, “The
Comprehensive Asia Development Plan,” in which Cebu Port is also identified as the major port of the Philippines
that needs to be developed urgently.
However, due to a policy change by the proponent of CPA, a proposal for development by a private investor and
no agreement by the local government, development of the New Cebu Port has not materialized.
Ten years have passed since the JICA study in 2002. Nowadays, the congestion has become more serious due to
increasing cargo volume. The congestion of the international and domestic container terminals is remarkable. In
order to handle the increasing container cargo, two quayside gantry cranes installed in 2003 were increased to four
gantry cranes in 2010 and will increase to five gantry cranes in 2012 with seventeen RTGs. For other
cargoesexcept containers, due to the very narrow apron area, congestion during the loading and unloading is much
more serious. Therefore, the efficiency of cargo handling decreases and the safety of port operations will become
an issue.
According to information from the shipping companies, the water depth in front of the wharf is too shallow for
efficient and economical international shipping operation from/to Kaohsiung, Pusan, Hong Kong and Singapore.
They have a lease contract for empty container stocking in the city proper because of the lack of available land in
the terminal. Deepening of the berth to accommodate bigger container ships is very difficult because of the
structure of the berth, pier type with a retaining wall. Expansion of the wharf into the sea is also difficult due to
the narrow strait between Cebu Island and Mactan Island.

2
The Aquino Government started in 2010, announced that national projects should utilize a PPP scheme in order to
reduce the governmental burden by introducing private investment. DOTC follows the same policy and is
examining their handling projects on the practicality of introducing PPP schemes.
In this Study, the past study JICA 2002 is reviewed taking into account the recent economy and port surrounding
conditions. Then, the Project will be renewed applying a PPP scheme, i.e., survey how we can introduce private
investment to the Project considering finance methods and procedures.
On the other hand, the cooperating proponent, Mitsubishi Corporation, intends to participate in the operation of
the new container terminal as one of the Japanese groups considering partnership with Filipino companies and to
confirm the realization of the Project. Another proponent, Nippon Steel Corporation, intends to participate in the
supply and construction of the large steel pipe sheet pile type structure for the New Cebu Port. This Study
examines and evaluates the various procedures for construction of the New Cebu Container Terminal and for port
development and shall provide a proposal with action plans from the viewpoints of the private firms in order to
ensure implementation.

3
(2) Basic Policy Concerning Decisions on Project Content
The Study comprises the following steps:
1) Selection of the Site for the New Cebu Container Port
In the 2002 JICA Report, five candidate sites were proposed as shown in Figure 1. As the PPP scheme is
assumed for this project, the estimated construction cost is used as the most important factor for evaluation of the
site selection even though other factors such as ease of access to the New Port and safe navigation of the ships are
also important. To compare the sites, rough port planning was done to calculate the major volume of quantity such
as dredging, reclamation, container berth and breakwaters to estimate the construction cost. The Consolacion site
is the most economical and recommendable considering evaluation factors as shown in Figure 2. Therefore, the
preliminary design, cost estimate of the Project implementation, and economical and financial analysis were made
based on the Consolacion site.
Figure 1 Candidate Sites of New Cebu Container Port
Consolacion
Mactan North Mactan South
Cebu South
Minglanilla
Cebu Baseport
(Source: JICA Report 2002)

4
Figure 2 Comparison of Construction Cost for Candidate Sites
83%
111%
83%
166%
97%
29%
92%
28%
51%
24%
71%
142%
5%
47%
4%
12%
0% 100% 200% 300% 400%
A1Consolacion
A2Mactan-North
A3Mactan South
A4Cebu-South
A5Minglanilla
Assume 1.0
1.4
2.5
2.7
3.0
Reclamation Dredging
Breakwater
Road
(Source: Study Team)
2) Technical Review
The technical items are studied as mentioned below.
a) Cargo Demand Forecast
- Economic Framework
The Government of the Philippines formulated the basic strategic policy on national economic development
entitled, “The Philippine Development Plan 2011 – 2016.” In this Plan, the Government sets the corresponding
targets of a high economic growth rate of 7 to 8% per year for at least 6 years. On the other hand, considering
growth rate forecast of the International Monetary Fund (IMF), an annual growth rate of 4.9% until 2016 and
5.0% after 2016 has been established in this study as a conservative estimate.
- Cargo Demand
The actual annual growth rate of the total cargo volume was over 3% after 2000 at Cebu Baseport. A high
correlation (coefficient of determination=0.8297) has been observed between total cargo volume and GRDP.
Based on the above growth rate of the economic framework, total cargo volumes are estimated as 16 million tons
and 24 million tons in 2020 and 2030 respectively.
- Forecast by type of trade
Cargo volume of import, export, domestic loading, and domestic unloading are forecasted either through
correlation analysis or elasticity analysis with GRDP. Import growth rate is the biggest among all cargoes from
2010 to 2030 and import cargo will reach 7.9 million MT around 2030, which exceeds the domestic unloading
volume of 7.8 million MT.
- Forecast by Package Type

5
Four package types of bulk cargo, break-bulk cargo, container cargo, and rolling were forecasted. Shares by
package type are set for each trade type taking into account the past achievements and recent development. Thus,
cargo volume by trade type and by package type can be estimated.
- Demand Forecast for International Containers (TEU)
To forecast the future foreign container volume, a correlation analysis between container volume (TEU) and
GRDP of Region VII is implemented. A high correlation between the two variables is confirmed with a
determination coefficient of 94.0%. Resultant foreign container volume is estimated at 343,000 TEU in 2020, and
594,000 TEU in 2030.
Cargo volume by trade type by package type can be estimated as shown in Table 1.
Table 1 Summary of Demand Forecast by Trade Type and by Package Type
(Source: Study Team)
b) Port Planning
- New Cebu Port
Among international container, domestic container, international bulk and international general cargo, the rate of
increase in the international container demand forecast is 5.5% per year and the others are 2.5%. The tariff of
domestic container handling is set at 60 - 70% of the international container value. Therefore, the priority to move
international containers to the New Port is thought to be highest from the viewpoint of financial feasibility for the
private terminal operator.
The timing of opening the New Port should be adjusted to the time the cargo volume of the existing port reaches
Foreign Trade
Container Import Bulk Export Bulk Container Passenger
TEU MT MT TEU Pax
2000 103,944 48,203 14,338 372,268 2,651 299,630 1,366,913 1,494,780 0 0 10,059,048
2001 112,700 70,971 5,542 417,270 2,647 310,845 32,255 2,332 1,741,965 2,251,422 0 0 10,156,654
2002 103,139 53,912 20,000 406,547 2,484 337,370 42,507 6,824 1,696,717 2,611,269 0 0 10,738,198
2003 115,246 73,986 10,027 259,359 3,520 335,092 45,060 9,625 1,913,186 2,143,714 0 0 10,934,435
2004 120,281 60,931 6,000 192,140 31,735 311,282 78,396 99,700 1,852,455 2,255,197 0 0 11,785,915
2005 128,803 44,206 2,000 333,910 21,254 317,317 70,573 37,200 1,740,712 2,146,086 0 0 11,945,178
2006 146,459 75,648 7,800 276,922 30,177 279,442 10,666,071
2007 169,191 42,056 0 350,477 30,100 292,548 10,921,179
2008 157,634 93,287 0 423,989 32,062 295,155 10,321,278
2009 178,879 125,543 0 411,523 8,335 257,469 122,699 71,662 1,780,891 2,421,876 269,250 314,158 9,784,977
2010 202,213 156,373 0 358,674 0 247,295 273,754 194,678 2,030,300 2,303,575 279,634 366,817 10,993,921
2011 202,454 174,708 0 382,455 2,279 278,904 266,807 187,470 2,089,791 2,349,794 291,742 381,172 11,195,1372012 215,129 195,129 0 408,142 4,648 294,434 259,636 180,064 2,153,060 2,398,818 304,562 396,248 11,396,3532013 228,425 217,245 0 434,623 7,109 301,115 251,954 172,295 2,218,174 2,448,861 317,834 411,768 11,597,5682014 242,372 241,163 0 461,922 9,664 307,946 243,739 164,153 2,285,186 2,499,945 331,575 427,745 11,798,7842015 257,003 266,998 0 490,061 12,317 325,429 234,970 155,625 2,354,150 2,552,090 345,798 444,190 12,000,0002016 272,351 294,871 0 519,063 15,070 332,810 225,626 146,700 2,425,122 2,605,319 360,519 461,115 12,000,0002017 288,779 325,344 0 549,681 17,933 340,523 215,787 137,419 2,499,377 2,660,698 375,937 478,721 12,000,0002018 306,029 358,190 0 581,264 20,905 348,414 205,316 127,708 2,575,830 2,717,250 391,900 496,846 12,000,0002019 324,142 393,560 0 613,836 23,988 356,486 194,187 117,554 2,654,543 2,774,999 408,427 515,505 12,000,0002020 343,160 431,616 0 647,424 27,186 364,744 182,372 106,942 2,735,582 2,833,972 425,535 534,712 12,000,0002021 363,128 460,195 0 690,292 27,730 373,863 186,931 109,081 2,803,972 2,890,651 436,173 545,406 12,000,0002022 384,096 490,202 0 735,304 28,285 383,209 191,605 111,263 2,874,071 2,948,464 447,078 556,314 12,000,0002023 406,111 521,710 0 782,566 28,850 392,790 196,395 113,488 2,945,923 3,007,433 458,255 567,440 12,000,0002024 429,228 554,794 0 832,191 29,427 402,609 201,305 115,758 3,019,571 3,067,582 469,711 578,789 12,000,0002025 453,500 589,532 0 884,298 30,016 412,675 206,337 118,073 3,095,060 3,128,934 481,454 590,365 12,000,0002026 478,986 626,006 0 939,010 30,616 422,992 211,496 120,434 3,172,436 3,191,512 493,490 602,172 12,000,0002027 505,746 664,305 0 996,457 31,229 433,566 216,783 122,843 3,251,747 3,255,343 505,827 614,216 12,000,0002028 533,845 704,518 0 1,056,777 31,853 444,405 222,203 125,300 3,333,041 3,320,449 518,473 626,500 12,000,0002029 563,348 746,742 0 1,120,113 32,490 455,516 227,758 127,806 3,416,367 3,386,858 531,435 639,030 12,000,0002030 594,326 791,077 0 1,186,615 33,140 466,904 233,452 130,362 3,501,776 3,454,596 544,721 651,810 12,000,000
Exportbrkbulk (MT)
InboundBrkbulk (MT)
OutboundBrkbulk (MT)
Foreign Trade Year
Domestic Trade Inbound Bulk
(MT)Outbound
Bulk (MT)Inbound
Rolling (MT)Outbound
Rolling (MT)Import
Brkbulk (MT)

6
its full capacity. The handling capacity of the international container terminal of the existing port is estimated as
approximately 300,000 TEU per year. Referring to the result of the demand forecast curve, the time of opening
the New Port is proposed to be the year 2018. The initial capacity of container handling of the New Port is
expected to be 400,000 TEU per year and is scheduled to increase to 500,000 TEU per year by 2023 by installing
additional QCs and RTGs. The demand forecast of international container and New Port development are shown
in Figure 3.
Figure 3 Demand Forecast of International Container and New Port Development
0
100
200
300
400
500
600
700
2000
2005
2010
2015
2020
2025
2030
Year
Thr
ough
put (
1,00
0 T
EU
)
Phase 1 New Port = 400,000TEU
Additional QC/RTG = 500,000TEU
Existing Terminal Capacity = 300,000TEU
ForecastPast Record
2018
2023
Phase 2 Expansion
(Source: Study Team)
The berth length of the New Port is considered as two berths in order to prevent ship-waiting time. With a long
berth one next generation container ship of 3,000 TEU and one present average sized ship of 1,000 TEU can berth
at the same time. Also, the long berth can accommodate two ships of the present maximum size of 2,000 TEU at
the same time as shown Figure 4.
Figure 4 Berth Length of New Port
LOA 240m (3,000 TEU)LOA 150m (1,000TEU)
LOA 180m (2,000TEU)LOA 180m (2,000TEU)
Full Loaded Draft = 12.1mFull Loaded Draft =8.8m
Full Loaded Draft = 11.0m Full Loaded Draft = 11.0m
Future Maximum Size Present Average Size
Presenyt Maximum Size Present Maximum Size
Berth Length 450m
(Source: Study Team)
The location of the reclamation area has been decided to be the area where sea level is around 0.00 m in order to

7
minimize reclamation and dredging volume and the location of the berth to be the area where sea level is around
-13.0 m. The reclamation area is moved 200 m to the south from the JICA study. The reclamation area is located
approximately 250 m from the shoreline so that the mangrove plants can be saved by water exchange through tide
flow. The access road is planned to be an elevated bridge-way for the same reason. The layout plan of New Cebu
Port is shown in Figure 5.
Figure 5 Layout Plan of Phase 1 Development (New Port)
(Source: Study Team)
The container terminal layout is planned with consideration of the maximum handling capacity of 500,000 TEU
containers. Four gantry cranes (initially three) with a capacity of 15 container rows, a 450 m long berth, a terminal
area, and a back yard for port operation facilities have been studied as shown Figure 6.
Cebu North Coastal Road is one of the major development projects of the DPWH in the Metro Cebu area to
develop Cebu province. A length of 1.39 km out of 6 km of Cebu North Coastal Road was completed in 2009 by
DPWH. The new access road of the New Cebu Container Port will be connected to Cebu North Coastal Road.
Two traffic lanes are required for each direction based on the traffic forecast and an elevated bridge-way on the
shoreline and a cutting mound type road near Cebu North Coastal Road has been designed. A trumpet type
interchange near Cebu North Coastal Road will be constructed by DPWH. The terminal layout and bird’s eye
view are shown in Figures 6 and 7.
Turning Basin
Reclamation 350m x 600m
Berth Length 450m

8
Figure 6 Terminal Layout Plan of New Cebu Port
(Source: Study Team)
Figure 7 Bird’s Eye View of New Cebu Port
(Source: Study Team)

9
- Cebu Baseport
A study must be done on reorganizing the existing port functions after shifting the international container terminal
from the existing port to the New Port. In addition, in redevelopment of the existing port, it is also important to
establish a safe and convenient port station and to create commercial space closely related to the people’s life
activities.
The background and necessity of the redevelopment Project are explained from following points:
- CPA has to reshuffle the layout of the existing port based on the future port demand forecast.
- Income from the international container terminal will vanish for the existing port. It is considered that the
Project is a financially closed unit in which the financial aspects of the New Port are separate from those of
the existing port. In order to raise the feasibility of the Project, cost saving and introduction of alternative
income sources will be required.
- It has been observed that the high risk of accidents in the cargo handling operation and passenger traffic is
mainly due to the narrowness of the cargo yard in the vicinity of the quay-wall. It is essential that CPA ensure
improvement of the safety.
- The guarantee of a safe and comfortable trip is important for passengers who use the port to depart to / arrive
from Manila, Mindanao, etc. using a ferry or RORO.
- To improve the financial status of regional citizens, a strategy must be developed where the port, as a center
of commercial activities, will activate the economy. The PPP policy introducing private finance for
development is based on this activation of the economy.
- Taking advantage of the location close to the urban core of Cebu, a part of the Cebu Baseport area will be
redeveloped for commercial and business use. Thereby, a combination of town and open space is created and
will contribute to the promotion of redevelopment in the urban core.
The Present Conditions of the Existing Port
In order to clarify the present condition of the existing port, the berthing time of each berth, berth occupancy ratio,
cargo operation (in and out), yard operation, handling capacity, etc. should be observed and analyzed. One of the
most important factors in port planning is the berth occupancy ratio, which is shown in Figure 8 for international
container and bulk berth.

10
Figure 8 Berth Occupancy Ratio of International Terminal
14%20%23%
8%57%
13%5%
23%
8%
0%
10%
20%
30%
40%
50%
60%
70%
80%
90%
100%
B2(L=130.5m)
B3(L=128.0m)
B4(L=128.0m)
B5(L=128.5m)
Berth No.
Ber
th O
ccup
ancy
Others
Rice
Container67%
54%
25% 27%
(Source: Study Team)
Port Planning of the Existing Port
The basic plan of the Project is as follows:
- International container terminal will be moved to the New Port according to the increase in port demand
(scheduled by 2018).
- Evaluate whether the capacity of the existing port is adequate or not before opening of the New Port.
- After commencement of operation of the New Port, study is required on facility investment of the existing
port as the short-term development plan 2020.
- Minimum required development on the existing port should be recommended. A PPP scheme should be
introduced on redevelopment by leasing the CPA owned port land so that the gained income will complement
the budget of the existing port.
- For the middle-term development plan targeted in 2030, some port functions should be relocated section by
section to the New Port when the capacity of the existing port is saturated.
- For the further long-term plan after 2030, only the passenger terminal should remain at the existing port and
all cargo functions should be moved to the New Port.
Degrees of Congestion of International Terminal
The international terminal handles both container and bulk / general cargo and it is not easy to evaluate congestion
separating these functions. Therefore, it is assumed that all international cargoes will be handled at the berths B2 -
B5 (4 berths, 515 m long) by 2018 as discussed. The limit capacity of the berth occupancy is assumed at 65%. The
following figures show the curve of demand for international container and international bulk/general cargo

11
calculated by the commodity-wise demand forecast.
Figure 9 Demand Forecast of International Container and Rate of Increase from Present Year 2011
International Container (TEU)
306
343
594
202
0
100
200
300
400
500
600
700
2000
2005
2010
2015
2020
2025
2030
Year
Thr
ough
put (
1,00
0 T
EU
)
51% Increase
70% Increase
(Source: Study Team)
Figure 10 Demand Forecast of Bulk / General Cargo and Rate of Increase from Present Year 2011
Import/Export Bulk (MT)
960
559
1,106
0
500
1,000
1,500
2,000
2,500
2000
2005
2010
2015
2020
2025
2030
Year
Thr
ough
put (
1,00
0MT
)
72% Increase
98% Increase
(Source: Study Team)
From these figures, international containers are estimated to increase 51% over the present throughput volume,
while international bulk / general cargo will increase 72% by 2018. On the other hand, the current berth
occupancy ratios of international container and bulk / general cargo berths (B2 - B5) are estimated at 15%
(container) and 29% (bulk / general). From this information, berth occupancy before New Port opening (2018) is
calculated as shown in Figure 11. It is foreseen that the occupancy ratio will increase to 71% (B2 - B5 total),
which will nearly reach the maximum capacity.

12
Figure 11 Forecast of Berth Occupancy Ratio before Opening New Port (2018)
BerthOccupancyContainer
BerthOccupancy
Bulk/Brkbulk
Total BerthOccupancy
At present 2011 15% 29% 43%
2018年 22% 49% 71%
51% Increase 72% Increase
(Source: Study Team)
The same calculations were made for other domestic containers, bulk, general cargoes and passengers to prepare
the short-term development plan in 2020.
The Suitable Location of Commercial and Public Spaces for Development
The location of commercial development sites by private sectors or public space sites such as a parks, etc. at Cebu
Baseport, is considered from the following viewpoints:
- Requirement of facilities and equipment as renewal port
- Appropriate location, function and scale as a commercial/public area in consideration of surrounding land
use and the city master plan
- Circulation of port-related traffic and other traffic
- Intention of redevelopment by private landowners in the port zone
- Private developer’s view on redevelopment
- Profitability of CPA land by sale or lease.
Regarding the location of the commercial development sites or public sites at Cebu Baseport, the following three
places are assumed as proposed sites with the Existing International Container Port area recommended as the most
feasible space.
- Existing International Container Port area
- Existing private lots in Port area
- The area around Fort San Pedro

13
Figure 12 Proposed Sites for Commercial Development or Public Space
Sites proposed for
(Source: Study Team)
Based on the above study, the Redevelopment Plan of the Baseport and Bird’s Eye View are shown Figures 13
and 14.
Figure 13 Redevelopment Plan of Cebu Baseport (2020)
Sky-Walk for Passenger
Superferry
Port Commercial Center
Bulk/General
Container Yard
Parking Parking
International Bulk/General
Domestic Container
Passenger
DomesticFerry/RORO/General
Commercial Development
Convert Terminal (Pier 1 & 3) Passenger → General Cargo
(Source: Study Team)
Site for Commercial or Public Spaces

14
Figure 14 Bird’s Eye View of Cebu Baseport (2020)
(Source: Study Team)
Port Plan 2030
The proposed port layout plan for 2030 is shown in Figure 15. In this plan, parts of port functions are moved to
the New Port when the capacities of each function are saturated due to an increase in demand. According to the
demand forecast study, initially, congestion of the international bulk / general cargo terminal will become serious
followed by the domestic container terminal. The proposed plan is dependent on these port functions (part of the
international bulk / general and the entire domestic container will be moved to New Port) being moved from the
existing port.

15
Figure 15 Proposed Layout Plan of Existing Port 2030
International Bulk/General
Passenger
Domestic Ferry/RORO/General
Commercial Development
Sky-Walk for Passenger
Superferry
Port Commercial Center
Bulk/General
Parking Parking
(Source: Study Team)
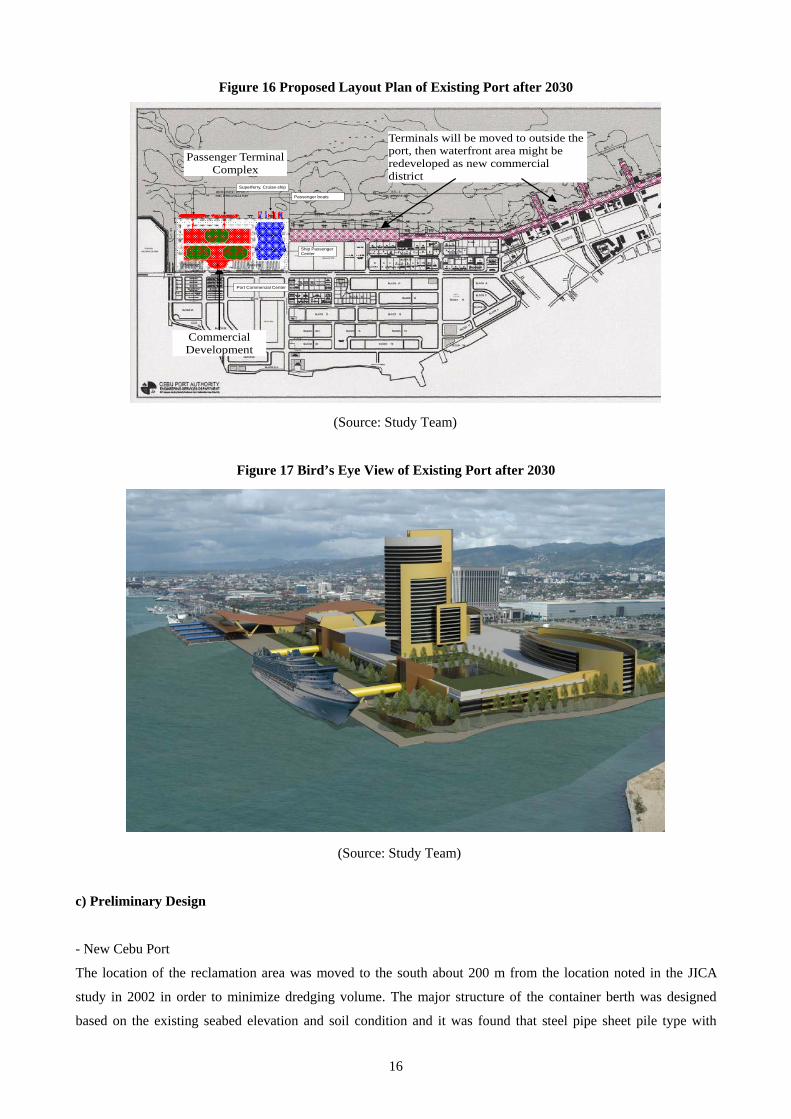
Port Plan after 2030
The proposed port layout plan after 2030 is shown in Figure 16. Port related parties have suggested that most of
the cargo terminals should eventually be moved to the newly developed port outside the downtown area of the city
in view of the social environment as well as the safety and efficiency of port operation as the present port space is
quite narrow. This study follows the same concept; thus, the plans of 2020 and 2030 represent the vision in the
process of this final port development strategy. Bird’s Eye View is shown in Figure 17.
16
Figure 16 Proposed Layout Plan of Existing Port after 2030
Terminals will be moved to outside the port, then waterfront area might be redeveloped as new commercial district
Commercial Development
Ship PassengerCenter
Passenger boats
Superferry, Cruise-ship
Port Commercial Center
Parking Parking
Passenger Terminal Complex
(Source: Study Team)
Figure 17 Bird’s Eye View of Existing Port after 2030
(Source: Study Team)
c) Preliminary Design
- New Cebu Port
The location of the reclamation area was moved to the south about 200 m from the location noted in the JICA
study in 2002 in order to minimize dredging volume. The major structure of the container berth was designed
based on the existing seabed elevation and soil condition and it was found that steel pipe sheet pile type with

17
anchor pile is the most economical and suitable for the new container port. Two traffic lanes are required for each
direction based on the traffic forecast and a bridge type superstructure in the coastline area and a cutting mound
type road near Cebu North Coastal Road is recommended. The typical substructure type will be multi-column
with a pier-head type pier and a bored pile foundation. The column section will be a circular shape, especially in
the seashore area, to minimize the streaming inhibition because it is the most economical and widely used in the
Philippines.
- Existing Cebu Port
For the structural type of pontoons, several options are available such as steel, fiberglass, concrete or
hybrid-concrete, etc. Considering the cost, durability, ease of local procurement and construction capabilities,
concrete type pontoons are proposed. For the foundation of the building, precast concrete piles are proposed
because they have good durability, low cost and are easy to procure in the local market. The structure of the
building is to be made of RC beam and slab.
d) Construction Cost
The Project cost estimated for the construction of New Cebu Port and the redevelopment of Existing Cebu Port
separately. The Project cost consists of civil work, building, utilities, container handling equipment, detailed
engineering cost, construction supervision cost, right of way acquisition cost and administration cost. Based on the
plan of New Cebu Port (Figure 6) and the redevelopment plan of Existing Cebu Port (Figure 13), rough quantities
were calculated for the facilities and estimated the cost. Cost of right of way for the access road is estimated using
the current price of the public works.
e) Environmental and Social Impacts
For the assessment of environmental issues, dredged materials from the New Cebu Port will be disposed in the
deep sea. In order to mitigate seawater contamination, a silt protector should be provided during the disposal of
the dredged material. There is small area of mangrove trees in the proposed site. It is assured that the number of
new mangrove trees that are planted will exceed the numbers that are cut down during the construction as
instructed by DENR.
3) Justification of the Project
The justification of the Project is evaluated by studying the following items.
a) Study of Investment Demarcation between Public and Private
In general, in the Philippines, fundamental facilities are the responsibility of the public while operation is the
responsibility of private companies. Firstly, construction costs, which should be kept as low as possible,
reclamation costs, which need an application to the central government for approval, berth cost and pavement

18
costs, which are relatively high, should be burdened by the public. Private institutions should shoulder the over
investments and expenditures as much as possible. Whether funds for facilities are to be provided by public or
private sectors, should be studied through pattern analysis.
b) Implementation Schedule
Based on the above demarcation, the implementation schedule is verified by each demarcation and reviewed for
expected completion and commencement of operation based on the demand forecast.
c) Evaluation of Finance
The possibilities to realize the both project for construction are studied including the case study of the facilities to
be shouldered by public or private.
d) Contributed Economic Effectiveness
The contribution to economic effectiveness is considered and verified in the cases with execution and without
execution.
4) Proposal toward Implementation of the Project
The proposals of the Study Team are compiled based on the above verifications.
a) Appropriate Demarcation of Public/Private Investments in View of Commencement of Operation and
Profitability
The timing of commencement and appropriate demarcation is proposed in consideration of the implementation
schedule and financial evaluation.
b) Utilization of Japan ODA Finance Program
The amount and investment objectives are proposed for the Japan ODA.

19
(3) Description of the Project
New Cebu Container Port will be constructed to cope with the congestion of the existing Cebu port and the
shallow water depth of the container berths. The redevelopment of the existing Cebu port will be implemented
including vacant area of the container terminal. The component of the new Cebu port is to construct international
container berths, container terminal and port related facilities and existing port is to construct expansion of berth,
floating passenger berths, domestic container terminal and passenger terminal.
1) Implementation Project Cost
The Project cost has been estimated for the New Cebu Port and the redevelopment of the existing Baseport.
The Project cost consists of civil work, building, utilities, container handling equipment, detailed engineering cost,
construction supervision cost, ROW acquisition cost, and administration cost.
a) Implementation Cost of New Cebu Port
Table 2 New Cebu Port
(Unit : 1,000 Peso)
LocalComponent
ForeignComponent
Total
1 Civil works for container terminal 1,024,195 2,302,518 3,326,713
2 Port Facilities 129,286 213,243 342,530
3 Building works 48,909 83,453 132,362
4 Access Road 129,827 241,107 370,934
5 Vessel traffic management system 1,637 128,748 130,385
6 Cargo handling equipment 269,103 2,421,926 2,691,029 Operator supply
7 Others 30,975 - 30,975
Total construction cost (1000 peso) 1,633,932 5,390,995 7,024,927
8 Consulting cost (Engineering cost) 147,523 344,221 491,745
1,781,455 5,735,217 7,516,672
Indirect cost
9 Admi & Eng. Overhead by PMO 105,374 - 105,374
10Duties / tariff (3% of equipment &material) by CPA 21,075 - 21,075
11 Duties / tariff by operator 52,687 - 52,687
12 Contingency 105,374 245,872 351,246
13 VAT (12% of total cost) by CPA 842,991 - 842,991
14 VAT by private operator 231,823 - 231,823
1,359,323 245,872 1,605,196
Grand total (1000 peso) 3,140,779 5,981,089 9,121,868 Total 16.42 bil. Yen
(Exchange rate : 1 Peso=1.8 Yen, 1$=42.8 pesos)
Total (9 to 14)
Total (1 to 8)
RemarksItem Description
(Source: Study Team)

20
b) Existing Baseport
Table 3 Existing Baseport
(Unit : 1,000 Peso)
Local Component Foreign Component Total
1 Berth Expansion(Width 10m) 36,980 147,920 184,900 2 Floating Bert (Pontoon) 39,527 158,108 197,635 3 Container Yard 11,479 17,218 28,697 4 Terminal Building 53,853 80,780 134,633 5 Demolition of Existing Terminal Bldgs 1,238 310 1,548 6 Others 7,786 21,163 28,949
Total (1000 peso) 150,863 425,499 576,362 8 Consultancy Service (Engineering Cost 17,291 40,345 57,636
168,154 465,844 633,998 Indirect Cost
9Administrative & EngineeringOverhead by PMO 8,645 - 8,645
10Duties/Tariff (3% of Equipment &Materials) by CPA 865 - 865
11 Duties/Tariff by CPA 2,161 - 2,161 12 Contingency Cost 8,645 20,173 28,818 13 VAT (12% of Total Cost ) by CPA 69,163 - 69,163 14 VAT by Private Operator 9,510 - 9,510
99,000 20,200 119,162 Grand Total (1000 peso) 267,154 486,044 753,160 Total 1.36 bil. Yen
(Exchange rate : 1 Peso=1.8 Yen, 1$=42.8 pesos)
Item Description Remarks
Total (9 to 14)
Total (1 to 8)
(Source: Study Team)
2) Outline of Preliminary Financial and Economic Analysis
a) Cebu New Port
a)-1 Financial Evaluation of the Project
- FIRR (Base Case): Overall Project 8.98%, CPA 4.34%, Operator 18.01%
- Sensitivity Analysis
Sensitivity analysis was carried out for a total of 6 cases: cost increase (Case I), revenue decrease (Case II), and
both cost increase and revenue decrease (Case III). In the case of 10% cost and revenue variance for the Overall
Project, the FIRR are 7.62% (Case I), 7.48% (Case II), and 6.13% (Case III) as shown below.

21
Table 4 Financial Evaluation of the Project
Overall Project CPA Operator Overall Project CPA Operator7.62% 3.51% 15.61% 6.39% 2.76% 13.48%
Overall Project CPA Operator Overall Project CPA Operator7.48% 3.42% 15.36% 5.81% 2.41% 12.48%
Overall Project CPA Operator Overall Project CPA Operator6.13% 2.60% 13.03% 3.16% N.A 7.98%
Case IIICost Increase & Revenue Decrease By 10% Cost Increase & Revenue Decrease By 20%
Case ICost Increase By 10% Cost Increase By 20%
Case IIRevenue Decrease By 10% Revenue Decrease By 20%
(Source: Study Team)
Assuming a Weighted Average Cost of Capital (WACC) of 2.16% for CPA and 6.43% for TO, both of which are
derived from financial plans, the resulting NPVs are PHP 2,087 million and PHP 3,366 million, respectively.
Further, B/C Ratios are 1.29 for CPA and 1.59 for TO under the same discount rates.
a)-2 Economic Evaluation
- EIRR (Base Case): 20.02%
- Sensitivity Analysis
As shown in the table below, the New Cebu Port Project has an EIRR of more than 15% for all of the cases in the
sensitivity analysis except for the worst scenario case.
Table 5 Economic Evaluation of the Project
Cost Increase By 10% Cost Increase By 20%18.03% 16.32%
Benefit Decreases By 10% Benefit Decreases By 20%17.82% 15.55%
Cost Increase & Benefit Decrease By 10% Each Cost Increase & Benefit Decrease By 20% Each15.97% 12.36%
Case I
Case II
Case III
(Source: Study Team)
Assuming the social discount rate of 15%, the Benefit Cost ratio (B/C) for the Base Case is 1.29. On the other
hand, the NPV of the Project is calculated at PHP 1,860 million.
b) Cebu Baseport
b)-1 Financial Evaluation of the Project
- FIRR (Base Case): 5.81%
- Sensitivity Analysis

22
Sensitivity analysis was carried out for the same 6 cases as the financial evaluation. In the case of a 10% cost and
revenue variance for the Project, FIRRs are 4.86% (Case I), 4.76% (Case II), and 3.81% (Case III) as shown
below.
Table 6 Financial Evaluation of the Project
Case IIICost Increase & Revenue Decrease By 10% Cost Increase & Revenue Decrease By 20%
3.81% N.A
Case IIRevenue Decrease By 10% Revenue Decrease By 20%
4.76% 3.59%
Case ICost Increase By 10% Cost Increase By 20%
4.86% 4.00%
(Source: Study Team)
Assuming the WACC is 7.0%, the NPV of the Cebu Baseport Project is calculated at PHP -85 million and the B/C
ratio is 0.89.
b)-2 Economic Evaluation of the Project
EIRR (Base Case): 20.97%
Sensitivity Analysis
As shown in the table below, the Cebu Baseport Project has an EIRR of more than 15% for all of the cases in the
sensitivity analysis except for the worst scenario case.
Table 7 Economic Evaluation of the Project
(Source: Study Team)
Assuming the social discount rate of 15%, the Benefit Cost ratio (B/C) for the Base Case is 1.24. On the other
hand, the NPV of the Project is calculated at PHP 105 million.
In general, the New Cebu Port Project has both high FIRR and EIRR values except for the worst scenario case in
the sensitivity analysis. On the other hand, there is a possibility that the FIRR of the Cebu Baseport Project is less
than the WACC of the Project while the EIRR of the Project is expected to be higher than 20%. It should be noted
however, the FIRR of the Baseport Project will improve and the financial problems mentioned above will be
resolved if the CPA plot is sold instead of leased or if a project fund with lower interest is secured through ODA
assistance. Taking these circumstances into consideration, both Projects can be judged to be sound and feasible.
Case ICost Increase By 10% Cost Increase By 20%
19.18% 17.65%
16.96%
Cost Increase & Revenue Decrease By 20%
14.09%
Benefits Decrease By 20%
19.00%Case II
Benefits Decrease By 10%
Case IIICost Increase & Revenue Decrease By 10%
17.34%

23
3) Evaluation of Environmental and Social Impacts
3)-1 General
This Study focuses on the environmental and social impacts in the area of the New Cebu Port about 10 km north
of the existing Baseport and the redevelopment area in the existing Baseport.
- Seawater Quality
Dissolved oxygen content and chemical oxygen level are much higher than the DENR limits. The levels of
cadmium in the New Port and arsenic at the Cebu Port site are critical. Other heavy metals are below the DENR
limits but excessive levels of total coliform and fecal coliform, both indicators of pollution from anthropogenic
sources, were observed to be very high in the New Port and existing Baseport.
- Sea Bottom Sediment Quality
Lead pollution in Baseport and New Port is significantly higher at ten times the Japan limit. Other heavy metals
are below the DENR limits. The chemical oxygen level is far higher than the DENR limits in both ports.
- Air and Noise
All levels of air quality parameters fall below the maximum limits set by DENR. This indicates relatively good air
quality at these sites.
- Marine Ecology
In the existing Baseport, the absence of marine vegetation and macrobenthos, which fish feed on, and regular
dredging in the harbor limit the survival of fishes in the area. The mangroves along the shoreline near the New
Port site showed the characteristic features of the substrate in the study area. Corals and associated macrobenthos
were observed near the Baseport site. The sea grasses provide nutrients for juvenile fishes and other marine
organisms in the area. No rare, threatened or endangered species of algae have been encountered.
Magnitude of development is as follows:
- New Port : 23 ha reclamation, 450 m berth, 16,000 m³ dredging and 600 m access road
- Baseport : 270 m pontoon, 4,800 m² passenger terminal, 4,000 m² yard, 8.5 ha business center by PPP.
3) -2 Positive Environmental and Social Impacts of the Project
With implementation of the New Cebu Port and redevelopment of Cebu Baseport, environmental improvement
around the Project site is expected as follows:
- By construction of the New Cebu Port, larger-sized vessels with emission control systems can use the port.
Reduction of CO₂ emission per TEU is expected. Due to construction of the New Cebu Port, the access
distance from Mactan Island will be shortened and the congestion around the existing Baseport will thus be
reduced.
- With construction of the New Cebu Port and redevelopment of the Baseport, cargo volumes will increase and
industrial/regional development in the hinterland and surrounding areas will follow. An increase in job
opportunities and local economic development is expected.

24
3)-3 Negative Environmental and Social Impacts of the Project
All impacts on the environment and society are relatively good at both sites.
The remarkable environmental and social impacts for the both sites are indicated below;
New Cebu Port
Land acquisition for the new access road before the construction of new port may cause a rise in land prices in
Consolacion, but considering the acquired land is small area and not located in the center of Consolacion, the
impact to the land price will be limited compared with the common national road construction.
A negative impact on marginal fishing is irreversible, but minimal in magnitude because the few who catch fish
nearby only get a small quantity of small-sized anchovies and small roundscads.
Operation-phase impacts of the Project will mainly be positive and highly probable, i.e., increased land values,
improved opportunities for livelihood, employment and income, economy and growth, enhanced port productivity,
efficiency and berth capacity and improved welfare of women and children. All these are reversible and vary in
terms of duration ranging from short to long-term.
Baseport
Operation of constructed facilities is expected to generate mainly positive impacts including: improvement in the
overall CPA efficiency in handling of cargoes and passengers, increase in space for business and recreation,
increased employment and livelihood opportunities, improved CPA financial resources, improvement in workers’
living standards and increased business and tourism activities and importantly.
3)-4 Study of Findings and Action Plan
a) New Cebu Port
- According to DENR, an EIA shall be prepared to apply for ECC because of the New Port.
- Land acquisition for construction of the access road is necessary. Coordination with DPWH and Consolacion
town is necessary to adjust the intersection and transition area to the Cebu North Coastal Road designed by
DPWH.
- EIA should provide legal proof to show its authority to reclaim and develop the New Cebu Port site. This
should be done together with an application for a special land patent from the Land Management Bureau of
DENR and a Presidential Proclamation for reservation of the Project site as a container port zone.
- CPA must consult with DENR Provincial Environment and Natural Resource Office (PENRO) and/or the
Community Environment and Natural Resource Office (CENRO) as well as the Protected Area, Wildlife and
Coastal Zone Management Service of DENR-7 to obtain clearance to acquire and develop the port site.
- CPA must also coordinate with the Philippine Reclamation Authority on its plan to carry out offshore
reclamation of Consolacion town.
- CPA must coordinate with DENR and Philippine Coast Guard Regional Office – Region 7 for confirmation of
designated/approved disposal site for dredged materials during port construction.

25
b) Cebu Baseport
Since the Cebu Baseport involves redevelopment including expansion/modification of the existing port facility,
existing DENR guidelines indicate that the EPRMP document must be prepared by CPA.

26
(4) Implementation Schedule
1) New Cebu Port
After the authorization and approval of the New Cebu container Port by the Philippine government, the following
will be done: the application for a soft loan, employment of the consultant, conduction of detailed design,
preparation of PQ and tender documents, selection of contractor of the civil works and implementation of
construction of the works. It is estimated the period of implementation of detailed design and preparation of tender
documents, construction of civil works and fabrication/installation of container handling equipment are one year,
two and a half years, and one year respectively.
Table 8 Implementation Schedule of New Cebu Port (PPP Scheme)
Month
Container Terminal Development 1 Implementing Public Portion by CPA
(1) Study on New Cebu Container Port by METI 6
(2) Submission and Review of New Cebu Container Port to NEDA by DOTC 3
(3) Preparation of EIA and Obtain ECC by CPA 3
(4) Financial Arrangement and Requests for Project Loan by CPA/DOTC 12
(5) Procurement of Consultants for the engineering study 3
(6) DD - PQ + T/D Preparation by Consultant 12
(7) PQ for procurement of contractor by CPA 3
(8) Tendering for procurement of contractor by CPA 6
(9) Contract negotiation and signing the contract with CPA 3
(10) Construction works 30
1) Dredging works 4
2) Container berth construction 18
3) Revetment construction 12
4) Reclamation works 12
5) Road and pavement construction 15
6) Building works construction 10
7) Utility works construction 12
8) Access road construction 18
2 Procurement of Private Investor (Concessioner)(1) Project Resolution by Government DOTC/CPA
1) Preparation and Submission of PPP Scheme by CPA 3
2) Evaluation and approval by CPA Board 3
(2) Transaction (Procurement ) of Private Investor
1) Document Preparation of PQ and Tender Documents 6
2) PQ process for short list investors for tendering 4
3) Procurement by Tendering 8
4) Contract negotiation and Signing the contract with CPA/DOTC 5
(3) Installation of the Equipment and Auxiliary Facility
1) Engineering study of facilities 3
2) Fabrication and Installation of the Equipment 12
3) Supply and preparatory work of Auxiliary Facility 6
3 Commencement of Operation of Container Terminal
Description of Works 2011 2012 2013 2014 2015 2016 2017 2018
(Source: Study Team)
2) Existing Baseport
After the authorization and approval of the New Cebu container Port by the Philippine government, the following
will be done: application for a soft loan, employment of consultant, conduction of detailed design, preparation of
PQ and tender documents, selection of contractor of the civil works and implementation of construction of the
works. It is estimated the period of implementation of detailed design and preparation of tender documents,
construction of marine works and construction of business/commercial center are eight months, fifteen months
and two years respectively.

27
Table 9 Implementation Schedule of Cebu Baseport (PPP Scheme)
Month
Redevelopment of Baseport1 Implementing Public Portion by CPA
(1) Study on New Cebu Container Port by METI 6
(2) Submission and Review of New Cebu Container Port to NEDA by DOTC 3
(3) Preparation of EIA and Obtain ECC by CPA 3
(4) Financial Arrangement and Requests for Project Loan by CPA/DOTC 12
(5) Procurement of Consultants for the engineering study 3
(6) DD - PQ + T/D Preparation by Consultant 6
(7) PQ for procurement of contractor by CPA 3
(8) Tendering for procurement of contractor by CPA 4
(9) Contract negotiation and signing the contract with CPA 3
(10) Construction works 15
1) Demolision of Bldgs 4
2) Widening of wharf (w=10m) 10
3) Fabrication and instllation of pontoon (45mx15m) 12
4) Yard Construction 4
5) Teminal bldg (3 stories) 10
2 Procurement of Private Investor (Concessioner)(1) Project Resolution by Government DOTC/CPA
1) Preparation and Submission of PPP Scheme by CPA 3
2) Evaluation and approval by CPA Board 3
(2) Transaction (Procurement ) of Private Investor
1) Document Preparation of PQ and Tender Documents 3
2) PQ process for short list investors for tendering 3
3) Procurement by Tendering 4
4) Contract negotiation and Signing the contract with CPA/DOTC 3
(3) Construction of Business and Commercial Center 24
3 Commencement of Operation of Redevelopment Plan of Baseport
Description of Works 2011 2012 20132014 to
20172018 2019 2020 2021
(Source: Study Team)
28
(5) Feasibility of Implementation
The purpose of this section of the report is to evaluate both the Cebu New Port and Baseport Projects from
financial and economic, technological, capability of the project implementation by CPA and advantages for
Japanese private firms.
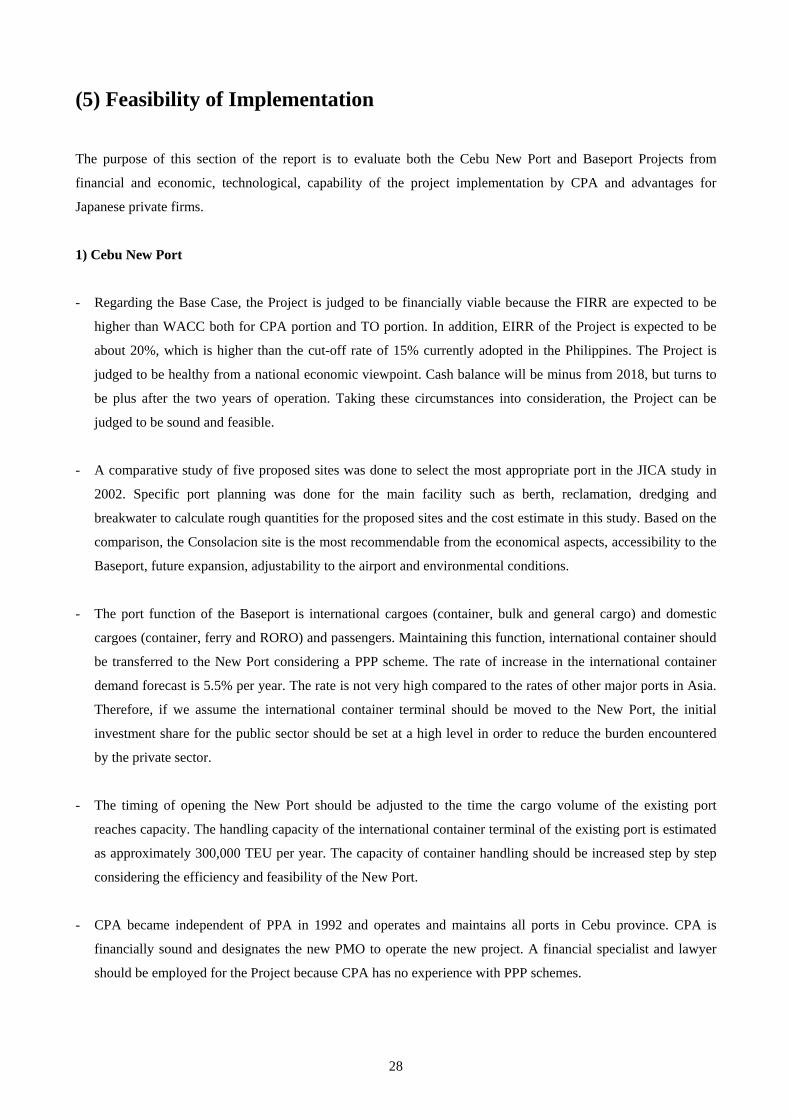
1) Cebu New Port
- Regarding the Base Case, the Project is judged to be financially viable because the FIRR are expected to be
higher than WACC both for CPA portion and TO portion. In addition, EIRR of the Project is expected to be
about 20%, which is higher than the cut-off rate of 15% currently adopted in the Philippines. The Project is
judged to be healthy from a national economic viewpoint. Cash balance will be minus from 2018, but turns to
be plus after the two years of operation. Taking these circumstances into consideration, the Project can be
judged to be sound and feasible.
- A comparative study of five proposed sites was done to select the most appropriate port in the JICA study in
2002. Specific port planning was done for the main facility such as berth, reclamation, dredging and
breakwater to calculate rough quantities for the proposed sites and the cost estimate in this study. Based on the
comparison, the Consolacion site is the most recommendable from the economical aspects, accessibility to the
Baseport, future expansion, adjustability to the airport and environmental conditions.
- The port function of the Baseport is international cargoes (container, bulk and general cargo) and domestic
cargoes (container, ferry and RORO) and passengers. Maintaining this function, international container should
be transferred to the New Port considering a PPP scheme. The rate of increase in the international container
demand forecast is 5.5% per year. The rate is not very high compared to the rates of other major ports in Asia.
Therefore, if we assume the international container terminal should be moved to the New Port, the initial
investment share for the public sector should be set at a high level in order to reduce the burden encountered
by the private sector.
- The timing of opening the New Port should be adjusted to the time the cargo volume of the existing port
reaches capacity. The handling capacity of the international container terminal of the existing port is estimated
as approximately 300,000 TEU per year. The capacity of container handling should be increased step by step
considering the efficiency and feasibility of the New Port.
- CPA became independent of PPA in 1992 and operates and maintains all ports in Cebu province. CPA is
financially sound and designates the new PMO to operate the new project. A financial specialist and lawyer
should be employed for the Project because CPA has no experience with PPP schemes.

29
2) Cebu Baseport
- Regarding the Base Case, FIRR of the Project is estimated at 5.81%, which is less than WACC. The FIRR of
the Project will however, become higher than WACC if a project fund with a lower interest rate such as an
ODA loan and CPA’s retained earning can be used. In addition, EIRR of the Project is expected to be about
20%, which is higher than the cut-off rate of 15% currently adopted in the Philippines. Therefore, the Project is
judged to be healthy from a national economic viewpoint. Cash flow of CPA Re-Development Project was
calculated based on the assumption that CPA will borrow a long-term loan from Treasury Bank. The cash
balance of CPA was minus for almost all of the period, and the minus in cash balance will be accumulated.
Selling or leasing the port land should be considered carefully giving comprehensive consideration for the best
use of the port land.
- Based on the movement of international container to the New Port, Baseport redevelopment should be planned
to use the vacant area of the international container yard for mitigation of the congestion of the port area for
target year 2020. The cargo operation is carried out in a way that the cargo transported from private storage by
trucks is directly loaded onto the ship; therefore, berth occupancy is taken into account quantitatively for the
port planning method.
- Income from the international container terminal will vanish due to the Baseport Redevelopment Project. In
order to raise the feasibility of the Project, cost saving and introduction of alternative income sources will be
required.
- Regarding the port layout of 2030, overflow cargo from the port capacity should be moved to the New Port.
Port related parties have suggested that most of the cargo terminals should eventually be moved to the newly
developed port outside the downtown area of the city.
Taking the variety of elements mentioned above into consideration, both the Cebu New Port and Baseport
Projects are judged to be feasible for implementation from financial, economic, technological, and social and
environmental aspects.

30
(6) Possible Japanese Firms’ Participation in the Proposed Project
1) Cebu New Port
Regarding the participation in the terminal operation, all Japanese operating oversea terminals are efficiently and
satisfactorily managed in Indonesia and Vietnam. As Japanese construction firms and suppliers have also acquired
knowledge in international competitive bidding, there is a high possibility of participation in the construction of
the New Cebu Container Terminal because of their experience in the Philippines.
2) Cebu Baseport
Japanese consulting firms have extensive experience in redevelopment of Japanese ports; therefore, there is an
advantage for Japanese Consulting Firms to participate in the Study for Redevelopment of the Baseport. Japanese
consulting firms have the intension to participate in redevelopment of the large scale business/commercial and
tourist area in the Baseport in 2030.

31
(7) Concrete Schedule for Realizing the Project and Risks Inhibiting
Its Realization
1) Implementation Schedule
The following stages are generally applied for processing PPP scheme projects. The master plan will be
implemented in four (4) stages for the Partnership Project, “Planning of Partnership Projects,” “Preparation of
Feasibility Study of the Partnership Projects,” “Transaction for Partnership Project” and “Management for
Implementation of the Partnership Project.”
Stage1:Planning and Selection of PPP Scheme Project
- CPA will be required to authorize the draft master plan as reviewed and updated by the current Study.
- CPA will identify and select the Project components to be implemented by PPP scheme based on the draft
master plan.
- CPA shall apply for Project resolution by the government and permit the implementation of the proposed
Project by PPP Scheme.
Stage 2:Preparation of full scale Feasibility Study of PPP Scheme Project
- CPA shall review the suggestion, recommendation and proposal of the full scale feasibility study.
- CPA will check and confirm the full scale feasibility study such as assessment, evaluation, the readiness of the
Project implementation, scope and cost of the public and private responsible portions, the financial returns of
the Project by CPA and private concessionaire, traffic demands, and implementing schedule of operation.
- CPA shall conduct the environmental survey by updating the previous EIA study carried out in 2002 under the
JICA study in order to obtain the approval of the EIA from the regional environmental agency.
Step 3: Transaction for Partnership Project (Procurement of private investor, concessionaire)
- CPA shall prepare the documents required for procurements of concessionaire, such as prequalification
documents, tender documents, draft partnership agreement documents, PQ and tender evaluation criteria for
selection of concessionaire in coordination with DOTC, MOF and Agencies responsible for PPP.
- CPA shall prepare the financial arrangement of the Project components responsible by CPA.
- CPA may procure a consultant for the engineering study of the Project and a contractor for the construction
works of the CPA portion.

32
Stage 4:Management for Implementation of Partnership Project
- CPA will prepare a management plan of partnership contract.
- CPA shall report periodically on the results of management activities to the higher authority responsible for the
Partnership Project Responsible agency in the Government of the Philippines.
- Management unit of CPA manages the fulfillment of preliminary requirements by Business Entity and
monitoring in the pre-construction stage as follows:
- Manages the performance of the partnership Project and monitor commercial operation.
- Manage various issues stemming from construction works in the construction stage.
- Conduct asset appraisal and management in the expiration of partnership agreement stage.
2) Risks to be Encountered for PPP Scheme
The types of risks in PPP projects for infrastructure provision are categorized as “political risk,” “project
performance risk” and “demand risk.” The executing agency and its supervisory ministry will be responsible for
checking and supervising the following aspects:
- Evaluation of Project feasibility and prioritization with regard to national development priorities are undertaken
by DOF and NEDA. DOTC and CPA shall prepare all documents carefully and assist DOF and NEDA to
clarify the all issues.
- Political Risk: To provide compensation to an asset owner/business enterprise based on a risk-sharing scheme
between the Government and Business Enterprise.
- Demand Risk: When demand becomes lower revenue than the minimum total revenues guaranteed by the
Government on which the agreement was based, extension of contract and/or other financial compensation may
be granted.
- If there is a delay of land acquisition or increase in land price, CPA will compensate the cost.
- If there is a delay in approval of commencement of commercial operation, delay in tariff adjustment and
changes, there will be an extension of contract and/or other financial compensation.

33
(8) Project Location Map
Figure 18 Location Map of the Project
(Source: Study Team)
Project Location


Chapter 1
Overview of Republic of Philippines and Port Sector


1 - 1
(1) Economic and Financial Conditions of Republic of Philippines
1) Population Changes in Past Years
This section describes the socio-economic conditions in the county and Central Visayas designated as Region
VII. The population in the Philippines was about 19 million in 1948, and it increased to about 88.5 million in
2007 (4.6 times). The annual average rate of population growth has fallen gradually from a peak of 3.08% for
the ten years from 1960 to 1970 to 2.04% from 2000 to 2007.
Table 1-1-1 Population Change in Past Years
Year 1948 1960 1970 1975 1980
Population 19,234,182 27,087,685 36,684,486 42,070,660 48,098,460
Growth Rate (%) 2.89% 3.08% 2.78% 2.71%
Year 1990 1995 2000 2007
Population 60,703,206 68,616,536 76,506,928 88,566,732
Growth Rate (%) 2.35% 2.32% 2.36% 2.04%
(Source: Philippine Statistical Yearbook 2000, 2010)
The population in 1980 in Central Visayas was less than 4 million but increased to about 6.4 million in 2007
(1.69 times) accounting for 7.2% of the Philippine population. The population growth rate of Central Visayas
from 1980 is less than the growth rate of the whole country except for the five years from 1995 to 2000.
Table 1-1-2 Change of Population Growth Rate by Region
Region 1980-1990 1990-1995 1995-2000 2000-2007NCR 2.98% 3.31% 1.06% 2.12%CAR 2.28% 1.71% 1.82% 1.50%Region 1 1.96% 1.30% 2.15% 1.10%Region 2 2.01% 1.52% 2.25% 1.13%Region 3 2.59% 2.13% 3.17% 2.35%Region 4 3.06% 3.55% 3.75% 2.92%Region 5 1.18% 1.91% 1.68% 1.22%Region 6 1.77% 1.30% 1.56% 1.35%Region 7 1.95% 1.66% 2.81% 1.59%Region 8 0.88% 1.84% 1.51% 1.12%Region 9 2.29% 2.75% 2.12% 1.83%Region 10 2.36% 2.44% 1.99% 1.67%Region 11 2.93% 2.17% 2.41% 1.72%Region 12 3.37% 3.25% 2.69% 2.41%Region 13 2.55% 1.82% 1.63% 1.25%ARMM 2.89% 2.46% 3.73% 5.46%Others - 3.66% 0.16% -3.04%Philippines 2.35% 2.32% 2.36% 2.04%
(Source: Philippine Statistical Yearbook 2010)
1 - 2
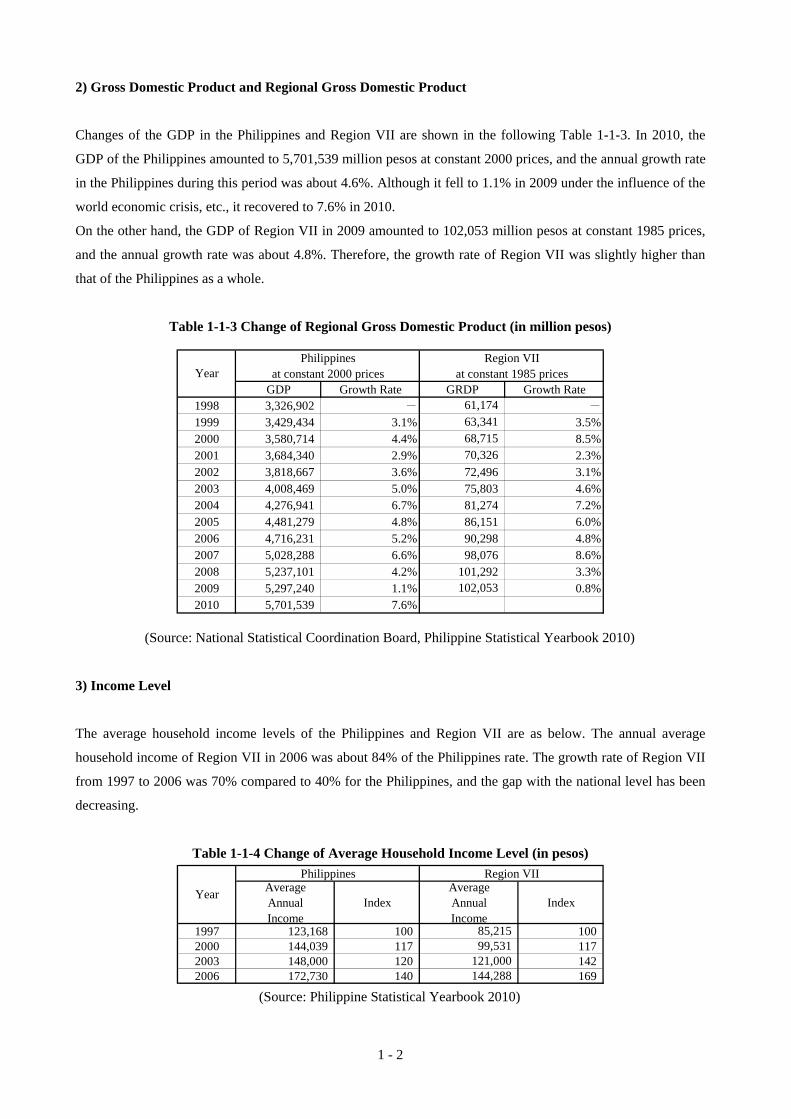
2) Gross Domestic Product and Regional Gross Domestic Product
Changes of the GDP in the Philippines and Region VII are shown in the following Table 1-1-3. In 2010, the
GDP of the Philippines amounted to 5,701,539 million pesos at constant 2000 prices, and the annual growth rate
in the Philippines during this period was about 4.6%. Although it fell to 1.1% in 2009 under the influence of the
world economic crisis, etc., it recovered to 7.6% in 2010.
On the other hand, the GDP of Region VII in 2009 amounted to 102,053 million pesos at constant 1985 prices,
and the annual growth rate was about 4.8%. Therefore, the growth rate of Region VII was slightly higher than
that of the Philippines as a whole.
Table 1-1-3 Change of Regional Gross Domestic Product (in million pesos)
Philippines Region VIIat constant 2000 prices at constant 1985 prices
GDP Growth Rate GRDP Growth Rate1998 3,326,902 - 61,174 -
1999 3,429,434 3.1% 63,341 3.5%2000 3,580,714 4.4% 68,715 8.5%2001 3,684,340 2.9% 70,326 2.3%2002 3,818,667 3.6% 72,496 3.1%2003 4,008,469 5.0% 75,803 4.6%2004 4,276,941 6.7% 81,274 7.2%2005 4,481,279 4.8% 86,151 6.0%2006 4,716,231 5.2% 90,298 4.8%2007 5,028,288 6.6% 98,076 8.6%2008 5,237,101 4.2% 101,292 3.3%2009 5,297,240 1.1% 102,053 0.8%2010 5,701,539 7.6%
Year
(Source: National Statistical Coordination Board, Philippine Statistical Yearbook 2010)
3) Income Level
The average household income levels of the Philippines and Region VII are as below. The annual average
household income of Region VII in 2006 was about 84% of the Philippines rate. The growth rate of Region VII
from 1997 to 2006 was 70% compared to 40% for the Philippines, and the gap with the national level has been
decreasing.
Table 1-1-4 Change of Average Household Income Level (in pesos)
Philippines Region VIIAverageAnnualIncome
IndexAverageAnnualIncome
Index
1997 123,168 100 85,215 1002000 144,039 117 99,531 1172003 148,000 120 121,000 1422006 172,730 140 144,288 169
Year
(Source: Philippine Statistical Yearbook 2010)

1 - 3
(2) Overview of Port Sector
1) DOTC, PPA and CPA
There are over 1,300 ports at present in the Philippines. Ports in the Philippines are classified into public ports
built and managed by public sectors and private ports built and managed by private sectors. In principle, all
ports are under the control of PPA (Philippine Ports Authority) and CPA (Cebu Port Authority) which means
the port authority can check and control all ports including private ports in this region from the viewpoint of
regional development and efficient port function arrangement.
The CPA was created through R.A. 7621 in 1992 to administer all ports located in Cebu province, effectively
separating them from the PPA system. CPA began operations and took over all Cebu ports on 01 January 1996,
15 years ago.
Both port authorities are under the supervision of the Department of Transportation & Communications
(DOTC) for purposes of policy coordination. There are no other port authorities in the Philippines at present.
2) PPA Port System
There are 122 ports in the PPA port system designated by the Management-Executive Committee of the PPA.
These ports consist of 19 Baseports, which function as hub ports both in foreign and domestic trade, and 103
Terminal Ports. There are Port Management Offices at each Baseport, and Terminal Offices at each Terminal
Port.
3) CPA Port System
There are 113 ports at present in Cebu province under control of CPA. These ports are classified into two main
groups: Government ports and Private ports. Government ports consist of 10 Primary Ports, which include Cebu
Baseport and 32 Secondary Ports. Government ports are owned by CPA except for a few municipal ports which
are funded by municipalities. CPA is basically responsible for the maintenance of these ports. The main office is
at Cebu Baseport and there are 4 branch offices at Toledo, Danao, Santa Fe and Argao. Private Marine Facilities
consist of Private Ports (52), Shipyards/Drydocks (14), Fish Ports (3) and a Marina (1).
4) Small Ports under PMO-DOTC
For small ports, the following decisions were made according to the approval of the NEDA Board, which was
convened in September 1990.
DOTC shall coordinate the programming and implementation of future municipal / tertiary / feeder port projects
1 - 4
while actual implementation and maintenance of these projects shall be devolved to the local government unit,
with DOTC providing technical supervision and engineering design standards. Actual construction and
rehabilitation of these ports is carried out by Project Management Service of DOTC at the national government's
expense, while maintenance and operation is carried out by local governments. However, local governments do
not have enough funds or technical skill at present.
5) Functions and Organization of the DOTC
The Department of Transportation and Communications is responsible for the maintenance and expansion of
viable, efficient and dependable transportation and communications systems as effective instruments for
national recovery and economic progress. It exercises general supervision over air, land and water transportation,
postal service and telecommunications.
The Water Transportation Planning & Project Development Division of Transportation Planning Service is in
charge of port related activities. The main functions of the Water Transportation Planning & Project
Development Division are as follows:
a) Coordinates with Marine Industry Authority and the Ports Authority with regards to the plans and programs
for the development of water transportation to draw up the integrated maritime transportation master plan for the
country;
b) Identifies and / or rationalizes water transportation needs and facilities in the country including maritime
navigational facilities;
c) Maintains liaison with other government and private offices / organizations related to water transportation
particularly the local shipping firms to know their requirements and needs with regards to safety at the ports and
waterways;
d) Performs such other functions as may be assigned from time to time.

1 - 5
(3) Present Situation of Cebu Region and Port
1) Population Changes in Past Years
Metro Cebu, which consists of seven cities and six municipalities, had a population of 2.31 million in 2007, and
accounts for 36.2% of the Region VII population. The annual average rate of population growth is gradually
falling and was 2.54% from 2000 to 2007 in comparison with 1995 to 2000. However, it has exceeded the
1.49% of Region VII and 2.04% of the Philippines as a whole.
Table 1-3-1 Change of Population Growth Rate of Metro Cebu
Population Annual Population Growth Rate1995 2000 2007 1995-2000 2000-2007 1995-2007
City of Carcar 78,726 89,199 100,632 2.71% 1.68% 2.08%Cebu City 662,299 718,821 798,809 1.77% 1.47% 1.59%Danao City 79,932 98,781 109,354 4.64% 1.41% 2.66%Lapu‐lapu City 173,744 217,019 292,530 4.88% 4.20% 4.47%Mandaue City 194,745 259,728 318,575 6.36% 2.86% 4.22%City of Naga 69,010 80,189 95,163 3.27% 2.39% 2.73%City of Talisay 120,292 148,110 179,359 4.56% 2.68% 3.41%Compostela 26,499 31,446 39,167 3.74% 3.07% 3.33%Consolacion 49,205 62,298 87,544 5.19% 4.80% 4.95%Cordova 26,613 34,032 45,066 5.41% 3.95% 4.52%Liloan 50,973 64,970 92,181 5.34% 4.94% 5.10%Minglanilla 62,523 77,268 101,585 4.64% 3.85% 4.16%San Fernando 38,700 48,235 54,932 4.83% 1.81% 2.98%Total 1,633,261 1,930,096 2,314,897 3.64% 2.54% 2.97%
(Source: Philippine Statistical Yearbook 2010)
2) Economic Zones
According to the Philippine Economic Zone Authority (PEZA) website, as of August 2011, the number of
operating economic zones in the Province of Cebu is 30 (12% of 248 operating economic zones in the
Philippines), and those being developed in the Province of Cebu is 13 (13% of 100 economic zones being
developed in the Philippines) (Table 1-3-2). The number of companies that have moved into the economic zones
under operation is 385 in total, and the number of companies that have moved into the major economic zones is
increasing steadily and is 2.7 times greater than the number in 1997 (Table 1-3-4).
Table 1-3-2 Economic Zones in Cebu Province as of 31 August 2011
Operating
Economic Zones Economic Zones being developed
IT Parks/Centers 22 12
Manufacturing Economic Zone 7 1
Tourism Economic Zone 1 -
(Source: PEZA)

1 - 6
Table 1-3-3 Manufacturing Economic Zones in Cebu Province
as of 31 August 2011
Operating Economic Zone 1 Cebu Light Industrial ParkLocation Basak, Lapu-lapu City, Mactan, CebuDeveloper/Operator : Cebu Light Industrial Park Inc.Region / Area R-VII / 62.49 (hectares)
2 Cebu South Road PropertiesLocation South Reclamation Project, Cebu CityDeveloper/Operator : City Government of CebuRegion / Area R-VII / 295.69 (hectares)
3 Mactan Economic ZoneLocation Lapu-Lapu City, Mactan, CebuDeveloper/Operator : Philippine Economic Zone AuthorityRegion / Area R-VII / 119.37 (hectares)
4 Mactan Ecozone IILocation Basak, Lapu-lapu City, Mactan, CebuDeveloper/Operator : Acoland Inc.Region / Area R-VII / 63.3 (hectares)
5 MRI EcozoneLocation Sabang, Danao City, CebuDeveloper/Operator : Mitsumi Realty , Inc.Region / Area R-VII / 28.29 (hectares)
6 New Cebu TownshipLocation Cantao-an, Naga, CebuDeveloper/Operator : MRC Allied Industries Inc.Region / Area R-VII / 122.83 (hectares)
7 West Cebu Industrial ParkLocation Arpili & Buanoy, Balamban, CebuDeveloper/Operator : Cebu Industrial Park Developers Inc.Region / Area R-VII / 160.86 (hectares)
Economic Zones Being 8 Polambato-Bogo Economic ZoneDeveloped Location Polambato, Bogo, Cebu
Developer/Operator : WenMar Development Corp.Region / Area R-VII / 41.71 (hectares)
(Source: PEZA)
Table 1-3-4 Number of Companies in Major Economic Zones in Cebu Province
(Source: PEZA, CEBU Economic Fact Book 2009)
According to the Provincial Development and Physical Framework Plan (PDPFP) 2008-2013 of the province of
Cebu, there are two economic zones located on the west coast of Cebu Island: Mira Nila Ecozone in Aloguinsan
and Toledo City Economy Zone (in the proposal stage). In addition, Balili property development of Naga city in
Cebu has applied to PEZA for status as an economic zone.
According to the Department of Trade and Industry on Cebu Provincial Office’s website, the plan for the Mira
Nila Ecozone, which Mira Nila Land Development Corporation is developing, is scheduled to construct the
following facilities in the vast area of 1,200 ha (short period) to 2,800 ha (mid-term).
1997 1998 1999 2000 2001 2002 2003 2004 2005 2006 2007 2008 2009 ・・・ 2011Mactan Economic Zone Lapu-Lapu City 101 103 103 109 108 108 107 110 112 109 108 140 151 152Mactan Econone II Lapu-Lapu City 14 19 25 32 37 40 39 48 47 47 50 49 54 54New Cebu Township Naga City 2 1 1 1 1 2 2 2 2 2 2 3 4 4West Cebu Indurtrial Park Balamban 5 5 5 5 5 5 5 5 6 6 13 16 16 17Cebu Light Industrial Park Lapu-Lapu City 1 4 5 5 6 6 21 23 25Asiatown IT Park Cebu City 6 6 18 15 35 52 68 73Cebu South Road Properties Cebu City 1 1 1 2 2MRI Ecozone Danao City 1 1 3 6 5 7 7 7
122 128 134 147 151 156 164 177 193 192 220 289 325 334Total

1 - 7
- Eight resort complexes
- Two golf courses
- Over 500 hectares of high-tech employment services including manufacturing/assembly facilities
- Wastewater treatment plant with treatment capacity of 400 cubic meters per day
- A wide range of types and densities of housing opportunities
- A comprehensive town center including commercial, service, civic, medical, cultural and religious facilities
and activities
- Retirement and resort/recreational facilities
- A new major regional airport/seaport
- A college/university site.
Balili property development of Naga City is scheduled to establish an industrial zone of about 9.7 hectares
(reclaimed land), a coal ash disposal site by KEPCO (the Korean Electric Power Co.), a seaside park, a seaport,
waste-to-energy facility, etc. in a site of about 27 hectares.
Figure 1-3-1 Balili Property Development Plan of Naga City
(Source: The Province of Cebu)
3) National and Regional Development Plans
a) Philippine Development Plan 2011-2016
After his inauguration as President, Benigno S. Aquino III, President of the Republic of the Philippines, directed
the National Economic and Development Authority (NEDA) to coordinate the formulation of the Philippine
ティナ・アン バランガイ
セブ州ナガ市
バリリ・プロパティ
開発計画
凡例
海岸線
道路
提案道路
廃棄物熱源転換設備用地(5.3ha)
韓国電力開発用地(9.9ha) 埋立地(10.53ha)
提案港
マングローブ林(14.4ha)
BRGY. TINA-AN, NAGA

1 - 8
Development Plan for 2011-2016 in order that his program of government that is based on his “Social Contract
with the Filipino People” might be formulated. This plan has been formulated and it adopts a framework of
inclusive growth, which is high growth that is sustained, generates mass employment, and reduces poverty.
With good governance and anticorruption as the overarching the theme of each and every intervention, the plan
translates into specific goals, objectives, strategies, and programs and projects all the things that we want to
accomplish in the medium term.
In this plan, the infrastructure development program is described as follows: “The Plan’s infrastructure
development program aims to contribute to inclusive growth and poverty reduction. It will support the
performance of the country’s economic sectors and ensure equitable access to infrastructure services, especially
as these affect the people’s health, education, and housing. Toward these ends, the government will accelerate
the provision of safe, efficient, reliable, cost–effective, and sustainable infrastructure.”
The objectives and strategies which shall be pursued across all infrastructure subsectors are to optimize
resources and investments, to attract investments in infrastructure, to foster transparency and accountability in
infrastructure development, to adapt to climate change and mitigate the impacts of natural disasters, and to
provide productive employment opportunities. In these, encouraging Public-Private Partnership (PPP) and
tapping the private sector for the financing, construction, operation, maintenance, and rehabilitation of major
infrastructure in high-priority areas, such as transportation, power and water is stated as a policy for attracting
investments in infrastructure.
Six strategic plans are set to realize “a safe, secure, efficient, viable, competitive, dependable, integrated,
environmentally sustainable, and people-oriented Philippine transportation system” for the transport sector, and
the strategic plans relevant to this Project are as follows:
- Develop an integrated multimodal logistics and transport system
a. Identify and develop strategic logistics corridors based on a National Logistics Master Plan
The SCMB Corridor and other strategic logistics corridors must be developed to become seamless intermodal
logistics corridors. In support of this, a Logistics Master Plan shall be completed to guide overall development.
b. Improve the RRTS
Interisland logistics shall be enhanced by further developing the RRTS. Studies on the domestic shipping
industry shall also be undertaken to identify concrete measures to lower interisland shipping costs. Efforts to
improve performance and efficiency in port operations shall likewise be pursued.
c. Explore ASEAN connectivity through sea linkages
The government shall study the development of existing RORO ports to accommodate international RORO
ships as well as the necessary regulatory framework to promote such service. The development of port facilities
through PPP to cater to cruise tourism, both servicing interisland and international cruise vessels, may also be
explored.
- Separate the regulatory and operation functions of transport and other concerned agencies

1 - 9
In line with the goal of separating the operation and regulation functions of transport agencies, the port, rail and
air transport organizations shall be restructured.
b) Provincial Development and Physical Framework Plan
“Provincial Development and Physical Framework Plan (PDPFP)” prepared by Provincial Planning and
Development Office, which was approved in June 2010, shows the plans, the projects, and activities
corresponding to the development strategy of the Province of Cebu in the period from 2008 to 2013. The
provincial government of Cebu opted to give priority to provision of three basic services, roads, water, and
electricity under the Good Roads and Bridges, Water, and Electrification Now (GWEN) Program.
In order to support business and tourism infrastructure as an individual program, two international ports are
planned as follows: “The development of the Naga International Port and the Lilo-an International Port will
further boost Cebu’s profile as the shipping capital of the country. The development of these ports in the north
and in the south will decongest the existing international port in the city, and free ships from the burden of
having to negotiate the increasingly tricky Mactan Channel.”
c) National Plan of Ports
“The Study on the Master Plan for the Strategic Development of The National Port System in the Republic of
the Philippines” was conducted by JICA in January 2004. The Philippine Port System Strategy (PPOSS) drawn
up in the study is extracted in Table 1-3-5. In the strategy, Cebu Port is selected as one of the international
gateway ports as a major "window" to the world that will be developed until 2024.

1 - 10
Table 1-3-5 Philippine Port System Strategy
Mission 1. Establishment of a fast, economical, reliable and safe maritime transport network accelerating
the development of national economy 2. Formation of maritime transport bases to support regional society
Strategies for
Planning
Establishment of a nationwide port development plan coordinated with the plans of various portmanagement public corporationsPort classification International gateway port (Gateway port), Principal international trade
port (Principal port), Major port (including RORO port for major corridors), Regional port
Principles for planning
1) Establishment of nationwide maritime transport
1) Concentrated Development of Specific International ContainerGateway Bases
2) Improvement of Domestic Container Transport Efficiency 3) Development of Facilities for Break Bulk and Bulk Cargo 4) Port Planning at the Greater Capital Region 5) Formation of Major Corridors
2) Formation of maritime transport bases to support regional society
1) Enhancing the Mobility of People and Goods in the Region2) Securing Transportation Bases to Support Daily Life in Remote
Islands 3) Supporting Social Reforms
Strategic development port
Investment in long term development plan (2004-2024); about 150 billion pesos Investment in short term development plan (2004-2009); about 41 billion pesos
Management and
Operation
Modification of port administration as well as improvement of port management/operation - Establishment of National Plan for Port Development (NPPD) Council - Increasing cargo handling efficiency - Appropriate port tariff setting
Investment and
Financing
Investment scheme and proper financial resource allocation for feasible port development - Proposed financial policies for public port development - Acceleration of private sector participation to port projects
(Source: The Study on the Master Plan for the Strategic Development of The National Port System in the Republic of the Philippines)
LEGEND: International Gateway
Port : Principal International
Trade Port : 2 Lane Nat’l Roads : 4 Lane Nat’l Roads
General Santos Davao
Zamboanga
CDO/MC
Cebu Iloilo
Batangas
Subic Manila

1 - 11
d) National Plan of Roads
“The Study of Master Plan on High Standard Highway Network Development in the Republic of the
Philippines” was conducted by JICA in July 2010. High standard highway (HSH) Development Master Plans on
three areas, Metro Manila and its 200 km radius sphere, Metro Cebu, and Tagum-Davao-General Santos (TDG)
Corridor, were proposed in the study.
The HSH development strategy stating that HSH network shall be limited to HSH-2, since formation of HSH-1
is difficult in Metro Cebu, was established and the HSH network to be developed by 2030 is proposed as shown
in Table 1-3-6 and Figure 1-3-2.
Table 1-3-6 Definitions of HSH
“Highways which provide high level of traffic services by assuring high speed mobility and
safe travel in order to vitally support socio-economic activities for sound socio-economic
development of strategic regions and the country as a whole.”
HSH 1:Arterial High Standard Highway
HSH 2:Regional High Standard Highway
(Source: The Study of Master Plan on High Standard Highway Network Development in the Republic of
the Philippines)
Table 1-3-7 Proposed HSH-2 Network: Metro Cebu
Highly
Urbanized
Area
Three (3) transport axes
are formed
- Cebu Central Transport Axis (Cebu North Road and Cebu
South Road)
- Cebu Central Transport Axis (road constructed on the
reclamation land).
It is extended up to Liloan (new road).
- Cebu Hillside Transport Axis (new road along the hillside and
functions as a circumferential road for traffic distribution)
Northern Area Cebu North Transport
Axis is formed
- Cebu North Road and its parallel road (new road)
Southern Area Cebu South Transport
Axis is formed
- Cebu South Road and its parallel road (new road)
Mactan Island ・Mactan Island Tourism Development Transport Axis (or Mactan Island circumferential
road) is formed.
・Connection between Cebu Main Island and Mactan Island is strengthened.
(Source: The Study of Master Plan on High Standard Highway Network Development in the Republic of the
Philippines)

1 - 12
Figure 1-3-2 Proposed HSH-2 Network: Metro Cebu
(Source: The Study of Master Plan on High Standard Highway Network Development in the Republic of the
Philippines)
e) National Plan of Airports
“The Master Plan Study on the Strategy for the Improvement of National Airports in the Republic of the
Philippines” was conducted by JICA in March 2006. In the study, the following nine strategies for improved
management of national airports system were identified, and the following eleven action plans were produced to
cover the strategies. Expansion of the terminal area at Mactan Cebu International Airport, one of nine
international airports, is indicated on the Development Plans for Long Term Development Phase (2016-2025).
Table 1-3-8 Master Plan for Improved Management of National Airports System Strategies Corresponding Action Plans for Year 2006-2010
1. Revision of Airport Classification 2. Development of Airport Standards and
Implementation of Certification System 3. Establishment of Airport Strategy for the Greater
Capital Region 4. Improvement of Airport Facilities 5. Improvement in Cost Recovery and
Establishment of Rational Pricing Regulations
6. Organizational Restructuring in Airport Management
7. Transfer of Airports to LGUs 8. Strengthening of Airport Security 9. Improvements in Data Quality and Management
1. Airport Classification2. Airport Safety Standards and Certification
System 3. Strategies for the GCR Airports 4. Improvement of Airport Facilities 5. Cost Recovery and Rational Pricing Regulations 6. Creation of Airports Authority of the Philippines 7. Amendment to the CAAP Bill 8. Local Airport Ownership Program 9. Airport Security 10. Data Quality and Management 11. Education and Training
(Source: The Master Plan Study on the Strategy for the Improvement of National Airports in the Republic of the
Philippines)

1 - 13
4) Present Situation of Cebu Port
4)-1 Utilization of the Port
Figure 1-3-3 shows the present utilization and management offices (MO) of every port quay-wall. The results of
the field survey and interviews are described below.
Figure 1-3-3 Present Utilization and Management Offices (MO) of Every Port Quay-wall
B1
B2 B3 B4 B5 B6 B7,8 B9 B10 B11 B12
B13 B14 B15 B16 B17
International Container International Bulk, General Cargo
Domestic Container
Passenger
RORO (Container/General)
(Passenger)
Passenger Passenger
RORO (General, Bulk)
(Passenger)
RORO (General, Bulk)
(Passenger)
RORO (General, Bulk)
(Passenger)
RestrictedDomestic Container Large Ferry, RORO
Port Road & Office Boundary
Port AreaPrivate Land
MO1 MO2
MO3
MO4
MO5
(Source: Study Team)
a) Land Use of Port Area
The line “ ” in Figure 1-3-3 shows the boundary of the official port area of Cebu Port. Of this area, the
colored land is owned by CPAs, while the white area is owned by private institutions or other authorities. The
CPA area is small and used for ship cargo handling purposes. The privately owned area is used for warehouses or
storage of empty containers.
As shown in the figure, most of the land behind the quay-wall is owned privately, which prevents CPA from
expanding port facilities. On the very narrow apron of the quay, many container ships, RORO, ferries and
passengers are berthing and their cargos are transported, thus the congestion of the port is very serious.
To change or develop land use in the boundary of the port area, permission must be given by the Land Owners
Association and the CPA. A representative of the Land Owners Association concurrently holds the post of CPA
board member.

1 - 14
b) Port Management Offices
Although Cebu Port is managed by CPA, the port is divided into 5 parts and each part has a Port Management
Office (MO1 - MO5). These management offices are responsible for berthing/de-berthing of arriving ships and
account of port charges, etc. CPA also manages the public/private ports on Cebu Island in addition to the Cebu
Baseport. Table 1-3-9 shows the berth numbers and handling commodities of each management office of Cebu
Baseport.
Table 1-3-9 Berth Numbers and Cargo Types of Each Management Office of Cebu Baseport
ManagementOffice
Berth No. Cargo Types
MO1 B1~B5 International Container, International Bulk & General Cargo
MO2 B6~B17 Domestic Container, Domestic Bulk & General Cargo, Passenger
MO3 B18~B23 Domestic Container, Domestic Bulk & General Cargo, Passenger
MO4 B24~B27 Domestic Bulk & General Cargo, Passenger
MO5 B28~B29 Domestic Bulk & General Cargo, Passenger (Source: Study Team)
c) Port Utilization of Each MO
【MO1 (B1~B5)】
Berths and yards of MO1 are used for international cargoes. The port utilization plan specifies that B2 is for
international bulk/general, whereas B3 ~ B5 are for international containers. However, B3 ~ B5 are sometimes
used for bulk/general because the berthing hours of bulk/general are usually long (1 day ~ 1 week) and large-sized
general cargo ships (LOA = 170 m) sometimes arrive and occupy a longer berth length. In particular, during the
rice import season (February ~ August), general cargo ships frequently use B3 or B4, as B2 alone is not big
enough to handle all the cargoes.
The major import bulk cargoes are salt and silica. At the B1 docking area, three (3) silos for imported bulk goods
were installed through co-investment of CPA and OPASCOR (terminal operator). However, they have not started
operation yet. Most of the rice cargo is imported in the form of bags by general cargo ships. Other imported
cargoes are steel, heavy equipment and spare parts, etc. There is little cargo exported from Cebu Baseport.
【MO2 (B6~B17)】
B6 is for domestic containers. A gantry crane is mounted on the quay. However, sometimes domestic containers
are handled at B8 ~ B10 which have no quay cranes. The reasons the containers are handled without quay cranes
include the shortage of quay length due to poor berth-window control and the reluctance of shipping companies to
pay extra costs for the crane charge.
B8~B9 are used for the Superferry which sails between Manila, Cebu and Mindanao, etc. Usual arrivals of the
Superferry are 7 ~ 8 times a week. Berthing hours of the Superferry are normally short with a minimum 3 hours
Domestic Container, Domestic Bulk & General

1 - 15
per arrival. The following table shows the arrival record of Superferry as one example.
Table 1-3-10 Berthing of Superferry (Record during 2011/8/18~31)
0 1 2 3 4 5 6 7 8 9 10 11 12 13 14 15 16 17 18 19 20 21 22 23 24
18-Aug Thu
19-Aug Fri
20-Aug Sat
21-Aug Sun
22-Aug Mon
23-Aug Tue
24-Aug Wed
25-Aug Thu
26-Aug Fri
27-Aug Sat
28-Aug Sun
29-Aug Mon
30-Aug Tue
31-Aug Wed
Hours
Superferry 2 Superferry 12
Superferry 20
Superferry 21
B8 LOA=138 B8/9 LOA=173
B8/9 LOA=173
B5 LOA=151
B5 LOA=151
B5 LOA=144
B5 LOA=144
B8 LOA=138B8/9 LOA=173
B8 LOA=173
B8/9 LOA=173
B8/9 LOA=173B8/9 LOA=138
B8/9 LOA=173
Superferry 12
Superferry 12
Superferry 12
Superferry 12
Superferry 12
Superferry 12
Superferry 12
Superferry 21
Superferry 2
Superferry 2
Superferry 20
(Source: Study Team)
At B10~B12 and B15~B17, most of the berths are occupied by RORO ships, while domestic container ships are
sometimes at berth. ROROs are categorized as: 1) large-sized Superferry that accommodate containers on chassis,
2) middle-sized RORO that carries containers loaded/unloaded by forklifts and break-bulk placed on pallets, and
3) small-sized RORO that carries only break-bulk. There are two types of RORO in terms of berthing direction,
those that berth perpendicular to the quay-face and those that berth alongside the quay-face. RORO alongside the
quay-face are generally large in size and usually use B10~B12. For alongside berthing, a ship occupies 150~170
m of quay-length, while for berthing perpendicular to the face, 3~4 ships can berth in one unit berth length of 125
m.
Passengers are carried by most ROROs. Passengers walk on the apron where forklifts and trailers are busily
working. The terminals for passengers are located at B13 and B14. Though boarding passengers are transported
from the terminal to the ship berth, some of the disembarking passengers walk from the ship to the gate guided by
security officers.
B13 and B14 are used for passenger boats. At B13 there is a CPA passenger terminal, from where fast-craft boats
sail to Bohor, Negros or Mindanao, etc. At B14 there is a private passenger terminal operated by Aboitiz
Transport Systems, from where fast-crafts (Supercat) depart to Bohor and Samal.
【MO3 (B18~B23)】
At B18~B19 and B21~B23 cargo operations of middle or small-sized RORO are performed. The apron width of
these berths is smaller than that of the MO2 area, thus the congestion on the apron is more serious. Berthing
directions of these ships are mostly perpendicular to the quay-face. Most of these RORO also carry passengers.

1 - 16
B20 is the jetty called Pier 3 projecting to the seaside. A passenger terminal building is installed on the jetty. At
this jetty, middle-sized fast crafts with a length of 35~40 m (mainly departing to Bohor) and conventional ships
with a length of 40~50 m (departing to Leyte or Bohor) berth.
B23 is also a jetty similar to B20 called Pier 2. This jetty was previously used for passengers, but the terminal
building was demolished and it is now used for a cargo jetty. Here, passengers are not observed. Ships with 40~70
m LOA berth.
【MO4 (B24~B27), MO5 (B28~B29)
The berths managed by MO4 and MO5 are very congested because the apron is narrow and the access way from
public roads outside the port is not convenient. The berths are used for for small to middle-sized RORO or
conventional ships. The operations of break-bulk and passengers are observed. B26 is a jetty similar to B20 and
B23, where passenger terminals are operational.
4)-2 Cargo operation – International container vessel (B2~B5)
Currently, all international containers have been loaded/unloaded at B2-5 except some shipments by domestic
feeder vessels and ferries. The cargo handling has been undertaken by Oriental Port & Allied Services
Corporation (OPASCOR) assigned by CPA. However, OPASCOR have mainly focused berth cargo operation
under the contract with the shipping agencies for handling in the same manner as general cargo as no integrated
terminal operator exists. OPASCOR is also working on storage and delivery but these operations are not managed
entirely under their control.
The berth cargo operation can be workable on a 24-hour basis but currently, the terminal has been operating
with only 5 vessels of 1000 TEU class per week regularly with low occupancy and utilization of the yard and
cargo handling equipments. The productivity of gantry crane achieves 25 containers per hour with 2 cranes
working per vessel in normal operation.
4)-3 Cargo operation – International bulk and general cargo vessel (B1)
Cargo operation of bulk and general cargo vessels at B1 has been undertaken by a quay general-purpose crane
and/or ships cranes. OPASCOR is responsible for cargo operation. The B1 berth and the backreach area are not
separated with a fence or partition from the container berth B2. Under such arrangements, the discharged cargo
has to be hauled immediately to the storage facility outside the terminal. Imports are dominant at Cebu. The
vessels stay for a few days for cargo operation with certain berth occupancy but it could possibly affect the
alongside schedule of arrival of container vessels for the next berth.
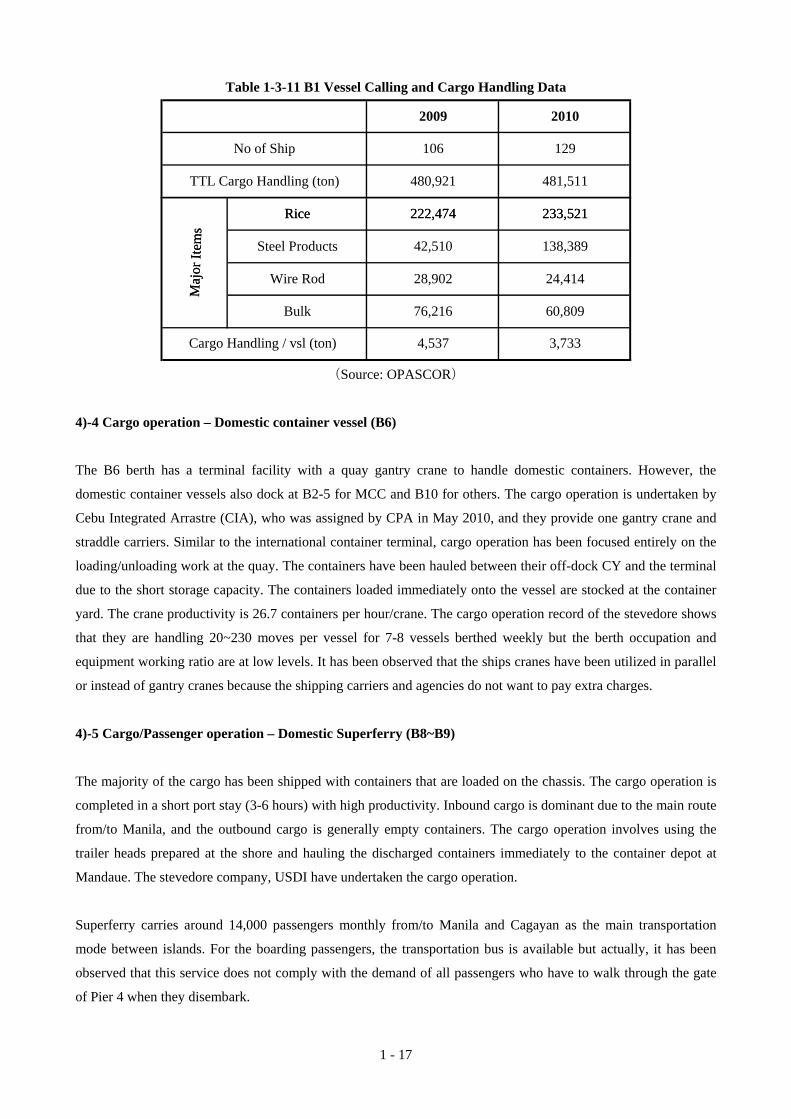
1 - 17
Table 1-3-11 B1 Vessel Calling and Cargo Handling Data
No of Ship 106 129
20102009
TTL Cargo Handling (ton) 480,921 481,511M
ajor
Ite
ms
Rice 222,474 233,521
Bulk 76,216 60,809
Steel Products 42,510 138,389
Cargo Handling / vsl (ton) 4,537 3,733
Maj
or I
tem
sRice 222,474 233,521
Wire Rod 28,902 24,414
(Source: OPASCOR)
4)-4 Cargo operation – Domestic container vessel (B6)
The B6 berth has a terminal facility with a quay gantry crane to handle domestic containers. However, the
domestic container vessels also dock at B2-5 for MCC and B10 for others. The cargo operation is undertaken by
Cebu Integrated Arrastre (CIA), who was assigned by CPA in May 2010, and they provide one gantry crane and
straddle carriers. Similar to the international container terminal, cargo operation has been focused entirely on the
loading/unloading work at the quay. The containers have been hauled between their off-dock CY and the terminal
due to the short storage capacity. The containers loaded immediately onto the vessel are stocked at the container
yard. The crane productivity is 26.7 containers per hour/crane. The cargo operation record of the stevedore shows
that they are handling 20~230 moves per vessel for 7-8 vessels berthed weekly but the berth occupation and
equipment working ratio are at low levels. It has been observed that the ships cranes have been utilized in parallel
or instead of gantry cranes because the shipping carriers and agencies do not want to pay extra charges.
4)-5 Cargo/Passenger operation – Domestic Superferry (B8~B9)
The majority of the cargo has been shipped with containers that are loaded on the chassis. The cargo operation is
completed in a short port stay (3-6 hours) with high productivity. Inbound cargo is dominant due to the main route
from/to Manila, and the outbound cargo is generally empty containers. The cargo operation involves using the
trailer heads prepared at the shore and hauling the discharged containers immediately to the container depot at
Mandaue. The stevedore company, USDI have undertaken the cargo operation.
Superferry carries around 14,000 passengers monthly from/to Manila and Cagayan as the main transportation
mode between islands. For the boarding passengers, the transportation bus is available but actually, it has been
observed that this service does not comply with the demand of all passengers who have to walk through the gate
of Pier 4 when they disembark.

1 - 18
4)-6 Cargo/Passenger operation – Domestic RORO Vessels
Large-sized RORO vessels of more than 5000 GWT normally use B 9-10 for docking alongside the berth. The
medium vessels less than 5000 GWT have used B 11-12, and B 15-17 for berthing in Mediterranean style. The
small vessels of less than 500DWT have used B19、B21-22、B24-25, etc. in Mediterranean style. Most of the
small and medium-sized RORO vessels provide cargo ramps and passenger access in the stern. Thus, berthing in
Mediterranean style can save space and contribute to quick and easy operation. The large RORO vessels load
containers as the majority as well as mobiles but the major cargoes of small and medium vessels are palletized
cargo and break-bulk general cargoes with small to large lots that are labor intensive and require small forklifts for
cargo operation.
The stats of Aug.,2011 shows that the embarkation/disembarkation recorded about 500 passengers per calling for
the large RORO vessels and about 100~350 for the small and medium vessels but the numbers vary in the most
cases depending upon the callings. The passengers have to walk around the cargo operation area unsafely. The
vessels are scheduled to arrive at evening and sail out at night for arrival at destination in next morning.

1 - 19
5) Regional Development Plan at New Port Candidate Locations
The JICA Report in 2002 proposed 5 candidate locations for new port development. This section describes the
recent regional development plan made by local municipalities.
Figure 1-3-4 Candidate Locations for New Port
Consolacion
Mactan North Mactan South
Cebu South
Minglanilla
Cebu Baseport
(Source: JICA Report 2002)
5)-1 Consolacion
There is no large-scale development project on the outskirts of a proposed site for the new port in the Municipality
of Consolacion. The Comprehensive Land Use Plan 2001-2010 of Consolacion Municipality is a land use plan
that shows the heavy industrial zones are coordinated to the south of the provincial road (Figure 1-3-5). The
proposed site surrounded by the heavy industrial zones is already designated as an international port zone, and is
separated clearly from the residential and commercial zones.
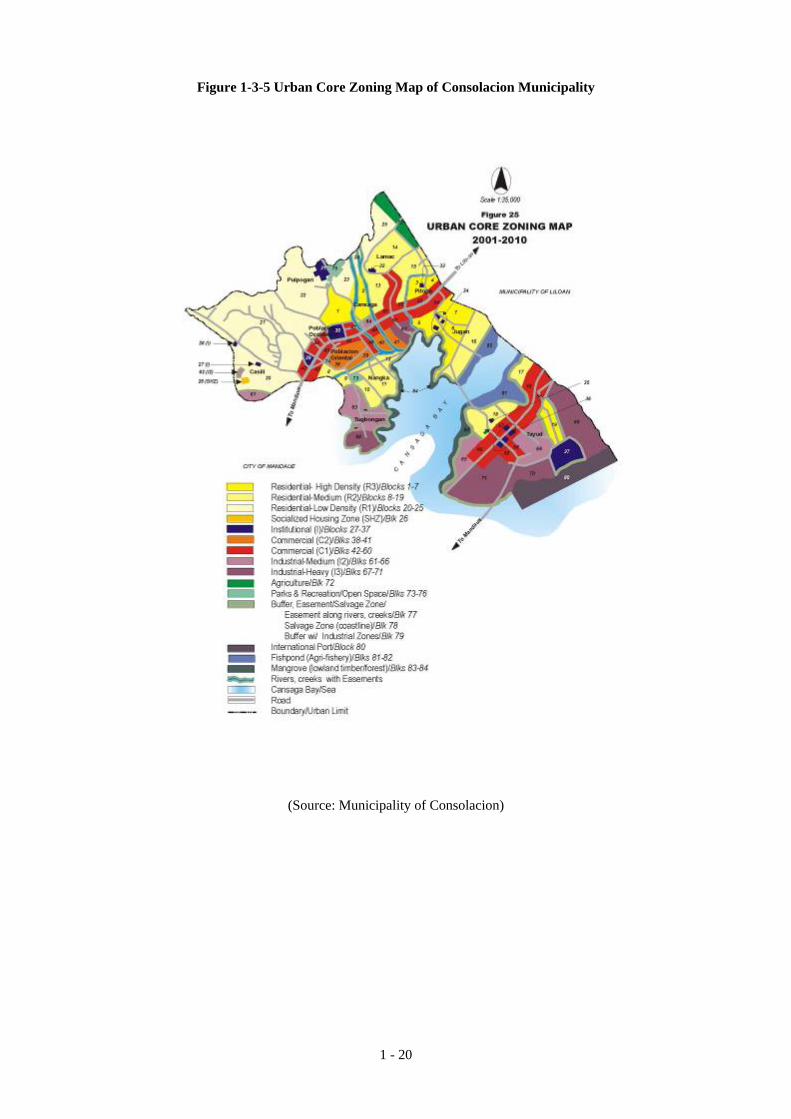
1 - 20
Figure 1-3-5 Urban Core Zoning Map of Consolacion Municipality
(Source: Municipality of Consolacion)

1 - 21
5)-2 Mactan North
There is a reclamation plan by Lapu-Lapu City on the outskirts of a proposed site for the new port in Mactan
North. In the plan, the total developed land area is 450 hectares, and a multiple urban development including a
port is planned on the area divided into five sections (Figure 1-3-6).
Figure 1-3-6 Reclamation Plan in Mactan North
(Source: Lapu-Lapu City)

1 - 22
5)-3 Mactan South
There is a huge reclamation plan by the province of Cebu on the outskirts of a proposed site for the new port in
Mactan South. In the plan, the total developed land area is 2,421 hectares, and a multiple urban development
including a port is planned on the area divided into seven sections (Figure 1-3-7). Relocating Mactan-Cebu
International Airport to this area has also been proposed.
Figure 1-3-7 Reclamation Plan on Mactan South
MANDAUE CITY
CEBU CITY
OLANGO ISLAND
CORDOVA
Parcel 1Area=405 has
Parcel 2Area=594 has
Parcel 3Area=518 has
Parcel 4Area=472 has
Parcel 5Area=204 has
Parcel 7Area=112 has
Parcel 1 Maritime City (Port Zone) 405 has
Parcel 2 Cebu New City 1 (Urban/Mixed Use Township)
594 has
Parcel 3 Cebu New City 2(Residential/Reclamation Township)
518 has
Parcel 4 Mactan Aqua Ville(Tourism and Resort Precint)
472 has
Parcel 5 Cordova New Town 204 has
Parcel 6 & 7 Ocean View Village 116 has122 has
LAPULAPU CITY
(Source: Province of Cebu)

1 - 23
5)-4 Cebu South
The Cebu South Road Properties Project is ongoing by Cebu City on the outskirts of a proposed site for the new
port in Cebu South. Although this project was originally designed to provide an area for industrial use, the plan
was changed for complex use. For 39% of the 275.09 hectares of developed land, the use is not yet fixed (Figure
1-3-8). In the block near the proposed site for the new port, a residence-based complex development is being
carried out.
Figure 1-3-8 Land Use Plan of South Road Properties
(Source: Cebu City)
凡 例
売却済(52.03ha) 共同事業(39.02ha)
貸付(3.15ha) 寄付(12.35ha) 空地(107.41ha)
池 A(61.13ha) 合計面積 275.09ha
SM(売却済)(30.41ha)
フィルインベスト (JV)(39.02ha)
池 A(61.13ha)
フィルインベスト(売却)(10.65ha)
提案河川
LEGEND
: SOLD OUT
SM
PHIL INVEST
POND
RIVER
PHIL INVEST

1 - 24
5)-5 Minglanilla
There is a reclamation plan by the Municipality of Minglanilla on the outskirts of a proposed site for the new port
in Minglanilla. The total developed land area is 300 hectares, and landfill is planned with a phased approach
(Figure 1-3-9). The reclamation of the blocks near the proposed site for the new port is in the first phase of
planning.
Figure 1-3-9 Reclamation Plan of Minglanilla
(Source: Municipality of Minglanilla)

Chapter 2
Study Methodology


2 - 1
(1) Contents of the Study
Based on a review of the feasibility of several candidates, the new port location has been selected considering
planning of a new container terminal. The economic and financial analysis is carried out. The port development
plan should be proposed maximizing the utilization of a STEP scheme under a Japanese Yen loan and private
sector initiatives. At the existing Cebu Port, the redevelopment port plan including the port facilities is to be
proposed after the container terminal facilities are moved to a new location. The economic effects by revitalizing
the logistic system are analyzed after port planning in consideration of environment friendliness. A discussion on
methodology of Public-Private Partnership is included as well as sharing of the capital between public and private
sectors. The scope of the studies is as below.
1) Review of Existing Reports
JICA’s “The Study on the Cebu Integrated Port Development Plan in the Republic of the Philippines (2002)” and
“The Study on the Master Plan for the Strategic Development of the National Port System in the Republic of the
Philippines (2004)” are to be reviewed.
2) Data Collection and Analysis for Present Port Situation
The present situation and future plan of Cebu Baseport and nearby facilities, utilization/operation (no. of ships
calls, cargo operation, yard, details of cargoes), port customer activities, cargo storage conditions, and
socio-economic activities in the port area and port hinterland regions are studied and analyzed by extracting the
issues.
3) Review on Cargo Movement and Demand Forecast
Through collecting the port statistics and relevant data for port activities and referring to the previous data in past
reports, the cargo/traffic demand forecast for Cebu Baseport is provided. The cargo demand should be forecasted
based on cargo type, e.g. container, general cargo, etc.
4) Study on the Relevant Plans and Projects
The current progress and forecast for all studies of the relevant development plans after 2002 (Master plan,
National plan, Port, Road, Private investment, etc) are studied as well as for other candidates for the new port. The
feasibility and consistency for this Project are examined and confirmed.
5) Review on Port Development Plan
Based on the cargo demand forecast, the development plan for new and existing ports are assessed and confirmed

2 - 2
in consideration with the master plan and development of an effective policy.
6) Public-Private Partnership
The plans for utilization of the port area after the relocation of the international container terminal will be
reviewed and assessed. In particular, the possibility of introducing a PPP scheme in the renovation Project through
use of a financing scheme, source of funds and investment scheme will be considered. Given that property sales in
the Cebu area are currently becoming more active, the possibility of private sector participation in business
opportunities other than port related transportation industries, such as development of amenity facilities, will be
assessed, and scenarios will be provided.
Scenarios of the renovation Project will include an assessment of possible sources of funds and economic impact
of the Project on the local society, such as the increase in job opportunities and impact on tourism. The roles and
responsibilities of both public and private sectors will be clearly defined in accordance with the improvement of
other existing port facilities.
7) Port Planning & Design
The cost estimate is reviewed with updated construction costs for the new container terminal and the existing
Cebu Baseport.
8) Economic & Financial Analysis
The new container port will be evaluated from the viewpoint of the national economy by comparing the costs and
benefits of “With case” and “Without case.” A comprehensive economic evaluation of the new container port is
carried out by calculating the EIRR with the NPV and R/C ratio being shown if applicable. Financial analysis is
carried out based on a private operator under concession building the appropriate facilities and managing the
terminal. The terms and conditions of the concession with the private operator will be examined in view of the
advantage of STEP with the possible introduction of a Japanese yen loan. FIRR will be calculated to examine the
financial feasibility of the new container port.
Regarding the existing Cebu Baseport, construction of a passenger terminal and redevelopment of RORO
berth/fast ship berth will be proposed. The EIRR of the proposed redevelopment Project at the existing Cebu
Baseport will be calculated based on “With case” and “Without case.” The FIRR will be calculated to examine the
financial feasibility of this Project after the redevelopment cost and income of the port charges, etc. are estimated.
9) Environmental Study
Screening and classification of the new container port and redevelopment of the Baseport will be done based on
the Environmental Guidelines of both JICA and JBIC. Checklist reports for both the new container port and
redevelopment of the Baseport using JBIC’s checklist and JICA’s checklist issued in April will be done.
Receiving an Environmental Compliance Certificate issued by the Environmental Management Bureau is essential

2 - 3
in order to get a STEP loan. As the JICA EIA was performed 10 years ago, it will be reviewed extracting the
possible problems and issues so that the ECC can be obtained without problem.
10) Technical Feasibility Study
The feasibility of the STEP loan and private sector initiative is studied after the construction costs in the JICA
study report done in 2002 are reviewed.

2 - 4
(2) Method of Study / Organization
The methods of study is charted as below in Figures 2-2-1.
Figure 2-2-1 Methods of Study
(Source: Study Team)
CPA who is the counterpart of the study team was separated from the PPA organization and established under
Regional Act.7621 to manage all ports in Cebu providence. CPA fully has been undertaking a port management in
Cebu providence since January 1, 1996. A Cebu Port Commission of 7 members have exercised the governing
function and policy-making. Their organization chart is shown below.

2 - 5
Figure 2-2-2 The organization of CPA
Office of the General Manager
Office of the Deputy General Manager
Finance & Administration Department
Business Marketing & Development Department
Port Security, Safety & Environment Department
Engineering Services Department
Legal Affairs Department
Internal Control Department
Port Management Department
Office of the Cebu Port Commission
(Source: Study Team)

2 - 6
Figure 2-2-3 Organization of the Study Team
Oriental Consultants Co.,Ltd.Port & Harbor DepartmentGlobal Consulting H.Q.
Project Manager Isao Hino Project Manager Port & Harbor Department Global Consulting H.Q. Oriental Consultants Co.,Ltd.
Local Support Ichiro Miyakoshi General Manager Manila Office Oriental Consultants Co.,Ltd.
【Cooperative Company】 Fumio Nakai Manager Transportation Infrastructure Business unit Infrastructure Project Division Mitsubishi Corporation
Cost Estimate Isao Hino Project Manager Oriental Consultants Co.,Ltd. Port & Harbor Department Global Consulting H.Q.
Port Development Planning(Redevelopment of Old Port) Akiko Nakashima Planning Department Global Consulting H.Q. Oriental Consultants Co.,Ltd.
PPP Project(PPP/Financing/Cost Effects) Toshiro Tsutsumi Ides Inc.
Plannning/Operation,ContainerTerminal Kazutoshi Tsuchiya Port & Harbor Department Global Consulting H.Q. Oriental Consultants Co.,Ltd.
Design/Cost Estimate, Road Atsushi Harada Road Planning Department Global Consulting H.Q. Oriental Consultants Co.,Ltd.
Environment/Social Impact CATALINO T. TACLIBON JR. ESS International Consultancy Corp. (Sub-contract)
Design/Port Facilities Atsushi Sato Port & Harbor Department Global Consulting H.Q. Oriental Consultants Co.,Ltd.
Demand Forecast・Economic/FincaceAnalysis Hiroshi Kato Ides Inc.
Engineering/Port Plannning Masatoki Nakanishi Port & Harbor Department Global Consulting H.Q. Oriental Consultants Co.,Ltd.
Local Support Manila Office Mitsubishi Corporation
【Cooperative Company】 Takashi Suzuki Manager Project Development Division Nippon Steel Corporation
(Source: Study Team)

2 - 7
(3) Schedule of the Study
The period of study is from August 17th, 2011 to February 16th, 2012 and includes the work in Philippines
consisting of the 1st and 2nd trip shown in Table 2-3-1.
Table 2-3-1 Schedule of the Study
2012August September October November December January February
① Preparation
2011
② Analysis/Discussion
③ Preparation of Final report
(Work in Japan)
⑥ Draft Report
⑧ Final Report
④ First Trip to Manila/Cebu
⑤ 2nd Trip to Manila/Cebu
(Submission of The Report)
(Work in Philippine)
Submitted in 12/22
Submitted on 2/16
(Source: Study Team)
The field work of the study has proceeded and includes the interviews and meeting with the counterpart, CPA and
various stakeholders relating to the development plan. The major meetings and interviews are summarized in
Table 2-3-2.
Table 2-3-2 The record of Major meetings and interviews
Meeting/Inteview
8 31Meeting with thecooperative company
9 1 Courtesy visit
Courtesy visit
Courtesy visit
2Presentation forOrientation of the study
5Presentation forOrientation of the study
13 Interview
Interview
Interview
14 Interview
Interview
Adolfo Quiroga, Provincial Planning & DevelopmentCoordinator
Cebu Providence office
The city of Cebu Alipio Bacalso, City Planning & Development Officer
S.Katsumi, Director
Aristotle B. Batuhan Undersecretary, George D. EsguerraAssistant Secretary, Lourdes T. PagtalunanCommunication Dev't Officer, Florencia A. CreusPlanning Director etc
Dennis R. Villamor General Manager, Tomas A. ReveralCommissioner, Joserido C. Sullano Planning Manager,Gelenn B. Castillo Finance Adm Manager etc
Rene Ledesma, Junior VP
Leah Constantino, Branch manager
Rogel Ramirez
Embassy of JapanK.Koreeda, Trade and Commercial AttacheM.Harigaya, Second Secretary, Ecomomic affairs
JETRO Office at Manila
DOTC
JETRO Office at Manila S.Ito, Senior Representative
Month/Date
Manila branch of Mitsubishi Corp. andNippon Steel Corp.
H.Yasuhara, Group manager of Mitsubishi Corp.H.Nakahara, General Manager of Nippon Steel Corp.
Name of AttendanceName of Counterpart
First Field Work
CPA
Evergeen, Intrenational carrier
American Prsident Line(APL),International carrier
Maersk Line, International carrier andMCC, Domestic carrier

2 - 8
Meeting/Inteview
9 15Port viist at Cagayan deOro
Port viist at Cagayan deOro
19 Interview
20 Interview on Operation
21Presetation for the siteselection
Interview
22 Interview
Interview
23 CPA Manager Meeting
Interview
Interview
Interview
Intervie on Operation
27 Interview
30Presetation for the siteselection for the congressmemeber
10 1 Visit at Naga
5 Port visit at Mandaue
7 Interim Report
10Meeting for PPPredevelopment plan
11 Interim Report
Interim Report
12 Interim Report
Interim Report
Intreview with Terminaloperator
Intreview with Terminaloperator
11 29 Interim Report
Interim Report
12 1 Interim Report
5 Future plan
7 Interim Report
8 Interim Report
Interim Report
9 Interim Report
JETRO Office at Manila S.Katsumi, Director
Asian Terminals Inc. (ATI)Sean L. Perez Vice President, Ernst A. Schulze ExecutiveVice President, Jose P. Carpio Special Project
Dennis R. Villamor General Manager, Joserido C.Sullano Planning Manager, Gelenn B. Castillo FinanceAdm Manager etc
Embassy of JapanK.Koreeda, Trade and Commercial AttacheM.Harigaya, Second Secretary, Ecomomic affairs
Japanese Chamber of Commerce at Cebu
CPA
Sulpicio, Domestic carrrier
CPA
Space
OPASCOR
Tamiya Philippine
Vice-Minister for Site Selection
Yusen Logistics
Cebu Holdings Inc
Cebu Mitsumi
The city of Mandaue
Manila office of Mitsubishi Corp.
CPA
DOTC
JETRO Office at Manila
International Container Terminal Services,Inc.(ICTSI)
Dante E.Clarito、Port Management Dep.
Congressman Osmeña, Aristotle B. BatuhanUndersecretary, Dennis R. Villamor General Manager
Pedro D. Compendio Consultant
Claro P. Fontanilla Division Manager
Aristotle B. Batuhan Undersecretary, Dennis R. VillamorGeneral Manager etc
Nagato, General Manager
Jonathan Fernandez, Operation Manager
Satoshi Matsuoka, Consultant
Victoria Go, Senior President
MasaTakenaga
Felomino Lin, President of the AssociationRobin Ong, Vice-President
S.Ichiki, Branch Manager, H.Yasuhara, Group manager
Aristotle B. Batuhan Undersecretary, George D. EsguerraAssistant Secretary, Lourdes T. PagtalunanCommunication Dev't Officer, Florencia A. CreusPlanning Director 他
S.Ito, Senior Representative, Y.Terasaki, ProjectFormulation Advisor, Floro O. Adviento ProgramManager, Leah L. Penarroyo Senior Program Offcer
Edgardo Q. Abesamis Executive Vice President
Embassy of Japan
DOTC
DOTC
JETRO Office at Manila
CPA
2nd Field Work
JETRO Office at Manila
George D. Esguerra Assistant Secretary, Lourdes T.Pagtalunan Communication Dev't Officer, Florencia A.Creus Planning Director etc
S.Katsumi, Director
Dennis R. Villamor General Manager, Joserido C.Sullano Planning Manager, Gelenn B. Castillo FinanceAdm Manager etc
Dennis R. Villamor General Manager
K.Koreeda, Trade and Commercial AttacheM.Harigaya, Second Secretary, Ecomomic affairs
George D. Esguerra Assistant Secretary, Lourdes T.Pagtalunan Communication Dev't Officer, Florencia A.Creus Planning Director etc
K.Koreeda, Trade and Commercial AttacheM.Harigaya, Second Secretary, Ecomomic affairs
CPA
S.Ito, Senior Representative,Y.Terasaki, Project Formulation Advisor
JETRO Office at Manila
Jonas R. Suan Technical Planning Supervisor
Nippon Express, Cebu Nobuaki Numazaki, Branch Manager
CIA Benjamin C.Akol, President
Yoichi Sato, Manager
Dennis R. Villamor General Manager, Tomas A. ReveralCommissioner, Joserido C. Sullano Planning Manager,Gelenn B. Castillo Finance Adm Manager etc
Month/Date Name of Counterpart Name of Attendance
Phividec Industrial Authority
Cagaya De Oro port office of PPA
Port Zone Lot Owners Association
(Source: Study Team)

Chapter 3
Justification, Objectives and
Technical Feasibility of the Project


3 - 1
3.1 Demand Forecast
1) Economic Framework
The Government of the Philippines formulated the basic strategic policy on national economic development and
geographical utilization of territorial areas entitled, “The Philippine Development Plan 2011 – 2016”. In this Plan,
the Government focuses on creating mass employment and reducing poverty as the main visions, and sets the
corresponding targets of a high economic growth rate of 7 to 8% per year for at least 6 years with an average of
one million jobs created annually. Therefore, based on the government plan, two (2) options for the economic
framework can be proposed for the demand forecast of Cebu Port: Option I: 8% and Option II: 7% during
2011-2016.
On the other hand, the International Monetary Fund (IMF) has been periodically forecasting the future economic
growth rate of individual nations worldwide. Although mid/long term forecasting of economic growth of a
nation/region is one of the most challenging tasks, the IMF economic forecast is reputed to be the most reliable
and trustworthy. Therefore, based on the IMF economic forecast, an annual growth rate of 5% for the midterm in
the Philippines can be proposed as the economic framework (Option 3).
Taking the realized growth rates and future prospects on economic growth in the Philippines explained above into
consideration, three (3) options on GDP growth rate during the period from 2011 to 2030 are summarized in Table
3-1-1.
Japan has been the No. 1 trading partner for Philippines for a long time, but is currently suffering from the effects
of a severe natural disaster in the northeast region of the mainland. The United States has also been experiencing
economic stagnation for the past couple of years. Further, the EU has been having trouble with financial issues in
some member countries and is recently seen as unstable. Taking these circumstances into consideration, it is
advisable to avoid an opportunistic forecast on the future economic framework, both for international and
domestic situations. In this Study, Option 3 is chosen as the economic framework for the demand forecast because
it is the most conservative.
It has been confirmed that the past growth rates of Region VII have followed the same tendency as those of the
national average. Therefore, the forecasted future growth rates shown in Table 3-1-1 Option 3 are also applied to
Region VII.

3 - 2
Table 3-1-1 Economic Framework for Demand Forecast
(Source: Study Team)
2) Forecast of Total Cargo Handling Volume
Cebu Baseport is the second largest in the Philippines in terms of port throughput only after Manila Port, and its
annual cargo handling volume reached 12 million metric tons. Cebu Baseport not only supports the economies
and lives of people on Cebu Island but also serves for socioeconomic activities and welfare promotion in the
entire Visaya region.
The total cargo volume handled at Cebu Baseport has been increasing more than 3% per year on average for the
past 10 years. A high correlationship (coefficient of determination=0.8297) has been observed between the total
cargo volume and Gross Regional Domestic Product (GRDP). Total cargo volumes handled at Cebu Port are
estimated to be 16 million tons in 2020 and 24 million tons in 2030, by applying future GRDP (see Table 3-1-2
and Figure 3-1-1).
Table 3-1-2 Total Cargo Handling Volume at Cebu Port
(Unit: '000 MT)
Year 2001 2010 2015 2020 2025 2030Thru'put 9,240 12,475 13,842 16,392 19,658 23,826
(Source: Study Team)
Figure 3-1-1 Historical Trend and Forecast of Total Cargo Handling Volume at Cebu Port
0
5,000,000
10,000,000
15,000,000
20,000,000
25,000,000
30,000,000
2000 2005 2010 2015 2020 2025 2030
MT
Year
Realized Forecast
(Source: Study Team)
Year 2000-2007 2010 2011 2012-2016 2017-2020 2021-2030Philippines Realized(%) 1.76%-7.09% 7.3%Region VII Realized (%) 2.34%-8.61% 7.3%
Option 1 (PDP High) 5.0% 8.0% 7.0% 6.0%
Option 2 (PDP Low) 5.0% 7.0% 6.0% 5.0%
Option 3 (IMF WEO) 4.7% 4.9% 5.0% 5.0%Note: PDP: Philippine Developmant Plan, WEO: World Economic Outlook
EconomicFramework

3 - 3
3) Forecast By Trade Type
Total cargo volume, calculated in the previous section, shall be further classified by trade type (export, import,
domestic loading, and domestic unloading). In general, international cargo are handled and stored at separate
locations from the domestic ones because of customs levies and regulations imposed on foreign ships and cargoes.
Differences in cargo handling efficiency between loading and unloading activities may be another reason why
cargo volume by trade type is required.
Cargo volumes by trade type for the last 6 years at Cebu Baseport are shown in Figure 3-1-2. In 2010, domestic
unloading is listed as the largest category (5.4 million MT), next is domestic loading (4 million MT), then Import
(2.2 million MT), and Export (0.9 million MT), in order.
Figure 3-1-2 Historical Trend of Cargo Volume by Trade Type at Cebu Port
0
1,000,000
2,000,000
3,000,000
4,000,000
5,000,000
6,000,000
2005 2006 2007 2008 2009 2010
MT
Import Export Inbound Outbound
(Source: Study Team)
Cargo volume by trade type is forecast either through correlation analysis or elasticity analysis with GRDP.
Elasticity is the ratio of the percent change in one variable to the percent change in another variable. It is a tool for
measuring the responsiveness of a function to changes in parameters in a unit-less way.
An example of correlation analysis for import cargo volume is shown Figure 3-1-3, and that of elasticity analysis
for domestic loading cargo volume is shown in Figure 3-1-4.
Resulting forecasted cargo volumes by trade type are summarized in Table 3-1-3 and Figure 3-1-5. Cargo volume
at Cebu Baseport is expected to expand with an average annual growth rate of 3.2% for the 20 years between 2010
and 2030. Regarding trade type, import cargo is expected to increase by 6.6% per year, and will reach 7.9 million
MT around 2030, which exceeds the domestic unloading volume (7.8 million MT).
Year

3 - 4
Figure 3-1-3 Correlation Analysis Between Import Volume and GRDP
y = 32.29 x - 1,399,603.56 R² = 0.93
0
500,000
1,000,000
1,500,000
2,000,000
2,500,000
60,000 80,000 100,000 120,000
MT
GRDP of Region VII (PhP Million)
(Source: Study Team)
Figure 3-1-4 Elasticity of Domestic Incoming Volume to GRDP
y = 0.4338x + 4.2464R² = 0.6334
6.84
6.86
6.88
6.90
6.92
6.94
6.96
6.000 6.050 6.100 6.150 6.200
Log
(M
T)
Log (Philippine GDP, PhP Million)
(Source: Study Team)
Table 3-1-3 Summary of Cargo Demand Forecast by Trade Type
(Source: Study Team)
(Unit: MT)
Year 2010 2015 2020 2025 2030 AGR
(1) Total Import 2,211,923 3,083,000 4,316,000 5,895,000 7,911,000 6.58%(2) Total Export 894,898 985,000 1,087,000 1,201,000 1,326,000 1.99%(3) Total Inbound 5,362,023 5,376,000 6,079,000 6,878,000 7,782,000 1.88%(4) Total Outbound 4,006,447 4,845,000 5,347,000 5,904,000 6,518,000 2.46%
Total (1)~(4) 12,475,291 14,289,000 16,829,000 19,878,000 23,537,000 3.23%Total By Regression 12,475,291 13,842,005 16,392,102 19,658,013 23,826,235 3.29%

3 - 5
Figure 3-1-5 Historical Trend and Forecast of Cargo Demand by Trade Type at Cebu Port
0.00
2,000,000.00
4,000,000.00
6,000,000.00
8,000,000.00
10,000,000.00
2000 2005 2010 2015 2020 2025 2030
MT
Import Export Inbound Outbound
(Source: Study Team)
4) Forecast By Package Type
Cargo volume by trade type is further classified by package type. In the CPA cargo statistics, cargo is classified
into four package types: bulk cargo, break-bulk cargo, container cargo, and rolling. Forecast of cargo volume by
package type is useful because cargo handling efficiency and equipment to be used varies by package type.
The historical trend of shares by package type for domestic outbound cargo at Cebu Baseport is shown in Figure
3-1-6. Shares by package type in 2020 are set for each trade type as shown in Table 3-1-4 taking into account the
past achievements and recent development. Thus, cargo volume by trade type by package type can be estimated as
shown in Table 3-1-5.
Figure 3-1-6 Composition by Package Type (Domestic Outbound)
0%
10%
20%
30%
40%
50%
60%
70%
2000 2002 2004 2006 2008 2010
Sha
re
Bulk Breakbulk Containerized Rolling
(Source: Study Team)
Year
Year

3 - 6
Table 3-1-4 Composition by Trade Type by Package Type
Trade Type Year 2010 2020 2010 2020 2010 2020 2010 2020
Bulk 7.3% 10.0% 0.0% 0.0% 5.74% 3.0% 4.42% 2.0%Breakbulk 16.8% 15.0% 0.0% 2.5% 42.59% 45.0% 52.35% 53.0%Containerized 75.9% 75.0% 100.0% 97.5% 45.81% 45.0% 34.89% 35.0%
Rolling 5.87% 7.0% 8.34% 10.0%
Foreign Import Foreign Export Domestic Inbound Domestic Outbound
(Source: Study Team)
Table 3-1-5 Summary of Demand Forecast by Trade Type by Package Type
Foreign Trade
Container Import Bulk Export Bulk Container Passenger
TEU MT MT TEU Pax
2000 103,944 48,203 14,338 372,268 2,651 299,630 1,366,913 1,494,780 0 0 10,059,048
2001 112,700 70,971 5,542 417,270 2,647 310,845 32,255 2,332 1,741,965 2,251,422 0 0 10,156,654
2002 103,139 53,912 20,000 406,547 2,484 337,370 42,507 6,824 1,696,717 2,611,269 0 0 10,738,198
2003 115,246 73,986 10,027 259,359 3,520 335,092 45,060 9,625 1,913,186 2,143,714 0 0 10,934,435
2004 120,281 60,931 6,000 192,140 31,735 311,282 78,396 99,700 1,852,455 2,255,197 0 0 11,785,915
2005 128,803 44,206 2,000 333,910 21,254 317,317 70,573 37,200 1,740,712 2,146,086 0 0 11,945,178
2006 146,459 75,648 7,800 276,922 30,177 279,442 10,666,071
2007 169,191 42,056 0 350,477 30,100 292,548 10,921,179
2008 157,634 93,287 0 423,989 32,062 295,155 10,321,278
2009 178,879 125,543 0 411,523 8,335 257,469 122,699 71,662 1,780,891 2,421,876 269,250 314,158 9,784,977
2010 202,213 156,373 0 358,674 0 247,295 273,754 194,678 2,030,300 2,303,575 279,634 366,817 10,993,921
2011 202,454 174,708 0 382,455 2,279 278,904 266,807 187,470 2,089,791 2,349,794 291,742 381,172 11,195,1372012 215,129 195,129 0 408,142 4,648 294,434 259,636 180,064 2,153,060 2,398,818 304,562 396,248 11,396,3532013 228,425 217,245 0 434,623 7,109 301,115 251,954 172,295 2,218,174 2,448,861 317,834 411,768 11,597,5682014 242,372 241,163 0 461,922 9,664 307,946 243,739 164,153 2,285,186 2,499,945 331,575 427,745 11,798,7842015 257,003 266,998 0 490,061 12,317 325,429 234,970 155,625 2,354,150 2,552,090 345,798 444,190 12,000,0002016 272,351 294,871 0 519,063 15,070 332,810 225,626 146,700 2,425,122 2,605,319 360,519 461,115 12,000,0002017 288,779 325,344 0 549,681 17,933 340,523 215,787 137,419 2,499,377 2,660,698 375,937 478,721 12,000,0002018 306,029 358,190 0 581,264 20,905 348,414 205,316 127,708 2,575,830 2,717,250 391,900 496,846 12,000,0002019 324,142 393,560 0 613,836 23,988 356,486 194,187 117,554 2,654,543 2,774,999 408,427 515,505 12,000,0002020 343,160 431,616 0 647,424 27,186 364,744 182,372 106,942 2,735,582 2,833,972 425,535 534,712 12,000,0002021 363,128 460,195 0 690,292 27,730 373,863 186,931 109,081 2,803,972 2,890,651 436,173 545,406 12,000,0002022 384,096 490,202 0 735,304 28,285 383,209 191,605 111,263 2,874,071 2,948,464 447,078 556,314 12,000,0002023 406,111 521,710 0 782,566 28,850 392,790 196,395 113,488 2,945,923 3,007,433 458,255 567,440 12,000,0002024 429,228 554,794 0 832,191 29,427 402,609 201,305 115,758 3,019,571 3,067,582 469,711 578,789 12,000,0002025 453,500 589,532 0 884,298 30,016 412,675 206,337 118,073 3,095,060 3,128,934 481,454 590,365 12,000,0002026 478,986 626,006 0 939,010 30,616 422,992 211,496 120,434 3,172,436 3,191,512 493,490 602,172 12,000,0002027 505,746 664,305 0 996,457 31,229 433,566 216,783 122,843 3,251,747 3,255,343 505,827 614,216 12,000,0002028 533,845 704,518 0 1,056,777 31,853 444,405 222,203 125,300 3,333,041 3,320,449 518,473 626,500 12,000,0002029 563,348 746,742 0 1,120,113 32,490 455,516 227,758 127,806 3,416,367 3,386,858 531,435 639,030 12,000,0002030 594,326 791,077 0 1,186,615 33,140 466,904 233,452 130,362 3,501,776 3,454,596 544,721 651,810 12,000,000
Exportbrkbulk (MT)
InboundBrkbulk (MT)
OutboundBrkbulk (MT)
Foreign Trade Year
Domestic Trade Inbound Bulk
(MT)OutboundBulk (MT)
InboundRolling (MT)
OutboundRolling (MT)
ImportBrkbulk (MT)
(Source: Study Team)
5) Demand Forecast for International Containers (TEU)
Containers are generally loaded and unloaded using gantry cranes (sometimes called Ship to Shore Cranes), which
are installed at the wharf, and empty containers are not an exception in this practice. In the case of bulk cargo or
break-bulk cargo, only cargo is subject to handling activities. However, in the case of containers, the cargo itself is
not the subject of handling activities but the container is. Therefore, in the former case, Metric Ton (MT) is
usually used as a unit of cargo volume, but in the latter case, for foreign containers in particular, TEU is generally
used as the unit of measurement.
Therefore, to forecast the future foreign container volume, a correlation analysis between container volume (TEU)
and GRDP of Region VII is implemented in addition to the MT basis forecasting explained above. A high
correlation between the two variables is confirmed with a determination coefficient of 94.0%. Resultant foreign

3 - 7
container volume is estimated at 343,000 TEU in 2020, and 594,000 TEU in 2030.
Table 3-1-6 Demand Forecast for International Containers (TEU)
(Unit: TEU)
Year 2000 2005 2010 2015 2020 2025 2030
Total Foreign 103,944 128,803 202,213 257,000 343,000 454,000 594,000
(Source: Study Team)
Figure 3-1-7 Historical Trend and Forecast of International Containers (TEU)
-100,000 200,000 300,000 400,000 500,000 600,000 700,000
2000 2005 2010 2015 2020 2025 2030
TE
U
Actual Forecast
(Source: Study Team)
6) Demand Forecast for Passenger Traffic
A total of some 11 million people embark and disembark every year at Cebu Baseport, and 12 million passengers
were recorded in 2005 (see Table 3-1-7 and Figure 3-1-8). The number of passengers at Cebu Baseport has been
stable over the past ten years. It is worthy to note that the number of passengers at Manila port is less than two
million per year and that the total number of passengers at all PPA ports is about 50 million per year. It is quite
clear from these records that Cebu Baseport is the center of maritime passenger traffic in Philippines.
Empirical records show that the correlationship between numbers of passengers and socioeconomic indices such
as per capita GRDP is low, and that the number of passengers has been stable over years. Therefore, it is
estimated that number of passengers at Cebu Baseport in 2030 will be 12 million, which is the largest number in
the past recorded at this port.
Table 3-1-7 Historical Trend and Forecast of Passenger Traffic at Cebu Baseport
(Unit:'000 Passenger)
Year 2000 2005 2010 2015 2020 2025 2030
Baseport Passenger 10,059 11,945 10,994 12,000 12,000 12,000 12,000
(Source: Study Team)
Year

3 - 8
Figure 3-1-8 Historical Trend of Passenger Traffic at PPA Ports and Cebu Baseport
010,000,000
20,000,00030,000,00040,000,000
50,000,00060,000,000
2000
2002
2004
2006
2008
2010
Pass
enge
rs
PPA Ports Cebu Baseport
(Source: Study Team)
7) Port Traffic at Cebu Baseport
Cebu Baseport registered a total of 29,963 shipcalls in 2010, of which 29,554 were for domestic trade and 409
were for foreign trade. The Total Gross Registered Tonnage (GRT) for foreign trade vessels has been increasing
rapidly in recent years while the number of shipcalls for this category has been rather stable for the same period.
This is attributed to the fact that the size of vessels engaged in foreign trade has been increasing year by year and
reached nearly 12,000 GRT per ship on average in 2009 (see Table 3-1-8).
The total GRT for foreign trade at Cebu Baseport is forecast by regression analysis with cargo throughput (MT)
for the past 5 years. The total GRT is estimated by a single regression formula with a coefficient of determination
of 83.2%. The resulting 27 million GRT in 2030 should be regarded as indicative only because an insufficient
number of observations are used in this analysis.
Table 3-1-8 Historical Trend of Port Traffic at Cebu Baseport
Year 2006 2007 2008 2009 2010Total Shipcalls 27,307 28,674 27,179 26,925 29,963Domestic Shipcalls 26,924 28,281 26,805 26,536 29,554Foreign Shipcalls 383 393 374 389 409Foreign GRT 3,106,074 3,661,896 3,730,938 4,640,278Ave. F. GRT/Shipcall 8,110 9,318 9,976 11,929
(Source: Study Team Based on CPA’s statistics)
Year
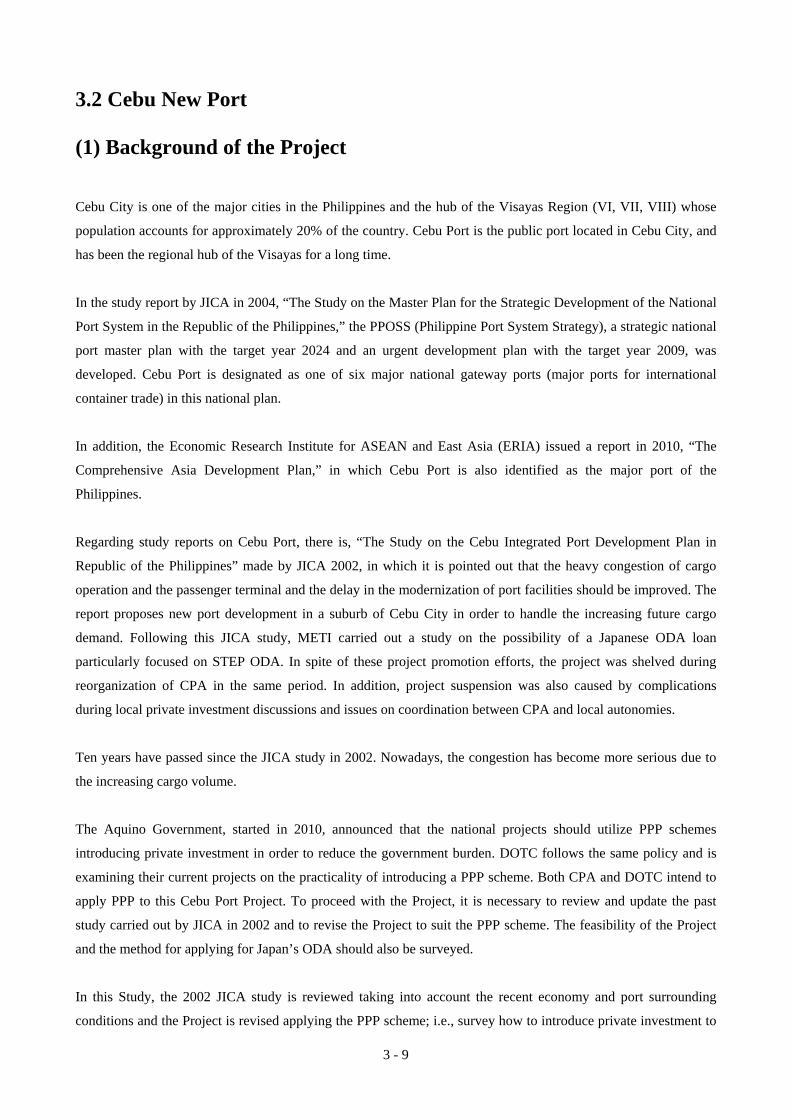
3 - 9
3.2 Cebu New Port
(1) Background of the Project
Cebu City is one of the major cities in the Philippines and the hub of the Visayas Region (VI, VII, VIII) whose
population accounts for approximately 20% of the country. Cebu Port is the public port located in Cebu City, and
has been the regional hub of the Visayas for a long time.
In the study report by JICA in 2004, “The Study on the Master Plan for the Strategic Development of the National
Port System in the Republic of the Philippines,” the PPOSS (Philippine Port System Strategy), a strategic national
port master plan with the target year 2024 and an urgent development plan with the target year 2009, was
developed. Cebu Port is designated as one of six major national gateway ports (major ports for international
container trade) in this national plan.
In addition, the Economic Research Institute for ASEAN and East Asia (ERIA) issued a report in 2010, “The
Comprehensive Asia Development Plan,” in which Cebu Port is also identified as the major port of the
Philippines.
Regarding study reports on Cebu Port, there is, “The Study on the Cebu Integrated Port Development Plan in
Republic of the Philippines” made by JICA 2002, in which it is pointed out that the heavy congestion of cargo
operation and the passenger terminal and the delay in the modernization of port facilities should be improved. The
report proposes new port development in a suburb of Cebu City in order to handle the increasing future cargo
demand. Following this JICA study, METI carried out a study on the possibility of a Japanese ODA loan
particularly focused on STEP ODA. In spite of these project promotion efforts, the project was shelved during
reorganization of CPA in the same period. In addition, project suspension was also caused by complications
during local private investment discussions and issues on coordination between CPA and local autonomies.
Ten years have passed since the JICA study in 2002. Nowadays, the congestion has become more serious due to
the increasing cargo volume.
The Aquino Government, started in 2010, announced that the national projects should utilize PPP schemes
introducing private investment in order to reduce the government burden. DOTC follows the same policy and is
examining their current projects on the practicality of introducing a PPP scheme. Both CPA and DOTC intend to
apply PPP to this Cebu Port Project. To proceed with the Project, it is necessary to review and update the past
study carried out by JICA in 2002 and to revise the Project to suit the PPP scheme. The feasibility of the Project
and the method for applying for Japan’s ODA should also be surveyed.
In this Study, the 2002 JICA study is reviewed taking into account the recent economy and port surrounding
conditions and the Project is revised applying the PPP scheme; i.e., survey how to introduce private investment to

3 - 10
the Project. In the matter of the selection of the new port location, more attention is paid to initial investment cost
and comparing the candidate locations because it is essential for the financial status of private investors as well as
the public authority, CPA. For the Study on PPP, analyzing investment sharing between public and private sectors
and determining the optimum cost distribution is proposed through preliminary financial analysis.

3 - 11
(2) The Study for Determination of the Project Contents
1) Selection of the New Port Site
1)-1 Review of JICA Study 2002
In the 2002 JICA report, five candidate sites were proposed and two sites were selected after comparing the five
on natural conditions, access to the existing port, safe ship navigation, restrictions due to aircraft navigation of
Mactan Airport, access network with industrial parks, land acquisition, and environmental aspects. The two sites
were further compared regarding construction cost and one site, “Consolacion,” was finally proposed.
Figure 3-2-1 Five Candidate Sites of New Port
(Source: JICA Report 2002)
Figure 3-2-2 shows the comparison results of the JICA report in 2002. The comparison was made in the manner
that each category has a full mark of 5 points, then three way evaluations were attempted, i.e., Standard
Evaluation, Weighted on Environmental Aspects, and Weighted on Construction Cost. The results show: the
Standard Evaluation gives 1st Cebu South (75pts) 2nd Consolacion (73pts), Weighted on Environmental Aspects
gives 1st Cebu South (78pts) 2nd Consolacion (73pts), and Weighted on Construction Cost gives 1st Consolacion
(74pts) 2nd Cebu South (23pts). This evaluation does not represent the difference of construction cost accurately
because it is expressed by points rather than in a qualitative way. In order to clarify the clear cost difference, we
have drawn a rough port plan for each site location. Then, the costs are calculated for comparison in this Study.
Consolacion
Mactan North Mactan South
Cebu South
Minglanilla
Cebu City

3 - 12
Figure 3-2-2 Result of Comparison on Five Candidate Sites, JICA Study 2002
73 73 74
65 66 6467
7067
7579
72
6165
60
0
10
20
30
40
50
60
70
80
90
STANDARD EVALUATION WEIGHTED ONENVIRONMENTAL
ASPECTS
WEIGHTED ONCONSTRUCTION COST
(Source: prepared by Study Team referring to JICA Report 2002)
1)-2 Port Plan of Each Candidate Site and Construction Cost
Figure 3-2-3 shows the port plan for each candidate site.
Every plan has reclaimed land sized 600 m x 500 m with a quay-wall length of 600 m. Reclamation and dredging
costs are estimated with volumes calculated by means of plotting layout onto a sea chart. Referring to the JICA
report, northern Mactan has calm sea conditions while southern Mactan has rather rough seas with the highest
wave height being 4 m. For the southern Mactan area, a breakwater is considered and its cost is estimated. An
access road is made connecting to the existing road, the length is measured, and its cost is estimated.
A1
Con
sola
cion
A2
Mac
tan
Nor
th
A3
Mac
tan
Sou
th
A4
Ceb
u S
outh
A5
Min
glan
illa

3 - 13
Figure 3-2-3 Port Plans of Each Candidate Site
●Access Road 500m
●Access Bridge 500m
●Reclamation 600m x 500m Average Depth -0.0m
●Basin Dredging 400,000m3
Alternative 1 Consolacion
A1 Consolacion
●Access Bridge 250m
●Reclamation 600m x 500m Average Depth -1.0m
●Basin Dredging 2,400,000m3
Alternative 2 Mactan North
Cebu Airport Runway
Approx. 1,000m distant from aircraft path
A2 Mactan North
●Causeway 3,800m
●Reclamation 600m x 500m Average Depth -0.0m
●Basin Dredging 7,600,000m3
Alternative 3 Mactan South
Wave Direction
●Access Road 1,400m
●Braekwater 600m, Ave. Depth -7.0m
A3 Mactan South
●Reclamation 600m x 500m Average Depth -5.0m
●Basin Dredging 2,300,000m3
Alternative 4 Cebu South
Wave Direction
●Access Road 150m
●Braekwater 1,200m Ave. Depth -10.0m
A4 Cebu South
Alternative 5 Minglanilla
●Reclamation 600m x 500m Average Depth -0.0m
Wave Direction
●Access Road 800m
● Braekwater 1,800m, Ave. Depth -13.1m
●Basin Dredging 4,200,000m3
A5 Minglanilla
(Source: Study Team)
Figure 3-2-4 shows the comparison of the construction costs of the five candidate port sites. As shown in the
figure, assuming the cost of Consolacion as 1.0, the costs of other candidates are, Mactan North 1.4, Mactan South
2.5, Cebu South 2.7 and Minglanilla 3.0. The cost at Consolacion is very low because: 1) reclamation volume is
small because the area is shallow (±0.0m), and 2) dredging volume is small because the seabed at the face of the
quay and its off-shore area is more than -13 m.
A5 Minglanilla
A4 Cebu South A3 Mactan South
A1 Consolacion A2 Mactan North

3 - 14
Figure 3-2-4 Comparison of Port Construction Cost of Each Candidate Location
83%
111%
83%
166%
97%
29%
92%
28%
51%
24%
71%
142%
5%
47%
4%
12%
0% 100% 200% 300% 400%
A1Consolacion
A2Mactan-North
A3Mactan South
A4Cebu-South
A5Minglanilla
Assume 1.0
1.4
2.5
2.7
3.0
Reclamation Dredging
Breakwater
Road
(Source: Study Team)
1)-3 Comparison of Each Candidate Location
Table 3-2-1 shows the comparison of each candidate location considering six factors including the previously
described cost of construction.
Table 3-2-1 Comparison of Each Candidate Location
Item A1 Consolacion A2
Mactan North A3
Mactan South A4
Cebu South A5
Minglanilla
Cost Assm 1.0 A 1.4 of A1 B 2.5 of A1 C 2.7 of A1 C 3.0 of A1 C
Future Expansion Potential
Good A Narrow C Good A Good A Good A
Access Baseport 10 km North Coast. Road
A 10 km Thr. Mactan Bridge
B15 km Thr. Mactan Bridge
C7.5 km South Coast. Road
A 18 km South Coast. Road
B
Conflict with Air-navigation
No conflict A Close to Air Route
C No conflict A No Conflict A No Conflict A
Environment Some Mangrove
B Some Mangrove
BSome Mangrove
B Little Plants A Some Mangrove
B
Social Some Fishermen
B Many Squatters
CRelocation Habitants
CClose to Residential
C Some Fishermen
B
Evaluation PPP Viewpoint
A B (-) Air navigation
C Cost is too high
C Cost is too high
C Cost is too high
(Source: Study Team)

3 - 15
【A1 Consolacion】
Consolacion is the plan with the least cost. For introducing a PPP scheme, the Consolacion plan is the most
advantageous as it can start with low initial investment cost. For future expansion potential, there is space to
extend the reclamation and the quay-wall 1,000 ~ 1,500 m toward the east although a private marina for pleasure
boats is located there (a preliminary negotiation was made during the 2002 JICA study). Regarding accessibility
to the existing port, the North Coastal Road has been completed up to an area near the new port location and will
be extended in the near future. There are no restrictions due to aircraft navigation because the Mactan Airport
runway is located a safe distance from the port quay-wall. Some mangrove trees are in the planned reclamation
area. Conservation and re-plantation are required to ensure that reclamation is separated from the existing
shoreline so that water passage can be secured while effectively maintaining the mangrove environment. The
number of replanted mangrove trees should be equal to or above the number of trees removed for the newly
developed reclaimed land. Small fishing activities have been observed so some compensation might be required.
【A2 Mactan North】
The construction cost for Mactan North is estimated to be approximately 1.4 times that of Consolacion. This
location is close to Mactan Airport and the distance between the port quay and the aircraft runway is only 1,000
m; thus, the height of the port facilities must be limited. To build these facilities as far as possible from the aircraft
runway, there is another restriction in that the opposite side of the airport is on the running approach channel of
the existing Cebu Port. The turning basin of the port crosses the approach channel, which increases the risk of
disturbing the ships navigating in and out of the channel. The potential for future expansion is rather small for the
same reason. However, at the time of this study, information was discovered that the government is currently
discussing relocating Mactan Airport to the Cordova district on the same island. If this plan is implemented soon,
the risk of aircraft navigation and the ship turning basin at the new port will be negligible. The location is near the
existing port, approximately 10 km away, but if the port is expanded and traffic increases, a third Mactan-Cebu
new bridge will be required. Regarding the environment, some mangroves are observed at the location, but
regeneration of trees is possible by re-planting them around the reclaimed land. Along the shoreline at the location,
there are many fishing villages; thus, their relocation and compensation for fishing rights might be very important
issues on implementation of the Project.
【A3 Mactan South】
The construction cost of the new port at Mactan South is estimated at 2.5 times the cost of Consolacion. The
reasons for this high cost are the requirements of dredging, the long distance of the new access road, and a
breakwater for wave protection. The wide area between the shoreline and the villages provides an advantage for
future expansion potential. However, the predominant wave direction is in the same line as the approach channel,
which causes the problem that the breakwater layout is not easy. For every future expansion of the port, the layout
of the breakwater may have to be changed or rebuilt. The access distance between the new and existing ports is
approximately 15 km. But, when the port is expanded and the traffic increases, a third Mactan-Cebu new bridge
will be required. Regarding the environment, some mangroves are observed at the location, but regeneration of
trees is possible by re-planting them around the reclaimed land. Along the shoreline at the location, there are some
fishing villages; thus, their relocation and compensation for fishing rights might be required on implementation of

3 - 16
the Project. In particular, the existing road for access to the villages is narrow and requires widening for port
traffic use. Many houses will have to be relocated along the existing road.
【A4 Cebu South】
The construction cost of a new port at Cebu South is estimated at 2.7 times the cost of Consolacion. The high cost
is due to requirements of dredging, the large reclamation volume caused by rather deep water and building of a
breakwater. For expansion potential, approximately 1,000 m of space is available for quay-wall extension. Access
to the existing port is very good at a distance of 7.5 km and is linked by the newly constructed South Coastal Road.
Regarding the environment, no mangrove plants or fishing grounds are observed. However, the most
disadvantageous point of this location is the consistency of port activities and the presence of residential parks that
are under development and face the port area. At the time of the JICA study in 2002, the Cebu South Reclamation
area was planned to be used for industrial development, but few developers were introduced despite advertisement
by the Cebu City Government. Cebu City changed the city planning making the use from industrial to
residential/commercial, and commenced selling. If the new port is built close to this area, it might result in heavy
traffic and a decrease in land value due to the decline in the residential environment, etc.
【A5 Minglanilla】
The construction cost of the new port at Minglanilla is estimated at 3 times the cost of Consolacion. The high cost
is due to requirements of dredging and building of a breakwater. The high cost for the breakwater is caused by the
steep and deep seabed topography. The expansion potential is high as the density of residential houses is low on
the surrounding shore. For access to the existing port, the distance is approximately 18 km using the state highway
and the South Coastal Road.
【Other Candidate Locations – Naga City】
Naga City, located 10 km west of Minglanilla, has a coastal industrial development project that is presently
underway. However, compared to other candidate locations, this location is disadvantageous because of the long
distance access to the existing port and the construction costs due to seabed topography.
Conclusion of Site Selection
As the result of the evaluation explained above, it is proposed that the most suitable location for the new port is
“Consolacion.” The strongest point in support of Consolacion is the construction cost, where the other conditions
are similar to other locations. Although there are some risks regarding the environment, there are several possible
ways to overcome these such as re-planting and reclamation layout allowing water flow to suit live mangroves.
The second cheapest, “A2 Mactan North,” is also a good option but it depends on the future relocation of the
existing Mactan Airport. The airport project is still at the conceptual level and the realization of the project
requires a long time. The existing Cebu Port has congestion problems that have to be solved urgently. Therefore,
this option is not suitable from a time schedule point of view. Also, it is noted that the cost of Mactan North is
higher than Consolacion.

3 - 17
(3) Description of the Project
1) New Port Planning
1)-1 Policy of Planning
a) Port Functions to be Moved to New Port
To plan the new port, first we have to determine what functions of the existing port should be moved to the new
port. In this Study, the functions to be moved are proposed taking into account the previously discussed port
demand forecast and the saving of the initial investment considering the introduction of a PPP scheme to the
Project.
In the existing port, there is a small space alongside the quay-wall for handling cargoes, which is the major cause
of congestion. There is no space for expansion as the land immediately behind the quay apron is owned by the
private sector. Expansion toward the offshore area is also limited because the navigation channel is close to the
quay-wall as the port is located at in a narrow strait between two islands. From these geographical conditions and
heavy congestion, it has been proposed for a long time that the port should be relocated to a new port to be
developed in the suburbs of metropolitan Cebu.
The existing Cebu Port has the following port functions:
a) International Container Terminal
b) International Bulk/General Cargo Terminal
c) Domestic Container Terminal
d) Domestic Bulk/General Cargo Terminal
e) Domestic Ferry Terminal
f) Domestic RORO Ship Terminal
g) Domestic Passenger Terminal
Out of these functions, the candidates to be relocated in the first step decided through discussions with CPA and
port operators are the International Container, International Bulk/General, and Domestic Container terminals.
If we consider the characteristics of a PPP business scheme, in other words, the requirement of repayment of debt
owed by investors for initial investment, the functions that should be moved in the first step should be ones that
are financially feasible.
Figure 3-2-5 and Figure 3-2-6 show the demand forecasts of international/domestic container and international
bulk/general cargo terminals.

3 - 18
The rate of increase in the international container demand forecast is 5.5% per year. The rate is not very high
compared to the rates of other major ports in Asia. Therefore, if we assume the international container terminal
should be moved to the new port, the initial investment share for the public sector should be set at a high level in
order to reduce the burden encountered by the private sector.
The rate of increase for domestic containers in the same forecast is 2.5% per year. The rate is lower than that of
international containers. The tariff (Container Handling Charge) of domestic container handling is controlled by
CPA and it is set at 60 - 70% of the international value in order to preserve the domestic market of cargo
transportation. Therefore, the priority to move domestic containers to the new port is thought to be lower than
international from the viewpoint of financial feasibility for the private terminal operator.
Figure 3-2-5 Demand Forecast of International/Domestic Container
343
594
0
100
200
300
400
500
600
700
2000
2005
2010
2015
2020
2025
2030
Year
Thr
ough
put (
1,00
0 T
EU
)
InternationalContainer(TEU)DomesticContainer(TEU)
ForecastPast Record
(Source: Study Team)
Figure 3-2-6 Demand Forecast of International Bulk General Cargo
2,011
1,106
515
0
500
1,000
1,500
2,000
2,500
2000
2005
2010
2015
2020
2025
2030
Year
Thr
ough
put (
1,00
0 M
T)
Import Bulk (MT)
Export Bulk (MT)
Import Breakbulk (MT)
Export Breakbulk (MT)
Total Import (MT)
Total Export (MT)
Grand Total (MT)
ForecastPast Record
(Source: Study Team)

3 - 19
Regarding international bulk/general cargo, if we assume it is moved with international containers, it is good for
the custom office as import/export procedures can be controlled at one place. The rate of increase in the forecast
shows 6% per year. There is little export as the most of the cargo are imports. The major commodities are rice
(general cargo), salt (bulk cargo), silica (bulk cargo) and steel cargo (general cargo), etc. Moving the international
bulk/general cargo to the new port is not recommended for the following reasons:
- Because most of the international cargo is imported while very little is exported, the increase of cargo is
thought to depend heavily on the regional GDP of Cebu. Looking at the statistics during 2000 - 2010, cargo
volume shows high and low levels. Such unstable growth might have a bad effect on the financial deal of new
port operations.
- According to a comment made by NFA regarding the future forecast of rice imports (it is the major import
cargo, 200,000~300,000 MT/year, approx. 50% of total imports), they are expected to decrease because under
a new national policy, the country will try to become self-sufficient for the domestic supply of rice.
- CPA built three bulk silos through co-investment with OPASCOR (private operator of international terminal)
recently, and is currently preparing to start importing grain. If port functions of bulk imports are moved to the
new port, this investment may become wasteful.
By these evaluations, it is recommended that only the international container terminal should be moved to the new
port. For other functions such as international bulk/general or domestic containers, it is recommended to survey
the timing of relocation to a time when recovery of investment will be nearly completed or when it is estimated
the risk is sufficiently reduced.
b) Timing of New Port Opening and Cargo Capacity
The timing of opening the new port should be adjusted to the time the cargo volume of the existing port reaches
capacity. The handling capacity of the international container terminal of the existing port is estimated as
approximately 300,000 TEU per year. Referring to the result of the demand forecast curve as shown in Figure
3-2-7, the time of opening the new port is proposed to be the year 2018. The initial capacity of container handling
of the new port is expected to be 400,000 TEU per year and is scheduled to increase to 500,000 TEU per year by
2023 by installing additional QCs and RTGs.

3 - 20
Figure 3-2-7 Demand Forecast of International Container and New Port Development
0
100
200
300
400
500
600
700
2000
2005
2010
2015
2020
2025
2030
Year
Thr
ough
put (
1,00
0 T
EU
)
Phase 1 New Port = 400,000TEU
Additional QC/RTG = 500,000TEU
Existing Terminal Capacity = 300,000TEU
ForecastPast Record
2018
2023
Phase 2 Expansion
(Source: Study Team)
The chronological table for planning until 2030 is as follows.
Table 3-2-2 Chronological Table of New Port Planning
Year Event
2011 International Container Throughput of Existing Port 200,000TEU/Year
2012~2018Planning, Design and Construction of New PortThroughput Increase to 300,000TEU/Year
2018New Port Open (Phase 1)Commence Operation with New Port Capacity 400,000TEU/Year
2020 Denamd Forecast 340,000TEU/Year
2023Throughput Increase to 400,000TEU/YearAdd QC/RTGs and Increase Capacity of New Port 500,000TEU/Year
2020~2026
Planning, Design and Construction of Expansion New PortMove International Bulk/General Cargo and Domestic Container from Existing Port toNew PortDemand Increase to 500,000TEU/Year
2026Open Expansion New Port (Phase 2)Planned Capacity is 600,000TEU/Year
2030 Demand Forecast 600,000TEU/Year
(Source: Study Team)
1)-2 Layout Plan of New Port
a) Berth Depth and Length
Figure 3-2-8 shows the sizes of international full container ships currently arriving in Cebu Port. The maximum
LOA (Length Overall) is 188 m (2,000 TEU equivalent), and the average LOA is 155 m (1,000 TEU equivalent).
The berth depth of the new port is set at -13.0 m taking into account the next generation feeder ships of 3,000
TEU.

3 - 21
Figure 3-2-8 LOA of Container Ships Arriving in Cebu Port
(Data: June –August 2011, International Container Ship)
0
5
10
15
20
25
30
35
80-9
0
90-1
00
100-
110
110-
120
120-
130
130-
140
140-
150
150-
160
160-
170
170-
180
180-
190
190-
200
LOA (m)
Fre
quen
cy
(Source: CPA data calculated by Study Team)
The berth length of the new port is set at L=450 m as shown in Figure 3-2-9. With this berth length, one next
generation container ship of 3,000 TEU and one present average sized ship of 1,000 TEU can berth at the same
time. Similarly, this length can also accommodate two ships of the present maximum size of 2,000 TEU.
Figure 3-2-9 Berth Length of New Port
LOA 240m (3,000 TEU)LOA 150m (1,000TEU)
LOA 180m (2,000TEU)LOA 180m (2,000TEU)
Full Loaded Draft = 12.1mFull Loaded Draft =8.8m
Full Loaded Draft = 11.0m Full Loaded Draft = 11.0m
Future Maximum Size Present Average Size
Presenyt Maximum Size Present Maximum Size
Berth Length 450m
(Source: Study Team)
b) Size of Reclamation Yard
The dimensions of the reclamation yard are set at 350 m wide and 650 m long. The space should be big enough to
plot a container yard with a capacity of 500,000 TEU/year and an additional port related area.
c) Layout Plan
Figure 3-2-10 shows the layout plan of the Phase 1 Project. In order to minimize the dredging and reclamation

3 - 22
volume, the reclamation area was plotted in shallow water (+/- 0.0 m) and the face of the quay-wall is aligned on
the line where the seabed is -13 m ACD. The reclamation is located approximately 250 m from the shoreline so
that the mangrove plants can be saved by water exchange through tide flow. The access road is planned to be an
elevated bridge-way for the same reason.
Figure 3-2-12 shows the layout plan of Phase 2 development. By 2030, the international container terminal should
be extended to 650 m in berth length. In addition, the domestic container terminal (400 m in berth length) and
approximately 50% of the international bulk / general cargo terminal (520 m in berth length) should be moved to
the new port.
Figure 3-2-10 Layout Plan of Phase 1 Development (New Port)
(Source: Study Team)
Turning Basin
Reclamation 350m x 600m
Berth Length 450m

3 - 23
Figure 3-2-11 Birds-eye Image of Phase I Development
(Source: Study Team)
Figure 3-2-12 Layout Plan of Phase 2 Development (New Port by 2030)
(Source: Study Team)
International Container Terminal
Domestic Container Terminal
International Bulk / General Cargo Terminal
650m650m
400m400m
520m520m
Turning Basin
400m
650m
520m

3 - 24
2) Container Terminal Plan
《 Berth Capacity 》
New container terminal is planned in referring to current operational conditions and with priority of the berth
productivity to enable to handle 500,000TEU in annual. The capacity is calculated based on the operational data
of current terminal operator, OPASCOR. 4 units of the 15 rows Quay Gantry Crane are planned to be installed at
450m berth. In the plan, 3 units of Quay Gantry Crane are installed initially and another 1 unit in implementation
later.
Table 3-2-3 Assumption of Operational Condition
Unit
m
Unit
Hour
Box
%
%
TEU Factor 1.4
Annual Crane Working Hours
Crane Productivity/hour
Crane Availabilty Ratio
Berth Occupancy Ratio
Item
450
4
Berth Length
No. of Quay Crane
7,623
25
90
53
(Source:Study team)
The berth capacity is calculated by following formula:
T = Q x H x P x A x B x TF Where : T : Berth Capacity (TEU) Q : Number of QC H : Working Hours P : Crane Productivity (Handling volume per hour) A : Crane Availability B : Berth Occupancy Ratio TF : TEU factor (Conversion factor per box to TEU) 1.4
The berth capacity is calculated at 500,000TEU in the berth length of 450m.
This capacity is proposed on the terminal plan at the initial stage based on current operational condition and
subject to extension of operational hours and to improvement of operational efficiency to cope with increase of
the handling volume.

3 - 25
《 Terminal Layout 》
《 Area of Quay/Apron 》
The planned terminal is proposed to have the quay of 450m in berth length and apron area incl. the back reach
space with 60m in width. The container yard including the back yard has 144,500 ㎡(14,5ha) with 340m in length
and 350m in width, except the access road.
《 Area of Marshalling Yard 》 The marshalling yard and backyard are calculated as follows;
M1 = ( My x Dw / Dy ) x P Where:
M1 : Required number of storage of container (TEUs) My : Annual container throughput (500,000 TEU) Dw : Average dwelling days (5 days) Dy : Operating days (365 days) P : Peak ratio (maximum storage ratio) (1.3)
Required ground slot is: S1 = M1 / L Where:
S1 : Required ground slot (TEUs) M1 : Required storage of containers (TEUs) L : Stacking height of containers (3.3 tiers)
Required area of ground slot is calculated based on the required ground slot of the required storage of each dry
containers and reefer containers :
Gy = { S1 ( 1 – h ) x i1 } + { S3 x i2 }
Where:
Gy : Area of ground slot (㎡) S2 : Ground slot of Dry Containers (㎡) h : Ratio of Reefer Container ground slot (10%) S3 : Ground slot of Reefer Containers (S1 x h) (㎡) i1 : Unit area of Dry Containers (14.9 ㎡) i2 : Unit area of Reefer containers (19.5 ㎡)
Required area of marshaling yard is: B = Gy x J Where:
B : Area of marshalling yard (㎡) J : Marshalling area factor
(conversion factor to the area including yard path) (3.0)

3 - 26
The required area of the marshalling yard is shown in Table 3-2-4.
Table 3-2-4 Marshalling Yard
Unit
TEU
TGS
㎡
㎡Marshalling yard Area100,000(10ha)
Container Grand Slot
500,000
2,160
Grand Slot Area 33,200
Item
Annual Handling Volume
(Source : Study team)
《 Area of Backyard 》
The following facilities and floor areas are proposed to be built in the backyard.
Main building/customs office 1,600 ㎡ Equipment maintenance shop 1,200 ㎡ Gate ( Main/Sub gates 7 lane ) 700 ㎡ Marine house 150 ㎡ Sub-power station 200 ㎡ ECD/Container Service Space 3,000 ㎡
The area of the backyard is calculated with the formula below:
C = B x K
C : Required area of backyard (㎡) B : Area of the facilities (㎡) K : Backyard area factor (conversion factor to area including yard path) ( 2.5 )
The required area of the backyard is shown in Table 3-2-5.
Table 3-2-5 Area of Backyard
Unit
㎡
㎡
㎡
㎡
㎡
㎡
㎡
㎡
6,850
17,500
Total
Backyard Area
700
150
200
3,000
Gate(Main/Sub Gate)
Marine House
Sub-Power Station
ECD/Container Service Space
Main Building/Customs Office
Equipment Maintenance Shop
1,600
1,200
Item Area
(Source : Study team)

3 - 27
The summary of the required Terminal areas are shown in Table 3-2-6.
Table 3-2-6 Summary of Terminal Areas
Unit ha
㎡ 2.7
㎡ 10
㎡ 17.5
㎡ 30.2
Backyard
Grand Total
27,000
100,000
17,500
144,500
Item Area
Quay/Apron
Marshaling Yard
(Source : Study team)
Figure 3-2-13 Terminal Layout Plan
(Source:Study team)

3 - 28
《 Quay/apron 》
The Panamax QCs with rail span of 30.48m are to be installed at the apron. The width of the apron is 60 m. The
condition of more than 3 QCs working in parallel for one vessel is considered. After the hatch covers are removed
and stored at the back reach, the running space of yard trailers behind QCs is ensured sufficiently for 2 way traffic.
The allocation of the marine house for the rest of gang and storage of cargo lifting operation gears should be
considered in the back reach when necessary.
《 Marshalling yard 》
The marshalling yard provides 9 lanes of 40 bays x 6 slot stacking area in principle. In consideration with the yard
condition in current terminal, it is recognized that the discharged laden containers have not stayed at the terminal
for a long period and have been delivered quickly. The storage of the empties containers is supposed to increase in
view of 70% of the loading container , and to need the sufficient storage space of the empty containers in the yard.
In assumption of the operational stacking height at 3.3 ties, the sufficient number of RTGs are to be arranged
considering that the delay and stoppage during operational peak should be prevented. As planned, 18 x One over
5-6 stacking RTGs are arranged at the least. The storage of empty containers are not planned additionally because
these empties are for exported, and can be managed in the stacking yard in the same manner as other containers.
The wider west passage way is provided with 35m in width including trailer waiting lane for due to possible
trailers queue for the gate-out containers delivered. RTG steering space is not included and separately arranged.
《 Storage of Reefer containers 》
At current operation, the storage of reefer containers is minimum at the terminal for quick delivery and can be
manageable within 45 plugs provided. However, in view of sufficient number of plugs/storage area required for
future operation after possible introduction of the new tariff rule for free time storage, 200 TGS reefer space
which is 10% of total TGS in assumption are planned in the same manner as other terminals, subject to review.
《 Facilities at the backyard 》
The terminal layout is considered in the priority of the basic operational functions and maximizes the space of the
cargo operation/storage. The facilities at the backyard are the minimum and are arranged only for this purpose. As
the devanning / vanning operation currently have been carried out at the outside private facilities, it is recognized
that the layout does not need to include CFS inside the terminal. In view of possible increase of storage of the
empty containers in future, the utility space for ECD / container service area of 3,000 ㎡ is provided in the
backyard.
《 Container Gate 》
The number of gates is planned at 7 lanes for main and sub gates in order to ensure quick turn time of the trailers
without any congestion in the traffic of yard. The provision of the sub-gate and flexible operation would
contribute to smooth traffic in gate-out in the peak in consideration that the majority of containers are for import.
The number of gates should be reconsidered after review.
The gate system in interface with terminal operating system is essential to ensure smooth operation and should be
studied for implementation as well as automatic gate system.

3 - 29
《 Terminal Management System 》
The current terminal does not have the system but the implementation of Terminal Operating System (TOS) for
ships planning, yard planning, yard/cargo operation, gate operation etc is definitely required for terminal
operational efficiency. Especially, the implementation of the system is essential for smooth operation including
yard operation for the customer trailers in parallel of the quay operation for 2~3 vessels in the peak time.
3) Cross Section of Quay-wall
As the preliminary design, a typical cross section of new container berths is shown in this section. In the 2002
JICA study, a steel sheet-pile (pipe) wall structure was proposed as the most economical type of structure. In this
Study, some cost saving ideas are introduced considering a similar cross section. To reduce the cost of dredging,
the location of quay-wall is plotted 200 m south of the original proposal by JICA in 2002. It is proposed that the
most economical structural type is a steel sheet-pile wall considering the local seabed topography and available
soil data. The proposed cross section is shown in Figure 3-2-14.
Figure 3-2-14 Proposed Cross Section of Quay-wall
(Source: Study Team)
3 - 30
4) Preliminary Design of Port Access Road
4)-1 Background
Cebu North Coastal Road is one of the major development projects of the DPWH in the Metro Cebu area. It is an
integral part of the overall road network system that runs parallel to the existing main north-south line of Cebu
North Road. Cebu North Coastal Road is the last remaining link to complete the arterial bypass from the southern
district of Talisay City to the central district (Cebu and Mandaue Cities) by way of the Cebu South Coastal Road
and the Mandaue Causeway, up to the northern district of Consolacion, Lilo-an, Compostela and Danao City. The
new road alignment links the northern town of Cebu to a new development area and facilities such as the proposed
Cebu International Container Port and Cebu Reclamation Development Project. Figure 3-2-15 shows the entire
Metro Cebu Urban Road Network Development Plan.
The Project of Cebu New International Container Port Access Road connects to this Cebu North Coastal Road at
Consolacion (STA. 3+100). Figure 3-2-16 shows the vicinity map of the Cebu New International Container
Terminal and Access Road.

3 - 31
Figure 3-2-15 Metro Cebu Urban Road Network Development Plan
CEBU-M
ACTAN
INTE
RNATIONAL A
IRPORT
(CIV
IL WORK
S/ EL
ECTR
O-
MEC
HANICAL W
ORKS;
EQUI
PMEN
T)
MACTA
N EXPO
RT
PROCES
SING
ZONE
(ENVIR
ONMENTA
L FAC
ILITY)
FIRS
T M
AN
DA
UE-
MA
CTA
N B
RID
GE
SEC
ON
D M
AN
DA
UE-
MA
CTA
N B
RID
GE
CEBU CITY
SOUTH
RECLAMATIO
N
MC
DP
I M
CD
P II
SE
CO
ND
MA
NDA
UE-M
AC
TAN
BRI
DG
E
BU
S TE
RMIN
AL
MC
DP
III C
EBU
SOUT
H C
OA
STA
L RO
AD
M
CD
P III
CEB
U C
ITY
SOUT
H RE
CLA
MA
TIO
N
PRO
POSE
D C
EBU
CIT
Y C
IRC
UMFE
REN
TIAL
ROA
D A
ND
DIS
TRIB
UTO
RSC
EBU
NO
RTH
CO
AST
AL
ROA
D
(LG
U)
LEG
END
:
SOLI
D W
AST
E (L
GU)
MA
ND
AU
E
RE
CL
AM
AT
ION
CEB
U P
ORT
SA
UTHO
RITY
(PO
RT C
ARG
O E
QUI
PMEN
T)
SEC
ON
D M
AN
DA
UE-
MA
CTA
N B
RID
GE
CEB
U N
ORT
H
CO
AST
AL
ROA
D
SE
GM
EN
T 3
B-2
Le
ng
th =
0.9
7 K
M.
(On
-go
ing
)C
om
ple
tio
n:
Ju
ne
20
09
Su
bway
Se
ctio
n
CO
NT
RA
CT
PA
CK
AG
E N
o.
1S
ta.
-0+
09
4 t
o S
ta. 1
+4
00
Le
ng
th =
1.4
9 K
M.
Bri
dg
e:
684
.13
m
SE
GM
EN
T 3
B-1
Le
ng
th =
0.3
0 K
M.
Co
mp
lete
d:
Jan
20
06
Off
sh
ore
Ra
mp
s
SE
GM
EN
T 3
A
Le
ng
th =
1.6
2 K
MS
.C
om
ple
ted
: O
ct.
20
03
Via
du
ct S
ect
ion
SE
GM
EN
T
Le
ng
th =
4.8
6 K
MS
.C
om
ple
ted
: O
ct.
20
02
2C
ause
wa
y S
ecti
on
SE
GM
EN
T 1
Le
ng
th =
4.4
6 K
MS
.C
om
ple
ted
: M
ay
200
4
Tal
isa
ySe
ctio
nCEB
U SO
UTH
C
OA
STA
L RO
AD
CEB
U S
OUT
H
RO
AD
CEB
U N
ORT
H
RO
AD
CEB
U N
ORT
H
CO
AST
AL
ROA
D
(Source: Study Team)

3 - 32
Figure 3-2-16 Vicinity Map for Proposed Cebu New International Container Port
and Access Road connecting to Cebu North Coastal Road
(Source: Study Team)
4)-2 DPWH investment program for Cebu North Coastal Road
Package 1 of Cebu North Coastal Road for the new Cansaga Bay Bridge across Cansaga Bay with approaches at a
length of 1.39 km was constructed in 2009 by DPWH. This Package 1 for the first approach starts at the coastal
terminus of the 4-lane Plaridel Extension in Brgy Paknaan, Mandaue City. The bridge traverses Cansaga Bay and
ends with its second approach at a junction with the existing provincial road at Brgy Tayud, Municipality of
Consolacion.
Based on the DPWH investment program, Package 2 of Cebu North Coastal Road for the construction of a new
bypass road will start at the end of the Cansaga Bay Bridge approach at Brgy Tayud, Consolacion. The new
coastal road runs in a westerly direction and ends at the junction with the existing Cebu North Road in Brgy
Jagobiao, Municipality of Lilo-an. This new alignment bypasses the heavily congested sections of the Cebu North
Road from the approach road to Fernan Bridge in Mandaue City to the town center of Consolacion.
Cebu New Sea Port Access Road will connect at STA. 3+100 in Consolacion of Package 2 for the Cebu North
Coastal Road.
Proposed Cebu North Road Project by DPWH Package-2 including SUBA Bridge
Cebu North Road Project Package-1 Cansaga Bridge done by DPWH Year 2009
NEW CEBU INTERNATIONAL CONTAINER PORT AND ACCESS ROAD

3 - 33
4)-3 Preliminary Design for Access Road
a) Design Concept
The design concept of the access road is to provide safe and smooth access and efficient movement of cargo
trucks to the national road of Cebu North Coastal Road. The access road consists of 830 m for a bridge and 150 m
for earth work with a trumpet-type interchange connecting to Cebu North Coastal Road Package-2.
b) Highway Design Standard
The following standards are mainly used as a reference in access road design.
- A Policy on Geometric Design of Highways and Streets, AASHTO 2004
- Highway Safety Design Standards Part 1 Road Safety Design Manual, May 2004, DPWH
- Japan Road Association, Road Structure Ordinance, 2004

3 - 34
c) Design Speed
The recommended design speed by the previous feasibility study was 80 km/h. In accordance with the Road
Safety Design Manual (DPWH, 2004) and considering the moderate topographic conditions and traffic safety
while staging construction, the design speed is recommended to be 80 km/h for the main access road and 60 km/h
for the ramp connecting to the new Cebu North Coastal Road.
d) Number of Lanes
According to the previous feasibility study, the traffic forecast of hourly design traffic volume was 392 veh/h in
the year 2010 and will be 983 veh/hr (11,702 veh/d) in 2020. 2 traffic lanes are required for each direction based
on the traffic forecast and the following reasons:
- Lanes in both directions are separated by a concrete curve median to provide smooth and safe traffic
movement.
- This access road is mainly used by cargo trucks going to and from New Cebu International Container
Terminal. The cargo must be able to be transported over the access road anytime even if the cargo trucks
have trouble or there is an accident along the access road.
e) Typical Cross Section
A typical cross section for the access road is as shown in Figure 3-2-17
Figure 3-2-17 Typical Cross Section for Earth Work Section
(Source: Study Team)
f) Plan and Profile for Access Road
The proposed Plan and Profile for the access road is shown in Figure 3-2-18 for Plan and Figure 3-2-19 for
Profile.

3 - 35
Figure 3-2-18 Plan for New Cebu Container Port Access Road
Connecting Proposed Cebu North Coastal Road Package-2 by DPWH
(Source: Study Team)
Figure 3-2-19 Profile for New Cebu Container Port Access Road
(Source: Study Team)
Cebu North Coastal Road Package-2
New Cebu Container Port Access Road
New Cebu Container Terminal

3 - 36
g) Structural Design Standard
The Structurral Design Standard shall be in accordance with the following codes and guidelines:
- AASHTO Standard Specifications for Highway Bridges 17th edition 2002
- DESIGN Guidelines Criteria and Standard for Department of Public Works And Highways
- Basic Specifications – DPWH Standard Specifications 2004, Highways, Bridges and Airports
- Alternatively, Japanese Standards also will be adopted as the structure design standards.
h) Typical Bridge Type
The typical superstructure type will be the AASHTO Prestressed I-Girder because it is the most economical and
widely used in the Philippines.
The typical substructure type will be a multi column with pier-head type pier with a bored pile foundation. The
column section will be a circular shape, especially in the seashore area to minimize the streaming inhibition.
A typical bridge type is as shown in Figure 3-2-20.
Figure 3-2-20 Typical Bridge Type (PC Girder Span=30 m)
(Source: Study Team)

3 - 37
5) Future Subjects to Study
This section explains the development strategy of the new port by referring to the conceptual design and port
planning. For implementation of the Project, more detailed and practical study is required. The points to be
covered in the future study are described as follows.
a) Monitoring Cargo Throughput and Comparison to Demand Forecast
Needs of the Project and its timing of implementation depend on the demand forecast. Therefore, it is required to
monitor the difference between the forecast and the actual output, and to continually know the timing of Project
preparations.
b) Natural Condition Survey for Detailed Planning
In order to make the plan details, a bathymetric survey, a wave and current survey, and soil investigation by
offshore boring should be carried out.
c) Selection of Private Terminal Operator
At present, the international terminal at the existing port is operated by OPASCOR under a contract with CPA. In
the event of new port development and shifting the terminal to the new port, studies are required on the matter of
the existing contract as well as the method of introducing new private operators.
d) The Effective Use of Port Related Area
In this Study, a plot for a Port Related Area (7 ha) is proposed behind the new container terminal. This area is for
future needs of warehouses or empty container yards. An additional study is required on how the yard should be
leased to the private sector, or how CPA can develop the area and introduce private users.
e) Development of North Coastal Road
Currently, the Department of Public Works and Highways (DPWH) plans to extend the North Coastal Road. In
this Study, a highway interchange at the connection between the Coastal Road and the port access road is
proposed. For implementation of the new port development, coordination on road planning between CPA/DOTC
and DPWH is required.

3 - 38
3.3 Cebu Existing Port
(1) Background of the Project
As explained in Section 3.2, some of the port functions need to be relocated to the new port, as the degree of
congestion will be heavier due to an increase in cargo demand. A study must be done on CPA’s role in
reorganizing the existing port after shifting the international container terminal from the existing port to the new
port. In addition, in redevelopment of the existing port, it is also important to establish a safe and convenient port
station and to create commercial space closely related to the people’s life activities.
Hereinafter, the background and necessity of the redevelopment Project are explained from two points: the role of
CPA and from the standpoint of port users.
1) The Role of CPA
As examined in the former section, CPA has to prepare the answers to the following subjects after the
international container terminal is moved to the new port that is planned to commence operation in 2018.
- CPA has to reshuffle the layout of the existing port after the new port begins operation. A new layout
deployment of the port functions is required to suit the future port demand forecast.
- From the CPA’s financial viewpoint, income from the international container terminal will vanish for the
existing port. We consider the Project is a financially closed unit in which the financial aspects of the new
port are separate from those of the existing port. In order to raise the feasibility of the Project, cost saving and
introduction of alternative income sources will be required.
- It has been observed that the high risk of accidents in the cargo handling operation is mainly due to the
narrowness of the cargo yard in the vicinity of the quay-wall. Moreover, passengers suffer the same risk as
they embark / disembark RORO or ferries passing through the quay apron where a lot of heavy equipment is
being used. It is essential that CPA ensure improvement of the safety.
2) From the Standpoint of Port Users
- The guarantee of a safe and comfortable trip is important for passengers who use the port to depart to / arrive
from Manila, Mindanao, etc. using a ferry or RORO.
- To improve the financial status of regional citizens, a strategy must be developed where the port, as a center
of commercial activities, will activate the economy. The PPP policy introducing private finance for
development is based on this activation of the economy.
In addition, if Cebu Baseport is redeveloped, the following effects are expected regarding the development plans
of the Baseport surrounding area.

3 - 39
- When passenger transport function improves and passenger's convenience and safety improve, the
convenience of moving between the surrounding areas, including the Central and Eastern Visayas regions, will
also improve. In addition, it is expected that the power of the province of Cebu and Metro Cebu as the hub of
economy and tourism will increase.
- Taking advantage of the location close to the urban core of Cebu, a part of the Cebu Baseport area will be
redeveloped for commercial and business use. Thereby, a combination of town and open space is created and
will contribute to the promotion of redevelopment in the urban core.

3 - 40
(2) The Study for Determination of the Project Contents
1) Present Status Surrounding Cebu Baseport
1)-1 Existing Land Use
Commercial land use accounts for most of the Cebu Baseport vicinity, and the other land is used for institutions,
industrial, vacant land, and parks & playgrounds (Figure 3-3-1).
Figure 3-3-1 Existing Land Use
(Source: Official Website of Cebu City)
1)-2 Zoning Policy
Land use zoning of the Cebu Baseport vicinity by an Ordinance Revising the Comprehensive Zoning Regulations
for the City of Cebu is shown in Figure 3-3-2.
The Cebu international container port area is designated as a transportation zone and the surroundings are
designated as C-2 for medium/high intensity commercial districts. The area from the northwest side of the C-2
districts to the 1st pier is designated as I-1 for low intensity industrial districts. The Central Business District

3 - 41
(CBD), the Prime Commercial Zone, and the Tourist Belt of Cebu city are located on the west side of this I-1
district.
In addition, the area from the 1st pier to Fort San Pedro, Plaza Independencia, and Cebu City Hall is designated as
the Civic Center, and the following policies are adopted in order to achieve compatible land uses relevant to the
establishment of the Civic Center:
- Undertake efforts to preserve and enhance the character of the area as a Civic Center;
- Promote the architectural design of buildings which respect the Spanish-Cebuano heritage, culture and
historical background;
- Promote or encourage the establishment of tourism-oriented projects within the site; and, to provide the
necessary support to its linkage activities including infrastructure requirements.
Figure 3-3-2 Zoning Map
(Source: City of Cebu)
Furthermore, as a historical area in Cebu City, Fort San Pedro and Plaza Independencia are described as the
Heritage Core, and the area on the west side is described as the Old Down Town Area.

3 - 42
Figure 3-3-3 History Town and Civic Center of Cebu City
(Source: City of Cebu)
1)-3 Redevelopment Procedure of Private Lands
Development on the private land of the port zone has restrictions on height and use, and developments that do not
conform to these restrictions require approval of both the lot owners association and CPA. Reconstruction that
does not exceed 18 meters in height and does not require a change in zoning does not require approval. The
restrictions are stated on the certificate of title of land.
2) The Present Conditions of the Existing Port
2)-1 International Container Terminal (B2~B5)
a) Ships Arriving at the International Container Terminal
Figure 3-3-4 shows the data of ship length overall (LOA) of international trade ships arriving in Cebu Port during
June - August 2011. The maximum LOA was 188 m and the average was 155 m. The maximum and average LOA
of international trade ships except for container ships were 175 m and 110 m respectively.

3 - 43
Figure 3-3-4 International Ships’ LOA and Frequency of Arrival
0
5
10
15
20
25
30
35
20-3
0
30-4
0
40-5
0
50-6
0
60-7
0
70-8
0
80-9
0
90-1
00
100-
110
110-
120
120-
130
130-
140
140-
150
150-
160
160-
170
170-
180
180-
190
190-
200
LOA (m)
Freq
uenc
y
Container ShipOther Ship
(Source: Study Team)
b) Berthing Time of International Trade Ships
Figure 3-3-5 and Figure 3-3-6 show the frequency of each range of berthing time of international trade ships using
data from June - August 2011. The container ships show the longest berthing time of 30 - 40 hours, while other
ships show approximately 10 days at maximum and 3.6 days on average. The average berthing time of rice cargo
ships, which were major commodity carriers of the port, was 5.6 days.
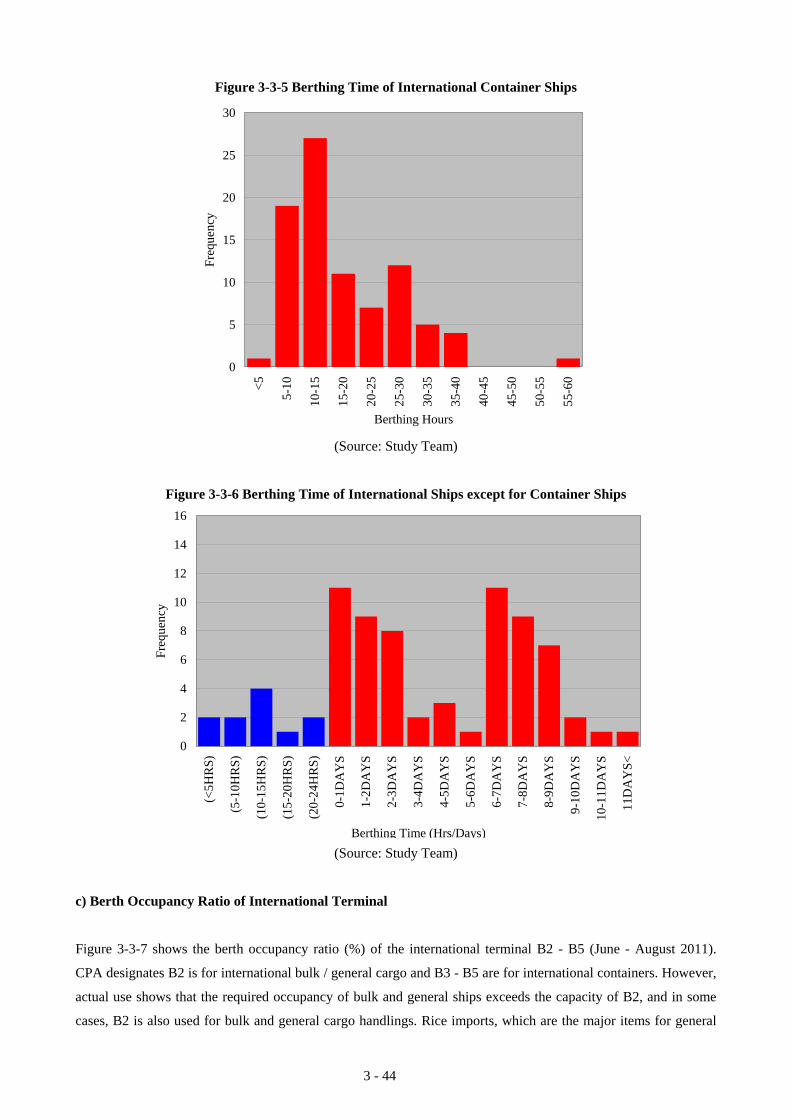
3 - 44
Figure 3-3-5 Berthing Time of International Container Ships
0
5
10
15
20
25
30
<5
5-10
10-1
5
15-2
0
20-2
5
25-3
0
30-3
5
35-4
0
40-4
5
45-5
0
50-5
5
55-6
0
Berthing Hours
Fre
quen
cy
(Source: Study Team)
Figure 3-3-6 Berthing Time of International Ships except for Container Ships
0
2
4
6
8
10
12
14
16
(<5H
RS
)
(5-1
0HR
S)
(10-
15H
RS
)
(15-
20H
RS
)
(20-
24H
RS
)
0-1D
AY
S
1-2D
AY
S
2-3D
AY
S
3-4D
AY
S
4-5D
AY
S
5-6D
AY
S
6-7D
AY
S
7-8D
AY
S
8-9D
AY
S
9-10
DA
YS
10-1
1DA
YS
11D
AY
S<
Berthing Time (Hrs/Days)
Fre
quen
cy
(Source: Study Team)
c) Berth Occupancy Ratio of International Terminal
Figure 3-3-7 shows the berth occupancy ratio (%) of the international terminal B2 - B5 (June - August 2011).
CPA designates B2 is for international bulk / general cargo and B3 - B5 are for international containers. However,
actual use shows that the required occupancy of bulk and general ships exceeds the capacity of B2, and in some
cases, B2 is also used for bulk and general cargo handlings. Rice imports, which are the major items for general

3 - 45
cargo of the port, is seasonal. The high season of the rice import is February - August; the period of data taken for
this survey was during the high season.
The figure shows that the occupancies of B2 and B3 are in the range of 50 - 60%, which nearly reaches the berth
capacity.
Figure 3-3-7 Berth Occupancy Ratio of International Terminal
14%20%23%
8%57%
13%5%
23%
8%
0%
10%
20%
30%
40%
50%
60%
70%
80%
90%
100%
B2(L=130.5m)
B3(L=128.0m)
B4(L=128.0m)
B5(L=128.5m)
Berth No.
Ber
th O
ccup
ancy
Others
Rice
Container67%
54%
25% 27%
(Source: Study Team)
2)-2 Domestic Terminal (B6~B28)
a) Berth Occupancy Ratio of Domestic Terminal
Figure 3-3-8 shows the berth occupancy of B6 - B23 for August 2011.
CPA designates B6 to be used as a domestic container berth and deploys 1 quay gantry crane (QC). Although the
original data did not reveal the berthing time of container ships for the berths B7 - B23, we observed some full
container ships berthing at B8 - B12. Container cargo handling at B8 - B12 is done by ships’ crane because a QC
is not installed at these berths. The main reason the users tend to use these berths even though the capacity of B6
is still not full (data shows occupancy of 40%) is that cargo owners are reluctant to use B6 due to the increased
cost of using QC.
B8 - B9 are used for the Superferry that sails Manila - Cebu - Mindanao. The Superferry usually arrives 3 - 5
times a week, and the average berthing time is 3 - 3.5 hours per arrival. Some ROROs or other ferries use B8 and
B9 while this Superferry is not berthed.
B13, B14, B20 (Pier 3) and B26 (Pier 1) are exclusively used for passenger ships. The CPA passenger terminal
building is located alongside B13, where small passenger ships berth. Their average LOA is 35 m. B14 is for the

3 - 46
private operator Supercat passenger fast crafts. The Supercat ship shuttles passengers from Cebu to Bohol or
Leyte islands. Their average LOA is 24 m. Berth occupancies of B13 and B14 are about 30%, mainly due to the
night moorings, and normal berthing time for passengers is 20 - 30 minutes; thus, these berths can afford to
accommodate more ships. B20 (Pier 3) is a long pier fixed perpendicular to the quay face line on which a
passenger building is installed. Here, fast-craft passenger ships and smaller sized ferries are berthed. The average
LOA of B20 is 35 – 45 m. The berth occupancy of B20 is also rather low at 30 - 40% and does not reach the
maximum capacity. In the past, B23 was also used for passengers, but the terminal building has been demolished
so it is used for cargo ships at present.
Figure 3-3-8 Berth Occupancy Ratio of Domestic Terminal
16%12%
8%14%
54%
32%
3%
52%
24%
57%
39%14%
15%
11%
8%
6%
3%
13%
91%
13% 12%
12%
26%
100%
30% 30%
17%
31%
-
10%
20%
30%
40%
50%
60%
70%
80%
90%
100%
B6(128m)
(*1)
B8(140.0m)
(*1)
B9(125.0m)
(*1)
B10(125.0m)
(*2)
B11(125.0m)
(*2)
B12(125.0m)
(*3)
B13(125.0m)
(*3)
B14(125.0m)
(*3)
B15(125.0m)
(*3)
B16(125.0m)
(*3)
B17(125.0m)
(*3)
B18(L=90m)
(*3)
B20N(L=155m)
(*3)
B20S(L=155m)
(*3)
B21(130m)
(*3)
B22(130m)
(*3)
B23N(155m)
(*3)
Passenger/Ferry
Container/RORO w.o. Pass.
RORO with Passenger
Super Ferry
39%
30%
28%
18%
21%
60%
30% 30%
34%
16%
52%
91%
30%
42%
37%
83%
Note: (*2) means assumed capacity of the berth whose number shows the maximum number of ships berthing at the same time (only for the purpose of calculation).
(Source: Study Team)
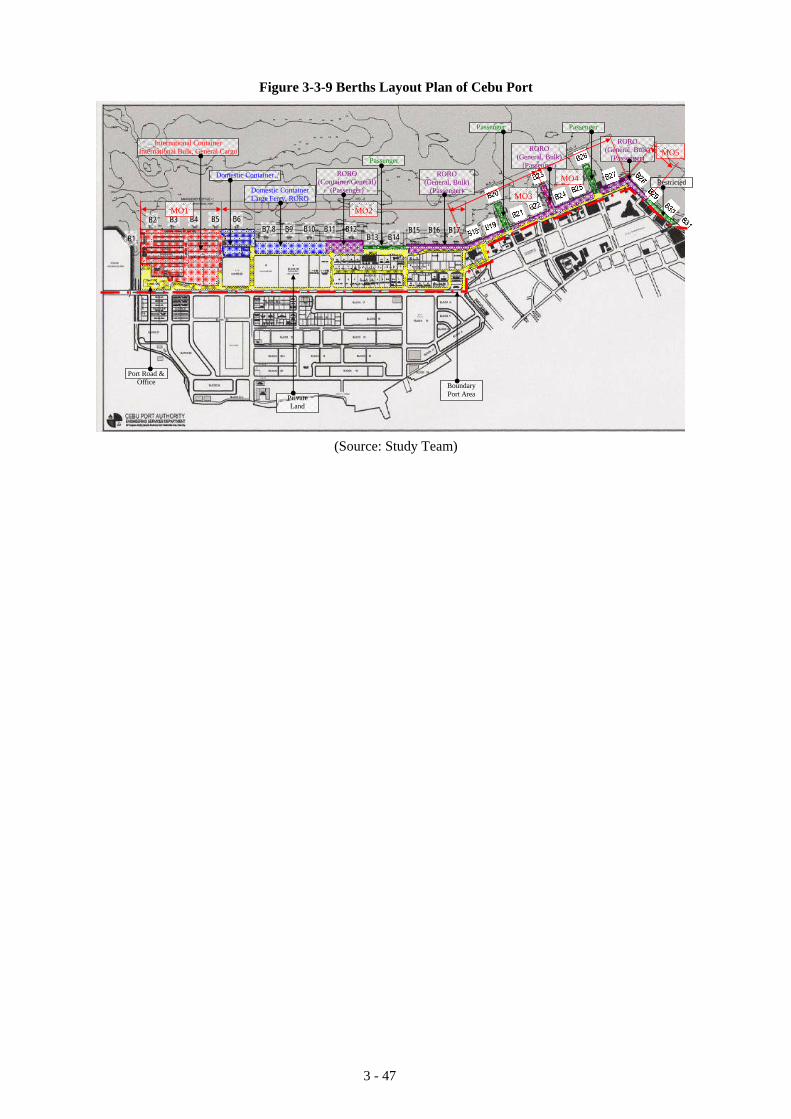
3 - 47
Figure 3-3-9 Berths Layout Plan of Cebu Port
B1
B2 B3 B4 B5 B6 B7,8 B9 B10 B11 B12
B13 B14 B15 B16 B17
International Container International Bulk, General Cargo
Domestic Container
Passenger
RORO (Container/General)
(Passenger)
Passenger Passenger
RORO (General, Bulk)
(Passenger)
RORO (General, Bulk)
(Passenger)
RORO (General, Bulk)
(Passenger)
RestrictedDomestic Container Large Ferry, RORO
Port Road & Office Boundary
Port AreaPrivate Land
MO1 MO2
MO3
MO4
MO5
(Source: Study Team)

3 - 48
b) Present Condition of Southern Berths (B28~B31)
The quay face of the south end of the existing port bends westward. Its quay-apron is quite small and there is only
one access way from the public road; therefore, it is highly congested.
The berths presently used for cargo are B28 and half of B29. The rest, the other half of B29 and B30 are reserved
for presidential office use, where no cargo operations are carried out.
In the Master Plan of Cebu Baseport, an area around the berths of B31-33, which were closed due to the Cebu
South Coastal Road Project, was planned to be a redevelopment area. The present situation of the area is as
follows (Figure 3-3-10):
- The berths of B31-33 are not being used.
- Construction of Cebu South Coastal Road has been completed and is being used. Although the site of the
turnoff is secured, construction has not started, and the present vacant lot is subsequently used as a turnoff.
- A sidewalk has been constructed on the sea side of Cebu South Coastal Road, but it is a roped-off area.
- The historical building (Maritime Building) close to the berth of B32 is not used.
- Between the berth of B33 and Cebu South Coastal Road, reclamation is already completed and the area is
vacant.
- In the block on the north side of the Maritime Building, commercial development through renovation of old
buildings is being carried out (under construction).
Figure 3-3-10 Existing Cebu Baseport
(Source: Cebu Port Authority)

3 - 49
3) Cargo Operation at Cebu Baseport
3)-1 International Container – Cargo Operation (B2~B5)
The handling volume of the international containers was recorded at 200,000 TEU in 2010 and is expected to
exceed 220,000 TEU in the forecast of 2011. Looking at the breakdown of 2010, the import accounted for 47%
and export for 27%, of which a large portion was loading of empty containers.
Currently, all international containers have been loaded/unloaded at B2-5 except for some shipped by domestic
feeder vessels and ferries. Cargo handling has been undertaken by Oriental Port & Allied Services Corporation
(OPASCOR) assigned by CPA. The style of cargo operation is in exactly the same manner as the general cargo
ships under a cargo operation contract between the stevedore and shipping carriers. The storage/delivery of the
containers loaded/unloaded has also been arranged by this stevedore but the billing of charges for these associated
works, including the electricity for reefers, is the responsibility of CPA. OPASCOR is assigned mainly for quay
cargo operation and not as the terminal operator who have undertaken all operations and terminal management.
The general overview of terminal facilities, cargo operation and layout are shown below.
Figure 3-3-11 International Container Terminal B2-5
(Source: Oriental Consultants Sept. 2011)

3 - 50
Table 3-3-1 International Container Terminal – Facilities and Overview of Operation
Unit
m
㎡
㎡
TGS
TEU
Hour
Unit
Unit
Unit
Vessel
TEU
Box
Box/h
Container Yard
Grand Slot
Terminal Operating Hours/d
Storage Capacity
Item Q'ty
Berth Length
Terminal Area
328
Berth Operation
3
11
No. of Vessels called (Annual)
2 x 11 rows GC, 1 x 13 rows GCNew 1 x GC to be delivered in 2012。One over 4 RTG x 9units, One over 5 RTG x 2units2 x One over 6 RTG to be delivered in 2012
Actual in 2010 for Container ships.MCC domestic containers vessels are included.
Except Empty container storage area (600TEU)45 Reefer plugs
Average Berth Productivity 50
Annual Handling Volume 144,360
Quay Gantry Crane
RTG
Reach Stacker 2
Annual Handling Volume
Remark
General cargo ships (International) also berthingat B-1,2
08:00-17:00 in normal operating except ships cargooperation.
Container Terminal
Container Handling Equipment
514
70,000
40,000
1,770
21
7,080
only for International containers
in use of 2 x Gantry cranes.
202,110
TEU factor 1.4
(Source: Study Team)
Table 3-3-2 Overview of Cargo Operation
Import 86,969 95,754
Year 2009 2010
Export 42,490 51,179
Empty Container 50,635 55,178
Total (TEU) 180,094 202,110
(Source: prepared by Study Team based on OPSCOR data)

3 - 51
Figure 3-3-12 Layout of International Container Terminal
(Source:OPASCOR)
NF
A W
AR
EH
OU
SE
S
WAREHOUSE
BAGGINGAREA
TR
AN
SF
ER
TO
WE
R
SIL
O 1
SIL
O 2
SIL
O 3
HO
PP
ER
AP
RO
NA
PR
ON
AL
PH
A 1
AL
PH
A 2
AL
PH
A 3
AL
PH
A 4
AL
PH
A 5
BR
AV
O 1
BR
AV
O 2
BR
AV
O 3
BR
AV
O 4
BR
AV
O 5
PR
ES
EN
TG
AT
EC
ON
TR
OL
CF
S A
RE
A
E W
SN
LO
CA
LC
ON
TA
INE
RY
AR
DB
UR
EA
U O
FC
US
TO
MS
SE
IZE
DC
AR
GO
AR
EA
BO
C C
ON
TA
INE
RS
CA
NN
ER
SH
IP-T
O-S
HO
RE
GA
NT
RY
QU
AY
CR
AN
ES
BE
RT
H 2
- 1
30.5
MB
ER
TH
3 -
128
MB
ER
TH
4 -
128
MB
ER
TH
5 -
128
MB
ER
TH
6 -
128
M
CP
A C
AN
TE
EN
FA
BR
ICA
TIO
NA
RE
A
MO
TO
RP
OO
L
PO
WE
R H
OU
SE
&P
UM
P S
TA
TIO
N
GA
TE
2
GA
TE
3G
AT
E1
PR
OP
OS
ED
CO
MF
OR
TR
OO
M
ON
E-S
TO
PIM
PO
RT
-EX
PO
RT
DO
CU
ME
NT
AT
ION
CE
NT
ER
GA
TE
PR
OP
OS
ED
EN
GIN
EE
RIN
GS
ITE
PR
OP
OS
ED
GA
TE
CO
NT
RO
L O
FF
ICE

3 - 52
Berth Operation
As of October 2011, 5 liner vessels have berthed weekly and regularly with an average handling volume of
500-1,000 boxes per vessel. 2 quay gantry cranes are set up for one vessel and take 10-20 hours to complete cargo
operations. There appear to be some vacant hours at the berth but occasionally, 2 vessels berth at the same time
and need 3 gantry cranes for cargo operation. The ships cranes sometimes work in parallel with the dockside
gantry cranes in order to ensure completion of the cargo operation on time. In cases where one or 2 general cargo
vessels have used B-1, the longer stay may affect the berthing schedule of the container vessels at B-2/3 due to the
length being more than 130 m; but, it has been confirmed that the berthing schedule can be manageable without
congestion including waiting at anchorage. The shipping agents determine the number of gantry cranes to hire for
cargo operation so that the work can be completed within the allowed port stay, and they submit an order to
OPASCOR because hiring shore gantry cranes requires extra cost in the tariff. Under this operation, the stevedore
company is only required to manage achievement of crane productivity (25 moves per hour/crane) as specified in
the contract with the shipping agencies, and does not undertake the terminal management entirely. In
consideration to current berth occupancy and provision of 3 quay gantry cranes, this terminal is capable of
handling 300,000 TEU. This was also confirmed by an interview with the executives of OPASCOR.
The terminal accepts late delivery of loaded containers until 2 hours after the vessel arrivals. Therefore, they
usually start loading operation subsequent to completion of the unloading operation. In view of lower occupation
of the berth, the shipping agents sometimes delay the departure time awaiting arrival/loading of the late delivered
containers but it depends on the availability of the berth and the allowance in the vessel’s schedule.
The berthing schedule of regular callers and their handling volume are summarized below.
Table 3-3-3: Berthing Schedule and Handling Volume of Regular Container Vessels (as of October 2011)
Day
Tuesday
Thursday
Friday
Saturday
Sunday
Operating Hours No.of QC
RCL 10 2
20 2-3
6 1
Shipping Carrier Handling Volume/vsl
APL
Evergreen
Bengal Tiger Line
500
1,000
500 10 2
600 12 2
Maranas 150
(Source: Study Team)
・Yard Operation
The yard capacity has 7,080 TEU stacking four containers high, and is occupied at 52-60% of capacity in normal
operation. The free storage period has been set at 6 days for the import-laden containers, 5 days for export-laden
containers and 3 days for empty containers. No specific problems regarding yard capacity have been reported
because the berthing frequency is about one vessel per day, and the free period for the export-laden containers and

3 - 53
empty containers is rather short. Storage of the reefer containers can be provided with 45 reefer plugs. Most reefer
containers are delivered to the consignees immediately after discharge due to the lack of free storage time.
・Cargo Operation Capacity
The yard operation can be managed by stacking 3 high to handle 300,000 TEU. Therefore, the current yard
capacity is recognized as sufficient to cope with this demand. The terminal operation capacity is realized for a
berthing capacity of 300,000 TEU based on the current terminal arrangement.
3)-2 Domestic Container – Cargo Operation (B6~B10)
a) Berth B6
CPA statistics show that the handling volume in 2010 was 247,295 TEU. According to an interview with the
stevedores, 70% of the domestic containers were moved by container vessels and the balance was carried by ferry
and large-sized RORO vessels. For the domestic container carriers, MCC transport has used B5 for
loading/unloading of 220,000 TEU annually and B6 for 40,000-50,000 TEU of National Marine / Lorenzo as B6
is for use of the container vessels with the quay gantry cranes. Other container shipping carriers have used B8-10
where no quay crane is available. Cargo operation at B8-10 is undertaken by ship’s cranes. The ferry and RORO
vessels also have used B8-10. The domestic cargo movements show the same tendency as international in that the
inbound volume is larger than the outbound of which 70% of the cargo is empty containers. The major domestic
container operators are listed as Sulpicio / Gothong Southern / National Marine / Lorenzo Shipping / MCC / 2GO
(NVOCC) / Ocean Transport / Oceanic Transport / Negros Navigation / Aboitiz.
The stevedore company, Cebu Integrated Arrastre (CIA), has been assigned to do cargo operation at B6 by CPA
since May 2010. They have provided the quay gantry crane and straddle carriers for quay cargo operation and
yard operation. They are undertaking discharge and loading cargo work similarly to OPASCOR. No terminal
management function exists. CIA is also undertaking cargo operation of the container vessels operated by their
contract carriers, which are berthing at B8.
The general overview of terminal facilities and cargo operation are shown below.

3 - 54
Figure 3-3-13 Domestic Container Terminal B6
(Source: Oriental Consultants Sept. 2011)
Table 3-3-4 Domestic Container Terminal – Facilities and Overview of Operation (B6)
(Source: Study Team)
Unit
m
㎡
㎡
TGS
TEU
Hour
Unit
Unit
Unit
Vessel
Box
TEU
Box/h
Item Q'ty Remark
Container Terminal
Berth Length 176 A part of B-5 Berth included.
Terminal Area 15,400
Container Yard 7,840
Grand Slot 240 Modified to RTG operation yard in 2012
Storage Capacity 720 960 TEU after RTG operation started.
Terminal Operating Hours/d 2408:00-17:00 in normal operating except ships cargooperation.
Container Handling Equipment
Berth Operation
Quay Gantry Crane 11 x 13 rows GC.One GC to be delivered in 2012.
RTG 4 4 x One over 5 RTG to be delivered in 2012年
Straddle Carrier 4 For 2/3 tiers
No. of Vessels called (Annual) 28-32 LOA 90-130m
Handling Volume (2010) 40,860 May - Dec., 2010
Calculated with TEU factor
Average Berth Productivity 26,7 by 1 GC
Handling Volume (2010) 48,960

3 - 55
・Berth Operation
The cargo operation record of the stevedore for Aug-Sep 2011 shows that they handle 20~230 moves per berthed
vessel for 7-8 vessels per week. Only one quay gantry crane is installed but the cargo operation is often carried out
through parallel operation with ship cranes because most of the container vessels are equipped with cranes. The
shipping agents have sometimes preferred to use the ship cranes even if the quay gantry crane is available because
an extra charge is incurred for use of the quay gantry crane. Because of this, the quay gantry crane has a low
utilization of 20%. The long stoppage of the crane resulted in low productivity in 2010 at 16.5 moves/hour that
improved to 25 moves/hour in 2011. 26.7 moves/hour was achieved after they contracted for productivity with
their customers and shipping agents. The main users of the shipping carriers at B6 are 2 companies: National
Marine Corp. and Lorenzo Shipping Corp.
・Yard Operation
CPA has recognized the problems of short storage and cargo handling space caused by the limited backspace of
the quay and have managed to shorten the cargo storage period by setting a short free storage period in the port
tariff (one day for inbound containers and two days for outbound containers). The container yard at B6 cannot
accommodate all containers loaded/unloaded so CIA have provided their off-dock CY, which is located at
Mandaue (2 km away from the quay) and have accepted/released the majority of the containers. The container
yard at the quay only accepts storage of containers to be immediately loaded on the vessel alongside. The
transportation between the quay and off-dock is undertaken by trailers and is accounted for by the
shipper/consignee and shipping agents. 80% of the handling containers have been shifted between the quay and
off-dock CY and the balance for direct release/acceptance at the B6 container yard. CIA is currently working on
changing the yard operation to an RTG operation to increase the storage capacity of the container yard at the quay.
They expect to start operation in 2012. No storage facility for reefer containers is provided at the container yard.
All reefer containers are currently released/accepted directly from/to the vessel. The overview of the off-dock CY
facilities is shown below.
Table 3-3-5 CIA Off-dock CY Facilities
Unit
㎡
TEU
Box
Unit
Q'ty
1,900
Remark
1,200
350
3
at 2-3 Tiers
Straddle Carrier
Item
No. of Container per gate/d
Storage Capacity
Container Yard
Container Handling Equipment
(Source: Study Team)
・Cargo Operation Capacity
The capacity of container terminal B6 can be calculated by the berthing capacity because the shortage of yard
capacity can be complemented sufficiently by the function of off-dock CY, provided that the haulage is in order.

3 - 56
CIA is going to install an additional crane in 2012, which will contribute to an increase in the handling capacity to
more than 100,000 TEU. However, achieving this goal depends on an increase in use of the quay gantry crane
instead of relying on ship cranes.
b) Berth B10
Cargo operations of other container vessels and large sized RORO vessels other than Superferry have been mainly
carried out at B10. The container vessels use their own cranes. RORO vessels use the trailers provided at the quay.
For ferry and RORO vessels, in principle, all containers are loaded with a trailer chassis for quick cargo operation
within the limited port stay. The productivity of ship cranes is reported to be 8-10 moves/hour. The major
domestic container carriers, Gothong Southern and Sulpicio, have used B10 for their ship cargo operations. The
back area of the quay is very limited and has only short-time storage space of 200-400 TEU. Thus, each carrier
provides their own off-dock CY at nearby areas and hauls the containers between the quay and off-dock CY in a
similar manner to OPASCOR and CIA. The containers that are to be immediately loaded onto the next vessel
alongside are allowed to be accepted/stored at the quay. In addition, the back area is also occasionally used for
cargo devanning and vanning space. The stevedores of B10 are CIA, USD1 and CASCOR.
Figure 3-3-14 Domestic Container Berth and Back Area B8-10
(Source: Oriental Consultants Sept. 2011)
3)-3 Domestic Superferry and RORO Vessels with Passengers (B8~B9)
In general, the small and medium-sized ferries and RORO vessels dock alongside the berth with the stern
(Mediterranean style) at Cebu Port. Superferry has exclusively used B8-9 for her berthing in ordinary style. The
cargo operation and embarkation/disembarkation have been carried out simultaneously due to the short port stay
of around 3-6 hours. The containers on Superferry have been loaded/unloaded with the chassis as well as other
cargo operation of the large sized RORO vessels. The flagship of Superferry called “Superferry 12” has the
capacity to accommodate 711 passengers and 160 trailers. The details of Superferry vessels are listed below.

3 - 57
Table 3-3-6 Details of Superferry Vessels Berthed
Passenger(People)
Trailer(unit)
711 160
800 100
Capacity
Calling PortsShips Name LOA GWT
Superferry 12
Superferry 2
165
139
9,710
7,270
Manila/Cagayan
Manila/Buntan/Surigao
(Source: Study Team)
The operator of Superferry, Aboitiz, have provided the container depot at Mandaue for off-dock CY and container
storage, and haul all unloaded containers to this depot for release to the customers.
For movement of the passengers, the number of embarkations/disembarkations for August 2011 shows 105
passengers per vessel on average for Superferry 2 and 373(embarkation) / 283(disembarkation) for Superferry 12.
These 2 ferries carry 14,000 passengers monthly. The ferry company provides bus transportation from/to the
passenger terminal at B13 for the passengers but it has been observed that this service does not comply with the
demand of all passengers, who when disembarking, have exited by walking through the gate of Pier 4.
The cargo and passenger operation for August, 2011 is listed below:
Table 3-3-7 Superferry – Cargo and Passenger Operation
Unit
Vessel
People
People
Ton
Ton/h
Embarking: 6,141 Disembarking: 7,797
Dischargeing : 5,066 T Loading : 3,140 T
216
1,367
Berth Productivity
No. of Cargo Handling per vessel in average
RemarkItem
No. of Calling
No. of Passengers (Embarking/Disembarking)
No. of Passengers per vesselfor embarking/disembarking
Q'ty
26
13,938
536
(Source:Study Team)
Note that the cargo operation for Superferry achieved higher productivity by chassis operation for containers due
to quick work required for short port stay.

3 - 58
Figure 3-3-15 Berth for Superferry B8-10
(Source: Oriental Consultants Sept. 2011)
Figure 3-3-16 Cargo Operation for Superferry/Large RORO Vessels
(Source: Oriental Consultants Sept. 2011)
3)-4 Domestic RORO Vessels with Passengers (B 9-12, B 15-18, B19-28)
Large-sized RORO vessels of more than 5000 GWT normally use B9-10 for docking alongside the berth. The
medium vessels of less than 5000 GWT use B11-12, B15-17 to berth Mediterranean style. The small vessels of

3 - 59
less than 500DWT use B19, B21-22, B24-25, etc. in Mediterranean style. Most of the small and medium-sized
RORO vessels provide cargo ramps and passenger access in the stern. Due to this, berthing in Mediterranean style
can save space and contribute to quick and easy operation. Most vessels arrive/berth after the evening and stay
until midnight/next morning. The vessels moor tightly with very small distances between vessels (10~20 m) so
that several vessels can dock in one berth length of 125 m at the same time. Regarding cargo, large vessels load
the cargo containers with chassis, trailers and other mobile vehicles in most cases, but the majority of small and
medium vessels have palletized cargo and break-bulk general cargoes with small to large lots as the opening of
cargo ramp and height/width of the cargo deck are varied and limited. In cargo operation of these vessels, in some
cases, 3.5 ton forklifts are arranged at the cargo hold and the quay for delivery over the ramp due to the height gap
between the quay and cargo hold floor. The cargo operation for small vessels fully relies on labor-intensive work
without any equipment. Because of this, the back area of the quay becomes very congested from handling the
cargo and moving cargo handling equipment in an unsafe manner. In addition, the embarkation and
disembarkation of passengers definitely contributes to the congestion and unsafe conditions at the quay as most of
the passengers have actually exited by walking through the cargo handling area even though a transportation bus
has been arranged.
The productivity of cargo operation for these RORO and ferry vessels depends on the size of vessels and declines
from large to small because the small vessels need more labor-intensive work. The small ferries and RORO
vessels are recognized as significant transportation carriers of passengers and daily commodities between the
nearby islands.
Figure 3-3-17 Cargo Operation of Large-sized RORO Vessels (B11)
(Source: Oriental Consultants Sept. 2011)

3 - 60
Figure 3-3-18 Cargo Operation of Medium-sized RORO Vessels(B18)
(Source: Oriental Consultants Sept. 2011)
Figure 3-3-19 Cargo Operation of Small-sized RORO Vessels(B21-22)
(Source: Oriental Consultants Sept. 2011)

3 - 61
4) Method of Planning the Existing Port
The main issue of port planning for the existing Cebu Port is how to reduce the congestion of operation at berths
and their aprons. Port planning is studied taking into account the demand forecast discussed in Section 3.1 and
assuming the international container terminal will be moved to the new port. It is assumed that the congestion can
be mitigated by eliminating the container terminal from the existing port (the new port is planned to begin
operation by 2018), but if demand increases as forecasted, the congestion will recur someday. Therefore, making
clear the degree of decreased congestion after removing the international container terminal and required facility
development for the short-term 2020 port plan is discussed.
In Cebu Port, temporary storage of cargo for loading / unloading is difficult because the CPA owned cargo
handling space alongside the quay-wall is very small. Therefore, the cargo operation is carried out in a way that
the cargo transported from private storage by trucks or trailers is directly loaded onto the ship, and the cargo on
board the ship is directly unloaded on to a wheel carrier and driven out of the port immediately. It is expected that
the capacity of the port is more dependent on the ability to berth than on the yard size for storage. Therefore, berth
occupancy is taken into account quantitatively for the port planning method.

3 - 62
(3) Description of the Project
1) Port Planning of the Existing Port
1)-1 Basic Policy of the Project
The basic policy of the project is as follows:
- International container terminal will be moved to the new port according to the increase of port demand
(scheduled by 2018).
- Evaluate whether capacity of existing port is adequate or not before opening of new port.
- After commencement of operation of the new port, study is required on facility investment of the existing port
as the short-term development plan 2020.
- Considering the financial burden for CPA due to new port development, minimum required development on
the existing port should be recommended. In addition, a PPP scheme should be introduced on redevelopment
by leasing or selling part of the CPA owned port land so that the gained income will complement the budget
of the existing port.
- For the middle-term development plan targeted in 2030, some port functions should be relocated section by
section to the new port when the capacity of the existing port is saturated.
- For the further long-term plan after 2030, only the passenger terminal should remain at the existing port and
all cargo functions should be moved to the new port.
1)-2 Degrees of Congestion of Each Terminal
a) Congestion of International Terminal
The international terminal handles both container and bulk / general cargo and it is not easy to evaluate congestion
separating these functions. Therefore, it is assumed that international container terminal will be moved to the new
port by 2018 as discussed in the former section, and the degrees of congestion are to be estimated before / after the
shifting of the international container terminal. The estimate is carried out taking the berth occupancy ratio into
account as the critical factor also considering the result of the commodity-wise demand forecast.
a)-1 Congestion before Operation of New Port
Until opening of the new port (2018), it is assumed that international container and bulk / general cargo will be
handled at the berths B2 - B5 (4 berths, 515 m long). The limit capacity of the berth occupancy is assumed at 65%,
which is equivalent to the maximum of the actual figure at B2. The following figures show the curve of demand
for international container and international bulk / general cargo calculated by the commodity-wise demand
forecast.

3 - 63
Figure 3-3-20 Demand Forecast of International Container and Rate of Increase from Present Year 2011
International Container (TEU)
306
343
594
202
0
100
200
300
400
500
600
700
2000
2005
2010
2015
2020
2025
2030
Year
Thr
ough
put (
1,00
0 T
EU
)
51% Increase
70% Increase
(Source: Study Team)
Figure 3-3-21 Demand Forecast of Bulk / General Cargo and Rate of Increase from Present Year 2011
Import/Export Bulk (MT)
960
559
1,106
0
500
1,000
1,500
2,000
2,500
2000
2005
2010
2015
2020
2025
2030
Year
Thr
ough
put (
1,00
0MT
)
72% Increase
98% Increase
(Source: Study Team)
From these figures, international containers are estimated to increase 51% over the present throughput volume,
while international bulk / general cargo will increase 72% by 2018. On the other hand, the current berth
occupancy ratios of international container and bulk / general cargo berths (B2 - B5) are estimated at 15%
(container) and 29% (bulk / general). From this information, berth occupancy before new port opening (2018) is
calculated as shown in Table 3-3-8. It is foreseen that the occupancy ratio will increase to 71% (B2 - B5 total),
which will nearly reach the maximum capacity.
Table 3-3-8 Forecast of Berth Occupancy Ratio before Opening New Port (2018)
(Source: Study Team)
BerthOccupancyContainer
BerthOccupancy
Bulk/Brkbulk
Total BerthOccupancy
At present 2011 15% 29% 43%
2018年 22% 49% 71%
51% Increase 72% Increase

3 - 64
a)-2 Congestion after Operation of New Port (2020)
After opening of the new port, international cargo of the existing port will be only bulk / general cargo as the
international containers will be moved from the existing port. As Figure 3-3-21 shows, cargo volume of bulk /
general is estimated to increase 98% over the present 2011 volume. Table 3-3-9 indicates the estimated figure of
berth occupancy at 2020 assuming the cargo will be handled with some berths B2 - B5. If the cargo is handled by
all B2 - B5, berth occupancy 2020 is estimated at 57%. Trial calculation shows that if 3 berths (B2 - B4) are used,
occupancy exceeds capacity, while using 4 berths (B2 - B5) gives some spare capacity.
From these analyses, it is proposed B2, B3 and B4 are to be exclusively used for international bulk / general cargo,
B5 is to be commonly used for bulk / general and domestic containers, and B6 is to be used for domestic
containers exclusively.
Table 3-3-9 Forecast of Berth Occupancy Ratio after Opening New Port (2020)
Berth OccupancyContainer
Berth OccupancyBulk/Brkbulk
Total BerthOccupancy
At present 2011 15% 29% 43%
98% increase2020(4berths) 0% 57% 57%2020(3berths) 0% 75% 75%
2020(3.5berths) 0% 65% 65%
Move to Newport
(Source: Study Team)
b) Congestion of Domestic Container Terminal
b)-1 Congestion before Operation of New Port
Figure 3-3-22 shows the estimate of the increase of domestic container cargo applying the same method as for
the international terminal. According to the demand forecast, increases are estimated at 22% (2018) and 31%
(2020).
Figure 3-3-22 Demand Forecast of Domestic Container and Rate of Increase from Present Year 2011
Domestic Container (TEU)
348365
279
0
100
200
300
400
500
2000
2005
2010
2015
2020
2025
2030
Year
Thr
ough
put (
1,00
0 T
EU
)
25% Increase
31% Increase
(Source: Study Team)

3 - 65
As the calculated present berth occupancy was 39% (Figure 3-3-8), it is estimated to increase 49% by 2018. This
still gives spare capacity if the assumed capacity is 65%.
Table3-3-10 Forecast of Berth Occupancy Ratio before Opening New Port (2017)
BerthOccupancy
At present 2011 39%
2018 49%25% Increase
(Source: Study Team)
b)-2 Congestion after Operation of New Port (2020)
While B6 is for domestic containers, some container ships are currently berthing at B8 - B12. Table 3-3-11 shows
the estimated berth occupancy at 2020, assuming all container ships use only B5 or B6 (assumed at 1.5 berths).
Here, the existing condition assumes that approximately 40% of all domestic containers are loaded / unloaded at
berths other than B6. The estimate shows that as the occupancy reaches 60% in 2020, the status will be nearly
maximum capacity.
Table 3-3-11 Forecast of Berth Occupancy Ratio after Opening New Port (2020)
BerthOccupancy
BerthOccupancy
Total BerthOccupancy
At present 2011 39% 30% 69%
20201.5Berths=B5,B
34% 26% 60%
31% Increase31% Increase Move to Newport
(Source: Study Team)
c) Congestion of Domestic Other Terminal (non-container)
c)-1 Congestion before Operation of New Port
As Figure 3-3-23 shows, the increase of domestic bulk / general cargo is estimated at 17% (2017) and 22%
(2020).

3 - 66
Figure 3-3-23 Demand Forecast of Domestic Bulk / General Cargo
and Rate of Increase from Present Year 2011
Domestic Non-Container Total (MT)
6,5156,819
5,567
0
1,000
2,000
3,000
4,000
5,000
6,000
7,000
8,000
9,000
10,000
2000
2005
2010
2015
2020
2025
2030
Year
Thr
ough
put (
1,00
0MT
)
17% Increase
22% Increase
(Source: Study Team)
Berth occupancy before new port opening (2018) is estimated at 56%, which is less than existing capacity.
Table 3-3-12 Forecast of Berth Occupancy Ratio before Opening New Port (2017)
BerthOccupancy
Bulk/Brkbulk48%
56%
At present 2011
2018
17% Increase
(Source: Study Team)
c)-2 Congestion after Operation of New Port (2020)
After the new port opening, it is assumed all domestic containers will be handled at B5 or B6 while no container
ships will berth at B8 or southern berths. Here, berth occupancy by container ships at B8 or southern berths is
assumed at 3% of the common average 48%, while the present value of occupancy is set at 45%. From Table
3-3-13, berth occupancy in 2020 is estimated at 55% if existing quay-walls are used unchanged. If we assume B20
(Pier 3) and B26 (Pier 1) will be converted to cargo berths from passenger, and B28 with worsened condition will
be disused, the estimated occupancy is 47%.

3 - 67
Table 3-3-13 Forecast of Berth Occupancy Ratio after Opening New Port (2020)
BerthOccupancy
Bulk/Brkbulk48%At present 2011
2020B20 & B26 converted to Cargo Berth (21 berths)
2020Before Development (18 Berths)
55%
47%
22% Increase
(Source: Study Team)
d) Congestion of Passenger Terminals
Berth occupancy of passenger terminals B13 and B14 is about 30%. Berthing time of these passenger ships is
generally short, estimated at roughly 15 minutes - 1 hour because embarkation / disembarkation of passengers is
quicker than cargo loading / discharging. The 30% occupancy value comprises night mooring rather than
passenger boarding; thus, the actual occupancy ratio should be much smaller. In addition, the demand forecast
shows a rather conservative increase.
Berth occupancy of B20 (Pier 3) and B26 (Pier 1) is estimated at 30 - 40%, which is also not a high value.
Figure 3-3-24 Demand Forecast of Passenger and Rate of Increase from Present Year 2011
Passenger (Pax)
12,000 12,00011,195
0
2,000
4,000
6,000
8,000
10,000
12,000
14,000
16,000
18,000
20,000
2000
2005
2010
2015
2020
2025
2030
Year
Thr
ough
put (
1,00
0PA
X)
7% Increase 7% Increase
(Source: Study Team)

3 - 68
1)-3 The Suitable Location of Commercial and Public Spaces for Development
The location of commercial development sites by private sectors or public space sites such as a parks, etc. at Cebu
Baseport, is considered from the following viewpoints:
- Requirement of facilities and equipment as renewal port
- Appropriate location, function and scale as a commercial/public area in consideration of surrounding land
use and the city master plan
- Circulation of port-related traffic and other traffic
- Intention of redevelopment by private landowners in the port zone
- Private developer’s view on redevelopment
- Profitability of CPA land by sale or lease.
Regarding the location of the commercial development sites or public sites at Cebu Baseport, the following three
places as shown in Figure 3-3-25, are assumed as proposed sites.
- Existing International Container Port area
- Existing private lots in Port area
- The area around Fort San Pedro
Figure 3-3-25 Proposed Sites for Commercial Development or Public Space
(Source: Study Team)
The results comparing these three proposed sites are shown in Table 3-3-14. The existing international container
port area is suitable for the location of commercial development sites and public space sites, and the area around
Fort San Pedro is suitable for the location of public space.
Sites proposed forSite for Commercial or Public Spaces

3 - 69
Table 3-3-14 Comparison Table for Proposed Sites of Commercial/Public Area
Existing International Container Port Area
Existing Private Lots in Port Area
The Area Around Fort San Pedro
CPA Land CPA can gain large proceeds from land sales or land rental.
There is almost no CPA land.
The area of CPA land is not large.
Using a marine building commercially requires an agreement with the organizations concerned.
City Planning Since this area is distant from the central business district (CBD), the effect on city planning is not large.
It’s close to commercial-2 District.
Same as left. Since this area is positioned in Civic Center and an historic area of Cebu City, it is important for city planning.
This area is close to commercial areas.
There is a plan to make a marine building into a maritime museum.
Port Function Since it is an area that hasdepth and port facilities can be easily arranged, selling off or renting is wasteful.
The port will be divided and it is hard to manage for CPA or Private Operator.
While it is desirable to make the southwest side from Pier 1 into a collected public space, rearrangement of the existing port function is needed.
Private Sector
Large-scale commercial development by private sector is possible.
It is disadvantageous for commercial development not to be redeveloped to the waterfront line, to be intermingled with port functions, and to touch the arterial road, which is congested with container trucks.
Same as left. Same as left. It is hard for a private
developer when business feasibility is dependent on negotiation with a landowner.
When there are many restrictions on preservation and utilization of an existing historical building, the profitability for private sectors may decrease.
There is almost no room for large-scale commercial development by the private sector.
Evaluation Suitable for locating commercial buildings / public
space
Difficult to locate commercial buildings / public
space
Suitable for locating commercial buildings
(Source: Study Team)
Figure 3-3-26 Redevelopment Plan of the Area Around Fort San Pedro
(Source: Study Team)

3 - 70
1)-4 Port Plan 2020
The proposed port layout plan for 2020 is shown in Figure 3-3-27. In this plan, the international container terminal
is moved from the existing port by the target year 2018. On this occasion, the contents of redevelopment at the
existing port are as follows.
Figure 3-3-27 Proposed Layout Plan of Existing Port 2020
Sky-Walk for Passenger
Superferry
Port Commercial Center
Bulk/General
Container Yard
Parking Parking
International Bulk/General
Domestic Container
Passenger
DomesticFerry/RORO/General
Commercial Development
Convert Terminal (Pier 1 & 3) Passenger → General Cargo
(Source: Study Team)
Figure 3-3-28 Bird’s-Eye View of Proposed Layout Plan of Existing Port 2020
(Source: Study Team)

3 - 71
a) International Bulk / General Cargo Terminal
B2, B3, and B4 are for exclusive use for international bulk / general cargo. B5 should be common use for the bulk
/ general and domestic container in accordance to the cargo demand increase.
b) Domestic Container Terminal
B6 is to be used for the domestic container terminal, which is the same as present. B5 should be common use for
the bulk / general and domestic container in accordance to the cargo demand increase. The space where the
custom office building is presently located is to be redeveloped as an additional container yard. Cooperation with
the custom office is needed so the office should be relocated to another place, for instance to the planned private
development commercial buildings.
c) Passenger Terminal
A new terminal building is to be built in front of B13 and B14, which will integrate public/private terminal
functions presently located separately in the existing port. Terminals of Pier 1 and Pier 3 should also move into
this new terminal building. In order to hold berthing capacity for passenger ships and ferries, two lines of the new
pier in the form of floating pontoons are to be installed at B13 and B14. At present, passengers are embarking /
disembarking at other cargo berths for ROROs and ferries. The separate passenger terminals should be combined
in one terminal, which gives the advantage of safety because transportation (by bus) of passengers from/to RORO
berths will be able to be managed by a single unit office. B13 and B14 are almost at the center of the port so the
location is convenient and good for time saving for passengers.
Superferry is using B8 and B9 and will be assigned the same location because of the long size of the ship and
because it handles a large volume of cargo along with with passenger boarding. The passenger terminal for
Superferry is to be located in the new private commercial building and an elevated walkway from the terminal to
the face of the quay should be installed to ensure the safety of passengers.
d) Domestic Cargo Terminal
B8 - B12 and B15 - B27 will be allocated to the domestic cargo terminal. In order to reduce congestion due to the
future increase in cargo, B20 (Pier 3) and B26 (Pier 1) are to be converted to cargo berths, while passenger
terminals built on these piers are to be demolished. B28 and B29, which suffer from poor access and a narrow
apron, will not be used.
e) Introduction of Private Commercial Building
The space presently used as CPA office / parking and other offices (6 - 7 ha area) located west of the existing
international container yard will be used for a private investment area, for which the CPA should examine the
possibility of leasing or selling the land to developers. Developed commercial buildings should accommodate a
retail shopping mall as well as the offices of CPA, customs, etc. CPA should gain revenue from the effective use
of this land space.

3 - 72
1)-5 Port Plan 2030
The proposed port layout plan for 2030 is shown in Figure 3-3-29. In this plan, parts of port functions are moved
to the new port when the capacities of each function are saturated due to an increase in demand. According to the
demand forecast study, initially, congestion of international bulk / general cargo terminal will become serious
followed by the domestic container terminal. The proposed plan is dependent on these port functions (part of the
international bulk / general and entire domestic container will be moved to new port) being moved from the
existing port.
Figure 3-3-29 Proposed Layout Plan of Existing Port 2030
International Bulk/General
Passenger
Domestic Ferry/RORO/General
Commercial Development
Sky-Walk for Passenger
Superferry
Port Commercial Center
Bulk/General
Parking Parking
(Source: Study Team)
The contents of redevelopment at the existing port by 2030 are as follows:
a) International Bulk / General Cargo Terminal
B2 - B6 are allocated to the international bulk / general cargo terminal, while a part of the same function should be
moved to the new port when its demand exceeds the capacity.
b) Domestic Container Terminal
Domestic container terminal is moved to the new port by the target year 2030.
c) Expansion of Private Commercial Building
After shifting the domestic container terminal from the existing port, the container yard can be used for expansion
of the commercial building. CPA should study effective use of this space by the target year 2030.
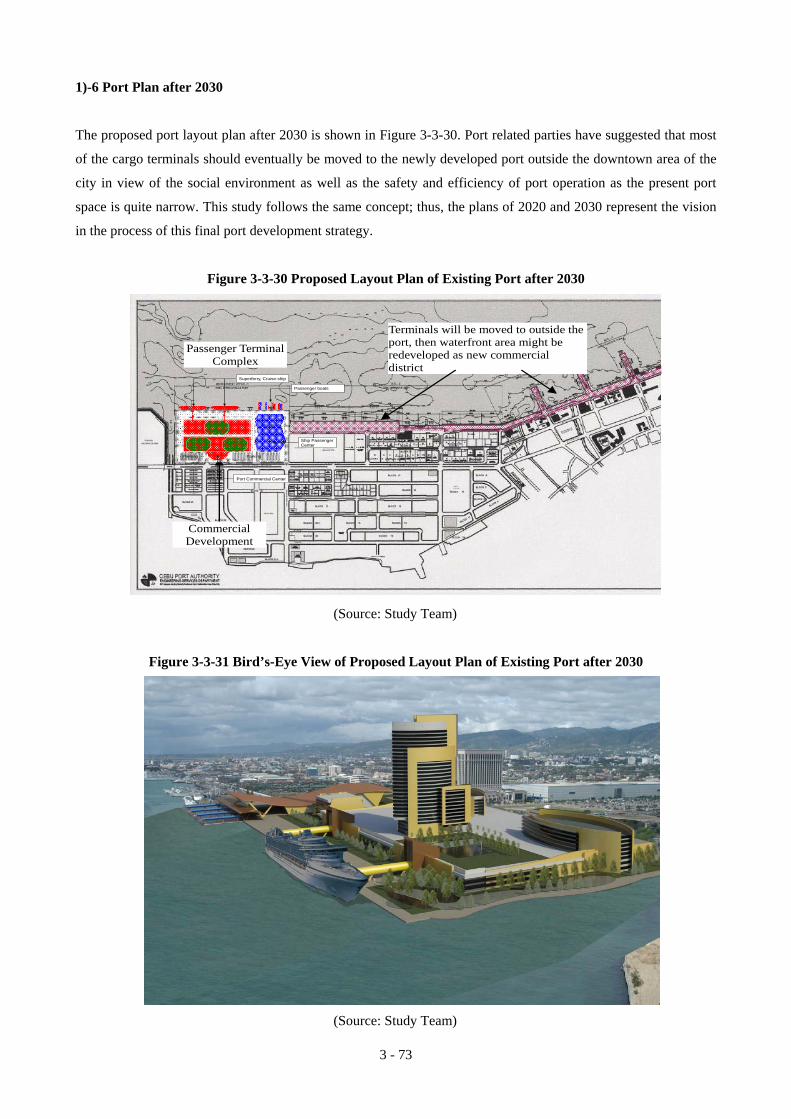
3 - 73
1)-6 Port Plan after 2030
The proposed port layout plan after 2030 is shown in Figure 3-3-30. Port related parties have suggested that most
of the cargo terminals should eventually be moved to the newly developed port outside the downtown area of the
city in view of the social environment as well as the safety and efficiency of port operation as the present port
space is quite narrow. This study follows the same concept; thus, the plans of 2020 and 2030 represent the vision
in the process of this final port development strategy.
Figure 3-3-30 Proposed Layout Plan of Existing Port after 2030
Terminals will be moved to outside the port, then waterfront area might be redeveloped as new commercial district
Commercial Development
Ship PassengerCenter
Passenger boats
Superferry, Cruise-ship
Port Commercial Center
Parking Parking
Passenger Terminal Complex
(Source: Study Team)
Figure 3-3-31 Bird’s-Eye View of Proposed Layout Plan of Existing Port after 2030
(Source: Study Team)

3 - 74
The contents of redevelopment at the existing port after 2030 are as follows:
a) Passenger Terminal Complex
The present container terminal and yards behind the quay-wall are proposed to be redeveloped as a passenger
terminal complex that is to be composed of the passenger terminal, a commercial shopping mall, hotels or
residential areas, or public / private office space. The space occupied by NFA, the storage warehouse for import
rice, is to be used upon requesting the cooperation of relevant authorities.
Floating piers installed at B13 and B14 as per the plan of 2020, are to be reused and relocated to this place to save
costs.
b) Relocation of All Cargo Terminals from Existing Port
All cargo terminals are to be relocated from the existing port. CPA must carry out a careful study on the
relocation area as to whether the rest of the port functions are to be moved to the new port proposed at
Consolacion, or moved to another large-scaled industrial development such as Mactan North or Cordova, both of
which are still conceptual and under discussion with the local autonomies.
c) Redevelopment of Existing Port Area
After relocation of port functions carried by B8 - B29, the space owned by CPA should be redeveloped. The
strategy and development concept should be studied by CPA considering the wishes of members including the
port owners association, Cebu city government, private investors, etc.
This Study does not cover discussion on this point, but it might be possible to redevelop the southern block for a
public park incorporating historical facilities like Fort Saint Pedro. Moreover, the middle block of the port might
be suitable for developing residential buildings, hotels or restaurant malls taking advantage of the waterfront
location.
2) Conceptual Design and Specifications
The major contents of development of the existing port are floating pontoons and a passenger terminal building.
The size of the pontoon is proposed to be 45 m long, 15 m wide and 4 m deep. The total length of the quay is 135
m and can house 6 pontoon units. For the structural type of pontoons, several options are available such as steel,
fiberglass, concrete or hybrid-concrete, etc. Considering the cost, durability, ease of local procurement and
construction capabilities, concrete type pontoons are proposed. For manufacturing, ship building docks or
slipways located on Mactan Island can be used. The fabricated pontoon should be towed by tugboat and installed
at the existing port location. To attach the pontoons, concrete anchor blocks and chains will be installed. Fenders,
bollards and passenger waiting booths are to be mounted on the pontoons.
The dimensions of the passenger terminal building are 80 m x 20 m with 3 stories totaling 4,800 m2 of floor space.
For the foundation of the building, precast concrete piles are proposed because they have good durability, low cost
and are easy to procure in the local market. The structure of the building is to be made of RC beam and slab.

3 - 75
Passenger waiting rooms are planned on the first and second floors and offices of shipping private firms are
planned on the third floor.
Figure 3-3-32 Image of Passenger Terminal
(Source: Study Team)
3 - 76
3) Future Subjects to Study
This section presents the redevelopment strategy of the existing new port by working out the conceptual design
and port planning. For the implementation of the Project, more detailed and practical study is required. The points
to be covered in the future study are described as follows:
a) More Accurate Forecast of the Future Port Congestion based on Site Survey
In this section, port planning was carried out using the factor of berth occupancy ratio to forecast future
congestion. The data covered the period of the three months between June and August 2011. A future study
should survey data over a longer period for a more accurate evaluation.
In addition, congestion of the port depends not only on berth occupancy but also on the ability and numbers of
cargo equipment, capability of workers, etc. A future analysis should consider these different factors. To make
these factors clear, a one to three month comprehensive site survey employing record taking staff is
recommended.
b) Monitoring Cargo Throughput and Comparison to Demand Forecast
The needs of the Project and the timing of implementation depend on the demand forecast. Therefore, it is
required to monitor the difference between the forecast and the actual output, and to continually know the timing
of Project preparations.
c) Reconsideration of Port Planning
If required, the future port plan should be reorganized taking into account the 1) practical site survey and 2)
monitoring forecast.
d) Detailed Study of Private Commercial Development on PPP Scheme
Regarding commercial development introducing private investment, a study on a suitable procedure for tender for
investors is needed. It is also important to draw up an actual plan incorporating the ideas and intentions of the
investors.
e) Coordination to Relevant Authorities and Local Autonomies
CPA should coordinate with the relevant authorities such as supreme government authorities DOTC as well as
local autonomies such as Cebu city or the provincial government. Coordination with local autonomies is
particularly important as CPA owned land is limited and the area is closely related to city planning.
3 - 77
3.4 Public-Private Partnership (PPP) of the Project
1) Background of PPP in Port Sector
a) PPP under Privatization
PPP is considered as the latest form of Private Sector Participation Initiative in infrastructure investment. Private
participation is also called simply “Privatization,” or “Private Participation in Infrastructure (PPI),” “Private
Sector Participation (PSP)” and others (ADB PPP Handbook, September 2008).
- PPPs present a framework that-while engaging the private sector, acknowledge and structure the role for
government in ensuring that social obligations are met and successful sector reforms and public investments
are achieved. The structure of the partnership should be designed to allocate risks to the partners who are best
able to manage those risks and thus minimize costs while improving performance.
- PSP is a term often used interchangeably with PPPs. However, PSP contracts transfer obligations to the
private sector rather than emphasizing the opportunity for partnership. In the mid to the late 1990s, there was
a slowdown in public–private contracting in infrastructure sectors, which was largely precipitated by a social
backlash against the perceived preference for the private sector over the public sector in delivering
infrastructure services in developing countries.
- Privatization involves the sale of shares or ownership in a company or the sale of operating assets or services
owned by the public sector. Privatization is most common and more widely accepted in sectors that are not
traditionally considered public services, such as manufacturing, construction, etc. When privatization occurs
in the infrastructure or utilities sectors, it is usually accompanied by sector-specific regulatory arrangements
to take account of social and policy concerns related to the sale, and continuing operation of assets used for
public services.
b) Historical Background
In infrastructure, particularly in public port sectors, “Privatization” started in the 1980s with a combination of
“Public Port Reform” from the UK. The UK started selling19 public ports in 1983. Port Kelang in Malaysia
started privatization incorporating Kelang Container Terminal (KCT) in 1985. Sweden privatized the Port of
Gothenburg in 1986. New Zealand established the Port Companies Act in 1988 and started privatization. The
Philippines contracted the operation of Manila International Container Terminal to a private operator ICTSI in
1988. The Port of Singapore Authority was corporatized in 1991. Hutchison Whampoa entered into a
joint-venture agreement with Shanghai Port (PRC) in 1992. Pakistan advertized investment for Gwadar. There
have been many examples where the private sector has participated in port sector reform.

3 - 78
c) Public Port Reform
Public Port Reform mainly includes two tires of reform: (1) reform of the port administration body as a regulator
and (2) reform of the port operation body as the cargo handling body.
Ports can be classified into four main models: the public service port, the tool port, the landlord port, and the fully
privatized port or private service port (ADB Best Practices for PSI, 2000; World Bank, Port Reform Tool Kit,
2001 and 2008).
Table 3-4-1 Basic Port Management Models
(Source: Best Practice in ADB PPP, World Bank, Port Reform Tool Kit, Second Edition 2008)
Earlier in the report, “Privatization Defined: Is it the Universal Panacea? 1999”, Mr. Alfred Baird provided similar
categorization of Port Management Models as below:
Table 3-4-2 Key Port Element: Privatization Options
(Source: Baird, Privatization Defined, 1999)
In general, port reform is aimed at: (a) improving performance of the public sector (Port Authority) in providing a
regulatory frame work and financial aspect, (b) increasing operational efficiency and (c) reducing port charges.
d) Best Practice of Private Participation in Ports
There are many examples and forms of Private Sector Participation (PSP) in ports. ADB reviewed examples of
PSP in the port sector, and concluded that, “the Landlord model is the best structure for promoting PSP” (ADB:
Best Practice for PSI, 2000) as shown below:
• The bidding process should encourage unbundling not only of the network but also for the services within
the ports. Where ports are not financially viable, they should not be bundled with profitable ports, but
treated as stand-alone facilities that are turned over to local government or put under management
Type Infrastructure Superstructure Port labor Other functions
Public service port Public Public Public Majority public
Tool port Public Public Private Public/private
Landlord port Public Private Private Public/private
Private service port Private Private Private Majority public
Type Port Regulator Port Landowner Operator
Public Public Public Public
Private/I Public Public Private
Private/II Public Private Private
Private/III Private Private Private

3 - 79
contract using a competitive tender.
• The landlord model is the best structure for promoting PSP because it accommodates different forms of
public-private partnership while recognizing that the only fixed responsibility of the public port is the
ownership of the site.
• The most effective and efficient procedure for promoting PSP in the port sector is to lease existing
facilities with relatively short-term agreements that allow for reorganization and improvement in
productivity. Subsequently, concession agreements can be used to encourage private investment in
additional capacity. Where this capacity is required immediately, or labor problems make it difficult to
lease out existing facilities, then concessions might precede lease agreements.
• Continued public investment will be required, as it is difficult to recover the costs for basic infrastructure
in a time period reasonable to the private sector. Public investment may also be required to reduce the
barriers to entry. This is important where a new entrant would otherwise have to make a large investment
before competing with existing service providers.
• The best form of tariff regulation is market regulation; the second best is through the terms of the contract
that identify the non-competitive services requiring regulation, state the maximum rates, the formulae for
escalating these rates over time, and the arbitration procedures for discriminatory behavior in excess of
that justified by commercial pricing. The third best is the establishment of a regulatory agency outside of
the port which would apply a pricing formula related to cost recovery. All of these are preferable to a
vague procedure for negotiating future changes in tariffs.
• The private sector should assume all commercial risks. Other risks should be negotiated, based on which
party has the capability to mitigate the risk.
• The critical element in any effort to promote PSP is competition, or at least the potential for competition.
This can be provided through direct competition between private sector service providers, between public
and private service providers or between bidders in the case of an activity that does not allow
competition.
Actual examples show that the most common mode of private participation in container terminals is the “Landlord
Type” model (Private/I).
Table 3-4-3 Extent of Privatization within the Top 100 Container Ports
(Source: Baird, Privatization Defined, 1999)
e) PPP in Port among Other Sectors
Considering the amount of investment made by the private sector in infrastructure in developing countries
between 1990 and 2001, the majority was made in telecommunication and electricity sectors. The investment
amount of private participation in the port sector is still limited (World Bank Working Paper 2003).
Type Public Private/I Private/II Private/III
Number of ports 7 88 2 3

3 - 80
Figure 3-4-1 Sectoral Breakdown of Investment in Infrastructure Projects with Private Participation,
1990–2001
(Source: World Bank PPP Projects Database)
2) Examples of PPP in Port Sectors
a) Philippines:
Philippines Port Authority (PPA) was managing and operating nearly all the public ports. Cebu Port Authority
was the first port authority separated from PPA in June 1992 to administrate ports in Cebu. Subic Port is also
administrated by a separate body from PPA, but PPA is still managing most of the major public ports.
Private participation in terminal operation started when Manila International Container Terminal (MICT) was
constructed and concession of terminal operation was called for bids. PPA established a 25-year concession for
MICT. The initial concession agreement, granted under the Marcos government, failed but was re-bid under the
administration of President Aquino and won by International Container Terminal Services Inc. (ICTSI) (initially
together with Sealand), which has operated successfully until now. Subsequently, a lease was granted to Asia
Terminal International (together with P&O Terminal) for international container operation in South Harbor. The
two now actively compete for international traffic (ADB 2000).
PPA granted concessions and similar cases are followed by others such as Subic, Batangas, and recently Davao
and General Santos Ports.
On the other hand, investors are constructing business center, hotel and shopping center in the center of Cebu city.
New department store has been constructing at the back of Cebu port area by Robinson who is the major

3 - 81
department in the Philippines. Almost half of lots in the south reclamation area have been sold out as of now and
some tenant has started the construction of the building. The price of land has risen up by 1.44 times from 1997 to
2007 along the Osmena avenue behind Cebu port area.
b) Other Countries
World Bank provided examples of concession and BOT in Oman and India as below (World Bank, Tool Kit
2007):
b)-1 Salalah, Oman
In 1997, Salalah Port Services (SPS) was awarded a 30-year concession to equip and operate the Port of Salalah in
Oman. SPS is a joint venture with 30 percent foreign investment and 70 percent Omani government and
public/private investment. The concession contract covers the container terminal, the conventional port, and the
free trade zone. Investment in the port originally consisted of the following proportions:
Omani government: 20 percent
Government pension funds: 11 percent
Sea-Land Services: 15 percent
Omani private investors: 19 percent
Public offering: 20 percent
Maersk/A.P. Moller: 15 percent.
The initial capitalization was $260 million.
The government built the infrastructure.
b)-2 Vallarpadam, India
In August 2004, India’s Cabinet Committee on Economic Affairs awarded Dubai Ports International (DPI) the
contract to further develop the existing Rajiv Gandhi Container Terminal in Cochin (Kuchi) and build a new
terminal at or nearby Vallarpadam Island. The contract is on a BOT (build-operate-transfer) basis with total
investment estimated at Rs 21.2 Bn ($460 million). When completed, Vallarpadam will be able to handle vessels
up to 8,000 TEU with 2,150 meters of berth and a throughput capacity of 3–4 million TEU. DPI was announced
as successful winner of the public tender by submitting the highest bid to share 30 percent of gross revenues with
the Cochin Port Trust, which was subsequently negotiated down to 25 percent. The next highest bid was based on
sharing 10 percent of revenues. Vallapardam will primarily compete with Colombo for share of regional
transshipment traffic.


Chapter 4
Evaluation of Environmental and Social Impacts


4-1
(1) Environmental and Social Considerations
1) General
In this study environmental and social assessment for the New Cebu Port and Redevelopment of the
Existing Cebu Port Project will be examined based on the baseline survey conducted in the JICA study in
2002.
2) Natural Environmental Conditions – New Cebu Port Site and Existing Cebu Port
The characteristics of environmental conditions at the respective sites of the New Cebu Container Port
Project (NCCP) and Cebu Baseport Redevelopment Project (CBPRP) are characterized in the
environmental baselines of the JICA study in 2002. No recent study of the environment is available to
update the baselines. In JICA study, field surveys were done to find out the quality and conditions of
seawater, bottom sediments, air and noise. Also, actual observations of terrestrial and marine ecology were
made to assess the quality and diversity of marine and terrestrial life in the impact zones.
2)-1 Seawater Quality
Colour, temperature, conductivity and salinity levels in the harbour waters at both sites were fairly good at
the time of sampling. Dissolved oxygen content is high above the 5 mg/l critical level at NCCP and
CBPRP. Chemical oxygen levels are above the 10 mg/l maximum limit mandated by the Department of
Environment and Natural Resources (DENR). Surfactants are well below limits but grease and oil
concentrations generally exceed limits – obviously a result of pollution by shipping vessels plying the
channel and landing at Cebu Port and, in the case of the new site, ship repair activities on the southern
shores of Consolacion. The level of 0.06 -0.07 mg/l of cadmium appears high in excess of the 0.01 mg/l
DENR limit. Arsenic level is critical at the Cebu Port site but far below the 0.05 mg/l limit in Consolacion.
Mercury, lead, cyanide and hexavalent chromium levels are far below the DENR limits.
Total phosphates are slightly detectable while organophosphates are not detected. Total nitrogen of 2.5 –
3.3 mg/l at the CBPRP site is higher than the 1.6 mg/l levels at the NCCP site.
Excessive levels of total coliform and fecal coliform, both indications of pollution from androphogenic
sources, were observed in 2001. In Cebu harbour, up to 160 million MPN/100 ml and 90 million
MPN/100 ml of total coliform and fecal coliform, respectively were detected, far in excess of the 1000
MPN/100 ml limits set by DENR. In the NCCP area, a maximum total coliform count of 900 million
MPN/100 ml was observed. The same level of fecal coliform was measured at the site indicating pollution
mainly from human waste discharged to the coastal area. It is likely that over the last ten years, the level of

4-2
sewage pollution from the City of Cebu and the barangays of Consolacion and other waste discharging
coastal cities and towns along Mactan Channel have increased substantially, resulting in a worsening of
biological quality levels of seawaters at these sites. The result of the assessment of seawater quality is
shown in Table 4-1-1.
Slow deterioration of seawater quality mainly due to continued pollution discharges from adjacent
shipyard at NCCP. The active currents along narrow strait will allow relatively fast dispersion of seawater
pollutants at CBPRP.
2)-2 Sea Bottom Sediment Quality
Sea bottom sediment analyses at several points offshore of both Projects were made. As there are no
standard quality limits set up by the DENR for marine sediment quality, a comparative evaluation for the
two sites is being made here. BOD ranges from 8.6 -17.1 ppm in Cebu harbour against 9.8 – 21.1 ppm at
the NCCP site indicating higher organic pollution in the latter. COD is comparable in the higher range at
41.3 ppm. Oil and grease contamination are between 5 to 6.5 ppm at both sites while industrial phenol
contamination does not vary very much with a concentration range from less than 0.01 ppm to 0.08 ppm.
Heavy metal contamination shows less than 0.10 ppm for both cadmium and arsenic at the two sites.
Cyanide ranges from 0.01 to 0.04 ppm levels for both sites while hexavalent chromium levels do not
exceed 0.002 ppm. The levels for the above heavy metals are lower than the Japan Environmental Agency
(EA) 1990 criteria for harmful bottom sediment intended for landfill or sea dumping of 0.1 mg/l for Cd,
0.5 mg/l for As, and 1.0 mg/l for cyanide.
Lead pollution of 12.7 – 52.8 ppm in CBPRP is significantly higher than the 7.4 – 19.1 ppm levels at the
NCCP site. Both locations show toxic lead contamination that are in excess of Japan EA’s 1.0 mg/l.
Mercury levels are less than 0.01 ppm at both sites – much higher than EA’s 0.005 mg/l harmful limit. No
organophosphate contamination is detected at either site while nitrogen nutrient levels are low ranging
from 0.03 – 0.08 ppm at the Cebu port site and 0.002 – 0.14 ppm in Consolacion.
At both sites, coliform – both total and fecal – are in excess of 1.0 million MPN/100 ml and even reach 24
million MPN. Like seawater, bottom sediments are contaminated with human and animal waste in Cebu
Port harbour and at the Consolacion port site.
Slow deterioration of sea bottom sediment quality mainly due to continued pollution discharges from
adjacent shipyard in Cansaga at NCCP. Without the Project, deterioration of bottom sediments at Mactan
Channel near the Cebu Port will continue to increase even though the active currents along narrow strait, it
will continue at its current rate.

4-3
Table 4-1-1 Seawater Quality at Existing Cebu Port Area and New Cebu Port Site
Parameters Existing Port Site New Port Site DENR
Standard Low High Low High Color (visual) Clear Slightly turbid Clear Clear pH 7.26 7.99 7.87 8.02 6.0-8.5 Temperature, oC 31.4 30.8 31.1 31.5 Conductivity, mS 59.4 59.9 53.4 53.9 Salinity, ppt 33.2 35.4 35.1 35.3 Dissolved Oxygen (DO), ppm 7.11 8.83 6.77 8.01 5.0 Turbidity, NTU 0.25 0.45 0.15 0.55 Biochemical Oxygen Demand (BOD), ppm 20 110 13.2 35.4 7-10 Chemical Oxygen Demand (COD), ppm 45 305 28.2 76.5 - Total Suspended Solids, ppm 2.0 4.5 <1.0 8.5 - Surfactants, (w/methylene blue), ppm 0.02 0.04 0.02 0.05 0.5 Oil and Grease, ppm 2.4 7.5 3.3 7.1 3 Phenols, ppm 0.02 0.05 <0.01 <0.01 - Total Coliform, MPN/100 ml 2400 >160,000,000 240 900,000 1,000 Fecal Coliform, MPN/100 ml <2 90,000,000 <2 900,000 - Copper, ppm 0.04 0.05 0.05 0.05 0.05 Arsenic, ppm 0.05 0.06 0.021 0.031 0.05 Cadmium, ppm 0.06 0.07 0.06 0.07 0.01 Hexavalent Chromium, ppm 0.001 0.004 <0.001 <0.001 0.1 Cyanide, ppm <0.01 0.05 <0.01 0.05 0.05 Lead, ppm 0.034 0.40 0.38 0.40 0.05 Total Mercury, ppm <0.0001 <0.0001 <0.0001 <0.0001 0.002 Organophosphates, ppm ND ND ND ND Nil Total PO4, ppm <0.01 <0.01 <0.01 <0.01 - Total N, ppm 2.5 3.3 1.6 1.6 - Sulfates, ppm 2,120 2,867 -
(Source: The Study on the Cebu Integrated Port Development Plan, 2002)

4-4
Table 4-1-2 Bottom Sediment Quality at Cebu Baseport Area and New Container Port Site
Parameters Cebu Baseport New Container Port Site
Low High Low High Sediment Appearance Muddy Muddy Sandy Muddy/Silty Color (visual) Charcoal Gray Grayish Black Charcoal
Gray Charcoal
Black Odour Marshy Marshy Marshy Marshy pH @25.0 oC 8.56 8.86 8.38 8.62 Loss on Ignition (LOI) % 5.0 14.8 7.4 18.4 Biochemical Oxygen Demand (BOD), ppm 8.6 17.1 9.8 21.0 Chemical Oxygen Demand (COD), ppm 18.1 41.3 21.2 41.3 Surfactants (with Methylene Blue), ppm 0.02 0.20 0.02 0.10 Oil and Grease, ppm <5.0 <5.0 <5.0 6.5 Phenols, ppm 0.01 0.08 <0.01 <0.01 Total Coliform, MPN/g 1,400,000 24,000,000 5,000,000 22,000,000 Fecal Coliform, MPN/g 1,400,000 22,000,000 2,600,000 22,000,000Copper, ppm <.01 49.5 7.7 41.6 Arsenic, ppm <0.1 <0.1 <0.1 <0.1Cadmium, ppm <0.01 <0.1 <0.1 <0.1Hexavalent Chromium, ppm 0.001 <0.002 <0.001 <0.001Cyanide, ppm 0.02 0.04 0.01 0.04 Lead, ppm 12.7 52.8 7.4 19.1 Total Mercury, ppm <0.01 <0.01 <0.01 <0.01 Organophosphates, ppm ND ND ND ND Total PO4, ppm 0.07 0.48 0.04 0.17 Total N, ppm 0.03 0.08 0.002 0.14 Sulfates, ppm 72.2 353 76.7 461
(Source: The Study on the Cebu Integrated Port Development Plan, 2002)
2)-3 Air and Noise
A comparison of air quality and noise levels at the existing Cebu Port and at the Consolacion port site are
shown in Table 4-1-3. Except for total suspended particulates in certain areas of Cebu Baseport complex
that exceed the DENR limit of 300 μg/Ncm, all levels of air quality parameters measured at that time fall
below the maximum limits set by DENR. This indicates relatively good air quality at these sites.
These indicators are not expected to substantially change at the site or its surroundings at NCCP. However
with the scheduled implementation and operation of North Cebu Coastal Road project, road traffic noise
will rise along the road alignment near the project site. Even without the Project, other developments in
and out of the Port area will cause increase traffic congestion near the CBPRP.

4-5
Table 4-1-3
Air Quality and Noise Quality at Cebu NCCP and CBPRP Site, 2002
Parameter NCCP Site CBPRP Site DENR Standard
SO2, ppm 0.001-0.004 0.001 – 0.004 0.13
NO2, ppm 0.0003-0.0064 0.0033-0.0190 0.14
NOx, ppm Not Detectable Not detectable -
CO, ppm Not Detectable Not Detectable 30.0
TSP, μg/Ncm 7-134 103 – 2,700 300
Noise, dB(A) 40-49 42 – 66 -________
(Source: The Study on the Cebu Integrated Port Development Plan, 2002)
2)-4 Marine Ecology
In the existing CBPRP, the absence of marine vegetation and macrobenthos, which fish feed on, and
regular dredging in the harbour limit the survival of fishes in the area. Sustenance fishing is rarely
observed near the port area due to very low productivity of the fishing area. The few who catch fish nearby
only get a small quantity of small-sized anchovies and small roundscads. These fish species are relatively
tolerant to some forms of pollution. In general, roundscad account for more than 50 percent of the total
major species caught along the coastal waters of Cebu Province. Before reclamation in the Mactan and
CBPRP area was done, good-sized big-eye trevally (talakitok), Spanish mackerel (tanigue), shad fish
(kabansi), siganid rabbitfish (samara) and grouper (lapulapu), as well as shrimp and squid were caught in
Mactan Channel. Some sea grasses are found south and north of the CBPRP area.
In 2001, the mangroves along the shoreline near the NCCP site showed the characteristic features of the
substrate in the study area. Mangrove species observed thriving in the coastal zone near the site include
Sonneratia alba (firefly mangrove) and Avicennia marina (Bungalon/Piapi). It seems that the situation of
the mangroves along the shoreline and reclamation site is the same as in 2002.
Corals and associated macrobenthos were observed near the port site. Corals identified included Galaxia
sp., Goniophora sp., Fungia sp., Pyctenia sp., Montiphora sp., Porites sp., and Tubiphora sp. Most corals
showed only folius or encrusting growth. Soft macrobenthos in the coral area north of the reclamation site
includes holothurians (Synapta sp.) and sponge. Among the molluscs, Paphia amabilis and Anadara
antiquata are the most abundant along the muddy coastline of Consolacion, in association with the
mangrove community. Seaward, the echinoderms Diadema setossum and Strongylocetrotidae sp. are more
abundant species – their presence is indicative of the relatively polluted environment as evidenced by a
BOD ranging from 13.3 mg/l to 35.4 mg/l which is higher than the DENR standard of 7-10 mg/l. Two

4-6
species of sea grasses and 8 species of algae were found. Together with mangroves north of the site, the
sea grasses provide nutrients for juvenile fishes and other marine organisms in the area. No rare, threatened
or endangered species of algae have been encountered.
Coastal mangrove stand will continue expand at gradual rate. Coastal fishery will continue slowly
detriorate at its current rate. Proliferation of seagrass is expected to remain stable as it is ten years ago. The
past and present degradation rate of corals seaward of the port site is not expected to abate without the
Project. Even without the Project, CPA will pursue base port expansion but on limited and slower rate.
However, individual and collaborative activities of LGUs, NGOs, DENR and BFAR- especially those in
south of Mactan Island will improve marine ecology in the Channel to some extent.
3) Soical Environmental Conditions – New Cebu Port Site and Existing Cebu Port
3) -1 Exsting Cebu Port
- Population
In 2007, Cebu City has a population of 798,809 and a population density of 2,370 persons per square
kilometer. From 1970 to 1995, the City had an average of 2.54% in-migration rate.
- Economy, Labor, Employment, Income and Expenditures
The City is the commercial and trading hub of the Visayas Region for domestic and international shipping
attracting financial institutions and other support services provider. Tourism and allied services continue
growing fast in the City and nearby towns and cities. Data for 1995 showed that 73.2 % of labor force are
in trade and other related service, 18.8 % are in industry while 7.85% are engaged in agriculture. In April
2000 the rate of unemployment in the city was at 11.5% against the country’s 13.7 %. The 1997 National
Statistic reports average family income of P163,196 against expenditure of P114,326.
- Education, Health and Housing Facilities and Social Welfare Services
The city has seven (7) universities and sixteen (16) colleges. The city has a very high literacy rate of 98%.
For the 1999 – 2000 of the city’s total of 307 public and private pre-school, elementary, and high schools
with the total enrolment of 196,293. The City has a social welfare program directed at the community,
family, women, youth and the disabled. At present the city has 11 police stations and 8 fire stations with a
force of 452 police and 137 fire personnel, respectively.
3) -2 New Cebu Port
- Population
The 2007 National Statistic shows a population of 87,544 with its growth averages 3.580%.
- Helth, Sanitation and Social Welfare
In 1995, acute respiratory tract infection was the major cause of morbidity. Hypertensive disease is the
number one killer followed by cancer. A malnutrition among children ages 0 –6 years old with
malnourished children of 3,779. Septic tanks comprise of 23.60 % of the total number of households.

4-7
Households without toilet facilities comprised a high 25.60%. The Municipal Social Welfare Department
maintains the program for Women’s Welfare program, Child and Youth Welfare programs, programs for
Emergency Assistance and for persons with disability. The Municipal Education, Culture and Sports
department provide sixteen public elementary schools and nine secondary schools. In 1995, the town had a
one (1) policeman per 2,135 population – still below the minimum national standard of 1 per 1,000.
- Housing and Shelter
Pressure of urbanization in the cities of mainly Cebu, Mandaue and Lapu-lapu, is making new affordable
residential lands for development relatively scarce in these cities. The proximity of Consolacion makes it a
convenient alternative for residential land supply. Thus, a number of subdivisions have grown to address
the demand of housing within Consolacion and nearby cities.
- Economy
There are 131 registered business establishments in Consolacion in 1999. About 43% of this are in the
service sector and 20% are retailers, dealers and traders. The latter are located in Poblacion (East and
West) Casili, and Pulpogan. Only about 17% are manufacturers while 14.5% are into food production.
About 68% of manufacturing industry players is predominantly in the industrial zone of Barangays Pitogo,
Tugbongan, Cansaga, and Tayud.

4-8
(2) Environmental Effects Due to Project Implementation
1) General
For the assessment of the environmental effects, qualitative analysis will be made instead of quantitative
analysis because detailed baseline survey is necessary to conduct the quantitative analysis.
Table 4-2-1 and 4-2-2 show the impact to the environmental effects.
1)-1 New Container Port Project
Construction activities resulting in improvement in the natural environment on the coastal area of Tayud,
Consolacion are limited to alteration of topography by the reclamation of 23 hectares compared with large
scale reclamation, reclamation height is from 0.0 to +3.0 m and dredging volume is small. Without
mitigation measures, negative construction impacts will result in pollution of seawater caused mainly by
offshore disposal of dredged materials, increased water turbidity and suspended solids due to reclamation
and erosion, noise and dust generation and reduction of areas for fishing. The magnitude ranges will be
minimal considering the dredging volume is 16,000 ㎥ and minimal disposed volume due to the utilization
of the reclamation. During the disposal of the dredged material silt protector should be provided to mitigate
the diffusion of the contaminated sea water. Most impacts are short in duration and only affect the vicinity
of the disposed site 25 km from New Cebu Port.
During port operations, mitigation measures are needed for largely negative impacts on seawater pollution
in the port complex, noise generation by construction heavy equipment, and greenhouse gas emissions
(largely caused by increased electricity usage by equipment and employees), but there is less impact on
pollution generated by garbage, which usually occurs at ordinary general cargo berths. Impacts on the
environment during this phase are generally minimal, with a medium to high chance of occurring. Long-
term impacts are mainly confined to the vicinity of the port complex.
1)-2 Existing Cebu Port Redevelopment Project
Construction activities will generally cause negative environmental impacts for water pollution, solid
waste generation, dust, and noise generation by pile driving. Short-term and reversible negative impacts
will result from these activities after construction finish. These impacts are confined within the CPA port
area. An increase in occupational health and safety risks will be faced by workers involved in the
construction sites. To mitigate safety risks, safety measure clause should be included in the contract of
contractor and CPA safety staff should secure the construction site.

4-9
Without mitigation measures in place, operation of the high-rise new multi-storey port commercial center,
elevated passenger skywalk, bulk/general cargo berths, domestic container yard, etc., will cause additional
sewage and solid wastes that could pollute harbour waters, create noise in and outside the port commercial
complex, and generate new greenhouse gas emissions from direct and indirect sources, all due to increased
electricity consumption.
Table 4-2-1 Environmental Impacts of New Container Port Project Implementation
Potential Impact(Construction)
NatureMagnitud
eProbability ofOccurrence
ImpactDuration
Geographic Extent of Impact
a) Seawater Pollution Negative Significant Medium Short term Vicinity of the project area
b) Air Quality dustgeneration
NegativeMinimal tomoderate
Medium Short termVicinity of project area & access roads
c) Noise from heavyequipment operations
NegativeMinimal tomoderate
Medium Short termVicinity of project area & access rds
d) Alteration of Topography Positive Significant High Short term Vicinity of the project area
e) Reduction of area foropen Space/Fishing ground
Negative Moderate High Long termReclamation area
f) Impact on marine life(corals, mangrove)
Negative Minimal High Long term Vicinity of the port site
g) Increase seawaterturbidity & suspended solids
Negative Significant High Short term Seawaters in vicinity of reclamation area
h) GHG Emissions Negative Minimal High Short term Atmosphere
Potential Impact(Operation)
NatureMagnitud
eProbability ofOccurrence
ImpactDuration
Geographic Extent of Impact
a) Seawater/MarinePollution
Negative Significant High Long term Port site and harbor
b) Noise from ships and portoperation/activities
Negative Significant Medium Short Term Port area & areas near access roads
c) Impact on marine life(Corals and mangroves)
Negative Significant High Long term Vicinity of the project area
d) Solid wastes generation Negative Significant Medium Long Term Vicinity of Port Area
e) GHG Emissions (Newusers of electricity)
Negative Significant Low Long term Vicinity of Port Area
f) Impact on Marine Life Negative Significant Low Long term Navigation lane and harbor areaReversible
Reversible
Reversible
Reversible
Irreversible
Irreversible
Reversible
Reversible
Reversible
Reversible
Reversible
Reversible
Reversibility/
Reversible
Reversibility
Nat
ural
En
viro
nm
ent
Reversible
(Source: Study Team)

4-10
Table 4-2-2 Environmental Impacts of Cebu Baseport Redevelopment Project
ImpactPotential Impacts
(Construction Phase)Nature Magnitude
Probability ofOccurrence
ImpactDuration
Geographic Extent of Impact
a) Seawater Pollution Negative Minimal Medium Short term Vicinity of the harbor area
b) Increase in air pollution Negative Minimal Low Short term Vicinity of the project area
c) Dust and NoiseGeneration
Negative Minimal Medium Short term Immediate vicinity of the construction area
d) Sewage and solid wastegeneration
Negative Significant High Long Term Vicinity of Existing container port area
e) Visual Resources andLandscape
NegativeNil to
minimalMedium Short term Vicinity of construction area
f) GHG Emissions Negative Minimal High Short term Atmosphere
Potential Impacts(Operation Phase)
Nature MagnitudeProbability ofOccurrence
ImpactDuration
Geographic Extent of Impact
a) Seawater Pollution Negative Significant High Long term Vicinity of the project area
b) Noise Generation Negative Significant Medium Long term Vicinity of Port Area
c) Increase Space for Portuse & for Amenities
Positive Significant High Long-term Vicinity of existing container port area
d) GHG Emissions. Negative Moderate High Long Term Atmosphere
Reversible
Reversible
Reversible
Reversibility/Permanence
Reversible
Reversible
Nat
ura
l En
viro
nm
ent
Reversibility
Reversible
Reversible
Reversible
Reversible
Reversible
(Source: Study Team)
2) Assessment and Evaluation of Alternative Plans
For the five alternative sites considered for the container port, the impacts to the natural and social
environments were compared. The initial comparative impact evaluation is presented in Table 4-2-3. No
alternative plan for a new container port with lesser environmental impact than the recommended plan was
found.
Table 4-2-3 Comparison of Potential Impacts at Five Sites
Area of Impact
Consolacion Mactan North Mactan South SRP South Minglanilla
Marine Ecology:
Mangroves
Some mangrove stands will be adversely affected
Some mangrove stands will be adversely affected
Several mangrove stands will be adversely affected
Grasses and some shrubs
Several mangrove stands will be adversely affected
Corals No significant good coral area
Substantial areas of corals
Substantial areas of corals
No significant coral area
No significant coral area
Social: Informal Settlers
nil Nil Many Nil Nil Nil
Fishermen Some sustenance fishermen
Several fishpen and fish cage operators
Some municipal fishermen
Some sustenance fishermen
Some sustenance fishermen
Land Use Conforms with LGU Zoning Ordinance
Conflict with air navigation of MIA
No conflict Some conflict with present land use
No conflict
Land Acquisition
Reclaim port site Reclaim shore site
Reclaim shore Reclaim shore site Reclaim shore site
Access Road New construction
Widening of existing road and new construction
New construction New construction
Widening of existing road and new construction
(Source: Study Team)
4-11
3) Positive Environmental and Social Impacts of the Project
With implementation of the New Cebu Port and redevelopment of Existing Cebu Port, environmental
improvement around the Project site is expected as follows:
- By construction of the New Cebu Port, larger-sized vessels with emission control systems can use the
port. Reduction of CO₂ emission per TEU is expected. Due to construction of the New Cebu Port, the
access distance from Mactan Island will be shortened and the congestion around the existing Cebu port
will thus be reduced.
- With construction of the New Cebu Port and redevelopment of the existing Cebu port, cargo volumes
will increase and industrial/regional development in the hinterland and surrounding areas will follow. An
increase in job opportunities and local economic development is expected.
4) Project Screening and Environmental Checklists
Following the guidelines for project screening prescribed by Japan International Cooperation Agency
(JICA), Japan International Bank for Cooperation (JBIC) and DENR Guideline, the initial screening and
environment checklist of both Projects were prepared. The predicted environment issues were identified
and studied as indicated in Figure 4-2-1, 4-2-2, 4-3-1, 4-3-2.

4-12
(3) Social Impacts of Project Implementation
1) General
The social consequences of the NCCP and CBPRP are largely positive. Simultaneous implementation
could likely raise the impact magnitude and significance due to synergism of project execution. This
means improvement in the social and economic conditions of the impact zones. When completed, NCCP
and CBPRP will enable CPA to be more productive and operationally efficient in its functions as a result
of expanded container cargo handling capacity in the new port and better domestic container port and
bulk/general cargo berthing facilities. The new port will enable CPA to increase its annual revenue. In
parallel terms, the commercial complex at the existing Cebu port will also open new and additional sources
of revenue for CPA. Below is a discussion of the potential social consequences of implementation of both
Projects while Table 4-3-1 and Table 4-3-2 present summaries of impacts on the social environment.
2) New Container Port Project
The component of the New Cebu Port is;
23 ha reclamation, 450 m long berths, 16,500 ㎥ dredging, 600 m access road, 14 ha container yard, 4 units
of quayside gantry cranes, 16 RTGs, terminal building, container gate, water supply, power supply and
drainage system.
Construction activities will cause a significant rise in land prices – impact which is negative, irreversible,
long-term and has a high probability. This will affect lands within the immediate hinterland of NCCP
especially in Consolacion town. Positive impacts will manifest in terms of improvement in livelihood, new
employment opportunities and uplifting welfare of women and children of those who will be employed in
construction and who can engage in livelihood related to the construction of the port. All these will be
moderate in magnitude, highly probable, short-term and will cover communities within the vicinity of the
Project site including Consolacion and Liloan towns.
The 23 ha reclamation will permanently change land use by closure of a small coastal fishing area of
sustenance fishermen - a negative impact on marginal fishing which by its nature is irreversible, long-term
but minimal in magnitude due to the small number of fisherman, small scale of fishing and small
reclamation area. Other negative, highly probable and significant but reversible short-term impacts are
traffic congestion along the construction access roads and threats to occupational/health and safety of
construction employees.

4-13
Operation-phase impacts of the Project will mainly be positive and highly probable, i.e., increased land
values (positive for landowners and negative for land buyers), improved opportunities for livelihood,
employment and income, economy and growth, enhanced port productivity, efficiency and berth capacity
and improved welfare of women and children. All these are reversible and vary in terms of duration
ranging from short to long-term.
3) Cebu Baseport Redevelopment
The component of the redevelopment of Existing Cebu Port is;
270 m floating berths, 4,800 ㎡ Passenger terminal, 4,000 ㎡ container yard and 8.5 ha
commercial/business center
Positive social impacts predominate the construction phase of the Project. In this phase, the reversible
impacts will provide more/better opportunities for employment and livelihood, uplift of women and
children’s welfare and improvement of workers’ living standards. Highly probable negative impacts that
are reversible and have short-term duration include threats to occupational health and safety of workers
hired in the construction and increased vehicular traffic in the vicinity of the port complex.
Operation of constructed facilities is expected to generate mainly positive impacts including: increase in
space for business and recreation, increased employment and livelihood opportunities, improved CPA
financial resources, improvement in workers’ living standards and in the welfare of women and children,
increased business and tourism activities and importantly, and improvement in the overall CPA efficiency
in handling of cargoes and passengers in and out of the existing port. A significant negative impact is
likely in traffic congestion in and out of the port complex due to the influx of people in the port terminal
and the commercial center. This will be a significant, highly probable, long-term but reversible impact but
due to the construction of new port, expansion of service road in the port area and construction of urban
road in the Cebu city it will be reduced.

4-14
Table 4-3-1 Container Port Project Implementation
ImpactArea
Potential Impacts (Construction Phase)
Nature MagnitudeProbability ofOccurrence
ReversibilityImpact
DurationGeographic Extent of Impact
a) Occupational Health and Safety Threats
Negative Significant High Reversible Short term Vicinity of project area
b) Increase in Land ValuesPositive/Negative
Significant High Irreversible Long term Consolacion and Liloan Areas
c) Improvement of livelihood employment and income
Positive Moderate High Reversible Short term Vicinity of the project area
d) Improved Living Standard Positive Moderate High Reversible Short term Vicinity of the project area
e) Uplift of Women and Children’s Welfare
Positive Moderate High Reversible Short term Vicinity of the project area
f) Increased Vehicular Traffic Negative Significant High Reversible Short term Roads to port site
g) Change in Land Use (Closure of existing fishing area)
Negative Minimal High Irreversible Long term Reclamation Area (23 has.)
Potential Impacts (Construction Phase)
Nature MagnitudeProbability ofOccurrence
ReversibilityImpact
DurationGeographic Extent of Impact
a) Increased Land market values Positive Significant High Irreversible Long term Vicinity of the project area
b) Improvement of livelihood, employment and income
Positive Significant High Reversible Short term Vicinity of the project area
c) Effect on Local Government Economy and Growth
Positive Moderate High Irreversible Long term Municipality of Consolacion
d) Improvement of Productivity, Berth Capacity & Efficiency
Positive Significant High Reversible Long term Port Area/CPA
e) Uplift of Women & Children’sWelfare
Positive Moderate High Reversible Short term Vicinity of the project area
f) Increase in Vehicular Traffic NegativeMinimal tomoderate
High Reversible Long term Roads to port site
g) Increase cargo handling and land transport expenses
Negative Minimal Medium Irreversible Long termCebu Port – Consolacion Portcorridor
Social Environment
Social Environment
(Source: Study Team)
Table 4-3-2 Cebu Baseport Redevelopment Project
ImpactArea
Potential Impacts (Construction Phase)
Nature MagnitudeProbability ofOccurrence
ReversibilityImpact
DurationGeographic Extent of Impact
a) Increase inEmployment Livelihood andIncome
Positive Significant High Reversible Short term Cebu City & nearby areas
b) Effect on CPA Financial Resources Negative Significant High Reversible Long term Cebu Port Authority Complex
c) Improvement Workers’ Living Standards Positive Significant High Reversible Long term Vicinity of the project area
d) Uplift of Women and Children’s Welfare Positive Moderate High Reversible Short term Vicinity of the project area
e) Increase in vehicular Traffic NegativeMinimal/Moderate
High Reversible Short-term Vicinity of base port complex
f) Occupational Safety and Health Negative Significant Medium Reversible Short-term Vicinity of construction Areas
Potential Impacts(Operation Phase)
Nature MagnitudeProbability ofOccurrence
Reversibility/Permanence
ImpactDuration
Geographic Extent of Impact
a) Increase in Space for business & recreation
Positive Significant High Irreversible Long term Vicinity of of the existing port area
b) Increase Employment, Livelihood and Income
Positive Significant High Reversible Long term Cebu City & nearby areas
c) Effect on CPA Financial Resources Positive Significant High Reversible Long term Cebu Port Authority Complex
d) Improvement Workers’ Living Standard
Positive Moderate High Reversible Long term Vicinity of the project area
e) Uplift of Women and Children’s Welfare
Positive Moderate High Reversible Short term Vicinity of the project area
f) Influx of Business locators and tourists to new Commercial Center
Positive Significant High Reversible Long term Vicinity of the port area
g) Improved management & handling of domestic container & bulk/ general cargoes
Positive Significant High Reversible Long term Vicinity of the port area
h) Increase in vehicular Traffic Negative Significant High Reversible Long term Vicinity of base port complex
Social Environment
(Source: Study Team)

4-15
(4) Governing Laws of the Philippines on Environmental and
Social Impacts
1) Policies and Legislations Regulating Environmental and Social Impact Assessment
The Philippine Environmental Impact Statement System (PEISS) is embodied in the Constitution of the
Republic of the Philippines that states, “The State shall protect and advance the right of the people to a
balanced and healthful ecology in accord with the rhythm and harmony of nature.”
In 1977, the statutory policy framework for the Environmental Impact Assessment (EIA) for all projects
that could potentially affect the quality of the environmental was decreed through Presidential Decree (PD)
1151 - The Philippine Environmental Policy. Shortly thereafter, PD 1152, Philippine Environment Code,
was shortly promulgated. The Code established specific environment management policies and prescribed
environment quality standards to be observed in the country. Tasked to implement this code was the
National Environmental Protection Council (NEPC).
Subsequently, the PEISS was promulgated through Presidential Decree 1586 in 1978. This established an
environmental impact assessment system designed to ensure that Filipinos will enjoy a “balanced and
healthy ecology” in pursuit of economic development. PEISS requires the proponent to conduct
Environmental Impact Assessment (EIA) for its project and the submission of an Environmental Impact
Statement (EIA Report) to the NEPC - now the Environmental Management Bureau (EMB) of the
Department of Environment and Natural Resources (DENR) - for review and evaluation and ultimately for
issuance or denial of Environmental Compliance Certificate (ECC).
Over the years, a series of laws and regulations has been established to refine Philippine laws and policies
on Environmental Impact Assessment as shown in the attachment in Chapter 4.
2) Outline of EIA Progress in the Philippines
Under the present provisions of DENR DAO 03-30, certain steps and processes must be undertaken to
initiate and complete the EIA process, and ultimately secure an ECC. The flowchart for both EIS and
EPRMP preparation is presented in Figure 4-4-1.

4-16
Figure 4-4-1 Flowchart of EIA Progress in the Philippines
Proponent Driven
Proponent-driven but
outside EIA process
DENR-EMB Driven
NO
Yes
Yes
No
PROJECT
EIA
REQUIRED?
EIA SCOPING
UNDERTAKE EIA
PROJECT SCREENING
ISSUE CERTIFICATE OF
NON-COVERAGE
SUBMIT EIA
DOCUMENT
REVIEW OF EIA / AI
DOCUMENT
MORE INFO
NEEDED?
PREPARE/SUBMI
T ADDITIONAL
INFO/DATA
ISSUE/DENY
ECC
ACQUIRE OTHER PERMITS
CLEARANCES FROM
OTHER OFFICES
IMPLEMENTATION
ENVIRONMENTAL
MONITORING/
EVALUATION/AUDIT
PROJECT
EXPANSION
/MODIFICATION
(Source: Study Team)

4-17
The basic and minimum necessary contents of the EIA Report
Executive Summary of the Report
Main Report:
- Project Description – inclusive of Project rationale, location, area, components, process and or
technology options, size/scale, plan and phases of development, resource requirement for project
implementation
- Analysis/Assessment of Key Environmental Quality Indicators – includes baseline quality indicators
on, as well as potential project impacts to the natural environment (Land, Water and Air/Noise) and to
the social environment (People and society)
- Environmental Management Plan (EMP) to include:
Plan to Manage Project Impacts
Social Development Plan for the Project
Information, Education and Communication Plan for the Project
Environmental Compliance Monitoring Plan
Emergency Response Policy/Plan
Abandonment/Decommissioning/Rehabilitation Guidelines
- Institutional Plan for EMP Implementation
3) Government-mandated Environmental and Social Impact Assessment
The DENR is mandated to implement policies and regulations related to the management and protection of
natural and social environments. Such function is defined specifically in DENR Department Order 30
Series of 2003 (DAO 03-30), and is supplemented by DENR Circular 2010-14.
Under the guidelines, projects are screened and categorized under three major groups:
- Group I – Environmentally Critical Projects (ECP) to be implemented in environmentally Critical areas
(ECA) as well as environmentally Non-Critical areas (NECA)
- Group II – Non-Environmentally Critical Projects (NECP) to be implemented in ECAs
- Group III – Non-Environmentally Critical Projects in NECAs.
Based on the DENR screening process, the New Cebu Port Project is under the category of “Transport
Facilities: Seaport, Causeways and Harbors” and falls within Group II – Non-Environmentally Critical
Project because the reclamation component is greater than 15 hectares but less than 50 hectares. However,
it is located adjacent to mangroves and within a municipal fishing area. EIS document is required by
DENR.

4-18
On the other hand, under the Philippine EIA system, an Environmental Performance Report and
Management Plan (EPRMP) must be submitted to EMB-DENR for the expansion/improvement or
rehabilitation of an existing Project. In this regards, the redevelopment of the Exiting Cebu Port is
categorize as EPRMP. This document presents critical environmental parameters (land, water, air/noise,
people) affected by the Project. Actual and observed impacts during implementation and operation which
were monitored following the EMP are then compared with baseline data collected before Project was first
implemented.
Basic contents of the EPRMP Report are as follows:
Executive Summary of Report
Main Report
- Description of the EIA Process – includes TOR os EIA study, EIA study team and schedule, EIA
coverage area, methodology and public participation
- Project Description – including Project background and rationale, location,site considerations,
project phases, resource requirements, waste/emissions and management measures and comparison
of old project and the proposed project (expansion/rehab/ modification)
- Baseline Environmental/Social Conditions for Critical Parameters of Natural and Social
Environment – inclusive of critical parameters for Land, Water, Air/Noise and People/Society
- Environmental Performance of the Project Owner/Operator based on the Original Environmental
Management Plan of the Original EIS – to include impact mitigation plan, monitoring plan,
information/education/communication plan, social development plan, environmental risk
management and emergency response plan, abandonment/ decommissioning plan, institutional plan
and achievement/awards and outstanding accomplishments in environment management practices
given to Project owner/operator
- Environmental Risk Assessment and Risk Categorization – inclusive of assessment of potential risk
to environment due to project expansion/rehabilitation and project environmental monitoring and
audit prioritization scheme
- Environmental Management Plan for the Proposed Project Expansion or /Modification or
Rehabilitation – includes a revised/modified or adjusted EMP to be implemented based on the
proposed project expansion/modification/rehabilitation.

4-19
(5) Action Plan for the Government of Philippines
1) Redevelopment of Existing Cebu Port and Implementation of New Container Port
In June 2007, CPA attempted to revive the acquisition of an environmental compliance certificate as the
first step to Project implementation. After initial discussions with EMB-DENR Region 7, the EMB
requested CPA to update the 2002 baseline environmental and re-submit an updated Environmental Impact
Statement (EIS). Considering the 10-year time that has elapsed and the need to revalidate the plans prepared
in the 2002 JICA Study.
2) Recommended Action Plan of CPA for Environmental and Social Impact Assessment
Considering the 10-year time that has elapsed from the JICA study, CPA representative and study team
member discuss with DENR manila office, DENR Cebu office, PENRO, CENRO, Cebu city, Mactan city,
Consolacion, Reclamation Authority, regal office, it is found that approval from Reclamation Authority and
EPRMP application to DENR is necessary to get ECC which is not specified in 2002. Zoning regulation
was approved in Consolacion to reserve the location of new port. Issues and requirement for ECC approval
is cleared through the JICA, JBIC and DENR latest guideline. According to the DENR Cebu office,
baseline survey made by JICA 2002 may not be used totally so additional survey for sea water, sea bed, air
and noise would be necessary.
The assessment conducted in this study will assist the action plan of CPA to implement the both project as
the proponent of the project. Not only this report but also the all information and data collected in this study
will support CPA to get ECC.
Action plans of CPA to implement the both project are as follows;
It is anticipated that after completion of this METI-assisted study, the financing and implementation plan
will be drafted for review and approvals by the DOTC-CPA. Also, it is expected that CPA will prepare EIA
and EPRMP to submit DENR for ECC approval. ECC approval is the requisition of the ODA finance.
A part of the data/information in the 2002 EIA study for the Project can be partly used to shorten the
EPRMP preparation process and save any extra cost incurred for an additional study. The EIA to be
prepared for this Project shall therefore follow DAO 03-30 of DENR.
In order to proceed with this process, CPA is required to account for the cost and charges on the preparation
of EIA and assessment of EMB in the budget of fiscal year 2012. Baseline survey such as sea water, sea
bottom sediment, air and noise will be subcontracted.

4-20
Prior to/during preparation of the EIA, CPA should ensure consultation/tight communication with EMB
Region 7 in order to obtain an EEC at minimum cost and time. The process should be monitored through
regular contacts and meetings so that the issues can be identified timely with consideration of possible
measures.
a) New Cebu Container Port Implementation
- EIA report is required under the guidelines of DENR in view of the new port.
- CPA must initiate the acquisition of right of way for the port access road. Area of the acquisition is
9,000 ㎡ and no relocation of houses expected. The acquisition is required to be discussed/agreed with
DPWH and the municipality of Consolacion on the issues including the planned North Shore Road of
Cebu.
- EIA must accompany legal proof documents to show its authority to reclaim and develop the new Cebu
Port site and special land patents from the Land Management Bureau of DENR. Also, an application for
Presidential Proclamation for reservation of the Project site as a container port zone should be submitted.
- CPA should proceed consultation with PENRO and CENRO/DENR Region 7 for protection of the
reserve in order to obtain approvals of acquisition on the port land and development.
CPA must also coordinate with the Philippine Reclamation Authority on its plan to carry out reclamation
offshore of Consolacion town.
- CPA must coordinate with DENR and Philippine Coast Guard Regional Office Region 7 for
confirmation of a designated/approved disposal site for dredged materials during port construction.
b) Cebu Baseport Redevelopment
Under the guidelines of DENR, the application should follow the existing EPRMP guidelines and format
since the new Cebu Port Project involves redevelopment of an existing port facility for EIA.

4-21
Attachment
Law/Regulation Date Description/Explanation/Coverage
PD 1151 June 6, 1977 The Philippine Environmental Policy – declares the broad government goals
and policy in environmental protection
PD 1152 June 6, 1977 Establishing the Philippine Environmental Code – defines specific environ-
mental quality policies, targets and standards relating to air/noise, land,
water and natural resource utilization, among others.
PD 1586 June 11, 1978 Establishing the Philippine EIS System (PEISS) including other Environ-
mental Management and Related Measures – defines the framework to
mplement the EIS system the means to reconcile impacts of development
projects on society and the natural environment.
DAO 92-21 June 5, 1992 Amending the Revised Rules and Regulations Implementing PD 1586 –
prescribes procedures in ECC applications and processing and defined roles
and functions of Department of Environment and Natural Resources
(DENR) offices to be involved in EIS and Environmental Compliance
Certificate (ECC) issuance.
DAO 94-11 Mar 28, 1994 Providing for Programmatic Compliance Procedures within the EIS System
– defines procedures for EIS compliance of programs with several project
components or phases and for programs planned for expansion
AO 300 (OP) Nov 4, 1996 Further Strengthen the Philippine EIS System and Clarifying Authority to
Grant/Deny the issuance of ECC
AO 42 (OP) Nov 2, 2002 Rationalizing the Implementation of the EIS System and Granting Authority
to EMB Director and Regional Directors to manage EIS implementation
DAO 96-37 Dec 2, 1996 Revising DAO 96-21 to further Strengthen Implementation of EIS System -
defines specific projects/industries covered/not covered by EIS, defined
process of scoping, public participation and review of EIS, among others.
DAO 99-37 Aug 23, 1999 Operationalization of the Environmental Revolving Fund (ERF) –
authorizes DENR-EMB to use funds generated from fees, fines and other
impositions authorized by PD 1586 for EIS-related functions of the agency.
DAO 2000-05 Jan 6, 2000 Revision and Streamlining the Programmatic Compliance Procedures
established under DAO- 94-11 for EIS System
DAO 2000-37 Apr 10, 2000 Prescribing Standard Costs and Fees Relative to the Implementation
of the EIS System
DAO 2003-30 Jun 30, 2003 Implementing Rules and Regulations of the Philippine EIS System –
provides for a more comprehensive and updated rules and regulations for
the implementing Philippine EIS System
4-22
DAO 2004-61 Oct 07, 2004 Delegation of DENR-EMB’s Authority to Laguna Lake Development
Authority (LLDA) to Grant or Deny ECC/Certificate Non-Coverage (CNC)
for Projects in Environmentally Critical Areas (ECAs) in Laguna Bay region
DAO 2005-02 Feb 8, 2005 Exempting Projects located in Philippine Economic Zone Areas (PEZA)
from securing ECC from Laguna Lake Development Authority
DAO 2005-06 Apr 6, 2005 Institutionalizing a System of Mandatory Environmental Insurance
Coverage (MEIC) – institutionalizes MEIC as part of ECC conditions to
compensate those adversely affected stakeholders by a Project
EO 190 (OP) Mar 31, 2003 Abolishing the Golf Course Construction and Development Committee
(GCCDC) of the Office of the President & Transferring its Powers to the
DENR – abolishes GCCDC as entity that gives permit/clearance for
construction of golf course projects in the Philippines
MC 2003-21 Sep 30, 2003 Guidelines on Availment of Reduction of Penalties for Existing Projects
Without ECC – provides Project owners guidelines to obtain lower
penalties for operating without ECC
MC-2002-15 Nov 25,2002 Scope and Guidelines for the Imposition of Applicable Fines and Penalties
for violations under the Philippine EIS System
MC 2001-01 Apr 5, 2001 Guidance on the Implementation of DAO 2000-05: Scope of the
EIS Programmatic Compliance Policy – sets guidelines in implementing
EIS compliance requirements for multi-phase and multi-component
programs, among others
MC 2004-001 April 23, 2004 Non-requirement of Barangay and/or LGU Endorsements and Locational
Clearances for CNC Applications – stops the imposition of endorsements
and clearances from LGU for the processing of Certificate of Non-Coverage
MC 2004-002 Aug 30, 2004 CNC for Barangay Micro-Business Enterprises (BMBEs) – exempts village-
based micro-enterprises from the Coverage of ECC
MC 2004-04 Oct 05, 2004 Initial Environmental Examination (IEE) Checklist for Economic Zone
Enterprises – simplifies the preparation and report format of IEE to be
prepared by locators inside Special Eco-zones
MC 2005-01 Jan 5, 2005 Procedural Manual for DENR Administrative Order No. 30
Series of 2003 (DAO 03-30) – prepares a manual of procedure for DAO-
2003-30 to be used by EIS Preparers, EIA Reviewers, DENR-EMB officials
and staff and the public
MC 2005-07 Nov 14, 2005 Environmental Performance Report and Management Plan (EPRMP)
Checklist for Economic Zone Enterprises – simplifies the preparation and
EPRMP report format for locators inside Special Eco-zones.
4-23
MO 2005-21 Dec 21, 2005 Supplemental Guidelines to MEIC – provides additional instructions/guides
to implement and comply with the mandatory environmental insurance
coverage for Projects
MO 2006-01 Feb 21, 2006 Suspension of the Implementation of the DA 2005-06 which put in place
the Mandatory Environmental Insurance Coverage for all projects covered
by the EIS system
MC 2006-003 Sept 19, 2006 IEE Checklist for Wind Energy Projects – prescribes specific IEE checklist
format specifically for wind energy projects
MC 2006-05 Dec 19, 2006 Clarificatory Guidelines in the implementation of DAO 2003-30, IRR for
the PEISS – issues clarifications and explanations on specific implement-
tation of the EIS system
MC 2007-001 Mar 09, 2007 Environmental Impact Assessment (EIA) Review Manual – issues the
comprehensive manual of procedure for the review of EIA reports submitted
to EMB for ECC purposes to be used primarily by EIA reviewers and EMB
DMC 2007-08 Jul 13, 2007 Simplifying the requirements for Environmental Compliance Certificate or
Certificate of Non-Coverage Applications
DMC 2010-14 June 29, 2010 Standardization of EIS Requirements/ Enhancement of Public Participa-
tion in the Streamlined EIS system – further simplifies and reduces
mandatory documentary annexes of EIS to be prepared/filed at EMB and
provides conditions for enhanced public participation in the EIA process
(Source: Study Team)


Chapter 5
Financial and Economic Evaluation

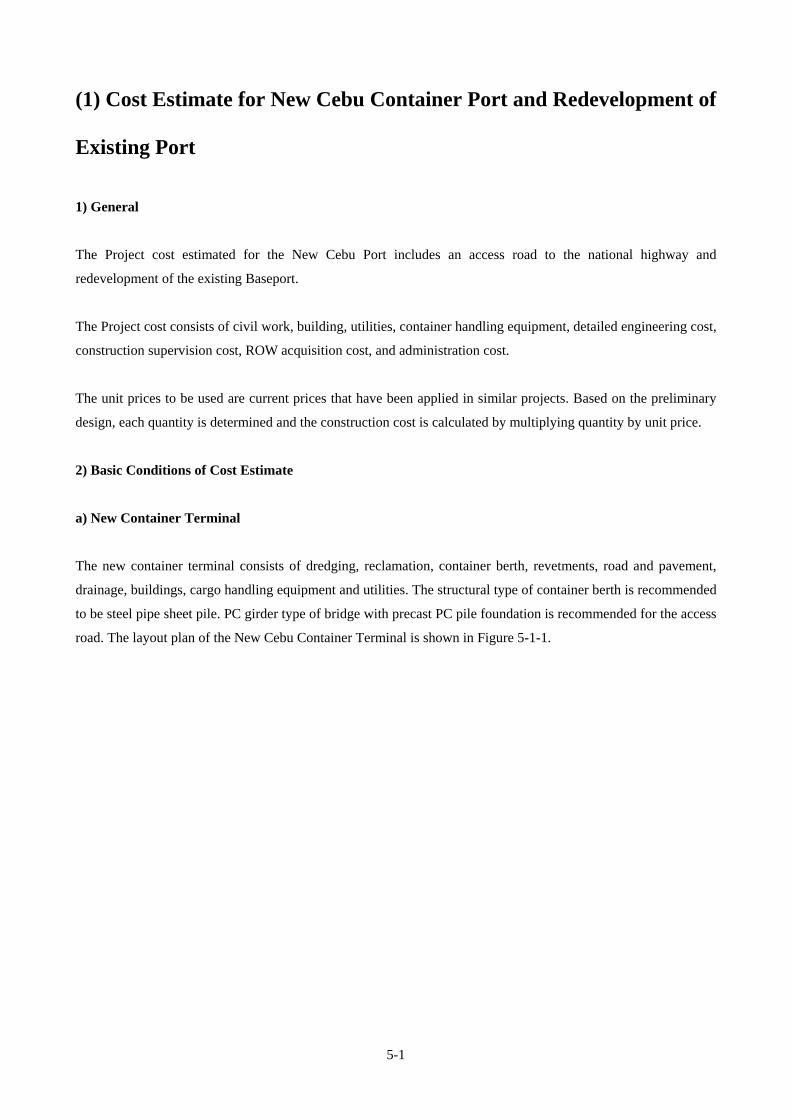
5-1
(1) Cost Estimate for New Cebu Container Port and Redevelopment of
Existing Port
1) General
The Project cost estimated for the New Cebu Port includes an access road to the national highway and
redevelopment of the existing Baseport.
The Project cost consists of civil work, building, utilities, container handling equipment, detailed engineering cost,
construction supervision cost, ROW acquisition cost, and administration cost.
The unit prices to be used are current prices that have been applied in similar projects. Based on the preliminary
design, each quantity is determined and the construction cost is calculated by multiplying quantity by unit price.
2) Basic Conditions of Cost Estimate
a) New Container Terminal
The new container terminal consists of dredging, reclamation, container berth, revetments, road and pavement,
drainage, buildings, cargo handling equipment and utilities. The structural type of container berth is recommended
to be steel pipe sheet pile. PC girder type of bridge with precast PC pile foundation is recommended for the access
road. The layout plan of the New Cebu Container Terminal is shown in Figure 5-1-1.

5-2
Figure 5-1-1 Layout Plan of New Cebu Container Terminal
(Source: Study Team)
Dredged materials will be disposed in the deep sea area in front of Liloan city approximately 25 km from the new
Cebu container terminal. Special attention shall be made to provide a silt protector for the disposed dredging
material in the deep sea in order not to contaminate the sea. It is considered that environmental issues may be
minor because of the small quantity of dredged material (16,500 m³). Quarry sites for reclamation and fill
materials are in the Naga area and some material can be used from access road excavation. Quarry site of rock
material for revetment is in the Toledo area approximately 50 km from the Project site.
b) Existing Cebu Baseport
The layout plan for redevelopment of Cebu Baseport is shown in Figure 5-1-2. This Redevelopment Project
consists of expansion of berth, floating berth, container stocking yard, a new passenger terminal building and
demolition of the existing passenger terminal on Piers No. 1 and 3. The floating berths (pontoons) will be made of
prestressed concrete and fabricated in the shipyard or slipway.

5-3
Figure 5-1-2 Layout Plan of Cebu Baseport
Sky-Walk for Passenger
Superferry
Port Commercial Center
Bulk/General
Container Yard
Parking Parking
International Bulk/General
Domestic Container
Passenger
Domestic Ferry/RORO/General
Commercial Development
Convert Terminal (Pier 1 & 3) Passenger → General Cargo
(Source: Study Team)
c) Cost of Land Acquisition for the Right of Way (ROW) of Access Road
Cost of land acquisition for the access road is estimated based on the zonal value per square meter at the Project
site. The actual purchase cost of ROW is considered to be 200% to 250% of the zonal value as the market price of
the land acquisition.
LAC = A × Z × P
LAC : Land Acquisition Cost
Z : Zonal Valuation per locality
P : Ranges from 200 - 250% (The range depends on the actual location of the lot)
A : Area of the lot to be acquired
d) Exchange Rate
The exchange rate of the Project cost estimates is US$ 1.00=Peso 42.80=Yen 77 or Peso 1.00=Yen 1.80 as of
September 2011.
e) Others
Cost estimates for detailed engineering cost, construction supervision cost, administration cost and physical
contingency are estimated as percentages of the civil work cost as follows:
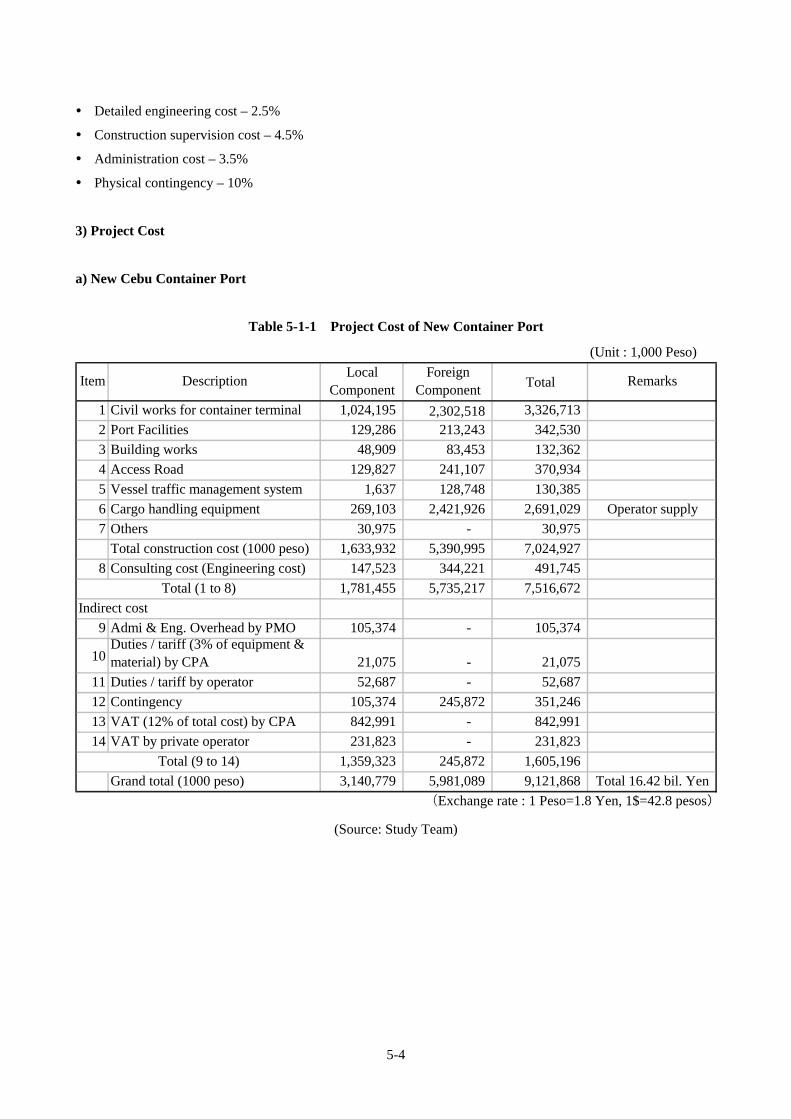
5-4
Detailed engineering cost – 2.5%
Construction supervision cost – 4.5%
Administration cost – 3.5%
Physical contingency – 10%
3) Project Cost
a) New Cebu Container Port
Table 5-1-1 Project Cost of New Container Port
(Unit : 1,000 Peso)
LocalComponent
ForeignComponent
Total
1 Civil works for container terminal 1,024,195 2,302,518 3,326,713
2 Port Facilities 129,286 213,243 342,530
3 Building works 48,909 83,453 132,362
4 Access Road 129,827 241,107 370,934
5 Vessel traffic management system 1,637 128,748 130,385
6 Cargo handling equipment 269,103 2,421,926 2,691,029 Operator supply
7 Others 30,975 - 30,975
Total construction cost (1000 peso) 1,633,932 5,390,995 7,024,927
8 Consulting cost (Engineering cost) 147,523 344,221 491,745
1,781,455 5,735,217 7,516,672
Indirect cost
9 Admi & Eng. Overhead by PMO 105,374 - 105,374
10Duties / tariff (3% of equipment &material) by CPA 21,075 - 21,075
11 Duties / tariff by operator 52,687 - 52,687
12 Contingency 105,374 245,872 351,246
13 VAT (12% of total cost) by CPA 842,991 - 842,991
14 VAT by private operator 231,823 - 231,823
1,359,323 245,872 1,605,196
Grand total (1000 peso) 3,140,779 5,981,089 9,121,868 Total 16.42 bil. Yen
(Exchange rate : 1 Peso=1.8 Yen, 1$=42.8 pesos)
Total (9 to 14)
Total (1 to 8)
RemarksItem Description
(Source: Study Team)

5-5
Table 5-1-2 Breakdown Cost of New Container Port
Item . Description Unit QuantityLocal
ComponentForeign
ComponentTotal
(1,000 Peso)1 Civil Works for Container Berth
1.01 Mobilization/Demobilization and Preparatory Work % 2 49,088 32,726 81,814 Container Berth
1.02 Dredging Works m3 16,750 1,209 4,834 6,043 1.02a Dredging m3 16,750 1.02b Disposal m3 16,750 1.03 Container Berth (Depth -13m) m 450 256,015 1,024,059 1,280,074 1.04 Revetment East (Depth 0 ) m 200 4,667 7,001 11,668 1.05 Revetment East (Depth 0 to -1m) m 150 2,071 8,283 10,353 1.06 Revetment East (Depth (-1 to -13m) m 260 117,415 176,122 293,537 1.07 Revetment North (Depth 0) m 350 4,084 16,335 20,419 1.08 Revetment West (Depth 0) m 450 5,251 21,003 26,253 1.09 Revetment West (Depth 0 to -13m m 160 36,128 144,510 180,638 1.10 Revetment (Depth -11m) m 100 71,783 107,674 179,457 1.11 Reclamation m3 894,000 168,303 252,455 420,758 1.12 Yard Fence m 1,250 2,229 2,229 4,457 1.13 Soil Improvement m3 682,500 70,684 106,026 176,710 1.14 Yard Pavement (incl. Transfer Crane Foundation) m2 93,000 161,338 242,007 403,344 1.15 Reefer Container Yard (Receptacle + Stage) TEU 648 13,785 55,140 68,925 1.16 Pavement (excl. container stacking yard) m2 35,000 29,665 44,498 74,164
Other1.17 Yard Drainage m2 146,000 4,758 19,033 23,791 1.18 Service Road m2 11,200 25,723 38,584 64,307
Sub-Total 1 - Container Berth Civil Works 1,024,195 2,302,519 3,326,713 2 Port Facilities
2.01 Power Supply m2 146,000 20,404 81,616 102,020 2.02 Lighting System (Exterior) m2 146,000 11,312 16,967 28,279 2.03 Generator set 1 74,506 18,627 93,133 2.04 Telecommunications m2 146,000 1,088 1,631 2,719 2.05 Water Supply, Sewage, Firefighting m2 146,000 1,789 2,410 4,199 2.06 Pump House, Water Tank m2 146,000 10,599 15,898 26,497
2.07Environmental Treatment Facilities (Solid Waste,Bilge Oil, etc)
LS 1 1,360 2,040 3,400
2.08 Improvement in Information Technology LS 1 8,228 74,054 82,282 Sub-Total 2 - Port Facilities 129,286 213,243 342,530
3 Building Works3.01 Terminal Building m2 800 17,951 26,927 44,878 3.02 Equipment/container Service Area m2 1,200 18,849 28,273 47,121 3.03 Gate (In) lane 8 6,055 14,127 20,182 3.04 Gate (Out) lane 5 3,784 8,829 12,614 3.05 Weigh Bridge nr 3 2,270 5,298 7,568
Sub-Total 3 Building Works 48,909 83,454 132,362 4 ACCESS ROAD
4.01 Bridge & earthwork 129,827 241,107 370,934 Sub-Total 4 - Access Road 129,827 241,107 370,934
5 Vessel Support5.01 Vessel Traffic Control System LS 1 - 97,653 97,653 5.02 Navigation Aids for New Cebu port LS 1 1,637 31,095 32,732
Sub-Total 5 - Vessel Support 1,637 128,749 130,385 Equipment Supply by CPA (2018: 3QGC, 13RTG, 25Trailer, 2023: 1QGC, 2RTG, 8Trailer, 2027:3RTG,)
6 Cargo Handling Equipment6.01 Quay Gantry Crane nr 4 116,394 1,047,546 1,163,940 6.02 Rubber Tired Transfer Crane nr 18 121,515 1,093,638 1,215,153 6.03 Tractor Head (for yard) nr 33 17,285 155,561 172,845 6.04 Chassis (20' - 40') nr 33 5,762 51,854 57,615 6.05 Miscillaneous Equipment LS 1 5,820 52,377 58,197 6.06 Computer System LS 1 2,328 20,951 23,279
Sub-Total 6 - Cargo Handling Equipment 269,103 2,421,926 2,691,029 7 Others
7.01 Land m2 9,020 27,962 - 27,962 7.02 Mangrove 30,000 120 - 120 7.03 Relocation of Houses 2 2,893 - 2,893
Sub-Total 7 - Others 30,975 - 30,975 Total Construction Cost 1,633,931 5,390,998 7,024,929
(Source: Study Team)
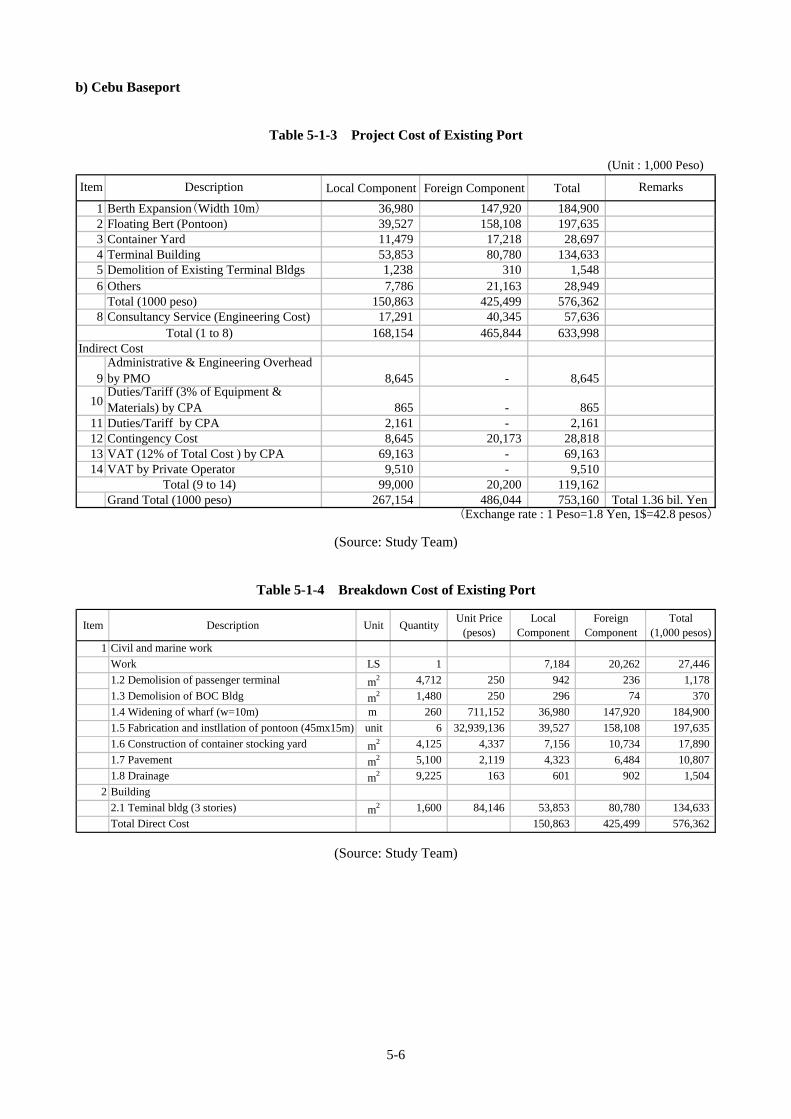
5-6
b) Cebu Baseport
Table 5-1-3 Project Cost of Existing Port
(Unit : 1,000 Peso)
Local Component Foreign Component Total
1 Berth Expansion(Width 10m) 36,980 147,920 184,900 2 Floating Bert (Pontoon) 39,527 158,108 197,635 3 Container Yard 11,479 17,218 28,697 4 Terminal Building 53,853 80,780 134,633 5 Demolition of Existing Terminal Bldgs 1,238 310 1,548 6 Others 7,786 21,163 28,949
Total (1000 peso) 150,863 425,499 576,362 8 Consultancy Service (Engineering Cost) 17,291 40,345 57,636
168,154 465,844 633,998 Indirect Cost
9Administrative & Engineering Overheadby PMO 8,645 - 8,645
10Duties/Tariff (3% of Equipment &Materials) by CPA 865 - 865
11 Duties/Tariff by CPA 2,161 - 2,161 12 Contingency Cost 8,645 20,173 28,818 13 VAT (12% of Total Cost ) by CPA 69,163 - 69,163 14 VAT by Private Operator 9,510 - 9,510
99,000 20,200 119,162 Grand Total (1000 peso) 267,154 486,044 753,160 Total 1.36 bil. Yen
Remarks
(Exchange rate : 1 Peso=1.8 Yen, 1$=42.8 pesos)
Total (9 to 14)
Total (1 to 8)
Item Description
(Source: Study Team)
Table 5-1-4 Breakdown Cost of Existing Port
Item Description Unit QuantityUnit Price
(pesos)Local
ComponentForeign
ComponentTotal
(1,000 pesos)1 Civil and marine work
Work LS 1 7,184 20,262 27,446
1.2 Demolision of passenger terminal m2 4,712 250 942 236 1,178
1.3 Demolision of BOC Bldg m2 1,480 250 296 74 370
1.4 Widening of wharf (w=10m) m 260 711,152 36,980 147,920 184,900
1.5 Fabrication and instllation of pontoon (45mx15m) unit 6 32,939,136 39,527 158,108 197,635
1.6 Construction of container stocking yard m2 4,125 4,337 7,156 10,734 17,890
1.7 Pavement m2 5,100 2,119 4,323 6,484 10,807
1.8 Drainage m2 9,225 163 601 902 1,504
2 Building
2.1 Teminal bldg (3 stories) m2 1,600 84,146 53,853 80,780 134,633
Total Direct Cost 150,863 425,499 576,362
(Source: Study Team)

5-7
(2) Outline of Preliminary Financial and Economic Analysis
1) Financial Analysis
1)-1 Methodology
The purpose of the financial analysis is to appraise the financial viability of the Project from the viewpoint of
capital investment as to whether it can yield sufficient returns. In this Study, to measure the financial viability
quantitatively, the Financial Internal Rate of Return (FIRR) on gross capital bases is calculated and compared
with the Weighted Average Cost of Capital (WACC) as to whether FIRR can exceed the WACC. FIRRs of the
Project will be calculated for both the New Container Port and the existing Cebu Baseport individually, and
regarding the former, FIRRs are calculated separately for CPA and the Terminal Operator.
1)-2 Prerequisites for the Financial Analysis
a) Base Year
Incomes and expenses estimated in the financial analysis are expressed as the price of some fixed year throughout
the “Project Life” mentioned below. The year is called “Base Year.” In this analysis, the year 2011 is adopted as
the “Base Year” since the expenses and revenues of the Project are prepared on the basis of the current price of
the same year.
b) Project Life
It is assumed that engineering services on the New Container Port will commence in 2014 and a total of 37 years
until 2050 is adopted as the “Project Life” including the construction period for infrastructure and the operation
period of the terminal.
c) Foreign Exchange Rate
The following foreign exchange rates are adopted for this analysis:
PhP 1.0 = ¥ 1.8, US$1.00 = PhP 42.8 as of September 2011.
d) “With-the-Project” Case and “Without-the-Project” Case
A cost-benefit analysis is conducted on the difference between the “With-the-Project” case in which an
investment is made and the “Without-the-Project” case in which no investment is made. That is, the revenues and
expenses arising from the investment for the Project are calculated in market price and compared.
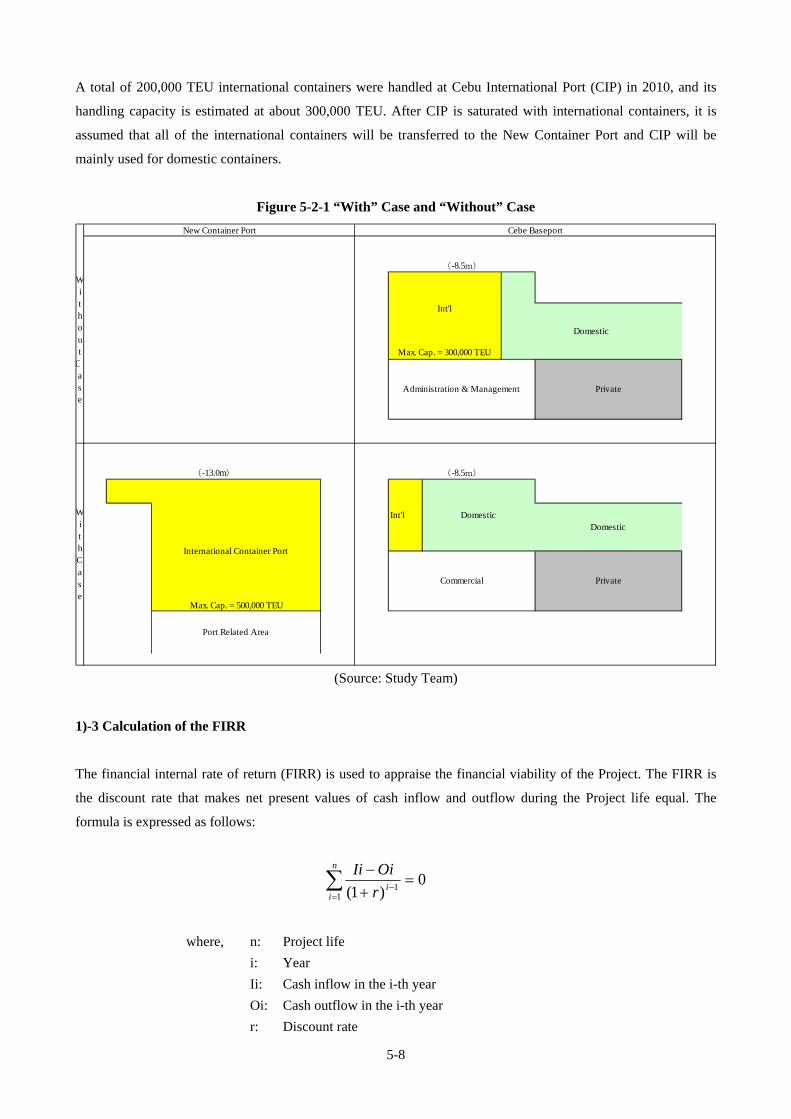
5-8
A total of 200,000 TEU international containers were handled at Cebu International Port (CIP) in 2010, and its
handling capacity is estimated at about 300,000 TEU. After CIP is saturated with international containers, it is
assumed that all of the international containers will be transferred to the New Container Port and CIP will be
mainly used for domestic containers.
Figure 5-2-1 “With” Case and “Without” Case
(Source: Study Team)
1)-3 Calculation of the FIRR
The financial internal rate of return (FIRR) is used to appraise the financial viability of the Project. The FIRR is
the discount rate that makes net present values of cash inflow and outflow during the Project life equal. The
formula is expressed as follows:
n
iir
OiIi
11
0)1(
where, n: Project life
i: Year
Ii: Cash inflow in the i-th year
Oi: Cash outflow in the i-th year
r: Discount rate
WithCase
Port Related Area
Administration & Management
Max. Cap. = 500,000 TEU
Without
Case
Domestic
International Container Port
(-13.0m)
New Container Port Cebe Baseport
Domestic
(-8.5m)
Commercial Private
Int'l
Private
Int'l Domestic
(-8.5m)
Max. Cap. = 300,000 TEU

5-9
1)-4 Sensitivity Analysis
Sensitivity analysis is executed to determine whether the Project will remain feasible if changes in the
assumptions used in the calculation/projections were to take place according to the degree in which they are likely
to vary from the estimated or projected values. The following three (3) cases are examined in this Study as
sensitivity analyses:
Case I: Increase in projected costs by 10% and 20%
Case II: Decrease in revenues by 10% and 20%
Case III: Combination of Cases I and II
1)-5 Net Present Value (NPV)
Expenses and revenues that will be generated each year during the Project life are converted to the present value
by applying the weighted average cost of the capital (WACC) as a social discount rate. Through this process,
values of expenses and revenues decrease as time passes. If the NPV is negative, the Project should probably be
rejected.
1)-6 Financial Analysis on New Container Port Development Project
FIRR on the New Container Port Development Project is calculated in order to confirm the financial viability of
the Project as a whole. The Government of the Philippines has been working out its policy on infrastructures
development based on PPP scheme as much as possible. Therefore, FIRR will be calculated for investor-wise
(CPA and Terminal Operator) so as to evaluate the possibility of introduction of PPP scheme into this Project. In
this Study, it is assumed that, as indicated in Table 5-1-1, a Terminal Operator will invest for cargo handling
equipment and CPA will invest for civil and architectural infrastructure. Implementation scheme of the New
Container Port Development Project is discussed in Chapter 8, 1)-3.
a) Revenues
Revenues are gained by providing port services to users such as shippers and shipping lines. CPA revenues
include vessel charges, cargo charges, storage charges, arrastre share, and stevedoring share. Twenty percent
(20%) of the handling charge for international containers goes to CPA as a concession fee and the rest of the
portion belongs to the Terminal Operator. Recent CPA revenues per international container (TEU) based on CIP’s
financial documents are summarized in Table 5-2-1. Future CPA revenues are estimated by multiplying the unit
TEU revenue and estimated international TEU.
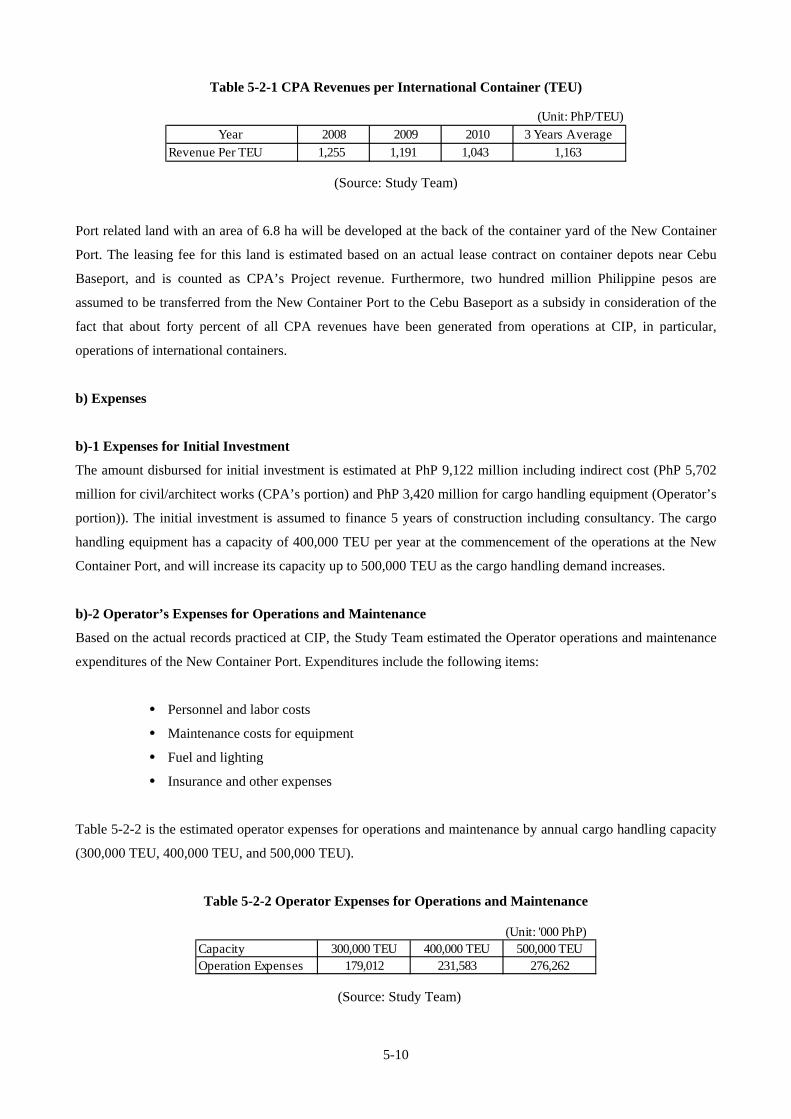
5-10
Table 5-2-1 CPA Revenues per International Container (TEU)
(Unit: PhP/TEU)
Year 2008 2009 2010 3 Years Average
Revenue Per TEU 1,255 1,191 1,043 1,163
(Source: Study Team)
Port related land with an area of 6.8 ha will be developed at the back of the container yard of the New Container
Port. The leasing fee for this land is estimated based on an actual lease contract on container depots near Cebu
Baseport, and is counted as CPA’s Project revenue. Furthermore, two hundred million Philippine pesos are
assumed to be transferred from the New Container Port to the Cebu Baseport as a subsidy in consideration of the
fact that about forty percent of all CPA revenues have been generated from operations at CIP, in particular,
operations of international containers.
b) Expenses
b)-1 Expenses for Initial Investment
The amount disbursed for initial investment is estimated at PhP 9,122 million including indirect cost (PhP 5,702
million for civil/architect works (CPA’s portion) and PhP 3,420 million for cargo handling equipment (Operator’s
portion)). The initial investment is assumed to finance 5 years of construction including consultancy. The cargo
handling equipment has a capacity of 400,000 TEU per year at the commencement of the operations at the New
Container Port, and will increase its capacity up to 500,000 TEU as the cargo handling demand increases.
b)-2 Operator’s Expenses for Operations and Maintenance
Based on the actual records practiced at CIP, the Study Team estimated the Operator operations and maintenance
expenditures of the New Container Port. Expenditures include the following items:
Personnel and labor costs
Maintenance costs for equipment
Fuel and lighting
Insurance and other expenses
Table 5-2-2 is the estimated operator expenses for operations and maintenance by annual cargo handling capacity
(300,000 TEU, 400,000 TEU, and 500,000 TEU).
Table 5-2-2 Operator Expenses for Operations and Maintenance
(Unit: '000 PhP)Capacity 300,000 TEU 400,000 TEU 500,000 TEUOperation Expenses 179,012 231,583 276,262
(Source: Study Team)
5-11
b)-3 Management Expenses of CPA
Based on past records of CIP’s expenses, management expenses including port security are estimated. In addition,
It is assumed that the New Container Port will bear forty percent (40%) of the CPA headquarters’ expenses
including personnel costs and administrative costs, and that this amount is listed as a component of the Project
expenses (CPA portion).
b)-4 Maintenance Costs for Infrastructure
CPA will bear maintenance costs for infrastructure. This is assumed to be 1% of the initial investment expenses of
depreciable infrastructure. No maintenance expenses for infrastructure are required for 5 years after
commencement of the operations.
b)-5 Renewal Investment
A Terminal Operator will bear renewal expenses for cargo handling equipment, which will be renewed when its
useful life expires throughout the Project life. Individual use lives are assumed referring to actual operational
experiences: Fifteen (15) years for reach stacker, forklift and tractor/chassis, twenty (20) years for Rubber Tire
Mounted Gantry Cranes (RTG), and 25 years for Quayside Gantry Cranes.
c) FIRR of New Container Port Development Project
The resulting FIRR is shown in Table 5-2-3 for the overall Project, Table 5-2-4 for CPA’s portion, and Table
5-2-5 for Terminal Operator’s portion.
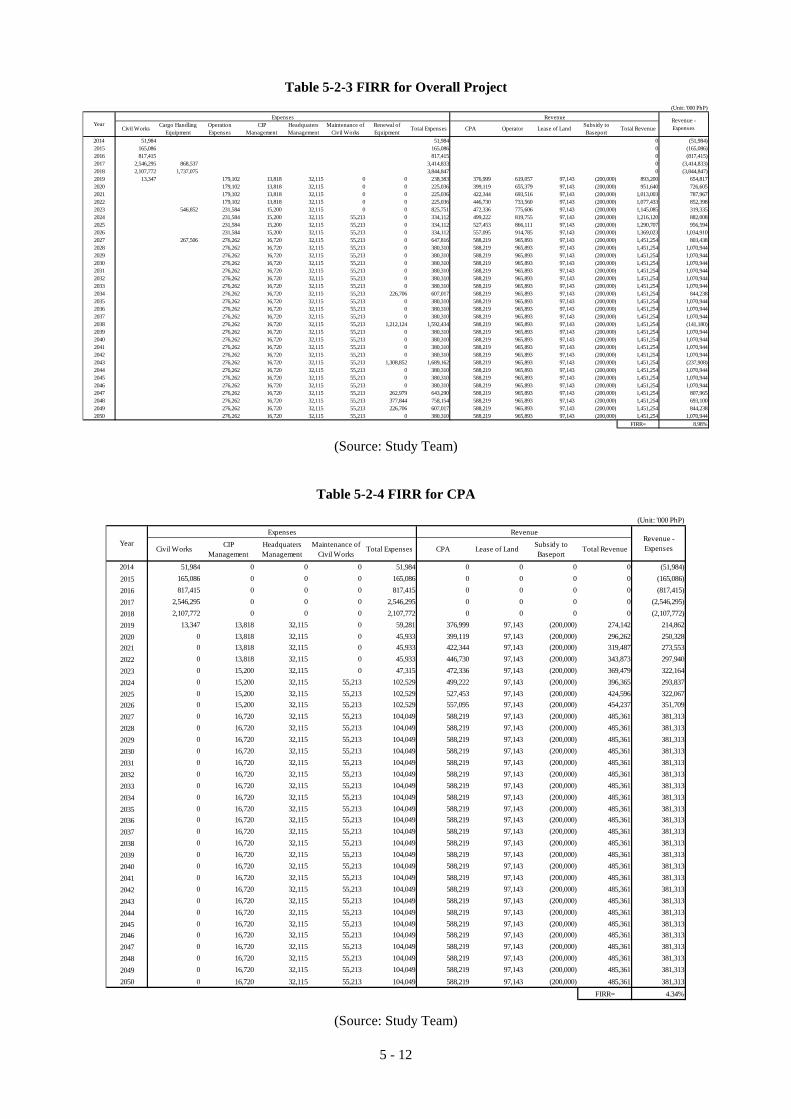
5 - 12
Table 5-2-3 FIRR for Overall Project (Unit: '000 PhP)
2014 51,984 51,984 0 (51,984)2015 165,086 165,086 0 (165,086)2016 817,415 817,415 0 (817,415)2017 2,546,295 868,537 3,414,833 0 (3,414,833)2018 2,107,772 1,737,075 3,844,847 0 (3,844,847)2019 13,347 179,102 13,818 32,115 0 0 238,383 376,999 619,057 97,143 (200,000) 893,200 654,8172020 179,102 13,818 32,115 0 0 225,036 399,119 655,379 97,143 (200,000) 951,640 726,6052021 179,102 13,818 32,115 0 0 225,036 422,344 693,516 97,143 (200,000) 1,013,003 787,9672022 179,102 13,818 32,115 0 0 225,036 446,730 733,560 97,143 (200,000) 1,077,433 852,3982023 546,852 231,584 15,200 32,115 0 0 825,751 472,336 775,606 97,143 (200,000) 1,145,085 319,3352024 231,584 15,200 32,115 55,213 0 334,112 499,222 819,755 97,143 (200,000) 1,216,120 882,0082025 231,584 15,200 32,115 55,213 0 334,112 527,453 866,111 97,143 (200,000) 1,290,707 956,5942026 231,584 15,200 32,115 55,213 0 334,112 557,095 914,785 97,143 (200,000) 1,369,023 1,034,9102027 267,506 276,262 16,720 32,115 55,213 0 647,816 588,219 965,893 97,143 (200,000) 1,451,254 803,4382028 276,262 16,720 32,115 55,213 0 380,310 588,219 965,893 97,143 (200,000) 1,451,254 1,070,9442029 276,262 16,720 32,115 55,213 0 380,310 588,219 965,893 97,143 (200,000) 1,451,254 1,070,9442030 276,262 16,720 32,115 55,213 0 380,310 588,219 965,893 97,143 (200,000) 1,451,254 1,070,9442031 276,262 16,720 32,115 55,213 0 380,310 588,219 965,893 97,143 (200,000) 1,451,254 1,070,9442032 276,262 16,720 32,115 55,213 0 380,310 588,219 965,893 97,143 (200,000) 1,451,254 1,070,9442033 276,262 16,720 32,115 55,213 0 380,310 588,219 965,893 97,143 (200,000) 1,451,254 1,070,9442034 276,262 16,720 32,115 55,213 226,706 607,017 588,219 965,893 97,143 (200,000) 1,451,254 844,2382035 276,262 16,720 32,115 55,213 0 380,310 588,219 965,893 97,143 (200,000) 1,451,254 1,070,9442036 276,262 16,720 32,115 55,213 0 380,310 588,219 965,893 97,143 (200,000) 1,451,254 1,070,9442037 276,262 16,720 32,115 55,213 0 380,310 588,219 965,893 97,143 (200,000) 1,451,254 1,070,9442038 276,262 16,720 32,115 55,213 1,212,124 1,592,434 588,219 965,893 97,143 (200,000) 1,451,254 (141,180)2039 276,262 16,720 32,115 55,213 0 380,310 588,219 965,893 97,143 (200,000) 1,451,254 1,070,9442040 276,262 16,720 32,115 55,213 0 380,310 588,219 965,893 97,143 (200,000) 1,451,254 1,070,9442041 276,262 16,720 32,115 55,213 0 380,310 588,219 965,893 97,143 (200,000) 1,451,254 1,070,9442042 276,262 16,720 32,115 55,213 0 380,310 588,219 965,893 97,143 (200,000) 1,451,254 1,070,9442043 276,262 16,720 32,115 55,213 1,308,852 1,689,162 588,219 965,893 97,143 (200,000) 1,451,254 (237,908)2044 276,262 16,720 32,115 55,213 0 380,310 588,219 965,893 97,143 (200,000) 1,451,254 1,070,9442045 276,262 16,720 32,115 55,213 0 380,310 588,219 965,893 97,143 (200,000) 1,451,254 1,070,9442046 276,262 16,720 32,115 55,213 0 380,310 588,219 965,893 97,143 (200,000) 1,451,254 1,070,9442047 276,262 16,720 32,115 55,213 262,979 643,290 588,219 965,893 97,143 (200,000) 1,451,254 807,9652048 276,262 16,720 32,115 55,213 377,844 758,154 588,219 965,893 97,143 (200,000) 1,451,254 693,1002049 276,262 16,720 32,115 55,213 226,706 607,017 588,219 965,893 97,143 (200,000) 1,451,254 844,2382050 276,262 16,720 32,115 55,213 0 380,310 588,219 965,893 97,143 (200,000) 1,451,254 1,070,944
FIRR= 8.98%
YearExpenses Revenue
Operator Lease of LandSubsidy toBaseport
Total Revenue
Revenue -ExpensesCivil Works
Cargo HandlingEquipment
OperationExpenses
CIPManagement
HeadquatersManagement
Maintenance ofCivil Works
Renewal ofEquipment
Total Expenses CPA
(Source: Study Team)
Table 5-2-4 FIRR for CPA
(Unit: '000 PhP)
2014 51,984 0 0 0 51,984 0 0 0 0 (51,984)
2015 165,086 0 0 0 165,086 0 0 0 0 (165,086)
2016 817,415 0 0 0 817,415 0 0 0 0 (817,415)
2017 2,546,295 0 0 0 2,546,295 0 0 0 0 (2,546,295)
2018 2,107,772 0 0 0 2,107,772 0 0 0 0 (2,107,772)
2019 13,347 13,818 32,115 0 59,281 376,999 97,143 (200,000) 274,142 214,862
2020 0 13,818 32,115 0 45,933 399,119 97,143 (200,000) 296,262 250,328
2021 0 13,818 32,115 0 45,933 422,344 97,143 (200,000) 319,487 273,553
2022 0 13,818 32,115 0 45,933 446,730 97,143 (200,000) 343,873 297,940
2023 0 15,200 32,115 0 47,315 472,336 97,143 (200,000) 369,479 322,164
2024 0 15,200 32,115 55,213 102,529 499,222 97,143 (200,000) 396,365 293,837
2025 0 15,200 32,115 55,213 102,529 527,453 97,143 (200,000) 424,596 322,067
2026 0 15,200 32,115 55,213 102,529 557,095 97,143 (200,000) 454,237 351,709
2027 0 16,720 32,115 55,213 104,049 588,219 97,143 (200,000) 485,361 381,313
2028 0 16,720 32,115 55,213 104,049 588,219 97,143 (200,000) 485,361 381,313
2029 0 16,720 32,115 55,213 104,049 588,219 97,143 (200,000) 485,361 381,313
2030 0 16,720 32,115 55,213 104,049 588,219 97,143 (200,000) 485,361 381,313
2031 0 16,720 32,115 55,213 104,049 588,219 97,143 (200,000) 485,361 381,313
2032 0 16,720 32,115 55,213 104,049 588,219 97,143 (200,000) 485,361 381,313
2033 0 16,720 32,115 55,213 104,049 588,219 97,143 (200,000) 485,361 381,313
2034 0 16,720 32,115 55,213 104,049 588,219 97,143 (200,000) 485,361 381,313
2035 0 16,720 32,115 55,213 104,049 588,219 97,143 (200,000) 485,361 381,313
2036 0 16,720 32,115 55,213 104,049 588,219 97,143 (200,000) 485,361 381,313
2037 0 16,720 32,115 55,213 104,049 588,219 97,143 (200,000) 485,361 381,313
2038 0 16,720 32,115 55,213 104,049 588,219 97,143 (200,000) 485,361 381,313
2039 0 16,720 32,115 55,213 104,049 588,219 97,143 (200,000) 485,361 381,313
2040 0 16,720 32,115 55,213 104,049 588,219 97,143 (200,000) 485,361 381,313
2041 0 16,720 32,115 55,213 104,049 588,219 97,143 (200,000) 485,361 381,313
2042 0 16,720 32,115 55,213 104,049 588,219 97,143 (200,000) 485,361 381,313
2043 0 16,720 32,115 55,213 104,049 588,219 97,143 (200,000) 485,361 381,313
2044 0 16,720 32,115 55,213 104,049 588,219 97,143 (200,000) 485,361 381,313
2045 0 16,720 32,115 55,213 104,049 588,219 97,143 (200,000) 485,361 381,313
2046 0 16,720 32,115 55,213 104,049 588,219 97,143 (200,000) 485,361 381,313
2047 0 16,720 32,115 55,213 104,049 588,219 97,143 (200,000) 485,361 381,313
2048 0 16,720 32,115 55,213 104,049 588,219 97,143 (200,000) 485,361 381,313
2049 0 16,720 32,115 55,213 104,049 588,219 97,143 (200,000) 485,361 381,313
2050 0 16,720 32,115 55,213 104,049 588,219 97,143 (200,000) 485,361 381,313
FIRR= 4.34%
Revenue -ExpensesCivil Works
CIPManagement
HeadquatersManagement
Maintenance ofCivil Works
Total Expenses CPA Lease of LandSubsidy toBaseport
Year
Expenses Revenue
Total Revenue
(Source: Study Team)

5 - 13
Table 5-2-5 FIRR for Terminal Operator
(Unit: '000 PhP)
2014 0 0 0 0 0 0 0
2015 0 0 0 0 0 0 0
2016 0 0 0 0 0 0 0
2017 868,537 0 0 868,537 0 0 (868,537)
2018 1,737,075 0 0 1,737,075 0 0 (1,737,075)
2019 0 179,102 0 179,102 619,057 619,057 439,955
2020 0 179,102 0 179,102 655,379 655,379 476,276
2021 0 179,102 0 179,102 693,516 693,516 514,414
2022 0 179,102 0 179,102 733,560 733,560 554,458
2023 546,852 231,584 0 778,436 775,606 775,606 (2,829)
2024 0 231,584 0 231,584 819,755 819,755 588,171
2025 0 231,584 0 231,584 866,111 866,111 634,527
2026 0 231,584 0 231,584 914,785 914,785 683,201
2027 267,506 276,262 0 543,768 965,893 965,893 422,125
2028 0 276,262 0 276,262 965,893 965,893 689,631
2029 0 276,262 0 276,262 965,893 965,893 689,631
2030 0 276,262 0 276,262 965,893 965,893 689,631
2031 0 276,262 0 276,262 965,893 965,893 689,631
2032 0 276,262 0 276,262 965,893 965,893 689,631
2033 0 276,262 0 276,262 965,893 965,893 689,631
2034 0 276,262 226,706 502,968 965,893 965,893 462,925
2035 0 276,262 0 276,262 965,893 965,893 689,631
2036 0 276,262 0 276,262 965,893 965,893 689,631
2037 0 276,262 0 276,262 965,893 965,893 689,631
2038 0 276,262 1,212,124 1,488,385 965,893 965,893 (522,492)
2039 0 276,262 0 276,262 965,893 965,893 689,631
2040 0 276,262 0 276,262 965,893 965,893 689,631
2041 0 276,262 0 276,262 965,893 965,893 689,631
2042 0 276,262 0 276,262 965,893 965,893 689,631
2043 0 276,262 1,308,852 1,585,113 965,893 965,893 (619,220)
2044 0 276,262 0 276,262 965,893 965,893 689,631
2045 0 276,262 0 276,262 965,893 965,893 689,631
2046 0 276,262 0 276,262 965,893 965,893 689,631
2047 0 276,262 262,979 539,241 965,893 965,893 426,652
2048 0 276,262 377,844 654,106 965,893 965,893 311,787
2049 0 276,262 226,706 502,968 965,893 965,893 462,925
2050 0 276,262 0 276,262 965,893 965,893 689,631
FIRR= 18.01%
Year
Expenses Revenue
Revenue - ExpensesCargo HandlingEquipment
OperationExpenses
Renewal ofEquipment
Total ExpensesOperatorRevenue
Total Revenue
(Source: Study Team)
d) Sensitivity Analysis of New Container Port Development Project
The resulting FIRRs of Case I, II, and III in the sensitivity analysis explained previously are shown in Table 5-2-6.

5 - 14
Table 5-2-6 FIRR of Sensitivity Analysis
(Source: Study Team)
e) NPV and B/C Ratio of New Container Port Development Project
Assuming discount rates of 2.16% for CPA and 6.43% for TO, both of which are derived from the financial plan
discussed in detail in Chapter 9, the resulting NPVs are PhP 2,087 million and PhP 3,366 million, respectively.
Further, B/C Ratios are 1.29 for CPA and 1.59 for TO under the same discount rates.
1)-7 Financial Analysis on Cebu Baseport Redevelopment Project
Cebu Baseport Redevelopment Project includes construction works for berth widening, floating pontoon,
container yard pavement and passenger terminal building, and a financial analysis will be carried out under an
assumption that CPA will be the implementation body of the Project.
a) Revenues
In the “Without” case, international cargoes are assumed to be handled at CIP and domestic cargoes are
loaded/unloaded at other wharves. It is estimated that international container throughput will reach CIP’s
maximum capacity in around 2018. After the saturation, throughput of international containers cannot increase at
Cebu Baseport.
In the “With” case, it is assumed that the New Container Port will commence operations and subsequently, all of
the international containers will be handled at the New Container Port. CIP can be used for domestic containers
after the international containers shift to the New Container Port. Hence, domestic container handling capacity at
the Baseport can be expanded. Cargo throughput except international containers at the Cebu Baseport will reach
the maximum cargo handling capacity in around 2028. The difference in cargo handling capacity between the
“With” case and “Without” case is the revenue source of the Project in the financial analysis.
CPA revenues per MT including charges to vessels, cargoes, and storage at Cebu Baseport during the period
between 2008 and 2010 are shown in Table 5-2-7. Future CPA revenues can be estimated by multiplying the unit
revenue and difference of cargo volume (MT) between the “With” case and “Without” case.
On the other hand, the Baseport will lose revenue corresponding to 300,000 TEU by shifting international
containers to the New Container Port. Decrease in revenue for this amount results in negative Project revenue in
Overall Project CPA Operator Overall Project CPA Operator7.62% 3.51% 15.61% 6.39% 2.76% 13.48%
Overall Project CPA Operator Overall Project CPA Operator7.48% 3.42% 15.36% 5.81% 2.41% 12.48%
Overall Project CPA Operator Overall Project CPA Operator6.13% 2.60% 13.03% 3.16% N.A 7.98%
Case IIICost Increase & Revenue Decrease By 10% Cost Increase & Revenue Decrease By 20%
Case ICost Increase By 10% Cost Increase By 20%
Case IIRevenue Decrease By 10% Revenue Decrease By 20%

5 - 15
the financial analysis.
Table 5-2-7 Unit CPA Revenue By Trade Type
(Source: Study Team)
A plot of CIP land of 8.5 ha is planned to be converted to commercial land use. Revenue by leasing the plot to the
private sector is included in the Project revenues in this financial analysis. The leasing fee of this plot is estimated
based on an actual lease contract near the Baseport. In addition, PhP 200 million is included in the Project
revenues because the New Container Port is expected to subsidize the Baseport in compensation for complete
shifting of international containers from the Baseport to the New Container Port.
b) Expenses
b)-1 Expenses for Initial Investment
Initial investment costs for demolishing existing facilities and constructing new facilities are included in the
Project expenses. Infrastructures and buildings will be constructed in three (3) years including consultancy
services.
b)-2 Management Expenses
An increase in management expenses of CPA is included in the Project expenses in comparison with the
“Without” case.
b)-3 Maintenance Costs for Infrastructure
This is assumed to be 1% of the initial investment expenses of depreciable infrastructure and architecture. No
maintenance expenses are required for 5 years after commencement of the operations.
c) FIRR of Cebu Baseport Redevelopment Project
FIRR of the Cebu Baseport Redevelopment Project is estimated at 5.81% (see Table 5-2-8).
(Unit:PhP/MT)
Year 2008 2009 2010 Ave.
Foreign Cargo 90.0 97.6 89.3 92.3
Domestic Cargo 22.7 24.8 23.6 23.7

5 - 16
Table 5-2-8 FIRR of Cebu Baseport Redevelopment Project
(Source: Study Team)
d) Sensitivity Analysis of Cebu Baseport Redevelopment Project
The resulting FIRRs of Case I, II, and III in the sensitivity analysis are summarized in Table 5-2-9.
Table 5-2-9 Sensitivity Analysis of Cebu Baseport Redevelopment Project
Case IIICost Increase & Revenue Decrease By 10% Cost Increase & Revenue Decrease By 20%
3.81% N.A
Case IIRevenue Decrease By 10% Revenue Decrease By 20%
4.76% 3.59%
Case ICost Increase By 10% Cost Increase By 20%
4.86% 4.00%
(Source: Study Team)
e) NPV and B/C Ratio of Cebu Baseport Redevelopment Project
Assuming discount rates of 7.0% for CPA, the resulting NPV and its B/C Ratios of the Cebu Baseport
Redevelopment Project are PhP -85 million and 0.89, respectively.
(Unit: '000 PhP)
2015 0 02016 0 0 02017 0 0 02018 22,874 22,874 0 (22,874)2019 44,444 2,764 1,735 48,943 (355,933) 6,557 5,863 120,857 200,000 (22,656) (71,599)2020 684,149 2,764 3,509 690,421 (355,933) 13,467 11,860 120,857 200,000 (9,749) (700,171)2021 1,693 2,764 5,324 9,781 (355,933) 20,113 17,995 120,857 200,000 3,032 (6,749)2022 2,764 7,181 9,944 (355,933) 27,090 24,271 120,857 200,000 16,284 6,3402023 2,764 9,080 11,843 (355,933) 34,414 30,690 120,857 200,000 30,028 18,1852024 3,040 11,023 14,063 (355,933) 42,103 37,257 120,857 200,000 44,284 30,2212025 3,040 13,010 16,050 (355,933) 50,175 43,974 120,857 200,000 59,073 43,0232026 3,040 15,043 7,153 25,236 (355,933) 58,649 50,846 120,857 200,000 74,419 49,1832027 3,040 17,123 7,153 27,316 (355,933) 67,545 57,876 120,857 200,000 90,344 63,0292028 3,040 19,250 7,153 29,443 (355,933) 76,884 65,067 120,857 200,000 106,874 77,4312029 3,040 19,250 7,153 29,443 (355,933) 76,884 65,067 120,857 200,000 106,874 77,4312030 3,040 19,250 7,153 29,443 (355,933) 76,884 65,067 120,857 200,000 106,874 77,431
2031 3,040 19,250 7,153 29,443 (355,933) 76,884 65,067 120,857 200,000 106,874 77,431
2032 3,040 19,250 7,153 29,443 (355,933) 76,884 65,067 120,857 200,000 106,874 77,4312033 3,040 19,250 7,153 29,443 (355,933) 76,884 65,067 120,857 200,000 106,874 77,4312034 3,040 19,250 7,153 29,443 (355,933) 76,884 65,067 120,857 200,000 106,874 77,4312035 3,040 19,250 7,153 29,443 (355,933) 76,884 65,067 120,857 200,000 106,874 77,4312036 3,040 19,250 7,153 29,443 (355,933) 76,884 65,067 120,857 200,000 106,874 77,4312037 3,040 19,250 7,153 29,443 (355,933) 76,884 65,067 120,857 200,000 106,874 77,4312038 3,040 19,250 7,153 29,443 (355,933) 76,884 65,067 120,857 200,000 106,874 77,4312039 3,040 19,250 7,153 29,443 (355,933) 76,884 65,067 120,857 200,000 106,874 77,4312040 3,040 19,250 7,153 29,443 (355,933) 76,884 65,067 120,857 200,000 106,874 77,4312041 3,040 19,250 7,153 29,443 (355,933) 76,884 65,067 120,857 200,000 106,874 77,4312042 3,040 19,250 7,153 29,443 (355,933) 76,884 65,067 120,857 200,000 106,874 77,4312043 3,040 19,250 7,153 29,443 (355,933) 76,884 65,067 120,857 200,000 106,874 77,4312044 3,040 19,250 7,153 29,443 (355,933) 76,884 65,067 120,857 200,000 106,874 77,4312045 3,040 19,250 7,153 29,443 (355,933) 76,884 65,067 120,857 200,000 106,874 77,4312046 3,040 19,250 7,153 29,443 (355,933) 76,884 65,067 120,857 200,000 106,874 77,4312047 3,040 19,250 7,153 29,443 (355,933) 76,884 65,067 120,857 200,000 106,874 77,4312048 3,040 19,250 7,153 29,443 (355,933) 76,884 65,067 120,857 200,000 106,874 77,4312049 3,040 19,250 7,153 29,443 (355,933) 76,884 65,067 120,857 200,000 106,874 77,4312050 3,040 19,250 7,153 29,443 (355,933) 76,884 65,067 120,857 200,000 106,874 77,431
FIRR= 5.81%
Year Subsidy FromNew Container
Port
Total RevenueCivil WorksCPA Foreign Cargo
Mgnt ExpensesCPA Domestic Cargo
Mgnt Expenses
Expenses RevenueRevenue -Expenses
Maintenanceof Civil Works
Total ExpensesLoss of Foreign
ContainerForeign Cargo
RevenueDomestic Cargo
RevenueLease
Revenue

5 - 17
1)-8 Financial Evaluation
The resulting FIRRs for CPA and TO in the base case of the New Container Port Development Project are 4.34%
and 18.01% respectively, which exceed the WACC of the Project (2.16% for CPA in the case of 85% JICA Loan,
and 6.43% for TO in the case of 70% bank loan). In addition, even in sensitivity analyses, all of the cases of 10%
variance exceed the WACC mentioned above.
Regarding the Cebu Baseport Redevelopment Project, FIRR for the base case is estimated at 5.81%, which is
below the estimated interest rate of bank loan (7.0% in this analysis). It should be noted, however, that the FIRR
of the Project would be much higher if the 8.5 ha of CPA plot is sold for redevelopment instead of leased because
the CPA can earn a large amount of revenue at the beginning of the Project life.
Thus, the New Container Port Development Project is judged financially viable, and the Cebu Baseport
Redevelopment Project is also financially feasible if the financial plan is slightly improved.
2) Economic Analysis
2)-1 Purpose and Methodology of Economic Analysis
The economic analysis is carried out to study the economic benefits as well as economic costs arising from the
Project, and to evaluate whether the benefits of the Project exceed those that could be obtained from other
investment opportunities in the Philippines.
In the economic analysis the development plan, the “With” case, is compared to the “Without” case. All of the
benefit and cost differences between the “With” case and “Without” case will be calculated in market price, then
they will be converted to economic price.
In this Study, the Economic Internal Rate of Return (EIRR) method as well as NPV and B/C Ratio is used to
evaluate and appraise the economic feasibility of the Project. Sensitivity analysis is also conducted.
2)-2 Prerequisites for Economic Analysis
a) Base Year
As the financial analysis, the year 2011 is adopted as the “Base Year” since the market survey was conducted for
the estimation of construction costs in this year.
b) Project Life
It is assumed that engineering services on the Project will commence in 2014, and a total of 37 years until 2050 is

5 - 18
adopted as the “Project Life” including the construction period for infrastructure and the operation period of the
terminal.
c) Foreign Currency Exchange Rate
For the financial analysis, the following foreign exchange rates are adopted:
PhP 1.0 = ¥ 1.8, US$1.00 = PhP 42.8 as of September 2011.
d) Economic Price
d)-1 General
For the economic analysis, all prices must be expressed as economic prices. In general, the construction costs, the
operation costs and the maintenance costs are estimated at market prices. To convert market prices to economic
prices, conversion factors are used.
d)-2 Conversion Factors
It is generally required for ODA projects in the Philippines that project evaluation studies on infrastructure
development projects should be in consistent with the Guidelines which National Economic Development Agency
set forth. In this analysis, all costs and benefits are expressed in Philippine Pesos. A Shadow Exchange Rate
(SER) is applied to correct distortion in the prevailing exchange rate due to disequilibrium in the balance of
payments and the projection structure. The SER adopted in this analysis is 1.20 of the prevailing exchange rate.
Shadow Wage Rate (SWR) is also used to reflect the true economic value of labor employed in the Project. The
SWR (60 percent of legislated wage rates) is applied to the unskilled labor component of wages paid while no
SWR is required to the skilled labor. Application of these conversion factors is consistent with NEDA guidelines.
d)-3 Value Added Tax (VAT)
VAT has to be excluded in the economic analysis. Transfer items such as VAT that are included in the Project
expenses and revenues in the financial analysis have to be removed in the economic analysis.
e) “With” Case and “Without” Case
A cost-benefit analysis is conducted on the difference between the “With” case in which an investment is made
and the “Without” case in which no investment is made. That is, the benefits and costs arising from the investment
for the Project are compared.
Some 200,000 TEU of international containers were handled at CIP, Cebu Baseport in 2010, and the existing
container handling capacity of CIP is estimated at 300,000 TEU. It is assumed in this analysis that all of the
international containers will be transferred to and handled at the New Container Port after the container handling
demand exceeds the capacity at CIP. The wharf and yard of CIP will be mostly used for domestic containers.

5 - 19
2)-3 Calculation of EIRR
The Economic Internal Rate of Return (EIRR) based on a cost-benefit analysis is used to appraise the economic
feasibility of the Project. The EIRR is the discount rate that makes the costs and benefits of a project during the
project life equal. The formula is as follows:
n
iir
CiBi
11
0)1(
where, n: Period of economic calculation (project life)
i: Year
Bi: Benefits in the i-th year
Ci: Costs in the i-th year
r: Discount rate
2)-4 Sensitivity Analysis
Sensitivity analysis is executed to determine as to whether the Project will remain feasible from the viewpoint of
national economy when some factors vary. Based on the aforementioned NEDA Guideline, the following three (3)
cases are examined in this Study as sensitivity analyses:
Case I: Increase in projected costs by 10% and 20%
Case II: Decrease in projected benefits by 10% and 20%
Case III: Combination of Cases I and II
2)-5 Net Present Value(NPV)
Costs and Benefits generated each year during the Project life are converted to the present value by applying a
Social Discount Rate (SDR). Through this process, costs and benefits decrease as time passes. The SDR is set at
15% in this analysis following the NEDA guidelines.
2)-6 Economic Analysis for New Container Port Development Project
a) “With” and “Without” Case
In the “With” case, the New Container Port is constructed at Consolacion, and commences its operations when
demands of international containers exceed the annual handling capacities of CIP (300,000 TEU). The New Port
has an annual handling capacity of 400,000 TEU at the beginning of the operations and can expand its capacity up
to 500,000 TEU as the demand increases. In addition, larger container vessels can be accommodated at the quay
where the water depth alongside is 13 meters.

5 - 20
In the “Without” case, it is assumed that no international container handling ports are constructed on Cebu Island.
Therefore, no more than 300,000 TEU international containers can be handled on Cebu Island. Value added
corresponding to the overflow of international containers would be a loss for the national economy.
b) Benefits of the Project
b)-1 Ocean Transportation Cost Reduction
Ocean transportation cost reduction is included in the Project benefits. By constructing deeper quays (-13 m) at
the New Container Port, larger and faster container vessels are likely to call whereas the existing CIP has quays
with 8.5 m alongside water depth. It is assumed in the Study that average container vessel size will increase to
2,000 TEU type from the existing 1,000 TEU type. Ocean transportation cost reduction is expected to be
generated from 300,000 TEU, which is the maximum capacity of CIP, and only 50% of the benefits are counted as
economic contribution to Philippines as the rest belongs to foreign countries.
b)-2 Value Added of Exporting Commodities
Value added of exporting commodities which will overflow from the CIP in the “Without” case is counted as one
of the Project benefits. Although both exporting and importing commodities contribute to generate value added in
the Philippines, exported ones are counted as a benefit in this EIRR analysis so that Project benefits will be
estimated conservatively.
Based on the Philippine Customs statistics, the average commodity value in an exporting container is estimated at
PhP 1.3 million/Laden Export TEU (see Table 5-2-10). The percentage of operating income of the total sales is
estimated to be in the vicinity of 7%, which is generally adopted to estimate the value added in other development
studies.
Table 5-2-10 Value Added of Exporting Commodities
Year Export Value ($'000) Export Full TEU $'000/Full TEU PhP '000/Full TEU2006 1,560,468 53,965 28.9 1,2382007 1,766,481 57,230 30.9 1,3212008 1,527,040 50,368 30.3 1,2982009 1,253,157 42,695 29.4 1,256
Av. = 1,292
(Source: Study Team)
b)-3 Time Value of Exporting Containers
Container vessels calling at the New Container Port are expected to be not only larger but also faster than present
ones. The average sailing speed for 2,000 TEU type container vessels is approximately 20.9 knots per hour while
that for 1,000 TEU type is 18.6 knots per hour. For example, sailing time can be reduced by 5.4 hours between
Hong Kong and Cebu using the faster vessel type. Benefits generated by faster deliveries to consignors can be
estimated at PhP 3,600 per 20 containers in this case. Time value is included as a Project benefit only for laden
exporting containers.

5 - 21
b)-4 Benefit generated from the Port Related Area behind the Container Yard
Value added by utilizing the port related area (6.8 ha) behind the container yard at the New Container Port is
included as an economic benefit of the Project in this analysis. It is conservatively estimated that at least the lease
fee of this plot represents economic contributions.
c) Cost of the Project
c)-1 Costs for Initial Investment
Costs for initial investment can be categorized into direct cost and indirect cost, with the former further classified
into two (2) groups: civil works and cargo handling equipment. Main components of the civil works include
channel, basin, revetment, wharf structure, pavement, and buildings in the terminal. Construction cost for access
road to the terminal is also included in the initial investment costs. These costs are initially estimated at the market
price, and then converted to the economic cost using conversion factors mentioned previously after removal of the
transfer items such as VAT.
Economic costs for initial investment are estimated at PhP 9,065 million (see Table 5-2-11), which is slightly less
than the financial costs after removing the transfer items and applying conversion factors.
c)-2 Operation Costs and Maintenance Costs for Equipment
The following items are included in the operations and maintenance costs for the New Container Port
Development Project:
Personnel costs for workers and management of Terminal Operator
Maintenance costs for cargo handling equipment
Fuel cost
Lighting and utility costs
Insurance and other costs
Operations and maintenance costs are needed both for “With” case and “Without” case until throughput reaches
300,000 TEU. Therefore, economic costs for operations and maintenance are counted for the throughput portion
of more than 300,000 TEU. Economic cost is almost equivalent to the financial cost after applying conversion
factors and removing transfer items.

5 - 22
Table 5-2-11 Financial and Economic Costs for Initial Investment
(Source: Study Team)
c)-3 Maintenance Costs for Infrastructures
This is assumed to be 1% of the costs for initial investment of depreciable infrastructure and architecture. No
maintenance costs are required for 5 years after commencement of the operations.
c)-4 Renewal Cost of Cargo Handling Equipment
Cargo handling equipment will be renewed when its useful life expires throughout the Project life. Individual
useful lives are set as are in the financial analysis. Renewal cost in the “Without” case is counted as benefits of the
Project in this economic analysis.
d) EIRR of the New Container Port Development Project
The EIRR of the New Container Port Development Project is estimated at 20.02% under the conditions mentioned
above (see Table 5-2-12).
(Unit: PhP Million)
Economic Cost
Local Foreign Total Total
Construction Works
Mobilization / Demobilization 49.1 32.7 81.8 85.4
Dredging 1.2 4.8 6.0 6.9
Container Berth 256.0 1,024.1 1,280.1 1,469.4
Revetment 241.4 480.9 722.3 803.9
Reclamation 168.3 252.5 420.8 461.0
Road and Pavement 308.2 507.5 815.7 898.5
Building Works 48.9 83.5 132.4 146.1
Utility Works 129.3 213.2 342.5 377.3
Access Road 129.8 241.1 370.9 411.3
Cargo Handling Equipment 269.1 2,421.9 2,691.0 3,175.4
General Requirement and Others 32.6 128.7 161.4 185.1
Consulting & Engineering
Detailed Design 51.6 120.5 172.1 193.1
Tendering 7.4 17.2 24.6 27.6
Construction Supervision 85.6 199.6 285.2 320.0
Maintenance Monitoring 3.0 6.9 9.8 11.0
Indirect total
Administrative & Engineering Overhead by PMO 105.4 0.0 105.4 99.0
Duties / Tariff (3% of Equipment & Materials ) by CPA 21.1 0.0 21.1 0.0
Duties / Tariff by Operator 52.7 0.0 52.7 0.0
Contingency Cost 105.4 245.9 351.2 394.0
VAT (12% of Total Cost) by CPA 843.0 0.0 843.0 0.0
VAT by Private Operator 231.8 0.0 231.8 0.0
Grand Total 3,140.8 5,981.1 9,121.9 9,065.0
Financial Cost

5 - 23
Table 5-2-12 EIRR of the New Container Port Development Project
(Source: Study Team)
e) Economic Sensitivity Analysis of New Container Port Development Project
Resulting EIRRs of Case I, II, and III in the sensitivity analysis explained previously are shown in Table 5-2-13.
Except for the worst scenario (cost increases & benefit decreases by 20% each), the New Container Port
Development Project has an EIRR value of more than 15 % in all cases.
Table 5-2-13 Economic Sensitivity Analysis of New Container Port Development Project
Cost Increase By 10% Cost Increase By 20%
18.03% 16.32%
Benefit Decreases By 10% Benefit Decreases By 20%
17.82% 15.55%
Cost Increase & Benefit Decrease By 10% Each Cost Increase & Benefit Decrease By 20% Each
15.97% 12.36%
Case I
Case II
Case III
(Source: Study Team)
f) NPV and B/C Ratio of the New Container Port Development Project
Assuming a social discount rate of 15%, B/C ratio is calculated at 1.29 for the base case, and the NPV of the
Project is estimated at PhP 1,860 million.
(Unit: '000 PhP)
2014 55,112 55,112 0 (55,112)
2015 181,989 181,989 0 (181,989)
2016 800,363 800,363 0 (800,363)
2017 2,447,627 837,222 3,284,849 0 (3,284,849)
2018 2,233,859 1,674,444 3,908,303 0 (3,908,303)
2019 14,332 179,102 0 0 193,434 665,368 148,032 215,721 97,143 179,102 2,260,500 3,565,866 3,372,432
2020 179,102 0 0 179,102 665,368 291,882 221,626 97,143 179,102 1,455,122 1,276,019
2021 179,102 0 0 179,102 665,368 430,836 227,365 97,143 179,102 1,599,814 1,420,712
2022 179,102 0 0 179,102 665,368 564,119 232,908 97,143 179,102 1,738,641 1,559,539
2023 575,633 231,584 0 0 807,217 665,368 690,892 238,226 97,143 179,102 1,870,731 1,063,514
2024 231,584 57,333 0 288,917 665,368 810,245 243,283 97,143 179,102 1,995,142 1,706,225
2025 231,584 57,333 0 288,917 665,368 921,194 248,044 97,143 179,102 2,110,852 1,821,935
2026 231,584 57,333 0 288,917 665,368 1,022,674 252,470 97,143 179,102 2,216,758 1,927,842
2027 246,005 276,262 57,333 0 579,599 665,368 1,113,536 256,519 97,143 179,102 2,311,669 1,732,069
2028 276,262 57,333 0 333,594 665,368 1,113,536 256,519 97,143 179,102 2,311,669 1,978,074
2029 276,262 57,333 0 333,594 665,368 1,113,536 256,519 97,143 179,102 2,311,669 1,978,074
2030 276,262 57,333 0 333,594 665,368 1,113,536 256,519 97,143 179,102 2,311,669 1,978,074
2031 276,262 57,333 0 333,594 665,368 1,113,536 256,519 97,143 179,102 2,311,669 1,978,074
2032 276,262 57,333 0 333,594 665,368 1,113,536 256,519 97,143 179,102 2,311,669 1,978,074
2033 276,262 57,333 0 333,594 665,368 1,113,536 256,519 97,143 179,102 2,311,669 1,978,074
2034 276,262 57,333 216,261 549,855 665,368 1,113,536 256,519 97,143 179,102 2,311,669 1,761,813
2035 276,262 57,333 0 333,594 665,368 1,113,536 256,519 97,143 179,102 2,311,669 1,978,074
2036 276,262 57,333 0 333,594 665,368 1,113,536 256,519 97,143 179,102 2,311,669 1,978,074
2037 276,262 57,333 0 333,594 665,368 1,113,536 256,519 97,143 179,102 2,311,669 1,978,074
2038 276,262 57,333 1,156,276 1,489,870 665,368 1,113,536 256,519 97,143 179,102 2,311,669 821,798
2039 276,262 57,333 0 333,594 665,368 1,113,536 256,519 97,143 179,102 2,260,500 4,572,169 4,238,574
2040 276,262 57,333 0 333,594 665,368 1,113,536 256,519 97,143 179,102 2,311,669 1,978,074
2041 276,262 57,333 0 333,594 665,368 1,113,536 256,519 97,143 179,102 2,311,669 1,978,074
2042 276,262 57,333 0 333,594 665,368 1,113,536 256,519 97,143 179,102 2,311,669 1,978,074
2043 276,262 57,333 1,248,547 1,582,142 665,368 1,113,536 256,519 97,143 179,102 2,311,669 729,527
2044 276,262 57,333 0 333,594 665,368 1,113,536 256,519 97,143 179,102 2,311,669 1,978,074
2045 276,262 57,333 0 333,594 665,368 1,113,536 256,519 97,143 179,102 2,311,669 1,978,074
2046 276,262 57,333 0 333,594 665,368 1,113,536 256,519 97,143 179,102 2,311,669 1,978,074
2047 276,262 57,333 250,863 584,457 665,368 1,113,536 256,519 97,143 179,102 2,311,669 1,727,211
2048 276,262 57,333 360,435 694,030 665,368 1,113,536 256,519 97,143 179,102 2,311,669 1,617,639
2049 276,262 57,333 216,261 549,855 665,368 1,113,536 256,519 97,143 179,102 2,311,669 1,761,813
2050 276,262 57,333 0 333,594 665,368 1,113,536 256,519 97,143 179,102 2,311,669 1,978,074
EIRR= 20.02%
Benefits - CostsCivil Works
Cargo HandlingEquipment
OperationExpenses
Maintenance ofCivil Works
Renewal ofEquipment
Total CostsOcean
Transport CostR d ti
Value Added ofExport
C dit
Year
Costs Benefits
Time Cost Savingof Export
C dit
Value Added ofLeased Land
Operation CostSaving
Renewal CostSaving
Total Benefits

5 - 24
2)-7 Economic Analysis on Cebu Baseport Redevelopment Project
a) “Without” Case
The same “Without” case as explained in the financial analysis of the Cebu Baseport Redevelopment Project is
assumed.
b) Benefits of the Project
b)-1 Saving of Land Transportation Costs
The current annual cargo handling capacity of Cebu Baseport is estimated at a total of about 12 million (MT) for
domestic containers, break-bulk and bulk cargoes besides 300,000 TEU for international containers at CIP. It is
assumed that in the “Without” case, cargo throughput will exceed the cargo handling capacity of the Baseport in
around 2018, and that overflowed cargoes will be handled at other ports on Cebu Island and transported overland
by trucks to/from consignees/consignors.
The Study Team carried out land transportation cost analysis in order to estimate land transportation cost saving
quantitatively. It is conservatively assumed in this cost analysis that land transportation distance between shippers
and the port is 20 km, and 17 MT cargoes are transported per truck/chassis. The resultant land transportation cost
is estimated at PhP2,522 per vehicle.
In the “With” case, more volume of cargoes can be handled at the Baseport than in the “Without” case because
CIP can be used for domestic cargoes after all of the international containers are transferred to the New Container
Port. The Baseport will be able to cope with cargo handling demand until around 2028. Saving of land
transportation costs is included in the benefits of the Project in this economic analysis. Land transportation costs
are estimated in economic price.
c) Cost of the Project
c)-1 Costs for Initial Investment
Costs for initial investment are composed of direct cost and indirect cost, with the former including costs for
widening jetties, costs for pontoons, and costs for passenger terminal, and the latter including costs for consulting
services and taxes. These construction costs are initially estimated at the market price, and then converted to the
economic price using conversion factors after removal of the transfer items such as VAT. In this particular case,
economic costs are larger than the financial costs by 0.3%.
c)-2 Management Cost
The difference for management cost for non-international container cargo between the “With” case and ”Without”
case is included in the Project costs.
c)-3 Maintenance Costs for Infrastructures
This is assumed to be 1% of the costs for initial investment of depreciable infrastructure and architecture. No

5 - 25
maintenance costs are required for 5 years after commencement of the operations.
d) EIRR of the Cebu Baseport Redevelopment Project
The EIRR of the Cebu Baseport Redevelopment Project is estimated at 20.97% under the conditions mentioned
above (see Table 5-2-14).
Table 5-2-14 EIRR of the Cebu Baseport Redevelopment Project
(Source: Study Team)
(Unit: '000 PhP)
2015 0 0
2016 0 0 0
2017 0 0 0
2018 25,065 25,065 0 (25,065)
2019 36,325 2,764 1,735 40,823 23,623 23,623 (17,200)
2020 692,056 2,764 3,509 698,328 47,949 47,949 (650,379)
2021 1,790 2,764 5,324 9,878 72,494 72,494 62,617
2022 2,764 7,181 9,944 97,746 97,746 87,802
2023 2,764 9,080 11,843 123,728 123,728 111,884
2024 2,764 11,023 13,786 150,463 150,463 136,677
2025 2,764 13,010 15,774 177,978 177,978 162,204
2026 2,764 15,043 7,172 24,979 206,299 206,299 181,320
2027 2,764 17,123 7,172 27,059 235,453 235,453 208,394
2028 2,764 19,250 7,172 29,186 265,468 265,468 236,282
2029 2,764 19,250 7,172 29,186 265,468 265,468 236,282
2030 2,764 19,250 7,172 29,186 265,468 265,468 236,282
2031 2,764 19,250 7,172 29,186 265,468 265,468 236,282
2032 2,764 19,250 7,172 29,186 265,468 265,468 236,282
2033 2,764 19,250 7,172 29,186 265,468 265,468 236,282
2034 2,764 19,250 7,172 29,186 265,468 265,468 236,282
2035 2,764 19,250 7,172 29,186 265,468 265,468 236,282
2036 2,764 19,250 7,172 29,186 265,468 265,468 236,282
2037 2,764 19,250 7,172 29,186 265,468 265,468 236,282
2038 2,764 19,250 7,172 29,186 265,468 265,468 236,282
2039 2,764 19,250 7,172 29,186 265,468 265,468 236,282
2040 2,764 19,250 7,172 29,186 265,468 265,468 236,282
2041 2,764 19,250 7,172 29,186 265,468 265,468 236,282
2042 2,764 19,250 7,172 29,186 265,468 265,468 236,282
2043 2,764 19,250 7,172 29,186 265,468 265,468 236,282
2044 2,764 19,250 7,172 29,186 265,468 265,468 236,282
2045 2,764 19,250 7,172 29,186 265,468 265,468 236,282
2046 2,764 19,250 7,172 29,186 265,468 265,468 236,282
2047 2,764 19,250 7,172 29,186 265,468 265,468 236,282
2048 2,764 19,250 7,172 29,186 265,468 265,468 236,282
2049 2,764 19,250 7,172 29,186 265,468 265,468 236,282
2050 2,764 19,250 7,172 29,186 265,468 265,468 236,282
EIRR= 20.97%
Civil WorksForeign
Cargo MgntE
DomesticCargo Mgnt
E
Maintenanceof CivilW k
Year
Cost Benefit
Benefit - CostTotal Cost
Saving ofLand Trans.
C t
TotalBenefit

5 - 26
e) Economic Sensitivity Analysis of the Cebu Baseport Redevelopment Project
The resulting EIRRs of Case I, II, and III in the sensitivity analysis are shown in Table 5-2-15. Except for the
worst scenario (cost increases & benefit decreases by 20% each), the Cebu Baseport Redevelopment Project has
an EIRR value of more than 15% in all cases.
Table 5-2-15 Economic Sensitivity Analysis of the Cebu Baseport Redevelopment Project
(Source: Study Team)
f) NPV and B/C Ratio of the Cebu Baseport Redevelopment Project
Assuming a social discount rate of 15%, the B/C ratio is calculated at 1.41 for the base case, and the NPV of the
Project is estimated at PhP 186 million.
2)-7 Economic Evaluation
The leading view on economic evaluation is that the Project is feasible if the EIRR exceeds the opportunity cost of
capital. In the Philippines, it is generally considered that a project with an EIRR of more than 15% is
economically justifiable for infrastructure or social service projects. For the New Container Port Development
Project and Cebu Baseport Redevelopment Project, both cases have an EIRR of more than 20% (base case), which
is much higher than the opportunity cost of capital in the Philippines. Even after the sensitivity analysis, the
EIRRs of many cases are higher than the target. This means that the planned Projects are economically feasible.
Case ICost Increase By 10% Cost Increase By 20%
19.18% 17.65%
16.96%
Cost Increase & Revenue Decrease By 20%
14.09%
Benefits Decrease By 20%
19.00%Case II
Benefits Decrease By 10%
Case IIICost Increase & Revenue Decrease By 10%
17.34%

Chapter 6
Planned Project Schedule


6 - 1
(1) New Cebu Container Terminal
1) Assumptions of the Implementation Schedule
- CPA (public sector) will provide the basic facilities including dredging the channels/basin, land reclamation,
container berth, revetment, road and yard pavement, drainage system, water and power supply, buildings,
access from the road bridge to the container terminal and other miscellaneous facilities that are commonly
used by various private business entities in the port and terminals.
- The private investor will provide all the necessary facilities and equipment for container terminals including
quayside gantry cranes, container yard cranes (RTG), those on land facilities of buildings, utility supply
facilities, tractors and chasses and others required for business activities.
- The terminal facilities should be made operational from 2019.
- The implementation schedule was developed on the assumption that CPA will use a soft loan to finance the
construction of the CPA portion in the new Cebu Container Terminal Development Project.
- CPA shall conduct an EIA study and obtain approval from the regional office of DENR in order to apply for a
project loan to finance the components responsible by CPA.
- The implementing sequence is prepared considering the time required for the governmental procedures
required by various agencies and departments.
- In order to be financed by a soft loan, CPA should employ a consultant who can prepare detailed engineering
documents, PQ documents and evaluation criteria thereof, tender documents for selection of the contractor of
civil works and concessionaire for the terminal operation, and assist CPA during the tender process. The
consultant shall monitor environmental issues during the construction stage.
2) Implementation Schedule
The implementation schedule of New Cebu Port studied in Section 3 is shown Table 6-1-1.
After the authorization and approval of the new Cebu Container Port by NEDA and the cabinet in the government
of the Philippines, it will be followed by applying for a soft loan, employing a consultant, conducting the detailed
design, preparation of PQ and tender documents, selecting the contractor of the civil works and implementing
construction of the works. It is estimated the period of implementation of the detailed design and preparation of
tender documents, construction of civil works and fabrication/installation of container handling equipment will be
one year, two and half years and one year respectively.

6 - 2
Table 6-1-1 Implementation Schedule of New Cebu Port (PPP Scheme)
Month
Container Terminal Development 1 Implementing Public Portion by CPA
(1) Study on New Cebu Container Port by METI 6
(2) Submission and Review of New Cebu Container Port to NEDA by DOTC 3
(3) Preparation of EIA and Obtain ECC by CPA 3
(4) Financial Arrangement and Requests for Project Loan by CPA/DOTC 12
(5) Procurement of Consultants for the engineering study 3
(6) DD - PQ + T/D Preparation by Consultant 12
(7) PQ for procurement of contractor by CPA 3
(8) Tendering for procurement of contractor by CPA 6
(9) Contract negotiation and signing the contract with CPA 3
(10) Construction works 30
1) Dredging works 4
2) Container berth construction 18
3) Revetment construction 12
4) Reclamation works 12
5) Road and pavement construction 15
6) Building works construction 10
7) Utility works construction 12
8) Access road construction 18
2 Procurement of Private Investor (Concessioner)(1) Project Resolution by Government DOTC/CPA
1) Preparation and Submission of PPP Scheme by CPA 3
2) Evaluation and approval by CPA Board 3
(2) Transaction (Procurement ) of Private Investor
1) Document Preparation of PQ and Tender Documents 6
2) PQ process for short list investors for tendering 4
3) Procurement by Tendering 8
4) Contract negotiation and Signing the contract with CPA/DOTC 5
(3) Installation of the Equipment and Auxiliary Facility
1) Engineering study of facilities 3
2) Fabrication and Installation of the Equipment 12
3) Supply and preparatory work of Auxiliary Facility 6
3 Commencement of Operation of Container Terminal
Description of Works 2011 2012 2013 2014 2015 2016 2017 2018
(Source: Study Team)
3) Reducing the Time for Application/Formalities before Commencement of Construction
This Study has been made based on the assumption that the investment of the public portion will be covered by
Japanese ODA loans. The Japanese government is currently reviewing the implementation process of this loan
scheme in compliance with the request from the recipient countries for quick agreement and in strategic
consideration for the higher usability of Japanese ODA. The Japanese government announced the policy in June
2008 with respect to “Expediting of the process for Japanese ODA loans” stating that the government is aiming to
reduce the period for consultant works and preparation/procurement and complete these items within 2 years.
After the announcement, this policy has been reviewed every year and updated with subsequent amendments for
improvement. The substance of the policy is summarized as follows:
For the recipient countries who have submitted many applications and have been given ODA loans every year:
The appraisal process has been undertaken once a year in the Philippines but the applications are to be accepted
whenever necessary and processed with priority separately from other projects. The period from the completion of
this Study in February 2012 and the commencement of the detailed design in 2014 is two years; therefore, the
rational procedure should be taken, including shortening of the mission by the government and JICA or accepting
the selection of the consultant prior to exchange of notice and signing of the LA.

6 - 3
(2) Cebu Baseport
1) Assumption of the Implementation Schedule
- CPA (public sector) will provide the basic facilities including expansion of the berth, a floating berth, a new
passenger terminal and a container yard that are commonly used by various private business entities in the port
and terminals.
- A private investor will provide all the necessary facilities in order to implement planning, design, construction
and operation and maintenance of the business/commercial center using their own equity or loan from the city
bank.
- The business/commercial center should be made operational from 2020.
- CPA will finance the cost through a long-term loan from Treasury Bank
- CPA shall conduct an EIA study and obtain approval from the regional office of DENR.
- The implementing sequence is prepared by considering the time required for governmental procedures
required by various agencies and departments.
- CPA should employ a consultant in order to conduct detailed engineering, PQ documents and evaluation
criteria thereof, tender documents for selection of contractor of the civil work and investor, and assist CPA for
the tender process. The consultant shall monitor environmental issues during the construction stage.
2) Implementation schedule
The implementation schedule studied in Section 3 of Redevelopment Plan of Cebu Baseport is shown in Table
6-2-1.
After the authorization and approval of the new Cebu Container Port by NEDA and the cabinet in the government
of the Philippines, it will be followed by applying for a soft loan, employing a consultant, conducting the detailed
design, preparing PQ and tender documents, selecting a contractor for the civil works and implementing
construction of the works. It is estimated the period of implementation of the detailed design and preparation of
tender documents, construction of marine works and construction of a business/commercial center are eight
months, fifteen months and two years respectively.

6 - 4
Table 6-2-1 Implementation Schedule of Cebu Baseport (PPP Scheme)
Month
Redevelopment of Baseport1 Implementing Public Portion by CPA
(1) Study on New Cebu Container Port by METI 6
(2) Submission and Review of New Cebu Container Port to NEDA by DOTC 3
(3) Preparation of EIA and Obtain ECC by CPA 3
(4) Financial Arrangement and Requests for Project Loan by CPA/DOTC 12
(5) Procurement of Consultants for the engineering study 3
(6) DD - PQ + T/D Preparation by Consultant 6
(7) PQ for procurement of contractor by CPA 3
(8) Tendering for procurement of contractor by CPA 4
(9) Contract negotiation and signing the contract with CPA 3
(10) Construction works 15
1) Demolision of Bldgs 4
2) Widening of wharf (w=10m) 10
3) Fabrication and instllation of pontoon (45mx15m) 12
4) Yard Construction 4
5) Teminal bldg (3 stories) 10
2 Procurement of Private Investor (Concessioner)(1) Project Resolution by Government DOTC/CPA
1) Preparation and Submission of PPP Scheme by CPA 3
2) Evaluation and approval by CPA Board 3
(2) Transaction (Procurement ) of Private Investor
1) Document Preparation of PQ and Tender Documents 3
2) PQ process for short list investors for tendering 3
3) Procurement by Tendering 4
4) Contract negotiation and Signing the contract with CPA/DOTC 3
(3) Construction of Business and Commercial Center 24
3 Commencement of Operation of Redevelopment Plan of Baseport
Description of Works 2011 2012 20132014 to
20172018 2019 2020 2021
(Source: Study Team)

Chapter 7
Implementing Organization

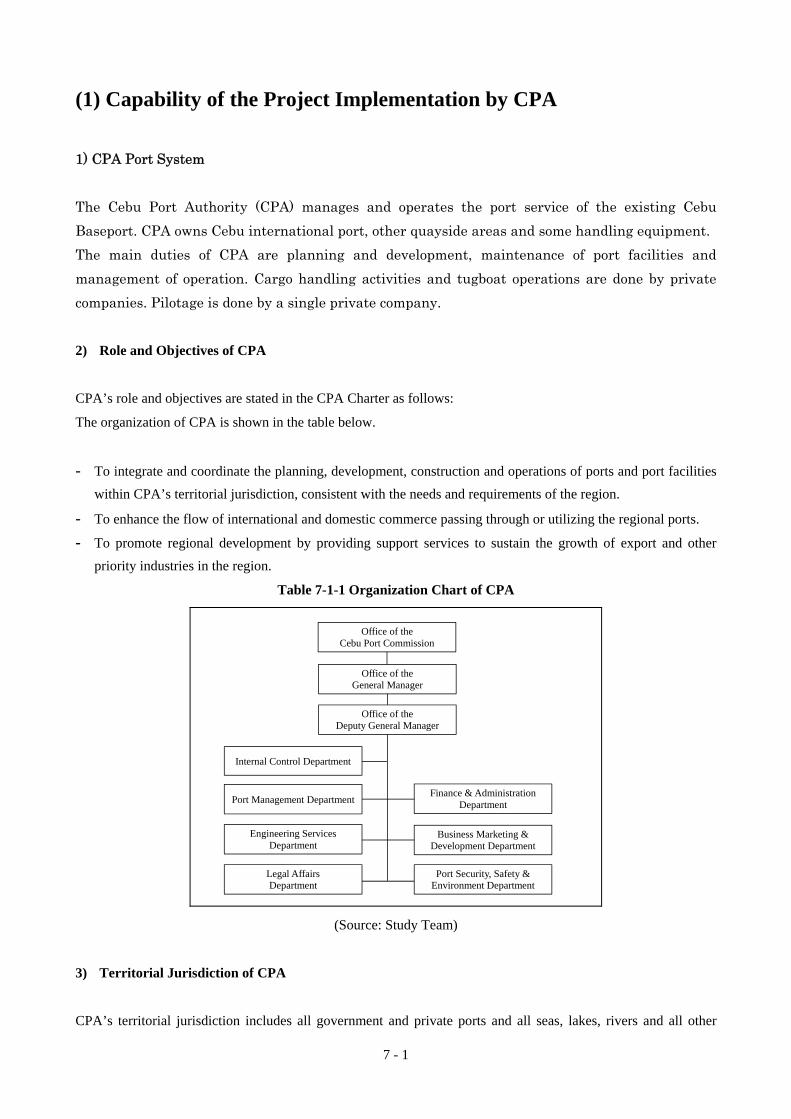
7 - 1
(1) Capability of the Project Implementation by CPA
1) CPA Port System
The Cebu Port Authority (CPA) manages and operates the port service of the existing Cebu
Baseport. CPA owns Cebu international port, other quayside areas and some handling equipment.
The main duties of CPA are planning and development, maintenance of port facilities and
management of operation. Cargo handling activities and tugboat operations are done by private
companies. Pilotage is done by a single private company.
2) Role and Objectives of CPA
CPA’s role and objectives are stated in the CPA Charter as follows:
The organization of CPA is shown in the table below.
- To integrate and coordinate the planning, development, construction and operations of ports and port facilities
within CPA’s territorial jurisdiction, consistent with the needs and requirements of the region.
- To enhance the flow of international and domestic commerce passing through or utilizing the regional ports.
- To promote regional development by providing support services to sustain the growth of export and other
priority industries in the region.
Table 7-1-1 Organization Chart of CPA
Office of the General Manager
Office of the Deputy General Manager
Finance & Administration Department
Business Marketing & Development Department
Port Security, Safety & Environment Department
Engineering Services Department
Legal Affairs Department
Internal Control Department
Port Management Department
Office of the Cebu Port Commission
(Source: Study Team)
3) Territorial Jurisdiction of CPA
CPA’s territorial jurisdiction includes all government and private ports and all seas, lakes, rivers and all other

7 - 2
navigable inland waterways within the Province of Cebu, including the City of Cebu and all other cities, which
may be created after R.A.7621 was signed in 1992.
4) Power and Responsibility of CPA
The Authority shall have the power and responsibility to:
- Have perpetual succession under its corporate name otherwise provided by law;
- Prescribe its bylaws and such rules and regulations as maybe found necessary to promote or enhance the
business of the authority;
- Adopt and use a seal;
- Sue and be sued in any court;
- Enter into contracts, transactions, and undertakings of whatever nature, which are necessary or incidental to
its functions and objectives, with any natural or juridical person or with any government institutions, domestic
or foreign;
- Acquire, own, hire, use, operate and dispose of personal property and to acquire, own, use, lease, operate and
dispose of real property and interests thereon and to make improvements on such real property, including the
reclamation, for port purposes, of foreshore and submerged lands within its territorial jurisdiction; which
reclaimed land shall ipso facto be deemed transferred in ownership to the Authority; and to enter into
contracts with any public or private entity for such reclamation under such terms and conditions as it may be
deemed to be for the public interest;
- Purchase, hold alienate, mortgage, pledge or otherwise dispose of the shares of the capital stock of, or any
bond, security or other evidences of indebtedness created by any other corporation or co-partnership of this or
any other country, and while the owner of said stock, to exercise all the rights of ownership, including the
right to vote thereon;
- Exercise the right of eminent domain;
- Exercise all the powers not contrary to law which may be necessary or incidental to the effectuation of its
authorized purposes or to the exercise of any of the foregoing powers, except the power to levy taxes or
assessments and, in general, to exercise in connection with property within its control all powers which may
be exercised by a natural or juridical person over its property and affairs;
- Levy dues and impose rates and charges for the use of the premises, works, appliances, facilities, or for
services provided by or belonging to the Authority, or any other organization concerned with port operations;
- Make expenditures in foreign countries to pay commissions and hire or contract experts and consultants, both
foreign and local;
- Make expenditures for promotion of the business affairs of the Authority; and
- Exercise all the powers of a corporation under the Corporation Law insofar as they are not inconsistent with
the provisions of this Act.

7 - 3
5) Organization of CPA
The powers and functions of the CPA are vested in and exercised by a Cebu Port Commission of 7 members,
which is CPA’s governing and policy-making body. The Chairman of the Commission is the Secretary of the
Department of Transportation & Communications, or his designated Undersecretary.
The Vice-Chairman is elected from the remaining Commissioners and is then designated as the Cebu Port General
Manager. Except for the Chairman, the Commissioners are all appointed by the President of the Philippines to a
fixed 3-year term and represent the following sectors: ship owners and shipping operators, cargo handling labor
and business.
The daily business and operational management of CPA is directed and controlled by the General Manager.
CPA has its head office and four terminal offices, Toledo, Danao, Argao, and Santa Fe.
6) Financial Performance
6)-1 Revenue
Revenue of the CPA mainly comes from port tariffs and shares of arrastre/stevedoring. Shares of
arrastre/stevedoring come from cargo handling charges of the private cargo handling company. Private company
pays a percentage of handling charges to CPA instead of getting a franchise to handle cargoes in the port.
CPA receives a 20% share of handling charges in government ports, a 10% share in non-registered private ports
and a 3% share in registered private ports. Revenue from port tariffs comes from not only government ports but
also private ports. But, as an incentive for registration, CPA reduced the port tariff for registered private ports by
50%.
It is shown in the balance sheet of CPA in 2008-2009 that wharfage dues and shares of arrastre/stevedoring
represented 62.5% and 63.5% of all revenue in 2008 and 2009 respectively. This figure has not changed
significantly over the last 10 years.
6)-2 Expenditure
Expenditure in 2008-2009 of CPA is well balanced. Personnel cost is relatively low at about 23.8% of total
operation expenses. CPA pays a BTR dividend to the national government every year, which was 51.9% of net
income after income tax in 2008.
6)-3 Evaluation for Financial Soundness
The financial soundness is appraised based on financial statements (Income Statement, Cash Flow Statement and
Balance sheet). The appraisal is made from the viewpoints of profitability, loan repayment capacity and
operational efficiency, using the following ratios:
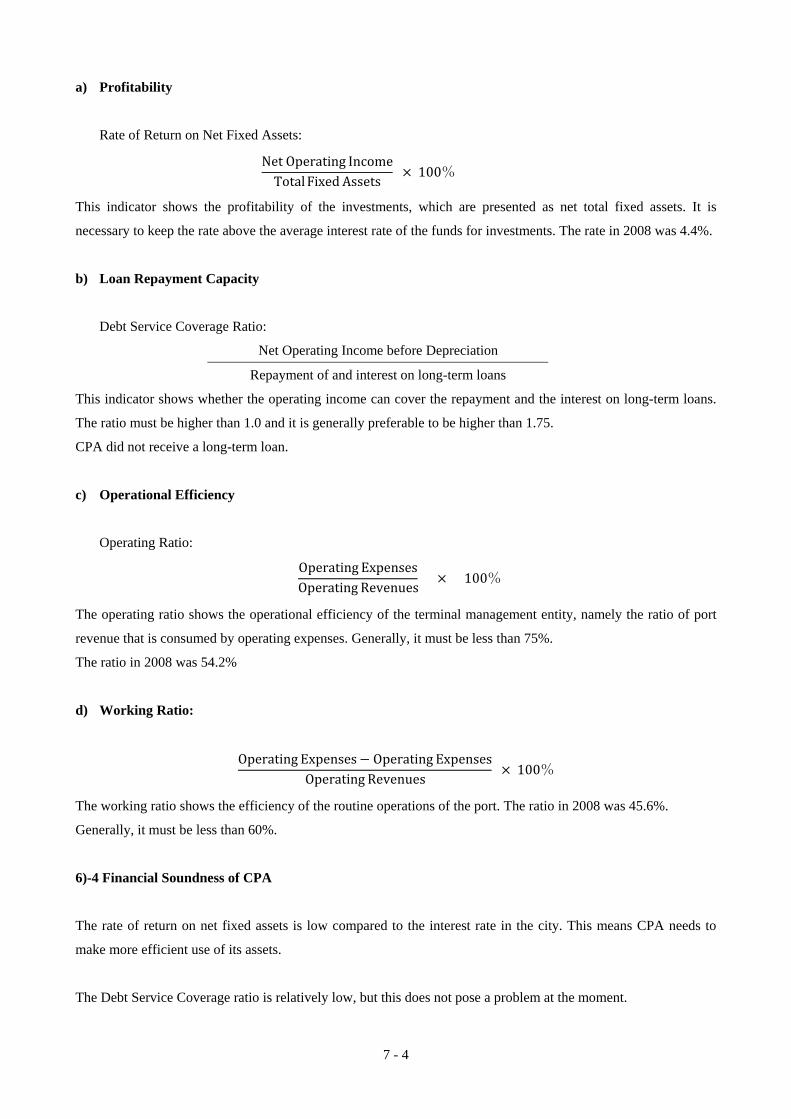
7 - 4
a) Profitability
Rate of Return on Net Fixed Assets:
NetOperating IncomeTotalFixed Assets
100%
This indicator shows the profitability of the investments, which are presented as net total fixed assets. It is
necessary to keep the rate above the average interest rate of the funds for investments. The rate in 2008 was 4.4%.
b) Loan Repayment Capacity
Debt Service Coverage Ratio:
Net Operating Income before Depreciation
Repayment of and interest on long-term loans
This indicator shows whether the operating income can cover the repayment and the interest on long-term loans.
The ratio must be higher than 1.0 and it is generally preferable to be higher than 1.75.
CPA did not receive a long-term loan.
c) Operational Efficiency
Operating Ratio:
Operating ExpensesOperating Revenues
100%
The operating ratio shows the operational efficiency of the terminal management entity, namely the ratio of port
revenue that is consumed by operating expenses. Generally, it must be less than 75%.
The ratio in 2008 was 54.2%
d) Working Ratio:
OperatingExpenses Operating ExpensesOperating Revenues
100%
The working ratio shows the efficiency of the routine operations of the port. The ratio in 2008 was 45.6%.
Generally, it must be less than 60%.
6)-4 Financial Soundness of CPA
The rate of return on net fixed assets is low compared to the interest rate in the city. This means CPA needs to
make more efficient use of its assets.
The Debt Service Coverage ratio is relatively low, but this does not pose a problem at the moment.

7 - 5
6)-5 Financial Capacity for the Project
Using the annual report of CPA 2008-2009, financial statements of CPA, and the approaches on financial capacity
evaluation outlined in Section 9, the Cebu Port Authority was found to have no capacity to self-finance the
container terminal investment using corporate funds. A significant portion of CPA’s funds is invested as market
securities, with available cash and cash equivalents.
6)-6 Capability of Project Implementation of CPA
The Executing Agency (EA) responsible for implementation of the proposed Project is the Cebu Port
Authority (CPA) under the Ministry of Transportation. The organization of CPA is shown in Table
7-1-1.
CPA has the capability to implement the proposed Project by the following organizational setup:
The Engineering Department of EA will be responsible for implementing the proposed Projects. The
EA will organize a committee called, “The Project Management unit (PMU)” for implementation of
the Project. The members of the PMU will consist of representative officials from the departments
concerned (Engineering Department, Business Department, Finance Department, etc.).
Generally, the PMU concerned will be directly involved in the Project management activities. CPA
will appoint a Project management officer to implement smooth and effective supervisory services.
The members of the committee are selected representatives from all the concerned departments of CPA to
evaluate technical aspects, feasibility of the Project, arrangement for finance of the Project, period of Project,
process of tendering for the selection of concessionaire and their performance, management and supervisory
responsible works of respective private and CPA portions, and equipment supply by a concessionaire.
The PMU will prepare contract documents with the concessionaire and check the contents of the
agreement, certify them for approval by the Board of CPA, and submit these documents to the
Ministry of Transport for final approval.
However, CPA has no experience in implementing a PPP scheme project by selection of a
concessionaire. They may need financial and legal experts for preparation of bid documents for
procurement of a concessionaire, evaluation of PQ, and the tender process for selection of a
concessionaire.
The ownership of the port facility and land estate to be developed by the PPP Scheme project should
remain with the CPA. The development of additional facilities and terminal operation of container,
should be opened to the selected concessionaire of the Philippines and/or JV with foreign private
investors.

7 - 6
The government intends to minimize the financial burden of the government body and to provide
effective cost performance of port management to the users.
At present, some other donors and international agencies have expressed interest in extending
assistance to the proposed Project.

Chapter 8
Technical Advantages of Japanese Companies


8 - 1
(1) Possible Japanese Firms’ Participation in the Proposed Project
1) Possibility of PPP in the Proposed Project
Considering the Project components, PPP will comprise PPP for (a) New Container Terminal and (b)
Redevelopment of the Baseport.
1)-1 PPP for the New Container Terminal
There are several instruments of private participation in container terminal investment. Major instruments
currently being considered are: (a) BOT (build-operate-transfer), BOO (build-own-operate), BTO
(build-transfer-operate), (b) Licenses or concession, and (c) Leasehold contract.
a) Philippines BOT Law (RA-6957) and Amendment (RA-7718)
PPP in Philippines started in 1990 when BOT Law (RA 6957) was established. In RA-6957 BOT and BT (Build
and Transfer) were considered. In 1994, an amendment was made by RA-7718 and other modes of PPP such as
BOO, BTO, BLT (Build-lease-transfer), ROT (Rehabilitate-operate-transfer), ROO (Rehabilitate-own-operate),
and others were included.
To date there is no concession law in the Philippines, but the concession of container terminals in Philippines
ports has already been made based on current laws. The government is also preparing another amendment of the
BOT law to include concession.
BOT/BOO & BTO are relatively new approaches to infrastructure development, which enable direct private
sector investment in large-scale infrastructure projects like container terminal construction and operation projects.
It is an understanding wherein a private company (or consortium) agrees with a government to invest in a public
infrastructure project. The company then secures their own financing to construct the project. The private
developer then owns, maintains, and manages the facility for an agreed concession period and recoups their
investment through charges. After the concessionary period, the company transfers ownership and operation of the
facility to the government or relevant state authority with whom the agreement was executed.
The common feature of most of these agreements is project financing; the lender’s source of repayment is cash
flow generated by the project, and there is limited or no recourse against the government. The advantages are that
BOO/BOT projects are conducted in a fully competitive bidding situation. The public will get the lowest cost of
project. The public will get the risk of the project shared by the private sector. The public will get the benefit of
the private sector’s ability to mobilize finances, and to use the best management skills in the construction of
projects and the operation of the project. The public will get access to the latest technology, and typically the
project is constructed much faster than it would be in the public utilities, manner of operation and in all these facets.

8 - 2
1)-2 Current Condition of Container Terminal Operation at Cebu Port
At Cebu Port, operation of Cebu International Port (CIP, which comprises International Container Terminal and
Domestic Container Terminal) was contracted out to private companies, Oriental Port and Allied Services
Corporation (OPASCOR) and Cebu Integrated Association (CIA). They are called, “Contract for Cargo Handling
Services,” but it is practically a lease contract of the terminal. They are not paying a lease fee, but pay 20% of the
total income of the respective operating company. CPA provides basic terminal infrastructure, and operating
companies provide cargo handling equipment and workers.
OPASCOR and PPA (before CPA was created) signed a contract for 10 years on January 9, 1991, allowing
OPASCOR to manage and operate arrastre and stevedoring services at International Container Terminal of CIP.
There was a dispute on the expiration of the original contract in 2001, and the first extension of the contract was
given on February 14, 2003 for another 10 years (until February 13, 2013). The first amendment was made on
February 26, 2008 to extend the contract for another 10 years (until February 13, 2023) in order to enable a new
business of OPASCOR to invest facilities for and operate handling bulk cargo.
OPASCOR currently owns 3 Quay-side Gantry Cranes (QC) and 11 Rubber Tired Gantry Cranes (RTGs) They
have ordered new 1 QC and 2 RTGs that are expected to be delivered to the port next year.
1)-3 Proposed PPP Scheme for the Project
When construction of the proposed Project is completed, all international containers will be transferred to the new
port and the current CIP will be only for domestic cargo. It is not clear what type of arrangements will be provided
for OPASCOR as the current operator and a selection of a new operator at the new port. OPASCOR supports the
proposed Project, and it is believed that the selection of a new operator will be done in an amicable and
transparent matter.
Regarding the mode of PPP for the new international container terminal, a leasing or concession agreement, where
the public (CPA) provides the basic infrastructure (wharf, access roads, etc.) and the private sector (Operator)
provides equipment for handling cargo (QCs, RTGs, tractors, trailers, etc.) will be the most realistic and proper
mode of PPP. BOT (or BTO, BOO) scheme which includes investment for wharfs and equipment will require
huge investment and the risk will be too high to attract private investors.
2) PPP for Redevelopment of the Base Port
Given that the Baseport is located at the center of Cebu City, the private sector will be very interested in investing
in the port area for commercial purposes, if there is available port land. If CPA makes an international container
terminal area in CIP, which will be transferred to the New Port, there will be space available for the private sector
to develop and private participation will be very likely.

8 - 3
As described in Port Planning, the Study Team proposes to use about 84,600 m² of CIP behind the domestic
container terminal. Considering the existing and future plans of the port, it might be preferable to lease this land
long-term rather than selling it. However, taking into account market trends, CPA should carefully consider
several options for use, including selling the land.
The lease fee is estimated based on the current market rate, i.e. lease of APL near CIP where APL is used for
empty container stockyard, at PhP 1,429/m²/year. In this Study, the same rate is used for the CIP land as a safe
estimate. If CPA leases the land to the private sector, CPA will generate less income at PhP 120,857,143/year.
3) Possible Japanese Firms’ Participation
3)-1 Participation in the New International Container Terminal
There will be possibilities for Japanese firms for participating in the New International Container terminal in the
area of: (a) providing funds for construction of the New Port, (b) construction of the New Port as a constructor, (c)
private terminal operator (either a single company or a joint venture partner) to provide funds, supply handling
equipment for containers, and operate the terminal.
(1) For financing the construction of the New Terminal from Japan, it is most likely that GOP requests GOJ for
financing through JICA. Among the JICA loans, STEP Loan should be the most preferable source of fund,
since it has the lowest interest and long repayment period with long grace period, albeit it is a tied loan.
However, the financial and economic evaluation indicates that this proposed project will be feasible by using
the JICA Loan with General and Standard Terms. Therefore, no STEP Loan is considered for evaluation in
this study, but JICA Loan with general and Standard Terms is. Private financing for construction is not
considered to be competitive when a bilateral JICA Loan is applicable.
(2) Japanese contractors have much experience in the construction of container terminals in Subic, Batangas and
Cagayan de oro in the Philippines. There is a high possibility of participation in the construction of the new
Cebu container terminal because of the international bidding. The type of container berth is steel pipe sheet
pile with tie rods anchor piles; therefore, there is a high possibility of participation in the procurement of
Japanese big-size steel sheet piles that are made using the advanced technology of Japanese makers and tie
wires that are made of anticorrosive Japanese material and are optimal for seawater.
(3) Japanese may participate in container terminal operation. Recently, Japanese firms have entered into a venture
agreement with Vietnamese Vinaline for operation of Lach Huyen International Port under a PPP scheme.
This project is considered to be the first PPP Port Project under the JICA Loan. A similar scheme can be
expected for the New Port of Cebu Container Terminal. Private terminal operator will provide financing for
operation and it is expected that Japanese equipments for handling containers will be provided.

8 - 4
3)-2 Participation in the Redevelopment of the Base Port
Redevelopment of the Baseport, which will require a further detailed study, may include:
(1) Expansion of the Domestic Container Terminal by the transfer of the International Container Terminal to the
New Port,
(2) Rearrangement of Domestic RORO terminals,
(3) Rearrangement of Passenger terminals, and
(4) Construction of proper terminal facilities for Domestic RORO and Passengers.
Among the above, possible opportunities where Japanese firms may participate will be: (1) consulting services to
prepare a Redevelopment Plan of the Base Port, and (2) construction and management of the
Commercial/Amenity Center Development though financing, construction, management and operation. Expansion
of domestic container terminal and construction of domestic RORO terminal will be provided by CPA through
public financing, and there will be little chance for Japanese firms to participate.

8 - 5
(2) Advantages for Japanese Private Firms on the Project
1) Advantages of Japanese Private Firms in Participation in New International Container Terminal
(1) Japanese contractors are able to fully utilize their know-how in availability of local construction firms and
construction methodology/technology accumulated in Subic, Batangas and Cagayan de oro in the Philippines.
Given that Japanese construction firms have also acquired knowledge in international competitive biddings
through JICA loans, there is a high possibility of participation in the construction of the new Cebu container
terminal because of the international bidding.
(2) Regarding the participation in the terminal operation, Japanese operators are not considered to be Global Mega
Operators, because not many operators are globally in charge. However, all Japanese operating oversea
terminals are efficiently and satisfactorily managed. Similar to an example of Lach Huyen International Port,
Japanese operating firms may participate under a similar PPP scheme of JICA. For supplying equipment for
container handling, high reputation in quality and durability are strong areas of Japanese manufacturers as well
as the existing experience in supplying gantry cranes in Cebu Port.
2) Advantages of Japanese Firms in Participation in the Redevelopment of the Baseport
(1) Japanese consulting firms have extensive experience in redevelopment of Japanese ports, such as MM21 in
Yokohama Port, Takeshiba-Shibaura in Tokyo Port, Center Pier in Kobe Port, Tempozan in Osaka Port, and
the Cruise Terminal in Nagasaki Port. They are the advantages of Japanese Consulting Firms to participate in
the Study for Redevelopment of the Baseport. Redevelopment in large size can be seen in US and Europe, but
small size redevelopments in a congested city area are not common. Therefore Japanese experiences and
know-how will be useful and great advantage in participating the consulting services.
(2) Participation in Commercial/Amenity Center Development Project is attractive for private sector, since the
Baseport is located at the center of the city where land area is very important and commercial activities are
dense. Some private investors, including Japanese firms, have shown interest in investing to create a
commercial center at CIP that may be fully converted to a commercial/tourist area after 2030. Japanese port
redevelopment projects have included similar commercial/amenity development, and private firms can fully
utilize their know-how in participating this proposed redevelopment project.

8 - 6
(3) Necessary Measures to Promote Participation of Japanese Firms
1) Financing
It is important to provide favorable funding for Philippines through ODA and to promote participation of Japanese
firms. One possibility of financial assistance from our country is an ODA loan from Japan International
Cooperation Agency (JICA). According to the conditions of current ODA loans, the Philippines is categorized as
a low-income country (GNI per capita between US $996 and 1,905) and under the standard and general conditions,
the interest rate is 1.4% with a 30-year repayment period (including a grace period of 10 years). Procurement
conditions are untied. However, a STEP loan, which is a tied loan, has more favorable conditions. Conditions of
the STEP loan are 0.2% interest rate with 40-year repayment period (including a 10 year grace period). Since a
STEP loan is a tied loan, the possibility of participation by Japanese firms will increase.
Financial support to the private sector is also possible to take advantage of export finance or investment financing
of JBIC. Conditions of JBIC loans, which require a separate review for each case, are expected to be favorable so
as to encourage private participation of Japanese firms.
2) Support for the Feasibility Study
This Study is considered to be a pre-feasibility study (Pre-FS) and it is necessary that a Feasibility Study (FS) is
conducted as soon as possible. Given that there are many experienced Japanese consulting firms, including
Oriental Consultants, in preparing FS related to port development, it is important to proceed from Pre-FS to FS
with the participation of Japanese experienced consulting firms as smoothly as possible. In some cases, detailed
design study (DD) may include a review and update of Pre-FS, and the time to the implementation will be
shortened. It is expected that the Japanese ODA process will be flexible and quick.

Chapter 9
Financial Outlook


9 - 1
(1) Analysis of Financing Plan
1) Financing Plan for the Project Components
The proposed Project will comprise the following four components:
(1) Construction of the New International Container Terminal
(2) Provision of equipment for container terminal operation
(3) Redevelopment of the Baseport for Passenger Terminal and RORO Terminal
(4) Redevelopment (commercial development) of CIP area by the private sector under a lease contract for the
available space.
Considering PPP at a maximum extent, bilateral ODA funds may be used for the construction of the new
international container terminal under CPA implementation.
For the provision of equipment for container operation by private operators, commercial banks, development
banks or other sources of funds can be used.
For redevelopment of Baseport terminals, it is appropriate that domestic funds be used, such as CPA’s own funds,
other public sources or commercial sources.
For commercial development, purely private investment is expected to participate.

9 - 2
(2) Possibility and Availability of Funds
1) Possible Fund for New Container Terminal
CPA may apply for a bilateral ODA fund, including a JICA Loan, through the Government of the Philippines for
construction of the New International Container Terminal. If a JICA Loan is provided, the current standard terms
and conditions for the Philippines are:
Amount: 85% of CPA cost
Interest Rate: 1.4% except for consulting services for which the interest rate is 0.01%
Loan Period: 30 years including a 10-year grace period
Repayment: Fixed amount repayment of principal.
CPA will provide a counterpart fund that is 15% of the total cost (by internal reserve, from Government grants,
loans from commercial banks, etc.)
2) Possible Funds for Container Terminal Operator
Initial and renewal investments by the Terminal Operator for equipment are assumed to be financed by
commercial banks and their own equity. If the Operator imports Japanese equipment and JBIC buyer’s credit is
applied for and approved, the interest rate can be estimated at 7.13% plus risk premium with a 10-year repayment
period. If the Operator uses domestic commercial banks, the current interest rate is around 7% (Banko Sentral NG
Pilipinas homepage). In this analysis, it is estimated that the Operator uses a bank loan at 7% interest rate with a
10-year repayment period.

9 - 3
(3) Cash Flow Analysis
1) Cash Flow of CPA for New International Container Terminal
Cash flow was calculated based on the assumption provided in 9.3.1 and with a Treasury Bank loan for the
counterpart fund.
Table 9-3-1 indicates CPA’s cash flow for the construction of the New International Container Terminal (basic
infrastructure). CPA’s balance will be minus only during the construction period from 2015 to 2018 to pay interest
of the bilateral loan and in 2025 when major repayment of the principal of the JICA Loan starts. Only one year
after the start of the operation, in 2020, cash ending turns to be plus and accumulates plus cash throughout the
Project cycle.
If a JICA Loan is applied for and approved, the JICA loan may cover the interest during construction, and CPA
will only have a cash flow shortage for interest payment for the Treasury Bank Loan during construction. Figure
9-3-1 shows the changes of major cash flow components (Cash Inflow, Cash Outflow, Cash Balance and Cash
Ending) of CPA.
2) Cash Flow of Container Terminal Operator
Table 9-3-1 indicates the cash flow of the Terminal Operator if all the investments are made by loans. Cash
balance will be minus from 2018 to 2020, but turns to be plus after two years of operation. The Operator will gain
and accumulate profits after 2021. The total cash shortage between 2018 and 2020 will be PhP 215,239,000. This
is less than 50% of annual revenue. The Operator may borrow a short-term loan or use internal reserves.
Figure 9-3-1 shows the changes of the major cash flow components (Cash Inflow, Cash Outflow, Cash Balance
and Cash Ending) of the Operator.
If the Terminal Operator uses equity at 30% of the initial investment and commercial loan at 70%, the cash
balance will be minus only in 2018. From 2019, the cash balance turns to be plus throughout the Project cycle (see
Table 9-3-2 and Figure 9-3-3).
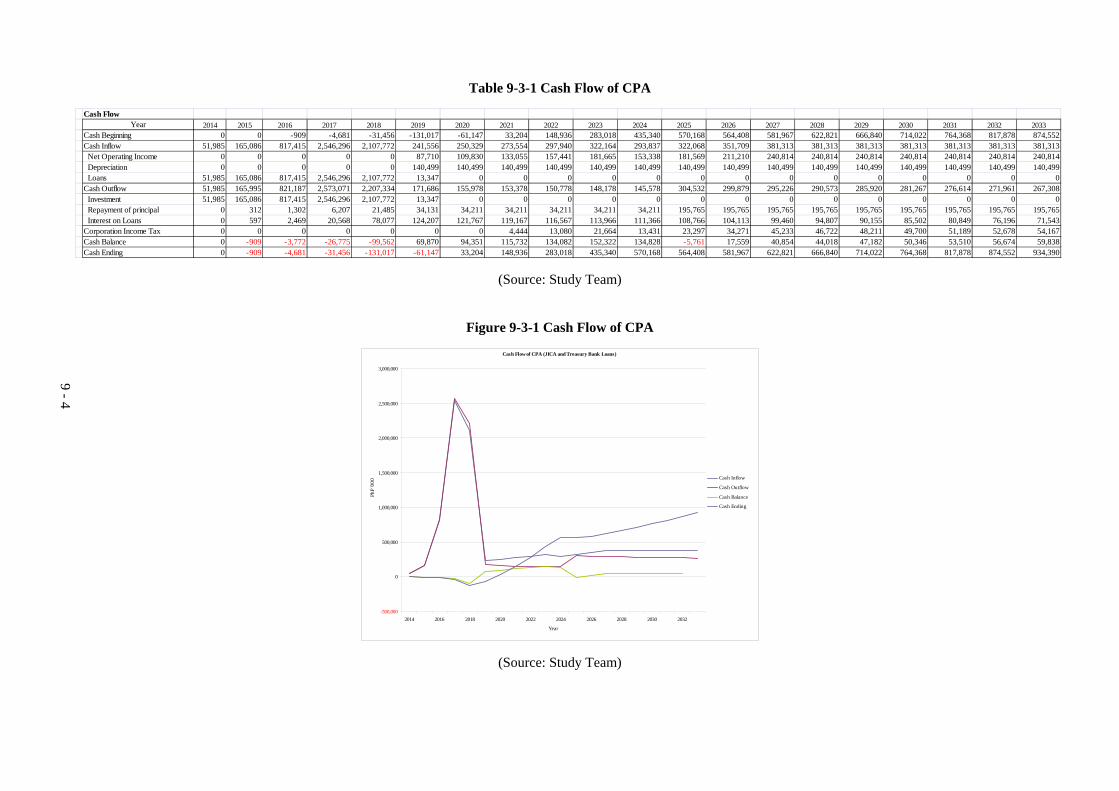
Table 9-3-1 Cash Flow of CPA
Cash FlowYear 2014 2015 2016 2017 2018 2019 2020 2021 2022 2023 2024 2025 2026 2027 2028 2029 2030 2031 2032 2033
Cash Beginning 0 0 -909 -4,681 -31,456 -131,017 -61,147 33,204 148,936 283,018 435,340 570,168 564,408 581,967 622,821 666,840 714,022 764,368 817,878 874,552Cash Inflow 51,985 165,086 817,415 2,546,296 2,107,772 241,556 250,329 273,554 297,940 322,164 293,837 322,068 351,709 381,313 381,313 381,313 381,313 381,313 381,313 381,313 Net Operating Income 0 0 0 0 0 87,710 109,830 133,055 157,441 181,665 153,338 181,569 211,210 240,814 240,814 240,814 240,814 240,814 240,814 240,814 Depreciation 0 0 0 0 0 140,499 140,499 140,499 140,499 140,499 140,499 140,499 140,499 140,499 140,499 140,499 140,499 140,499 140,499 140,499 Loans 51,985 165,086 817,415 2,546,296 2,107,772 13,347 0 0 0 0 0 0 0 0 0 0 0 0 0 0Cash Outflow 51,985 165,995 821,187 2,573,071 2,207,334 171,686 155,978 153,378 150,778 148,178 145,578 304,532 299,879 295,226 290,573 285,920 281,267 276,614 271,961 267,308 Investment 51,985 165,086 817,415 2,546,296 2,107,772 13,347 0 0 0 0 0 0 0 0 0 0 0 0 0 0 Repayment of principal 0 312 1,302 6,207 21,485 34,131 34,211 34,211 34,211 34,211 34,211 195,765 195,765 195,765 195,765 195,765 195,765 195,765 195,765 195,765 Interest on Loans 0 597 2,469 20,568 78,077 124,207 121,767 119,167 116,567 113,966 111,366 108,766 104,113 99,460 94,807 90,155 85,502 80,849 76,196 71,543Corporation Income Tax 0 0 0 0 0 0 0 4,444 13,080 21,664 13,431 23,297 34,271 45,233 46,722 48,211 49,700 51,189 52,678 54,167Cash Balance 0 -909 -3,772 -26,775 -99,562 69,870 94,351 115,732 134,082 152,322 134,828 -5,761 17,559 40,854 44,018 47,182 50,346 53,510 56,674 59,838Cash Ending 0 -909 -4,681 -31,456 -131,017 -61,147 33,204 148,936 283,018 435,340 570,168 564,408 581,967 622,821 666,840 714,022 764,368 817,878 874,552 934,390
(Source: Study Team)
Figure 9-3-1 Cash Flow of CPA
Cash Flow of CPA (JICA and Treasury Bank Loans)
-500,000
0
500,000
1,000,000
1,500,000
2,000,000
2,500,000
3,000,000
2014 2016 2018 2020 2022 2024 2026 2028 2030 2032
Year
PhP
'000
Cash Inflow
Cash Outflow
Cash Balance
Cash Ending
(Source: Study Team)
9 - 4

Table 9-3-2 Cash Flow of Terminal Operator (Investments with 100% Loan)
Cash FlowYear 2014 2015 2016 2017 2018 2019 2020 2021 2022 2023 2024 2025 2026 2027 2028 2029 2030 2031 2032 2033
Cash Beginning 0 0 0 0 0 -147,651 -199,996 -215,239 -192,145 -129,420 -54,311 -17,494 65,852 197,301 351,369 567,812 970,107 1,376,279 1,786,328 2,200,253Cash Inflow 0 0 0 868,537 1,737,075 439,955 476,277 514,414 554,458 1,090,874 588,171 634,527 683,201 957,137 689,631 689,631 689,631 689,631 689,631 689,631 Net Operating Income 0 0 0 0 0 349,517 385,839 423,976 464,020 431,469 475,618 521,974 570,648 566,952 566,952 566,952 566,952 566,952 566,952 566,952 Depreciation 0 0 0 0 0 90,438 90,438 90,438 90,438 112,553 112,553 112,553 112,553 122,679 122,679 122,679 122,679 122,679 122,679 122,679 Loans 0 0 0 868,537 1,737,075 0 0 0 0 546,852 0 0 0 267,506 0 0 0 0 0 0Cash Outflow 0 0 0 868,537 1,884,726 436,874 418,635 400,396 382,156 910,769 438,643 416,575 394,508 639,947 308,996 117,428 111,728 106,027 100,327 94,626 Investment 0 0 0 868,537 1,737,075 0 0 0 0 546,852 0 0 0 267,506 0 0 0 0 0 0 Repayment of principal 0 0 0 0 86,854 260,561 260,561 260,561 260,561 260,561 315,246 315,246 315,246 315,246 255,143 81,436 81,436 81,436 81,436 81,436 Interest on Loans 0 0 0 0 60,798 176,313 158,074 139,835 121,595 103,356 123,396 101,329 79,262 57,195 53,853 35,993 30,292 24,592 18,891 13,191Corporation Income Tax 0 0 0 0 0 55,425 72,885 90,925 109,576 104,996 112,711 134,606 157,244 163,122 164,192 169,907 171,731 173,555 175,379 177,204Cash Balance 0 0 0 0 -147,651 -52,344 -15,243 23,093 62,726 75,109 36,817 83,346 131,449 154,068 216,443 402,296 406,172 410,049 413,925 417,801Cash Ending 0 0 0 0 -147,651 -199,996 -215,239 -192,145 -129,420 -54,311 -17,494 65,852 197,301 351,369 567,812 970,107 1,376,279 1,786,328 2,200,253 2,618,053
(Source: Study Team)
Table 9-3-3 Cash Flow of Terminal Operator (Initial Investment with 30% Equity and 70% Loan)
Cash FlowYear 2014 2015 2016 2017 2018 2019 2020 2021 2022 2023 2024 2025 2026 2027 2028 2029 2030 2031 2032 2033
Cash Beginning 0 0 0 0 0 -103,356 -41,564 53,609 183,397 349,096 523,458 655,808 830,964 1,050,503 1,288,941 1,559,977 1,962,272 2,368,444 2,778,493 3,192,418Cash Inflow 0 0 0 607,976 1,215,953 439,955 476,277 514,414 554,458 1,090,874 588,171 634,527 683,201 957,137 689,631 689,631 689,631 689,631 689,631 689,631 Net Operating Income 0 0 0 0 0 349,517 385,839 423,976 464,020 431,469 475,618 521,974 570,648 566,952 566,952 566,952 566,952 566,952 566,952 566,952 Depreciation 0 0 0 0 0 90,438 90,438 90,438 90,438 112,553 112,553 112,553 112,553 122,679 122,679 122,679 122,679 122,679 122,679 122,679 Loans 0 0 0 607,976 1,215,953 0 0 0 0 546,852 0 0 0 267,506 0 0 0 0 0 0Cash Outflow 0 0 0 607,976 1,319,308 305,812 293,044 280,277 267,510 801,594 334,939 318,344 301,748 552,659 253,236 117,428 111,728 106,027 100,327 94,626 Investment 0 0 0 607,976 1,215,953 0 0 0 0 546,852 0 0 0 267,506 0 0 0 0 0 0 Repayment of principal 0 0 0 0 60,798 182,393 182,393 182,393 182,393 182,393 237,078 237,078 237,078 237,078 203,031 81,436 81,436 81,436 81,436 81,436 Interest on Loans 0 0 0 0 42,558 123,419 110,652 97,884 85,117 72,349 97,861 81,266 64,670 48,075 50,205 35,993 30,292 24,592 18,891 13,191Corporation Income Tax 0 0 0 0 0 72,351 88,060 104,349 121,249 114,918 120,882 141,027 161,913 166,041 165,359 169,907 171,731 173,555 175,379 177,204Cash Balance 0 0 0 0 -103,356 61,792 95,173 129,788 165,699 174,362 132,350 175,156 219,540 238,437 271,036 402,296 406,172 410,049 413,925 417,801Cash Ending 0 0 0 0 -103,356 -41,564 53,609 183,397 349,096 523,458 655,808 830,964 1,050,503 1,288,941 1,559,977 1,962,272 2,368,444 2,778,493 3,192,418 3,610,218
(Source: Study Team)
9 - 5

Figure 9-3-2 Cash Flow of Terminal Operator (100% Loan)
Cashh Flow of Terminal Operator (100% Bank Loan)
-500,000
0
500,000
1,000,000
1,500,000
2,000,000
2,500,000
3,000,000
2014 2016 2018 2020 2022 2024 2026 2028 2030 2032
Year
PhP
'000
Cash Inflow
Cash Outflow
Cash Balance
Cash Ending
(Source: Study Team)
Figure 9-3-3 Cash Flow of Terminal Operator
(Initial Costs: 30% Equity and 70% Loan)
Cash Flow of Terminal Operator (Initial Costs: 30% Equity and 70% Bank Loan)
-500,000
0
500,000
1,000,000
1,500,000
2,000,000
2,500,000
3,000,000
3,500,000
4,000,000
2014 2016 2018 2020 2022 2024 2026 2028 2030 2032
Year
PhP
'000
Cash Inflow
Cash Outflow
Cash Balance
Cash Ending
(Source: Study Team
9 - 6
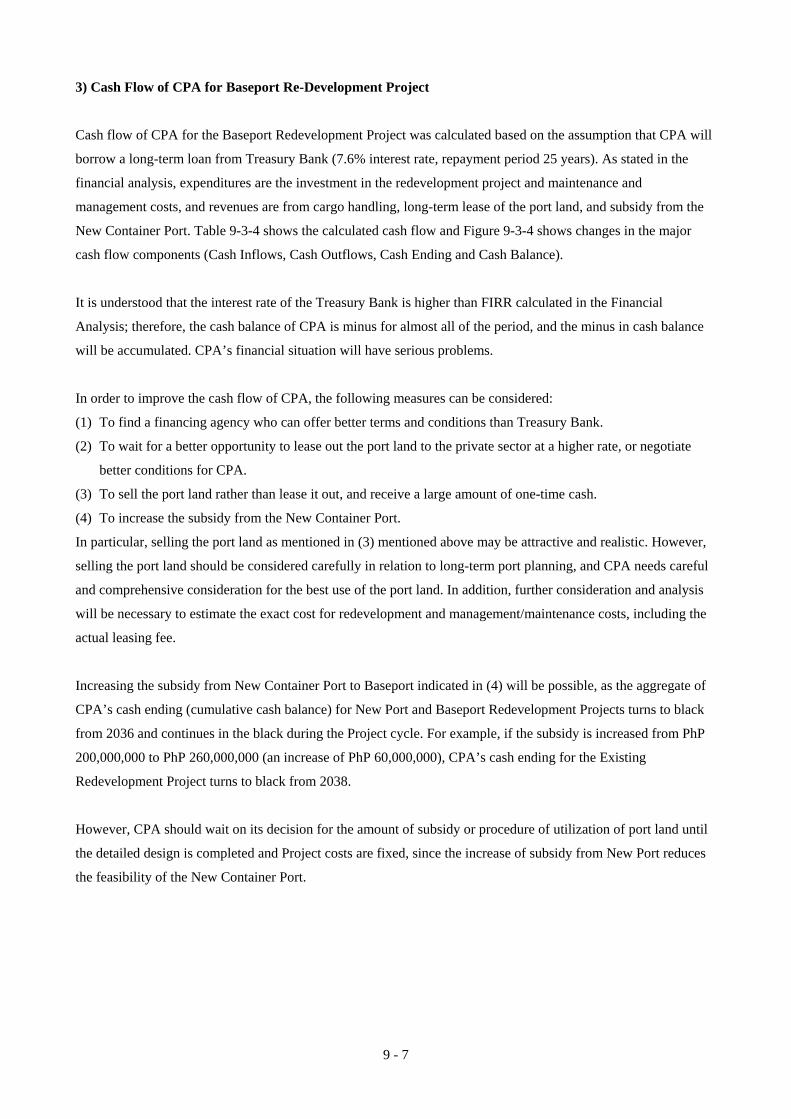
9 - 7
3) Cash Flow of CPA for Baseport Re-Development Project
Cash flow of CPA for the Baseport Redevelopment Project was calculated based on the assumption that CPA will
borrow a long-term loan from Treasury Bank (7.6% interest rate, repayment period 25 years). As stated in the
financial analysis, expenditures are the investment in the redevelopment project and maintenance and
management costs, and revenues are from cargo handling, long-term lease of the port land, and subsidy from the
New Container Port. Table 9-3-4 shows the calculated cash flow and Figure 9-3-4 shows changes in the major
cash flow components (Cash Inflows, Cash Outflows, Cash Ending and Cash Balance).
It is understood that the interest rate of the Treasury Bank is higher than FIRR calculated in the Financial
Analysis; therefore, the cash balance of CPA is minus for almost all of the period, and the minus in cash balance
will be accumulated. CPA’s financial situation will have serious problems.
In order to improve the cash flow of CPA, the following measures can be considered:
(1) To find a financing agency who can offer better terms and conditions than Treasury Bank.
(2) To wait for a better opportunity to lease out the port land to the private sector at a higher rate, or negotiate
better conditions for CPA.
(3) To sell the port land rather than lease it out, and receive a large amount of one-time cash.
(4) To increase the subsidy from the New Container Port.
In particular, selling the port land as mentioned in (3) mentioned above may be attractive and realistic. However,
selling the port land should be considered carefully in relation to long-term port planning, and CPA needs careful
and comprehensive consideration for the best use of the port land. In addition, further consideration and analysis
will be necessary to estimate the exact cost for redevelopment and management/maintenance costs, including the
actual leasing fee.
Increasing the subsidy from New Container Port to Baseport indicated in (4) will be possible, as the aggregate of
CPA’s cash ending (cumulative cash balance) for New Port and Baseport Redevelopment Projects turns to black
from 2036 and continues in the black during the Project cycle. For example, if the subsidy is increased from PhP
200,000,000 to PhP 260,000,000 (an increase of PhP 60,000,000), CPA’s cash ending for the Existing
Redevelopment Project turns to black from 2038.
However, CPA should wait on its decision for the amount of subsidy or procedure of utilization of port land until
the detailed design is completed and Project costs are fixed, since the increase of subsidy from New Port reduces
the feasibility of the New Container Port.

Table 9-3-4 Cash Flow of CPA for Baseport Redevelopment Project
Cash Flow Unit: PhP '000)Year 2014 2015 2016 2017 2018 2019 2020 2021 2022 2023 2024 2025 2026 2027 2028 2029 2030 2031 2032 2033
Cash Beginning 0 0 0 0 0 0 -75,741 -145,436 -283,321 -407,723 -519,372 -616,695 -698,926 -772,707 -831,874 -874,348 -914,533 -952,428 -988,034 -1,021,349Cash Inflow 0 0 0 0 22,874 -28,644 622,194 -49,296 -39,594 -29,131 -17,094 -4,292 1,868 14,193 28,596 28,596 28,596 28,596 28,596 28,596 Net Operating Income 0 0 0 0 0 -88,151 -77,018 -66,052 -54,657 -44,194 -32,157 -19,355 -13,195 -870 13,533 13,533 13,533 13,533 13,533 13,533 Depreciation 0 0 0 0 0 15,063 15,063 15,063 15,063 15,063 15,063 15,063 15,063 15,063 15,063 15,063 15,063 15,063 15,063 15,063 Loans 0 0 0 0 22,874 44,444 684,149 1,693 0 0 0 0 0 0 0 0 0 0 0 0Cash Outflow 0 0 0 0 22,874 47,097 691,888 88,589 84,808 82,518 80,229 77,939 75,649 73,360 71,070 68,781 66,491 64,201 61,912 59,622 Investment 0 0 0 0 22,874 44,444 684,149 1,693 0 0 0 0 0 0 0 0 0 0 0 0 Repayment of principal 0 0 0 0 0 915 2,693 30,059 30,126 30,126 30,126 30,126 30,126 30,126 30,126 30,126 30,126 30,126 30,126 30,126 Interest on Loans 0 0 0 0 0 1,738 5,047 56,837 54,682 52,392 50,102 47,813 45,523 43,233 40,944 38,654 36,365 34,075 31,785 29,496Corporation Income Tax 0 0 0 0 0 0 0 0 0 0 0 0 0 0 0 0 0 0 0 0Cash Balance 0 0 0 0 0 -75,741 -69,694 -137,885 -124,402 -111,649 -97,323 -82,231 -73,781 -59,167 -42,474 -40,185 -37,895 -35,605 -33,316 -31,026Cash Ending 0 0 0 0 0 -75,741 -145,436 -283,321 -407,723 -519,372 -616,695 -698,926 -772,707 -831,874 -874,348 -914,533 -952,428 -988,034 -1,021,349 -1,052,376
(Source: Study Team)
Figure 9-3-4 Cash Flow of CPA for Baseport Redevelopment Project (Changes of Major Components)
Cash Flow of CPA for Base Port Re-Development ( with Treasury Bank)
-1,200,000
-1,000,000
-800,000
-600,000
-400,000
-200,000
0
200,000
400,000
600,000
800,000
2014 2016 2018 2020 2022 2024 2026 2028 2030 2032
Year
PhP
'000
Cash Inflow
Cash Outflow
Cash Balance
Cash Ending
(Source: Study Team)
9 - 8

9 - 9
4) Commercial Development by Private Sector for the Base Port Redevelopment
This report only proposes a conceptual plan for the Base Port Redevelopment, such as commercial facilities
(shopping malls) and international cruise terminal, and a further analysis is necessary to prepare detailed
redevelopment plan.
The proposed shopping mall will create a large shopping complex, combined with the SM City Cebu (existing)
and Robinson Shopping Center (planned to be built next to the SM City Cebu), and this shopping complex is
expected to attract international tourists whose activities are currently concentrated in Mactan Island, instead of
Cebu Island.
Shopping mall will have many specialized shops, super markets, gift shops, restaurants, movie theaters and others,
and will have a large impact to the local economy through creating employment opportunity and other economic
activities.


Chapter 10
Action Plan and Issues

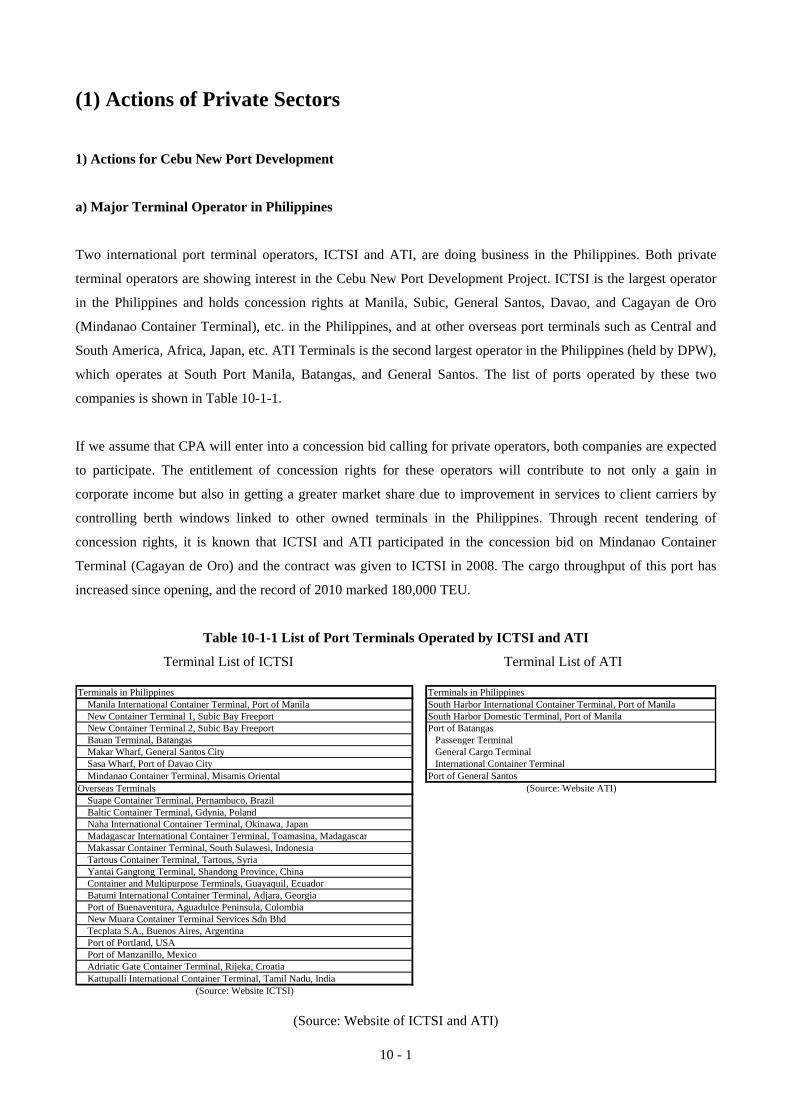
10 - 1
(1) Actions of Private Sectors
1) Actions for Cebu New Port Development
a) Major Terminal Operator in Philippines
Two international port terminal operators, ICTSI and ATI, are doing business in the Philippines. Both private
terminal operators are showing interest in the Cebu New Port Development Project. ICTSI is the largest operator
in the Philippines and holds concession rights at Manila, Subic, General Santos, Davao, and Cagayan de Oro
(Mindanao Container Terminal), etc. in the Philippines, and at other overseas port terminals such as Central and
South America, Africa, Japan, etc. ATI Terminals is the second largest operator in the Philippines (held by DPW),
which operates at South Port Manila, Batangas, and General Santos. The list of ports operated by these two
companies is shown in Table 10-1-1.
If we assume that CPA will enter into a concession bid calling for private operators, both companies are expected
to participate. The entitlement of concession rights for these operators will contribute to not only a gain in
corporate income but also in getting a greater market share due to improvement in services to client carriers by
controlling berth windows linked to other owned terminals in the Philippines. Through recent tendering of
concession rights, it is known that ICTSI and ATI participated in the concession bid on Mindanao Container
Terminal (Cagayan de Oro) and the contract was given to ICTSI in 2008. The cargo throughput of this port has
increased since opening, and the record of 2010 marked 180,000 TEU.
Table 10-1-1 List of Port Terminals Operated by ICTSI and ATI
Terminal List of ICTSI Terminal List of ATI
Terminals in Philippines Terminals in Philippines Manila International Container Terminal, Port of Manila South Harbor International Container Terminal, Port of Manila New Container Terminal 1, Subic Bay Freeport South Harbor Domestic Terminal, Port of Manila New Container Terminal 2, Subic Bay Freeport Port of Batangas Bauan Terminal, Batangas Passenger Terminal Makar Wharf, General Santos City General Cargo Terminal Sasa Wharf, Port of Davao City International Container Terminal Mindanao Container Terminal, Misamis Oriental Port of General SantosOverseas Terminals (Source: Website ATI) Suape Container Terminal, Pernambuco, Brazil Baltic Container Terminal, Gdynia, Poland Naha International Container Terminal, Okinawa, Japan Madagascar International Container Terminal, Toamasina, Madagascar Makassar Container Terminal, South Sulawesi, Indonesia Tartous Container Terminal, Tartous, Syria Yantai Gangtong Terminal, Shandong Province, China Container and Multipurpose Terminals, Guayaquil, Ecuador Batumi International Container Terminal, Adjara, Georgia Port of Buenaventura, Aguadulce Peninsula, Colombia New Muara Container Terminal Services Sdn Bhd Tecplata S.A., Buenos Aires, Argentina Port of Portland, USA Port of Manzanillo, Mexico Adriatic Gate Container Terminal, Rijeka, Croatia Kattupalli International Container Terminal, Tamil Nadu, India
(Source: Website ICTSI)
(Source: Website of ICTSI and ATI)

10 - 2
b) Terminal Operator of Cebu Port
The international terminal operator of Cebu Port is OPASCOR who has a contract with CPA valid until 2023.
OPASCOR owns 3 QCs (Quay Gantry Crane) and 18 RTGs at present. In order to meet the increasing cargo
demand, OPASCO is planning to install a new QC and 2 RTG in the near future. This Study proposes opening the
New Cebu Port in 2018, which implies that the shift will occur before the end of the contract between OPASCOR
and CPA. Therefore, CPA shall enter into practical discussions as soon as possible with OPASCOR on the matter
of the concession contract as well as the properties invested by OPASCOR to date.
Until now, there has been no contrary opinion from OPASCOR and its management has shown goodwill to the
new port development. The reason for such a cooperative attitude is that the OPASCOR understands its
concession right will be effective on new port opening and they could obtain the privilege to continue their status
as Terminal Operator.
c) Shipping Companies as Cebu Port Users
Table 10-1-2 shows the detail of services provided by carriers as Cebu Port users. Table 10-1-3 shows the
container throughputs at Cebu Port detailed by each carrier. In the past, the majority of international cargo was
shipped via Manila Port and loaded/unloaded at local ports including Cebu Port. Direct shipping from local ports
began when some new international terminals were opened at Davao, Cagayan de Oro, etc. The demand of direct
shipping to overseas hub-ports has been increasing. The reasons for such demand are the shipping cost of feeder
transport through Manila is higher than direct shipping and the hub functions of overseas ports (e.g. Kaohsiung
port in Taiwan) are generally wider than Manila (there are more destination ports). Such trends in demand
increase are expected to continue; thus, shipping companies using Cebu Port feel welcome to the new deep-sea
port development.
Table 10-1-2 Detail of Services Provided by Carriers as Cebu Port Users
Carrier Overseas Hub-Port Port in Philippines FrequencySize of Ship
(TEU)Ship Owner
APLShanghai, Ningbo, Hong Kong, Kaohsiung,Chi Wan
Manila, Cebu, Cagayan every week 1,065 Own Operation
Evergreen Kaohsiung Cebu every week 1,160 Own Operation
Wan Hai Lines Kaohsiung Cebu every week 1,500 Common Feeder
Yang Ming Line Kaohsiung Cebu every week 1,500 Common Feeder
Maersk Kaohsiung Cebu every week 1,500 Common Feeder
OOCL Kaohsiung Cebu every week 1,500 Common Feeder
NYK Kaohsiung Cebu every week 1,500 Common Feeder
RCL Singapore Cebu, Davao, General Santos every week 1,080 Own Operation
MarinasShanghai, Dalian, Quingdao, Hong Kong,Muara, Kota Muara, Kinabalu
Cebu, Cagayan, Davao every week 950-1,100 Own Operation
Hanjin Kaohsiung every week 1,500 Common Feeder
(Source: Study Team)

10 - 3
Table 10-1-3 Container Throughputs at Cebu Port Detailed by Each Carrier (2010)
Carrier Ship call Carrier Import Export Empty TotalAPL 46 APL 18,129 8,110 10,346 36,585Evergreen 1 Evergreen 18,837 3,550 18,161 40,548Mercury 30 Mercury 7,342 3,952 2,647 13,941RCL 27 Maersk 3,472 1,650 4,392 9,514Rollway 54 RCL 8,591 5,219 2,730 16,540Wan Hai - OOCL 3,398 3,222 1,488 8,108Marinas 66 Rollway 3,948 2,113 1,784 7,845Sino Cargo - Wan Hai 14,236 6,685 7,534 28,455Pacific - Marinas 5,962 7,246 3,324 16,532Melro Ship 52 Others 11,840 9,434 2,773 24,047BBC Trans - Total 95,755 51,181 55,179 202,115Subtotal 276 Tramping (不定期船) 129 MCC (Maersk: Domestic) 52 Total 457
Shipcalls OPASCOR2010
Container Throughput by OPASCOR (TEU)2010
(Source: OPASCOR)
d) Competition with Mindanao Container Terminal (Cagayan de Oro)
The current container throughput of Mindanao Container Terminal (Cagayan de Oro), which opened in 2008,
marked 180,000 TEU in 2010, and it is still increasing. Although Mindanao Island is abundant in agriculture and
natural resources, there was no deep seaport until Mindanao Container Terminal opened. Until then, cargo that
originated from the area near Cagayan de Oro was transported passing through Davao or Cebu. It has been
reported that the cargo demand of Cebu Port decreased due to lack of use because of the opening of Mindanao
Container Terminal.
However, there is a difference in the balance of import/export between Cebu and Cagayan if we consider the
current cargo demand of the two ports. In an interview with the Study Team, a carrier said that there are some
cases in which international lines dock in Cagayan (-13 m quay depth) first to discharge cargo and then sail to
Cebu by lighter draft because the depth of the berth at Cebu is shallow. Generally, it is said that Cagayan has high
exports of resources and Cebu has high imports of consumer goods. It is thought to be rational that ships with full
draft should go to Cebu to discharge cargo before sailing to Cagayan which has much cargo to load. Thus,
development of a deep seaport in Cebu (-13 m) is expected to contribute to the coexistence of the two ports as
well as upgrading shipping services by shortening the shipping time.
2) Actions for Redevelopment of Cebu Existing Port
Redevelopment of the existing port by PPP scheme introduction is important for CPA for: 1) repayment of new
port investment, 2) running cost earning of the existing port after the new port opens, and 3) future plan to shift
port functions to the new port. This study proposes the introduction of private developer investment placing focus
on the high value potential of the waterfront (port facing) area that is owned by CPA.
In the Cebu Port district, several private commercial facilities, such as shopping malls (SM) and hotels (Radisson),
are already operating. In a similar way, it is foreseen that development using the value of port related resources,

10 - 4
such as a passenger terminal, would be attractive. On the other hand, a shopping mall developer has pointed out
the disadvantage in a commercial center facing the noisy and dangerous cargo terminal. Taking into account the
financial situation of CPA, the port functions shifting outside the existing port should be carried out through
step-by-step spending over a rather longer time, approximately 20 years. CPA should start discussions with
candidate private developers as soon as possible to succeed in attractive redevelopment of the existing port.

10 - 5
(2) Actions of Public Sector
1) DOTC (Department Of Transportation and Communications)
DOTC is preparing to submit an application of the Project to NEDA (National Economic Development Agency)
in order to get approval from ICC (Investment Coordination Committee). The steps to the approval are: 1) audit of
the application by ICC-Technical Board, 2) audit the same by ICC-Cabinet Committee, and 3) approval by NEDA
Board, then the Project can proceed. The application will be written by the planning division manager of DOTC.
The planning division of DOTC is quite active on this Project and is prepared to answer any questions that may be
asked by these audit authorities.
2) CPA (Cebu Port Authority)
CPA is the substantial execution authority of the Project. The authority plans to get finance from a bilateral ODA
loan for new port development, while the ECC (Environmental Compliance Certificate) shall be obtained before
ODA application. CPA is preparing the next annual budget to account for the ECC and required cost for audit
procedures. This study shows that part of the JICA Study from 2002 can be used as is in regard to the environment.
The required time for obtainment of an ECC is estimated at approximately six months (3 months to make the
application report including an additional survey, and 3 months for audit procedures by environmental
authorities).
In addition, CPA is preparing a new internal taskforce also covered by the next fiscal budget to handle Project
execution. The plan of the organization is shown in Figure 10-2-1. The actions of the party will commence
according to the additional survey for the new ECC application.
Figure 10-2-1 Plan of New Internal Taskforce Organization for Project Execution (CPA)
PROJECT CONSULTANT PROJECT MANAGER
PROJECT ENGINEER
MATERIAL ENGINEER ADMIN/FINANCEFIELD ENGINEER (5)
G.E./SURVEYOR
SURVEY AIDS (5)
LAB AID (1) LAB TECH (2) CLERK (3)
CLERK
SECRETARY
(Source: CPA)

10 - 6
3) Department of Environment and Natural Resources (DENR) and Environment Management Bureau
(EMB)
Receiving the application for the ECC made by CPA, EMB-7 (Cebu branch of EMB) will immediately organize
an EIA Review Committee and commence works in accordance with the Order of DENR 2003-30. During the
process of application audit, assessment by the Land Management Bureau of DENR as well as the Reclamation
Authority will be required.

10 - 7
(3) Legal and Financial Constraints of CPA
1) Legal System
a) CPA
CPA was created by virtue of Republic Act No. 7621 on 26 June 1992, and is under the supervision of the
Department of Transportation and Communications (DOTC) for purposes of policy coordination. Under its
Charter, the CPA shall administer all facilities including wharves, piers, slips, docks, bulkheads, cargo terminals,
warehouses, cold storage, loading and unloading equipment, and passenger terminals and accessories, within the
province and cities of Cebu. CPA also has the power to lease out port property as provided for Section 7 of its
Charter (R.A. 7621).
b) Purposes and Objectives of CPA
CPA has the following purposes and objectives:
- To integrate and coordinate the planning, development, construction and operations of seaports and seaport
facilities within its territorial jurisdiction.
- To enhance the flow of international and domestic commerce passing through these seaports.
- To provide support services to sustain the growth of export and other priority industries (Section 5, Republic
Act No. 7621).
c) Governing Body of CPA
The governing body of the CPA is the Cebu Port Commission (CPC). It is composed of the Secretary of the
Department of Transportation and Communication (DOTC) or his duly designated Undersecretary, who shall be
the Chairman, and six (6) Commissioners. The Commissioners, who are appointed by the President of the
Philippines, represent the following sectors: ship-owners and shipping operators, cargo-handling labor sector and
business sector.
d) General Manager and Departments
The General Manager directs and controls the management of the day-to-day business and operations of the CPA
(Section 12, RA 7621). He is assisted by the Deputy General Manager and the different department managers for
Port Management, Finance and Administration, Port Safety, Security & Environment, Engineering Services,
Legal Affairs, and Business Marketing and Development. By the end of the year 2010, the Authority had 149
regular employees and 2 casual employees, totaling 151 employees distributed and assigned to the Baseport and
Subports.

10 - 8
e) CPA Port System
The CPA Port System is a network of ports in the province of Cebu and its component islands. The CPA Port
System is composed of a Baseport (Main Hub), five (5) Subports (Mandaue, Danao, Sta. Fe, Toledo, and Argao)
and thirteen (13) Outports located in the Cebu Province mainland and component islands.
2) Financial Situation
a) Revenue
CPA’s revenues are composed of wharfage, arrastre/stevedoring share, storage charges, berthing charges, harbor
fees, anchorage fees, and miscellaneous income, and nearly two thirds of the total revenues are generated from the
first two items. CPA registered PhP 710 million as revenue in 2010.
b) Operating Expenses
CPA’s operating expenses consist of maintenance and other operating expenses, repairs and maintenance - port
facilities, and personal services. About eighty percent (80%) of the total operating expenses are attributed to the
first two items. CPA registered PhP 419 million as total operating expenses in 2010.
c) Net Income
As a result, CPA registered about PhP 100 ~ 200 million as net income (after tax) during the period between 2005
and 2010 (see Table 10-3-1). CPA has been managing in sound finance.
Table 10-3-1 Income Statement of CPA
(Unit: PhP)2005 2006 2007 2008 2009 2010
REVENUES Wharfage 163,028,543 176,300,277 193,319,764 197,772,701 202,762,368 230,412,397 Arrastre/stevedoring share 131,292,783 150,971,324 178,364,507 181,432,138 198,591,189 235,992,122 Storage charges 22,327,595 25,122,925 25,296,346 44,755,934 54,666,705 50,063,333 Berthing charges-domestic 42,654,936 39,791,374 38,575,186 35,718,818 41,587,798 45,374,722 Harbor fees 24,976,727 23,671,813 26,327,262 24,137,194 30,331,844 29,565,952 Berthing charges-foreign 20,074,907 19,895,609 20,730,932 23,453,327 28,516,904 30,211,978 Anchorage fees 5,461,954 11,450,766 8,827,129 3,392,516 12,675,209 5,277,421 Miscellaneous Income (Note 16) 62,198,643 61,043,755 71,040,767 85,226,106 71,338,704 75,792,560
Total Revenue 472,016,088 508,247,843 562,481,893 595,888,734 640,470,721 702,690,485OPERATING EXPENSESPersonal services 63,537,386 68,056,355 68,151,812 74,956,239 82,795,499 81,834,680Maintenance and other operating expenses 134,866,275 129,720,352 143,931,202 151,906,229 159,937,356 160,920,119Repairs and Maintenance - Port facilities 19,384,344 77,124,422 157,362,098 165,842,803 104,648,681 176,504,760
Total Operating Expenses 217,788,005 274,901,129 369,445,112 392,705,271 347,381,536 419,259,559Income From Operations 254,228,083 233,346,714 193,036,781 203,183,463 293,089,185 283,430,926Other Income - Net 24,841,855 11,279,317 10,469,574 18,341,390 1,942,724 4,613,766
Income Before Income Tax 279,069,938 244,626,031 203,506,355 184,842,073 295,031,909 288,044,692Provision For Income Tax 77,167,008 107,524,560 67,683,321 66,588,237 84,956,821 83,565,666
NET INCOME 201,902,930 137,101,471 135,823,034 118,253,836 210,075,088 204,479,026
(Source: Tabulated by Study Team based on CPA Financial Documents)

10 - 9
d) Retained Earnings
CPA pays 50% of the net income (after tax) to the Government as dividends, and after payment the CPA earned
PhP 88 million as retained earnings in 2010. Accumulated retained earning was PhP 613 million at the end of
2010. CPA owes loans from neither commercial banks nor foreign countries.
Table 10-3-2 Statements of Changes in Equity
(Source: Cebu Port Authority, Statements of Changes in Equity)
3) Constraints
CPA, which is supposed to be the executing agency of the Project, is competent to do the all the works planned in
this Project. In addition, CPA has been running the business financially stable since the establishment of its
authority. Therefore, it can be concluded that neither legal nor financial constraints exist for CPA to implement
the Project.
2006 2007 2008 2009 2010
Equity Contribution
Balance at beginning of year 4,159,925,902 4,159,925,902 4,159,925,902 4,159,925,902 4,159,925,902
Additions (deductions)
Balance at the end of year 4,159,925,902 4,159,925,902 4,159,925,902 4,159,925,902 4,159,925,902
Retained Earnings
Balance at beginning of year 260,756,459 411,153,526 384,293,686 431,725,510 525,361,582
Net Income 137,101,471 135,823,034 118,253,836 210,075,088 204,479,026
Correction of prior-years' erro 81,846,331 (94,771,355) (11,695,094) (11,401,472) (14,718,162)
Dividends (68,550,736) (67,911,517) (59,126,918) (105,037,544) (102,239,513)
Balance at the end of year 411,153,526 384,293,688 431,725,510 525,361,582 612,882,933
PhP 4,571,079,428 4,544,219,590 4,591,651,412 4,685,287,484 4,772,808,835

10 - 10
(4) Requirement of Additional Detailed Studies
1) Cebu New Port
a) Monitoring Cargo Throughput and Comparison to Demand Forecast
Needs of the Project and timing of implementation depend on the demand forecast. Therefore, it is required to
monitor the difference between the forecast and the actual output, and to continually know the timing of Project
preparations.
b) Natural Condition Survey for Detailed Planning
In order to make the plan details, a bathymetric survey, a wave and current survey, and soil investigation by
offshore boring should be carried out.
c) Selection of Private Terminal Operator
At present, the international terminal of the existing port is operated by OPASCOR under a contract with CPA.
On the event of new port development and shifting the terminal to the new port, studies are required on the matter
of the existing contract as well as the method of introducing new private operators.
d) The Effective Use of Port Related Area
In this Study, a plot of Port Related Area (7 ha) is proposed behind the new container terminal. This is for the
future needs of warehouses or empty container yards. An additional study is required on how the yard should be
leased to the private sector, or on how CPA can develop the area and introduce private users.
e) Development of North Coastal Road
Currently, the Department of Public Works and Highway (DPWH) plans to extend the North Coastal Road. In this
study, a highway interchange at the connection between the Coastal Road and the port access road is proposed.
For implementation of the new port development, coordination on road planning between CPA/DOTC and
DPWH is required.

10 - 11
1) Cebu Existing Port
a) More Accurate Forecast of the Future Port Congestion based on Site Survey
In this section, port planning is carried out using the factor of berth occupancy ratio to forecast future congestion.
The data covers the period of the three months between June and August 2011. A future study should survey data
over a longer period for a more accurate evaluation.
In addition, the congestion of the port depends not only on berth occupancy but also on the ability and numbers of
cargo equipment, capability of workers, etc. An analysis should be done to incorporate these other factors. To
make these factors clear, a comprehensive one to three month site survey employing record taking staff is
recommended.
b) Monitoring Cargo Throughput and Comparison to Demand Forecast
Needs of the Project and its timing of implementation depend on the demand forecast. Therefore, it is required to
monitor the difference between the forecast and the actual output, and to continually know the timing of Project
preparations.
c) Reconsideration of Port Planning
If required, the future port plan should be reorganized taking into account: 1) practical site survey and 2)
monitoring forecast.
d) Detailed Study of Private Commercial Development on PPP Scheme
Regarding commercial development through introducing private investment, a study on a suitable procedure of
tender for investors is needed. It is also important to draw up an actual plan incorporating the ideas and intentions
of the investors.
e) Coordination to Relevant Authorities and Local Autonomies
CPA should coordinate with the relevant authorities, such as supreme government authorities DOTC and local
autonomies such as Cebu city or the provincial government. Coordination with local autonomies is particularly
important, as CPA owned land is limited and the area is closely related to city planning.


Reproduction Prohibited