Embed Size (px)
Citation preview

Research Collection
Doctoral Thesis
Metabolic engineering of yeast
Author(s): Çakar, Zeynep Petek
Publication Date: 2000
Permanent Link: https://doi.org/10.3929/ethz-a-004017268
Rights / License: In Copyright - Non-Commercial Use Permitted
This page was generated automatically upon download from the ETH Zurich Research Collection. For moreinformation please consult the Terms of use.
ETH Library

Diss. ETH No. 13665
METABOLIC ENGINEERING OF YEAST
A dissertation submitted to the
SWISS FEDERAL INSTITUTE OF TECHNOLOGY ZÜRICH
for the degree of
Doctor of Natural Sciences
Presented by
Zeynep Petek Cakar
M.Sc. Chem. Eng., Bogaziçi University, Istanbul
born August 23, 1972
citizen of Turkey
Accepted on the recommendation of
Prof. Dr. Bernard Witholt, examiner
Prof. Dr. Theo WaUimann, co-cxaminer
Dr. Uwe Sauer, eo-examiner
Prof. Dr. Markus Aebi, chairman
Zürich, 2000

2
Acknowledgements
I wish to express my gratitudes to my supervisor, Prof. Dr. James E. Bailey, for giving
me the chance to do a Ph.D. in his group and for his support throughout this study. I
would also like to thank Prof. Dr. Bernard Witholt for accepting to be my examiner, and
the time he devoted to reading and commenting on my thesis. Many thanks also go to
Prof. Dr. Markus Aebi, the chairman of the examination committee.
I am indebted to Prof. Dr. Theo WaUimann, my co-examiner, for his continuous
support throughout my Ph.D. study. I am also thankful to Drs. Uwe Schlattner and
Martin Stolz for many fruitful discussions and for introducing me with cell biological
techniques. It was a pleasure to collaborate with the WaUimann Group.
I would also like to thank Dr. Uwe Sauer, my co-examiner and group leader, for
the direct and excellent supervision, stimulating discussions and the rapid correction of
my thesis.
I am grateful to Ms. Miriam Bryant for her significant contributions to my
scientific English. May she rest in peace.
Many thanks also go to PD. Dr. Pauli Kallio, as well as Max Haueter and Helena
Zuber for their efforts especially during the last few months regarding the administrative
issues of my Ph.D.
Thank you all former and current IBTECH-members (I apologize for not listing all
your names here) for the friendly and motivating working atmosphere and your help.
Thank you my good friends for all your (E-)mails, calls, visits and support from
here, back home, and the U.S..
Thank you my dear yeasts, for showing me how complex life really is and making
also me 'multistress-resistant' during my Ph.D.
Merci vielmal und ade ETH-Züri, it was nice to be a Ph.D. student here.
Finally, to my family goes my eternal gratitude for their everlasting love, support,
and patience. Sevgili ailem, sizin sevgirriz, sonsuz desteginiz ve bana olan derin gtiven ve
inanciniz sayesinde bu noktaya kadar gelebildim. Bu nedenle doktora tezimi, herseyimi
borçlu oldugum aileme ithaf ediyorum.
I would like to dedicate this thesis to my family whom I owe
everything.
3
Table of Contents
Preface Summary/Zusammenfassung 4
Chapter 1 General Introduction 9
Chapter 2 Improving Yeast Energy Metabolism 23
by Overexpression of Creatine Kinase?
Chapter 3 Intracellular Carbon Fluxes in the Yeasts 43
Saccharomyces cerevisiae and Pichia stipitis
Chapter 4 Metabolic Engineering of Yeast: the Perils of 69
Auxotrophic Hosts
Chapter 5 Vacuolar Morphology and Cell Cycle Distribution 83
are Modified by Leucine Limitation
in Auxotrophic Saccharomyces cerevisiae
Chapter 6 Directed Evolution of Multiple-Stress Resistant 103
Saccharomyces cerevisiae
Chapter 7 General Conclusions 126
Curriculum Vitae 130

4
Preface
Summary/Zusammenfassimg
5
SUMMARY
The aim of this thesis was to provide insights into cellular properties that are relevant for
metabolic engineering of yeast: intracellular carbon fluxes, side effects of using
auxotrophic markers, and susceptibility of multiple stress resistance to evolutionary
engineering. For this purpose, several new methodologies were adapted for application to
yeast, and the reported results as well as the methods themselves can be used to increase
the efficiency of metabolic engineering in yeast.
First, we describe a metabolic engineering strategy that aims at improving yeast
energy metabolism by overexpression of creatine kinases, key enzymes of energy
metabolism in higher eukaryotes. Despite a previous report that creatine kinase-
overexpressing Saccharomyces cerevisiae takes up creatine and form phosphocreatine,
our in vivo 31P-NMR and inhibitor data reveal that such cells do not form
phosphocreatine, presumably for lack of creatine uptake. Thus, installing a functional
creatine kinase system in yeast requires further metabolic engineering of either
intracellular creatine biosynthesis or creatine uptake.
Second, we adapt a new methodology for metabolic flux analysis in yeast for the
first time. This method is based on the combination of classical metabolic flux balancing
and NMR tracing of nC-labeled amino acids. The wealth of available data also allowed to
include compartmentalization in the model and, contrary to previous attempts, to actually
conclude on the localization of certain metabolite pools. This flux model, along with the
generated data, were used to gain insights into the metabolic differences between the
yeasts Pichia and Saccharomyces. Most prominently, the results reveal significantly
higher fluxes through the pentose phosphate pathway in Pichia, A possible explanation
for these differences is the presence of a transhydrogenase or transhydrogenasc-hkc
activity in Pichia and its absence in Saccharomyces. Furthermore, our results suggest
transaldolase and transketolase, possibly in combination with transhydrogenase as a target
for metabolic engineering of xylose utilization for fuel ethanol production in S. cerevisiae.
Third, we show that auxotrophic yeast mutants may have physiological alterations
and sensitivities that are not generally recognized. Analyzing yeast morphology by
advanced high pressure freezing-freeze substitution and transmission electron
microscopy, we show the interrelation of vacuolar morphology, cell cycle, and amino
acid availability in auxotrophic S. cerevisiae strains. These techniques for sample
preparation, so far, have been barely successful in yeast. The results present a note of
caution that auxotrophic host-related physiological effects may complicate interpretation of
morphological, cell cycle, and metabolic engineering studies.
Fourth, we describe directed evolution of multiple-stress resistant S. cerevisiae.
Specifically, various batch and chemostat selection strategies were compared for their
suitability of selecting multiple-stress resistant mutants. These results revealed that

6
transient stress challenges in chemostat yielded mutants with up to 10-fold improved
oxidative, freezing and ethanol stress survival, compared to the wild-type. Selection in
batch culture, in contrast, yielded more specialized mutants with highly improved (up to
150-fold) resistances to oxidative and freezing stresses. These results suggest a
combination of selection in batch and transient stress challenges in a chemostat as most
appropriate for obtaining further improved multiple-stress resistant S. cerevisiae.

7
ZUSAMMENFASSUNG
Das Ziel dieser Doktorarbeit war die Untersuchung zellulärer Eigenschaften, die für das
'Metabolie Engineering' von Hefe bedeutsam sind: intrazelluläre Kohlenstoffflüsse,
Nebeneffekte auxotropher Marker und die Möglichkeit, Mutanten zu isolieren, die gegen
mehrere Stressbedingungen resistent sind. Zu diesem Zweck wurden diverse neue
Methoden für die Anwendung in Hefe adaptiert. Sowohl die Methoden als auch die
erzielten Ergebnisse ermöglichen die Verbesserung zukünftiger'Metabolic Engineering'
Strategien.
Zunächst beschreiben wir eine 'Metabolie Engineering' Strategie zur Verbesserung
des Energiemetabolismus der Hefe durch Ueberexpression von Kreatinkinasen, wichtiger
Enzyme des Energiemetabolismus in höheren Eukaryonten. Trotz früherer Berichte, dass
Kreatinkinase-exprimierende Saccharomyces cerevisiae Kroatin aufnehmen und
Phosphokreatin bilden können, zeigen unsere in vivo '"P-NMR und Inhibitordaten, dass
solche Zellen kein Phosphokreatin bilden, wahrscheinlich wegen eines fehlenden
Transportsystems. Zur Etablierung eines funktionellen Kreatinkinasesystems sind daher
weitere Veränderungen der Hefe notwendig. Diese sollten entweder die intrazelluläre
Biosynthese von Kreatin oder dessen Transport ermöglichen.
Im zweiten Teil modifizieren wir eine neue Methode zur Abschätzung der
intrazellulären Kohlenstoffflüsse für die erstmalige Anwendung in Hefe. Diese Methode
basiert auf der Kombination von klassischen Flussbilanzierungen und NMR Analyse von
"C markierten Aminosäuren. Die ermittelten, umfangreichen Daten ermöglichen auch die
Berücksichtigung der Komparlmentalisierung der Hefezelle in unserem Modell und.
anders als in bisherigen Modellen, die Gewinnung von Informationen über die
Lokalisierung von bestimmten Metabolitenpools. Modell und Analyse erlaubten uns einen
tieferen Einblick in die metabolischen Unterschiede zwischen den Hefen Saccharomyces
und Pichia zu erhalten. Die Ergebnisse zeigen insbesondere deutlich höhere
Kohlenstoffflüsse durch den Pentose Phosphat Weg von Pichia. Eine mögliche Erklärung
für diesen Unterschied ist die Präsenz einer Transhydrogenase oder Transhydrogenase-
ähnlichen Aktivität in Pichia und deren Abwesenheit in Saccharomyces. Weiterhin
erlauben unsere Ergebnisse den Schluss, dass die Reaktionen der Transaldolase und
Transketolase, möglicherweise in Kombination mit der Transhydrogenase, in S.
cerevisiae stärker exprimiert werden müssen, um Alkohol aus Xylose zu produzieren.
Drittens zeigen wir, das auxothrophe Hefe Mutanten häufig unbeachtete
physiologische Veränderungen zeigen. Durch morphologische Analysen mit 'Advanced
High Pressure Freezing-Freeze Substitution' und Transmissions Elektronenmikroskopie,
konnten wir zeigen, class die Vakuolenmorphologie, der Zcllzyklus und die
Aminosäureverfügbarkeit in auxotrophen Hefestämmen in einem Zusammenhang stehen.
Diese Technik zur Probenvorbereitung konnte bisher noch nicht erfolgreich in Hefe

8
angewendet werden. Unsere Ergebnisse zeigen, dass physiologische Effekte von
auxotrophen Mutationen mit morphologischen, Zellzyklus- und 'Metabolie Engineering'
Experimenten interferieren.
Viertens beschreiben wir eine Strategie zur Selektion von S. cerevisiae Mutanten,
die gegen mehrere Stressbedingungen resistent sind. Zu diesem Zweck wurden diverse
Batch und Chemostat Selektion sverfahren auf ihre Tauglichkeit hin untersucht. Die
Ergebnisse zeigen, dass Chemostaten mit kurzzeitigen Stressbedingungen auf Mutanten
selektionierten, die bis zu 10-fach erhöhte Resistenz gegenüber oxidativem, Gefrier- und
Alkoholstress als der Elternstamm zeigen. Batchverfahren dagegen selektionierten
Mutanten mit bis zu 150-fach höherer Resistenz gegenüber oxidativem und Gefrierstress.
Die Ergebnisse erlauben den Schluss, dass Mutanten mit Mehrfachstressresistenzen am
Besten durch eine Kombination von Selektionsverfahren in Batch und Chemostat mit
kurzzeitigen Stressbedingungen zu erhalten sind.

9
Chapter 1
General Introduction

10
METABOLIC ENGINEERING
Living cells have evolved in natural settings and are generally not optimized for objectives
relevant to biotechnology. Thus, development and improvement of biotechnological
processes often necessitates substantial restructuring of cellular metabolism. Improvement
of cellular functions by recombinant DNA technology has been termed metabolic
engineering (Bailey, 1991). The classical approach of metabolic engineering follows a
rational, deductive strategy, which is usually based on knowledge of the metabolic system
of interest and a proposed, more or less defined genetic manipulation towards a desired
objective. However, this endeavor has often been hampered by the need for extensive
information on the target metabolic system. In contrast to this constructive metabolic
engineering, the term inverse metabolic engineering has recently been introduced to
describe an alternative approach (Bailey et al., 1996). In this approach, the elucidation of
a metabolic engineering strategy proceeds through three distinct phases: first,
identification of a desired phenotype; second, determination of factors that confer that
phenotype; and third, transferring the basis of that phenotype to the organism of choice.
The obvious potential advantage is based on the initiation of the optimization process with
a known, desirable phenotype. A prime example of inverse metabolic engineering is the
successful improvement of energetic efficiency of microaerobic respiration by
heterologous expression of a bacterial hemoglobin (Khosla and Bailey, 1988; Khosla et
al., 1990). This example addresses a key problem in microbial fermentation processes,
the influence of cellular energetics on biotechnological product formation (Stouthamer and
van Verseveld, 1987).
ENGINEERING YEAST ENERGY METABOLISM
The yeast Saccharomyces cerevisiae is one of the most important biotechnological
microorganisms and therefore also a prime target for metabolic engineering. The
worldwide baker's yeast (S. cerevisiae) industry produces more than 2 million tons of
yeast per year. It is currently expanding at about 4% per year owing to the increasing
population, industrialization and dietary changes (Trivedi, 1986). Wide application of S.
cerevisiae in traditional biotechnologies like baking, brewing, distiller's fermentations and
wine making, emphasizes the industrial importance of this organism (Attfield, 1997).
Since the early 1980s, 5*. cerevisiae has also been used for the large-scale production of
intracellular and extracellular proteins of human, animal, and plant origin (Romanos et al.,
1992). The yeast expression systems for heterologous protein production as well as the
external conditions are usually optimized to obtain a high yield of the heterologous protein
of interest. A typical example is proinsulin production by S. cerevisiae, where host cell
properties and external pH were found to have an effect on proinsulin production (Kozlov
et al., 1995). Additionally, S. cerevisiae is a traditional microorganism used for ethanol
11
fermentation. The increasing demand for ethanol as a substitute for gasoline requires the
development of lower-cost feedstocks like lignocellulosic ones, which are sufficient to
substitute for corn starch (Hacking et al., 1986). Genetic engineering of S. cerevisiae for
pentose utilization is an important research target for this purpose. The familiarity and
experience of the corn processing industry with yeast fermentations and the potential
robustness of the organism makes S. cerevisiae most attractive to the corn processing
industry (Bothast et al, 1999).
When yeasts are used in these biotechnological processes, however, they have to
endure various environmental stresses like nutrient limitation, elevated temperatures and
oxidation. Since they respond to these stresses by signal transduction, transcriptional and
post-translational control, protein-targeting to organelles and activation of repair
functions, which are all energy-requiring cellular activities, they have higher energy
requirements under stress conditions (Attfield, 1997). As a consequence, cells must use
ATP to expel protons via plasma membrane H'-ATPase activity. Cell survival might
therefore be determined by the balance between maintenance of intracellular ATP levels
for repair, growth and ATP expenditure for pH homeostasis.
The heterologous expression of the bacterial hemoglobin (VHb) in S. cerevisiae is
a successful example of metabolic engineering to improve yeast energetics. Upon growth
on acetaldehyde, there has been a 3-fold increase in the final cell density of the VHb-
expressing S. cerevisiae compared to its control (Chen et al., 1994).
Another potentially relevant target for improving energy metabolism is creatine
kinase (CK), a key enzyme in energy metabolism of excitable cells and tissues of
vertebrate species, that appears to play a complex, multifaceted role in energy homeostasis
(WaUimann et al., 1992). As a main function, it catalyzes the reversible phosphorylation
from ATP to phosphocreatine (PCr), which serves as an energy-storage metabolite. Thus,
the readily accessible phosphorylation potential of PCr can be used to regenerate ATP, by
functioning as a temporal energy buffer. The CK system also functions as an energy
transport system by connecting sites of energy production with sites of energy utilization
and thus maintains a high intracellular ATP-to-ADP ratio. Additionally, as the CK
reaction in the direction of ATP synthesis utilizes one proton, it serves as a pH-buffering
function, thus counteracting the intracellular acidification. Therefore, the installation of a
CK-PCr circuit in yeast seems to have potential to be beneficial to energy metabolism,
either by improving overall efficiency, or by the 'energy buffer' function during transient
stress conditions. Transient stress conditions occur very commonly in industrial fed-batch
cultivations of S. cerevisiae. A typical example is short-term glucose fluctuations during
large-scale fed-batch cultivations (Neubauer et al., 1995a). Since these short-term stresses
influence cellular physiology and growth, their reduction is crucial for the process

12
performance (Neubauer et al, 1995b). The investigation of the CK-PCr circuit in yeast
are reported in Chapter 2.
METABOLIC ENGINEERING OF YEAST CENTRAL CARBON
METABOLISM
Studies on Xylose Utilization and Pentose Phosphate Pathway
In addition to yeast energy metabolism, central carbon metabolism is also an important
target for metabolic engineering, because it will eventually limit production, once the
biosynthetic branches are optimized. Several groups have been working on the
improvement of yeast central carbon metabolism for the production of various
compounds. Some efforts are directed towards introduction of features from other yeasts,
mostly utilization of certain sugars. It is known, for example, that the yeast Pichia stipitis
can grow on pentoses like xylose. S. cerevisiae, however, cannot utilize xylose
(Walfridsson et al., 1995). However, for the production of fuel ethanol from lower-cost
feedstocks, which are the lignocellulosic ones, utilization of pentose sugars like xylose is
necessary. Although P. stipitis can grow on xylose, it cannot produce ethanol. Xylose is
derived from the hemicellulose component of lignocelluloses (Bothast et al., 1999). For
the purpose of xylose utilization, S. cerevisiae was metabolically engineered by cloning
the P. stipitis genes XYLI and XYL2 encoding xylose reductase and xylitol
dehydrogenase. These two enzymes catalyze the initial steps in xylose utilization, which
do not exist in wild type S. cerevisiae. Additionally, the S. cerevisiae TKL1 and TALI
genes encoding transketolase and transaldolase were overexpressed, to improve pentose
phosphate pathway utilization. The results showed that XYLI- and X)/L2-expressing S.
cerevisiae that co-overexpresses TALI had considerably enhanced growth on xylose
compared to a strain expressing only XYLI and XYL2. From these data, it was
concluded that the insufficient transaldolase levels cause the inefficient utilization of
pentose phosphate pathway in S. cerevisiae (Walfridsson et al., 1995). Some aspects of
this problem are discussed in Chapter 3.
Studies on Glycolysis
As the central pathway of carbon metabolism, glycolysis is the prime route to the most
important yeast product, ethanol. There have been several attempts to metabolically
engineer yeast glycolysis by modifying various enzymes, especially those known as 'rate
limiting'. Atypical example is overexpression of eight different enzymes of glycolysis
and alcoholic fermentation in S. cerevisiae including hexokinase, phospholructokinase
and pyruvate kinase, which catalyze irreversible reactions (Schaaff et al., 1989).
However, this overexpression had no effect on ethanol production rate. Additionally,
simultaneous increases in the activities of enzyme pairs like pyruvate kinase and
phospholructokinase, or pyruvate decarboxylase and alcohol dehydrogenase, did not

13
increase the ethanol formation rate, either (Schaaff et al., 1989). In a former study,
however, a higher yield of ethanol was found in mutants overexpressing both pyruvate
decarboxylase and alcohol dehydrogenase (Sharma and Tauro, 1986). But these two
results are not comparable, since the latter was based on stationary phase-cells that were
grown anaerobically. It was concluded that the control of fluxes or metabolite
concentrations was generally shared among all enzymes, and only under specific
conditions certain enzymes assume a higher control than the others (Schaaff et al., 1989).
A later study of glycolysis mutants of S. cerevisiae revealed that in these mutants,
induction of pyruvate decarboxylase is correlated with the concentrations of three-carbon
glycolytic metabolites (Boles and Zimmermann, 1993). Characterization of some
glycolytic enzymes was also done in S. cerevisiae like the glucose-repressed pyruvate
kinase (Pyk2p), which was shown to be catalytically insensitive to fructose-1,6-
bisphosphate, and may be used under conditions of very low glycolytic flux (Boles et al.,
1997). In a different study, the energetic aspects of glucose metabolism were investigated
in a pyruvate-dehydrogenase-negative mutant of S. cerevisiae. It was found that, during
aerobic glucose-limited growth of S. cerevisiae at low growth rates, the pyruvate
dehydrogenase complex accounts for the major part of the pyruvate flux (Pronk et al.,
1994).
Studies on Byproduct Formation
Pyruvate decarboxylase is a key enzyme for the production of low-molecular-weight
byproducts (ethanol, acetate) in biomass-directed applications of S. cerevisiae (Flikweert
et al., 1999). Pyruvate is the branch point between respiration and fermentation. Foi-
respiration, pyruvate must be oxidatively decarboxylated to acetyl coenzyme A, a reaction
catalyzed by the mitochondrial pyruvate dehydrogenase complex. Alcoholic fermentation,
however, requires pyruvate decarboxylation to acetaldehyde by the cytosolic pyruvate
decarboxylase. In order to reduce byproduct formation in industrial fermentations,
pyruvate-decarboxylase deficient mutants were constructed and their physiology was
investigated extensively. These studies showed that the mitochondrial pyruvate
dehydrogenase complex cannot function as the sole carbon source of acetyl-CoA during
growth of S. cerevisiae on glucose, neither in glucose-limited chemostats nor in batch
cultures (Flikweert et al., 1996). In a similar study, the metabolic responses of pyruvate-
decarboxylase-negative S. cerevisiae to glucose excess was investigated. It was
concluded that reoxidation of cytosolic NADH via pyruvate decarboxylase and alcohol
dehydrogenase is a prerequisite for high glycolytic fluxes in 5. cerevisiae (Flikweert et
al., 1997). In a more detailed analysis of steady-state and transient-state growth and
metabolite production in a S. cerevisiae strain with reduced pyruvate decarboxylase
activity, it was found that inactivation of PDC2 gene, which encodes a positive regulator
of pyruvate decarboxylase synthesis, is not a viable option for reducing byproduct
14
formation in industrial fermentations. This conclusion resulted from the observation that
the pyruvate-decarboxylase deficient mutants had low maximum growth rates (finux) in
glucose-limited chemostat cultures, showing that the respiro-fermentative metabolism in
wild-type cultures is not only caused by the competition of respiration and fermentation
for pyruvate (Flikweert et al., 1999).
There are also pyruvate decarboxylase overexpression studies, which, in contrast
to pyruvate-decarboxylase deficient mutant studies, aimed at increasing the glycolytic flux
to ethanol. These studies showed that pyruvate decarboxylase overproduction influenced
flux distribution at the pyruvate branch point by affecting the competition for pyruvate
between pyruvate decarboxylase and the mitochondrial pyruvate dehydrogenase complex.
In chemostat cultures, it was observed that the dilution rate at which aerobic fermentation
started decreased from 0.30 lï1 in the reference strains to 0.23 h"1 in the pyruvate
decarboxylase-overproducing strain (van Hoek et al., 1998). Additionally, it was shown
that pyruvate decarboxylase by itself does not control the specific growth rale of S.
cerevisiae on glucose, as previously concluded (Schaaff et al, 1989).
METABOLIC FLUX ANALYSIS
From the above, it becomes clear that engineering of central carbon metabolism, although
important, is difficult to do. In many cases, consequences of metabolic engineering may
have already affected the intracellular reaction rates, i. e. the metabolic fluxes, but these
effects have apparently not influenced the physiological phenotype. Hence, it would be
desirable to have an analytical tool that would allow to monitor such intracellular flux
responses. Ideally, it could also provide valuable information for choosing a subsequent
target for metabolic engineering.
Stoichiometric flux balancing is a common way to perform flux analysis. In this
method, extracellular metabolite concentrations are measured, and the fluxes through the
primary metabolic pathways are determined by means of stoichiometric balance equations
of metabolites (Vallino and Stephanopoulos, 1990). However, in most of the systems,
there are more unknown fluxes than balancing equations, which makes these systems
underdetermined. Under these conditions, extra equations like flux ratios would be
necessary, to make the system determined and therefore solvable. In the absence of such
equations, several assumptions have to be made, which might be questionable from a
biological point of view, such as the assumption that cells maximize their ATP
production.
An alternative way of determining metabolic fluxes is the use of isotopic-traccr
experiments. Certain flux ratios are determined at some branch points by tracing the
metabolic fate of carbon-labelled substrates and nuclear magnetic resonance (NMR)
technology is applied to biological systems for this purpose. It has been widely applied to
15
estimate metabolite concentrations in whole cells, cell extracts and growth media (Gadian,
1982). Biosynthetically directed fractional l3C-labeling of the common proteinogenic
amino acids is a relatively new technique for peptides and proteins to obtain 'H resonance
assignments (Szyperski et al., 1992). It can also be used to monitor the flux of
metabolites within the key metabolic pathways like glycolysis, pentose phosphate
pathway, citric acid cycle and C, metabolism (Szyperski, 1995). The method is based on
isotopic imprinting of amino acids by their precursors, which enables the direct
determination of the active central carbon pathways and the ratios of their fluxes from
two-dimensional (2D) NMR analysis of hydrolyzed cell protein (Szyperski, 1998). This
method is referred to as METAFoR (metabolic flux ratio) analysis, which can
complement the stoichiometric flux balancing approach by providing extra equations or
constraints to make the system determined (Sauer et al., 1999). This combined approach
of using METAFoR and stoichiometric flux analysis has successfully been applied to
determine the flux distributions in riboflavin-producing Bacillus subtilis (Sauer et al.,
1997).
Previous studies involving yeast flux analysis relied mainly on stoichiometric flux
balancing without independent labeling data (see, for example, Jin et al., 1997; Nissen et
al, 1997). Additionally, most of the yeast flux studies did not take compartmentalization
into account, in order to simplify their models (Vanrofieghem et al., 1996; Jin et al.,
1997).
Under these circumstances, stoichiometric flux balancing combined with
METAFoR analysis for 5. cerevisiae in a network which considers compartmentalization
would give more realistic and reliable view of the metabolic flux distribution in this
eukaryotic organism. Additionally, using this combined approach, a comparison of
metabolic flux distributions between P. stipitis and S. cerevisiae may also reveal
intracellular flux differences between these two organisms which cause the different
utilization of pentoses. This could help to identify new metabolic engineering strategies
for improving S. cerevisiae's pentose phosphate pathway utilization. These aspects and
the application of this method to yeasts are discussed in Chapter 3.
POTENTIAL PERILS OF METABOLIC ENGINEERING IN YEAST
Metabolic engineering has been successfully applied to various bioprocesses. However,
the metabolic consequences of the genetic change are usually much different from the
expected ones (Bailey, 1991). Limitations in our knowledge of metabolic networks arc
one reason for these unexpected responses. These responses are called secondary
responses to metabolic engineering (Bailey, 1996). The fact that any network considered
for metabolic engineering purposes is a subnetwork of a much more complex global
metabolic network is one of the main causes of these secondary responses. Additionally,

16
the cells' own control mechanisms, misfolding, aggregation, degradation or incorrect
localization of foreign proteins are other possibilities of secondary responses, which often
result in failure of metabolic engineering attempts (Bailey et al., 1996).
Similar problems are also encountered in yeasts. A typical example is the common
use of auxotrophic host systems with dominant selection markers like URA3, LEU2,
TRPl or HIS3. Such auxotrophic mutants may have physiological alterations and
sensitivities, which might complicate the interpretation of the effects of an introduced
genetic change. Although expected by some, these effects have never been reported and
they obscure several published data. In Chapter 4, such complications are described,
quantified and their impact on fundamental and biotechnological research is discussed.
In addition to these physiological sensitivities, auxotrophic markers may also have
morphological alterations and sensitivities which are interrelated with physiological
alterations as well as changes in cell cycle distribution, due to different levels of
auxotrophic amino acid supply. These aspects are discussed in Chapter 5.
DIRECTED EVOLUTION AND SELECTION FOR MULTIPLE-STRESS
RESISTANT YEASTS
Some of the above-mentioned problems of rational metabolic engineering may be
overcome by the alternative approach of inverse metabolic engineering (Bailey et al.,
1996). In this approach, the desired phenotype is identified or constructed first. Random
mutation and selection is the most traditional approach in order to obtain a desired
phenotype. Chemostat selection, where strains adapt to continuous cultivation conditions
with nutrient limitation, is an alternative way for strain development (Helling et al., 1987;
Weikert et al., 1997). Here the cells compete for the limiting nutrient and in response,
such populations evolve by adaptation. Such selection strategies are also named 'directed
evolution'.
The successful application of directed evolution as an inverse metabolic
engineering approach depends on the availability of an enabling technology for the
identification of a genetic basis for the selected, desirable phenotypes. To characterize the
mutants at the protein level, two dimensional gel electrophoresis (2DE) is a high-
resolution method, which allows the separation of thousands of proteins (Wilkins et al.,
1996). Alternatively, a recent technology with high-density oligonucleotide arrays allows
monitoring of global gene expression levels (Wodicka et al., 1997). In this approach,
mRNA levels are determined by hybridization of complete mRNA populations to sets of
arrays containing hundreds of thousands of chemically synthesized oligonucleotides
(Wodicka et al., 1997). By means of this technology, mutants with the desired
phenotype(s) can be characterized and by comparison with their ancestors it may be
possible to identify the relevant genes. For biotechnological purposes, this would mean

17
that certain strain improvements could be done very efficiently by selecting for industrially
relevant characteristics of the organisms of interest and subsequent transfer of the desired
property. Until recently, improved strains were either obtained by random mutation and
selection procedures or via rational metabolic engineering. In the first approach, they were
usually characterized physiologically or morphologically. In the latter one, site-directed
mutagenesis was usually applied, which was not very efficient, since multiple genes or
gene families are usually involved in the expression of a phenotype. Therefore, deleting
or overexpressing one or few genes is usually not sufficient to achieve a desired, often
complex phenotype.
During growth in large-scale bioreactors, yeast cells are faced with several stresses
like oxidative stress, temperature changes, organic acids, alcohols and nutrient limitation.
Additionally, during storage and in frozen dough technology, yeasts are also exposed to
freezing stress. Thus, it would be desirable to obtain yeast cells that are resistant to
multiple stresses (Singer and Lindquist, 1998).
In Chapter 6, directed evolution is used to improve 5. cerevisiae's multiple-
stress resistance. Additionally, various chemostat and batch selection strategies employed
for obtaining multiple-stress resistant yeast strains are compared in that Chapter, to
provide guidance for further selection schemes. Successfully selected mutants were
subjected to global transcript analysis to identify the relevant mutations.
AIM AND SCOPE OF THIS THESIS
In this thesis, several new technologies were applied to yeast and yeast metabolic
engineering. The aim of this thesis was to improve the general understanding of various
aspects of yeast carbon and energy metabolism, physiology, morphology and genetics,
with a particular emphasis on metabolic engineering. In light of the reported results,
future metabolic engineering of yeast can be done more efficiently in certain cases and
some pitfalls may be avoided.
To be more precise, the most important new technologies successfully applied to
yeast throughout this study are listed below. Firstly, the novel and elaborate high pressure
freezing-freeze substitution techniques for transmission electron microscopy were applied
to yeast for the first time, revealing important morphological differentiations in the
vacuoles of auxotrophic revertants, compared to the wild-type strains. This was
previously not known, and supported our data on physiological differences between
auxotrophic mutants and their corresponding wild-type strains.
The first application of a new flux analysis technology to yeast was also done in
this study by combining the traditional metabolic flux balancing approach with NMR-
tracing of nC-labeled proteinogenic amino acids, the so-called METAFoR analysis.
Additionally, the compartmentalization in yeast was taken into account in our flux model,

18
an aspect that was neglected in many former yeast flux studies. This model and the
generated data were used to understand the differences between the metabolism of Pichia
and Saccharomyces yeasts, especially regarding pentose phosphate pathway utilization.
Additionally, the state-of-the-art DNA array technology was applied for the first
time to analyze mutants from a directed evolution selection, This directed evolution study
plays also a pioneering role, because no previous data were available on obtaining
multiple-stress resistant yeasts.
Following the general introduction given here in Chapter 1, metabolic
engineering of yeast energy metabolism by overexpression of creatine kinase is described
in Chapter 2. Investigation of the metabolic fluxes in S. cerevisiae and P. stipitis is
demonstrated in Chapter 3. Chapters 4 and 5 focus on problems related to the
application of rational metabolic engineering in S. cerevisiae, emphasizing the
physiological, morphological, and cell cycle-level alterations in auxotrophic yeast
expression systems. Chapter 6 introduces directed evolution as an inverse metabolic
engineering approach, which was successfully used for the selection of multiple-stress
resistant S. cerevisiae mutants in batch and chemostat cultures. A summary of the main
results as well as future prospects are given as general conclusions in Chapter 7.

19
REFERENCES
Attfield, P. V. 1997. Stress tolerance: the key to effective strains of industrial baker's
yeast. Nature Biotechnol. 15: 1351-1357.
Bailey, J. E. 1991. Toward a science of metabolic engineering. Science 252: 1668-1675.
Bailey, J. E., Sburlati, A., Hatzimanikatis, V., Lee, K., Renner, W. A., Tsai, P. S.
1996. Inverse metabolic engineering: a strategy for directed genetic engineering of
useful phenotypes. Biotechnol. Bioeng. 52: 109-121.
Boles, E., Zimmermann, F. K. 1993. Induction of pyruvate decarboxylase in glycolysis
mutants of Saccharomyces cerevisiae correlates with the concentrations of three-carbon
glycolytic metabolites. Arch. Microbiol. 160: 324-328.
Boles, E., Schulte, F., Miosga, T., Freidel, K., Schlüter, E., Zimmermann, F. K.,
Hollenberg, C. P., Heinisch, J. J. 1997. Characterization of a glucose-repressed
pyruvate kinase (Pyk2p) in Saccharomyces cerevisiae that is catalytically insensitive to
fructose-1,6-bisphosphate. J. Bacteriol. 179: 2987-2993.
Bothast, R. J., Nichols, N. N., Dien, B. S. 1999. Fermentations with new recombinant
organisms. Biotechnol. Prog. 15: 867-875.
Chen, W., Hughes, D. E., Bailey, J. E. 1994, Intracellular expression of Vitreoscilla
hemoglobin alters the genetic metabolism of Saccharomyces cerevisiae. Biotechnol.
Prog. 10: 308-313.
Flikweert, M. T., Van Der Zanden, L., Janssen, W. M., Steensma, H. Y., Van Dijken,
J. P., Pronk, J. T. 1996. Pyruvate decarboxylase: an indispensible enzyme for growth
of Saccharomyces cerevisiae on glucose. Yeast 12: 247-257.
Flikweert, M. T., van Dijken, J. P., Pronk, J. T. 1997. Metabolic responses of pyruvate
decarboxylase-negative Saccharomyces cerevisiae to glucose excess. Appl. Environ.
Microbiol. 63: 3399-3404.
Flikweert, M. T., Kuyper, M., van Maris, A. J., Kolter, P., van Dijken, J. P., Pronk, J.
T. 1999. Steady-state and transient state analysis of growth and metabolite production
in a Saccharomyces cerevisiae strain with reduced pyruvate-decarboxylase activity.
Biotechnol. Bioengin. 66: 42-50.
Gadian, D. G. 1982. Nuclear magnetic resonance and its applications to living systems.
Oxford University Press, Oxford.
Hacking, A. J. 1986. Economic aspects of biotechnology, Cambridge University Press,
Cambridge, U.K., pp. 74-92.
Helling, R. B., Vargas, C. N., Adams, J. 1987. Evolution of Escherichia coli during
growth in a constant environment. Genetics 116: 349-358.
Jin, S., Ye, K., Shimizu, K. 1997. Metabolic flux distributions in recombinant
Saccharomyces cerevisiae during foreign protein production. J. Biotechnol. 54: 161-
174.

20
Khosla, C, Bailey, J. E., 1988. Heterologous expression of a bacterial haemoglobin
improves the growth properties of recombinant Escherichia coli. Nature 331: 633-635.
Khosla, C, Curtis, J. E., De Modena, J., Rinas, U., Bailey, J. E. 1990. Expression of
intracellular hemoglobin improves protein synthesis in oxygen-limited Escherichia coli.
Bio/Technol. 8: 849-853.
Kozlov, D. G., Prahl, N., Efremov, B. D., Peters, L., Wambut, R., Karpychev, I. V.,
Eldarov, M. A., Benevolensky, S. V. 1995. Host cell properties and external pH affect
proinsulin production by Saccharomyces yeasts. Yeast 11: 713-724.
Neubauer, P., Ahman, M., Tornkvist, M., Larsson, G., Enfors, S. O. 1995a. Response
of guanosine tetraphosphate to glucose fluctuations in fed-batch cultivations of
Escherichia coli. J. Biotechnol. 43: 195-204.
Neubauer, P., Haggstrom, L., Enfors, S. O. 1995b. Influence of substrate oscillations
on acetate formation and growth-yield in Escherichia coli glucose-limited fed-batch
cultivations. Biotechnol. Bioengin. 47: 139-146.
Nissen, T. L., Schulze, U., Nielsen, J., Villadsen, J. 1997. Flux distributions in
anaerobic, glucose-limited continuous cultures of Saccharomyces cerevisiae.
Microbiol. 143: 203-218.
Pronk, J. T., Wenzel, T. J., Luttik, M. A., Klaassen. C. C, Scheffers, W. A.,
Steensma, H. Y., van Dijken, J. P. 1994. Energetic aspects of glucose metabolism in a
pyruvate-dehydrogenase-negative mutant of Saccharomyces cerevisiae. Microbiol.
140: 601-610.
Romanos, M. A., Scorer, C. A., Clare, J. J. 1992. Foreign gene expression in yeast: a
review. Yeast 8: 423-488.
Sauer, U., Hatzimanikatis, V., Bailey, J. F., Hochuli, M., Szyperski, T., Wüthrich, K.
1997. Metabolic fluxes in riboflavin-producing Bacillus subtilis. Nature Biotechnol.
15: 448-452.
Sauer, U., Lasko, D. R, Fiaux, J., Hochuli. M., Glaser, R., Szyperski, T., Wüthrich,
K., Bailey, J. E. 1999. Metabolic flux ratio (METAFoR) analysis of genetic and
environmental modulations of Escherichia coli central carbon metabolism. J. Bacteriol.
181: 6679-6688.
Schaaff, I., Heinisch, J., Zimmermann, F. K., 1989. Overproduction of glycolytic
enzymes in yeast. Yeast 5: 285-290.
Sharma, S., Tauro, P. 1986. Control of ethanol production by yeast: role of pyruvate
decarboxylase and alcohol dehydrogenase. Biotech. Lett. 8: 735-738.
Singer, M. A., Lindquist, S. 1998. Thermotolerance in Saccharomyces cerevisiae: the
Yin and Yang of trehalose. Trends Biotechnol. 16: 460-468.

21
Stouthamer, A. H., van Verseveld, H. W. 1987. Microbial energetics should be
considered in manipulating metabolism for biotechnological purposes. Trends-
Biotechnol. 5: 149-155.
Szyperski, T., Neri, D., Leiting, B., Otting, G., Wüthrich, K. 1992. Support of 'H-
NMR assignments in proteins by biosynthetically directed fractional nC-labeling. J.
Biomol. NMR 2: 323-334.
Szyperski, T. 1995. Biosynthetically directed fractional nC-labelling of proteinogenic
amino acids. An efficient analytical tool to investigate intermediary metabolism. Eur. J.
Biochem. 232: 433-448.
Szyperski, T. 1998. nC-NMR, MS and metabolic flux balancing in biotechnological
research. Q. Rev. Biophys. 31: 41-106.
Trivedi, N. B. 1986. Bakers' yeast. CRC dit. Rev. Biotechnol, 4: 75-109.
Vallino, J. J., Stephanopoulos, G. 1990. Flux determinations in cellular bioreaction
networks: application to lysine fermentations. In Frontiers in Bioprocessing (eds. S.
K. Sikdar, M. Bier, P. Todd), pp. 205-219, CRC Press, Boca Raton.
van Hoek, P., Flikweert, M. T., van der Aart, Q. J., Steensma, H. Y., van Dijken, J.
P., Pronk, J. T. 1998. Effects of pyruvate decarboxylase overproduction on flux
distribution at the pyruvate branch point in Saccharomyces cerevisiae. Appl. Environ.
Microbiol. 64: 2133-2140.
Vanrolleghem, P. A., de Jong-Gubbels, P., van Gulik, W. M., Pronk, J. T., van
Dijken, J. P., Heijnen, S. 1996. Validation of a metabolic network for Saccharomyces
cerevisiae using mixed substrate studies. Biotechnol. Prog. 12: 434-448.
Walfridsson, M., Hallborn, J., Penttila, M., Keranen, S., Hahn-Hagerdal, B. 1995.
Xylose-metabolizing Saccharomyces cerevisiae strains overexpressing the TKL1 and
TALI genes encoding the pentose phosphate pathway enzymes transketolase and
transaldolase. Appl. Environ. Microbiol. 61: 4184-4190.
WaUimann, T., Wyss, M., Brdiczka, D., Nicolay, K., Eppenberger, H. M. 1992.
Intracellular compartmentation, structure and function of creatine kinase isoenzymes in
tissues with high and fluctuating energy demands: the 'phosphocreatine circuit' for
cellular energy homeostasis. Biochem. J. 281: 21-40.
Weikert, C, Sauer, U., Bailey, J. E. 1997. Use of a glycerol-limited, long-term
chemostat for isolation of Escherichia coli mutants with improved physiological
properties. Microbiol. 143: 1567-1574.
Wilkins, M. R., Pasquali, C, Appel, R. D., Ou, K., Golaz, O., Sanchez, J. C, Yan, J.
X., Gooley, A. A., Hughes, G., Smith, I. H., Williams, K. L., Ilochstrasser, D. F.
1996. From proteins to proteomes: large scale protein identification by two-
dimensional electrophoresis and amino acid analysis. Nature Biotechnol. 14: 61-65.

22
Wodicka, L., Dong, H., Mittmann, M., Ho, M.-H., Lockhart, D. J. 1997. Genome-
wide expression monitoring in Saccharomyces cerevisiae. Nature Biotechnol. 15:
1359-1367.

23
Chapter 2
Improving
Yeast Energy Metabolism
by Overexpression of Creatine Kinase?

24
SUMMARY
As a key enzyme of energy metabolism in excitable cells and tissues of vertebrate species,
creatine kinase plays a complex role in energy homeostasis. It increases the efficiency of
cellular energetics and connects sites of energy production with sites of energy utilization.
The cytosolic brain-type (B-CK) and the mitochondrial (Mib-CK) isoforms of chicken
creatine kinase were functionally expressed in Saccharomyces cerevisiae, which normally
does not contain this enzyme. Growth physiological analysis showed that neither B-CK
nor Mib-CK expression had any effect on yeast growth and/or byproduct formation.
Additionally, the potential effects of co-overexpression of B-CK on heterologous protein
production were investigated in yeast. For this purpose, a set of constitutive and
galactose-inducible vectors encoding the bovine pancreatic trypsin inhibitor (BPTI) gene
were transformed into both B-CK-expressing hosts and their controls, which did not
express B-CK. The results revealed that, in high-level expression systems, where BPTI
production was induced by galactose, B-CK co-overexpression did not have any effect on
BPTI production. Despite a previous report that recombinant S. cerevisiae cells
expressing rabbit muscle type creatine kinase can form phosphocreatine (PCr) upon
incubation with creatine, our in vivo ,lP-NMR analysis of intracellular PCr indicated that
the substrate of CK, which is PCr, is not available intracellularly in yeast. Therefore, in
its existing form, the CK system is not functioning in S. cerevisiae. In this respect, the up
to 3-fold increase in the secreted BPTI concentration upon co-overexpression of B-CK in
constitutive BPTI expression systems is a secondary effect, and is not related to CK-
activity. Thus, the installation of a functional creatine kinase system in yeast requires
further metabolic engineering of either intracellular creatine biosynthesis or creatine
uptake.

25
INTRODUCTION
Accessible chemical energy is crucial for most basic cell functions, and is an absolute
requirement for many metabolic processes that are relevant to biotechnology. Excitable
cells and tissues of vertebrate species, with large bursts of energy utilization (e.g.,
skeletal muscle fibers and neurons), exploit an energy buffering and transport system
based on creatine kinase (CK) (WaUimann et al, 1992). As its main function, CK
catalyzes the reversible transfer of the phosphoryl group from ATP to phosphocreatine
(PCr), which serves as an energy-storage metabolite. Thus, the readily accessible
phosphorylation potential of PCr can be used to regenerate ATP by functioning as an
immediate temporal energy buffer on a sub-second time scale.
There are several additional functions of CK-PCr system that have potential for a
positive contribution to applied bioprocesses (WaUimann et al., 1992; WaUimann, 1994):
1) There is accumulating evidence for an 'energy carrier' function that connects
energy producing and consuming sites via subcellular compartmentalized CK
isoenzymes.
2) By functional coupling of CK to ATP-consuming processes it provides
appropriate local ATP-to-ADP ratios at subcellular sites. This is especially
important for the energetically demanding Ca"*+-pump ATPase, as shown by the
significantly altered Ca++ response in muscles of a M-CK/Mi-CK double knockout
mouse (Steeghs et al., 1997).
3) By stabilization of the intracellular ATP-to-ADP ratio, which is a key regulator
in many fundamental metabolic processes, overshoot responses can be avoided.
4) As the CK reaction in the direction of ATP synthesis utilizes one proton, it
serves a pH buffering function, thus counteracting the intracellular acidification.
5) The release of inorganic phosphate (P,) is also a metabolic function of the CK-
PCr system. Since net PCr hydrolysis is the major P, source, and since P, is
necessary for glycolysis and glycogenolysis, CK has an indirect regulatory effect
in muscles which depend on glycogenolysis.
The CK system, which evolved in higher organisms to optimize the link between
energy production and utilization, does not exist in prokaryotes or lower eukaryotic
microorganisms (Stryer, 1988). However, the possibility that the CK system could, if
artificially introduced, show beneficial effects on energy metabolism of mitochondria-
carrying microorganisms, has generated our interest. The fact that the presence of the CK-
PCr system in a cell can improve the efficiency of ATP hydrolysis and thus the energy
metabolism during transient periods as well as on a sustained level may also be true for
yeast. Such an energetic benefit may be exploited for biotechnological processes that
impose heavy energetic demands on cultivated cells. Firstly, the 'energy buffer' function
of CK-PCr system could have beneficial effects on yeast cells which undergo various

26
transient stress conditions during industrial bioprocesses like aerobic fed-batch, the
method employed to produce baker's yeast, in which molasses are used as the sugar
source. The fed-batch process requires the addition of incremental amounts of a sugar
source and supplementation with nitrogen and phosphate sources, as well as some
vitamins and minerals. It is limited by the aeration capacity of the fermenter system. The
accumulation of some molass components like organic acids, aldehydes, ketones and S02
during the fed-batch process also cause stressful conditions as growth inhibitors (Attfield,
1997). Secondly, even a few per cent increase in the overall energetic efficiency by
linking cytosolic and mitochondrial sites of energy utilization and generation, would
improve yeast energy metabolism significantly.
In this study, the cytosolic brain type (B-CK) and the mitochondrial (Mib-CK)isoforms of creatine kinase from chicken have been functionally expressed in
Saccharomyces cerevisiae, which is an important host for many traditional
biotechnological applications and also for heterologous protein production, because of its
advantages of rapid growth and ease of genetic manipulation, as well as its ability to post-
translationally modify proteins. Additionally, the fact that wild-type S. cerevisiae does not
have the CK system could help to better understand the complex mechanism of this
system. In a previous study, the muscle isoform of rabbit CK (M-CK) was successfully
expressed in S. cerevisiae and the functionality of the system was verified by the detection
of PCr with in vivo MP-NMR upon feeding the cells with creatine, the substrate of the
CK reaction (Brindle et al, 1990). This also suggests that S. cerevisiae would be an ideal
host for this study. Here we investigate the effects of CK overexpression on growth
physiology and recombinant protein production in S. cerevisiae.
27
MATERIALS AND METHODS
Strains and Plasmids
Genetic constructions of CK vectors were performed using Escherichia coli strain BMH
71-18 and S. cerevisiae strain PJ17-6A (MATa, trpl-1, ura3-l, ade2-l, lys2-l, met4-l,
can!-100, gallO-1, his5-2, leu2-l) (James and Hall, 1990). All physiological analyses
were conducted with the S. cerevisiae strains CBS7752 (MATa, ura3-52, leu2-3/112,
trpl), Centraalbureau voor Schimmelcultures (Delft, the Netherlands) and INVSC1
(MATa, ura3-52, his3-Al, leu2-3/112, trpl-289), Invitrogen BV (Leek, the
Netherlands). The constitutive yeast expression vectors pAAH5 (Ammerer, 1983) and
YEP24 (Botstein et al, 1979), which are S. cerevisiae-E. coli shuttle vectors, were used
for B-CK and Mib-CK-expressing constructs, respectively. For secreted BPTI
expression, three different yeast-E. coli shuttle vectors all carrying the BPTI gene together
with the URA3 and AmpR selection markers were employed, which were kindly provided
by Prof. Dane Wittrup (Dept. of Chemical Engineering, Univ. of Illinois, Urbana, USA):
pEB311U, with the constitutive GPD promoter, episomal; pCB216U, with the galactose-
inducible GALi-promoter, centromeric; and pEB316U, with the galactose-inducible
GALi-promoter, episomal.
DNA Manipulations
A constitutive expression plasmid for the cytosolic brain-type isoform of creatine kinase
(B-CK) was constructed using standard cloning protocols (Maniatis et al., 1982). The
original chicken cDNA encoding the B-CK gene was a generous gift from Prof. J. C.
Perriard, Institute of Cell Biology, ETH Zürich, Switzerland. In chicken, two distinct B-
CK isoforms exist (Ba- and B^-CK), which are formed by alternative splicing of a unique
B-CK gene (Wirz et al., 1990) and each subspecies dimerizes in a tissue-specific manner
(Quest et al., 1990). In this study, we have expressed the Bb-CK sub-type isoform in
yeast, and in the text we refer to this enzyme as B-CK. Using site-directed mutagenesis, a
HindlU site was created 17 bp upstream of the ATG start codon of the B-CK-coding
sequence (Furter-Graves, personal communication). This construction allowed cloning of
the B-CK gene as a HindlU fragment into the unique //mdlll site of the yeast expression
vector pAAH5 (Furter-Graves, personal communication). In the resulting plasmid,
FG12, the B-CK gene is expressed under the control of the constitutive ADHl promoter
and terminator. For the construction of Mi-CK vector, the Mi-CK gene was fused with
the S. cerevisiae cytochrome ct presequence for mitochondrial targeting (Hossle et al.,
1988). The fused sequences were inserted into the ADHl expression cassette foi-
constitutive expression from YEP24 containing the URA3 selection marker. The resulting
plasmid was called FG8, and correct processing was verified by N-terminal sequencing
of the purified Mi-CK from transformed yeast. The so-called 'double construct', co-
expressing B-CK and Mi-CK, was created by co-transforming S. cerevisiae with both B-
28
CK and Mi-CK vectors. For transformation of yeast cells, electroporation was used as
reported previously with minor modifications (Becker et al, 1990). Transformants were
selected by means of the LEU-marker on the plasmids pAAH5 and FG12, and the URA-
marker on YEP24, FG8, and the BPTI-expressing plasmids.
Growth Media and Culture Conditions
For cultivations during the genetic constructions, LB-medium (10 g/L tryptone, 5 g/L
yeast extract, and 10 g/L NaCl) was used for E. coli, and YPD-medium (10 g/L yeast
extract, 20 g/L peptone, and 20 g/L dextrose) for S. cerevisiae. For selection in E. coli,
ampicillin was added to a final concentration of 100 ug/mL. For physiological
experiments, yeast minimal medium (YMM), containing 6.7 g/L yeast nitrogen base
without amino acids (Difco) and 1% (w/v) glucose was used.
BPTI production was investigated in YMM with either 1 % (w/v) glucose, or 2%
(w/v) galactose, or 2% (w/v) raffinose as the carbon source. For constitutive BPTI
expression, cultures were grown in glucose-containing YMM for 96 hours. For inducible
BPTI expression, cells were harvested by centri fligation at 3500 rpm for 10 nùn in a
benchtop centrifuge (GS-6R, Beckman) after 48 h cultivation in glucose- or raffinose-
containing YMM. The supernatants were discarded and the cells were resuspended in
galactose-containing YMM to induce expression of BPTI for the next 96 h (Parekh and
Wittrup, 1997, with slight modifications). According to the host strain's requirement,
filter-sterilized tryptophan, uracil, and/or histidine were added to a final concentration of
20 mg/L each. Leucine was supplied to a final concentration of 240 mg/L.
For creatine supplementation of the growth medium, filter-sterilized creatine was
added to a final concentration of 15 raM. In the case of cyclocreatine experiments, filter-
sterilized cyclocreatine was added to a final concentration of 10 mM. Cultivations were
performed aerobically using a rotary shaker at 30°C and 200 rpm, in 500 mL baffled
shake flasks containing 100 mL medium.
Analytical Methods
Growth was monitored spectrophotometrically by measuring the optical density of
cultures at 600 ran (OD600). For determination of cellular dry weight (cdw), Eppendorf
tubes were dried at 80°C for 48 h, cooled in a desiccator for 30 min and weighed. Two
mL aliquots of culture broth were centrifuged in these Eppendorf tubes at 3500 rpm for
10 min in a benchtop centrifuge. The resulting cell pellets were washed twice with 2 mL
deionized water and dried at 80°C for 24 h. They were then placed in a desiccator for 30
min and weighed afterwards. Total soluble protein content was determined using the
method of Bradford (1976) with bovine serum albumin (BSA) as the standard. To verify
mitochondrial targeting of Mi-CK, SDS-PAGE analysis was performed as described
previously (Laemmli, 1970).

29
Creatine Kinase Activity Determination
For determination of CK activity, lysates were prepared according to a protocol adapted
from Beggs (1978). 250 mL cultures were centrifuged at 3500 rpm for 10 min in a
benchtop centrifuge (GS-6R, Beckman). The resulting pellets were washed in deionized
water, centrifuged at 3500 rpm for 5 min, resuspended in 5 ml. freshly-prepared SEM
buffer (1 M sorbitol, 25 mM EDTA, 50 mM ß-mercaptoethanol, pH 8.0), and incubated
at 30°C for 10 min. The suspension was then centrifuged at the previous settings, washed
with 5 mL of l M sorbitol, centrifuged again, resuspended in 5.0 mL SCE buffer (1 M
sorbitol, 0.1 M sodium citrate, 0.01 mM EDTA, pH 5.8) with 25 U of lyticase (Sigma),
and incubated at 30°C for 30 min under moderate shaking. Phenylmethylsulfonylfluoride
was then added to a final concentration of 0.1 mM, and the cell suspension was sonified
on ice for 2 min at 60% output (Branson Sonifier-250). The resulting lysates were
analysed for creatine kinase activity using either quantitative pH-stat analysis (Millner-
White et al., 1971; WaUimann et al., 1984) or qualitative cellulose polyacetate gel
electrophoresis (Wyss et al., 1990).
pH-stat analysis takes advantage of the stoichiometric proton consumption of the
reverse reaction catalyzed by CK:
Phosphocreatine (PCr) + ADP + H+ < Creatine (Cr) + ATP
By monitoring the rate of proton consumption in the reaction mixture, it is thus possible
to determine CK activity. The reaction mixtures for pH-stat consisted of 2.5 mL pH-stat
buffer (75 mM KCl, 10 mM MgCl2, 0.1 mM EGTA, and 1 mM ß-mercaptoethanol), 0.3
mL 0.1 M PCr, 120 uL 0.1 M ADP, 50-100 uL 20 mM NaOH (for initial-pH
adjustments), and 20 uL cell lysate. The reactions were started at pH 7.0 and room
temperature. Control blanks were measured in the absence of PCr or ADP. CK activity
was normalized to the determined total soluble protein concentration.
Cellulose polyacetate electrophoresis was performed for qualitative detection of
CK isoenzyme activity (Wyss et al., 1990). In this procedure, protein separation is based
on charge and size, as well as distribution differences in stationary phase (cellulose-
polyacetate-membrane matrix) and mobile phase (running buffer). In contrast to SDS-
Polyacrylamide gel electrophoresis, this method separates the proteins in their native form
and thus also allows separation of CK isoforms. CK can then be visualized on the
cellulose polyacetate membrane by activity staining via the overlay gel technique, which is
an adaptation of a previously described procedure (Dawson et al., 1967, Smith, 1968).
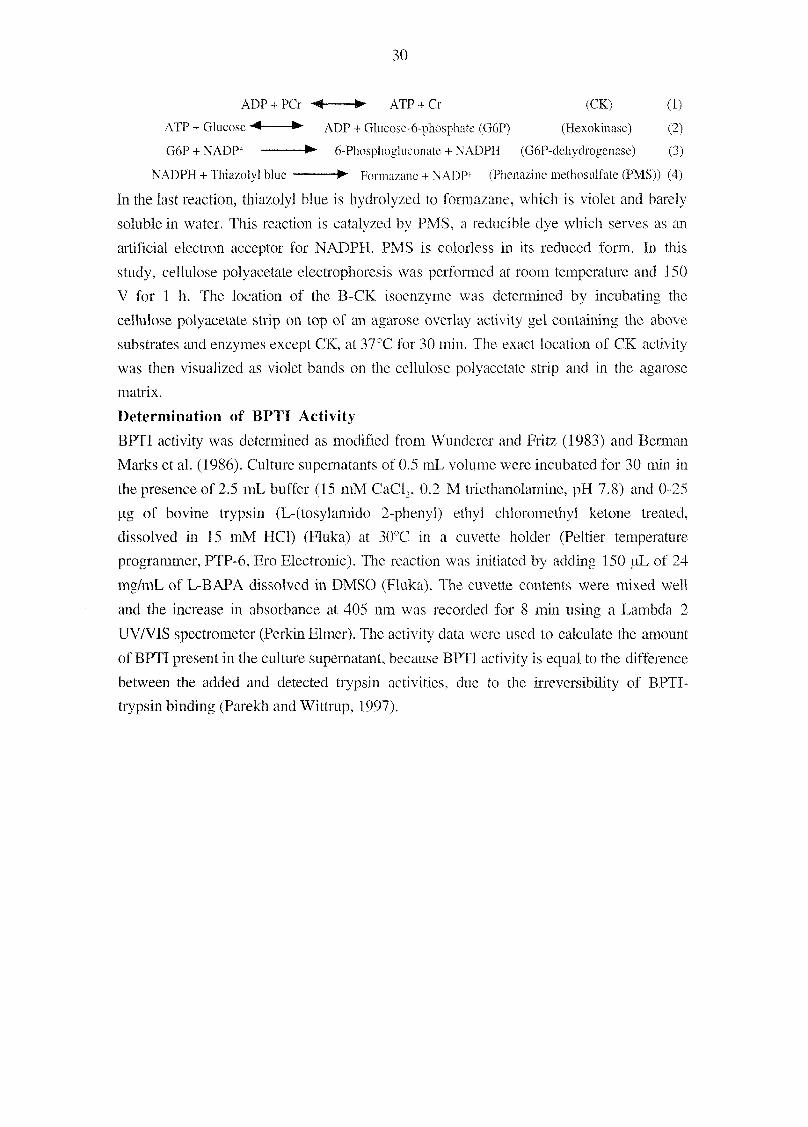
This activity staining procedure is based on the following set of reactions that are initiated
by CK:
30
ADP + PCr < ATP + Cr (CK) (1)
ATP + Glucose < ADP + Glucose-6-phosphate (G6P) (Hexokinase) (2)
G6P + NADP+ 6-Phosphogluconate + NADPH (G6P-dchydrogenase) (3)
NADPH + Thiazolyl blue Formazane + NADP+ (Phenazine methosulfatc (PMS)) (4)
In the last reaction, thiazolyl blue is hydrolyzed to formazane, which is violet and barely
soluble in water. This reaction is catalyzed by PMS, a reducible dye which serves as an
artificial electron acceptor for NADPH. PMS is colorless in its reduced form. In this
study, cellulose polyacetate electrophoresis was performed at room temperature and 150
V for 1 h. The location of the B-CK isoenzyme was determined by incubating the
cellulose polyacetate strip on top of an agarose overlay activity gel containing the above
substrates and enzymes except CK, at 37°C for 30 min. The exact location of CK activity
was then visualized as violet bands on the cellulose polyacetate strip and in the agarose
matrix.
Determination of BPTI Activity
BPTI activity was determined as modified from Wunderer and Fritz (1983) and Bennan
Marks et al. (1986). Culture supernatants of 0.5 mL volume were incubated for 30 min in
the presence of 2.5 mL buffer (15 mM CaCL, 0.2 M triethanolamine, pH 7.8) and 0-25
Hg of bovine trypsin (L-(tosylamido 2-phenyl) ethyl chloromethyl ketone treated,
dissolved in 15 mM HCl) (Fluka) at 30°C in a cuvette holder (Peltier temperature
programmer, PTP-6, Ero Electronic). The reaction was initiated by adding 150 uL of 24
mg/mL of L-BAPA dissolved in DMSO (Fluka). The cuvette contents were mixed well
and the increase in absorbance at 405 nra was recorded for 8 min using a Lambda 2
UV/VIS spectrometer (Perkin Elmer). The activity data were used to calculate the amount
of BPTI present in the culture supernatant, because BPTI activity is equal to the difference
between the added and detected trypsin activities, due to the irreversibility of BPTI-
trypsin binding (Parekh and Wittrup, 1997).
31
RESULTS
Functional CK Expression in S. cerevisiae
The constructed constitutive B-CK-expression plasmid FG12 and Mi-CK-expression
plasmid FG8 were transferred into S. cerevisiae CBS7752 and INVSCl via
electroporation. These strains were chosen because they carry only small numbers of
auxotrophic mutations. Additionally, the empty expression vectors pAAH5 and YEP24
were transformed into the same hosts as a control for B-CK and Mi-CK expression
studies. For combined overexpression, the two vectors carrying B-CK and Mi-CK were
co-transformed into CBS7752 and INVSCl. Correct targeting of Mi-CK to the
mitochondria was verified by SDS-PAGE analysis, where the short Mi-CK band was
observed (data not shown). This indicates that the signal sequence was cleaved from Mi-
CK, which, in turn, indicates correct targeting into mitochondria.
To verify whether the transformants functionally expressed B-CK and/or Mi-CK,
pH-stat analysis and cellulose polyacetate gel electrophoresis were performed. Using pll-
stat analysis, no activity was detected in cell lysates derived from the control strains. B-
CK-expressing cells, however, were found to exhibit CK activity in the range of 5.5-8.5
U per mg of total soluble protein. In the case of Mi-CK-expressing cells, CK activity was
in the range of 2.5-4.0 U per mg of total soluble protein. The double construct showed
the highest CK activity, which was in the range of 7.0-10.0 U per mg of total soluble
protein. Cellulose polyacetate gel electrophoresis qualitatively confirmed these results
(Figure 1). CK activity of B-CK-expressing cells was detected at the same relative
position as purified chicken Bb-CK, clearly demonstrating expression of enzymatically
active B-CK from the recombinant vector FG12. As expected, no activity could be
detected in the cell lysates of the control strains, implying that the observed activity in B-
CK-expressing cells resulted from heterologous CK expression and is not present in
wild-type S. cerevisiae. Similarly, CK activity in Mi-CK-expressing cells was also
detected using cellulose polyacetate gel electrophoresis (data not shown), demonstrating
that also Mi-CK was functionally expressed.

32
1 ? 3 4
ßsaEgB www»
Figure 1. B-CK activity determination after cellulose polyacetate gel electrophoresis of cmde cell
extracts from: purified chicken Bh-CK (lane 1); the pAAH5-earrying control strain (CBS7752) (lane 2);
the FG12-carrying strains CBS7752 and INVSCl (lanes 3 and 4); respectively. 0 denotes the position for
sample application.
Growth Physiology of B-CK- and/or Mi-CK-Overexpressing S. cerevisiae
To investigate whether the CK-overexpression had any appreciable effect on growth
physiology of S. cerevisiae CBS7752 and INVSCl, transformants expressing the Mi-CK
and B-CK genes exclusively or in combination were studied. YEP24- and/or pAAH5-
transformants of the strains, which contain the empty vectors without any CK-insert,
were used as the control.
However, when cells were grown aerobically in YMM containing 1% (w/v)
glucose as the sole carbon source, no significant difference was observed in their growth
rate, metabolite formation (data not shown), or final OD600 (Figure 2). Cellular dry weight
determination results were also consistent with OD600 values (data not shown).
Furthermore, these results indicate that CBS7752 transformants cannot attain final cell
densities as high as those of INVSCl transformants, a phenomenon that is investigated
and discussed in Chapter 4.

33
INVSCl CBS7752 INVSCl CBS7752 INVSCl CBS7752
MÎ-CK/YEP24 MCCK/YEP24 B-CK/pAAH5 B-CK/pAAH5 B-& Mi-CK/ B-&Mi-CK/
pAAII5&YEP24 PAAH5&YEP24
Figure 2. Final OD600 of S. cerevisiae INVSCl and CBS7752 transformants with various CK-
expression constructs and the control vectors YEP24 and pAAILS, grown in a minimal medium with 1%
(vv/v) glucose.
Increased Constitutive Expression of Recombinant BPTI Upon Co-
Overexpression of B-CK
Because protein formation is a very energy-requiring process (Gancedo, 1992), we
investigated the potential effects of B-CK co-overexpression on recombinant protein
production in S. cerevisiae. For this purpose, the B-CK-expressing cells and their
controls were transformed with the expression vector carrying the gene for secreted
BPTI. This vector, pEB31IU, is characterized by the constitutive expression promoter
GPD and has a low level of secreted BPTI production (D. Wittrup, personal
communication). With both host strains, the B-CK-expressing constructs reproducibly
had up to 3-fold higher BPTI concentrations in the culture supernatants, compared to their
corresponding controls (Table 1).
34
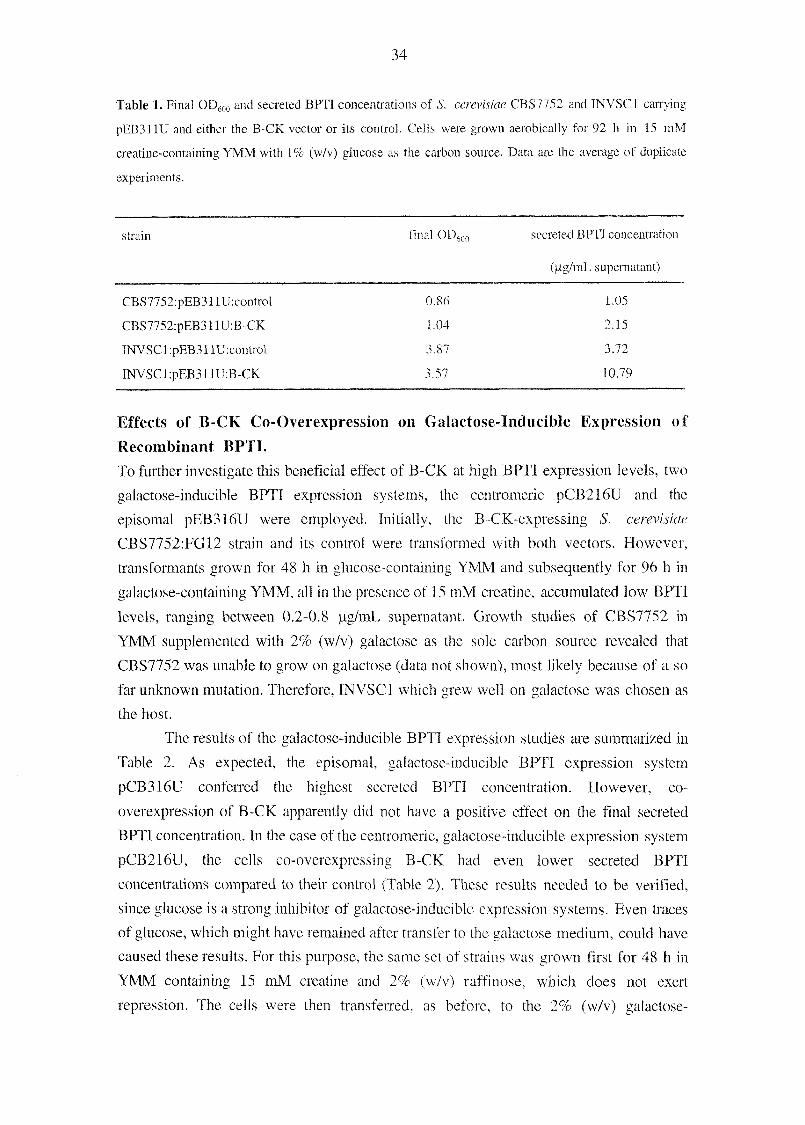
Table 1. Final OD600 and secreted BPTI concentrations of S. cerevisiae CBS7752 and INVSCt carrying
pEB3IUJ and either the B-CK vector or its control. Cells were grown aerobically for 92 h in 15 mM
creatine-containing YMM with 1% (w/v) glucose as the carbon source. Data are the average of duplicate
experiments.
strain final ODfino secreted BPTI concentration
(ug/mL supernatant)
CBS7752:pEB311U:control 0.86 1.05
CBS7752:pEB311U:B-CK 1.04 2.15
TNVSCl:pEB311U:control 3.87 3.72
INVSCl :pEB311U:B-CK 3.57 10.79
Effects of B-CK Co-Overexpression on Galactose-Inducible Expression of
Recombinant BPTI.
To further investigate this beneficial effect of B-CK at high BPTI expression levels, two
galactose-inducible BPTI expression systems, the centromeric pCB216U and the
episomal pEB316U were employed. Initially, the B-CK-expressing S. cerevisiae
CBS7752:FG12 strain and its control were transformed with both vectors. However,
transformants grown for 48 h in glucose-containing YMM and subsequently for 96 h in
galactose-containing YMM, all in the presence of 15 mM creatine, accumulated low BPTI
levels, ranging between 0.2-0.8 ug/mL supernatant. Growth studies of CBS7752 in
YMM supplemented with 2% (w/v) galactose as the sole carbon source revealed that
CBS7752 was unable to grow on galactose (data not shown), most likely because of a so
far unknown mutation. Therefore, INVSCl which grew well on galactose was chosen as
the host.
The results of the galactose-inducible BPTI expression studies are summarized in
Table 2. As expected, the episomal, galactose-inducible BPTI expression system
pCB316U conferred the highest secreted BPTI concentration. However, co-
overexpression of B-CK apparently did not have a positive effect on the final secreted
BPTI concentration. In the case of the centromeric, galactose-inducible expression system
pCB216U, the cells co-overexpressing B-CK had even lower secreted BPTI
concentrations compared to their control (Table 2). These results needed to be verified,
since glucose is a strong inhibitor of galactose-inducible expression systems. Even traces
of glucose, which might have remained after transfer to the galactose medium, could have
caused these results. For this purpose, the same set of strains was grown first for 48 h in
YMM containing 15 mM creatine and 2% (w/v) raffinose, which does not exert
repression. The cells were then transferred, as before, to the 2% (w/v) galactose-

35
containing YMM with 15 mM creatine for further growth for 96 h. The results
demonstrated that indeed glucose repression had hampered high BPTI expression in the
previous experiments, since the secreted BPTI levels of all cells were between 10-100%
higher in raffinose-experiments (Table 3). However, the B-CK co-overexpression clearly
had a negative effect in both cases.
Table 2. Final OD600 and secreted BPTI concentrations of S. cerevisiae INVSCt:FG12 (B-CK) or
INVSCl :pAAH5 (control), co-transformed with the galactose-inducihle BPTI expression systems
pCB216U (centromeric) or pCB316U (episomal). Cultures were first grown aerobically for 48 h in 15
mM creatine-containing YMM with 1 % (w/v) glucose as the carbon source. They were then grown in 2%
(w/v) galactose and 15 mM creatine-containing YMM for another 96 h. Data are the average of duplicate
experiments.
vector system final OD600 secreted BPTI
concentration
(jig/mL supernatant)
pCB216U: control 3.36 9.81
pCB216TJ: B-CK 4.71 2.93
pCB316U: control 3.83 21.90
pCB316U:B-CK 4.31 20.16
36
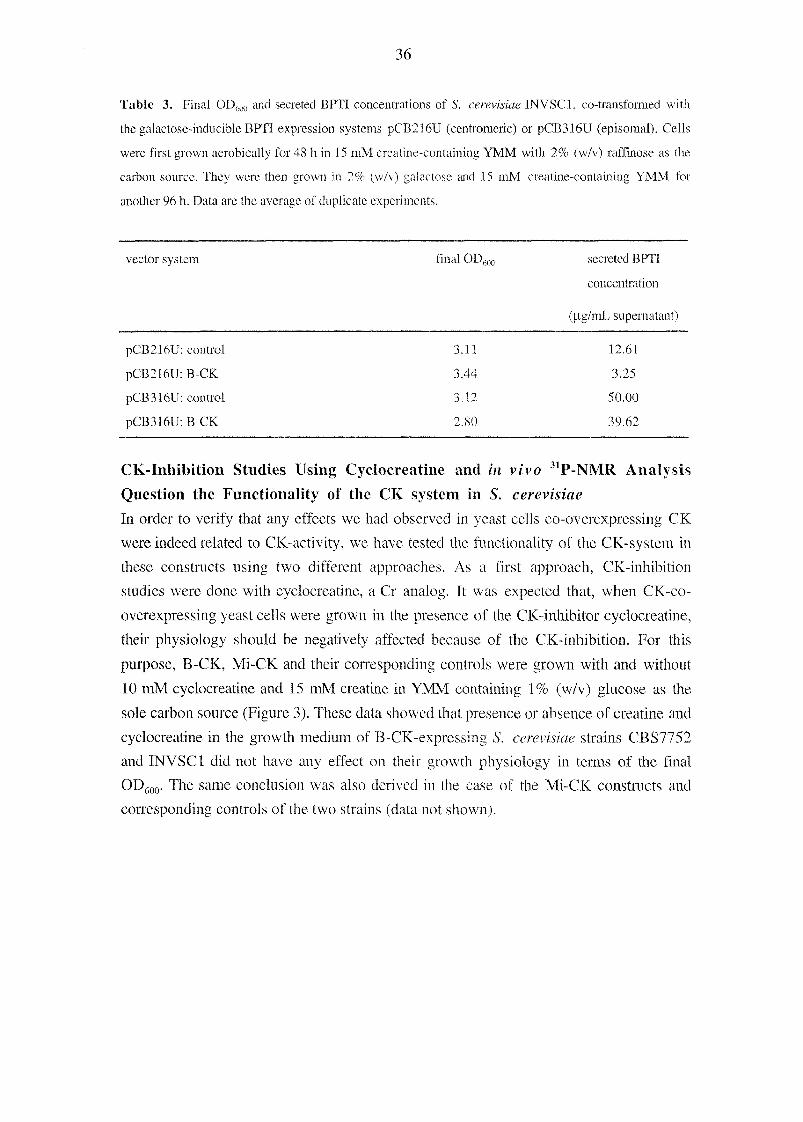
Table 3. Final OD600 and secreted BPTI concentrations of S. cerevisiae INVSCl, co-transformed with
the galactose-inducible BPTI expression systems pCB216U (centromeric) or pCB316U (episomal). Cells
were first grown aerobically for 48 h in 15 mM creatine-containing YMM with 2% (w/v) raffinose as the
carbon source. They were then grown in 2% (w/v) galactose and 15 mM creatine-containing YMM for
another 96 h. Data are the average of duplicate experiments.
vector system final OD600 secreted BPTI
concentration
(U-g/mL supernatant)
pCB216U: control 3.11 12.61
pCB216U: B-CK 3.44 3.25
pCB31611: control 3.12 50.00
pCB3I6U:B-CK 2.80 39.62
CK-Inhibition Studies Using Cyclocreatine and in vivo 31P-NMR Analysis
Question the Functionality of the CK system in S. cerevisiae
In order to verify that any effects we had observed in yeast cells co-overexpressing CK
were indeed related to CK-activity, we have tested the functionality of the CK-system in
these constructs using two different approaches. As a first approach, CK-inhibition
studies were done with cyclocreatine, a Cr analog. It was expected that, when CK-co-
overexpressing yeast cells were grown in the presence of the CK-inhibitor cyclocreatine,
their physiology should be negatively affected because of the CK-inhibition. For this
purpose, B-CK, Mi-CK and their corresponding controls were grown with and without
10 mM cyclocreatine and 15 mM creatine in YMM containing 1% (w/v) glucose as the
sole carbon source (Figure 3). These data showed that presence or absence of creatine and
cyclocreatine in the growth medium of B-CK-expressing S. cerevisiae strains CBS7752
and INVSCl did not have any effect on their growth physiology in terms of the final
OD600. The same conclusion was also derived in the case of the Mi-CK constructs and
corresponding controls of the two strains (data not shown).
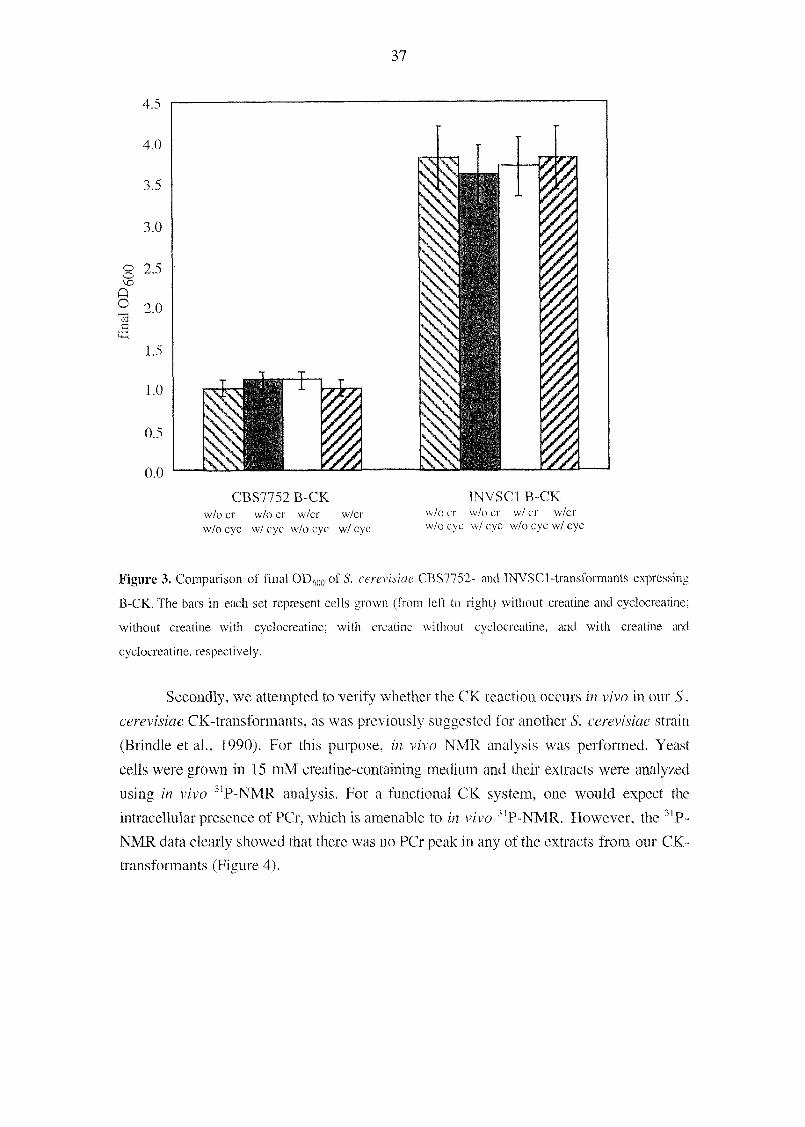
37
CBS7752 B-CK INVSC1 B-CK
w/ocr w/ocr w/cr w/cr w/o cr w/ocr w/cr w/cr
w/ocyc w/cyc w/o eye w/cyc w/o eye w/cyc w/o eye w/ eye
Figure 3. Comparison of final OD600 of S. cerevisiae CBS7752- and INVSCl-transformants expressing
B-CK. The bars in each set represent cells grown (from left to right) without creatine and cyclocreatine;
without creatine with cyclocreatine; with creatine without cyclocreatine, and with creatine and
cyclocreatine, respectively.
Secondly, we attempted to verify whether the CK reaction occurs in vivo in our S.
cerevisiae CK-transformants, as was previously suggested for another S. cerevisiae strain
(Brindle et al., 1990). For this purpose, in vivo NMR analysis was performed. Yeast
cells were grown in 15 mM creatine-containing medium and their extracts were analyzed
using in vivo 31P-NMR analysis. For a functional CK system, one would expect the
intracellular presence of PCr, which is amenable to in vivo "P-NMR. However, the 3IP-
NMR data clearly showed that there was no PCr peak in any of the extracts from our CK-
transformants (Figure 4).

38
^
Figure 4. ""P-NMR spectra of S. cerevisiae CBS7752 expressing B-CK. The peaks are: 1) sugar
phosphates, 2) inorganic phosphates, 3) glycerophosphorylcholme, 4) unidentified, but not PCr, 5)
terminal P in ADP and ATP and polyphosphates, 6) cx-P m ATP and ADP. also in NAD(P)H, 7) UDPG,
8) ß-P in ATP, 9) internal P of polyphosphates. The arrow indicates the expected position of the PCr
peak.

39
DISCUSSION
In this study, we aimed at improving growth characteristics and heterologous protein
production by installing the heterologous CK-system in S. cerevisiae. In addition to a
great deal of scientific information accumulated on CK, this work was based on the
premise that a functional CK system could be installed in yeast. There was already strong
evidence from a previous study that this is indeed feasible (Brindle et al, 1990). In that
study, it had been shown that recombinant rabbit muscle-type creatine kinase enzyme was
functioning in S. cerevisiae (Brindle et al, 1990). This statement was based on the
detection of a phosphocreatine peak by in vivo MP-NMR analysis upon perifusion of the
immobilized yeast cells with creatine, the substrate of the CK reaction, in the presence or
absence of I mM P,. However, our in vivo "P-NMR and HPLC studies with B-CK
yeasts grown in the presence of 15 mM creatine showed that no phosphocreatine was
detectable inside the cells (Klaas Nicolay, personal communication). Furthermore, in a B-
CK inhibition study using 10 mM of the inhibitor cyclocreatine, the B-CK-expressing
cells had even higher final OD600 values than the controls, when they were grown in the
presence of cyclocreatine (data not shown). These results clearly show that the effects
related to heterologous protein production were secondary and probably unrelated to CK
activity. Furthermore, they indicate that either creatine and cyclocreatine cannot be taken
up, because yeast does not have a special transporter system, or that intracellular creatine
is rapidly degraded. Both cases would interfere severely with installing the CK-system in
yeast and could explain our results.
B-CK co-overexpression had a negative effect on the galactose-inducible BPTI
expression system. This can be explained by "protein burden', which specifies the effects
of the synthesis of an extra protein on host cell function and metabolism (Bailey, 1993;
Snoep et al., 1995). Despite the fact that the CK system was not functional in our cells,
the positive secondary effect we have observed in constitutive expression of recombinant
secreted BPTI upon co-overexpression of B-CK is significant and reproducible.
Specifically, we found 3-fold improval in secreted BPTI levels by co-overexpression of
B-CK, compared to the control without B-CK. The concentration of the secreted BPTf in
the constitutive expression system was low, in the range of 1-5 pg secreted BPTI/mL.
Thus, the secondary effect may only be important in a low expression system.
Alternatively, the secondary effect may exist only in cells grown on glucose, but not in
galactose-containing media. The latter hypothesis is supported by the fact that galactose
metabolism of yeast is known to be very different from glucose metabolism, mainly
because of catabolite repression (Gancedo, 1992).
To summarize, further metabolic engineering attempts are necessary to install a
functional creatine kinase system in yeast. These could be either in the direction of
intracellular creatine bioynthesis or creatine uptake.

40
ACKNOWLEDGEMENTS
We thank Rolf Furter and Elizabeth Furter-Graves for constraction of plasmid FG12,
Dane Wittrup for providing us with the BPTI expression vectors, and Klaas Nicolay for
in vivo 31P-NMR measurements.

41
REFERENCES
Ammerer, G. 1983. Expression of genes in yeast using the ADC1 promoter. Meth.
Enzymol. 101: 192-211.
Attfield, P. V. 1997. Stress tolerance: the key to effective strains of industrial baker's
yeast. Nature Biotechnol. 15: 1351-1357.
Bailey, J. E. 1993. Host-vector interactions in Escherichia coli. Adv. Biochem. Eng.
Biotechnol. 48: 29-52.
Becker, D. M., Guarante, L. 1990. High efficiency transformation of yeast by
electroporation. Meth. Enzymol. 194: 182.
Beggs, I. D. 1978. Transformation of yeast by a replicating hybrid plasmid. Nature 275:
104-109.
Bennan Marks, C, Vasser. M., Ng, P., Henzcl, W., Anderson, S. 1986. Production of
native, correctly folded bovine pancreatic trypsin inhibitor by Escherichia coli. I. Biol.
Chem. 261: 7115-7118.
Botstein, D., Falco, S. C, Stewart, S. E., Brennan, M., Scherer, S., Stinchcomb, D.
T., Struhl, K., Davis, R. W. 1979. Sterile host yeasts (shy): a eukaryotic system of
biological containment for recombinant DNA experiments. Gene 8: 17-24.
Bradford, M. M. 1976. A rapid and sensitive method for the quantitation of microgram
quantities of protein utilizing the principle of protein-dye binding. Anal. Biochem. 72:
248-254.
Brindle, K., Braddock, P., Fulton, S. 1990. MP NMR measurements of the ADP
concentration in yeast cells genetically modified to express creatine kinase.
Biochemistry 29: 3295-3302.
Dawson, D. M., Eppenberger, H. M., Kaplan, N. O. 1967. The comparative
enzymology of creatine kinases: II. Physical and chemical properties. J. Biol. Chem.
242: 210-217.
Gancedo, J. M. 1992. Carbon catabolite repression in yeast. Eur. J, Biochem. 206: 297-
313.
Hossle, J. P., Schlegel, L, Wegmann, G., Wyss, M., Bohlen, P., Eppenberger, H. M.,
WaUimann, T., Perriard, J.-C. 1988. Distinct tissue specific mitochondrial creatine
kinases from chicken brain and striated muscle with a conserved CK framework.
Biochem. Biophys. Res. Commun. 151: 408-416.
James, P., Hall, B. D. 1990. ret\-l, a yeast mutant affecting transcription termination by
RNA polymerase 111. Genetics 125: 293-303.
Laemmli, L. K. 1970. Cleavage of structural proteins during the assembly of the head of
bacteriophage T4. Nature 227: 680-685.
Maniatis, T., Frisch, E. F., Sambrook, J. 1982. Molecular cloning: a laboratory manual,
Cold Spring Harbor Laboratory, New York.
42
Miliner-White, E. J., Watts, D. C. 1971. Inhibition of adenosine 5'-triphosphate-creatine
phosphotransferase by substrate-anion complexes. Biochem. J. 122: 727-740.
Parekh, R. N., Wittrup, K. D. 1997. Expression level tuning for optimal heterologous
protein secretion in Saccharomyces cerevisiae. Biotechnol. Prog. 13: 117-122.
Quest, A. F. G., Eppenberger, H. M., WaUimann, T. 1990. Two different B-type
creatine kinase subunits dimerize in a tissue-specific manner. FEBS Lett. 262: 299-
304.
Smith, I. (ed.) 1968. Chromatographic and electrophoretic techniques: 2, Interscience,
New York.
Snoep, J. L., Yomano, L. P., Westerhoff, H. V., Ingram, L. O. 1995. Protein burden in
Zymomonas mobilis: negative flux and growth control due to overproduction of
glycolytic enzymes. Microbiol. 141: 2329-2337.
Stryer, L. 1988. Biochemistry, Third Edition, W. H. Freeman and Company, New
York.
Steeghs, K., Benders, A., Oerlemans, F., de Haan, A., Heerschap, A., Ruitenbeek, W.,
Jost, C, van Deursen, J., Perryman, B., Pette, D., Bruckwilder, M., Koudijs, J.,
Jap, P., Veerkamp, J., Wieringa, B. 1997. Altered Ca2+ responses in muscles with
combined mitochondrial and cytosolic creatine kinase deficiencies. Cell 89: 93-103.
WaUimann, T., Schlösser, T., Eppenberger, H. M. 1984. Function of M-line-bound
creatine kinase as intramyofibrillar ATP regenerator at the receiving end of the
phosphorylcreatine shuttle in muscle. J. Biol. Chem. 259: 5238-5246.
WaUimann, T., Wyss, M., Brdiczska, D., Nicolay, K., Eppenberger, H. M. 1992.
Intracellular compartmentation, structure and function of creatine kinase isoenzymes in
tissues with high and fluctuating energy demands: the 'phosphocreatine circuit' for
cellular energy homeostasis. Biochem. J. 281: 151-170.
WaUimann, T. 1994. Dissecting the role of creatine kinase. Curr. Biol. 4: 42-46.
Wirz, T., Brandie, U., Soldati, T., Hossle, J. P., Perriard, J-C. 1990. A unique chicken
B-creatine kinase gene gives rise to two B-creatine kinase isoproteins with distinct N
termini by alternative splicing. J. Biol. Chem. 265: 11656-11666.
Wunderer, G., Fritz, H. 1983. Biochemistry and applications of aprotinin the kallikrein
inhibitor from bovine organs. Drug Research 33:4.
Wyss, M., Schlegel, J., James, P„ Eppenberger, H. M„ Walliraann, T. 1990. The
mitochondrial creatine kinase from chicken brain. J. Biol. Chem. 265: 15900-15908.

43
Chapter 3
Intracellular Carbon Fluxes in the Yeasts
Saccharomyces cerevisiae and Pichia stipitis

44
SUMMARY
In this study, we applied for the first time metabolic flux ratio (METAFoR) analysis by
NMR, and used it in combination with stoichiometric flux balancing for flux analysis in
the yeasts Saccharomyces cerevisiae and Pichia stipitis. Unlike many former yeast flux
studies, we had sufficient information to also include compartmentalization in the model
and to significantly reduce the number of assumptions that are necessary to solve the
equations. The flux analyses of three glucose-limited chemostats with wild-type S.
cerevisiae and P. stipitis strains revealed that S. cerevisiae has low fluxes through pentose
phosphate pathway, which, according to our analyses, seems to be related to the lack of a
transhydrogenase activity. P. stipitis, in turn, has significantly higher fluxes through the
pentose phosphate pathway, which may be one explanation why it is such an efficient
utilizer of xylose. The lower fluxes through the pentose phosphate pathway in S.
cerevisiae are possibly caused by the absence of a transhydrogenase reaction in this yeast.
These results point to a new target for metabolic engineering of efficient xylose utilization
for bioethanol production.

45
INTRODUCTION
Metabolie engineering of central carbon metabolism is complicated and elaborate. A major
problem is that metabolic engineering attempts may influence certain intracellular reaction
rates, the metabolic fluxes, but not necessarily affect the physiological phenotype. Thus,
an analytical tool is required to monitor intracellular flux changes, possibly to guide
further metabolic engineering targets. There are various analytical methods to gain
information about the intracellular flux distribution, commonly referred to as metabolic
flux analysis.
The classical approach is stoichiometric flux balancing (Vallino and
Stephanopoulos, 1990). In this approach, the stoichiometry of the considered intracellular
reactions is described in a stoichiometric matrix. Mass balancing around the intracellular
metabolites allows to calculate the metabolic fluxes. Such calculations arc based on a
pseudo steady-state assumption for the intracellular metabolite concentrations, and
measurement of extracellular reaction rates, as well as the macromolecular composition of
the biomass to quantify metabolite requirements for biomass synthesis (Varma and
Palsson, 1994). However, often there are more unknown fluxes than balancing equations
in typical bioreaction networks. Consequently, biological assumptions are introduced to
provide additional equations, thus to make the system solvable. However, these
biological assumptions about energy stoichiometry or biological functions of metabolic
systems are generally based on observations of wild-type organisms in their native
environment. Under experimental conditions like carbon limitations or low growth rates,
significant metabolic changes may occur and the assumptions may not be valid anymore
(Sauer et al., 1997). Alternatively, isotopic-tracer experiments were used to determine
flux ratios at certain branch points. For this purpose, nuclear magnetic resonance (NMR)
spectroscopy is often used to detect differences in the isotope isomer, or isotopomer,
composition of secreted metabolites or cellular components. This is achieved by growing
microorganisms on minimal media containing a mixture of nC-labeled and non-labeled
carbon source. Depending on the labeling experiment, NMR is used to detect site-specific
isotope enrichments in the metabolic intermediates (Cerdan and Seelig, 1990), or the
isotopomer distributions (Malloy et al., 1990). A recent method is biosynthetically
directed fractional uC-labeling of the common proteinogenic amino acids, which is used
to monitor metabolic flux ratios of metabolic key pathways (Szyperski, 1995). This
method, also referred to as metabolic flux ratio (METAFoR) analysis (Sauer et al., 1999),
can complement stoichiometric flux balancing by supplying additional constraints (or
equations) in order to make the system solvable (Sauer et al.. 1997).
Several attempts have been made to estimate the intracellular fluxes in the
biotechnologically relevant yeast Saccharomyces cerevisiae, based on stoichiometric flux
balancing. A relatively simple method was developed for estimating anabolic fluxes

46
(Cortassa et al., 1995), based on the calculation of anabolic fluxes from growth rate and
the requirements for building blocks. This method allowed also to estimate fluxes through
some central catabolic pathways. A similar study focused on the construction of metabolic
networks using biochemical information from the literature. This information was used to
describe the biochemistry of growth of S. cerevisiae and Candida utilis on several carbon
substrates like glucose, ethanol, acetate and mixtures of glucose and ethanol (van Gulik
and Heijnen, 1995). In this case, only two fitted parameters were used for all networks,
the P-to-O ratio and the maintenance coefficient. In a follow-up study, it was shown that
yield data for a number of mixtures of two substrates (glucose and ethanol) provide
sufficient information for estimating the two energetic parameters P/O and k; the
operational P-to-O ratio and the growth-related maintenance factor, respectively. These
two parameters were the only unknowns in the proposed stoichiometric description of S.
cerevisiae metabolism (Vanrolleghem et al., 1996). In contrast to the studies mentioned
above, stoichiometric flux analysis of anaerobic S. cerevisiae considered
compartmentalization in the flux model (Nissen et al., 1997). However, several
assumptions were necessary to make the system determined.
Apart from stoichiometric flux balancing, there are a few studies which employed
nC-NMR spectroscopy to determine certain flux ratios in S. cerevisiae. One example was
investigation of the tricarboxylic acid (TCA) and glyoxylate cycles in S. cerevisiae using
mathematical models based on the 13C-NMR spectra of glutamate obtained from cells fed
with 100% 2-nC acetate (Tran-Dinh et al., 1996). The glutamate isotopomer population
provided specific analytical equations for the deduction of the fluxes in the TCA and
glyoxylate cycles. Similarly, the use of l4C-labelled glucose or glutamic acid and
measurement of the radioactivity in the resulting compounds has also been employed to
study the distribution of carbon from glucose and glutamate in anaerobically grown S.
cerevisiae (Albers et al., 1998). It was concluded that the carbon flow follows two
separate paths, and that the major reactions used in the TCA cycle are those involved in
the conversion of 2-oxoglutarate to succinate. Additionally, it was found that the
glutamate family of amino acids (glutamine, glutamic acid, proline, arginine and lysine)
originate almost exclusively from the carbon skeleton of glutamic acid (Albers et al.,
1998).
In the present study, we combined stoichiometric flux balancing and "C-NMR
analysis of proteinogenic amino acids to develop a more realistic and reliable metabolic
flux model for S. cerevisiae that also considers compartmentalization. The primary goal of
this work was to elucidate potential differences in pentose phosphate metabolism of the
yeasts S. cerevisiae and Pichia stipitis during growth on glucose. The rationale for
choosing these two yeasts was that the former is an efficient producer of ethanol, but

47
cannot utilize pentoses efficiently, even when engineered to do so. In contrast, the latter
can utilize pentoses efficiently, but does not produce ethanol.

48
MATERIALS AND METHODS
Yeast Strains and Cultivation Conditions
S. cerevisiae wild-type strain CEN.PK 113.7D (MATa, MAL2-8\ SUC2) (obtained from
Dr. P. Kotier, Johann Wolfgang Goethe-University, Frankfurt, Germany) and the P.
stipitis wild-type strain CBS6054 (kindly provided by Prof. B. Hahn-Hägerdal, Lund
University, Sweden) were used. Batch cultures were grown in baffled shake flasks and
continuous cultivations in glucose-limited chemostats were performed at 30°C in a 1.5-L
bioreactor (Bioengineering, Wald, Switzerland) with a working volume of 1 L, equipped
with pH, dissolved oxygen, and temperature probes. The filter-sterilized mineral medium
used for all cultivations contained the following components (per liter of distilled water):
(NH4)2S04, 5 g; MgS047H20, 0.5 g; KH2P04, 3 g; 1 mL of vitamin solution (biotin,
0.05 mg/L; calcium pantothenate, 1 mg/L; nicotinic acid, 1 mg/L; inositol, 25 mg/L;
thiamine-HCl, 1 mg/L; pyridoxine-HCl, 1 mg/L; and para-aminobenzoic acid 0.2 mg/L)
and 1 mL of trace element solution (EDTA, 15 mg/L; ZnS047H20, 4.5 mg/L;
CoCl26H20, 0.3 mg/L; MnCl24H20, 1 mg/L; CuS045H20, 0.3 mg/L; CaCL/2H20, 4.5
mg/L; FeS047H,0, 3 mg/L; NaMo042H20; 0.4 mg/L; H3B03, I mg/L; and KI, 0.1
mg/L) (Verduyn et al., 1992). The minimal medium was supplemented either with 3.6
g/L of glucose containing nC at natural abundance, or with 3.24 g/L of glucose at natural
abundance and 0.36 g/L of uniformly labeled (nC6)~glucose (nC>98%, Tsotech,
Miamisburg, OH). The pH of the medium prior to adjustment was 4.5. Polypropylene
glycol 2000 (PPG 2000) was added as an antifoam to the medium at a concentration of 2
mL PPG 2000 (1:10 diluted in dH20) per liter of medium. For anaerobic S. cerevisiae
chemostat cultures, 1.25 mL (per liter of medium) of filter-sterilized Tween 80/ergosterol
solution containing 8 g ergosterol and 336 g Tween 80 per liter of ethanol was added to
the medium.
For chemostat cultivations, the pH was controlled at 5.50+0.05 by the addition of
3 M KOH. The fermentation volume was kept constant using a weight-controlled pump.
For aerobic chemostats, a constant air flow of 0.5 L/min was achieved by a mass flow
controller and the agitation speed was adjusted to 1200 rpm. Anaerobic conditions were
achieved by a constant flow of 0.5 L N2 per min. Aliquots for further analysis were taken
from chemostat cultures in steady state, which was defined as at least three volume
changes of stable optical density readings, and oxygen and carbon dioxide concentrations
in the fermenter off-gas, after any perturbation such as adjusting the dilution rate or
withdrawal of aliquots. Labeling was achieved by changing the feed medium of a culture
in steady state from the normal, unlabeled glucose medium to an identical medium that
contained the same absolute concentration of glucose, but a 10% fraction of it was nC6-
glucose. Samples of labeled biomass were taken after 1.00 (aerobic S. cerevisiae), 0.88
(anaerobic S. cerevisiae), and 1.00 (aerobic P. stipitis) volume changes, yielding an

49
overall degree of fractionally labeled biomass (xb), as calculated by using first order
wash-out kinetics; xb= l-eDl, of 60, 59, and 57%, respectively. From each chemostat,
about 0.1 g (cdw) of cells were harvested for NMR analysis.
Analytical Methods and Sample Preparation
Cellular dry weight (cdw) measurements were performed using six parallel 10-mL
suspensions, which were harvested by centrifugation at 5000 rpm for 20 min in a
benchtop centrifuge (Sigma, USA). The pellets were washed once with distilled water,
centrifuged again as above, and dried to constant weight at 85°C for 24 h. The
concentrations of glucose, ethanol, and glycerol were determined with a Synchron
CX5CE automated enzyme analysis system (Beckman, USA) with either kits supplied by
the manufacturer or following standard protocols (Bergmeyer, 1985). Concentrations of
additional fermentation (by-)products such as pyruvate, acetate, and succinate were
determined using high-pressure liquid chromatography (Supelco-Hewlett Packard) at
30°C and 0.2 N ortho-phosphoric acid as the elution solvent. Protein determination was
done using a modified Biuret method (Verduyn et al., 1990). RNA measurements were
done as described elsewhere (Benthin et al., 1991). Total carbohydrate content was
measured using the phenol method (Herbert et al., 1971). The remaining biomass
components, mainly lipids and ash, were calculated on the basis of reported results
(Nissen et al., 1997). The biomass precursor requirements for Bacillus subtilis (Sauer et
al., 1996) were adapted for yeast by considering the biomass composition differences
between yeast and bacteria, regarding especially the high glucose-6-phosphate
requirements of yeast as a cell wall component. These data were then used in flux
calculations. Off-gas concentrations of oxygen and carbon dioxide were determined with
a quadrupole mass spectrometer (Fisons, Uxbridge, United Kingdom).
For NMR measurements, O.f g (cdw) of cellular biomass were harvested by
centrifugation at 3800 rpm, 4°C, for 15 min in a benchtop centrifuge (Eppendorf,
Germany). The pellets were washed once with 20 mM Tris-HCl, pH 7.6 and centrifuged
at 14,000 rpm for 5 min in a benchtop centrifuge. The cells were then resuspended and
hydrolyzed in 6 M HCl at 110°C for 24 h. Due to oxidation, cysteine and tryptophan were
lost in the resulting samples, and asparagine and glutamine were deaminated. The
hydrolysates were then lyophilized and redissolved in 700 u.L 0.1 M 2HC1 in 2H20.NMR Spectroscopy and Data Analysis
NMR experiments were conducted at 40°C and a nC resonance frequency of 125.8 MHz
using a Bruker DRX500 spectrometer. The uniformly nC-labeled glucose fraction in the
medium was determined from the average degree of nC-labeling that was detenuined
from fD *H NMR spectra (S/yperski, 1995) and from the exchanged biomass fraction,
xb. For each of the three experiments, two (nC 'Hj-COSY spectra were recorded, one for
the aliphatic (data size 1500x256 complex points; tSmi= 353 ras; t, = 102 ms) and one

50
for the aromatic resonances (data size 800x128 complex points; tlnux= 341 ms; Umax = 102
ms) (Szyperski, 1995). The information on the relative abundances of intact multi carbon
fragments originating from glucose that are present in the precursor fragments for amino
acid biosynthesis is provided by 18 nC scalar coupling fine structures in nine different
amino acids (Szyperski, 1995; Szyperski et al., 1996). By means of probabilistic
equations, the scalar coupling fine structures were related to the relative abundance of
intact carbon fragments that can be extracted from such biosynthetically directed
fractionally nC-labeled amino acids (Szyperski, 1995). In order to estimate the
experimental error for the relative abundances of intact multi-carbon fragments, 13
redundant fine structures were used. The other 14 observed nC fine structures for the
proteinogenic amino acids in the hydrolysate were checked for consistency with the
known amino acid biosynthesis.
Computation of Fluxes
The yeast biochemical reaction network that was used in our analyses is shown in Figure
1. Glycolysis and PPP intermediates were considered exclusively as cytosolic pools and
the TCA intermediates as mitochondrial pools (Zimmermann and Entian, 1997). The only
exceptions are pyruvate, acetyl-CoA, and oxaloacetate that occur as both mitochondrial
and cytosolic pools. Amino acids from the pyruvate family were assumed to be
synthesized from the mitochondrial pyruvate pool, based on biochemical evidence (Pronk
et al., 1996; Jones and Fink, 1982). The METAFoR analysis principles were used first to
elucidate the localization of certain biosynthetic intermediates in the cytosolic or
mitochondrial compartments (Fiaux et al., unpublished). Information on pyruvate is
embedded in the amino acids alanine, valine, isoleucine and leucine. The first step in the
biosynthesis of isoleucine, leucine and valine is the condensation of pyruvate to a-
ketobutyrate for the former, and hydroxyethyl-TPP for the latter two, catalyzed by the
mitochondrial enzyme acetolactate-pyruvate lyase (Jones and Fink, 1982). Hence, the
nC-multiplet fine structure of these amino acids reflects directly the mitochondrial
pyruvate pool (Fiaux et al., unpublished). It is also known via subcellular fractionation
studies that the malic enzyme in S. cerevisiae is located in the mitochondria (Boles et al.,
1998). In contrast, based on METAFoR evidence, amino acids from the oxaloacetate pool
were assumed to be synthesized from the cytosolic pool. Our previous findings with
batch cultures of S. cerevisiae and P. stipitis revealed that, for biosynthesis of
proteinogenic aspartate, threonine and methionine, the cytosolic oxaloacetate was used,
and it did not equilibrate with the mitochondrial pool (Fiaux et al., unpublished).
According to these results, the entire oxaloacetate pool originated from pyruvate via the
pyruvate carboxylase and not from the TCA cycle. This view is consistent with the
reported localization of pyruvate carboxylase in the cytoplasm (Pronk et al., 1996).
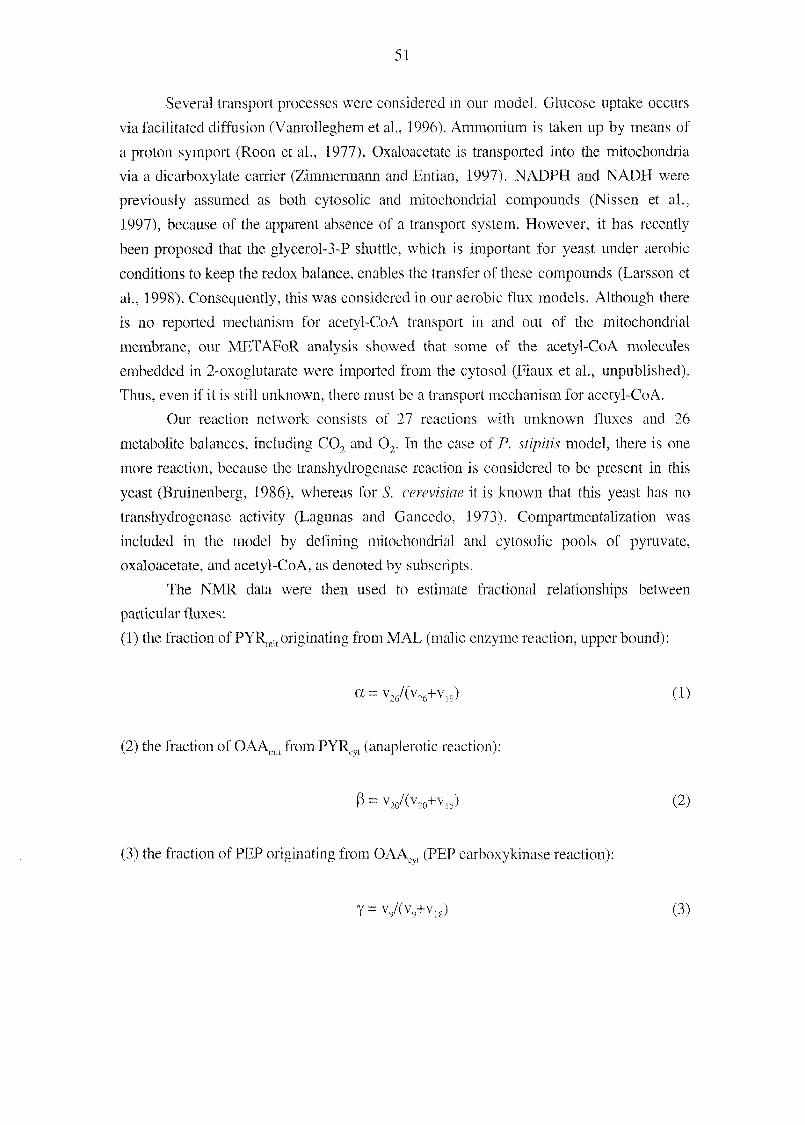
51
Several transport processes were considered in our model. Glucose uptake occurs
via facilitated diffusion (Vanrolleghemet al., 1996). Ammonium is taken up by means of
a proton symport (Roon et al., 1977). Oxaloacetate is transported into the mitochondria
via a dicarboxylate carrier (Zimmermann and Entian, 1997). NADPH and NADH were
previously assumed as both cytosolic and mitochondrial compounds (Nissen et al.,
1997), because of the apparent absence of a transport system. However, it has recently
been proposed that the glycerol-3-P shuttle, which is important for yeast under aerobic
conditions to keep the redox balance, enables the transfer of these compounds (Larsson et
al., 1998). Consequently, this was considered in our aerobic flux models. Although there
is no reported mechanism for acetyl-CoA transport in and out of the mitochondrial
membrane, our METAFoR analysis showed that some of the acetyl-CoA molecules
embedded in 2-oxoglutarate were imported from the cytosol (Fiaux et al., unpublished).
Thus, even if it is still unknown, there must be a transport mechanism for acetyl-CoA.
Our reaction network consists of 27 reactions with unknown fluxes and 26
metabolite balances, including C02 and 02. In the case of P. stipitis model, there is one
more reaction, because the transhydrogenase reaction is considered to be present in this
yeast (Bruinenberg, 1986), whereas for S. cerevisiae it is known that this yeast has no
transhydrogenase activity (Lagunas and Gancedo. 1973). Compartmentalization was
included in the model by defining mitochondrial and cytosolic pools of pyruvate,
oxaloacetate, and acetyl-CoA, as denoted by subscripts.
The NMR data were then used to estimate fractional relationships between
particular fluxes:
(1) the fraction of PYRmit originating from MAL (malic enzyme reaction, upper bound):
« = V26/(V26+Viq) (1)
(2) the fraction of OAAmt from PYRcyt (anaplerotic reaction):
ß = v2o/(v20+v„) (2)
(3) the fraction of PEP originating from OAAcu (PEP carboxykinase reaction):
Y = vQ/(v()+v18) (3)
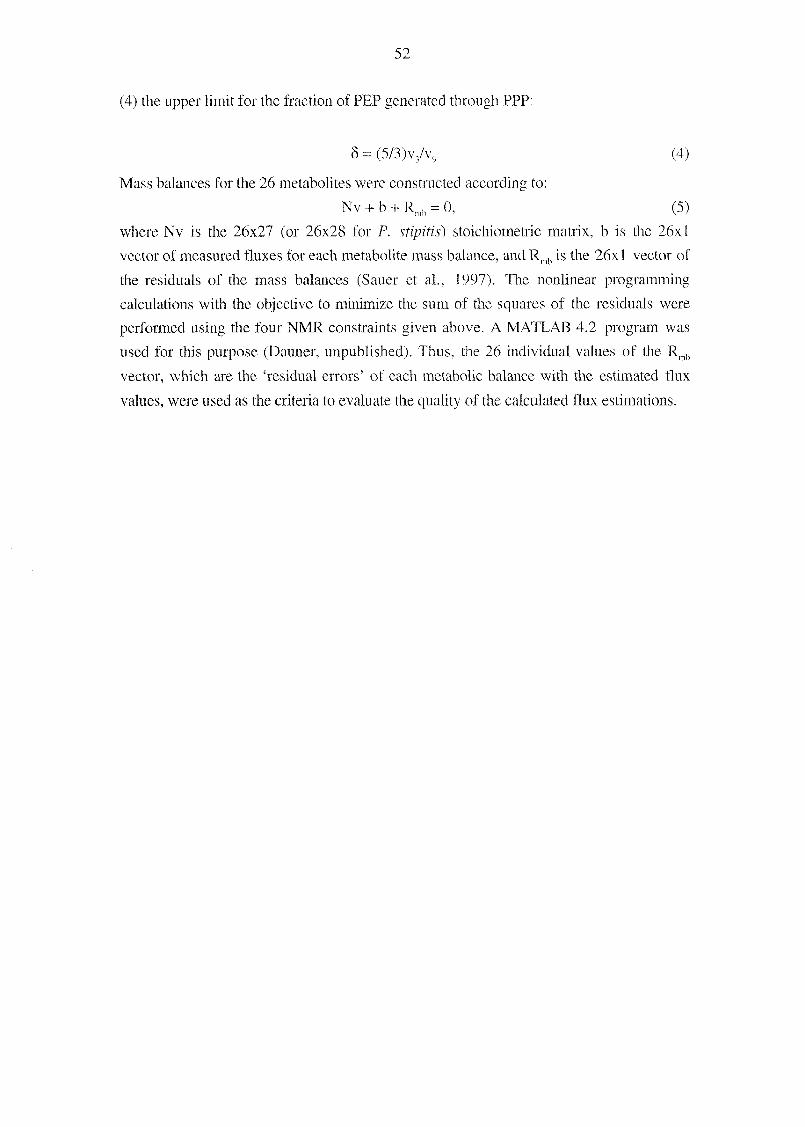
52
(4) the upper limit for the fraction of PEP generated through PPP:
8 = (5/3 )v,/v9 (4)
Mass balances for the 26 metabolites were constructed according to:
Nv + b + Rmb = 0, (5)
where Nv is the 26x27 (or 26x28 for P. stipitis) stoichiometric matrix, b is the 26x1
vector of measured fluxes for each metabolite mass balance, and Rmb is the 26x 1 vector of
the residuals of the mass balances (Sauer et al., 1997). The nonlinear programming
calculations with the objective to minimize the sum of the squares of the residuals were
performed using the four NMR constraints given above. A MATLAB 4.2 program was
used for this purpose (Dauner, unpublished). Thus, the 26 individual values of the Rmb
vector, which are the 'residual errors' of each metabolic balance with the estimated flux
values, were used as the criteria to evaluate the quality of the calculated flux estimations.

53
Glucose
vi
tG6P.
v2 I
F6P
v4 v6
n
Glycerol
v5
7~\X5P
.„„v/.
4_XR5P
his
S7P
\£—) t V>1 BMIaMppMdEaME4P
ryr
tPGA ser, gly Ethanol
v9 ! 24|EP phe, tyr Acetaldehyde
25m- Acetate v
Jt\V22
v23 ^ Y
Acetyl CoAcyt feu
V16
Cytosol
t*^ Acetyl CoAmit
OGA
glu, pro, arg
Mitochondrior succinate
Figure 1. Biochemical pathway model for yeast. Abbreviations: G6P, glucose-6-pliosphate; F6P, fruclosc-6-phosphate; Ru5P,
ribulose-5-phosphate; X5P, xylulose-5-phosphate: E4P, erythrose-4-phosphate; S7P, sediiheptulose-7-phosphatc; R5P, ribose-5-
phosphate; T3P. triose-3-phosphate; PGA, 3-phosphoglycerate; PEP. phosphoenolpyruvate; MAL, inalatc; PYR, pyruvate; OAA,
oxaloacetate; OGA. oxoglutarate; PYK, pyruvate kinase; PYC. pyrin ate carboxylase; PEP-CK, PEP carboxykinase; MAL-DH,
malate dehydrogenase; his, histidine; tyr, tyrosine; ter. serine; gly. glycine; phe. phenylalanine; leu, leucine; ala, alanine; val,
valine; He, isoleucine; asp, aspartate: ihr. threonine; met, methionine; glu, glutamate; pro, proline; arg, argininc. The subscripts
'cyt' and 'mit' indicate the cytosolic or mitochondrial localization of a give» metabolite pool.

54
RESULTS
Cells from glucose-limited chemostats were harvested after fractional nC-labeling and the
common amino acids in their hydrolysates were analysed using two-dimensional (UC,
'H)-COSY NMR (Szyperski, 1995). By determining the origin of the eight principal
intermediates that are used as building blocks for amino acid biosynthesis, information
was obtained on flux ratios through some key pathways of the central carbon metabolism
(Table 1).
Table 1. METAFoR analysis of three chemostat experiments: S. cerevisiae aerobic, S1. cerevisiae
anaerobic, P. stipitis aerobic. The mitochondrial and cytosolic oxaloacetate pools equilibrate in the case of
the 5. cerevisiae anaerobic and P. stipitis aerobic cultivations.
Metabolites Fraction of total
pool (%)
& cerevisiae, S. cerevisiae, P. stipitis',
aerobic anaerobic aerobic
(D = 0.10h') (D = 0.08 h ') (0 = 0.1011'')
Pentose phosphate pathway:PEP from pentoses (upper bound) 39±8 6+5 58±ll
intact C5 in Ribose-5-P 41 5 28
(lower bound)
Glycolysis and TCA cycle:PEP from OAA 1±7 not possible to 0±3
(PEP carboxykinase reaction) determine
OAA transported 38±5 see legend see legendfrom mitochondria
Glyoxylate shunt inactive inactive inactive
Mitochondria:
PYR from MAL (upper bound) 6±5 not possible to 1±6
(malic enzyme reaction) determine
OAA from PYR 41 ±4 97±3 37±2
(imported from cytosol)
(Anaplerotic)Cl-metabolism:
Serine from glycine + C1 34±2 35±2 26±2
(unknown subcellular localization)
Glycine from CO, + CI 5±3 5t2 3±3
(unknown subcellular localization)
The fraction of intact C(1>C(2) fragments in the PEP pool that must originate from OAA,
yielded an upper hmit of 0% to f % for the aerobic S. cerevisiae and P. stipitis cultures,
for the generation of PEP molecules via PEP carboxykinase (Table I). In the case of the
anaerobic S. cerevisiae chemostat, however, it was not possible to determine this fraction.
Thus, the aerobic chemostat results confirmed the previous assumption on the absence of
55
PEP carboxykinase activity during growth on glucose as the sole carbon source.
Additionally, an upper limit on the amount of PYR resulting from MAL could be derived
from the differences in relative abundance of intact C(1) C(2) fragments in PEP and PYR.
The flux ratio for PYR from MAL was found to be 6% and 1% for aerobic S. cerevisiae
and P. stipitis, respectively. The isotopomeric MAL pool composition was assumed to be
identical to the isotopomeric OAA pool composition, which was based on the high
exchangeability within the dicarboxylic acid portion of the TCA cycle (Table I).
Analysis of the acetyl-CoA labeling pattern did not allow for precise localization of
the observed pool. Similar multiplet fine structures were observed for acetyl-CoA
incorporated in leucine and for the carbon atoms originating from acetyl-CoA in OGA.
Acetyl-CoA was assumed to originate exclusively from PYR under the conditions
investigated.
Information on the PPP was available from the isotopomer analysis of histidine
and the aromatic ring of tyrosine, which correspond to the metabolites R5P and E4P,
respectively. Regarding the non-oxidative branch of the PPP, PEP resulting from
pentoses had an upper limit of only 39% and 67c in S. cerevisiae aerobic and anaerobic
cultivations, respectively. In the case of P. stipitis. however, this value was 58%.
Among the TCA cycle intermediates, OAA and OGA could be directly observed
from the data on the aspartate-threonine-methionine group and the glutamate-proline-
arginine group, respectively. Their labeling patterns provided important information on
the compartmentalization of the dicarboxylic acid pools as well as on the pathways active
under specified conditions. Our previous findings with batch cultures of S. cerevisiae and
P. stipitis revealed that the cytosolic OAA was used for biosynthesis of proteinogenic
aspartate, threonine and methionine, and that this pool did not equilibrate with the
mitochondrial pool, in which case the action of the TCA cycle would have been observed
in the aerobic samples (Fiaux et al., unpublished). This result is consistent with the
exclusively cytosolic location of pyruvate carboxylase (Pronk et al., t996). Although it is
known that the amino acids aspartate, threonine, and methionine can be synthesized from
oxaloacetate in both mitochondria and cytosol (Jones and Fink, 1982), our data indicated
that the amino acids incorporated into cellular proteins originate mainly from the cytosolic
pool of OAA. It was also observed that molecules from the cytosolic pool were not
converted to the symmetric metabolites succinate and fumarate. by activity of the TCA
cycle in mitochondria.
As a TCA cycle intermediate, OGA is expected to be present mainly in the
mitochondria. Consistent with this view, it exhibits the characteristic cleavage of the C2-
C3 connectivity caused by condensation of OAA and acetyl-CoA. In anaerobiosis, its
labeling pattern differs from that of the cytosolic OAA pool, which is affected by the
exclusively mitochondrial TCA cycle reactions. Thus, mitochondrial OAA, which is the
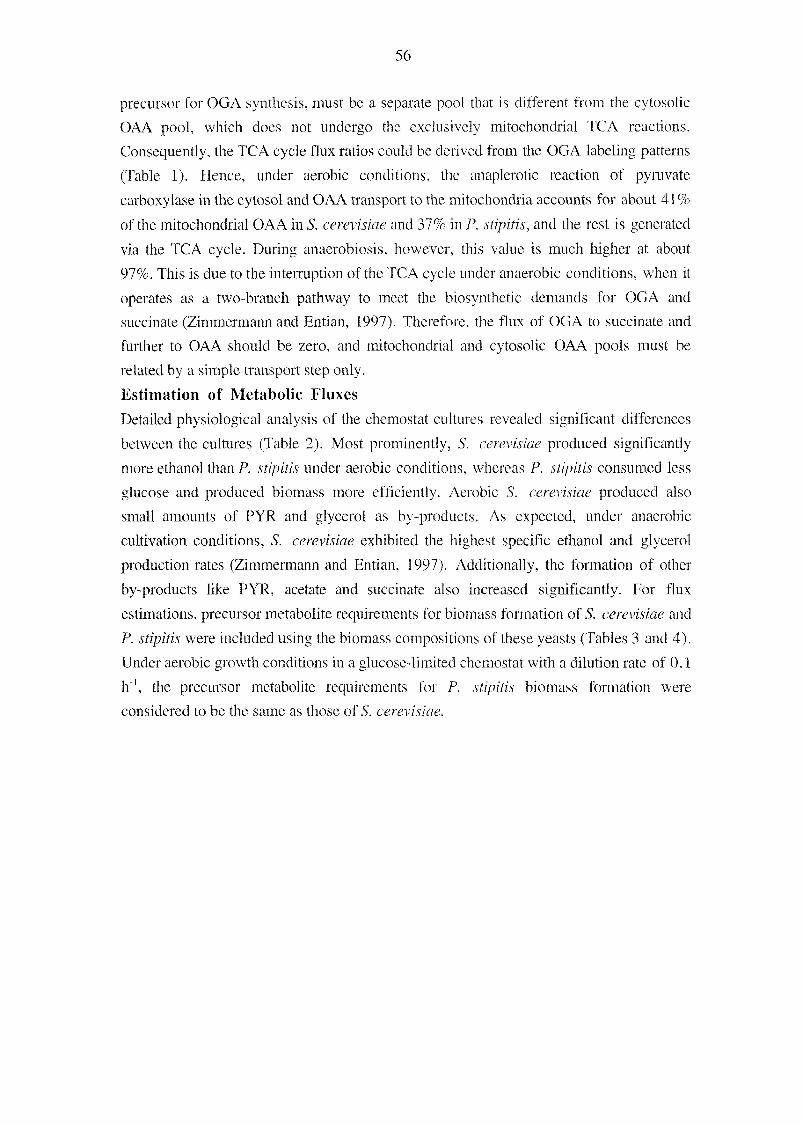
56
precursor for OGA synthesis, must be a separate pool that is different from the cytosolic
OAA pool, which does not undergo the exclusively mitochondrial TCA reactions.
Consequently, the TCA cycle flux ratios could be derived from the OGA labeling patterns
(Table 1). Hence, under aerobic conditions, the anaplerotic reaction of pyruvate
carboxylase in the cytosol and OAA transport to the mitochondria accounts for about 41%
of the mitochondrial OAA in S. cerevisiae and 37% in P. stipitis, and the rest is generated
via the TCA cycle. During anaerobiosis, however, this value is much higher at about
97%. This is due to the interruption of the TCA cycle under anaerobic conditions, when it
operates as a two-branch pathway to meet the biosynthetic demands for OGA and
succinate (Zimmermann and Entian, 1997). Therefore, the flux of OGA to succinate and
further to OAA should be zero, and mitochondrial and cytosolic OAA pools must be
related by a simple transport step only.
Estimation of Metabolic Fluxes
Detailed physiological analysis of the chemostat cultures revealed significant differences
between the cultures (Table 2). Most prominently, S. cerevisiae produced significantly
more ethanol than P. stipitis under aerobic conditions, whereas P. stipitis consumed less
glucose and produced biomass more efficiently. Aerobic S. cerevisiae produced also
small amounts of PYR and glycerol as by-products. As expected, under anaerobic
cultivation conditions, S. cerevisiae exhibited the highest specific ethanol and glycerol
production rates (Zimmermann and Entian, 1997). Additionally, the formation of other
by-products like PYR, acetate and succinate also increased significantly. For flux
estimations, precursor metabolite requirements for biomass formation of S. cerevisiae and
P. stipitis were included using the biomass compositions of these yeasts (Tables 3 and 4).
Under aerobic growth conditions in a glucose-limited chemostat with a dilution rate of 0.1
h"1, the precursor metabolite requirements for P. stipitis biomass formation were
considered to be the same as those of S. cerevisiae.
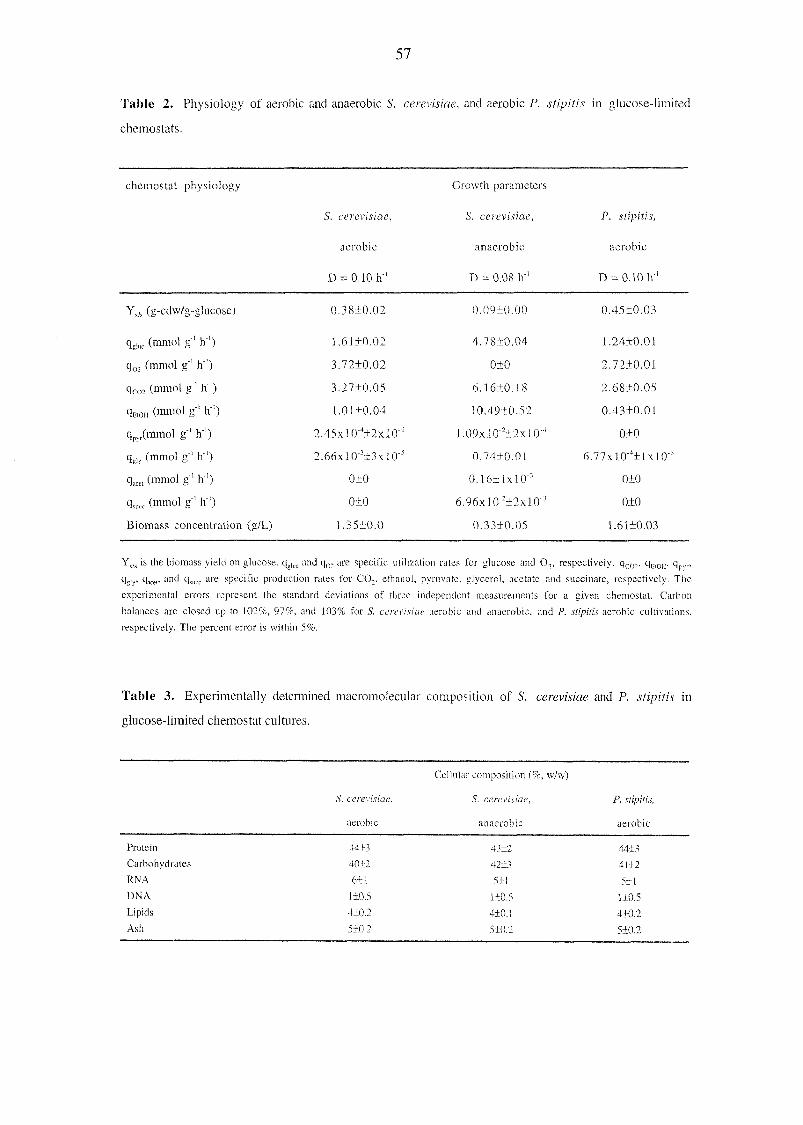
57
Table 2. Physiology of aerobic and anaerobic S. cerevisiae, and aerobic P. stipitis in glucose-limited
chemostats.
chemostat physiology
S. cerevisiae,
aerobic
D = 0.101V'
Growth parameters
S. cerevisiae,
anaerobic
D = 0.08 h"1
P. stipitis,
aerobic
D = 0.10 IV1
YxA (g-cdw/g-glucose)
q i„c (mmol g"' h4)
q02 (mmol g' h'1)
qcœ (mmol g'
h"1)
qFlOI, (mmol g' h"1)
qP)r(mmol g'
h"1)
q«,]y (mmol g'
h"')
q.,m (mmo1 e' h"])
q!UC0 (mmol g'1 h"')
Biomass concentration (g/L)
0.3810.02
1.61 ±0.02
3.72±0.02
3.27+0.05
1.01±0.04
2.45xl0-,±2xl0"6
2.66x10⁻³±3xl0"5
0+0
0±0
1.35+0.0
0.09±0.00
4.78±0.04
0±0
6.1610.18
10.4910.52
1.09x]0"-±2xl0"
0.74+0.01
0.1611x10"'
6.96x10-212xl0"
0.3310.05
0.4510.03
1.2410.01
2.7210.01
2.6810.05
0.4310.01
0±0
6.77xl0''±lxl0"!
010
010
1.6110.03
Yxh is the biomass yield on glucose. qglvlc and q0, are specific utilization rates for glucose and O,, respectively. qcm, qr,0„, q „,
q„i , qxa, and qm.c are specific production rates for CO,, ethanol. pyruvate, glycerol, acetate and succinate, respectively. The
experimental errors represent the standard deviations of three independent measurements for a given chemostat. Carbon
balances are closed up to 102%, 97%, and 103% for S. cerevisiae aerobic and anaerobic, and P. stipitis aerobic cultivations,
respectively. The percent error is within 5%.
Table 3. Experimentally determined macromolecular composition of S. cerevisiae and P. stipitis in
glucose-limited chemostat cultures.
Cellular composition (%, w/w)
S. cerevisiae. S. cerevisiae P. stipitis,
aerobic anaerobic aerobic
44+3 43+2 4413
40±2 42±3 41+2
6+1 5+t 5±1
1+0.5 1+0.5 1+0.5
4+0.2 410.1 4+0.2
5+0.2 5+0.2 5+0.2
Protein
Carbohydrates
RNA
DNA
Lipids
Ash

58
Table 4. Precursor requirements for the formation of 1 g of yeast in aerobic and anaerobic chemostat
cultures. Negative sign indicates generation.
Piecursor metabolite Amount leqmied (mmol / g dry weight of cells)
S. caeuuite, aeiobic S. cerevisiae, anaerobic
G6P 0684 0 656
PÜA 0 786 0 730
OAA 1 26S 0 972
Ribose-5-P 0 282 0 262
NADPH 10.130 9 410
Pyruvate 2 101 1953
Erythiose-4-P 0 246 0.228
PEP 0 492 0 457
OGA 0 734 0 551
NADH -1 897 -1.766
Acetyl-CoA 0 993 0 923
T3P 0 086 0 079
Our NMR data yielded information on relative flux ratios. We used this essential
information as constraints for our metabolic flux estimations in combination with classical
stoichiometric flux balancing. Data on the PEP carboxykinase reaction and the anaplerotic
PYR carboxylase reaction were used as equality constraints (Table 1). These equality
constraints constitute additional, independent equations. Additionally, the information on
PEP from pentoses and the malic enzyme reaction (Table I) were used as inequality
constraints (reaction bounds) in the least-squares calculations. The NMR-derived
constraints provided the missing equations to arrive at fully determined bioreaction
networks so that unique solutions of metabolic fluxes could be obtained.
According to these flux calculations, there are significant differences in the fraction
of G6P that enters the PPP pathway (v.) (Figures 2, 3, and 4) in the three cultures.
Among all cultures, P. stipitis had the highest percentage of oxidative PPP flux at about
55%, whereas in aerobic and anaerobic S. cerevisiae this flux was only 32% and 7%,
respectively. Consistent with the METAFoR data, in anaerobic ,$'. cerevisiae, the TCA
cycle was found to be a two-branched pathway (Figure 3). Another interesting finding
concerns the activity of the malic enzyme. Although no NMR equality constraint was
available for the malic enzyme reaction in anaerobic S. cerevisiae, this reaction was
assumed to be present under anaerobic conditions. However, this reaction was estimated
to be zero by the flux analysis program, showing that the malic enzyme was not active
under these conditions. Similar results were also obtained with the other two cultivations
(Figures 2 and 4). In anaerobic S. cerevisiae, we did not consider the gluconeogenic PEP
carboxykinase reaction (vlg) to have a determined system. In our aerobic cultures, for
which NMR equality constraints were available on this PEP carboxykinase reaction

59
(Table 1), the flux was estimated to be 0% and 2% for P. stipitis and S. cerevisiae,
respectively.

60
Glucose
Glycerol -%°° (2) T3P
Cytosol
Mitochondrio
Figure 2. Estimated intracellular carbon fluxes of S. cerevisiae in aerobic chemostat at a dilution rate of
0.1 h4. The fluxes are normalized to the glucose uptake rate.

61
Glycerol ^2 (2) T3P°'°2^
rE4P
Cytosol
Figure 3. Estimated intracellular carbon fluxes of S. cerevisiae in anaerobic chemostat at a dilution rate
of 0.08 h '. The fluxes are normalized to the glucose uptake rate. Negative signs indicate opposite flux
direction.
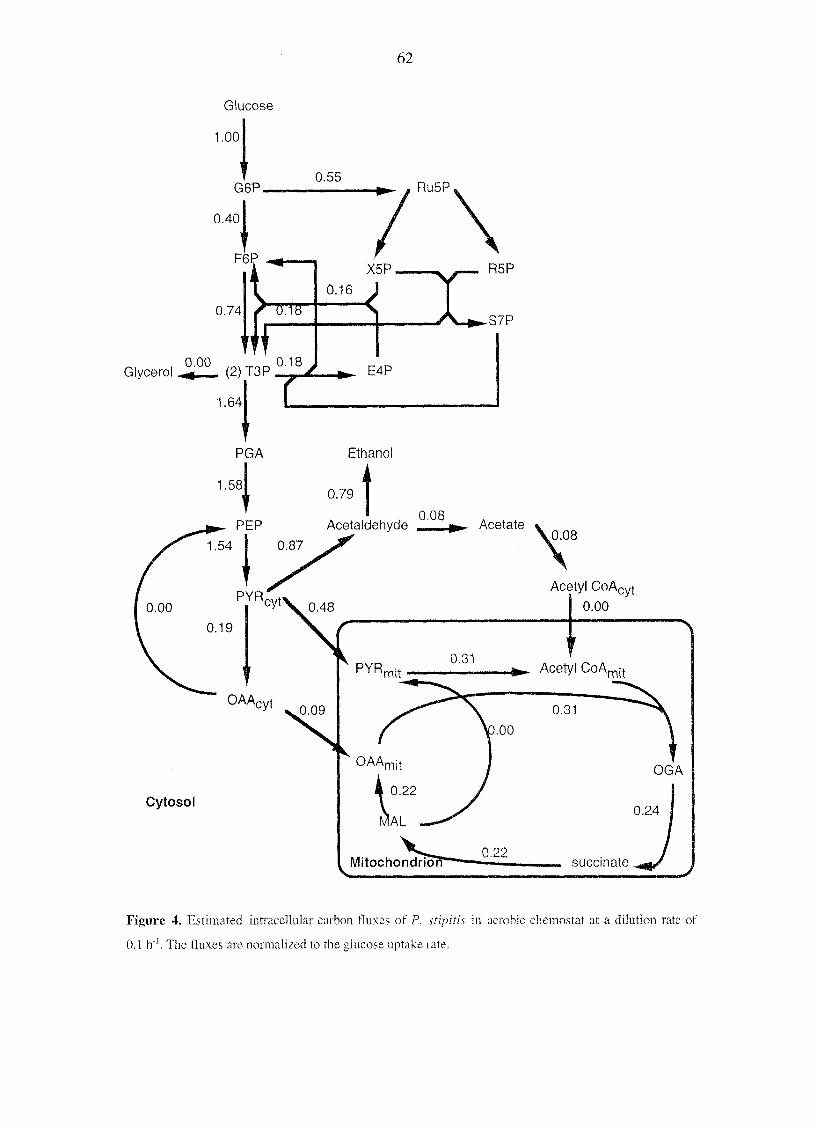
62
R5P
S7P
Glycerol %°° (2) T3P °'l,8/ ». E4P
1.64
Cytosol
Figure 4. Estimated intracellular carbon fluxes of P. stipitis in aerobic chemostat at a dilution rate of
0.1 h'\ The fluxes are normalized to the glucose uptake rate.
63
DISCUSSION
In this study, we have obtained estimates for intracellular carbon llux ratios and net fluxes
in S. cerevisiae and P. stipitis by using METAFoR analysis by NMR alone and in
combination with stoichiometric flux balancing. This is the first time such an analysis is
applied to eukaryotic cells. Unlike many former yeast flux analysis studies, we had
sufficient information that allowed us to include compartmentalization in our flux model to
arrive at a more realistic view of yeast metabolism. Moreover, METAFoR analysis
allowed us in some cases to distinguish between cytosolic and mitochondrial localization
of reactions. Thus, METAFoR analyses provided detailed insights into the carbon flux
distribution in S. cerevisiae and P. stipitis by independent assessment of in vivo operating
reactions, thus reducing assumptions on absence or presence of reactions.
Our llux estimations for S. cerevisiae are generally similar to those reported in the
literature. Regarding the main concepts like the interruption of the TCA cycle during
anaerobiosis, our anaerobic flux estimations are in agreement with those of the anaerobic
flux study considering compartmentalization (Nissen et al., 1997). Similar to their results,
we have also obtained fluxes in the reverse direction between the succinate-MAL-OAA
part of the TCA cycle, because of the presence of succinate as a by-product in the culture
supernatant. Additionally, TCA cycle provided OGA as a biosynthetic requirement
(Figure 3).
Most prominently, our flux ratio and net flux analyses revealed significant
differences in the pentose phosphate pathway operation between aerobic cultures of S.
cerevisiae and P. stipitis. The upper bound for the amount of PEP molecules originating
from pentoses, as obtained by METAFoR analysis, as well as the net flux estimates
showed a smaller contribution of the pentose phosphate pathway to glucose catabolism in
S. cerevisiae, compared to P. stipitis.
These major differences are related to the absence of a transhydrogenase reaction
in S. cerevisiae. Transhydrogenase catalyzes the reversible transfer of a hydride ion
equivalent between NAD(H) and NADP(H). One of the functions of this enzyme is to
provide NADPH for biosynthesis (Hoek and Rydström, 1988). There have been several
studies that investigated the presence or absence of transhydrogenase activity in yeasts.
Studies with Candida utilis revealed that the steady-state ceil yield on glucose increased
with increasing amounts of formate in the medium as an additional energy source, until
growth became carbon-limited (Bruinenberg et al., 1985). The maximum growth yield on
glucose in the presence of excess formate was dependent on the nitrogen source. This
difference in maximum growth yield was found to correlate with the NADPH requirement
for biomass formation with the two different nitrogen sources used, which suggested that
NADH produced from formate oxidation cannot replace the NADPH needed for biomass
formation. Thus, it was concluded that C. utilis had no transhydrogenase activity. A
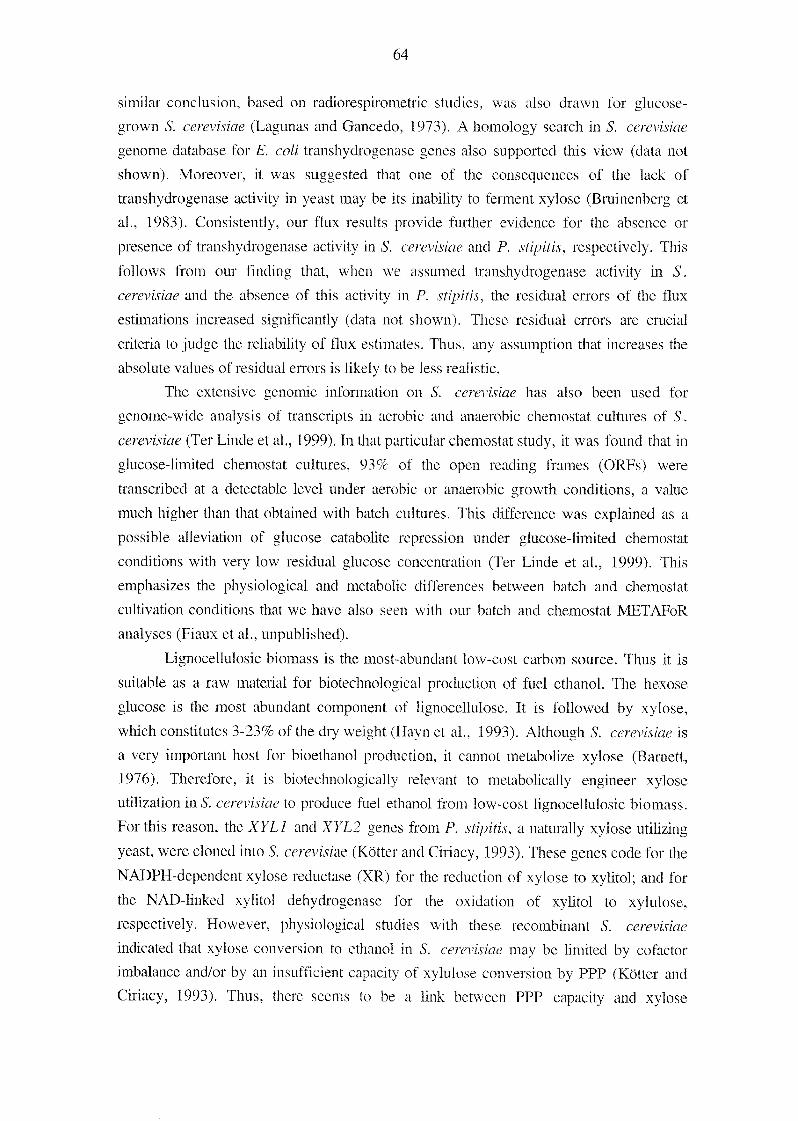
64
similar conclusion, based on radiorespirometric studies, was also drawn for glucose-
grown S. cerevisiae (Lagunas and Gancedo, 1973). A homology search in S. cerevisiae
genome database for E. coli transhydrogenase genes also supported this view (data not
shown). Moreover, it was suggested that one of the consequences of the lack of
transhydrogenase activity in yeast may be its inability to ferment xylose (Bruinenberg et
al., 1983). Consistently, our flux results provide further evidence for the absence or
presence of transhydrogenase activity in 5. cerevisiae and P. stipitis, respectively. This
follows from our finding that, when we assumed transhydrogenase activity in S.
cerevisiae and the absence of this activity in P. stipitis, the residual errors of the llux
estimations increased significantly (data not shown). These residual errors are crucial
criteria to judge the reliability of flux estimates. Thus, any assumption that increases the
absolute values of residual errors is likely to be less realistic.
The extensive genomic information on S. cerevisiae has also been used for
genome-wide analysis of transcripts in aerobic and anaerobic chemostat cultures of S.
cerevisiae (Ter Linde et al., 1999). In that particular chemostat study, it was found that in
glucose-limited chemostat cultures, 93% of the open reading frames (ORFs) were
transcribed at a detectable level under aerobic or anaerobic growth conditions, a value
much higher than that obtained with batch cultures. This difference was explained as a
possible alleviation of glucose catabolite repression under glucose-limited chemostat
conditions with very low residual glucose concentration (Ter Linde et al., 1999). This
emphasizes the physiological and metabolic differences between batch and chemostat
cultivation conditions that we have also seen with our batch and chemostat METAFoR
analyses (Fiaux et al., unpublished).
Lignocellulosic biomass is the most-abundant low-cost carbon source. Thus it is
suitable as a raw material for biotechnological production of fuel ethanol. The hexose
glucose is the most abundant component of lignocellulose. It is followed by xylose,
which constitutes 3-23% of the dry weight (Hayn et al, 1993). Although S. cerevisiae is
a very important host for bioethanol production, it cannot metabolize xylose (Barnett,
1976). Therefore, it is biotechnologically relevant to metabolically engineer xylose
utilization in S. cerevisiae to produce fuel ethanol from low-cost lignocellulosic biomass.
For this reason, the XYLI and XYL2 genes from P. stipitis, a naturally xylose utilizing
yeast, were cloned into S. cerevisiae (Kötter and Ciriacy, 1993). These genes code for the
NADPH-dependent xylose reductase (XR) for the reduction of xylose to xylitol; and for
the NAD-linked xylitol dehydrogenase for the oxidation of xylitol to xylulose,
respectively. However, physiological studies with these recombinant S. cerevisiae
indicated that xylose conversion to ethanol in 5. cerevisiae may be limited by cofactor
imbalance and/or by an insufficient capacity of xylulose conversion by PPP (Kötter and
Ciriacy, 1993). Thus, there seems to be a link between PPP capacity and xylose

65
utilization. In this respect, the differences we have found between wild-type S. cerevisiae
and P. stipitis during growth on glucose support this view of a limited PPP capacity. The
flux analysis methods applied here can, therefore, be further exploited to compare the
metabolism of xylose-utilizing recombinant S. cerevisiae and wild-type P. stipitis during
growth on xylose. This can possibly reveal metabolic bottlenecks in recombinant S.
cerevisiae metabolism for xylose utilization.
ACKNOWLEDGEMENTS
We would like to thank Bärbel Hahn-Hägerdal for providing the P. stipitis strain
CBS6054, Jocelyne Fiaux for NMR analysis, and Michael Dauner for the flux analysis
program.
66
REFERENCES
Albers, E., Gustafsson, L., Niklasson, C, Liden, G. 1998. Distribution of l4C-labelled
carbon from glucose and glutamate during anaerobic growth of Saccharomyces
cerevisiae. Microbiol. 144: 1683-1690.
Barnett, J. A. 1976. The utilization of sugars by yeasts. Adv. Carbohydr. Chem.
Biochem. 32: 126-228.
Benthin, S., Nielsen, J., Villadsen, J. 1991. A simple and reliable method for the
determination of cellular RNA content. Biotechnol. Tech. 5: 39-42.
Bergmeyer, H. U. 1985. Methods of enzymatic analysis, vol. IV. VCH Publishers,
Deerfield Beach, Fla.
Boles, E., de Jong-Gubbels, P., Pronk, J. T. 1998. Identification and characterization of
MAE1, the Saccharomyces cerevisiae structural gene encoding mitochondrial malic
enzyme. J. Bacteriol. 180: 2875-2882.
Bruinenberg, P. M., Van Dijken, J. P., Scheffers, A. W. 1983. An enzymic analysis of
NADPH production and consumption in Candida utilis. J. Gen. Microbiol. 129: 965-
971.
Bruinenberg, P. M., Jonker, R., Van Dijken, J. P., Scheffers, A. W. 1985. Utilization
of formate as an additional energy source by glucose-limited chemostat cultures of
Candida utilis CBS621 and Saccharomyces cerevisiae CBS8066. Arch. Microbiol.
142: 302-306.
Bruinenberg, P. M. 1986. The NADP(H) redox couple in yeast metabolism. Ant.
Leeuwenhoek 52: 411-429.
Cerdan, S., Seelig, J. 1990. NMR studies of metabolism. Annu. Rev. Biophys.
Biophys. Chem. 19: 43-67.
Cortassa, S., Aon, J. C, Aon, M. A. 1995. Fluxes of carbon, phosphorylation, and
redox intermediates during growth of Saccharomyces cerevisiae on different carbon
sources. Biotechnol. Bioeng. 47: 193-208.
Hayn, M., Steiner, W., Klinger, R., Steinmuller, H., Sinner, M., Esterbauer, H. 1993.
Basic research and pilot studies on the enzymatic conversion of lignocellulosics. In:
Bioconversion of forest and agricultural plant residues, pp. 33-72, (ed.) J. N. Saddler,
CAB International, Wallingford, UK.
Herbert, D., Phipps, P. J., Strange, R. E. 1971. Chemical analysis of microbial cells.
Methods Microbiol. 5B: 209-344.
Hoek, J. B., Rydström, J. 1988. Physiological roles of nicotinamide nucleotide
transhydrogenase. Biochem. J. 254: 1-10.
Jones, E. W., Fink, G. R. 1982. Regulation of amino acid and nucleotide biosynthesis.
In: 'The molecular biology of the yeast Saccharomyces, metabolism and gene

67
expression', eds. Strathern, J. N., Jones, E. W., Broach, J. R., Cold Spring Harbor
Press, New York (vol 2, pp. 181-299).
Kötter, P., Ciriacy, M. 1993. Xylose fermentation by Saccharomyces cerevisiae. Appl.
Microbiol. Biotechnol. 38: 776-783.
Lagunas, R., Gancedo, J. M. 1973. Reduced pyridine-nucleotides balance in glucose-
growing Saccharomyces cerevisiae. Eur. J. Biochem. 37: 90-94.
Larsson, C, Pahlmann, l.-L., Ansell, R., Rigoulet, M., Adler, L., Gustafsson, L.
1998. The importance of the glycerol 3-phosphate shuttle during aerobic growth of
Saccharomyces cerevisiae. Yeast 14: 347-357.
Malloy, C. R., Sherry, A. D., Jeffrey, F. M. H. 1990. Analysis of tricarboxylic acid
cycle of the heart using nC isotope isomers. Am. J. Physiol. 259: H987-H995.
Nissen, T. L., Schulze, U., Nielsen, J., Villadsen, J. 1997. Flux distributions in
anaerobic, glucose-limited continuous cultures of Saccharomyces cerevisiae.
Microbiol. 143: 203-218.
Pronk, J. T., Steensma, H. J., Van Dijken, J. 1996. Pyruvate metabolism in
Saccharomyces cerevisiae. Yeast 12: 1607-1633.
Roon, R. J., Levy, J. S., Larimore, F. 1977. Negative interactions between amino acid
and methylamine/ammonia transport systems of Saccharomyces cerevisiae. J. Biol.
Chem. 252: 3599-3604.
Sauer, U., Hatzimanikatis, V., Hohmann, H.-P., Manneberg, M., van Loon, A. P. G.
M., Bailey, J. E. 1996. Physiology and metabolic fluxes of wild-type and riboflavin-
producing Bacillus subtilis. Appl. Env. Microbiol. 62: 3687-3696.
Sauer, U., Hatzimanikatis, V., Bailey, J. E., Hochuli, M., Szyperski, T., Wüthrich, K.
1997. Metabolie fluxes in riboflavin-producing Bacillus subtilis. Nat. Biotechnol. 15:
448-452.
Szyperski, T. 1995. Biosynthetically directed fractional nC-labeling of proteinogenic
amino acids. An efficient analytical tool to investigate intermediary metabolism. Eur. J.
Biochem. 232: 433-448.
Szyperski, T., Bailey, J. E., Wüthrich, K. 1996. Detecting and dissecting metabolic
fluxes using biosynthetic fractional nC-labeling and two-dimensional NMR
spectroscopy. Trends Biotechnol. 14: 453-459.
Ter Linde, J. J. M., Liang, H., Davis, R. W., Steensma, H. Y.. Van Dijken, J. P.,
Pronk, J. T. 1999. Genome-wide transcriptional analysis of aerobic and anaerobic
chemostat cultures of Saccharomyces cerevisiae. J. Bacteriol. 181: 7409-7413.
Tran-Dinh, S., Bouet, F., Huynh, Q.-L, Hervé. M. 1996. Mathematical models for
determining metabolic fluxes through the citric acid and the glyoxylate cycles in
Saccharomyces cerevisiae by nC-NMR spectroscopy. Eur. J. Biochem. 242: 770-
778.

68
Vallino, J. L, Stephanopoulos, G. 1990. Flux determinations in cellular bioreaction
networks: application to lysine fermentations. In: Frontiers in Bioprocessing (eds. S.
K. Sikdar, M. Bier, P. Todd), pp. 205-219, CRC Press, Boca Raton.
van Gulik, W. M., Heijnen, J. J. 1995. A metabolic network stoichiometry analysis of
microbial growth and product formation. Biotechnol. Bioeng. 48: 681-698.
Vanrolleghem, P. A., de Jong-Gubbels, P., van Gulik, W. M., Pronk, J. T., van
Dijken, J. P., Heijnen, S. 1996. Validation of a metabolic network for Saccharomyces
cerevisiae using mixed substrate studies. Biotechnol. Prog. 12: 434-448.
Varma, A., Palsson, B. O. 1994. Metabolic flux balancing: basic concepts, scientific, and
practical use. Bio/Technol. 12: 994-998.
Verduyn, C, Postma, E., Scheffers, W. A., van Dijken, J. P. t992. Effect of benzoic
acid on metabolic fluxes in yeasts: a continous culture study on the regulation of
respiration and alcoholic fermentation. Yeast 8: 501-517.
Zimmermann, F. K., Entian, K.-D. (eds.) 1997. Yeast Sugar Metabolism. Technomic
Publishing Co., Inc. Basel.

69
Chapter 4
Metabolic Engineering of Yeast:
the Perils of Auxotrophic Hosts
Z. Petek Çakar, Uwe Sauer, and James E. Bailey
published in Biotechnol. Lett. 1999, 21: 611-616.

70
SUMMARY
Auxotrophic mutants may have physiological alterations and sensitivities which are not
generally recognized. Such features are shown here by observations that final cell
densities attained by several leucine-auxotrophic Saccharomyces cerevisiae strains depend
differently on the initial leucine concentration in the medium. Furthermore,
complementing such auxotrophic strains with the plasmid-based LEU2 selection marker
resulted in different final cell densities than chromosomal expression of LEU2 in the
otherwise isogenic, prototrophic strains. These results warn that auxotrophic host-related
physiological influences overlay any metabolic effect of a cloned gene expressed in such a
host, clearly complicating interpretation of the effect ofthat gene's product in scientific or
metabolic engineering research.

71
INTRODUCTION
In metabolic engineering (Bailey, 1991), auxotrophic host systems are often used to
ensure maintenance of plasmids with selectable markers. A typical example is the yeast
Saccharomyces cerevisiae, an important host for many traditional biotechnological
applications and heterologous protein production (Buckholz and Gleeson, 1991). In this
organism, the most common dominant selection markers are URA3, LEU2, TRP1, or
HIS3. They are used in auxotrophic yeast strains that are unable to synthesize uracil,
leucine, tryptophan, or histidine, respectively, and selection is achieved by cultivation in
minimal media without the relevant nutrient. Such auxotrophic hosts are not only
employed for genetic experiments, but also for heterologous protein production
(Kuriyama et al., 1992; Shu and Yang, 1996).
There are several problems associated with the use of such auxotrophic strains.
First, auxotrophic strains that are grown in a nutrient-supplemented medium are not
necessarily physiologically equivalent to the complemented transformants (Pronk et al.,
1996). Second, it is a priori not clear how much of the substrate for which the organism
is auxotrophic must be added to the growth medium, and there is a high degree of
variation in concentrations given in prior publications. Recently, for example, media
optimization studies revealed that the optimal L-leuciue concentration in defined yeast
media for cultivation of L-leucine S. cerevisiae auxotrophs must be 100 mg/L (Adams et
al., 1998), more than 3-fold of the concentration that was previously recommended (30
mg/L) in the standard yeast methods handbook (Rose et al., 1990). When one or more of
such substrates are supplemented insufficiently, dramatic changes in physiology and
growth behavior of a strain can be expected. Third, under auxotrophic substrate-limiting
conditions there is a strong selection pressure for revertants. If not recognized, such
effects may be misleading when the physiology of engineered and control strains is
compared.
In this paper we present systematic experiments designed to expose generally
unrecognized physiological sensitivities in auxotrophic yeast strains, with a focus on
yeast expression systems used in the context of metabolic engineering studies. For this
purpose, leucine demands and growth physiology of various S. cerevisiae hosts were
studied, including the well-defined CEN.PK strains which were found to be the best
academic model for industrial yeast strains (Brown, 1997).
72
MATERIALS AND METHODS
Strains and Plasmids
The following S. cerevisiae strains were used in this study: CBS7752 (MATa, ura3-52,
leu2-3/H2, trpl), Centraalbureau voor SchimmeJcultures (Delft, the Netherlands); W303-
\A (MATa, ade2-l, ura3-l, his3-Il/15, can!-100, leu2-3/112, trpl-1), Prof. F. Thoma
(Institute of Cell Biology, ETH Zürich, Switzerland); INVSCl (MATa, ura3-52, his3-
Al, leu2-3/112, trpl-289), Invitrogen BV (Leek, the Netherlands); and the CEN.PK
strains 102-5B (MATa, ura3-52, his3-Al, leu2-3/112, TRP1, MAL2-8C, SUC2), 113-6B
(MATa, ura3-52, HIS3, leu2-3/112, trpl-289, MAL2-8L, SC/C2). 113-11C (MATa, ura3-
52, his3-Al, LEU2, TRP1, MAL2-8\ SUC2), and 113-14A (MATa, ura3-52, HIS3,
LEU2, trpl-289, MAL2-8C, SUC2), Dr. P. Kötter (Institute of Microbiology, Johann
Wolfgang Goethe-University, Frankfurt, Germany). The constitutive yeast expression
vectors pAAH5 (Ammerer, 1983) and YEP24 (Botstein et al., 1979) were kindly
provided by Prof. T. WaUimann (Institute of Cell Biology, ETH Zürich, Switzerland).
Transformations
The strains CBS7752 and W303-1A were transformed by electroporation as described
previously (Becker and Guarante, 1990). INVSCl and CEN.PK strains were
transformed by using the S. cerevisiae EasyComp transformation kit (Invitrogen BV).
Transformants were selected by means of the LEU or URA markers on the plasmids
pAAH5 or YEP24, respectively.
Growth Media and Culture Conditions
For cultivations prior to transformation, YPD-medium (10 g yeast extract/L, 20 g
peptone/L, and 20 g dextrose/L) was used. Yeast minimal medium (YMM), containing
6.7 g yeast nitrogen base without amino acids (Difco)/L and glucose (2.0% w/v) as the
carbon source was used in physiological analyses. Filter-sterilized adenine sulfate,
histidine, tryptophan and uracil were added where appropriate to give 20 mg/L each.
Leucine was varied between 80-300 mg/L. Cells were grown until stationary phase using
a rotary shaker at 30°C and 200 rpm, in 500 mL baffled shake flasks containing 100 mL
medium. Achievement of stationary phase was verified by at least three consecutive OD600
readings.
Analytical Methods
Growth was monitored spectrophotometrically by measuring the optical density of
cultures at 600 nm (OD600) (I OD600 ~ 0.5 g cellular dry weight (cdw)/L). For
determination of cellular dry weight (cdw), Eppendorf tubes were dried at 80°C for 48 h,
cooled in a desiccator for 30 min and weighed. Two mL aliquots of culture broth were
centrifuged in these Eppendorf tubes at 15,800 g for 10 min in a benchtop centrifuge. The
resulting cell pellets were washed twice with 2 mL deionized water and dried at 80°C for
24 h. They were then placed in a desiccator for 30 min and weighed afterwards. The total

73
cell number was determined by counting the yeast cells in 13 pL of diluted (1:10) samples
by using an improved Neubauer haemocytometer. The cells were counted at 400x
magnification using a light microscope (Olympus BH-2, Japan).

74
RESULTS
Leucine Requirements of Auxotrophic 51. cerevisiae CEN.PK Strains
Initially, we determined the leucine requirements for auxotrophic strains of the industrial
5. cerevisiae model strain CEN.PK (Brown, 1997). In particular, dependence of final cell
density was determined as a function of initial leucine concentration. For this purpose,
auxotrophic CEN.PK 102-5B and 113-6B strains were grown in batch cultures initiated
with various leucine concentrations.
The results reveal that the leucine concentration required for optimum growth of
auxotrophic CEN.PK strains was much higher than the values suggested in the literature
for yeast growth (Figure 1, Table I). For both strains, increasing leucine concentrations
up to around 240 mg/L had a positive effect on the final cell density. For all strains
investigated, the final cell density was determined by means of cellular dry weight (cdw),
microscopic cell counting (data not shown), and optical density (OD600) measurements
(data not shown), all of which were consistent. Variations in the initial leucine
concentration did not affect the spécifie glucose uptake rates of these cultures.
Extracellular pH is probably not a relevant factor, because cultures with a higher final cell
density had even lower final pH values (approximately 0.5 pH units) than those with a
lower final cell density (data not shown). These cell density effects are most likely related
to the leucine requirements and not to the potential use of leucine as a nitrogen source,
since leucine is poorly utilized during nitrogen starvation and known to play a minor role
in nitrogen metabolism (Watson, 1976). Additionally, it should be noted that in all the
cases the cultures were not limited by nitrogen supply.
Leucine Requirements of Other S. cerevisiae Strains
The S. cerevisiae strain INVSCl reached final cell densities essentially identical to those
attained by CEN.PK (Table 1). Similar responses with respect to leucine supplementation
were also observed with two other commonly used strains, CBS7752 and W303-1 A, the
latter of which is the haploid form of the genomic functional analysis strain W303 (Riegel¬
et al., 1997).
For optimal growth, W303-1A has a leucine requirement higher than 80 mg/L,
which is also supported by a color change observation. The adel and ade2 mutants of S.
cerevisiae, such as W303-1A, produce a red pigment upon induction of their defective
adenine biosynthetic pathway, which happens normally when the cells exceed a certain
cell density. The lack of color change from white to pink in the case of W303-1A grown
with 80 mg leucine/L is caused by its growth at sub-optimal leucine levels, which results
in a delay or absence of pigment production, as was described previously for amino acid
auxotrophs carrying mutations in adel or ade2 (Pearson et al., 1986). Light absorption of
this pink pigment did not have a significant effect on ODh00 determinations.
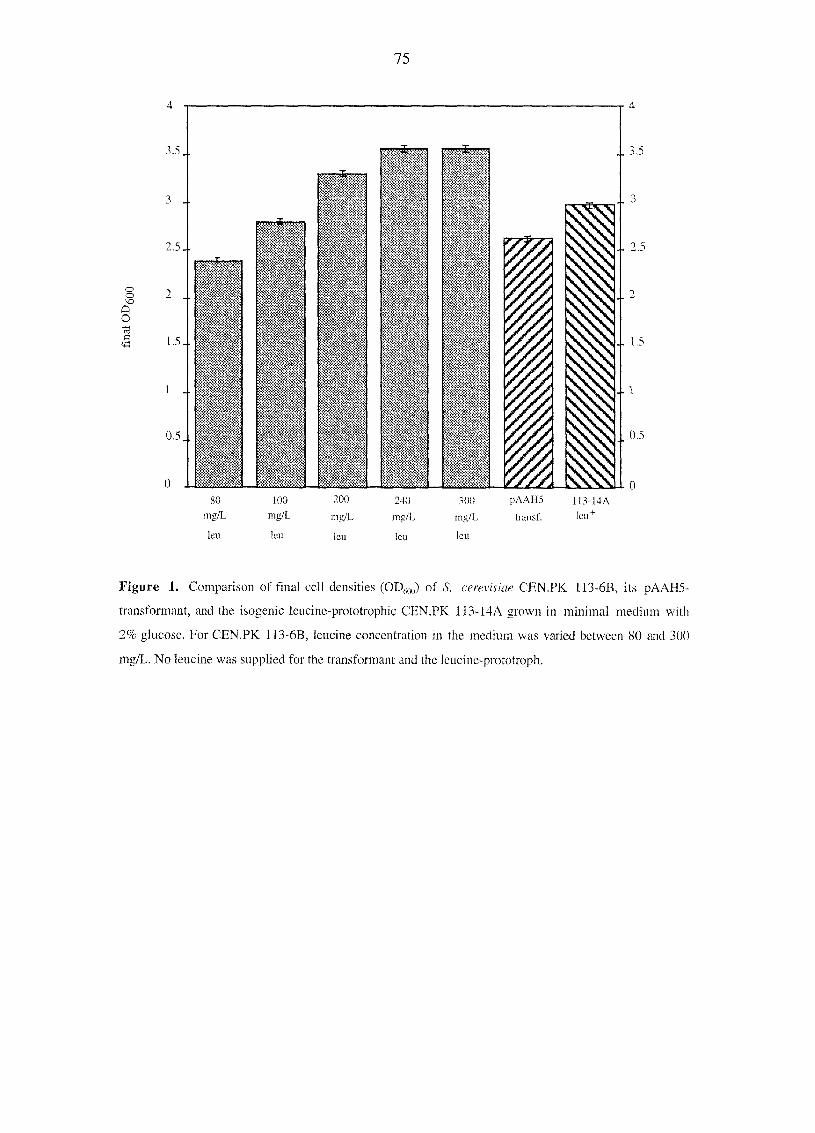
75
is
3..
25..
ooVO
QO
15..
1..
05.,
i^îâ^'
£$
£M&
m*.
80
mg/L
leu
100
mg/L
leu
200
mg/L
leu
240
me/L
leu
^00
mg/l
pAAH5
tiansf
m 14A
leu+
Figure 1. Companson of final cell densities (ODf00) ol 5 ceiexisiae CEN PK 113-6B, its pAAHS-
transtormant, and the isogenic leucine-prototrophic CEN PK 113-14A giown m minimal medium with
2% glucose For CEN PK 113-6B, leucine concentration m the medium was vaned between 80 and 300
mg/L No leucine was supplied for the transformant and the leucine-piototroph

76
Table 1. Final cellular dry weight (g/L) of S. cerevisiae strains grown in minimal medium with 2%
glucose and various leucine concentrations. The values given are the mean values of three independent
measurements.
StrainsNo leucine 80 ma leucme/L 240 mg leucine/L 300 mg leucme/L
CEN.PK 102.5B - 1 07+0 05 -
CEN.PK 102.5B+ pAAH5 1.25±0.05 - .
CEN.PK 113.11C 1.55±0.08 - -
CEN.PK 113.6B - 1.15+0.05 -
CEN.PK 113.6B+ pAAH5 1.37+0.05 - -
CEN.PK 113.14Ah 1.50±0.06 - -
INVSCl - 1 06+0.05 -
INVSCl+pAAH5 1.15+0.05 - -
W303-1A - 1.27+0.06 1.72+0.09
W303-lA+pAAH5 1.81+0.10 - -
CBS7752 - 0.94+0.05 1.05+0.08
CBS7752+pAAH5 0.44+0.04 - -
CBS7752+C - 0.83+0.04 1 08+0.06
CBS7752*+pAAH5 1.12+0.06 - -
1.60+0.07
1.75+0.07
1.62+0.07
isogenic to CEN.PK 102-5B except for the leucine prototrophy.
"Isogenic to CEN.PK 113-6B except for the leucine prototrophy.
CA tryptophan-revertant mutant strain obtained from CBS7752.
Plasmid-based Leucine Complementation
To investigate the physiological effects of plasmid-based leucine complementation on the
hosts mentioned above, their transformants with LEU marker-carrying plasmids were
grown in leucine-free media. In the case of CEN.PK strains, the corresponding isogenic
leucine-prototrophic strains were also investigated under the same growth conditions as
those of the transformants. The final cell densities of the isogenic leucine-prototrophic
CEN.PK strains cultivated in minimal medium without leucine supplementation were in
the range of those of the auxotrophs grown in minimal medium with about 150 mg
leucine/L (Figure 1, Table 1). These results clearly indicate that leucine concentrations for
auxotrophic CEN.PK strains should be at least 150 mg/L to make them comparable, with
respect to final cell density, to their isogenic leucine-prototrophs grown without leucine
supplementation. When grown in minimal medium without leucine supplementation,
pAAH5-transformants exhibited lower final cell densities than the prototrophic strains.
Growing these pAAH5-transformants in the presence of 80-240 mg leucine/L had no

77
discernible influence on the final cell densities (data not shown). Therefore, it appears that
metabolic perturbations of plasmid maintenance overlay leucine requirement, and, for that
matter, probably also other metabolic effects of cloned gene expression.
Surprisingly, the final cell density of W303-lA's pAAH5-transformant was
comparable to that of the host grown with the highest leucine supplementation (Figure 2,
Table 1). Similar to the transformants of CEN.PK strains, growth of the transformant of
W303-1A in the presence of leucine did not further increase its final cell density (data not
shown). However, the pAAH5-transformant of CBS7752 grew only to extremely low
densities, less than half the value reached by the host supplied with 80 mg leucinc/L
(Figure 2, Table 1). The presence of 300 mg leucine/L in the medium increased the final
cell density of this transformant more than two-fold (data not shown), which indicates an
intracellular limitation of leucine in the transformants.
oo*o
QO
c
2.5 •
2-"
1.5 -
0.5
A B C
• 2.5
• 2
15
'
0.5
80 240 plas. 80 240 plas 80 240 plas.
mg/L mg/L trans mg/L mg/L trans mg/L mg/L trans
Figure 2. Comparison of final cell densities (OD600) of wild-type S. cerevisiae W303-1A (A), CBS7752
(B), and CBS7752* (tryptophan revenant) (C) with those of their corresponding pAAH5-transformanls
grown in minimal medium with 29c glucose. The leucine concentration in the medium was either 80 or
240 mg/L, and no leucine was supplied for the transformants. CBS7752l was grown without tryptophan
supplementation.

78
Auxotrophic Reversion Interferes with a Seemingly Unrelated Auxotrophy
At least one auxotrophy of S. cerevisiae CBS7752 has an unexpectedly high frequency of
reversion with strong pleiotropic effects. We encountered this problem recently when
CBS7752 was co-transformed with the plasmids pAAH5 and YEP24. Transformants
were grown in yeast minimal medium containing 20 mg tryptophan/L, and, after about
100 generations, a tryptophan revenant was predominant. Plasmid curing studies showed
that the 'new' host was auxotrophic for uracil and leucine only and was denoted
CBS7752*. As a result of this reversion, cell physiology and response to plasmid
transformation were affected. Both CBS7752 and CBS7752* showed a similar behavior
with respect to leucine supplementation, while the presence or absence of 20 mg
tryptophan/L did not change the response of CBS7752*, illustrating that the change is
permanent and no longer tryptophan-dependent. Unexpectedly, CBS7752* was always
found to reach lower final cell densities than CBS7752 at 80 mg leucine/L
supplementation. The pAAH5-transformants of CBS7752* grew to much higher final cell
densities than the pAAH5-transformants of CBS7752 (Figure 2, Table 1). In contrast to
the transformants of CBS7752, the presence of leucine in the medium did not further
increase the final cell density of the transformants of CBS7752* (data not shown). Thus,
it remains unclear whether growth of transformants of CBS7752 is limited by leucine,
tryptophan or another yet unidentified component. These results indicate that seemingly
unrelated mutations in auxotrophic markers can augment the effects of limiting supply of
leucine and possibly other amino acids. Such mutations add a further difficulty to the
interpretation of the results obtained with auxotrophic hosts, in particular those with
multiple auxotrophies.

79
DISCUSSION
Physiological perturbations of enzyme overexpression or high-copy-number plasmid
burden are generally recognized (Bailey, 1993). Here we clearly show previously
neglected physiological sensitivities arising in auxotrophic yeasts and in these strains with
complementing vectors. Therefore, metabolic changes which occur when cloned genes
are expressed in such host-vector systems may well arise from peculiarities of the
auxotrophic host rather than from activity of the cloned proteins. Exogeneous
supplementation of leucine has a strong influence on the final cell density of all strains
investigated. Expression of a plasmid-based leucine marker gene has more heterogeneous
effects in a highly strain-specific fashion and may lead to final cell densities similar to
those obtained with the highest leucine supplementation of auxotrophs or much lower
values. The decrease can in some cases, but not in all, be partly cured by exogeneous
addition of leucine.
The problems of using auxotrophic host strains in physiological research are not
confined to yeast. Amino acid limitations were also observed at higher growth rates in
glucose-limited chemostat cultures of a methionine-auxotrophic Bacillus subtilis 1012
strain (Saito et al., 1979), supplemented with 50 mg methionine/L. At dilution rates
higher than 0.15 If1, the methionine-auxotrophic strain started to secrete substantial
amounts of acetate and the cell density dropped significantly (Sauer, unpublished). The
prototrophic wild-type strain and a riboflavin-producer, on the other hand, never excreted
acetate below a dilution rate of 0.7 h', and their cell density increased steadily up to a
dilution rate of 0.5 If1 (Sauer et al., f 996). Thus, the auxotrophic strain was apparently
limited by methionine, although the methionine supplementation provided was more than
two to three times the theoretical requirement for B. subtilis biomass.
Similar observations were made with auxotrophic Escherichia coli strains that are
frequently used in metabolic engineering and physiological research, such as HB 101
(A(gpt-proA)62, leu) and C600 (thi-1, thr-1, leuBG) (Boyer and Roulland-Dussoix, 1969;
Appleyard, 1954). Although compensating compounds were added to the feed stocks,
such strains are known to reach only medium cell densities in fed-batch cultivations with
minimal media (Riesenberg, 1991), supporting the view expressed here that the
phenotype of supplemented auxotrophs often does not compare well with those of their
prototrophic counterparts. Without rationali7ation, these factors are avoided in industrial
bioprocesses, where it is common practice to use prototrophic E. coli strains.
Amino acid auxotrophies are of particular importance in amino acid-producing
Corynebacterium glutamicum, because they are often used as growth-limiting nutrients in
fed-batch processes, or they interfere with the biosynthetic regulation of the produced
amino acid. Media optimization studies with the well-characterized leucine-auxotrophic C.
glutamicum MH20-22B revealed that for optimal lysine production, the initial leucine

80
concentration should be 315 mg/L in the first inoculum, but 1300 mg/L in the fed-batch
process, which reflects the dependence on cultivation conditions (Weuster-Botz et al.,
1997). However, another leucine-auxotrophic C. glutamicum strain has its highest
specific lysine production rate at low leucine concentrations that were achieved by
pulsewise supplementation (Takiguchi et al., 1997).
To avoid artifacts in metabolic engineering studies, we strongly recommend
avoiding auxotrophic host systems. The use of regulated promoters, which allow the
protein introduced to effect metabolic engineering to be turned on or off, minimizes
artifacts which may arise when using different genotypes to study the physiological
effects of this protein. However, even in this situation, changes in cultivation conditions
required for regulation of cloned gene expression may themselves have nontrivial
consequences (see, for example, Kosinski et al., 1992; Prati et al., 1999), reiterating the
importance of careful control experiments.
ACKNOWLEDGEMENTS
We thank Daniel E. Gottschling for advice on leucine requirements in supplemented yeast
minimal media, and Bärbel Hahn-Hägerdal, Johan Thevelein, Theo WaUimann, Uwe
Schlattner, and Martin Stolz for discussions of various aspects of this work.
This work was supported by the Swiss Bundesamt für Bildung und Wissenschaft
(BBW) within the Framework IV Biotechnology Programme of the European
Commission.
81
REFERENCES
Adams, A., Gottschling, D. E., Kaiser, C. A., Stearns, T. 1998. Methods in yeast
genetics: a Cold Spring Harbor Laboratory course manual, 1997 edition, Cold Spring
Harbor Laboratory Press, New York.
Ammerer, G. 1983. Expression of genes in yeast using the ADC1 promoter. Meth.
Enzymol. 101: 192-211.
Appleyard, R. K. 1954. Segregation of new lysogenic types during growth of a doubly
lysogenic strain derived from Escherichia coli K12. Genetics 39: 440-452.
Bailey, J. E. 1991. Toward a science of metabolic engineering. Science 252: 1668-1675.
Bailey, J. E. 1993. Host-vector interactions in Escherichia coli. Adv. Biochem. Eng.
Biotechnol. 48: 29-52.
Becker, D. M., Guarante, L. 1990. High efficiency transformation of yeast by
electroporation. Meth. Enzymol. 194: 182.
Botstein, D., Falco, S. C, Stewart, S. E., Breenan, M., Scherer, S., Stinchcomb, D.
T., Struhl, K., Davis, R. W. 1979. Sterile host yeasts (shy): a eukaryotic system of
biological containment for recombinant DNA experiments. Gene 8: 17-24.
Boyer, H. W., Roulland-Dussoix, D. 1969. A complementation analysis of the restriction
and modification of DNA in Escherichia coli. J. Mol. Biol. 41: 459-472.
Brown, A. J. P. 1997. Control of metabolic flux in yeasts and fungi. Trends Biotechnol.
15: 445-447.
Buckholz, R. G., Gleeson, M. A. G. 1991. Yeast systems for the commercial production
of heterologous proteins. Bio/Technol. 9: 1067-1071.
Kosinski, M. J., Rinas, U., Bailey, J. E. 1992. Isopropyl-ß-D-thiogalactopyranoside
influences the metabolism of Escherichia coli. Appl. Microbiol. Biotechnol. 36: 782-
784.
Kuriyama, M., Morita, S., Asakawa, N., Nakatsu, M., Kitano, K. 1992. Stabilization of
a recombinant plasmid in yeast. J. Ferment. Bioeng. 74: 139-144.
Pearson, B. M., Fuller, L. J., Mackenzie, D. A., Keenan, M. H. J. 1986. A red/white
selection for Saccharomyces cerevisiae auxotrophs. Lett. Appl. Microbiol. 3: 89-91.
Prati, E. G. P., Sutter, T. B., Matasci, M., Dinter, A., Sburlati, A. R., Bailey, J. E.
1999. Partial cloning and inducible inhibition of Galßl,3GalNAca2.3-sialyltransferase
in Chinese hamster ovary (CHO) cells. Biotechnol. Bioeng. (in press).
Pronk, J. T., Steensma, H. Y„ Van Dijken, J. P. 1996. Pyruvate metabolism in
Saccharomyces cerevisiae. Yeast 12: 1607-1633.
Rieger, K.J., Kaniak, A., Coppée, J.-Y., Aljinovic, G., Baudin-Baillieu, A.,
Orlowska, G., Gromadka, R., Groudinsky, O., Di Rago, J.-P., Slonimski, P. P.
1997. Large-scale phenotypic analysis- the pilot project on yeast chromosome III.
Yeast 13: 1547-1562.

82
Riesenberg, D. 1991. High-cell-density cultivation of Escherichia coli. Curr. Op. in
Biotech. 2: 380-384.
Rose, M. D., Winston, F., Hieter, P. 1990. Methods in yeast genetics: a laboratory
manual, Cold Spring Harbor Laboratory Press, New York.
Saito, H., Shibata, T., Ando, T. 1979. Mapping of genes determining
nonpermessiveness and host specific restriction to bacteriophages in Bacillus subtilis
Marburg. Mol. Gen. Genet. 170: 117-122.
Sauer, U., Hatzimanikatis, V., Hohmann, H., Manneberg, M., van Loon, A. P. G. M.,
Bailey, J. E. 1996. Physiology and metabolic fluxes of wild-type and riboflavin-
producing Bacillus subtilis. Appl. Environ. Microbiol. 62: 3687-3696.
Shu, C, Yang, S. 1996. Kinetics of continuous GM-CSF production by recombinant
Saccharomyces cerevisiae in an airlift bioreactor. J. Biotechnol. 48: 107-116.
Takiguchi, N., Shimizu, H., Shioya, S. 1997. An on-line physiological state recognition
system for the lysine fermentation process based on a metabolic reaction model.
Biotechnol. Bioeng. 55: 170-181.
Watson, T. G. 1976. Amino-acid pool composition of Saccharomyces cerevisiae as a
function of growth rate and amino-acid nitrogen source. J. Gen. Microbiol. 96: 263-
268.
Weuster-Botz, D., Kelle, R., Frantzen, M., Wandrey, C. 1997. Substrate controlled fed-
batch production of L-lysine with Corynebacterium glutamicum. Biotechnol. Prog. 13:
387-393.

83
Chapter 5
Vacuolar Morphology and Cell Cycle Distribution
are Modified by Leucine Limitation in Auxotrophic
Saccharomyces cerevisiae
Z. Petek Çakar, Uwe Sauer, James E. Bailey, Martin Müller11,
Martin Stolz1', Theo Wallimannb, and Uwe Schlattnerb
Laboratory of Electron Microscopy I, ETH Zurich
bInstitute of Cell Biology, ETH Zurich
84
SUMMARY
Yeast vacuoles are highly dynamic and flexible organelles. In this paper, we demonstrate
for the first time an interrelation of vacuolar morphology, cell cycle and amino acid
availability in auxotrophic Saccharomyces cerevisiae strains. To study cell morphology by
transmission electron microscopy, advanced high pressure freezing-freeze substitution
techniques were used for sample preparation, which so far have been barely successful in
yeast. Slight leucine limitation of leucine-auxotrophic S. cerevisiae led to growth
restriction and cells that were characterized by single, large vacuoles, a hexagonal
tonoplast pattern and a partial arrest in Gl-phase of cell cycle during later growth phases.
Relieving such limitations, either by providing unusually high extracellular leucine
concentrations in the medium, or via enhanced intracellular leucine biosynthesis due to
plasmid-based expression of a leucine marker gene, led to more than two-fold higher final
optical densities in stationary phase. Vacuoles fragmented to a different degree into
several smaller vesicles with rather homogenous membranes and only an inferior
proportion of cells remaining in Gl phase. These results reveal that not only nitrogen,
phosphate, or sulfate starvation, but also subtle, often unrecognized amino acid
limitations of commonly used auxotrophic S. cerevisiae strains can drastically affect cell
physiology, vacuolar morphology and cell cycle distribution. This presents a note of
caution for morphological and cell cycle studies in yeast. Our results further indicate that
vacuolar morphology and cell cycle can be related under batch growth conditions, in a
similar way as has been shown in synchronized cultures.

85
INTRODUCTION
The vacuole of S. cerevisiae is central to the physiology of this organism and is involved
in pH- and osmoregulation, protein degradation and storage of various compounds
(reviewed in Jones et al., 1997). Vacuoles are also highly dynamic and flexible organelles
that are sensitive to many factors, including the genetic background of a particular strain
as well as growth conditions (Weisman et al., 1987; Raymond et al., 1990). For
example, yeast vacuoles may change size and shape, alter the morphology of their
tonoplast (Moeller and Thomson, 1979a,b), move around or remain in close contact with
the nucleus (Jones et al., 1993). In addition, they may fragment into multiple small
vacuoles or, vice versa, fuse into one single large vacuole (Wiemken et al., 1970; Bryant
and Stevens, 1998). Although these phenomena were described in some detail, it has
remained unclear whether they are triggered by general, well-defined molecular or
physiological events or whether they simply depend on the yeast strain or the
experimental procedure (Weisman et al, 1987; Willison and Johnson, 1985).
Yeast cells have mostly a single, large spherical vacuole (Wiemken et al., 1970),
at least during the GI-phase of the cell cycle. Moeller and Thomson (1979a,b) have
analyzed in detail the morphology of tonoplast membranes during growth of S. cerevisiae
A364A batch cultures. They described aggregated states of intramembrane particles at the
transition from exponential to stationary phase, which form geometric, mostly hexagonal
patterns of particle-free regions. Similar patterns were observed in strain HMSF1, using
the temperature-sensitive secretory mutant seel at restrictive temperature (Necas and
Svoboda, 1986), but were not detected in other strains (Willison and Johnson, 1985). A
fragmentation of the large Gl-phase vacuole into several smaller vacuoles was first
observed in synchronized cultures prior to bud formation in S-phase (Wiemken et al.,
1970; Severs et al., 1976). In fact, as the cell cycle proceeds, some small vacuoles
migrate into the bud. When mitosis and cytokinesis are completed, bud and mother cell
vacuoles fuse, resulting in a single, large vacuole in each cell. Thus, fragmentation and
fusion of yeast vacuoles are integral part of vacuolar inheritance and their molecular basis
has been studied to some extent (Gaits and Russell, 1999; reviewed in Bryant and
Stevens, 1998). Vacuole fragmentation was also observed in certain vacuole protein
sorting (vps) mutants (Banta et al., 1988; reviewed in Bryant and Stevens, 1998), and
after treatment with microtubuli-inhibitors (Guthrie and Wickner, 1988), suggesting a
structural basis of this phenomenon. However, no correlation between vacuole
fragmentation and cell cycle was found in asynchronous batch cultures, except for an
adenine-supplemented ade mutant strain (Weisman et al., 1987). These authors
concluded vacuolar morphology to be cell cycle independent.
It is well known that the cell cycle of yeast is controlled by the availability of
nutrients. Deprivation of nutrients like glucose, ammonia, sulfate, phosphate, biotin, or

86
potassium leads to an arrest of cell division at the unbudded Gl-phase of S. cerevisiae
(Williamson and Scopes, 1962; Johnston et al., 1977). Other deprivations like
auxotrophic starvation may cause yeast cells to arrest at various points in the cell cycle
(Cooper et al., 1979). Our previous studies revealed that variations in leucine
supplementation of leucine-auxotrophic S. cerevisiae cause dramatic changes in growth
physiology (Çakar et al., 1999). Cells that were grown with insufficient leucine attained
much lower final cell densities in batch culture than with optimal leucine concentrations.
This raised the question if insufficient supply of auxotrophic amino acid(s) induces Gl-
arrest in these cultures. We also observed the frequent appearance of trp+ revertants of
strain CBS77752, denoted as CBS7752*. When transformed with pAAH5 (carrying the
LEU2 gene), CBS7752* grew to much higher cell densities than the wild type
transformant (Çakar et al, 1999). In addition, the presence of leucine in the medium
further increased the final cell density of CBS7752 transformants, but not that of
CBS7752* transformants, indicating that CBS7752 transformants are limited while
CBS7752* transformants essentially behaved like other auxotrophic yeast strains (Çakar
et al., 1999).
On the basis of these results, our present study aims to evaluate possible
interrelations between leucine starvation, cell cycle Gl-phase arrest and vacuolar
morphology in leucine-auxotrophic S. cerevisiae under leucine limitation. Slight leucine
starvation in the later growth phase was induced in two ways: (i) decreasing leucine
supplementation via the medium, and (ii) the use of wild type CBS7752 that grows only
to suboptimal final cell densities if a leucine marker gene is supplied on a plasmid,
together with the close descendant CBS7752* that grows normally if transformed with
the same plasmid.

87
MATERIALS AND METHODS
Strains and Plasmids, Transformation Protocol
S. cerevisiae strain CBS7752 (MATa, ura3-52, leu2-3/112, trpl) was from the
Centraalbureau voor Schinunelcultures (Delft, the Netherlands), and CEN.PK strain 113-
6B (MATa, ura3-52, HIS3, leu2-3/112, trpl-289, MAL2-8c, SUC2) was provided by
Dr. P. Kötter (Institute of Microbiology, Johann Wolfgang Goethe-University,
Frankfurt, Germany). For auxotrophic complementation we used the constitutive yeast
expression vectors pAAH5 (Ammerer, 1983) and YEP24 (Botstein et al., 1979). Strain
CBS7752 was transformed by electroporation (Becker and Guarante, 1990), CEN.PK by
using the S. cerevisiae EasyCompTM transformation kit (Invitrogen BV). Transformants
were selected by means of the leu or ura markers on the plasmids pAAH5 or YEP24,
respectively.
Growth Media and Culture Conditions
Yeast minimal medium (YMM), containing 6.7 g/L yeast nitrogen base without amino
acids (Difco) and glucose (0.5% w/v) as the carbon source, was used in all physiological
analyses. Filter-sterilized tryptophan and uracil were added where appropriate to a final
concentration of 20 mg/L each. The leucine concentration of the CEN.PK growth medium
was either 80 or 240 mg/L. Cells were grown until stationary phase using a rotary shaker
at 30°C and 200 rpm, in 1-L baffled shake flasks containing 250 mL medium.
Achievement of stationary phase was verified by at least three consecutive optical density
readings at 600 nm (OD600).
FACS Analysis
Sample preparation for FACS analysis was done as described before (Lew et al., 1992;
Deere et al., 1998) with some modifications. Liquid culture samples of I mL and IxlO6
cells/mL density were harvested and washed with ice-cold, sterile dH20. Absolute ethanol
was then added to the cells to a final concentration of 70%. The cells were kept at 4°C
overnight, for membrane permeabilization and fixation. They were then centrifuged and
washed once with Na-citrate (50 mM, pH 7.0), and resuspended in 500 uL Na-citrate.
RNase A was added to a final concentration of 1 mg/mL, and the cells were incubated for
2 h at 37°C and subsequently transferred on ice. Cell densities were again adjusted to
IxlO6 cells/mL by addition of cold, sterile PBS buffer (140 mM NaCl, 3 mM KCl, 10
mM Na2HP04 2 mM KH2P04) and 3 uL of propidium iodide (1 mg/ml in PBS buffer)
was added. Samples were incubated on ice in the dark for up to 2 hours before analysis.
FACS analysis was performed using an EPICS ELITE Analyzer (Coulter, USA), and
data were evaluated using the MultiCycle software.
Labeling of Yeast Vacuoles and Light Microscopy
Three mL of yeast culture in a light-protected tube were supplemented with 20 pL Cell
TrackerTMBiueCMAC(10mM stock solution. Molecular Probes, Eugene, OR, USA),

88
a cell-permeable fluorescent marker that accumulates specifically in vacuoles. After
incubation of the culture for 0.5-1 h at 30°C, yeast cells were harvested by centrifugation
at 4°C, washed once with ice-cold SPM buffer (1.2 M sorbitol, 1 mM MgCl2, 50 mM
KH2P04, 0.1 mM EDTA, pH 7.3), resuspended in 100 uL SPM buffer and finally kept at
4°C in the dark. On a glass slide coated with Concanavalin-A and poly-L lysine, a drop of
this suspension was immobilized under a coverslip and sealed with nail polish. Cells were
observed using a Carl Zeiss Inc. Axiophot microscope with a lOOx oil-immersion
objective, equipped for differential interference optics (DIC), i.e. Nomarski optics, and
epifluorescence. Fluorescence filters used were Carl Zeiss Inc. G365 (excitation), FT 395
(beam splitter), and LP420 (emission barrier). All DIC and fluorescent images were
photographed using a Kappa CF8/1 FMCC video-camera.
Transmission Electron Microscopy
Cells were conventionally fixed (Luft, 1961) with 2.5% glutaraldehyde, followed by 1%
Os04 and 1% K-ferrocyanide as described previously (van Tuinen and Riezman, 1987;
Banta et al, 1988), rendering the cell walls permeable by treatment with 1% sodium
metaperiodate. Thin sections were cut from Epon/Araldite blocks and poststained with 2%
aqueous uranylacetate, followed by lead citrate (Reynolds, 1963). Micrographs were
taken on a Jeol 200 transmission electron microscope at 80 kV. Cryopreparation of cells
for thin section TEM was performed as described previously (Hohenberg et al., 1994).
The suspensions were sucked into porous cellulose capillary tubes and cryoimmobili/ed
in their growth medium by high pressure freezing (Studer et al., 1979), using a Baltec
HPM 010 instrument. Freeze substitution was performed in 2% 0sO4 in acetone (van
Flarreveld and Crowell, 1964). Embedding, sectioning, poststaining and microscopy
were done as outlined above.
Cryo-scanning Electron Microscopy
Samples for cryo-scanning electron microscopy (cryo-SEM) were prepared and imaged as
described elsewhere (Walther et al., 1995; Walther and Müller, 1997). A 100-mesh
copper grid (diameter 3 mm) was dipped into the yeast suspension and mounted between
two aluminum platelets. This sandwich was frozen in a high pressure freezing machine
(HPM 010, Baltec, Balzers, Liechtenstein), and subsequently cryofractured in a freeze
etching device (BAF 300, Baltec) by removing one aluminum platelet with the microtome
knife (temperature 163 K, vacuum about 2x10⁷ mbar). After 2 min of etching
(sublimation of some water at the fracture face), the sample was coated by electron beam
evaporation with 3 nm of platinum-carbon, from an angle of 45°, and 8 nm of carbon,
perpendicularly. After coating, the samples were cryo-transferred under liquid nitrogen
into a cryo-SEM (Hitachi S-900 in-lens field emission) and analyzed in the frozen-
hydrated state on a cold stage (Gatan) at a temperature of 140 K. Images were recorded
using the backscattered electron signal.
89
RESULTS
Leucine Limitation Dramatically Affects Growth Behavior, Vacuolar
Morphology, and Cell Cycle Distribution of a S. cerevisiae CEN.PK
Strain
Based on our previous study of leucine effects on growth physiology (Çakar et al.,
1999), we hypothesized that unexpected growth limitation in batch cultures may be
caused by the intracellular availability of amino acids. Since amino acid starvation leads to
cell cycle arrest in Gl-phase and cell cycle may be related to vacuolar morphology
(Wiemken et al., 1970; Severs et al., 1976), we examined if slight leucine limitation of a
leucine-auxotrophic S. cerevisiae strain alone could alter both, vacuolar morphology and
cell cycle distribution.
For this study, we chose CEN.PK 113-6B, a leucine-auxotrophic strain of the
well-defined S. cerevisiae CEN.PK family (Brown, 1997). The amino acid availability
was modulated by growing the strain in minimal medium with different initial leucine
concentrations. 80 mg/L leucine were insufficient for optimal growth, since cultures
grown with 240 mg/L leucine attained 50% higher cell densities (Figure 1). Vacuole-
specific fluorescence staining revealed a single, large vacuole without any fragmentation
in the late exponential growth phase with 80 mg/L leucine (Figure 2a,b). However,
cultivation with 240 mg/L leucine led to a pronounced, although not complete vacuolar
fragmentation during later phases of growth (Figure 2c,d), where growth rates differed
largely between both culture conditions (see Figure 1). We then used FACS analysis to
investigate whether indeed slight leucine limitation was correlated not only with vacuole
morphology, but also with the cell cycle distribution, as was previously hypothesized
(Wiemken et al., 1970; Severs et al., 1976). With 80 mg/L initial leucine concentration, a
higher percentage of the CEN.PK 113-6B cells was in Gl-phase, and also in S-phase, as
compared to cells grown with 240 mg/L initial leucine concentration (Figure 3). This
difference was most pronounced at later stages of growth (i.e. 16 h). These results
support our hypothesis that insufficient supplementation of leucine prevents growth and
cell division of yeast cells and leads to altered vacuolar morphology.
Insufficient Leucine Biosynthesis Through Marker Gene Expression
Affects Vacuolar Morphology
In many experimental systems, auxotrophic mutations are not countered by extracellular
supplementation of the nutrient, but by transformation with plasmid-encoded auxotrophic
marker genes. While we have shown above that suboptimal extracellular supply of leucine
induced partial Gl arrest and altered vacuolar morphology, we here investigate the effects
of suboptimal leucine biosynthesis by strain-specific marker gene expression. For this
purpose, we chose the two 5. cerevisiae strains CBS7752, a wild-type strain, and
CBS7752*, a previously described pleiotropic mutant of this strain, which responds very

90
differently to plasmid-based marker gene expression (Çakar et al., 1999). For the wild-
type, these data indicated that plasmid-based expression of the leu2 marker gene was
insufficient for optimal leucine supply, as was evidenced by higher final cell densities
when extracellular leucine was added to the transformants. In contrast, final cell densities
attained by transformants of the mutant strain CBS7752* were similar to those of other
transformed leucine auxotrophic yeast strains, including CEN.PK (Çakar et al., 1999).
4
35
3
2.5
1.5
1
0.5
Q i 1 TU—i 1 1 1 1 -i 1 1 1—-J 1——J L—J L—j 1 1 ! i 1 i i
0 10 20 30 40 50
time (h)
Figure 1. Growth behavior of CEN.PK 113.6B on 0.5% glucose-YMM and at two different initial
leucine concentrations, 80 mg/L (circles) and 240 mg/L (squares). The arrow indicates the sampling time
for microscopy and FACS analysis.
1 1 1 1 | I 1 i 1 1 I I i I | i i i i | i i r
I [uw"*1''^
-ÖD

Figure 2. Vacuole fragmentation of CEN.PK 113.6B grown at 80 mg/L (a,b) and 240mg/L (c,d) initial
leucine concentration in the late exponential growth phase (16 h). Cells were grown on 0.5% glucose-
YMM and native stained with the vacuole-specific fluorescent marker dye Cell TrackerIM Blue CMAC.
Images were taken with DIC (a,c) or fluorescence microscopy (b,d). Note that each cell has a single, large
vacuole in (b), but smaller, 'diffuse', or partially fragmented vacuoles in (d). See arrows for fragmented
vacuoles. Bars: 3 um.
1«H1
ii,? A 80 mg/L leucine B 240 mg/L leucine
DNA content
Figure 3. Cell cycle distribution of CEN.PK 113-6B in late exponential growth phase (16 h). Cells
were grown on 0.5% glucose-YMM at two different initial leucine concentrations, 80 mg/L (A) and 240
mg/L (B). FACS was performed as described in Materials and Methods. The distribution of cell number
versus propidium iodide fluorescence is recalculated as a distribution of cells in phase Gl (DNA content
In), S and G2 (2;i) (see gray peaks, from left to right). Note the higher proportion of cells in Gl- and S-
phase at 80 mg/L initial leucine concentration.

92
To investigate whether insufficient synthesis of leucine via plasmid-based leucine
marker gene expression in wild-type CBS7752 causes similar morphological and cell
cycle effects as shown before with CEN.PK, we grew CBS7752 and CBS7752* in 0.5%
glucose-containing minimal medium (Figure 4). In stationaiy phase, transformants of
CBS7752* reached at least two-fold higher final optical densities compared to
transformants of CBS7752. These OD600 measurements were consistent with cellular dry
weight measurements and microscopic cell counts (data not shown). When CBS7752 and
CBS7752* transformants attained OD600 values of about 0.5 and 0.9, respectively,
glucose was completely consumed in the CBS7752* culture, while the CBS7752 culture
retained about 55% of the initial glucose (data not shown).
oo\o
QO
time (h)
Figure 4. Growth behavior of transformants of CBS7752 (circles) and revertant CBS7752'*' (squares) on
0.5% glucose-YMM.

93
Staining with a vacuole-specific fluorescent dye revealed a significant difference in
vacuolar morphology of these two strains (Figure 5). CBS7752 transformants generally
had a single, large vacuole that persisted throughout their entire growth (Figure 5b), as
seen already in CEN.PK with suboptimal leucine supply (Figure 2b). By contrast,
transformants of the revenant strain CBS7752X showed pronounced fragmentation of the
vacuole, especially when approaching late growth phase (Figure 5d), where the difference
in growth rate between CBS7752 and CBS7752^ transformants became most prominent
(see Figure 4). Vacuolar fragmentation was accompanied by a significant reduction of
cellular volume occupied by the vacuoles and by an increased background staining in the
cytosol with a vacuole-specific marker dye (Figure 5d).
Figure 5. Vacuole fragmentation of transformants of CBS7752 (a,b) and revenant CBS7752"- (c,d) at
late stages of growth. Cells were grown on 0 5% glucose-YMM and native staining of cells was
performed with the vacuole-specific fluorescent maiker dye Cell Tracker Blue CMAC. Images were
taken with DIC (a.c) or fluorescence microscopy (b,d). Note that each cell has a single, large vacuole in
(b), but multiple, smaller vacuoles in (d). Bars: 10 urn.
Cellular morphology of both yeast strains was further analyzed by different EM
methods (Müller and Moor, 1984; Studer et al., 1989; for a review see Kiss and
Staehelin, 1995), including conventional TEM (Figure 6a,d) and cryofixation-based (high
pressure-freezing-freeze-substitution) procedures for TEM (Figure 6b,e), as well as by
Cryo-SEM of high pressure frozen and freeze-fractured samples (Figure 6c,f). The
single, spherical vacuole of the CBS7752 transformant was found adjacent to the nucleus.
The tonoplast showed a very regular, geometric pattern of smooth hexagonal areas (0
-200 nm, Figure 6c), which were depressed towards the organelle interior and separated
by particle-rich rows. These rows corresponded to the edges of the scalloped pattern of
tonoplasts seen in thin-sectioned cells, especially after high-pressure cryofixation (Figure

94
6b). The typical CBS7752* transformant had multiple vacuoles with highly variable size,
distributed all over the cell and a rather smooth tonoplast surface without geometric
patterns (Figure 6f). In addition, the number of electron-microscopically isomorphous
vesicles, already seen in the CBS7752 transformant, increased significantly in the
CBS7752* transformant (Figure 6d,f). These vesicles, representing most likely lipid
droplets, were surrounded by a single lipid membrane and did not stain with our vacuole-
specific dye (Figures 2 and 5).

95
Figure 6. Cellular moiphology of transtonnants of CBS7752 (a c) and levertant CBS7752* (d f) giown
on 0 5% glucose YMM Miciographs were taken at late stages ol growth with TEM of chemically iixcd
Epon embedded cells (a,d) and high-piessuie ciyo lixed cells (be) oi with ciyo SEM of high picssuic
fiwen cells (c f) Note the scalloped tonoplast membrane (ab) coiresponding to a hexagonal tonoplast
pattern of aggregated mil amembiane particles in leucine limited CBS7752 (c) m contrast to the diffcient
vacuolai morphology and the accumulation ol lipid dioplcts in CBS7752!|- (d f) Abbieviations N
nucleus M mitochondrion L lipid droplet vm \acuolar membrane 1m membiane ol lipid dioplets
Bats 0 5 pm

96
Taken together, our results obtained with strains CEN.PK 113-6B and CBS7752
suggest that leucine limitation causes leucine-auxotrophic cells to accumulate at the Gl-
phase. This prevents cell growth and division and leads to the large, single vacuoles with
a geometric tonoplast pattern typical for non-dividing cells and induction of stationaiy
phase.

97
DISCUSSION
Vacuolar Morphology and Cell Cycle Distribution of Leucine-auxotrophic
S. cerevisiae Depend on Initial Leucine Supplementation
In this paper, we demonstrate for the first time an interrelation of vacuolar morphology,
cell cycle distribution and amino acid deprivation of auxotrophic S. cerevisiae. We also
present TEM analysis of high pressure-frozen, freeze-substituted yeast samples, which
preserve a maximum of their native structure. In contrast to freeze fracturing techniques
for TEM and SEM (Studer et al., 1989; McDonald et al., 1996; Erk et al., 1997), this
cryomethod has been only occasionally successful with yeast due to the quite
impermeable cell wall.
Leucine limitation in two different strains of leucine-auxotrophic S. cerevisiae was
found to dramatically change vacuolar morphology. Leucine-auxotrophic cells grown in
batch culture with limiting extracellular leucine supplementation or insufficient leucine
biosynthesis based on plasmid-based marker gene expression, had mostly single, large
vacuoles with a tonoplast showing geometric patterns of intramembrane particles. This is
characteristic of Gl-phase in the cell cycle of synchronized cultures (Wiemken et al.,
1970; Severs et al., 1976) and of a transition to stationaiy phase (Moeller and Thomson,
1979a), eventually leading to G0-arrest (reviewed in Werner-Washburne et al, 1996).
Thus, vacuolar morphology is consistent with a leucine-limitation of these cells, leading
to reduced growth and cell division. In contrast, growing batch cultures of auxotrophic
mutants at sufficient leucine supply yielded cells with many small vacuoles and rather
homogeneous tonoplast morphology, an indicator of budding and cell division.
Consistently, the portion of cells in Gl-phase was much more prominent in leucine-
auxotrophic cells as compared to cells grown with sufficient leucine supplementation.
This indicates a 'partial' Gl-arrest (Pringle and Hartwell, 1981) under leucine-limitation
and a close relationship between cell cycle and vacuolar morphology under batch growth
conditions. Taken together, our results demonstrate that not only nitrogen, phosphate, or
sulfate starvation (Williamson and Scopes, 1962; Johnston et al., 1977), but also subtle,
often unrecognized amino acid limitations in auxotrophic S. cerevisiae strains drastically
affect cell physiology, vacuolar morphology and cell cycle distribution.
Vacuolar Morphology is Cell Cycle-dependent Also Under Batch Growth
Conditions
The major morphological difference between leucine-limited and leucine-sufficient yeast
cells were changes in the vacuole ultrastructure, which coincided with differences in cell
cycle distribution. Indeed, it is known that yeast vacuoles are very flexible and dynamic
compartments, sensitive to different physiological and genetic conditions (Weisman et al.,
1987; Jones et al, 1993; Bryant and Stevens, 1998). We have found that fragmentation
of a single, large vacuole into multiple, small vacuoles of variable size were characteristic
98
of rapidly growing, non-leucine-limited batch cultures of S. cerevisiae. Such a vacuole
fragmentation in budding yeast has been described for strain A363A in synchronized
cultures, undergoing cell division (Wiemken et al., 1970; Severs et al, 1976) and for
several vps mutants (Bryant and Stevens, 1998). For strain CBS7752, we characterized
the ultrastructure of the single, large vacuole of leucine-limited cells in more detail. The
tonoplast showed hexagonal patterns, similar to those previously described for cells
approaching stationary phase (Moeller and Thomson, 1979a,b) and for secretion mutant
seel (Necas and Svoboda, 1986). These patterns are due to the aggregation of
intramembrane particles and were explained by phase separation of lipid molecules of the
tonoplast membrane (Moeller et al., 1981).
More recent studies, however, could not relate such morphological changes to
specific phases of cell division. Using asynchronous batch growth conditions, Weisman
et al. (1987) found that vacuole fragmentation was cell cycle-independent in strain
X2180-1A, and Willison and Johnson (1985) failed to observe geometric patterns at the
tonoplast surface of strain AGl-7 during later growth phase. The authors concluded that
changes in vacuolar morphology related to cell division were restricted to specific yeast
strains or dependent on synchronized culture conditions. By contrast, our results
demonstrate that vacuolar morphology also changes in asynchronous batch cultures as a
consequence of slight amino acid limitations. In addition, an ade2 mutant of strain
X2180-1A also showed significant vacuole fragmentation when grown with high levels
of adenine (Weisman et al., 1987). This is probably also due to an auxotrophic limitation,
as we have found for W303-1A, another ade" strain of S. cerevisiae (Çakar et al., 1999).
Cell Cycle Studies with Auxotrophic S. cerevisiae Can Be Misleading if
the Supply of Auxotrophic Substrate Is Limited
The significant influence of even subtle amino acid limitations on the cell cycle
distribution of batch cultures presents a note of caution for cell cycle studies in yeast, in
particular as 80-100 mg/L of leucine is not generally recognized as limiting and even
recommended by laboratory manuals (Adams et al., 1998). In fact, there are several
published reports that are likely to be affected by this correlation. For example, the cell
cycle behavior of auxotrophic S. cerevisiae strains was studied by flow cytometry, using
minimal media with an insufficient amino acid supplementation (Lew et al., 1992; Porro
and Srienc, 1995). In addition, some of the constructs used in those studies were based
on gene disruption via insertions of amino acid-encoding genes like leu2 (Lew et al.,
1992; Aon and Cortassa, 1998). It follows from our results that the comparisons made
with the wild type could be misleading, since the amino acid supplied by a gene does not
seem to have the same physiological effects as the externally supplied corresponding
amino acid (see also Çakar et al., 1999). In order to minimize such complications, the
amino acid concentrations that make auxotrophic strains comparable to their wild types

99
have to be determined carefully for each particular strain, before using them in cell cycle,
as well as physiological or morphological studies.
ACKNOWLEDGEMENTS
We thank Eva Niederer, Wolfgang Minas, Paul Walther and Else Zanoila for technical
assistance. This work was supported by the Swiss Bundesamt für Bildung und
Wissenschaft (BBW) within the Framework IV Biotechnology Programme of the
European Commission (to J.E.B.), the Swiss National Science Foundation (SNF grant
No. 3100-5082.97 to T.W. and U. Schlattner), and the ETH Zürich (graduate training
grant).

100
REFERENCES
Adams, A., Gottschling, D. E., Kaiser, C. A., Stearns, T. 1998. Methods in Yeast
Genetics: a Cold Spring Harbor Laboratory Course Manual, 1997 Edition. Cold Spring
Harbor Laboratory Press, New York.
Ammerer, G. 1983. Expression of genes in yeast using the ADC1 promoter. Meth.
Enzymol. 101: 192-211.
Aon, M. A., Cortassa, S. 1998. Catabolite repression mutants of Saccharomyces
cerevisiae show altered fermentative metabolism as well as cell cycle behavior in
glucose-limited chemostat cultures. Biotechnol. Bioeng. 59: 203-213.
Banta, L. M., Robinson, J. S., Klionsky. D. J., Emr, S. D. 1988. Organelle assembly in
yeast: characterization of yeast mutants defective in vacuolar biogenesis and protein
sorting. J. Cell. Biol. 107: 1369-1383.
Becker, D. M., Guarante, L. 1990. High efficiency transformation of yeast by
electroporation. Meth. Enzymol. 194: 182.
Botstein, D., Falco, S. C, Stewart, S. E., Breenan, M., Scherer, S., Stinchcomb, D.
T., Strahl, K., Davis, R. W. 1979. Sterile host yeasts (shy): a eukaryotic system of
biological containment for recombinant DNA experiments. Gene 8: f 7-24.
Brown, A. J. P. 1997. Control of metabolic flux in yeasts and fungi. Trends Biotechnol.
15: 445-447.
Bryant, N. J., Stevens, T. H. 1998. Vacuole biogenesis in Saccharomyces cerevisiae:
protein transport pathways to the yeast vacuole. Microbiol. Mol. Biol. Rev. 62: 230-
247.
Çakar, Z. P., Sauer, U., Bailey, J. E. 1999. Metabolic engineering of yeast: the perils of
auxotrophic hosts. Biotechnol. Lett. 21: 611-616.
Cooper, T. G., Britton, C, Brand, L., Sumrada, R. 1979. Addition of basic amino acids
prevents Gl-arrest of nitrogen-starved cultures of Saccharomyces cerevisiae. J.
Bacteriol. 137: 1447-1448.
Deere, D., Shen, J., Vesey, G., Bell, P., Bissinger, P., Veal, D. 1998. Flow cytometry
and cell sorting for yeast viability assessment and cell selection. Yeast 14: 147-160.
Erk, I., Nicolas, G., Caroff, A., Lepault, J. 1998. Electron microscopy of frozen
biological objects: a study using cryosectioning and cryosubstitution. J. Microscopy
189: 236-248.
Gaits, F., Russell, P. 1999. Vacuole fusion regulated by protein phosphatase 2C in
fission yeast. Mol. Biol. Cell 10: 2647-2654.
Guthrie, B. A., Wickner, W. 1988. Yeast vacuoles fragment when microtubules are
disrupted. J. Cell Biol. 107: 115-120.
Hohenberg, H.. Mannweiler, K., Müller, M. 1994. High-pressure freezing of cell
suspensions in cellulose capillary tubes. J. Microscopy 175: 34-43.

101
Jones, H. D., Schliwa, M., Drubin, D. G. 1993. Video microscopy of organelle
inheritance and mobility in budding yeast. Cell Motil. Cytoskeleton 25: 129-142.
Jones, E. W., Webb, G. C, Hiller, M. A. 1997. Molecular Biology of the Yeast
Saccharomyces cerevisiae vol. III. Cold Spring Harbor Laboratory Press, New York.
Johnston, G. C, Pringle, J. R., Hartwell, L. H. 1977. Coordination of growth with cell
division in the yeast Saccharomyces cerevisiae. Exp. Cell Res. 105: 79-98.
Kiss, J. Z., Staehelin, L. A. 1995. High pressure freezing. In: N.J. Severs, D.M.
Shotton (eds.): Rapid Freezing, Freeze Fracture and Deep Etching, Wiley-Liss Inc.,
pp. 89-104.
Lew, D. J., Marini, N. J., Reed, S. I. 1992. Different Gl cyclins control the timing of
cell cycle commitment in mother and daughter cells of the budding yeast S. cerevisiae.
Cell 69: 317-327.
Luft, J. H. 1961. Improvements in epoxy resin embedding methods. J. Biophys.
Biochem. Cytol. 9: 409-414.
McDonald, K., O'Toole, E. T., Mastronarde, D. N„ Winey, M„ Mcintosh, J. R. 1996.
Mapping the three-dimensional organization of microtubules in mitotic spindles of
yeast. Trends in Cell Biol. 6: 235-239.
Moeller, C. H., Thomson, W. W. 1979a. An ultrastructural study of yeast tonoplast
during the shift from exponential to stationary phase. J. Ultrastruct. Res. 68: 28-37.
Moeller, C. H., Thomson, W. W. 1979b. Uptake of lipid bodies by the yeast vacuole
involving areas of the tonoplast depleted of intramembranous particles. J. Ultrastruct.
Res. 68: 38-45.
Moeller, C. H., Mudd, J. B., Thomson, W. W. 1981. Lipid phase separations and
intramembranous particle movements in the yeast vacuole. Biochim. Biophys. Acta
643: 376-386.
Müller, M., Moor, H. 1984. Cryofixation of thick specimens by high-pressure freezing.
In: J. P. Revel, T. Barnard, G. H. Haggis (eds.): The Science of Biological Specimen
Preparation, AMF O'Hare, Chicago, pp. 131-138.
Necas, O., Svoboda, A. 1986. Ultrastructure of two secretory mutants of Saccharomyces
cerevisiae as revealed by freeze-fracture techniques. Eur. J. Cell Biol. 41: 165-173.
Porro, D., Srienc, F. 1995. Tracking of individual cell cohorts in asynchronous
Saccharomyces cerevisiae populations. Biotechnol. Prog. 11: 342-347.
Pringle, J. R., Hartwell, L. H. 1981. The Saccharomyces cerevisiae cell cycle. In: J.N.
Strathern, E.W. Jones, J.R. Broach (eds.): The Molecular Biology of the Yeast
Saccharomyces, Life Cycle and Inheritance, Cold Spring Harbor Laboratory Press,
NewYork, pp. 45-55.

102
Raymond, C. K., O'Hara, P. L, Eichingcr, G., Rothman, J. H., Stevens, T. H. 1990.
Molecular analysis of the yeast vps3 gene and its role in vacuolar protein sorting and
vacuolar segregation during the cell cycle. J. Cell Biol. Ill: 877-92.
Reynolds, E. S. 1963. The use of lead citrate at high pH as an electron-opaque stain in
electron microscopy. J. Cell. Biol. 17: 208-212.
Severs, N. J., Jordan, E. G., Williamson, D. H. 1976. Nuclear pore absence from areas
of close association between nucleus and vacuole in synchronous yeast cultures. J.
Ultrastruct. Res. 55:374-387.
Studer, D., Michel, M., Müller, M. 1989. High pressure freezing comes of age.
Scanning Microsc. Suppl. 3: 253-269.
Takeshige, K., Baba, M., Tsuboi, S., Noda, T., Ohsumi, Y. 1992. Autophagy in yeast
demonstrated with proteinase-deficient mutants and conditions for its induction. J. Cell
Biol. 119: 301-311.
van Harreveld, A., Crowell, J. 1974. Electron microscopy after rapid freezing on a metal
surface and substitution fixation. Anat. Rec. 149: 381-386.
van Tuinen, E., Riezman, H. 1987. Immunolocalization of glyceraldehyde-3-phosphate
dehydrogenase, hexokinase, and carboxypeptidase Y in yeast cells at the ultrastructural
level. J. Histochem. Cytochem. 35: 327-333.
Walther, P., Wehrli, E., Hermann, R., Müller, M. 1995. Double layer coating for high
resolution low temperature SEM. J. Microscopy 179: 229-237.
Walther, P., Müller, M. 1997. Double-layer coating for field-emission cryo-scanning
electron microscopy -present state and applications. Scanning 19: 343-348.
Weisman, L. S., Bacallao, R., Wickner, W. 1987. Multiple methods of visualizing the
yeast vacuole permit evaluation of its morphology and inheritance during the cell cycle.
J. Cell. Biol. 105: 1539-1547.
Werner-Washburne, M., Braun, E. L., Crawford, M. E., Peck, V. M. 1996. Stationaiy
phase in Saccharomyces cerevisiae. Mol. Microbiol. 19: 1159-1166.
Wiemken, A., Matile, P., Moor, H. 1970. Vacuolar dynamics in synchronously budding
yeast. Arch. Mikrobiol. 70: 89-103.
Williamson, D. H., Scopes, A. W. 1962. A rapid method for synchronizing division in
the yeast Saccharomyces cerevisiae. Nature 193: 256-257.
Willison, J. H. M., Johnson, G. C. 1985. Ultrastructure of Saccharomyces cerevisiae
strain AGl-7 and its responses to changes in environment. Can. J. Microbiol. 31: 109-
118.

103
Chapter 6
Directed Evolution of Multiple-Stress Resistant
Saccharomyces cerevisiae

104
SUMMARY
Various chemostat selection regimes and successive batch selection approaches were
employed to elucidate their capability to select for multiple-stress resistant Saccharomyces
cerevisiae strains. To increase genetic diversity prior to selection, all cultures were
inoculated from the same pool of chemically mutagenized CEN.PK cells. Populations
harvested at different time points during the selections as well as clones from selected
populations were grown in batch cultures and exposed to oxidative, freezing, temperature
and ethanol stresses, in order to determine the relative resistance levels. The results
revealed that transient stress challenges in chemostat yield 'generalists', namely mutants
with up to 10-fold improved oxidative, freezing, and ethanol stress survival, compared to
the wild-type. Alternatively, subjecting a population to cycles of mutation and selection in
batch culture yielded "specialists', mutants with highly improved (up to 150-fold)
resistances to two types of stresses (oxidative and freezing). Less successful were
selection strategies with permanent stress challenge and without a direct stress challenge,
although in the latter case freezing tolerance was improved up to 160-fold, It appears that
the ideal selection strategy to obtain multiple-stress resistant S. cerevisiae would be a
combination of batch selection and transient stress challenges in a chemostat, i. e. batch
selection for oxidative stress resistance followed by extensive starvation in a glucose-
limited chemostat.

105
INTRODUCTION
In metabolic engineering, cellular activities are improved by directed manipulation of
enzymatic, transport, and regulatory functions of the cell with the use of recombinant
DNA technology (Bailey, 1991). This rational and deductive strategy is usually based on
existing knowledge on the metabolic systems and a proposed, more or less defined,
genetic manipulation towards a desired objective. However, selection of the effective
targets is often hampered by our limited understanding of the complex cellular systems
and by unanticipated secondary responses to genetic manipulation. As an alternative
approach, inverse metabolic engineering attempts to reduce such problems by starting
with the identification of a desired phenotype (Bailey et al., 1996). The genetic or
environmental basis for this phenotype is then elucidated; and subsequently endowed on
the organism of interest. This strategy has been successfully employed to increase the
energetic efficiency of microaerobic bacterial respiration (Bailey et al., 1996).
However, many biotechnologically desirable phenotypes are not readily available
in nature. One strategy to create such desired phenotypes for inverse metabolic
engineering involves random mutation and selection of desired variants from the
population. This has frequently been used in combination with selection on solid media to
confer a specific phenotype to a strain, but may also be done by continuous selection of
evolving populations in liquid culture, for example, in chemostat cultures (Dykhuizen and
Haiti, 1983). Driven by spontaneous or induced mutagenesis, the initially monoclonal
population segregates and fitter variants periodically take-over the culture. If an
appropriate selection pressure towards a desired phenotype is applied, this procedure is
referred to as directed evolution. Alternatively, selection for fitter variants may also be
achieved by a person that periodically removes certain phenotypes from the population.
There are several successful selection studies reported. One example is evolution
of phenol-degrading Pseudomonas strains (Masque et al., 1987). Another example is
chemostat selection, at increasing chloramphenicol concentrations, of plasmids with
increased segregational stability in Bacillus subtilis (Fleming et al., 1988). In a recent
study, the evolution of Escherichia coli mutants was investigated in a glycerol-limited
chemostat at a dilution rate of 0.05 h"1 over 126 days (Weikert et al., 1997). After this
time, about 90% of the chemostat population consisted of mutant strains with altered
colony morphology. Two particular isolates with this morphology had higher stress
resistance, growth rates and biomass yields in batch cultures on various carbon sources,
as compared to the parent strain.
To fully exploit such directed evolution strategies for inverse metabolic
engineering, it is a prerequisite to identify the genetic basis of the evolved desired
phenotype. While this is generally rather difficult to achieve, in particular in the absence
of any information on the affected genes, there are several novel analytical methodologies

106
that may facilitate such endeavors. One example is two dimensional protein gel
electrophoresis, which, in combination with mass spectroscopy and genomic sequence
data, can identify differences in whole cell protein composition between mutants and
parent (Wilkins et al., 1996). Another example are high-density oligonucleotide arrays
that allow to monitor global mRNA levels. In this approach, mRNA levels are determined
by hybridizing complete mRNA populations to sets of arrays which contain hundreds of
thousand of chemically synthesized oligonucleotides (Wodicka et al., 1997). Both
techniques are potentially capable of identifying the genetic basis of mutants with
desirable characteristics.
Resistance to multiple stresses is a rather complex phenotype, which is very useful
for applied purposes but would be difficult to achieve rationally. In all traditional yeast
processes such as baking, brewing, distiller's fermentations, and wine making, the cells
are exposed to various environmental stresses. There are several reported studies that
investigate genetic factors that are involved in single stress resistances and how these
factors may be improved. Typical examples are freeze- (Takagi et al., 1997) and salt-
tolerant (Matsutani et al., 1992) Saccharomyces cerevisiae laboratory strains that were
obtained by mutation and direct selection procedures. However, for improved process
performance, a strain should acquire resistance to multiple stresses, because even the
most common yeast bioprocess, aerobic fed-batch production of baker's yeast, causes a
variety of stress conditions (Attfield, 1997). Firstly, the process is ultimately limited by
the aeration capacity of the bioreactor system (Evans, 1990). Secondly, accumulation of
metabolic byproducts like alcohols and organic acids poses additional challenges.
Additionally, the fact that manufacturers grow baker's yeast at supraoptimal temperatures
and often add salts causes further stress to yeasts (Reed and Nagodawithana, 1991).
Moreover, molasses contain not only sugars, but also metabolizable and non-
metabolizabie inhibitors that can accumulate during the fed-batch process and damage
yeast cells (Yokota and Fagerson, 1971). In addition to the production process, the
storage of yeast in frozen dough introduces the additional stress of freezing/thawing
(Attfield, 1997).
Here we compare the efficiency of different selection procedures for obtaining S.
cerevisiae strains with multiple-stress resistance. These procedures can be categorized into
five groups. First, glucose-limited chemostats under 'permanent stress challenge', where
a growing population is challenged with increasing concentrations of the oxidative stress
agent H202 or temperature oscillations. Second, glucose-limited chemostats were
subjected to 'transient stress challenges', including heat shock and starvation. Third and
fourth, chemostats were operated under glucose or ethanol limitation in the absence of any
other stress challenge. Fifth, successive cycles of mutation and selection were performed
in batch cultures. To increase genetic diversity, the populations were subjected to

107
chemical mutagenesis prior to selection. The isolated mutant strains were characterized for
their viability after exposure to four selected stresses. In order to access the genetic basis
of the improved stress resistance phenotype, total mRNA was isolated and sent out for
global transcript analysis.

108
MATERIALS AND METHODS
Strain, Media, and Chemical Mutagenesis
The S. cerevisiae wild-type strain CEN.PK 113.7D (MATa, MAL2-8C, SUC2), obtained
from Dr. P. Kötter (Institute of Microbiology, Johann Wolfgang Goethe-University,
Frankfurt, Germany) was used throughout this study. For cultivation prior to chemical
mutagenesis, YPD medium (10 g/L yeast extract, 20 g/L peptone, and 20 g/L dextrose)
was used. Yeast minimal medium (YMM), containing 0.5% (w/v) glucose and 6.7 g/L
yeast nitrogen base without amino acids (Difco) was used in all other cultivations. For the
ethanol-limited chemostat, 0.5% (v/v) ethanol was used as the sole carbon source. EMS
(ethyl methane sulfonate) mutagenesis was performed as described elsewhere (Lawrence,
1991).
Selection Cultures
Chemostat cultures were grown in a 1.5-L benchtop fermentor (Bioengineering) with 1 L
working volume at a dilution rate of 0.07 h '. The pH was maintained at 5.5 ± 0.1 by the
addition of 3 M KOH. The cultivation temperature was 30°C, stirrer speed at 1200 rpm,
and the aeration rate was 0.5 L air/min. Polypropylene glycol 2000 (1:10 (v/v) dilution in
dH20) (Fluka) was added at 200 uL/L to prevent foaming. A mass-controlled pump was
used to keep the culture volume constant. Temperature oscillations were achieved by
sinusoidally varying the temperature between 25°C and 35°C. During the oscillations, one
full sinusoidal cycle (2n) was completed in 1 h. The oscillations were continued for 7
days (about 17 generations). Batch cultures were grown in test tubes under aerobic
conditions at 30°C and 200 rpm in YMM containing 0.5% (w/v) glucose as the sole
carbon source. Aliquots were taken from both chemostat and batch cultures at regular
intervals and kept at -20°C as frozen stocks in 30% (v/v) glycerol. Diluted aliquots were
plated on solid YPD medium in order to verify the absence of contaminants.
Estimation of Stress Resistance
Cell growth was monitored by determining the optical density at 600 nm (OD600).Resistance to oxidative stress, heat shock, rapid freezing, and ethanol was determined as
described previously (Lewis et al., 1997). Briefly, cells were grown at 30°C and 200 rpm
into late exponential growth phase (OD600=1.2-1.8) in YMM containing 2% (w/v) glucose
as the sole carbon source. They were then harvested at 3000 rpm for 2 min in a benchtop
centrifuge and resuspended in 5 mL of fresh medium without glucose. For each stress, 1
mL-aliquots of cells were used. Oxidative stress was applied by adding H202 to the
cultures at a final concentration of 0.3 M. Cells were then incubated at room temperature
for 1 h, harvested as above, and resuspended in fresh medium. For heat shock, the cells
were incubated at 65°C for 10 min in an Eppendorf heater-shaker, and then cooled on ice.
For rapid freezing, aliquots of cells in 1.5 mL-microfuge tubes were immersed in liquid
nitrogen for 20 min and then thawed in a water bath at 24°C for 2-3 min. Ethanol stress

109
was applied by adding absolute ethanol to a final concentration of 20% (v/v) and
incubation for 30 min at room temperature, after which the cells were harvested as above
and resuspended in fresh medium.
Analytical Methods
A Synchron CX5CE automated enzyme analysis system (Beckman) was used to
determine glucose and ethanol concentrations in the culture supernatant using kits
supplied by the manufacturer. The concentrations of oxygen and carbon dioxide in the
reactor off-gas were determined with a Fisons quadrupole mass spectrometer (Uxbridge).
Viable cell numbers were determined by a most-probable-number (MPN) assay (Russek
and Colwell, 1983), using serial dilutions in 96-well plates that contained 180 uL YMM
with 2% (w/v) glucose. For five parallel samples, dilutions were made in the range of 10"
l-10"8. Based on the ability of aliquots to grow at higher dilutions, their MPN cell counts
were estimated by using published tables for the case of 'five-tube MPN' (Lindquist,
1999).
Isolation of 5. cerevisiae Total RNA and mRNA for Transcriptome
Analysis
Fifty mL yeast culture at an OD6()0 of 0.4 or 1.2 were either harvested directly (for stress-
negative controls) or as quickly as possible after the stress challenge in a benchtop
centrifuge at 3000 rpm for 1 min at room temperature. The pellets were frozen
immediately in liquid nitrogen and stored at -80°C. For RNA isolation, pellets were
resuspended in 7 mL lysis buffer (10 mM Tris-HCl, pH 7.5; 10 mM EDTA, 0.5% (w/v)
SDS) and 7 mL water-saturated acid phenol (C. Mei-Fang Kao, personal
communication), vortexed vigorously, and incubated in a water bath at 65°C for 1 h with
occasional vortexing. The samples were then placed on ice for 10 min and transferred to
sterile 15-mL tubes for phase separation at 3000 rpm and 10 min at room temperature.
The aqueous phase was transferred to a fresh centrifuge tube and reextracted with phenol
as above at room temperature without incubation. After an additional extraction with
chloroform, the aqueous phase was transferred to a fresh tube and incubated at -20°C for
30 min after addition of sodium acetate to 0.3 M and two volumes of 100% ethanol. RNA
pellets were then obtained by centrifugation as above, and dried overnight with loose
caps. They were then resuspended in 100 uL ddH20 and the RNA content and purity was
determined by measuring OD260 and OD,80 in a UV/Vis spectrophotometer. Furthermore,
RNA was separated and visualized on a 2% agarose gel, to verify the absence of
significant degradation.
Isolation of mRNA from total RNA was performed using a commercial mRNA
isolation kit according to the instructions of the manufacturer (Oligotex mRNA Midi Kit,
QIAGEN).
110
RESULTS
Following chemical mutagenesis to increase genetic diversity, several batch and chemostat
selection procedures were performed to compare their efficiency to enrich or evolve
multiple-stress resistant yeast strains from the mutagenized population. Schematic
representations of the employed directed evolution strategies are shown in Figure la and
b. All selections were started with the same pool of EMS mutants. To minimize
potentially interfering adaptations to different environmental conditions, all chemostats
were performed at a dilution rate of 0.07 h"1. To monitor the progress of selection,
aliquots of the population were subjected to four different stresses and their capability for
survival was determined by the MPN method. All samples for these analyses were taken
from aliquots that were frozen at different time points of the cultivations, to assure
identical pre-stress treatment.
Permanent Stress Challenge (PSC) in Chemostat Culture
As a first selection approach, EMS-mutagenized CEN.PK was grown in a glucose-limited
chemostat and exposed to a permanent but gradually increasing stress challenge after
reaching a physiological steady state. Oxidative stress was chosen as the first stress,
because a previous co-tolerance study reported a strong correlation of oxidative stress
tolerance with several other stress tolerances (Lewis et al., 1997). For this purpose, the
concentration of H202 in the feed was increased from 0 to 100 mM in steps of 20 mM
H202 per day, which equals 2.4 generations. After this period, the CO, concentration in
the fermenter off-gas remained essentially unaltered. After 17 generations, at a final feed
concentration of 100 mM H202, it was not possible to further increase the concentration
without risking wash-out. The culture was then switched to a new medium without H202
and was challenged with sinusoidally oscillating temperature between 25°C and 35°C for
another 17 generations.
The relative resistance to each stress is given in Table 1, revealing that there was
apparently no effective selection for improved resistance to any of the stresses
investigated. The sole exception was a 30% improvement in temperature resistance of the
PSCL5 population, withdrawn after 17 generations of exposure to oscillating temperature.
Because the performance of the population represents the average of different variants that
may co-exist, we picked 24 randomly chosen clones from a plated aliquot of the PSC8
and PSC 15 populations. The individual stress resistances of the 24 clones varied within
10% and the statistical average resembled the performance of the whole population,
including the 30% increased temperature resistance (data not shown).

Ill
(a)oxidative «•
stress
WSC4
Mr
WSC"!
:olor changelü pink
PSC1
WSC 5
WSC6
WSC7
ws cs
4 3 2 1
H—h
WSC2wsci PS.C1
t -J'rf J f EMS f
'
TSCi—
S2T, 3 mm-
TSC2 -
52°C, 6niin-
TSC3,
starvation stmts
starvation ends -
TSC4 -
tsci
2 3
,ESC2
,ESC1
,ESC4
7 8 9 10 11 12 13 14 15
I 1 1 ur»it= 1 week= 16.94 generations for ESC and WSC
I 1 1 unit = 1 day = 2 42 generations for TSC and PSC
H fiiiE-}
| j i unit ~ 12 h batch uil!i\a!ion == ï 46 generations
Figure 1. Schematic representation of chemostat (a) and batch (b) selection strategies used. PSC:
permanent stress challenge; TSC: transient stress challenge; ESC; ethanol-limited chemostat without
stress challenge; WSC: glucose-limited chemostat without stress challenge. II,, H,H2, H,T2, EI,H2E,, and
H,T2N, are the batch populations withdrawn at the indicated points. The numbers following the selection
abbreviation refer to weekly (ESC and WSC) or daily (TSC and PSC) samples taken from the chemostats.
The sinusoidal curve (PSC9-PSC15) is not drawn to scale, as 192 cycles were performed over the period
of selection. The samples PSC2 to PSC6 were taken in steady state just before each stepwise increase in
H202 stress. In batch selection, stresses were applied immediately after EMS mutagenesis.

112
Table 1. Stress resistances of various mutant populations expressed as survival ratios normalized to the
wild-type CEN.PK level. The absolute survival ratios for CEN.PK to each stress were between 0.5 and
3xl0~3. For abbreviations see the legend to Figure 1.
POPULATION STRESS
oxidative freezing temperature ethanol
Permanent
Challenge
Stress
(PSC)
PSCI 1.0+0.0
PSC2 0.9±0.l
PSC3 1.0+0.1
PSC4 1.010.0
PSC5 0.9+0.0
PSC6 0.9+0,1
PSC7 1.0+0.0
PSC8 1.0±0.1
PSC9 1.010.0
PSC 12 0.9+0.1
PSCI 5 0.9+0.1
Transient Stress
Challenge (TSC)
TSC1 1.0+1.0
TSC2 1.0+1.0
TSC3 1.0±0.0
TSC4 5±1
Without St
Challenge
rest
(WSC)
WSC1 1.0+0.1
WSC2 1.010.0
WSC3 0.910.1
WSC4 0.910.1
WSC5 1.010.1
WSC6 1.010.0
WSC7 0.9+0.1
WSC8 1.0+0.0
Ethanol St
Challenge
ress
(ESC)
ESC1 1.010.1
RSC2 0.910.1
F.SC3 1.010.0
ESC4 1.010.1
Batch Stress
Challenges
n, 1.010.0
11,14, 3013
H jHtIi^ 914
H,T, l.OiO.l
H,T„N, 6513 S
0.9+0.1
0.9+0.0
1.0+0.1
0.910.1
1.0+0.0
0.910.Ü
1.010.0
1.0+0.1
1.0+0.1
1.0+0.1
0.910.1
1.0+0.1
1.010.0
1.0+1.0
812
1.010.0
1.010.1
1.0+0.2
1.010.1
160110
155+8
150+10
153+9
0.910.1
1.0+0 0
0.9+0.1
1.0+0.1
0.910.1
145155
87+32
2116
2518
1.0+0.1
0.910.1
0.910.1
1.010.1
1.010.1
0.9+0.1
0.910.1
0.910.0
0.9+0.0
1.0+0.0
1.3+0.1
1.0+0.0
1.010.0
1.010.0
1.010.0
1.010.1
1.010.0
1.010.1
1.010.0
1.010.1
1.010.1
1.010.0
1.0+0.1
1.010.0
0.910,1
0.910.1
1.0+0.1
1.010.1
1.0+0 0
l.Oi-O.I
1 010.1
1.010.0
0.910.0
1.0+0.1
t.0+0.1
0.910.1
1.0+0.0
1.OiO.l
1.010.0
0,9+0.1
1.010.0
1.010.1
1.010.1
1.0+0.0
1.010.0
1.011.0
5.011.0
1.0+0.0
1.010.1
1.0+0.1
1.010.0
1.OiO.l
1.010.0
1.010.1
1.010.1
1.0+0,0
0.910.0
1.0+0.1
0.910.1
1.010.0
1.010.0
1.010.0
0.910.1
0.910.1

113
Transient Stress Challenge (TSC) in Chemostat Results in Multiple-Stress
Resistant Mutants
In this approach, the EMS-mutagenized CEN.PK population was exposed to short-term
'stress shocks' in a glucose-limited chemostat. Once the cells reached a physiological
steady-state after about 10 generations, they were exposed to a temperature shock at 52°C
for 3 min. After another 5 generations, the culture attained again a steady state that was
characterized by stable OD600 and concentration of carbon dioxide in the off-gas. The
values were identical to those prior to the stress challenge. The culture was then exposed
to 52°C for 6 min. After an additional 7 generations, a physiological steady state was
achieved and the population was subjected to 36 h of starvation by stopping the medium
flow. Subsequently, the cells were allowed to grow for another 4 generations.
Analyzing the resistance of the population to various stresses revealed an
improved performance only in the TSC4 population that was harvested after the starvation
stress (Table 1). This population was characterized by a significantly improved resistance
to oxidative, freezing, and ethanol stress, leading to 5-, 8-, and 5-fold increased viability,
respectively, compared to the parent. This result was confirmed by the mean value
obtained from the analysis of 24 randomly picked individual clones (Table 2). However,
these data indicate a significant heterogeneity within the population. While several clones
exhibited a behavior similar to the overall population, seven clones had a parent-like
behavior (without any improvement) and three clones with the highest resistance to
oxidative and freezing stress exhibited no improvement towards ethanol stress.

114
Table 2. Survival ratios (normalized to wild-type levels) of 24 individual mutants isolated from the
TSC4 population. The error indicates the standard deviation between three independent repeats of stress
tests for a given individual mutant. Mean values indicate the arithmetic means of 24 colonies.
STRAIN STRESS
oxidative fiee/ing tcmpciatuie ethanol
Tl 813 714 110 16+6
T2 1+0 110 2+1 211
T3 110 110 211 7±1
T4 110 14+6 613 9+4
T5 1+0 411 1+1 110
T6 ltO 110 110 110
T7 2017 2317 110 111
T8 610 814 110 4+2
T9 311 512 111 2+1
T10 1819 2117 110 110
Til 110 110 110 1+0
T12 1+0 13±5 211 9+4
T13 Itl 513 110 1+0
T14 110 612 HI 1+1
T15 1«) 110 210 2+1
T16 111 714 HI 1+0
T17 110 111 110 110
T18 713 813 110 14+5
T19 110 512 111 5+2
T20 110 110 110 1+0
T21 1919 1717 110 1+0
T22 6+3 511 110 1216
T23 110 1 + 1 111 1+0
T24 714 713 111 913
Pool 513 i:±b 1±0 5+2
Mean value 4±6 7±6 1±1 4±5
Glucose- and Ethanol-Limited Chemostats Without Stress Challenge (WSC
and ESC)
To decipher selection due to nutrient limitation or stress, a glucose-limited chemostat
without stress challenges was operated for 136 generations after inoculation with the
EMS-mutagenized CEN.PK mutant pool (Figure la). After 68 generations, an aliquot
was subjected to another round of EMS mutagenesis and used to inoculate an identical
chemostat, which was operated for a further 68 generations. After about the 44lh
generation, cells changed their color from creamy white to pink. The second EMS
mutagenesis during the 68th generation did not cause any reversion and the cells remained
pink until the end of the cultivation. While there was no apparent improvement of
resistance over the first 68 generations, there was a sudden increase in temperature

115
resistance in the WSC5 population that was harvested 13 generations after the second
round of EMS mutagenesis (Table 1). This population was found to have a 160-fold
higher survival ratio following a freezing stress. However, this value did not change in
any direction during the following 50 generations. The individual clone data reveal a very
homogeneous population and generally supported the population data (data not shown).
Additionally, a chemostat with 0.59f (v/v) ethanol as the sole carbon source was
also operated with the EMS-mutagenized CEN.PK population for about 68 generations,
without any stress challenge (Figure la). However, no improvement was detected in any
of the stress resistances of interest (Table 1).
Batch Culture Selection for Improved Stress Resistance
As an alternative to selection in chemostats, we used several cycles of mutagenesis and
selection for improved resistance to different stresses in batch culture (Figure lb). First, a
CEN.PK population was mutagenized using EMS and exposed to 0.1 M H202 for lh.
The survivors were then allowed to grow overnight in fresh YMM medium for about 4
generations. This population (H,) was indistinguishable from the parent (Table I). An
aliquot of this population was mutagenized again and split prior to exposure to
temperature (H,T2) or oxidative (H,H2) stress. The temperature stress was applied by
incubating the cells at 65°C for 10 min. In the case of oxidative stress, the selection
pressure was increased by exposing the cells to 0.3 M H202 for 1 h. The two resulting
populations were each mutagenized a third time and subjected to freezing (20 min in liquid
nitrogen and thawing at 24°C in a water bath) or ethanol (30 min in 20% ethanol) stress,
to yield the populations H,T2N3 and HjH2E,, respectively.
Upon increased oxidative selection pressure, the H,H2 population was found to
exhibit greatly increased resistance not only to oxidation stress but also to freezing (Table
1). This behavior of the total population was found to be remarkably conserved by almost
all individual clones analyzed, indicating a very homogeneous population (Table 3). In no
case did we see improved resistance to either ethanol or temperature stress. Another round
of mutagenesis and selection for ethanol stress resistance (H,H2E3) caused a significant
decrease in the population's resistance to oxidative stress (Table 1). Again, this pattern
was conserved by the majority of the analyzed individual clones (Table 4). Surprisingly,
we did not detect any improvement in ethanol tolerance.
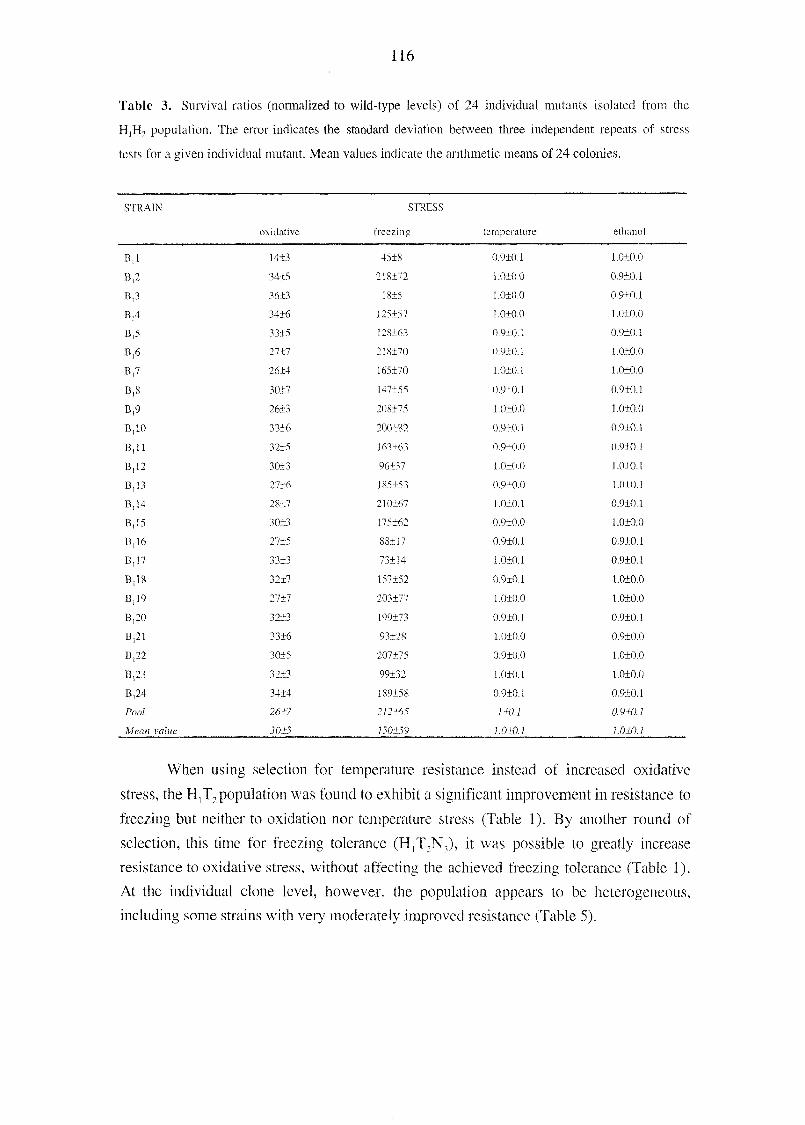
116
Table 3. Survival ratios (nonnalized to wild-type levels) of 24 individual mutants isolated from the
H]H2 population. The error indicates the standard deviation between three independent repeats of stress
tests for a given individual mutant. Mean values indicate the arithmetic means of 24 colonies.
STRAIN STRESS
oxidative free?ing temperature ethanol
B,l 14+3 4518 0.910.1 1.010.0
B,2 3415 218172 1.010.0 0.910.1
B,3 36+3 1815 1.010.0 0.910.1
B,4 34+6 125+57 1.010.0 1.010,0
B,5 3315 128163 0.910.1 0.910.1
B,6 27+7 218170 0.910.1 1.01-0.0
B,7 2614 165170 1.010.1 1.0+0.0
B,8 30+7 147155 0.910.1 0.910.1
B,9 2613 208175 1.0+0,0 1.0+0.0
B, 10 33+6 200182 0.910.1 0.910.1
B,U 3215 163163 0.910.0 0.910.1
B,12 30+3 96137 1.010.0 1.010.1
B,13 2716 185153 0.910,0 1.010.1
B,14 28+7 210167 1.010.1 0.9+0.1
B,I5 3013 175+62 0.910.0 1.010.0
B,16 2715 88117 0.910.1 0.9+0.1
B,17 3313 73+14 1.010.1 0.9+0.1
B,18 32+7 157+52 0,910.1 1.0+0.0
B,19 2717 203177 1.010.0 1.010.0
B,20 3213 199173 0.910.1 0.910.1
B,21 33+6 93128 1.010.0 0.910.0
B,22 30+5 207175 0.910.0 1.010.0
B,23 3213 99132 1.010.1 l.010.0
B,24 3414 189158 0.910.1 0.910.1
Pool 26+7 2/2165 1*0.1 0.9+0.1
Mean value 301.5 150±ï9 1.0±0.1 1.010.1
When using selection for temperature resistance instead of increased oxidative
stress, the H^, population was found to exhibit a significant improvement in resistance to
freezing but neither to oxidation nor temperature stress (Table 1). By another round of
selection, this time for freezing tolerance (H,T2N,), it was possible to greatly increase
resistance to oxidative stress, without affecting the achieved freezing tolerance (Table 1).
At the individual clone level, however, the population appears to be heterogeneous,
including some strains with very moderately improved resistance (Table 5).
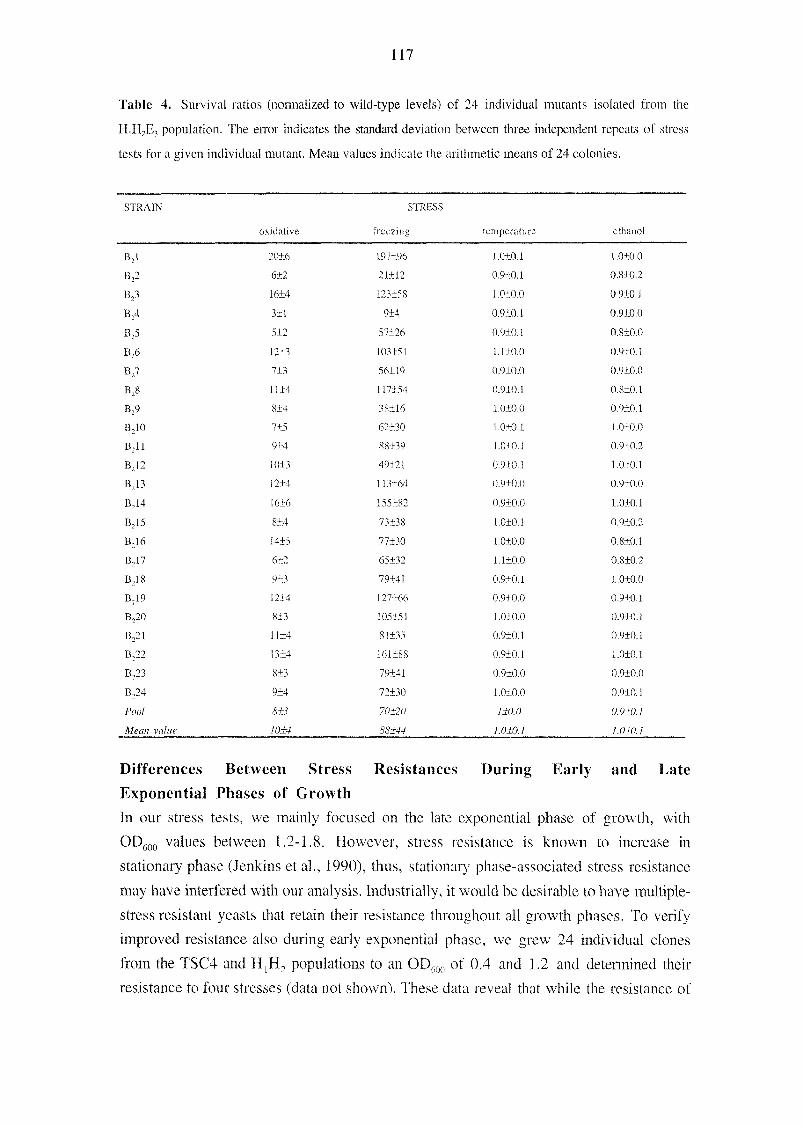
117
Table 4. Survival ratios (normalized to wild-type levels) of 24 individual mutants isolated from the
H,H2E, population. The error indicates the standard deviation between three independent repeals of stress
tests for a given individual mutant. Mean values indicate the arithmetic means of 24 colonies.
STRAIN STRESS
oxidative freezing temperature ethanol
B,l 2016 197196 1.0+0.1 1.010.0
B,2 6+2 21+12 0,910.1 0.810.2
B23 1614 123158 1.010.0 0.9+0. t
B24 311 914 0.910.1 0.9+0.0
B25 512 57126 0.910.1 0.810.0
B,6 1213 103151 1.110.0 0.910.1
B27 713 56119 0.910.0 0.910.0
B28 1114 117154 0.910.1 0.810.1
B29 814 38116 1.010.0 0.910.1
B210 715 62130 1.010.1 1.010.0
B.,11 914 88139 1.010.1 0.910.2
B212 10+3 49121 0.910.1 1.010.1
B,13 12±4 113164 0.910.0 0.910.0
B214 1616 155182 0.910.0 1.010.1
B215 814 73138 1.010.1 0.910.2
B,16 14+5 77130 1.010.0 0.810.1
B217 612 65132 1.110.0 0.810.2
B218 913 79141 0.910.1 1.010.0
B2I9 1214 127166 0.910.0 0.910.1
B220 8+3 105151 1.010.0 0.910.1
B221 1114 81135 0,910.1 0.910.1
B,22 1314 161+88 0.910.1 1.010.1
B223 8+3 79141 0.910,0 0.910.0
B224 9+4 72130 1.010.0 0.910.1
Pool S±? 70±20 1+0.0 0.9+0.1
Mean value 10+4 SS±44 1.0+0.1 1.0+0.1
Differences Between Stress Resistances During Early and Late
Exponential Phases of Growth
In our stress tests, we mainly focused on the late exponential phase of growth, with
OD600 values between 1.2-1.8. However, stress resistance is known to increase in
stationary phase (Jenkins et al., 1990), thus, stationaiy phase-associated stress resistance
may have interfered with our analysis. Industrially, it would be desirable to have multiple-
stress resistant yeasts that retain their resistance throughout all growth phases. To verify
improved resistance also during early exponential phase, we grew 24 individual clones
from the TSC4 and H,H2 populations to an OD600 of 0.4 and 1.2 and determined their
resistance to four stresses (data not shown). These data reveal that while the resistance of

118
the H,H2 clones was very similar at both OD600 values, the TSC mutants did not exhibit
any significantly improved stress resistance at an OD600 of 0.4.
Table 5. Survival ratios (normalized to wild-type levels) of 24 individual mutants isolated from the
H|T:N, population. The error indicates the standard deviation between three independent repeats of stress
tests for a given individual mutant. Mean values indicate the arithmetic means of 24 colonies.
STRAIN STRESS
oxidative freezing temperature ethanol
B31 20111 3119 0.910.1 0.910.1
B,2 113 311 1.010.1 1.010.0
B33 91138 2918 0.910.1 0.910.1
B,4 132180 45117 1.010.0 1.010.0
B,5 13+4 1917 0.9+0.0 1.010.0
B36 98+27 33112 0.910.1 0.910.0
B,7 211 713 0 910.1 1.010.1
B38 73122 30112 1.010 0 0.910.0
B39 110175 38116 0.910.0 1.010.0
B,10 17+9 2316 1.010.1 1.010.0
B,ll 411 812 0.910.0 0.910.1
B312 116+77 43+11 1.010.0 0.910.0
B313 88156 2619 1.010.0 1.010.0
B,14 105+73 33113 0.910.1 0.910.0
B315 68142 2218 1.010.0 1.010.0
BJ6 64144 2419 1.010.0 0.910.1
B317 118173 38113 0.910.1 1.010.0
B,18 85153 33110 0.910.0 0.910.1
B,19 27117 2419 1.110.0 0.910.0
B,20 1519 26111 1.010.1 1.01.0.1
B,2l 94153 36114 0.910 0 0.910.0
B,22 58137 21+6 1.010 I 1.010.0
B323 63139 24111 0.910.1 1.010.1
B,24 17110 2117 0.910.0 1.0+0.0
Pool 53±JS 1S±6 I.O1O.0 1.0+0.0
Mean value 62±4J 27+11 1.0+0.1 1.0+0.1
Isolation of Total and mRNA from Stress-Exposed Mutants, the Wild-
Type and Their Corresponding Stress Controls
To elucidate the genetic basis of the selected mutants, DNA array technology was chosen.
From the TSC4 and H,H, populations the clones Tl and B,l (Tables 2 and 3) and the
wild-type CEN.PK were chosen for DNA array analysis. This technology requires the
cDNA from the mutants to be hybridized to DNA arrays containing several
oligonucleotides. For this purpose, we first isolated total RNA from the above cultures.
Cultures at early and late phases of the exponential growth with OD600 values of 0.4 and

119
1.2, respectively, were either harvested directly or as quickly as possible after the stress
challenge.
The quality of the preparation was verified on a 2% agarose gel (Figure 2), and
found to be sufficient for further preparation. From these samples we enriched mRNA by
the use of a commercial kit (Figure 3). These samples are currently under investigation by
our collaborators at Stanford University.
Figure 2. Total RNA isolated from the Tl clone of the TSC4 population after exposure to four
stresses. From left to right: 1 kb-ladder DNA size marker; TSC4 Tl after oxidative; freezing; temperature;
and ethanol stresses; 1 kb-ladder DNA size marker. Samples were run on 2% agarose gel.

120
Figure 3. m-RNA isolated from total RNAs shown in Figure 2. From left to right: 1 kb-ladder DNA
size marker; TSC4 Tl after oxidative; freezing; temperature; and ethanol stresses. Samples weie îun on
2% agarose gel.

121
DISCUSSION
A priori it is not clear how much the relative resistance to multiple stresses can be
improved and when a maximum level of resistance is attained. The primary goal of this
study was to compare the efficiency of various selection procedures to enrich improved
variants from a diverse (mutagenized) population. Although there are previous selection
studies on yeast stress resistance, almost all of them focus on single stress resistances,
such as freezing (Takagi et al., 1997) and salt tolerance (Matsutani et al., 1992), using
successive mutation and direct selection procedures. Additionally, there are some studies
on transient adaptation to stress in yeast. One such study focused on improvement of
oxidative stress resistance upon preexposure to low H202 levels (Davies et al, 1995).
These results revealed that pretreated, adapted cells exhibited about 90% stress survival,
whereas the non-treated cells could not survive the 0.8 M H202 stress treatment. To our
knowledge, however, there is only one study that investigates multiple-stress resistance in
yeast. In this case, retrotransposon Ty insertion mutants exhibited significantly improved
heat- (up to 1000-fold improvement), UV- (up to 10-fold improvement) and ethanol- (up
to 2-fold improvement) resistance (Iida, 1988).
Transient stress challenges (TSC) in chemostat yielded 'generalists', which, in our
case, had moderately (up to 10-fold) increased oxidative, freezing, and ethanol stress
resistances, compared to their parent. However, the moderate improvement of those
stress resistances appeared to be confined to the late exponential growth phase, and was
not found in early exponential phase cells. Thus, the improved stress resistance of the
TSC population might be related to an earlier induction of stationary phase responses that
also encompasses a higher stress resistance, as was shown for bacteria (Jenkins et al.,
1990). This might also explain why the ethanol stress resistance was improved by this
approach, but not by any other selection, including ethanol stress. Thus, ethanol
resistance is apparently different from other stress resistances, as was reported previously
(Lewis et al, 1997), which may be related to its mechanism of toxicity; deterioration of
the membrane. Hence, it can be expected that stationary phase cells are more resistant,
because their membrane composition also changes.
The applied permanent oxidative and temperature stress challenges did not lead to
any improved resistance of the four stresses analyzed. Likewise, the glucose- and
ethanol-limited chemostat selections without any stress challenge were also not successful
with respect to yielding multiple-stress resistant strains. Surprisingly, however, the
glucose-limited chemostat that was basically intended as a control to the stress selection
chemostats, yielded mutant strains with altered morphology (data not shown) and a highly
improved freezing resistance. Although not ideal for multiple-stress resistance selection,
this result indicates that individual stress tolerance may evolve without direct selection for
this phenotype. The observed color change from creamy white to pink, is not directly

122
related to this high freezing resistance feature, because it occurred prior to the increase in
freezing resistance. Pink color in S. cerevisiae fermentations is usually associated with
amino acid auxotrophs that carry mutations in the adel or ade2 genes of the adenine
synthesis pathway (Pearson et al., 1986). Although our mutants definitely had no adenine
auxotrophy, they might still have a mutation in this pathway, which causes this color
change without affecting biosynthesis. The results of this selection indicate that either two
mutations are necessary for a freezing resistance phenotype or that a required single
mutation was not present in the first population.
The first stress challenge in the permanent stress chemostat, oxidative stress was
chosen, because a recent study with fourteen industrial strains of S. cerevisiae showed
that tolerance to H202 was correlated with the tolerance to several other stresses like slow
and rapid freezing, salt, heat, but not ethanol stress (Lewis et al., 1997). It was claimed
that H202 tolerance might be an important marker for general stress tolerance in yeast.
Aerobic organisms such as S. cerevisiae usually have multiple defense mechanisms to
avoid the generation of highly reactive oxygen derivatives and to repair damages caused
by oxidative stress, such as modifications of DNA, lipids, and proteins (Juhnke et al.,
1996). The most important ones are superoxide dismutases, catalases, peroxidases, and
DNA repair systems, which all exist in S. cerevisiae (Costa et al., 1997; Moradas-Ferreira
et al., 1996). However, permanent oxidative stress challenge in chemostat did not select
for multiple-stress resistant strains. This conclusion is supported by the fact that the PSC8
population did not grow in batch culture containing 100 mM H202 (data not shown).
However, using batch cultivations and successive cycles of mutation and selection for
various stresses, the so-called batch stress challenge 'specialist' mutant strains were
obtained with highly improved freezing (150-fold) and oxidative (30-fold) stress
resistances. These results indicate that H,02 in the chemostat may have been degraded,
either via physiological adaptation or evolution of subpopulations. Thus, the effective
H202 concentration in the reactor was probably very low, preventing an effective
selection. Similar observations were made with Bacillus subtilis carrying a pUB 110-
derived plasmid encoding chloramphenicol resistance (Fleming et al., 1988), During
chemostat selection for increased segregational plasmid stability, it was important to
periodically increase the chloramphenicol concentration to avoid plasmid loss.
Apparently, the chemostat population inactivated the supplemented chloramphenicol and
only a small, plasmid-carrying subpopulation was sufficient for this purpose.
Generally, analysis at the population level was very informative about the progress
of selection, because most populations were homogeneous. This indicates that we have
enriched already existing mutants, rather than selected periodically evolving fitter variants
(Dykhuizen and Haiti, 1983). Our finding that transient stress challenges in glucose-
limited chemostat select for moderately improved resistance to multiple stress may be

123
exploited to further improve stress resistances by applying more frequent and harsher
transient stresses, in particular starvation. Clearly, the improvements attained were not
optimal (Table 1). The batch selection strategy should probably be improved by using
harsher selection conditions for ethanol and temperature stresses, since this strategy did
not yield any improvement in these two stresses. Alternatively, the batch 'specialists' of
freezing and oxidative stress resistance may be grown in a chemostat with permanent
temperature stress challenge for a longer period as in the present PSC case, to improve
temperature stress resistance. To obtain stress resistance that persists throughout different
growth phases, the use of the batch selection approach is recommended.
In general, our findings reveal that starvation is very useful to improve multiple-
stress resistance in a transient challenge chemostat; and oxidative stress is very useful for
batch selection. In light of these findings, the ideal selection strategy should be a
combination of both approaches, e.g. starting with batch selection using oxidative stress
and exposing the resulting mutant population to extensive starvation periods in a glucose-
limited chemostat.
ACKNOWLEDGEMENTS
We thank Dr. Camilla Mei-Fang Kao for technical advice on RNA isolation.

124
REFERENCES
Attfield, P. V. 1997. Stress tolerance: the key to effective yeast strains of industrial
baker's yeast. Nature Biotechnol. 15: 1351-1357.
Bailey, J. E. 1991. Toward a science of metabolic engineering. Science 252: 1668-1675.
Bailey, J. E., Sburlati, A., Hatzimanikatis, V., Lee, K., Renner, W. A., Tsai, P. S.
1996. Inverse metabolic engineering: a strategy for directed genetic engineering of
useful phenotypes. Biotechnol. Bioeng. 52: 109-121.
Costa, V., Amorim, M. A., Reis, E., Quintanilha, A., Moradas-Ferreira, P. 1997.
Mitochondrial superoxide dismutase is essential for ethanol tolerance of Saccharomyces
cerevisiae in the post-diauxic phase. Microbiol. 143: 1649-1656.
Davies, J. M. S., Lowry, C. V., Davies, K. J. A. 1995. Transient adaptation to oxidative
stress in yeast. Arch. Biochem. Biophys. 317: 1-6.
Dykhuizen, D. E., Hard, D. L. 1983. Selection in chemostats. Microbiol. Rev. 47; 150-
168.
Evans, I. H. 1990. Yeast strains for baking, pp. 13-45 in Yeast Technology, Spencer, J.
F. T., and Spencer, D. M. (eds.). Springer-Verlag, Berlin, Germany.
Fleming, G., Dawson, M. T., Patching, J. W. 1988. The isolation of strains of Bacillus
subtilis showing improved plasmid stability characteristics by means of selective
chemostat culture. J. Gen. Microbiol. 134: 2095-2101.
lida, H. 1988. Multistress resistance of Saccharomyces cerevisiae is generated by
insertion of retrotransposon Ty into the 5' coding region of the adenylate cyclase gene.
Mol. Cell. Biol. 8: 5555-5560.
Jenkins, D. E.. Chaisson, S. A., Matin, A. 1990. Starvation induced cross protection
against osmotic challenge in Escherichia coli. J. Bacteriol. 172: 2779-2781.
Juhnke, H., Krems, B., Kötter, P., Entian, K.-D. 1996. Mutants that show increased
sensitivity to hydrogen peroxide reveal an important role for the pentose phosphate
pathway in protection of yeast against oxidative stress. Mol. Gen. Genet. 252: 456-
464.
Lawrence, C. W. 1991. Classical mutagenesis techniques. Meth. Enzymol. 194: 277-
278.
Lewis, J. G., Learmonth, R. P., Attfield, P. V., Watson, K. 1997. Stress co-tolerance
and trehalose content in baking strains of Saccharomyces cerevisiae. J. Indust.
Microbiol. Biotechnol. 18: 30-36.
Lindquist, J. 26 August 1999, revision date. A five-tube MPN table (online).
http://www.bact.wisc.edu/bactl02/102dil3a.html. (27 August 1999, last date
accessed).
Masque, C, Nolla, M.. Bordons, A. 1987. Selection and adaptation of a phenol-
degrading strain of Pseudomonas. Biotechnol. Lett. 9: 655-660.

125
MatSLitani, K., Fukuda, Y., Murata, K., Kimura, A., Yajima, N. 1992. Adaptation
mechanism of yeast to extreme environments: constraction of salt-tolerance mutants of
the yeast Saccharomyces cerevisiae. J. Ferment. Bioengin. 73: 228-229.
Moradas-Ferreira, P., Costa, V., Piper, P., Mager, M. 1996. The molecular defense
against reactive oxygen species in yeast. Mol. Microbiol. 19: 651-658.
Palasova, E., Stejskalova, E., Sikyta, B. 1983. Strains of Escherichia coli with
simultaneous elevated synthesis of three catabolic enzymes. Biotechnol. Lett. 6: 19-24.
Pearson, B. M., Fuller, L. J., Mackenzie, D. A., Keenan, M. H. J. 1986. A red/white
selection for Saccharomyces cerevisiae auxotrophs. Lett. Appl. Microbiol. 3: 89-91.
Piper, P. W. 1995. The heat shock and ethanol stress responses of yeast exhibit extensive
similarity and functional overlap. FEMS Microbiol. Lett. 134: 121-127.
Reed, G., Nagodawithana, T. W. 1991. Yeast technology. 2"d edition, Van Nostrand
Reinhold, New York.
Russek, E., Colwell, R. R. 1983. Computation of most probable numbers. Appl.
Environ. Microbiol. 45: 1646-1650.
Takagi, H., Iwamoto, F., Nakamori, S. 1997. Isolation of freeze-tolerant laboratory
strains of Saccharomyces cerevisiae from proline-analogue-resistant mutants. Appl.
Microbiol. Biotechnol. 47: 405-411.
Weikert, C, Sauer. U., Bailey, J. E. 1997. Use of a glycerol-limited, long-term
chemostat for isolation of Escherichia coli mutants with improved physiological
properties. Microbiol. 143: 1567-1574.
Wilkins, M. R., Pasquall, C, Appel, R. D., Ou, K., Golaz, 0., Sanchez, J. C, Yan, J.
X., Gooley, A. A„ Hughes, G., Smith, I. H., Williams, K. L., Hochstrasser, D. F.
1996. From proteins to proteomes: large scale protein identification by two-
dimensional electrophoresis and amino acid analysis. Nature Biotechnol. 14: 61-65.
Wodicka, L., Dong, H., Mittmann, M., Ho, M.-H., Lockhart, D. J. 1997. Genome-
wide expression monitoring in Saccharomyces cerevisiae. Nature Biotechnol. 15:
1359-1367.
Yokota, M., Fagerson, I. S. 1971. The major volatile components of cane molasses. J.
Food Sei. 26: 1091-1094.

126
Chapter 7
General Conclusions

127
In this thesis, one of the most important industrial microorganisms, the yeast
Saccharomyces cerevisiae, was chosen as the target organism for metabolic engineering
and the establishment of a method for metabolic flux analysis. The purpose of installing
the creatine kinase-phosphocreatine (CK-PCr) circuit in yeast, described in Chapter 2,
was to improve yeast energy metabolism, because CK is known to be a key enzyme in
energy metabolism of excitable cells and tissues of vertebrate species (WaUimann et al.,
1992). Our work was based on the premise that creatine could be taken up by yeast, for
which strong evidence came from a previous study (Brindle et al., 1990). Although we
successfully installed a CK system in yeast, consisting of a cytoplasmic and a
mitochondrial CK, we could not identify any distinct phenotype. Furthermore, MP-NMR
and CK inhibitor studies provided data that strongly suggest the absence of creatine
uptake as the primary problem of afunctional CK system.
Metabolic engineering mostly concerns in one way or another central carbon
metabolism, either as the primary target or as a responsive element. Therefore, it is
desirable to have an analytical tool, which would allow to monitor intracellular flux
responses. The aim of our work presented in Chapter 3 was to establish a reliable state-
of-the-art procedure for metabolic flux analysis in yeast by combining stoichiometric flux
balancing and metabolic flux ratio (METAFoR) analysis. The developed metabolic model
also considered the previously neglected compartmentalization. By comparing the
estimated flux distributions between Pichia stipitis and S. cerevisiae, we identified several
significant differences between these two yeasts. Most prominently, our analyses revealed
a smaller contribution of the pentose phosphate pathway to glucose catabolism in aerobic
S. cerevisiae, compared to P. stipitis. This conclusion is based on the higher fraction of
PEP molecules originating from pentoses, identified by METAFoR analysis and our net
flux estimates. These results further suggest that the pentose phosphate pathway of S.
cerevisiae is not optimally suited for catabolic function, which may explain the problems
of engineering this organism for efficient pentose utilization (van Zyl et al, 1999), which
P. stipitis is naturally capable of.
The so-called secondary responses to metabolic engineering (Bailey et al., 1996)
have been the main focus in the work summarized in Chapters 4 and 5. These
secondary responses are metabolic consequences of the genetic change introduced, which
are much different from the expected ones (Bailey, 1991). Our results clearly show
previously neglected physiological sensitivities of auxotrophic yeasts and complementing
vectors that are frequently used in yeast research and applications. Thus, metabolic
changes that occur upon expression of cloned genes in such host-vector systems may well
arise from peculiarities of the auxotrophic host, rather than from activity of the cloned
proteins. Moreover, we have shown that the exogeneous supplementation of leucine for
auxotrophic strains should be much higher than suggested by common laboratory

128
manuals to allow for optimal growth. These often unnoticed limitations in availability of
leucine have not only physiological implications, but also effects on vacuolar morphology
and cell cycle distribution of leucine-auxotrophic S. cerevisiae. Both chapters present a
note of caution for all physiological and cell cycle studies with auxotrophic yeasts.
Inverse metabolic engineering may help overcome some of the above-mentioned
problems of rational metabolic engineering (Bailey et al., 1996). It requires, however,
first the availability of a desired phenotype. In Chapter 6, we used directed evolution to
improve multiple-stress resistance of S. cerevisiae, an industrially relevant property for
food applications and large-scale fermentations (Singer and Lindquist, 1998). The
primary goal was to compare the efficiency of different selection procedures to enrich
improved valiants from a mutagenized population, in order to provide guidance for
further selection. From the currently used strategies, we found transient starvation
challenge chemostats and oxidative stress in batch selection most appropriate for obtaining
multiple-stress resistant yeast. These results allow us to devise more efficient selection
procedures to obtain further improved mutants. To identify the relevant mutations,
successfully selected mutants are currently subjected to global transcript analysis.

129
REFERENCES
Bailey, J. E. 1991. Toward a science of metabolic engineering. Science 252: 1668-1675.
Bailey, J. E., Sburlati, A., Hatzimanikatis, V., Lee, K., Renner, W. A., Tsai, P. S.
1996. Inverse metabolic engineering: a strategy for directed genetic engineering of
useful phenotypes. Biotechnol. Bioeng. 52: 109-121.
Brindle, K., Braddock, P., Fulton, S. 1990. "P NMR measurements of the ADP
concentration in yeast cells genetically modified to express creatine kinase.
Biochemistry 29: 3295-3302.
Singer, M. A., Lindquist, S. 1998. Thermotolerance in Saccharomyces cerevisiae: the
Yin and Yang of trehalose. Trends Biotechnol. 16: 460-468.
van Zyl, W. H., Eliasson, A., Hobley, T., Hahn-Hagerdal, B. 1999. Xylose utilization
by recombinant strains of Saccharomyces cerevisiae on different carbon sources. Appl.
Microbiol. Biotechnol. 52: 829-833.
WaUimann, T., Wyss, M., Brdiczka, D., Nicolay. K., Eppenberger, H. M. 1992.
Intracellular compartmentation, structure and function of creatine kinase isoenzymes in
tissues with high and fluctuating energy demands: the 'phosphocreatine circuit' for
cellular energy homeostasis. Biochem. J. 281: 21-40.

130
Curriculum Vitae
Personal Details
Last Name:
First Name(s):
Place and Date of Birth:
Nationality:
Education
Jan. 2000-present:
Çakar
Zeynep Petek
Istanbul, 23.08.1972
Turkish
1996-2000:
1994-1996:
1992-1995:
1990-1994:
1983-1990:
Work Experience
Jan. 2000-present:
1997-present:
1996-1999:
1994-1996:
July-Sept. 1993:
July-Sept. 1992:
Languages
English
German
Turkish
Post-doctoral training on transcytosis and endocytosis
in endothelial cell lines, Dept. of Biochemistry,
Biocenter, University of Basle, Switzerland.
Ph.D. studies on metabolic engineering of yeast,
supervisors: Prof. James E. Bailey and Dr. Uwe Sauer,
Institute of Biotechnology, ETH-Zurich, Switzerland.
M.Sc. in Chemical Engineering, Thesis title: Cloning and
expression of Tacjl endonuclease in E. coli by using the cloning
vector pUC18, Bogaziçi (Bosphorus) University, Istanbul,
Turkey.
B.Sc. in Molecular Biology and Genetics,
Double Major Program, Bogaziçi University.
B.Sc. in Chemical Engineering, Bogaziçi University.
High School Education, Istanbul Lisesi, Istanbul, Turkey.
Research and teaching assistantship,
Dept. of Biochemistry, Biocenter, University of Basle.
Proof-reading (Eng.) and technical translation (Ger.->Eng.) for the
biotechnology journal BioWorld, Kusnacht, Switzerland.
Research and teaching assistantship,
Institute of Biotechnology. ETH-Zurich.
Research and teaching assistantship,
Dept. of Chemical Engineering, Bogaziçi University.
Summer internship, Procter & Gamble, Eur. Technical Center,
Egham, U.K..
Summer internship, Turk-Hoechst, Istanbul, Turkey.
Fluent
Fluent (with 'Sprachdiplom')
Native language


![AKREDiTASYON SERTiFiKASı · 2017-06-21 · F70]-040 TÜRK AKREDiTASYON KURUMU AKREDiTASYON SERTiFiKASı Deney Laboratuvarı olarak faaliyet gösteren, BOGAZiçi ÜNivERSiTESi ÇEVRE](https://img.dokumen.tips/doc/110x75/5e444ada7c757f06081ce89b/akreditasyon-sertifikas-2017-06-21-f70-040-toerk-akreditasyon-kurumu-akreditasyon.jpg)