Embed Size (px)
Citation preview
METALLOCENE TECHNOLOGY
in Commercial Applications
Dr. George M. Benedikt, Editor Society of Plastics Engineers
Plastics Design Library
Copyright © 1999, Plastics Design Library. All rights reserved.
ISBN 1-884207-76-6
Library of Congress Card Number 98-89319
Published in the United States of America, Norwich, NY by Plastics Design Library a division of
William Andrew Inc.
Information in this document is subject to change without notice and does not represent a commitment
on the part of Plastics Design Library. No part of this document may be reproduced or transmitted in
any form or by any means, electronic or mechanical, including photocopying, recording, or any infor-
mation retrieval and storage system, for any purpose without the written permission of Plastics Design
Library.
Comments, criticism and suggestions are invited and should be forwarded to Plastics Design Library.
Plastics Design Library and its logo are trademarks of William Andrew Inc.
Please Note: Great care is taken in the compilation and production of this volume, but it should be
made clear that no warranties, express or implied, are given in connection with the accuracy or com-
pleteness of this publication, and no responsibility can be taken for any claims that may arise. In any in-
dividual case of application, the respective user must check the correctness by consulting other
relevant sources of information.
The use of general descriptive names, registered names, trademarks, etc. in this publication does not
imply, even in the absence of a specific statement, that such names are exempt from the relevant protec-
tive laws and regulations and therefore free for general use.
Manufactured in Canada
Plastics Design Library, 13 Eaton Avenue, Norwich, NY 13815 Tel: 607/337-5000 Fax: 607/337-5090
Preface
The revolution in polyolefin technology started during the last decade of the 20th century con-
tinues today at an ever-faster pace. We are talking about the metallocene and single site cata-
lyst based homo and copolyolefins (mPOs) with their well-defined structures and closely
controlled molecular architectures. Their capabilities to compete, on the basis of their tailored
properties against traditional polymers such as ABS, PVC, thermoplastic elastomers (TPEs)
and others combined with a favorable cost structure constitutes a fertile resource for im-
proved materials.
Since the publication last year of “Metallocene Catalyzed Polymers”, where the ad-
vances in catalysis and polymerization techniques where discussed in detail together with the
polymer properties, processing and the initial markets, we have witnessed a tremendous
growth in the commercial development of these novel materials. They are more and more tar-
geted on an improved cost/performance basis at replacing or complementing the traditional
materials. We have also witnessed some inroads of the novel materials in other areas not con-
templated initially such as elastomers, adhesives and engineering thermoplastics.
One of the inevitable but expected aspects of the new product/process development in a
free market economy is the protection of intellectual property. In many cases this leads to long
drawn and expensive litigation between major or minor players with adverse effects on timely
commercial development. Therefore the recently announced (see C&E News June 21st, 1999)
agreement between Dow Chemical Co., Exxon and Univation Technologies (a licensing joint
venture between Exxon and Union Carbide Corp.) to settle rather than litigate their patent
rights constitutes certainly a step in the right direction of an increased competitive market
growth for metallocene polyolefins. This is important since besides the two major players,
Dow Chemical Co. and Exxon, many more companies have announces their commercial ef-
forts for metallocene polyolefins. (BASF, DSM, TOTALFINA, MITSUI, BOREALIS,
EQUISTAR, Union Carbide, etc)
The present book is based on 40 papers presented at the ANTEC 98 and 99 and other
conferences. As a general observation, the center of gravity has shifted from polymer manu-
facturing to application development. As a consequence there are only two catalysis related
papers in the chapter on Catalytic Systems. They deal with the polymerization results using
supported single site catalysts (for mPEs), as well as with the detrimental effect of the residual
triethyl aluminum on the molecular weight of elastomeric PP.

The bulk of the book describes, in the chapter of Processing, the development work in
adapting these new, now commercial materials into specific applications, using appropriate
processing methods and techniques.
In some cases metallocene polyolefins can be used in applications directly. For instance
the second-generation metallocene PEs (EZP-mPE) presented by Univation Technologies
exhibit controlled MWD (compared with the first generation that was very narrow, and thus
harder to process), compositional distribution, long chain branching and distribution. These
structural properties lead to a much tougher film in comparison with the typical blends of
Ziegler-Natta ZN-LL/LDPEs. Consequently thinner films are possible, this downgauging re-
sulting in cost savings. Additionally, the heat sealability of mPEs is also superior.
In many other cases one unique material cannot provide the entire range of desired prop-
erties. In this case blends are preferred, and this is no different for mPOs. Blends can be
formulated to target existing applications, while taking advantage of the properties afforded
to the blend by the mPOs. Whenever the use of blends is necessary one has to tackle the issues
of miscibility and compatibility. It’s worth directing the reader’s attention at a new concept in
polymer blend, presented by a group from Exxon, namely the spherulite boundary strength-
ening. This is achieved by a copolymer that migrates to the spherulite boundary and
cocrystallizes creating additional interspherulitic links. The strengthening agent studied was
an isotacticPP-atacticPP made by single site catalysis, containing additionally sodium benzo-
ate as nucleating agent. Another interesting blend application presented by Dow Chemical
Co. workers uses an ethylene-styrene interpolymer made using INSITE technology. This
product could be blended with either atactic PS, or PP, giving unique properties. Uses as
moldings, films and foams are contemplated.
All major processing techniques have been impacted by the novel mPOs: extrusion, film
blowing, injection molding, foam production, fiber spinning and composite manufacturing.
Efforts in process parameter optimization, using the new mPOs and their blends and reported
in several of the papers, are included in the Processing chapter. They encompass film applica-
tions for fresh food packaging, heat sealing, coextrusion, PP films and applications, nitrogen
autoclave foaming and others.
Separately we grouped the papers studying Structure-Property relationships, includ-
ing rheology, instrumental analysis, study of crystallization, crystal growth kinetics.
In a final chapter we grouped the papers dealing with polymer Markets, market outlook
for mPOs, the availability and pricing of monomers, projected world demand for PP as well
as a long term look at PVC markets in the next two decades. The PVC study is included be-
cause of the expected future market pressure on the flexible PVC applications from the
metallocene polyolefins.
viii Metallocene Technology

We do expect indeed to see in the future a continuation of the metallocene polyolefin
revolution. Today’s technology appears to be only in a “transition state”. As competition in
the market place will accelerate and, in turn, as the market place will exert more stringent per-
formance demands, novel, higher productivity catalytic systems will temporarily win the
popularity contest. We expect to see the introduction of some products containing functional
groups, we also expect competition from catalytic systems based on Ni, Fe Pd, rather than Zr,
Ti, Hf.
George M. Benedikt
The BFGoodrich Company
Brecksville, Ohio
August, 1999
Preface ix

Table of Contents
Preface vii
George M. Benedikt
Catalytic Systems
Single-Site Supported Catalysts for Ethylene 1
A. MuÔoz-Escalona, L. Mendez, B. PeÔa, P. Lafuente, J Sancho,
W. Michiels, G. Hidalgo and Ma. Fca. Martinez-NuÔez
Synthesis of High-Molecular-Weight Elastomeric Polypropylene with
Half-Titanocene/MAO Catalysts 9
Oing Wu, Benheng Xie, Meiran Xie, Rui Chen
Precessing Methods
Blending
Is Metallocene Polyethylene Blend with HDPE More Compatible Than with PP? 17
D. Rana, K. Cho, B. H. Lee and S. Choe
Spherulite Boundary Strengthening: A New Concept in Polymer Blends 23
A. Lustiger, CN. Marzinsky and R. R. Mueller
Modification of Syndiotactic Polystyrene 29
JØrg Kressler, Ralf Thomann
Blends of Ethylene/Styrene Interpolymers and Other Polymers: Benefits in
Applications 37
C.F. Diehl, M. J. Guest, B. I. Chaudhary, Y. W. Cheung,
W. R. Van Volkenburgh, B.W. Walther
Extrusion
Easy Processing Metallocene Polyethylene 47
Ching-Tai Lue
Effect of Metallocene Polyethylene on Heat Sealing Properties of Low
Density Polyethylene Blends 53
Juan D. Sierra, MarÍa del Pilar Noriega and Tim A. Osswald
Extrusion Operation Window for Filled Metallocene Polyethylenes 61
MarÍa del Pilar Noriega and Tim A. Osswald, Omar A. Estrada
Processing Trends of Metallocene Linear Low Density Polyethylenes and
Their Influence on Single Screw Design 69

K. R. Slusarz, C. A. Ronaghan, and J. P. Christiano
Influence of mPE Grades on the Dynamic Properties of PP/mPE-Blends 77
Frank Raue and Gottfried W. Ehrenstein
“Single-Site” Catalyzed Polyolefin for Fresh-Cut Produce Packaging.
A Comparison Between Monoextruded Blends and Coextruded Film 85
V. Patel, S. Mehta, S. A. Orroth and S. P. McCarthy
Rheology and Processing Experience of New Metallocene Polyolefins 93
Atul Khare, Chuan Qin, Michael T. K. Ling, and L. Woo
Film Forming
Properties and Film Applications of Metallocene-Based Isotactic Polypropylenes 101
Aiko Hanyu and Rusty Wheat
Phase Structure Characterization and Processing-Structure-Property Relationships
in Linear Low-Density Polyethylene Blown Films 111
Jianjun Lu, Baiyi Zhao and Hung-Jue Sue
The Relative Influences of Process and Resin Time-Scales on the MD Tear
Strength of Polyethylene Blown Films 121
Rajendra K. Krishnaswamy and Ashish M. Sukhadia
Metallocene Catalyzed Polyethylene in Blown Film Applications. A Comparison
Between Monoextruded Blended Films and Coextruded Films 129
C. M. Beagan, G. M. Mc Nally & W. R. Murphy
Trade-offs in Blown Film Processing-Structure-Property Behavior of LLDPE
Type Resins from Chromium, Metallocene and Ziegler-Natta Catalysts 137
Ashish M. Sukhadia
Injection Molding
Transparent Metallocene-Polypropylene for Injection Molding 147
J. RØsch, J. R. Grasmeder
Equipment Design Considerations for Processing with Metallocene Resins 153
Andrew W. Christie
Other Processing Methods
Product and Process Developments in the Nitrogen Autoclave Process for
Polyolefin Foam Manufacture 157
D. E. Eaves and N. Witten
Properties of Syndiotactic Polypropylene Fibers Produced from Melt Spinning 167
Mohan Gownder
iv Metallocene Technology

Melt Spinning of Syndiotactic Polypropylene: Structure Development and
Implications for Oriented Crystallization 177
Ravi K. Sura, Prashant Desai and A.S. Abhiraman
Properties
New Polyolefins Characterization by Instrumental Analysis 183
Carmina Gartner and Juan D. Sierra, Roger Avakian
Dynamic Melt Rheometry Used to Study Degradation of Metallocene
Polyethylene 193
Scott H. Wasserman, George N. Foster, Douglas J. Yacka
Melt Rheology and Processability of Conventional and Metallocene
Polyethylenes 201
Choon K. Chai
Rheology of Metallocene-Catalyzed Polyethylenes. The Effects of Branching 209
Sujan E. Bin Wadud and Donald G. Baird
Extensional and Shear Rheology of Metallocene-Catalyzed Polyethylenes 217
Sujan E. Bin Wadud and Donald G. Baird
A Criterion for the Onset of Gross Polyolefins: Molecular Structure Effect 223
Seungoh Kim and John. M. Dealy
Relationship Between Structure and Rheology of Constrained Geometry
Catalyzed and Metallocene Polyethylenes 231
Paula Wood-Adams and John M. Dealy
The Influence of Sequence Length Distribution on the Linear Crystal Growth
of Ethylene-Octene Copolymers 239
John E. Wagner, Samir Abu-Iqyas, Kenneth Monar and Paul J. Phillips
Crystallization and Microstructure of Ziegler-Natta and Metallocene Based
Isotactic Polypropylenes: Simulation and Experiment 247
Y. Churdpunt and A. I. Isayev
Crystallization of Ethylene-Octene Copolymers at High Cooling Rates 257
Paul J. Phillips and John Wagner
Kinetics of Non-Isothermal Crystallization Syndiotactic Polypropylene:
Avrami, Ozawa, and Kissinger Approaches 263
Pitt Supaphol and Joseph E. Spruiell
High Temperature Flexible Polyolefins a User’s Perspective 275
Atul Khare, Samuel Y Ding, Michael T. K. Ling, and L. Woo
Table of Contents v
Markets
An Outlook for Metallocene and Single Site Catalyst Technology into
the 21st Century 283
Kurt W. Swogger
World Olefins Markets: Issues Influencing Availability and Pricing 293
Robin G. Harvan
World Polypropylene Demand 299
Russ DeLuca
PVC Markets, Today and in 2020 303
Donald Goodman
Index 307
vi Metallocene Technology

Single-Site Supported Catalysts for Ethylene
A. MuÔoz-Escalona, L. Mendez, B. PeÔa, P. Lafuente, J Sancho, W. Michiels,
G. Hidalgo and Ma. Fca. Martinez-NuÔez
Repsol, S.A. c/Embajadores, 183, 24085 Madrid, Spain
INTRODUCTION
Single-site catalysts emerged in the polymers field with the discovery of metallocene cata-
lysts by Sinn and Kaminskyl based on early transition metals (Zr, Ti, Hf). Soon after their ap-
pearance in 1980 their advantages over the conventional multi-site Ziegler-Natta and
chromium catalysts were recognized. Thus, they are high active catalysts exhibiting an ex-
ceptional ability to polymerize olefin monomers, producing extremely uniform polymers and
copolymers of narrow molecular weight distribution (polydispersity of about 2) and narrow
chemical compositional distribution, controlling at same time the resulting polymer chain ar-
chitectures. The evolution of single-site coordinative catalysis continue with the appearance
in 1995 of new Ni and Pd diimine complexes capable of producing hyper-branched and
functionalized polyolefins2 and more recently in 1998 with the synthesis of highly active cat-
alysts for ethylene polymerization based on substituted tridented pyridine bis-imine ligands
attached to Fe and Co metals.3
To prepare supported single-site catalysts different methods can be employed.4,5 Among
them, the most investigated methods are based on direct adsorption over inorganic supports
(Method 1) or on previously passivated supports by treatment with methylaluminoxane,
MAO, (Method II). A different method, based on the synthesis of metallocenes with func-
tional chemical groups and supporting them by reaction with the chemical groups of the
carriers, has been recently published.5 The reactivity between the functional groups of the
carriers and the metallocene are carefully controlled so that the reaction is very selective, al-
lowing a uniform distribution of the active sites across the catalysts particles.
We present results on supported metallocene single-site catalysts using the above men-
tioned methods as well as results obtained with unsupported and supported single-site
catalysts based on Ni and Fe metals using method II.

EXPERIMENTAL
All solvents and air-sensitive compounds were handled under nitrogen atmosphere using
Schlenk techniques.
Commercial carriers: silica (Crossfield, UK and PQ, USA) and MAO modified silica
were employed as received. The preparation of supported catalysts was carried out by sus-
pending the carrier in toluene and adding the organometallic compound. The resulting
supported catalyst was carefully washed with additional toluene, filtered and dried under vac-
uum to give a free flowing powder. The metal contents were measured by inductively coupled
plasma (JCP) spectroscopy.
Slurry polymerizations were carried out in batch using a 1,2 liter glass reactor autoclave
filled with 600 ml of n-heptane, 4 bar ethylene pressure and at different reaction temperatures.
The catalysts concentration in the reactor was in the range of 0,0056-0,0017 mmol depending
of the metal used. MAO and triisobutylaluminium (TIBA) were used as co-catalysts at a
M/Al ratio of 700.
The polymers were characterized by GPC, TREF and NMR13C using well established
techniques. Finally, the morphologies of catalysts and polymers particles were observed un-
der scanning electron microscope (SEM) coupled with an EDX detector for metals analysis.
In order to examine the distribution of the metals across the catalyst particles or the inner mor-
phology of the polymer particles, they were previously sectioned.
RESULTS AND DISCUSSION
SUPPORTED METALLOCENE SINGLE-SITE CATALYSTS.
When Method I is used to prepare SiO2 supported metallocene catalysts, different type of
complexes covalently and ionically attached to the silica are formed on its surface.5 Using
thermogravimetric analysis coupled to a mass spectrometer it could be also observed that this
reaction is accompanied by a significant decomposition of the metallocene as some amount
of free ligands could be detected. As a consequence, only a small fraction of the total sup-
ported metallocene (approximately 1%) is active for the ethylene polymerization. Therefore,
it is not surprising that the activities found for catalysts are one to two orders of magnitude
lower compared to the homogeneous analogs. Finally, if MAO is used as co-catalyst leaching
of the metallocene was found to occur so that the polymerization takes place not only on the
catalyst particle but also in solution. As result, no replication phenomena was found and same
reactor fouling or sheeting was observed.
By using Method II for supporting the metallocene, the detrimental effect of the
Bronsted and Lewis groups of the silica can be avoided. The active catalytic species are di-
rectly formed so that no additional MAO is needed for activation and only TIBA as scavenger
2 Metallocene Technology

for impurities is usually needed. Furthermore, the metallocene complex is bound to the sup-
port only by loosely ionic interaction so that it can float and move over the supported layers of
the MAO resembling the homogeneous catalyst. Therefore, catalysts with higher activities
than those obtained in Method I can be obtained. Regarding the control of the polymer mor-
phology by the catalyst, one important factor to be considered is the morphology of the
starting support MAO/SiO2. In Figure 1 the morphology of a MAO modified SiO2 containing
23% Al is shown. It can be observed that samples are composed by big spherical grains to-
gether with small irregular particles detached from the former. By EDX analysis under the
SEM it could be shown that the small particles are debris detached of the outer layer of practi-
cally pure MAO covering the silica. The small particles can be almost removed by washing
them out with toluene. Furthermore, the content of MAO across the support is not uniform
distributed decreasing its concentration from the surface to the inside of the big silica parti-
cles. After the absorption of MAO on the silica catalysts were prepared by addition of the
metallocene compound. The immobilization of the metallocene proceeds trough extraction of
one methide (or Cl) ligand by the MAO giving rise to the formation of cation-like
metallocenium-active species. Due to the uneven distribution of MAO in the modified
MAO/SiO2 a high concentration of active species are produced in the outer layers of the cata-
lyst decreasing gradually toward the center of the particles. Therefore, a non-uniform
fragmentation of catalyst particles occurs during polymerization. The rapidly expanding
outer layers are not followed by the less active growing inner part resulting in hollow poorly
filled polymer particles. Sectioned polymer particles produced with this type of catalysts can
be seen in Figure 2. Furthermore, due to the very fast fragmentation of the outer layers of the
catalysts, considerable amount of fine polymer particles is also produced. Finally, due to the
Single-Site Supported Catalysts 3
Figure 1. Morphology of MAO modified (MAO/SiO2)
containing 23% Al.Figure 2. Cress-sectioned PE particles produced with supported
metallocene on MAO/SiO2.

mobility of the active catalytic species migration to the reactor walls or reaction medium take
place leading to reactor fouling or sheeting, specially at high polymerization temperatures.
The above mentioned disadvantages can be overcome by synthesizing metallocene with
functional chemical groups and reacting them with the carrier according to the reaction
scheme below.
The active species are attached to the silica by covalent bonds so that no leaching can
take place avoiding reactor fouling. The mobility of the active catalytic species are controlled
by the number of functional groups of the metallocene reacting with the carrier and the length
of the spacers placed between the carrier and the metallocene. Furthermore, using porous car-
riers an even distribution of the anchored metallocene across the particle is obtained, leading
to a uniform fragmentation of the catalyst and to a good replication phenomena, as shown in
Figure 3.
SUPPORTED Ni BASED SINGLE-SITE CATALYSTS
The aryl-bis-diimine complexes of Ni were synthesized after Brookhart’s procedure.2 The
soluble catalysts and also heterogenized by supporting them on MAO modified SiO2 (Method
II) with 23% of Al were used for ethylene polymerization (see structure on the next page).
4 Metallocene Technology
Figure 3a. Morphology of PE produced with supported
functionalized metallocene on SiO2.
Figure 3b. Replication phenomena obtained with supported
functionalized metallocene on SiO2.
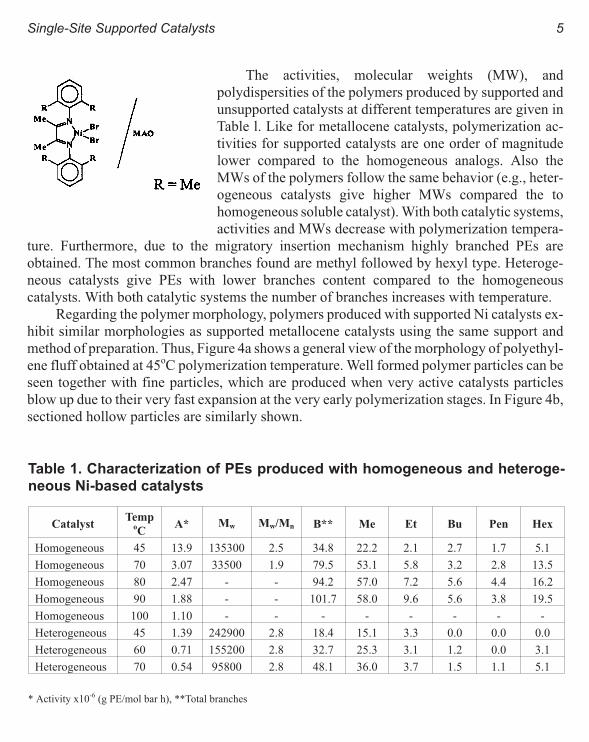
The activities, molecular weights (MW), and
polydispersities of the polymers produced by supported and
unsupported catalysts at different temperatures are given in
Table l. Like for metallocene catalysts, polymerization ac-
tivities for supported catalysts are one order of magnitude
lower compared to the homogeneous analogs. Also the
MWs of the polymers follow the same behavior (e.g., heter-
ogeneous catalysts give higher MWs compared the to
homogeneous soluble catalyst). With both catalytic systems,
activities and MWs decrease with polymerization tempera-
ture. Furthermore, due to the migratory insertion mechanism highly branched PEs are
obtained. The most common branches found are methyl followed by hexyl type. Heteroge-
neous catalysts give PEs with lower branches content compared to the homogeneous
catalysts. With both catalytic systems the number of branches increases with temperature.
Regarding the polymer morphology, polymers produced with supported Ni catalysts ex-
hibit similar morphologies as supported metallocene catalysts using the same support and
method of preparation. Thus, Figure 4a shows a general view of the morphology of polyethyl-
ene fluff obtained at 45oC polymerization temperature. Well formed polymer particles can be
seen together with fine particles, which are produced when very active catalysts particles
blow up due to their very fast expansion at the very early polymerization stages. In Figure 4b,
sectioned hollow particles are similarly shown.
Single-Site Supported Catalysts 5
Table 1. Characterization of PEs produced with homogeneous and heteroge-
neous Ni-based catalysts
CatalystTemp
oC
A* Mw Mw/Mn B** Me Et Bu Pen Hex
Homogeneous 45 13.9 135300 2.5 34.8 22.2 2.1 2.7 1.7 5.1
Homogeneous 70 3.07 33500 1.9 79.5 53.1 5.8 3.2 2.8 13.5
Homogeneous 80 2.47 - - 94.2 57.0 7.2 5.6 4.4 16.2
Homogeneous 90 1.88 - - 101.7 58.0 9.6 5.6 3.8 19.5
Homogeneous 100 1.10 - - - - - - - -
Heterogeneous 45 1.39 242900 2.8 18.4 15.1 3.3 0.0 0.0 0.0
Heterogeneous 60 0.71 155200 2.8 32.7 25.3 3.1 1.2 0.0 3.1
Heterogeneous 70 0.54 95800 2.8 48.1 36.0 3.7 1.5 1.1 5.1
* Activity x10-6 (g PE/mol bar h), **Total branches

The question is whether catalysts
can be considered as single-site or not.
To answer this question GPC and TREF
analysis of the polymers were carried
out. Narrow molecular weight distribu-
tion (MWD) of polymers produced with
supported metallocene as well as with
Ni based catalysts (supported and un-
supported) are presented in Figure 5.
For comparison, PE Affinity from Dow
produced with metallocene in solution
has been also included. More informa-
tion can be obtained from TREF
analysis of copolymers as given in Fig-
ure 6. It can be seen that the different (co)polymers exhibit very narrow chemical composition
distributions. Thus, the 1-hexene metallocene copolymer having 12.1 SCB/100oC present a
narrow peak in the TREF curve. The high branched 1-octane copolymer with 23 SBC/100oC
(Affinity plastomer from Dow) present a small shoulder on the TREF trace at about 92oC elu-
tion temperature. The Ni based hyper-branched PE (with 29/100oC SCB content) presents
also a narrow peak at 81.1oC elution temperature but a more visible peak at about 94oC. The
differences observed for both PE types (Affinity and Ni based PE) could be due to the differ-
ence in the amount and type of SCB: hexyl in case of the Affinity and a mixture of ethyl,
buthyl, hexyl and predominantly methyl for the more branched Ni based PE. The similarity
between the Ni hyper-branched polyethylene and the Affinity plastomers produced by
6 Metallocene Technology
Figure 4a. Morphology of PE obtained with Ni-based catalyst
supported on MAO/SiO2.
Figure 4b. Cross-section of PE particles.
Figure 5. GPC curves of affinity and PEs obtained with supported
metallocene and homogeneous and supported Ni-based catalysts.
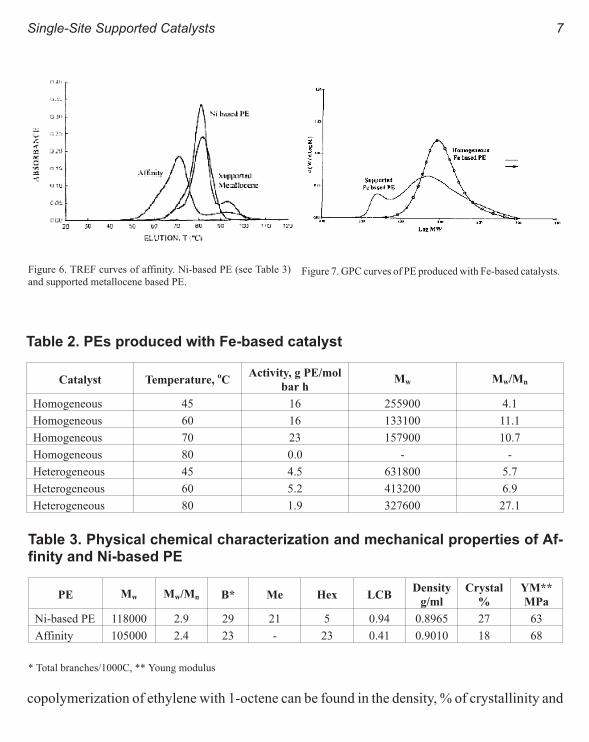
copolymerization of ethylene with 1-octene can be found in the density, % of crystallinity and
Single-Site Supported Catalysts 7
Table 2. PEs produced with Fe-based catalyst
Catalyst Temperature,oC
Activity, g PE/mol
bar hMw Mw/Mn
Homogeneous 45 16 255900 4.1
Homogeneous 60 16 133100 11.1
Homogeneous 70 23 157900 10.7
Homogeneous 80 0.0 - -
Heterogeneous 45 4.5 631800 5.7
Heterogeneous 60 5.2 413200 6.9
Heterogeneous 80 1.9 327600 27.1
Figure 6. TREF curves of affinity. Ni-based PE (see Table 3)
and supported metallocene based PE.Figure 7. GPC curves of PE produced with Fe-based catalysts.
Table 3. Physical chemical characterization and mechanical properties of Af-
finity and Ni-based PE
PE Mw Mw/Mn B* Me Hex LCBDensity
g/ml
Crystal
%
YM**
MPa
Ni-based PE 118000 2.9 29 21 5 0.94 0.8965 27 63
Affinity 105000 2.4 23 - 23 0.41 0.9010 18 68
* Total branches/1000C, ** Young modulus

mechanical properties, as shown in Table 3 (see
also reference 5). These results indicate that with
Ni catalysts plastomer Affinity type PEs could be
produced.
SUPPORTED Fe BASED SINGLE-SITECATALYSTS.
Finally, the following Fe based single-site cata-
lyst was synthesized after Bookhart et al.3 and
used supported and unsupported for ethylene
polymerization (see structure on this page).
The Method II used for supporting this cata-
lyst is the same as the one used for Ni based catalyst. However, the main difference between
both supported catalysts is that the Fe based catalyst does not polymerize ethylene when
TIBA is used as co-catalyst. Therefore, to produce an active catalyst, additional MAO is
needed in the reaction medium. The activities are lower compared to the Ni based catalysts
but the MWs are higher. The supported catalysts show activities at temperature higher that
80oC, while the homogeneous catalysts not. For homogeneous and supported catalysts the
polydispersities are too high for a single-site catalyst. The MWDs are very broad and even bi-
modal as shown in Figure 7. Therefore, more research is needed for producing Fe supported
single-site catalyst. For instance by exploring different type of systems for catalyst activation.
REFERENCES
1 H. Sinn and W. Kammisky. Adv. Organometallic Chem., 1980, 18, 99.
2 L. K. Johnson, Ch. Killian and M. Brookhart. J. Am. Chem. Soc., 1995, 117, 6414.
3 B. L. Small, M. Brookhart and A. M. A. Bennet. J. Chem. Soc., 1998, 120, 4049.
4 M. R. Ribeiro, A. Deffleux and M. F. Portela. Ind. Eng. Chem. Res., 1997, 36, 1224.
5 A. Munoz-Escalona, L. Mendez, J. Sancho, P. Lafuente, B. Peaea, W. Michels, G. Hidalgo and M. F. Martinez-Nunez.
To be published in Metalorganic Catalysts for Synthesis and Polymerization. Springer Verlag, Berlin (Germany), 1998.
8 Metallocene Technology
Synthesis of High-Molecular-Weight Elastomeric
Polypropylene With Half-Titanocene/MAO Catalysts
Oing Wu, Benheng Xie, Meiran Xie, Rui Chen
Institute of Polymer Science, Zhongshan University, Guangzhou 510275, China
INTRODUCTION
The stereochemistry and molecular weight of polyolefins strongly influence their physical
and mechanical properties. It is well known that isotactic and syndiotactic polypropylenes
consisting of a regular arrangement of the stereocenters are crystalline thermoplastics with
high melting points. Atactic polypropylene is an oil, a sticky soft solid, or an amorphous elas-
tomer, depending upon its molecular weight being low, middle, or high.
Natta1,2 was the first to produce rubbery polypropylene by titanium chloride catalyst in
the 1950s and interpreted the elastomeric properties of this material as a result of stereoblock
structure composed of crystallizable isotactic stereosequences and amorphous atactic se-
quences. Elastomeric stereoblock polypropylenes with low isotactic content and crystallinity
and a high molecular weight ether-soluble fraction can be obtained by polymerization using
alumina-supported tetraalkyl3 or bisarene4 group IVB catalysts. Significant efforts have been
directed to study the polymerization of propylene catalyzed by homogeneous
metallocene-aluminoxane catalyst systems since the 1980s. These results indicate that higher
steric controllability with the cyclopentadienyl ligand allows the synthesis of many
metallocenes with different symmetries which give rise to different stereoregular arrange-
ments of polymers. A number of non-symmetric ethylidene-, propylidene- and
dimethylsilylene-bridged metallocene complexes of titanium, zirconium, and hafnium have
been employed in preparing the thermoplastic-elastomeric polypropylenes.5-7 A mechanism
of polymerization was postulated invoking an active species having two interconverting
propagating states. The polymerization occurs alternately on the aspecific and stereospecific
sites to form alternating stereoregular/crystallizable and stereoirregular/amorphous seg-
ments. A unbridged metallocene catalyst composed of bis(2-phenylindenyl)zirconium
dichloride and MAO was designed to isomerize between chiral rac-like and achiral meso-like

geometries by rotation of the indenyl ligands about the metal-ligand bond axis in order to ob-
tain atactic-isotactic stereoblock elastomeric polypropylene.8 Recently, a novel, atactic
polypropylene with high molecular weight has been prepared with C2ν symmetric
dimethylsilanediylbis(9-fluorenyl)zirconium dichloride and dimethyl/MAO catalyst sys-
tems.9
On the other hand, half-titanocenes have been reported to be efficient catalyst precursors
for syndiospecific polymerization of styrene as well as catalyzed polymerizations of substi-
tuted styrene, conjugated diene, ethylene and their copolymerization. Very little work on
propylene polymerization by monocyclopentadienyl catalysts has been reported in open liter-
ature.10-12 Recently, Bochmann et al.13 reported a catalyst system generated from 1:1 mixtures
of Cp*TiMe3 and B(C6F5)3 being highly active for propylene polymerization to give
high-molecular-weight atactic and elastomeric polypropylene. As revealed by GPC analysis
of the produced polymer, a significant proportion of the titanium centers acts as living propyl-
ene polymerization catalyst.
In this paper, we report a new result from aspecific polymerizations of propylene pro-
moted by half-titanocene/MAO through controlling the amount of the residual TMA in
MAO. The dependencies of molecular weight of the atactic polypropylene on the structure of
titanocene and polymerization conditions are also reported.
EXPERIMENTAL
MATERIALS
Trimethyl aluminum (TMA) was commercially available and used without further purifica-
tion. Toluene, benzene and hexane were distilled from sodium under nitrogen just before use.
Half-titanocene compounds, CpTi(OBz)3, CP*TiCl3, Cp*TiBz3, Cp*Ti(O allyl)3 and
Cp*Ti(OBz)3 (Cp=η-cyclopentadienyl, Cp*= η-pentamethylcyclopentadienyl, Bz = benzyl),
were synthesized by the similar procedures as in literature.14,15 MAOs were prepared as fol-
lows: 200 mL of TMA solution (3.1 M in toluene) was added dropwise into a flask with ap-
propriate amount of ground Al2(SO4)3⋅18H2O in toluene at 0oC. The mixture was gradually
heated to 60oC and stirred for 24 h, and was then filtered. The filtrate was concentrated under
reduced pressure to a white solid. Residual TMA content in the MAO was determined by
pyridine titration. The MAOs prepared with initial [H2O]/[TMA] molar ratios of 1.0, 1.3 and
1.8 contain the residual TMA 28.0%, 22.9% and 15.4%, respectively, and are referred to
MAO1, MAO2 and MAO3. MAO2 was redissolved in toluene and then the solvent was va-
porized at 60oC in vacuo, to give MAO2’.
10 Metallocene Technology

POLYMERIZATION PROCEDURE
Polymerizations were carried out in a 100 mL glass flask equipped with a magnetic stirrer.
Twenty mL of toluene saturated with the monomer and desired amount of MAO and
titanocene compound were introduced in this order. The gaseous monomer was fed on de-
mand. The total pressure was maintained at 130 kPa throughout the course of the polymeriza-
tion. The polymerizations were stopped after 1 h and the polymers were precipitated by
addition of acidified alcohol. The resulting polymers were washed with alcohol and dried in
vacuo to constant weight.
CHARACTERIZATION
Molecular weight of polymer was obtained from intrinsic viscosities16 measured at 135oC in
tetrahydronaphthalene. The molecular weight distributions were measured on a Waters-208
LC/GPC with chloroform as solvent at 40oC. Monodisperse polystyrene was used as a stan-
dard. 13C NMR spectra of the polymers in o-dichlorobenzene were recorded on a
Bruker-AM400 at 120oC. DSC scans were obtained on a PE DSC-7c at a scanning rate of
10oC/min from -40 - 200oC.
RESULTS AND DISCUSSION
EFFECT OF RESIDUAL TMA
MAO is the ubiquitous co-catalyst used in metallocene catalyzed olefin polymerization. It al-
ways contains some amount of unreacted TMA that cannot be removed easily by vacuum dis-
tillation. The residual TMA can be a factor influencing the catalytic activity of metallocenes
and molecular weight of polyolefins. Four MAOs with various amounts of residual TMA
were tested as cocatalyst in the propylene polymerization with catalyst precursors
CpTi(OBz)3 and Cp*Ti(OBz)3. The activity of the catalyst is very sensitive to the TMA con-
tent in MAO, as showed in Table 1. Using MAOs with residual TMA content more than 20
mol% (MAO1 and MAO2), the catalysts show considerably poor activities for propylene
polymerization. High catalytic activity is achieved only with MAO3 which contains 15.4
mol% of TMA. Reducing the amount of residual TMA from 22.9 mol% (MAO2) to 17.4
mol% (MAO2’) by redissolving MAO2 in toluene and then vaporizing the solvent in vacuo at
60oC causes a dramatic increase in catalytic activity. On the contrary, addition of external
TMA into MAO3-containing system, which originally gives high activity in propylene poly-
merization, deactivates the catalyst.
To give a better insight into the effect of the TMA in MAO on the polymerization, oxida-
tion state distribution of the Ti species was measured by redox titration17 under the similar
conditions as the polymerizations. The values of titanium oxidation states from the reaction
Synthesis of Polypropylene 11

of the titanocenes with MAO are given in Table l. Large fractions of titanium are in the re-
duced oxidation states ([Ti3+] = 80.9-83.3% and [Ti2+] = 3.7-4.7% for CpTi(OBz)3, 60% and
14.9% for Cp*Ti(OBz)3) when the titanocenes react with MAO1 or MAO2 having high TMA
content, whereas the reactions with MAO3 and MAO2’ containing less TMA give mostly
Ti4+ species ([Ti4+] = 73.7-75.3% for CpTi(OBz)3, 81.3% for Cp*Ti(OBz)3). With the addi-
tion of a small amount of external TMA into the catalyst system with MAO3 originally
containing less residual TMA, [Ti3+] increases remarkably from 23.6% to 67.4% and [Ti2+]
increases from 1.1% to 3.2%, and the catalytic activity drops down correspondingly.
The results indicate that the catalyst activity can be correlated with titanium valence
states. Titanium in the catalyst systems with MAO containing less residual TMA can remain
mostly in a tetravalent state, and promotes propylene polymerization efficiently. On the other
hand, a high TMA content in MAO or addition of external TMA favors the reduction of tita-
nium to the lower valent states which do not catalyze the polymerization of propylene.
Therefore, we propose that the active species for the propylene polymerization in the
half-titanocene/MAO systems are in tetravalent state, and the Ti species in the reduced va-
lences are inactive for propylene polymerization, but active for styrene syndiotactic
polymerization.14,17,18
12 Metallocene Technology
Table 1. Polymerization of propylene using half-titanocene activated with vari-
ous MAOsa
Titanocene
MAO preparation External
TMA
mM
Oxidation statesb,
mol%Activity
kg PP/mol
Ti h
Mwc
x10-4
TgoC
No.H2O
/Al
TMA
%Ti4+ Ti3+ Ti2+
CpTi(OBz)3
MAO1
MAO2
MAO3
MAO3
MAO2’
1.0
1.3
1.8
1.8d
28.0
22.9
15.4
15.4
17.4
0
0
0
16.7
0
12.1
15.4
75.3
29.4
73.7
83.3
80.9
23.6
67.4
25.7
4.7
3.7
1.1
3.2
0.6
trace
2.20
87.7
trace
58.9
5.3
4.4
-8.1
-9.2
Cp*Ti(OBz)3
MAO2
MAO2’
MAO3
1.3d
1.8
22.9
17.4
15.4
0
0
25.1
81.3
60.0
17.3
14.9
1.1
trace
62.7
72.0
31.5
41.9
-7.3
-7.8a
aPolymerization conditions: [Ti]=1 mM; [MAO]=170 mM; toluene 20 mL; 40oC, 1 h. bTi oxidation states were measured by
redox titration. cMolecular weight from intrinsic viscosity measurement. dMAO2’ was obtained by re-dissolving MAO2 in
toluene and then vaporizing the solvent at 60oC in vacuo.

DEPENDENCE OF THE PRODUCT MOLECULAR WEIGHT
Five half-titanocenes, CpTi(OBz)3, Cp*TiCl3, Cp*TiBz3, Cp*Ti(OBz)3 and Cp*Ti(O allyl)3,
were used as the catalyst precursor in the propylene polymerization with co-catalyst MAO3.
As shown in Table 2, the titanocene without substitution for H at the Cp ring gives atactic
polypropylene of modest molecular weight (Mw = 4.4×10⁴), while the related one having
pentamethyl substitution at Cp ring gives high molecular weight atactic polypropylene
(Mw=41.9×10⁴) under the same conditions, increasing molecular weight by one order of
magnitude. On the other hand, esterified or alkylated titanocenes with appropriate -OR and
-R ligands produce higher molecular weight polypropylene than the corresponding halide.
The most common cause for molecular weight depression in metallocene-catalyzed
polymerizations is β-hydrogen transfer. The higher molecular weight of the atactic
polypropylenes obtained by catalyst systems Cp*Ti(OR)3/MAO and Cp*TiR3/MAO can be
mainly due to an increase in electron density at the metal center and also at β-carbon of the
growing polymer chain which is caused by substitutions of more electron-releasing Cp* and
-OR or -R ligands for Cp and chlorine, respectively. It makes the thermodynamic driving
force forβ-H transfer diminishing. In addition, bulk of the Cp* and -OR or -R ligands has cer-
tain steric effect on β-hydrogen transfer by increasing the energy of the transition state for
which it is necessary to rotate the growing polymer chain about the Cα—Cβ bond.
The polymers produced by the Cp*-bearing titanocene catalysts at ambient pressure and
temperatures ≤ 60oC have molecular weight higher than 20×104 with narrow polydispersities
ranging from 1.5 to 2.0. As shown in Table 3, the molecular weight of the polymers is also
sensitive to polymerization temperature and increases with reducing the temperature. When
the polymerizations were carried out at 0oC in toluene, Mw values of the produced
polypropylenes reach 103×104 for Cp*Ti(OBz)3 system, 69×104 for Cp*Ti(O allyl)3 system,
Synthesis of Polypropylene 13
Table 2. Polymerization of propylene with different half-titanocenes activated
with MAO3
Titanocene[MAO3]/[Ti]
mol/mol
Activity
kg PP/mol Ti hMw x 10
-4 Ether-soluble
fraction, %
CpTi(OBz)3 330 84.9 4.7 99
Cp*TiCl3 330 37.6 12.9 98
Cp*Ti(OBz)3 330 98.0 42.6 99
Cp*Ti(O allyl)3 330 134 34.5 98
Cp*TiBz3 230 112 34.3 nd.
Cp=cyclopentadienyl; Cp*=pentamethylcyclopentadienyl; [Ti]=0.5 mM; toluene 20 mL, T=40oC, t=1 h
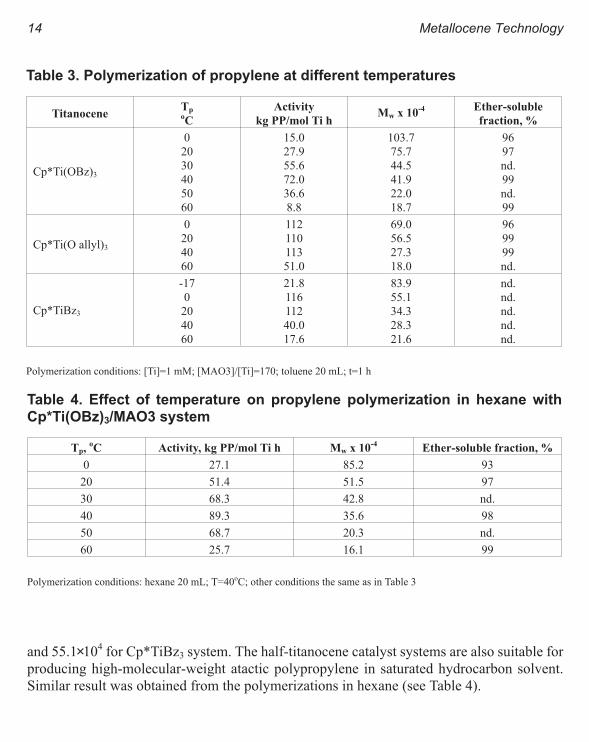
and 55.1×10⁴ for Cp*TiBz3 system. The half-titanocene catalyst systems are also suitable for
producing high-molecular-weight atactic polypropylene in saturated hydrocarbon solvent.
Similar result was obtained from the polymerizations in hexane (see Table 4).
14 Metallocene Technology
Table 3. Polymerization of propylene at different temperatures
TitanoceneTpoC
Activity
kg PP/mol Ti hMw x 10
-4 Ether-soluble
fraction, %
Cp*Ti(OBz)3
0
20
30
40
50
60
15.0
27.9
55.6
72.0
36.6
8.8
103.7
75.7
44.5
41.9
22.0
18.7
96
97
nd.
99
nd.
99
Cp*Ti(O allyl)3
0
20
40
60
112
110
113
51.0
69.0
56.5
27.3
18.0
96
99
99
nd.
Cp*TiBz3
-17
0
20
40
60
21.8
116
112
40.0
17.6
83.9
55.1
34.3
28.3
21.6
nd.
nd.
nd.
nd.
nd.
Polymerization conditions: [Ti]=1 mM; [MAO3]/[Ti]=170; toluene 20 mL; t=1 h
Table 4. Effect of temperature on propylene polymerization in hexane with
Cp*Ti(OBz)3/MAO3 system
Tp,oC Activity, kg PP/mol Ti h Mw x 10
-4Ether-soluble fraction, %
0 27.1 85.2 93
20 51.4 51.5 97
30 68.3 42.8 nd.
40 89.3 35.6 98
50 68.7 20.3 nd.
60 25.7 16.1 99
Polymerization conditions: hexane 20 mL; T=40oC; other conditions the same as in Table 3

All the polypropylenes obtained with the Cp*-bearing titanocene catalysts are amor-
phous, elastomeric materials and soluble in ether and hydrocarbon solvents. The glass
transitions of the materials appear approximately at -8oC by DSC measurement. 13C NMR
analyses confirm the half-titanocene/MAO catalysts afford atactic and, to a certain extent,
regio-irregular polypropylenes.
ACKNOWLEDGMENT
Financial support of this research from the National Natural Science Foundation of China and
the Science Foundation of Guangdong Province are gratefully acknowledged.
REFERENCES
1 G. Natta, G. Mazzanti, G. Cresci, G. Moraglio, Chim. Ind, Milan, 39, 275 (1957).
2 G. Natta, J. Polym. Sci., 34, 531 (1959).
3 J. W. Collette, C. W. Tullock, R. N. MacDonald, W. H. Buck, A. C. L. Su, J. R. Harrell, R. Mulhaupt, B. C. Anderson,
Macromolecules, 22, 3851 (1989).
4 C. W. Tullock, F. N. Tebbe, R. Mulhaupt, D. W. Ovenall, R. A. Setterquist, S. D. Ittel, J. Polym. Sci., Part A: Polym. Chem.,
27, 3063 (1989).
5 D. T. Mallin, M. D. Rausch, Y. G. Lin, S. Dong, J. C. W. Chien, J. Am. Chem. Soc., 112, 2030 (1990).
6 G. H. Llinas, S. H. Dong, D. T. Mallin, M. D. Rausch, Y. G. Lin, H. H. Winter, J. C. W. Chien, Macromolecules, 25, 1242
(1992).
7 W. J. Gauthier, J. F. Corrigan, N. J. Taylor, S. Collins, Macromolecules, 28, 3771 (1995).
8 G. W. Coates, R. M. Waymouth, Science, 267, 217 (1995).
9 L. Resconi, R. L. Jones, A. L. Rheingold, G. P. A. Yap, Organometallics, 15, 998 (1996).
10 K. Soga, D. H. Lee, Makromol. Chem., 193, 1687 (1992).
11 C. Pellecchia, A. Proto, P. Longo, A. Zambelli, Makromol. Chem., Rapid Commun., 13, 277 (1992).
12 Q. Wu, Z. Ye, Q.-H. Gao, S.-A. Lin, J. Polym. Sci., Part A: Polym. Chem., 36, 2051 (1998).
13 J. Sassmannshausen, M. Bochmann, J. Roesch, D. Lilge, J. Organomet. Chem., 548, 23 (1997).
14 Q. Wu, Z. Ye, S.-A. Lin, Macromol. Chem. Phys., 198, 1823 (1997).
15 M. Mena, P. Royo, R. Serrano, M. A. Pellinghell, A. Tiripicchio, Organometallics, 8, 476 (1989).
16 D. Pearson, L. Fetters, L. Younghouse, J. Mays, Macromolecules, 21, 479 (1988).
17 J. C. W. Chien, Z. Salajha, S. Dong, Macromolecules, 25, 3199 (1992)
18 P. Longo, A. Proto, A. Zambelli, Macromol. Chem. Phys., 196, 3015 (1995).
Synthesis of Polypropylene 15

Is Metallocene Polyethylene Blend with HDPE More
Compatible Than with PP?
D. Rana, K. Cho, B. H. Lee and S. Choe
Department of Chemical Engineering, Inha University, Inchon 402-751, Korea
Taedok Institute of Technology, SK Corporation, Taejon 305-370, Korea
INTRODUCTION
Polyolefins are the prime polymers in the industrial field. A vast amount of blends in linear
low density polyethylene (LLDPE) with conventional polyolefins have been commercially
used in the agricultural application and packaging industry as a form of extrusion blown
films. LLDPE contains generally 1-butene or 1-hexene or 1-octene comonomer controlled by
Ziegler-Natta catalyst. Recently LLDPEs with uniformly distributed high percentage of
comonomer are made by metallocene catalysts. Though many research works1-5 have already
been done regarding LLDPE made by Ziegler-Natta catalyst, it still needs to study recently
developed metallocene polyethylene (MCPE). The interfacial tension between MCPE and
polypropylene (PP) was found to be very low which indicates submicron dispersions of
polyolefins were accomplished even with high melt index of PP.6 Again MCPE exhibits sharp
relaxation at sub-ambient temperature.7 High and low molecular weight metallocene cata-
lyzed high density polyethylene (HDPE) formed a miscible blend.8 Previously this laboratory
had a project regarding miscibility and processability of LLDPE with other conventional
polyethylene.9-15 It is our interest to examine the thermal, mechanical and viscoelastic behav-
iors of MCPE blended with conventional polyolefins, e.g., HDPE and PP. In this article, we
present evidence, first to our knowledge, that both blends are immiscible and the extent of
compatibility of the HDPE-MCPE blends is larger than the PP-MCPE blends by both thermal
and relaxation studies.
EXPERIMENTAL
Molecular weight of the polymers was measured by Waters 510 GPC at 140oC using
1,2,4-trichlorobenzene as a solvent and polystyrene as a standard. The number (Mn) and
weight (Mw) average molecular weight, and polydispersity index (PDI, Mw/Mn) are calcu-
lated from the GPC curves. Melting and crystallization behaviors of the blends were exam-
ined by Perkin-Elmer DSC-7. Indium and zinc were used for the calibration of the melting
peak temperature and enthalpy of fusion. The samples were scanned up to 180oC at a heating
rate 10oC/min, annealed for 5 min and cooled down to 50oC at a cooling rate 10oC/min. Again
re-scanned at the same rate and temperature interval as mentioned before. The melting and
crystallization temperature, and heat of fusion and crystallization were calculated from the
second scan. The relaxations were measured by using the Polymer Laboratories DMTA Mk
III in the range -145oC to Tm -10oC, and tensile mode at a constant frequency of 1 Hz, and at a
heating rate of 2oC/min. The mechanical properties were measured using universal testing
machine INSTRON 4465 with a cross-head speed 200 mm/min at ambient temperature. All
the specimens were dumbbell-shaped with 2 mm thickness, 12.6 mm width and 25 mm gauge
length. Izod impact energy was measured by Tinius Olsen impact tester at notched mode at
-27oC.
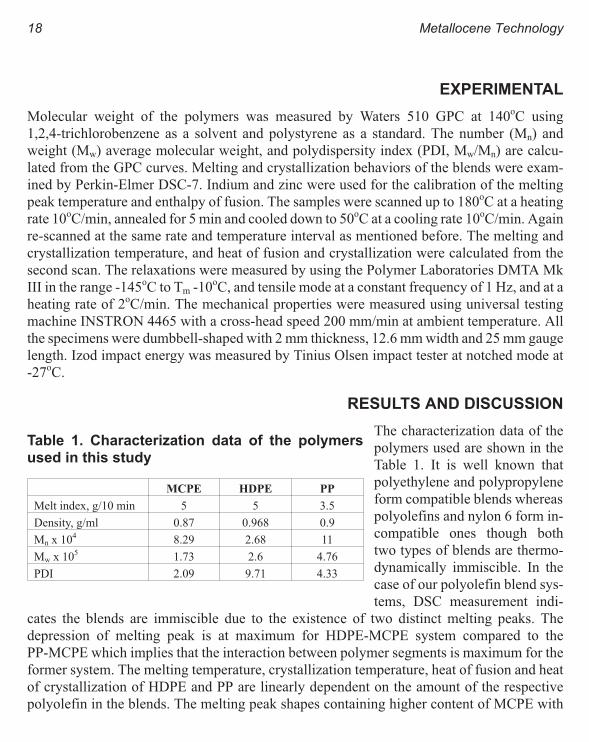
RESULTS AND DISCUSSION
The characterization data of the
polymers used are shown in the
Table 1. It is well known that
polyethylene and polypropylene
form compatible blends whereas
polyolefins and nylon 6 form in-
compatible ones though both
two types of blends are thermo-
dynamically immiscible. In the
case of our polyolefin blend sys-
tems, DSC measurement indi-
cates the blends are immiscible due to the existence of two distinct melting peaks. The
depression of melting peak is at maximum for HDPE-MCPE system compared to the
PP-MCPE which implies that the interaction between polymer segments is maximum for the
former system. The melting temperature, crystallization temperature, heat of fusion and heat
of crystallization of HDPE and PP are linearly dependent on the amount of the respective
polyolefin in the blends. The melting peak shapes containing higher content of MCPE with
18 Metallocene Technology
Table 1. Characterization data of the polymers
used in this study
MCPE HDPE PP
Melt index, g/10 min 5 5 3.5
Density, g/ml 0.87 0.968 0.9
Mn x 104 8.29 2.68 11
Mw x 105 1.73 2.6 4.76
PDI 2.09 9.71 4.33

HDPE and PP are shown in Figures 1 and 2 respectively. Although the polydispersity index
values are almost comparable but fractionation takes place in the case of HDPE-MCPE blend
which also indicates better interaction between HDPE and MCPE.
Figure 3 represents the temperature dependence of tensile storage modulus, E’, tensile
loss modulus, E", and tensile tanδ of MCPE which contains 24% 1-octene comonomer. A
Metallocene Polyethylene Blend 19
Figure 1. The melting peak shape of HDPE in the second scan
of DSC thermograms of HDPE-MCPE blends. The number
indicates the percentage of MCPE in the blends.
Figure 2. The melting peak shape of PP in the second scan of
DSC thermograms of PP-MCPE blends. The number indicates
the percentage of MCPE in the blends.
Figure 3. Representative of storage modulus, E’, loss modulus,
E”, and tensile tan δ as a function of temperature for pure
MCPE.
Figure 4. Tensile tan δ spectra of HDPE-MCPE blends and
pure HDPE. The number indicates the percentage of HDPE in
the blends.

broad relaxation exhibits at about
-55oC which is due to the segmental
motion of 1-octene comonomer.
HDPE does not show any relaxation
whereas PP shows at 12oC. Lower
content of MCPE (up to about 50%)
in PP-MCPE blends show two dis-
cernible transitions whereas
relaxation shifted to higher tempera-
ture as the MCPE content decreases in
HDPE-MCPE system as shown in
Figures 4 and 5 respectively. So the
latter system becomes more compati-
ble than the former ones.
As expected, both the modulus
and yield stress decrease as the MCPE
content increases in the blends of
HDPE-MCPE and PP-MCPE. Tensile
strength at break decreases exponentially by the addition of MCPE whereas elongation at
break increases linearly up to about 50% of MCPE and then abruptly increases with MCPE
for both systems. As expected, impact energy increases with MCPE content in the blend. Im-
pact energy of HDPE-MCPE blend is higher than the PP-MCPE blend.
CONCLUSIONS
Metallocene polyethylene blends with HDPE and PP are immiscible but the degree of com-
patibility is larger for the former system compared to the latter which reminds the old idea
“like dissolves like” is also valid in the polyolefin blends.
ACKNOWLEDGMENTS
S. Choe thanks to the SK Corporation and Inha University for financial support of this work.
REFERENCES
1 A. A. Donatelli, J. Appl. Polym. Sci., 1979, 23, 3071.
2 S. R. Hu, T. Kyu and R. S. Stein, J. Polym. Sci., Polym. Phys., 1987, 25, 71.
3 F. M. Mirabella, S. P. Westphal, P. L. Fernando, E. A. Ford and J. G. Williams, J. Polym. Sci., Polym. Phys., 1988, 26, 1995.
4 J. N. Hay and X. -Q. Zhou, Polymer, 1993, 34, 2282.
5 A. K. Gupta, S. K. Rana and B. L. Deopura, J. Appl. Polym. Sci., 1993, 49, 477.
6 N. R. Dharmarajan and T. C. Yu, Plastics Engineering, 1996, 52, 33.
20 Metallocene Technology
Figure 5. Tensile tan δ spectra of PP-MCPE blends and pure PP. The
number indicates the percentage of PP in the blends.

7 L. Woo, M. T. K. Ling and S. P. Westphal, Thermochimica Acta, 1996, 272, 171.
8 A. Munoz-Escalona, P. Lafuente, J. F. Vega, M. E. Munoz and A. Santamaria, Polymer, 1997, 38, 589.
9 H. Lee and S. Choe, Polymer (Korea), 1994, 18, 338.
10 K. Cho and S. Choe, Polymer (Korea), 1995, 19, 615.
11 K. Cho, 1. Park and S. Choe, Polymer (Korea), 1995, 19, 625.
12 H. Lee, K. Cho, K. Hwang, B. H. Lee and S. Choe, Polymer (Korea), 1996, 20, 317.
13 K. Cho, T. K. Ahn, B. H. Lee and S. Choe, J. Appl. Polym. Sci., 1997, 63, 1265.
14 H. Lee, K. Cho, T. K. Alm, S. Choe, I. J. Kim, I. Park and B. H. Lee, J. Polym. Sci., Polym. Phys., 1997, 35, 1633.
15 K. Cho, T. K. Alm, I. Park, B. H. Lee and S. Choe, J. Ind Eng. Chem., 1997, 3, 147.
Metallocene Polyethylene Blend 21

Spherulite Boundary Strengthening: A New Concept
in Polymer Blends
A. Lustiger, CN. Marzinsky and R. R. Mueller
Exxon Research and Engineering Route 22 East Annandale, NJ 08801
INTRODUCTION
Semi-crystalline polymers, as the name suggests, contain both a liquid-like amorphous phase
and an ordered crystalline phase. When solidified from the melt, the crystalline phase resides
in platelets called lamellae, which typically grow radially from a central point to form spheru-
lites.
The basis for the phenomenon of spherulitic crystallization is the tendency for the poly-
mer to reject non-crystallizable material during their formation.1 As a result, the boundaries
between adjacent spherulites contain a high concentration of noncrystallizable material com-
posed of low molecular weight chains, atactic polymer, and various impurities. Not
unexpectedly, the segregation of non-crystallizable material at spherulite/lamellar boundaries
results in mechanical weakness in these regions of the polymer.2
The objective of this work is to develop a scheme for increasing interspherulitic and
interlamellar strength in polypropylene (PP) while maintaining as much as possible the origi-
nal crystallinity and melt flow characteristics. The approach we have taken towards this
objective is to blend isotactic polypropylene homopolymer with a copolymer that segregates
at spherulite boundaries and interlamellar regions like a noncrystallizable impurity during
primary crystallization, but then cocrystallizes across adjacent spherulites/lamellae during
secondary crystallization. In anthropomorphic terms, the principle is to “fool” the polypropy-
lene homopolymer spherulites into rejecting a copolymer that the homopolymer “thinks” is
an impurity. However, after this rejection, the copolymer would strengthen spherulite and
lamellar boundaries through forming new connections between them.

EXPERIMENTAL
MATERIALS
Homopolymers
The polypropylene used in this study was an experimental high crystallinity polypropylene
(HIX). Through poisoning those catalyst sites which produce atactic PP segments, the
crystallinity of IPP can be significantly increased. High crystallinity IPP with an isopentad
fraction of 95% was produced with a melt flow rate of 1.5. Molecular weight of the material
was Mn= 87,700, Mw=360,900.
Copolymers
Two types of copolymers were used in this study. The first was a 30 MFR ethylene propylene
random copolymer (Mw=133,600, Mw/Mn=2.2), containing 5.2% ethylene. The second com-
prised a multiblock copolymer of isotactic and atactic polypropylene. This copolymer was
synthesized based on a paper authored by Chien et al.3 The copolymer had Mw=295,000 and
Mw/Mn =2.7.
Blending
Blending of the homopolymers and copolymers took place using a CSI laboratory scale ex-
truder with a barrel temperature of 200oC. In specific cases, 1000 parts per million (PPM) of
sodium benzoate was added to these blends in order to raise the crystallization temperature of
the homopolymer. Tensile, flexural and impact specimens were compression molded directly
from the extrudate at 200oC.
ANALYTICAL CHARACTERIZATION
Fourier Transform Infrared (FTIR) Microscopy
A Nicolet 510P FTIR microscope was used to determine relative ethylene content at
spherulite boundaries versus spherulite centers in the homopolymer blended with the random
ethylene propylene copolymer.
MECHANICAL CHARACTERIZATION
Flexural testing was accomplished using Instron 4502 mechanical test equipment. Specimens
were molded 0.02 inches thick with a gage length of 1 inch. Standard flex and Izod specimens
had identical geometries. Flex specimens were tested with a span of 2 inches deformed at 0.05
inches per minute. Flexural data given is an average of three specimens. Izod impact speci-
mens were notched and tested in accordance with ASTM standard D256. Impact data given is
an average of five specimens.
24 Metallocene Technology

RESULTS AND DISCUSSION
RANDOM COPOLYMER BLENDS
To prove the feasibility of the spherulite boundary strengthening concept, it was necessary to
experimentally demonstrate that:
1) the homopolymer-copolymer blends would be melt miscible, or at most
immiscible on the nanoscale.
2) the copolymer migrates to spherulite boundaries during crystallization of
these blends.
3) after this migration, the copolymer forms a link between adjacent spherulites
through crystallization of the copolymer chains onto the previously existing
homopolymer lamellae in adjacent spherulites.
The first experiment was designed to demonstrate copolymer segregation at the
spherulite boundaries. This was done by implementing a classic experiment first described by
Keith and Padden.1 In their experiment, a blend of isotactic and atactic polypropylene was
blended in the ratio of 10:90 weight percent and crystallized isothermally using a hot stage.
These spherulites were compared with isotactic homopolymer spherulites with no diluent
grown under similar conditions.
In their paper, segregation was demonstrated by observing the nature of the spherulites
formed in these blends with high diluent (i.e., atactic polymer) concentration. While pure
homopolymer yielded the familiar compact spherulites, the high diluent blends displayed
open armed, coarse spherulites. These open spherulites are produced because so much
noncrystallizable impurity is rejected from the growing spherulites that the formation of new
lamellae is sacrificed in favor of thickening of existing lamellae. In contrast, the
homopolymer contains a much lower level of impurity, resulting in compact spherulites.
Figure 1 shows a 10:90 blend of PD5052 homopolymer and the random ethylene propyl-
ene copolymer described above crystallized isothermally at 137oC, displaying a similar open
spherulitic morphology. This appearance confirms segregation of the copolymer to spherulite
boundaries.
Cocrystallization
A 75-25 blend of homopolymer and random copolymer was isothermally crystallized at
135oC, etched using potassium permanganate, placed in a constant strain fixture and strained
until close to yield. Subsequently, the sample while still in the fixture was placed under the
FTIR microscope, and spectra were obtained at the spherulite boundaries and spherulite cen-
ters respectively. A composite of these results is shown in Figure 2. The optical microscope
results clearly show the presence of oriented material at the spherulite boundaries in the strain
Spherulite Boundary Strengthening 25
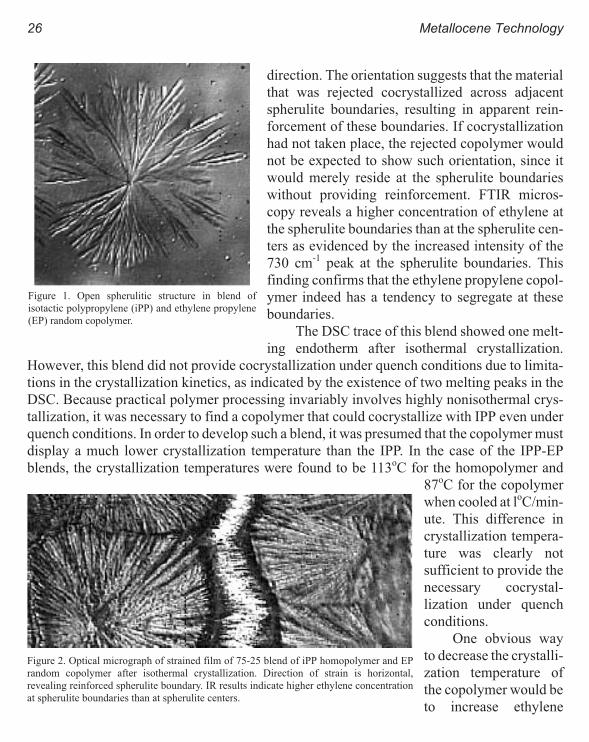
direction. The orientation suggests that the material
that was rejected cocrystallized across adjacent
spherulite boundaries, resulting in apparent rein-
forcement of these boundaries. If cocrystallization
had not taken place, the rejected copolymer would
not be expected to show such orientation, since it
would merely reside at the spherulite boundaries
without providing reinforcement. FTIR micros-
copy reveals a higher concentration of ethylene at
the spherulite boundaries than at the spherulite cen-
ters as evidenced by the increased intensity of the
730 cm-1 peak at the spherulite boundaries. This
finding confirms that the ethylene propylene copol-
ymer indeed has a tendency to segregate at these
boundaries.
The DSC trace of this blend showed one melt-
ing endotherm after isothermal crystallization.
However, this blend did not provide cocrystallization under quench conditions due to limita-
tions in the crystallization kinetics, as indicated by the existence of two melting peaks in the
DSC. Because practical polymer processing invariably involves highly nonisothermal crys-
tallization, it was necessary to find a copolymer that could cocrystallize with IPP even under
quench conditions. In order to develop such a blend, it was presumed that the copolymer must
display a much lower crystallization temperature than the IPP. In the case of the IPP-EP
blends, the crystallization temperatures were found to be 113oC for the homopolymer and
87oC for the copolymer
when cooled at loC/min-
ute. This difference in
crystallization tempera-
ture was clearly not
sufficient to provide the
necessary cocrystal-
lization under quench
conditions.
One obvious way
to decrease the crystalli-
zation temperature of
the copolymer would be
to increase ethylene
26 Metallocene Technology
Figure 1. Open spherulitic structure in blend of
isotactic polypropylene (iPP) and ethylene propylene
(EP) random copolymer.
Figure 2. Optical micrograph of strained film of 75-25 blend of iPP homopolymer and EP
random copolymer after isothermal crystallization. Direction of strain is horizontal,
revealing reinforced spherulite boundary. IR results indicate higher ethylene concentration
at spherulite boundaries than at spherulite centers.

content beyond 5.2%. However, based on Lohse’s miscibility criteria for EP copolymers,4 the
maximum ethylene content that could be tolerated in a melt miscible blend would be 8%. The
change from 5.2% to 8% ethylene would be too insignificant to effect a sufficient difference
in crystallization temperature. As a result, a new copolymer was needed.
ISOTACTIC-ATACTIC POLYPROPYLENE (IPPAPP) COPOLYMER BLENDS
As was evident in the Keith-Padden experiment described above, subsequently confirmed by
Lohse ,4 atactic polypropylene is melt miscible with isotactic polypropylene in all concentra-
tions. Although pure atactic polypropylene does not crystallize, if one were to use a
multiblock copolymer of isotactic and atactic polypropylene (IPPAPP) in a blend with pure
IPP, the desired cocrystallization could result.
Such a copolymer has in fact been synthesized by Chien et al.5,6 using single site catalyst
technology. In these papers, polymerization conditions are laid out to synthesize what the au-
thors describe as crystalline-amorphous block polypropylene.
The Keith-Padden experiment was repeated to confirm the appearance of open spheru-
lites in a 90:10 IPPAPP- IPP blend and hence verify segregation of the IPPAPP copolymer to
the spherulite boundaries.
Use of Nucleating Agents to Enhance Cocrystallization
A further means of maximizing the difference in crystallization temperatures and hence en-
hance cocrystallization was to add a nucleating agent to the high crystallinity polypropylene.
The nucleating agent chosen was sodium benzoate, incorporated at a concentration of 1000
parts per million (PPM) in the blend.
Modulus and toughness results for the homopolymers and blends are shown below in
Table l. As is well known in the industry, addition of nucleating agent to polypropylene in-
creases flexural modulus but moderately decreases toughness. When IPPAPP alone was
added to the HIX PP, toughness increased but modulus decreased. However, when both so-
dium benzoate and IPPAPP were added, the blend showed a simultaneous increase in both
Izod toughness values as flexural modulus. In contrast, if atactic PP (APP) is included as the
blending component instead of IPPAPP, a significant reduction in modulus and toughness is
evident. Such an effect would be expected with an atactic PP blend, since the desired
cocrystallization is precluded.
The simultaneous improvement in toughness and stiffness brought about by the addition
of the nucleating agent is presumably because the additive provides both enhanced crystalli-
zation which increases stiffness, and enhanced cocrystallization which increases toughness.
In the case of nucleated material, where the spherulites are on the order of one micron in
diameter, one would expect that the spherulite boundary reinforcing effect might be an unim-
portant factor in increasing toughness. However, it should be noted that the cocrystallization
Spherulite Boundary Strengthening 27

effect is presumably not limited to the interspherulitic regions, but takes place between adja-
cent lamellae as well, resulting in an increase in the interlamellar tie molecule concentration.
CONCLUSIONS
Spherulite boundary and interlamellar strengthening of isotactic polypropylene can take
place through blending with an appropriate copolymer. The copolymer migrates to spherulite
boundaries as well as interlamellar regions and cocrystallizes, resulting in a higher number of
interspherulitic links and tie molecules. Isotacticatactic polypropylene block copolymer has
been shown to be an effective spherulite boundary strengthening additive.
Toughness as measured by Izod impact testing has been found to significantly increase
through blending with this copolymer. Perhaps more significantly, the toughness enhance-
ment is not accompanied by a significant stiffness decrease as is generally evident in
conventional rubber toughening schemes.
REFERENCES
1 H. D. Keith and F. J. Padden, J. Appl. Phys., 35, 1270 (1964).
2 J. M. Schultz, Polym. Eng. Sci. 24, 770, (1982).
3 D. T. Mallin, M. D. Rausch, Y. G. Lin, S. Dong and J. C. W. Chien, J. Am. Chem. Soc., 112, 2030 (1990).
4 D. J. Lohse and G. E. Wissler, J. Mat. Sci., 26, 743 (1991).
5 G. H. Llinas, S. H. Dong, D. T. Mallin, M.D. Rausch, Y. G. Lin, H. Henning-Winter and J. C. W. Chien, Macromolecules,
25, 1242 (1992).
6 B. Rieger, X. Mu, D.T. Mallin, M.D. Rausch and J.CW, Chien, Macromolecules, 23, 3559 (1990).
28 Metallocene Technology
Table 1. Stiffness and toughness of isotactic PP-IPPAPP blends
Flexural modulus, MPa Izod impact, J
IPP 1322 0.147±0.006
IPP + Na benzoate 1679 0.133±0.006
IPP + 10% IPPAPP 1250 0.237±0.016
IPP + 10% IPPAPP + Na benzoate 1301 0.289±0.016
IPP + 10% APP 1163 0.128±0.017
Modification of Syndiotactic Polystyrene
JØrg Kressler
Martin-Luther-Universit¬t Halle-Wittenberg, Fachbereich Werkstoffwissenschaften,
D-06099 Halle (Saale), Germany
Ralf Thomann
Freiburger Materialforschungszentrum und Institut fòr Makromolekulare Chemie der
Albert-Ludwigs-Universit¬t Freiburg, Stefan-Meier-Str. 21, 79104 Freiburg, Germany
INTRODUCTION
The first synthesis of syndiotactic polystyrene (s-PS) was done by Ishihara et al. in 1986.1
s-PS has a complex polymorphism. Three different crystal structures (α β γ, , ) and one clathrat
structure (δ) have been described.2-4 Furthermore, the two crystalline modifications α and βare divided in different submodifications having different degrees of structural order
( , , ,′ ′′ ′ ′′α α β β ).2,3 In syndiotactic copolymers of styrene and p-methylstyrene, the α -modifica-
tion is favored relative to the β-modification.5,6
In order to study the influence of longer aliphatic substitution on the phenyl ring on the
crystal structure, the crystallization behavior of the copolymers (s-P(S-co-BuS)-X, X ≡mol%
p-n-butylstyrene (BuS)) is studied by means of atomic force microscopy (AFM), wide angle
X-ray scattering (WAXS) and differential scanning calorimetry (DSC).7
A certain disadvantage of s-PS is the extreme brittleness. There are several possibilities
to overcome this problem. It is demonstrated by diffusion experiments employing nuclear re-
action analysis (NRA) that s-PP is miscible with deuterated atactic polystyrene (a-PS). The
miscibility behavior of s-PS with other polymers is very similar to that of a-PS.
Therefore, a broad range of polymers is available for the modification of s-PS as PPE,
Kraton, HIPS etc. The blend morphology of s-PS/Kraton (polystyreneblock-poly(ethene
-ran-but-l-ene)-block-polystyrene) is studied by means of atomic force microscopy.

EXPERIMENTAL
MATERIALS
The copolymers of styrene and BuS were polymerized using the metallocene catalyst system
CpTiCl3 (CP = cyclopentadienyl)/MAO. Some polymer data are summarized in Table 1. The
s-PS homopolymer used was from the BASF AG (Ludwigshafen, Germany). Kraton is a
commercially used TPE of Shell.
DSC MEASUREMENTS
Differential scanning calorimetry (DSC) was performed on a Perkin Elmer DSC-7 thermal
analyzer.
LIGHT MICROSCOPY
The light microscopic investigations are carried out with an Olympus-Vanox AH2 micro-
scope and a Linkam TMS 90 hot stage that allows observation during isothermal crystalliza-
tion. The samples used to study the crystalline morphology were prepared by melting the
powder of the as-prepared and dried polymer between two cover glasses. The layer thickness
between the glasses was about 30 to 50 µm. The samples were held for 10 min at 280oC and
then quenched to crystallization temperature with a rate of 99oC/min.
ATOMIC FORCE MICROSCOPY
To study the crystalline morphology (Figure 3) the prepared film was etched to remove amor-
phous material from the surface. The etching reagent was prepared by stirring 0.02 g potas-
sium permanganate in a mixture of 4 ml sulfuric acid (95-97 %) and 10 g orthophosphoric
30 Metallocene Technology
Table 1. Polymer data
Sample Tg,oC BuS
+content, mol%* Mn, g/mol** Mw/Mn
s-P(S-co-BuS)-4 95 4 81000 2.2
s-P(S-co-BuS)-7 93 7 85000 2.2
s-P(S-co-BuS)-11 90 11 124000 1.6
s-P(S-co-BuS)-20 83 20 33000 5.6
s-P(S-co-BuS)-27 82 27 51000 4.1
s-P(S-co-BuS)-40 66 40 18000 6.3
s-P(S-co-BuS)-47 61 47 21000 7.7
s-PS rrrr-Pantads > 99% Mn=140000** Mw/Mn=1.9
* calculated from 1H- and 13C-NMR spectra, ** by size exclusion chromatography versus polystyrene standards
acid. The 30 to 50µm thick film was immersed into the fresh etching reagent at room temper-
ature and held there for 1 h. At the beginning, the sample was held in an ultrasonic bath for 15
min. For subsequent washings, a mixture of 2 parts by volume of concentrated sulfuric acid
and 7 parts of water was prepared and cooled to near the freezing point with dry ice in
iso-propanol. The sample was washed successively with 30 % aqueous hydrogen peroxide (to
remove any manganese dioxide present). Then the sample was washed with distilled water.
Each washing was supported with an ultrasonic bath. The AFM experiments were carried out
with a “Nanoscope III” scanning probe microscope (Digital Instruments) at ambient condi-
tions in the tapping-mode/height-mode (TMHM). The blend morphologies (Figures 5a,5b)
were measured in the tapping mode/phase mode (TMPM) without any etching procedure.
WAXS MEASUREMENTS
The measurements were carried out with a Siemens D500 apparatus. For WAXS measure-
ments the CuKα radiation of a wavelength of λ=0.154 nm was used.
RESULTS AND DISCUSSION
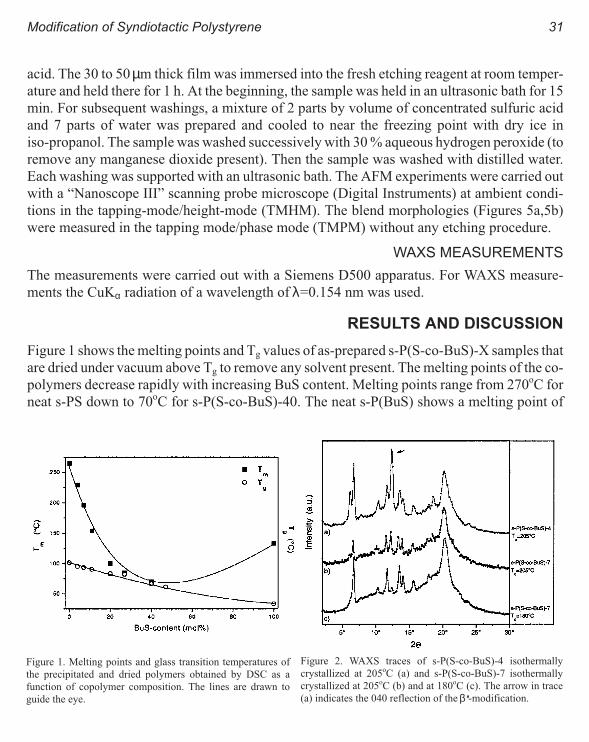
Figure 1 shows the melting points and Tg values of as-prepared s-P(S-co-BuS)-X samples that
are dried under vacuum above Tg to remove any solvent present. The melting points of the co-
polymers decrease rapidly with increasing BuS content. Melting points range from 270oC for
neat s-PS down to 70oC for s-P(S-co-BuS)-40. The neat s-P(BuS) shows a melting point of
Modification of Syndiotactic Polystyrene 31
Figure 1. Melting points and glass transition temperatures of
the precipitated and dried polymers obtained by DSC as a
function of copolymer composition. The lines are drawn to
guide the eye.
Figure 2. WAXS traces of s-P(S-co-BuS)-4 isothermally
crystallized at 205oC (a) and s-P(S-co-BuS)-7 isothermally
crystallized at 205oC (b) and at 180oC (c). The arrow in trace
(a) indicates the 040 reflection of the ′′β -modification.

133oC. This indicates the existence of an eutecticum for the melting points as a function of the
copolymer composition.8 Glass transition temperatures of copolymers were found to depend
quite linearly on BuS contents. The glass transition temperature for the homopolymer
s-P(BuS) is 33oC.
Figure 2 shows the WAXS traces of s-P(S-co-BuS)-4 (a) and of s-P(S-co-BuS)-7 (b) iso-
thermally crystallized from the melt at 205oC. Furthermore, an s-P(S-co-BuS)-7 trace (c)
obtained after crystallization at 180oC is shown. Thus the traces (a) and (c) were obtained
from samples crystallized at identical supercoolings (T Tm
o
c− ). s-P(S-co-BuS)-4 isother-
mally crystallized at 205oC shows mainly the ′β -modification. One intense peak of the′β -modification at 2Θ= 12.3o is marked with an arrow. s-P(S-co-BuS)-7 isothermally crystal-
lized at the same temperature shows theα - and theβ-modifications. The increasing amount of
the α -modification with increasing comonomer content is also observed for syndiotactic co-
polymers of styrene and p-methylstyrene.5,6 Crystallized at 180oC, s-P(S-co-BuS)-7 shows
mainly the α -modification. This supports again the statement that with increasing content of
BuS the α -modification is promoted.
Figure 3 shows an AFM micrograph of an etched sample of s-P(S-co-BuS)-7 isother-
mally crystallized at 205oC. Crystalline entities formed by lamellae radiating from a central
nucleus can be observed. These lamellae have a preferred orientation within the whole
supermolecular structure. Therefore, it can be assumed that the supermolecular structure is
32 Metallocene Technology
Figure 3. AFM micrographs of s-P(S-co-BuS)-7 isothermally
crystallized at 205oC. Crystalline entity formed by broad
lamellae (TMHM).
Figure 4. Light micrograph of s-P(S-co-BuS)-7 isothermally
crystallized at 205oC (2 cm = 50 µm).

not formed by three dimensional spherulites but from crystalline slices. Different orientations
of these slices in the bulk yield the two typical appearances in the light micrograph; similar to
spherulites for flat-on slices and elongated entities for edge-on slices seen in the photograph
of Figure 4.
Figure 5 depicts AFM micrographs (TWM) of s-PS/Kraton blends. The blends were pre-
pared in a Haake-Bòchner kneader at 280oC. Figure 5a shows the AFM micrograph of a 80/20
wt% blend of s-PS and Kraton. s-PS forms the matrix. The block copolymer (Kraton, circular
phase) forms well ordered domains. Figure 5b depicts an AFM micrograph of a 60/40 wt%
blend of s-PS and Kraton. The minor phase (Kraton) forms the matrix. s-PS particles are ir-
regularly distributed in this matrix. Kraton and s-PS are phase separated. The relatively fine
dispersion of the respective phase enclosed in the matrix can be related to the miscibility of
the a-PS block of Kraton with sPS. The miscibility of s-PS with d-a-PS is studied by nuclear
reaction analysis (NRA). Figure 6 depicts the d-a-PS concentrationφ(z) as a function of depth
z, in a two layer sample of s-PS with d-a-PS. The NRA traces were taken after different an-
nealing times at ta =190oC.
Modification of Syndiotactic Polystyrene 33
Figure 5. AFM micrographs (TMPM) of s-PS/Kraton blends. (a) s-PS/Kraton 80/20 wt%, (b) s-PS/Kraton 60/40 wt%.

CONCLUSIONS
Syndiotactic polystyrene is a new engineering plastic. There are several possibilities to over-
come the extreme brittleness of s-PS (i.e., the insertion of comonomeric units in the s-PS
chain, or the modification of s-PS with tough polymers). Syndiotactic copolymers of styrene
with p-n-butylstyrene are used to study the influence of longer substitution on the phenyl ring
on the crystallization behavior. Only copolymers with relatively low comonomer content (4
and 7 mol% BuS) are crystallizable from the melt. The copolymers have higher contents of
the α -modification than neat sPS at comparable supercoolings and also at identical crystalli-
zation temperatures. Crystallized at relatively low supercoolings the copolymers form crys-
talline slices built up by broad lamellae.
34 Metallocene Technology
Figure 6. d-a-PS concentration φ(z) as a function of depth z, in a two layer sample of s-PS with d-a-PS. The NRA traces were
taken after different annealing times at ta=190oC.

Blends of s-PS and Kraton are phase separated. The relatively fine dispersion of the re-
spective phase enclosed in the matrix can be related to the miscibility of the a-PS block of
Kraton with s-PS. The miscibility of a-PS and s-PS is demonstrated by diffusion experiments
employing nuclear reaction analysis.
ACKNOWLEDGMENT
The authors would like to thank Dr Josef Wònsch, BASF, for supplying us with s-PS samples.
REFERENCES
1 Ishihara, N.; Seimiya, T.; Kuramoto, M.; Uoi, M., Macromolecules, 1986, 19, 2465.
2 De Rosa, C.; Rapacciuolo, M.; Guerra, G.; Petraccone, V.; Corradini. P., Polymer, 1992, 23, 1423.
3 De Rosa, C.; Guerra, G.; Petraccone, V.; Corradini, P., Polym. J., 1991, 23, 1435.
4 Guerra, G.; Vitagliano, M.; De Rosa, C.; Petraccone, V.; Corradini, P., Macromolecules, 1990, 23, 1539.
5 De Rosa, C.; Petraccone, V.; Dal Poggetto, F.; Guerra, G.; Pirozzi, B.; Di Lorenzo, M. L.; Corradini, P., Macromolecules,
1995, 28, 5507.
6 Manfredi, C.; Guerra, G.; De Rosa, C.; Busico, V.; Corradini, P., Macromolecules, 1995, 28, 6508.
7 Thomann R, Sernetz FG, Heinemann J, Steinmann S, Mòlhaupt R, Kressler J, Macromolecules in print.
8 Wunderlich B, Macromolecular Physics. Volume 3, Academic Press, New York, London, Toronto, Sydney,
San Francisco, 1. Ed. 1980.
Modification of Syndiotactic Polystyrene 35

Blends of Ethylene/Styrene Interpolymers and Other
Polymers: Benefits in Applications
C.F. Diehl, M. J. Guest, B. I. Chaudhary, Y. W. Cheung, W. R. Van Volkenburgh,
B.W. Walther
The Dow Chemical Company, Polyethylene and INSITE Technology R & D
INTRODUCTION
INSITETM technology has enabled the synthesis of ethylene/styrene interpolymers (ESI) us-
ing single site constrained geometry catalysts.1 The current focus is on ESI containing up to
about 50 mole % (~ 80 wt%) copolymer styrene content. These ESI’s encompass materials
ranging from crystalline to amorphous microstructure, dependent upon the copolymer sty-
rene content.2,3 Materials engineering through blending of ESI’s with other thermoplastic
polymers can be used to expand the material performance envelop, and design materials to
meet specific performance requirements. A brief background outlining pertinent features of
blend technology is given. The characteristics and potential application of selected ESI
blends with atactic polystyrene (PS) and polyolefins are then described.
BACKGROUND TO BLEND TECHNOLOGY
MISCIBILITY AND COMPATIBILITY
Depending on the nature and extent of interactions, polymer blends may be classified as mis-
cible, compatible and incompatible.4 Blends are defined as miscible when the blend compo-
nents are “molecularly mixed” and form a homogeneous phase. One characteristic is that
such a miscible blend exhibits a single glass transition temperature (Tg) intermediate between
the Tgs of the pure polymers. It is well known that most polymer blends are immiscible, and
have multiple Tgs reflecting the different phases.
An earlier communication described the technology of ESI/ESI blends for ESI’s differ-
ing in styrene content.5 The critical comonomer difference in styrene content at which phase
separation occurs between two ESI was found to be about 10 wt% for copolymers with mo-

lecular weight (MW) of the order of 105,
both from predictions using copolymer/co-
polymer blend models and also from
analysis of Tg data for blends and blend
components. From such analyses, it is evi-
dent that blends of ESI with PS will be
immiscible. Figure 1 illustrates the
immiscibility of a blend of high styrene
content ESI with polystyrene. The blend ex-
hibits two distinct Tgs. Additionally, ESI
blends with olefin polymers are expected to
be immiscible when the copolymer styrene
content of the ESI is above 10 wt%.
Immiscible blends may be further de-
scribed as compatible or incompatible.
Severe phase debonding and significant
losses in ultimate mechanical properties are typically found in incompatible blends. Blends
showing good mechanical integrity as reflected by the ultimate mechanical properties and
diffused interfacial phase boundary are referred to as compatible. Blends of ESI with styrenic
polymers, polyolefins and a wide variety of other thermoplastics have been found to exhibit
excellent mechanical properties, and typically are compatible.
MORPHOLOGY CONSIDERATIONS FOR THERMOPLASTIC BLENDS
Solid state morphology is a major contributor to immiscible blend properties. Morphologies
can include matrix/occlusion types and structures with co-continuity of phases. Blends of in-
terest described herein are all produced in melt processing operations. It is generally accepted
(e.g. 6) that factors which determine final solid state morphological structures include the
volume fraction of blend components present, interfacial tension between the components in
the melt and the shear/elongational flow fields applied to the melt both during blending and
also prior to the solidification process for final manufacture of molded parts, films, foams etc.
The underlying approach adopted in our studies has been to pre-design blends dependent
upon the desired characteristics of the engineered material, using appropriate morphol-
ogy/rheology modeling to help the selection of blend components and composition ratios.
38 Metallocene Technology
Figure 1. DMS of ES66/PS (70/30) blend (compression molded).
Note two distinct Tgs.

EXPERIMENTAL
ESI MATERIALS USED
Composition of ESI is expressed as weight % copolymer styrene. For example, ES70 denotes
a copolymer with 70 wt% styrene incorporation. Ethylene-rich and styrene-rich ESI are also
referred to as E-series and S-series ESI, respectively. Some of the polymers contain small
amounts (< 5 wt%) of PS. The weight average molecular weight (MW) for the polymers gen-
erally ranges from about 200,000 to 250,000 g/mol. The MW distributions of all ESI used in
this study were narrow (Mw/Mn < 3.5).
BLEND PREPARATION
The melt blends were prepared with a Haake mixer equipped with a Rheomix 3000 bowl.
Component polymers were first dry blended and then fed into the mixer equilibrated at
180oC. The molten material was mixed at 180oC and 80 rpm for about 5 min. Test parts pro-
duced via compression molding were formed at 190oC.
BLOWN FILM FABRICATION
Films were produced from a dry blend of ES70/PS on a blown film line equipped with a 2.5
inch diameter extruder, a 24:1 single flight, high intensity mixing screw, and a 6 inch diameter
high pressure die with 40 mil die gap. Fabrication conditions included a melt temperature of
approximately 215oC, a rate of 120 lb/hr, and a blow-up-ratio of approx. 2.5:1. Film thickness
was targeted at 2.8 mils.
BLEND SYSTEM EXAMPLES
THERMOPLASTIC BLENDS/MOLDINGS
The broad compatibility of ESI
with other common polymers is
shown in Tables 1 and 2, which il-
lustrate some of the wide variety of
compatible blends that have been
produced using ESI. Note that in
some cases, E-series ESI demon-
strates the best compatibility, while
for other polymers S-series is more
desirable. For some blend poly-
mers both E-series and S-series
ESI can produce a compatible
Blends of Ethylene/Styrene Interpolymers 39
Table 1. ESI as major component in blends
Major component Minor componentProperty
enhancement
E- or S-series ESI PP, PS, PEmodulus control
service temp. range
S-series ESI PPOmodulus control
service temp. range
E- or S-series ESI SEBS, SBS, SISservice temp. range
elasticity
E- or S-series ESI EVA, TPUpolarity
HF weldability
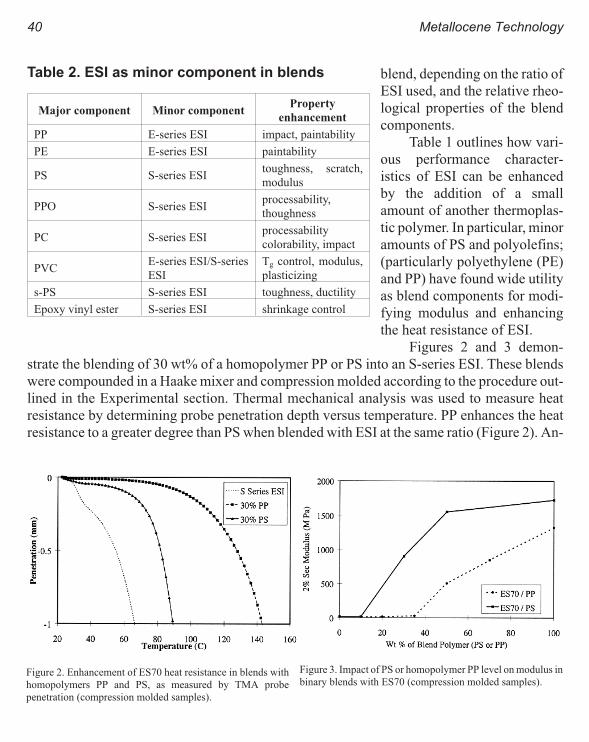
blend, depending on the ratio of
ESI used, and the relative rheo-
logical properties of the blend
components.
Table 1 outlines how vari-
ous performance character-
istics of ESI can be enhanced
by the addition of a small
amount of another thermoplas-
tic polymer. In particular, minor
amounts of PS and polyolefins;
(particularly polyethylene (PE)
and PP) have found wide utility
as blend components for modi-
fying modulus and enhancing
the heat resistance of ESI.
Figures 2 and 3 demon-
strate the blending of 30 wt% of a homopolymer PP or PS into an S-series ESI. These blends
were compounded in a Haake mixer and compression molded according to the procedure out-
lined in the Experimental section. Thermal mechanical analysis was used to measure heat
resistance by determining probe penetration depth versus temperature. PP enhances the heat
resistance to a greater degree than PS when blended with ESI at the same ratio (Figure 2). An-
40 Metallocene Technology
Table 2. ESI as minor component in blends
Major component Minor componentProperty
enhancement
PP E-series ESI impact, paintability
PE E-series ESI paintability
PS S-series ESItoughness, scratch,
modulus
PPO S-series ESIprocessability,
thoughness
PC S-series ESIprocessability
colorability, impact
PVCE-series ESI/S-series
ESI
Tg control, modulus,
plasticizing
s-PS S-series ESI toughness, ductility
Epoxy vinyl ester S-series ESI shrinkage control
Figure 2. Enhancement of ES70 heat resistance in blends with
homopolymers PP and PS, as measured by TMA probe
penetration (compression molded samples).
Figure 3. Impact of PS or homopolymer PP level on modulus in
binary blends with ES70 (compression molded samples).

other important difference between the use of the selected PS and PP blend components is
that PS addition increases modulus, while ESI/PP blends remain relatively flexible. As shown
in Figures 2 and 3, the heat resistance of the ES70 can be significantly enhanced by the addi-
tion of 30 wt% homopolymer PP, without any significant increase in the modulus, while the
addition of 30 wt% PS dramatically increases the modulus of the blend.
PP and PS also differ in their degree of compatibility with the E-series and S-series ESI
products. In general, PP is more compatible with the E-series than PS and can be blended at
higher levels with the E-series. In contrast, PS exhibits superior compatibility with the
S-series than PP, and can therefore be used to produce compatible blends at higher levels of
incorporation in S-series ESI.
The specific morphology obtained is highly dependent on the selection of molding con-
ditions in combination with choice of blend components and component ratios. For example,
oriented and elongated phase domains have been observed on the surface of injection molded
parts prepared from ESI/PS and ESI/polyethylene (PE) blends, and these are considered to af-
fect properties such as modulus and toughness The same injection molded parts typically
show a more spherical domain morphology at the core of the part. The concentration of
phases remains consistent throughout the part on a macro scale.
FILMS FROM ESI/POLYSTYRENE BINARY BLENDS
ESI has demonstrated potential for film and sheet applications,7 as a result of such attributes
as processability, mechanical properties, heat sealability, stress relaxation, drape,
conformability, printability, deadfold properties, elasticity, and thermoformability.
Monolayer and multilayer films have been successfully produced from ESI using a vari-
ety of conventional film fabrication equipment including blown, cast, and calendered
techniques. Potential applications include labels, window films, decorative overlays, and
tapes. Depending on the specific film application requirements, it has often been found ad-
vantageous to employ a binary blend of ESI and PS.
The properties of such blends have been found to be strongly dependent on the fabrica-
tion process conditions and the resulting blend morphology. For example, a unique
morphology has been observed in blown films containing as little as 10 wt% PS, in which
very fine (<0.1 µm) elongated PS domains oriented in the machine direction result in films
with significantly improved heat resistance, enhanced tensile strength and ambient modulus,
while providing a film with good contact clarity, excellent stress relaxation characteristics,
and reduced blocking tendencies. Figure 4 compares the dynamic mechanical properties of an
ES70/PS blown film to a compression molded sample of the same binary blend.
Figure 5 shows a transmission electron micrograph of a blown film of a ES70/PS. The
highly elongated fibrillar PS domains are extremely small (sub-micron in size) and primarily
result from the high shear orientation encountered in the blown film process. This unique
Blends of Ethylene/Styrene Interpolymers 41

morphology provides high optical transpar-
ency. Additionally, the fibrillar morphology
provides reinforcement for the blend and
significantly increases the modulus of the
blend, enhancing its heat resistance, as re-
flected in the data of Figure 4. In contrast,
Figure 6 shows the corresponding compres-
sion molded morphology in which the aPS
domains appear nearly spherical. Because
the domain size is of the order of microns
and there is a sufficient refractive index mis-
match between ESI and PS, light scattering
gives rise to turbidity in the final molded
part.
Table 3 compares the blown film prop-
erties of a ES70/PS binary blend to those of
the neat ES70 and STYRONTM 612. The ad-
dition of 30 wt% PS to the ES70 increases
the modulus of the film while not significantly affecting the unique tensile stress relaxation or
elongation of the ES70. The heat resistance is also positively affected as indicated by the in-
crease in heat seal temperature from 70 to 120oC, while the % haze still remains relatively
low.
42 Metallocene Technology
Figure 4. Effect of fabrication induced morphology-properties
of an ES70/PS (85/15) blend.
Figure 5. TEM of a ES70/PS (85/15) blend (blown film).
Figure 6. TEM of ES70/PS (85/15) blend (compression molded).

FOAMS FROM BINARY BLENDS OF ESI AND POLYOLEFIN OR STYRENICTHERMOPLASTICS
Unique foams have successfully been made by expanding blends of ESI and various thermo-
plastics, such as PE, PP, PS, and ethylene/vinyl acetate (EVA), using existing polyolefin or
polystyrene foam extrusion assets.8
Data are presented on extruded foams made from blends of ESI and low density PE
(LDPE , 0.923 g/cm3 density and melt index of 1.8 dg/min (190oC; 2.16 kg). An ES70 poly-
mer with a melt index of 1.5 dg/min was used. Isobutane was used as the blowing agent.
Closed-cell foams with a smooth skin were obtained. Compared with the control LDPE
foam, the foams made from LDPE/ESI blends were softer, tougher, and exhibited better
drape/conformability. Figure 7 shows that the LDPE/ES70 blend foams also exhibited signif-
icantly lower densities than the LDPE control foam, and that the cell sizes of the LDPE/ESI
blend foams were significantly smaller than the cell sizes of the reference LDPE foam. Small
cells result in a finer cell structure which is aesthetically more desirable.
As shown in Figure 8, the dimensional stability of the LDPE foam was significantly im-
proved by blending the ES70 with the LDPE at a 50/50 ratio. The styrene functionality of the
ESI apparently reduces the permeability of the polymer matrix to the isobutane which re-
duces foam shrinkage.9 The styrene functionality of the ESI also enhances the printability or
paintability of the LDPE/ESI blend foams.
Blends of Ethylene/Styrene Interpolymers 43
Table 3. ESI/PS binary blend blown film properties
ESI type ES70 ES70 ES70 None
ESI, % 100 85 70 0
PS (StyronTM 612), % 0 15 30 100
MD* tensile relaxation, % at 100% 57.4 63.1 63.3 breaks
MD permanent set, % at 100% 10.1 42.1 44.7 breaks
MD 2% secant modulus, MPa 21.4 436.9 782.2 1862
MD yield stress, MPa 4.9 13.1 28.0 40.6
MD ultimate tensile, MPa 40 36 36 41
MD elongation, % 208 210 172 2
Heat seal temperature, oC 70 110 120 N/A
Gardner gloss 45 deg 98 69 71 109
Haze, % 4 8 13 2
* MD= machine direction

Modification of PS-based foams with ESI has been shown to result in a softer foam with
improved impact toughness and flexibility.8 Control of open/closed cells is also enhanced in
PS/ESI blend foams. ESI’s have also been shown to be effective compatibilizers for
polyolefins and PS10,11 and foams have been made from tertiary blends of PE, PS and ESI.
CONCLUSIONS
The performance requirements of potential applications currently under development for ESI
can be met by thermoplastic blends with one or more thermoplastic polymers. ESI’s exhibit
compatibility with a wide range of polymers due to their inherent combination of olefinic and
styrenic functionality. Blends of ESI with PS, PE, and PP, in particular, have been found to of-
fer interesting and unique combinations of performance properties. The selection of blend
components, blend composition ratio and final part fabrication conditions are key factors in
determining structure/property relationships. Appropriate morphology/ rheology modeling is
useful in blend design.
REFERENCES
1 US Patent 5,703,187, The Dow Chemical Company.
2 Cheung, Y. W., Guest, M. J., Proc. 55th SPE ANTEC, 1634, (1996).
3 Chen, H., et al., J.Appl.Polym.Sci., 70(l), 109 (1998).
4 Krause, S. J., Pure Appl. Chem. 58(12), 1553 (1986).
5 Cheung, Y. W., Guest, M. J., Proc. 56h SPE ANTEC, 1798 (1998).
6 Utracki, L.A. “Rheology and Processing of Multiphase Systems” in “Current Topics in Polymer Science; Vol. 11",
p 30 et seq., Hauser (1987).
7 Murphy, M. W., “Ethylene/Styrene Interpolymer Materials for Film and Sheet Applications”, Proc. SP ‘97, 13’h Ann.
World Congress, Zurich, Dec. 1-3, 1997.
44 Metallocene Technology
Figure 7. Density and cell size of foams made from
LDPE/ES70 blends (7.5 phr isobutane blowing agent).Figure 8. dimensional stability of LDPE/ES70 blend foams,
illustrating the reduction in shrinkage due to addition of ESI.

8 Karande, S. V., Chaudhary, B. I., FOAMPLAS’98, p. 1-8 in Proc. of 2d Worldwide Conference on Foamed Thermoplastics
Markets & Technology, May 19-20, 1998.
9 Briscoe, B. J., Chaudhary B. 1. and Savvas, T., Cellular Polymers, 12, 171 (1993).
10 US Patent 5,460,818, The Dow Chemical Company.
11 Park, C. P. And Clingerman, G. P., Plastics Engineering, 97-99 (March 1997).
Blends of Ethylene/Styrene Interpolymers 45
Easy Processing Metallocene Polyethylene
Ching-Tai Lue
Univation Technologies (Exxon Chemical/Union Carbide Joint Venture), P.O. Box 5200
Baytown, TX 77520
INTRODUCTION
The development of metallocene catalysts has been considered as one of the major revolu-
tionary steps in the history of plastic industry.1 Like the introduction of gas-phase linear poly-
ethylene by Union Carbide in the 1970’s, the commercialization of metallocene technology in
the 1990’s is making a dramatic impact on the polyethylene industry. It is changing the “rules
of the game” for polyolefin manufacturing, the polymers produced and their applications.
The first commercial mPE was introduced to the market as “differentiated” or “spe-
cialty” products for applications like food packaging and impact modifiers. They are now
available with resin densities ranging from 0.86 to 0.91 g/cm3 and are characterized by nar-
row molecular weight distribution (MWD) and narrow compositional distribution (CD).
These products are valued by the market for their very low extractable, outstanding heat seal
performance, high gas permeability, excellent clarity and superior toughness. Typical exam-
ples are the ExactTM plastomers by Exxon commercialized in 1991 and the AffinityTM and
EngageTM products by Dow in 1993.
In 1995 the first “commodity” mPE products were commercialized by Exxon as Ex-
ceedTM polyethylene. Unlike its predecessor ExactTM plastomers which are made initially by
a high pressure process and recently by solution and slurry processes as well, the ExceedTM
products are made by the more cost effective UNIPOL® gas-phase process. With densities
ranging from 0.915 to 0.930 g/cm3, they were introduced to the market to compete with
ZN-LLDPE’s for applications such as can liners and stretch film. These products maintain the
narrow MWD/CD features and provide advantages in toughness and optical properties.
Between 1995 and 1997, numerous resin suppliers publicly disclosed their development
efforts and intentions to commercialize mPE.2,3 These companies, in alphabetical order, in-
clude BASF, Borealis, BP, Dow, DSM, Fina, Mitsui, Mobil, Phillips, Quantum (now Equistar

Chemicals) and Union Carbide. Com-
mercializations in this period include
EliteTM (from Dow), EvolueTM (from
Mitsui), BoreceneTM (from Borealis) and
LuflexenTM (from BASF) polyethylenes.
All claimed to have enhanced perfor-
mance over conventional PE products.
Currently, a wide array of mPE
products is being developed in the indus-
try to possibly replace the whole
spectrum of non-functionalized conven-
tional PE products.4,5,6 These products
are grouped in three families as shown in
Figure 1.
Unlike the early generation of mPE,
where narrow MWD and narrow CD are the keys for its outstanding performance, the
up-coining new mPE products are focusing on the “control/manipulation” of MWD, CD,
long chain branch (LCB) and long chain branch distribution (LCBD). Manipulating these
molecular structures to meet a specific set of performance requirements has become a popular
theme for future mPE development.
In this paper, a new family of easy processing metallocene polyethylene (EZP-mPE)
will be presented. The resins exhibit a unique combination of easy processing, outstanding
toughness and good optical properties that has not been seen with existing PE products. This
new family of mPE has a great potential for applications where blends of ZN-LLDPE and
HP-LDPE are currently used.
EXPERIMENTAL
The EZP-mPE in this study was an experimental ethylene/hexene (E/H) copolymer with tar-
get MI and density of 1.0 dg/min and 0.918 g/cm3, respectively. For comparison, a series of
blends was prepared from a selected pair of commercial ZN-LLDPE and BP-LDPE at various
ratios. These blends were prepared with a WP-57 twin screw extruder. The ZN-LLDPE was
also an E/H copolymer. The BP-LDPE was a homopolymer. Table 1 lists the materials and
test results.
Blown film samples were made on a 2 1/2" (64 mm) Egan line with a typical LLDPE
Sterlex barrier screw, a 6" (150 mm) diameter die and a Uniflo dual lip air ring. The die gap
was set at 30 mil (0.8 mm); target film gauge was 2 mil (50 µm); blow up ratio was 2.5 and
output was about 115 lb/hr (52 kg/hr).
48 Metallocene Technology
Figure 1. New generation of metallocene PE.

Film properties were measured according to ASTM methods after at least 40 hours of
conditioning. The dart impact strength reported in Table 1 was measured from a 26" (66 cm)
height (Method-A).
DISCUSSION
As suggested by FRR (flow rate ratio at condition-F vs. condition-E according to ASTM
D1238), the EZP-mPE was inherently more shear thinning than the conventional ZN-LLDPE
(46 vs. 29, respectively, in Table 1). One would therefore expect this new EZP-mPE to pro-
cess more easily than a conventional ZN-LLDPE. Using extrusion pressure (Figure 2) and
motor load (Figure 3) as measurements for processability, the EZP-mPE is about 20-30%
better than the ZN-LLDPE at a similar MI. This is very different from the currently available
commercial mPE’s whose processability is often inferior to or, at best, comparable to that of a
ZN-LLDPE product. This new family of EZP-mPE is truly an easy processing product.
Compared with LL/LD blends, it is as easy to process as a LD-rich (25% LL/75% LD) blend
(see Figures 2 & 3).
For tensile strength, EZP-mPE is comparable to the ZNLLDPE and significantly better
than all of the blends (Figure 4). The most impressive single feature of this product is its ex-
ceptionally high impact strength: 60% higher than the ZN-LLDPE and about four times that
of ZN-LL/BP-LD blends (see Figure 5). As for the Elmendorf tear, EZP-mPE is significantly
Easy Processing Metallocene Polyethylene 49
Table 1. Summary
Product100%
ZN-LL
75% ZN-LL
25% HP-LD
50% ZN-LL
50% HP-LD
25% ZN-LL
75% HP-LD
100%
HP-LDEZP-mPE
Density, g/cm3 0.919 0.920 0.921 0.921 0.921 0.919
MI, dg/min 1.0 0.8 0.7 0.6 0.6 1.1
FRR (I-21/I-2) 29 33 41 53 76 46
64 mm Egan blown film line (0.8 mm die gap, 2.5 BUR, 50 micron)
Output, kg/h 51 52 49 51 52 52
Head press., MPa 21.3 20.2 18.2 16.3 13.3 15.6
Motor load, amp 39.6 38.7 33.8 30.3 24.6 30.9
MD tensile, MPa 46.7 38.1 29.8 28.4 28.0 44.1
TD tensile, MPa 47.1 37.7 33.2 27.5 25.1 45.0
MD tear, g/micron 17.8 4.2 2.8 3.4 5.4 8.2
TD tear, g/micron 26.4 26.0 20.5 8.4 3.3 16.9
Dart impact, g/micron 10.2 4.6 4.1 3.7 3.8 16.1
Haze, % 14.7 8.8 8.6 8.1 6.7 10.2

better than all of the blends in both MD tear and MD/TD balance (Fig-6). The balance in
MD/TD tear is important for a film to avoid “splitiness”, i.e., a great tendency to fail in one
particular direction.
In the history of PE product evolution, there has always been a trade-off between film
properties and processability. From the above discussion, this paradigm has been broken by
this new family of EZP-mPE. It presents a tremendous potential to replace a wide range of
conventional PE products and their blends.
Figure 7 and Figure 8 are radar charts that illustrate this possibility. The charts were con-
structed to show the differences between products. The properties have been grouped as
50 Metallocene Technology
Figure 2. Comparison of extrusion pressure. Figure 3. Comparison of motor load.
Figure 4. Comparison of tensile strength. Figure 5. Comparison of dart impact.
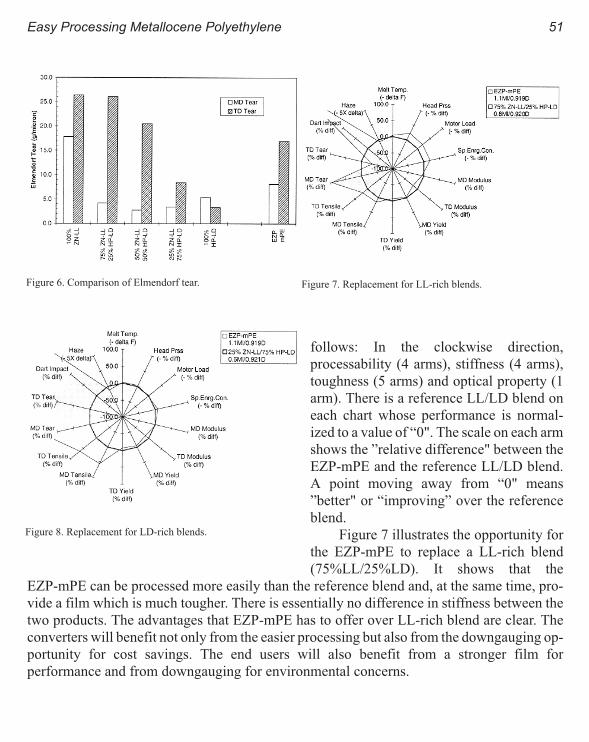
follows: In the clockwise direction,
processability (4 arms), stiffness (4 arms),
toughness (5 arms) and optical property (1
arm). There is a reference LL/LD blend on
each chart whose performance is normal-
ized to a value of “0". The scale on each arm
shows the ”relative difference" between the
EZP-mPE and the reference LL/LD blend.
A point moving away from “0" means
”better" or “improving” over the reference
blend.
Figure 7 illustrates the opportunity for
the EZP-mPE to replace a LL-rich blend
(75%LL/25%LD). It shows that the
EZP-mPE can be processed more easily than the reference blend and, at the same time, pro-
vide a film which is much tougher. There is essentially no difference in stiffness between the
two products. The advantages that EZP-mPE has to offer over LL-rich blend are clear. The
converters will benefit not only from the easier processing but also from the downgauging op-
portunity for cost savings. The end users will also benefit from a stronger film for
performance and from downgauging for environmental concerns.
Easy Processing Metallocene Polyethylene 51
Figure 6. Comparison of Elmendorf tear. Figure 7. Replacement for LL-rich blends.
Figure 8. Replacement for LD-rich blends.

When comparing to the LD-rich (25%LL/75%LD) blend, the advantages of EZP-mPE
in toughness are even more dramatic (Figure 8). On an extrusion line such as the one used in
this study, there would be no observable loss in processability.
CONCLUSIONS
The new family of EZP-mPE has shown a unique combination of product attributes not seen
before. It changes the “rules of the game” for the balance/combination among processability,
stiffness and toughness of PE products. It offers an excellent opportunity in applications
where blends of ZN-LLDPE and BP-LDPE are currently used. It is as strong as a conven-
tional ZN-LLDPE for most of the toughness measures and as easy to process as most of the
LL/LD blends. There is a great potential for downgauging which will benefit not only the
converters, but also the consumers with environmental concerns and overall cost reduction
needs.
ACKNOWLEDGMENTS
The author recognizes contributions from N. A. Merrill and G. A. Vaughan for catalyst devel-
opment, M. E. Muhle for making the experimental mPE product and S. Ohlsson for valuable
inputs.
REFERENCES
1 V. Wigotsky, “Metallocene: The Next Step”, Plastics Engineering, P. 16 (July 1995).
2 MetCon’95; Worldwide Metallocene Conference 1995.
3 Plastics Formulation and Compounding; (Dec. 1995).
4 W. A. Fraser, J. L. Adams & D. M. Simpson, “Polyethylene Product Capabilities from Metallocene Catalysts with
the UNIPOL® Process”, 4h International Conference on Metallocenes Polymers: Metallocenes Asia ‘97, May 1997.
5 D. M. Simpson, P. D. Whaley & H. T. Liu, “Product Performance of mLLDPE Resins with Improved Processability”,
SPO Conference in Houston (1997).
6 G. N. Foster, J. L. Adams, D. C. Lee, R. H. Vogel & S. H. Wasserman", “Advanced Polyethylene Product Design
for Technology Licensing”, Advances in Polyolefins, Sept. 1997, Napa, California, Sponsored by ACS.
52 Metallocene Technology

Effect of Metallocene Polyethylene on Heat Sealing
Properties of Low Density Polyethylene Blends
Juan D. Sierra
Instituto de CapacitaciÙn e InvestigaciÙn del Pl«stico y del Caucho, ICIPC Medellin,
Colombia, P.O. Box 2629
MarÍa del Pilar Noriega and Tim A. Osswald
Polymer Processing Research Group, University of Wisconsin - Madison, USA.
INTRODUCTION
The heat sealing is the typical technique used in modern machinery for packaging of liquid
and solid products. Due to the good cost/performance balance of low density polyethylene
(LDPE) this polymer is widely used as a sealing layer in several laminations for packaging of
diverse products. The increasing demand for higher speed in VFFS and HFFS packaging
equipment and better integrity, has imposed surplus requirements for polymers, including
better hot tack values, low initiation temperature of sealing and wider temperatures ranges of
sealing. The mentioned features are quite difficult to meet with traditional polymers so it is
mandatory to consider alternative materials with
better sealing properties and higher prices.
Blending of traditional LDPE with poly-
mers with better sealing properties, such us m-PE
and EVA,1,2 is a good alternative to meet the
higher speed demands in modern packaging ma-
chinery. Even blends with low quantities of m-PE
are enough to modify significantly the heat seal-
ing properties of LDPE. The purpose of this
research is to evaluate the percentage of m-PE (based in octene comonomer) for optimal bal-
ance of sealing properties and cost in laminations of BOPP/aluminum foil/PE sealing layer
for packaging of diverse products (see Figure 1).
Figure 1. Details of laminate structure.

The interdiffusion theory suggests that during the sealing process of semicrystalline
polymers the following phenomena occur sequentially:3,4
• Melting of the polymers: low melting temperature and low heat of fusion en-
hances sealability.
• Wetting of the interfaces: reduction of the distance to maximize intermolecular
attraction forces. A proper compatibility at the interface is very important for good
seal integrity.
• Diffusion of chains segments across the interface: for best seal strength a great
degree interdiffusion of chain segments is required.
• Recrystallization of some of the chain segments.
According to the mentioned interdiffusion theory, for a good seal the following proper-
ties are required:
• Enough heat transfer that guarantees proper melting and mobility of chain seg-
ments at the interface.
• Intimate contact of both surfaces.
• Enough time and compatibility for a high degree of interdiffusion of chain seg-
ments across the interface.
• Not too high crystallization degree which makes a fragile seal.
EXPERIMENTAL
The tested materials were a high-pressure low density polyethylene (LDPE) of MFI of 2,0 for
film extrusion and a metallocene polyethylene (m-PE) with 12% octene comonomer and MFI
1,0 as a sealing modifier (see Table 1).
The present study is based on measurements of heat seal strength and hot tack values.
Complementary studies of glass transition and melting point were done using a Differential
Scanning Calorimeter, DSC. The following instruments were used:
54 Metallocene Technology
Table 1. Information on evaluated polymers
High-pressure, low-density
polyethylene, LDPEMetallocene polyethylene, m-PE
Producer Ecopetrol, Colombia Dow Plastics
Polymerization process High-pressure Metallocene catalyst
Comonomer type octene
Comonomer content 12%
MFI, g/10 min at 190oC and 2.16 kg 2.0 1.0
Additivesslip: Erucamide 700 ppm,
antiblock: 1260 ppm
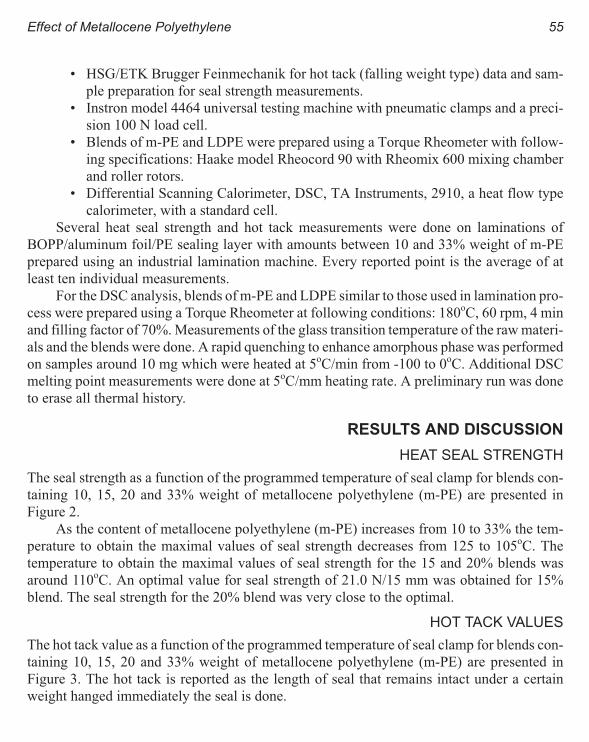
• HSG/ETK Brugger Feinmechanik for hot tack (falling weight type) data and sam-
ple preparation for seal strength measurements.
• Instron model 4464 universal testing machine with pneumatic clamps and a preci-
sion 100 N load cell.
• Blends of m-PE and LDPE were prepared using a Torque Rheometer with follow-
ing specifications: Haake model Rheocord 90 with Rheomix 600 mixing chamber
and roller rotors.
• Differential Scanning Calorimeter, DSC, TA Instruments, 2910, a heat flow type
calorimeter, with a standard cell.
Several heat seal strength and hot tack measurements were done on laminations of
BOPP/aluminum foil/PE sealing layer with amounts between 10 and 33% weight of m-PE
prepared using an industrial lamination machine. Every reported point is the average of at
least ten individual measurements.
For the DSC analysis, blends of m-PE and LDPE similar to those used in lamination pro-
cess were prepared using a Torque Rheometer at following conditions: 180oC, 60 rpm, 4 min
and filling factor of 70%. Measurements of the glass transition temperature of the raw materi-
als and the blends were done. A rapid quenching to enhance amorphous phase was performed
on samples around 10 mg which were heated at 5oC/min from -100 to 0oC. Additional DSC
melting point measurements were done at 5oC/mm heating rate. A preliminary run was done
to erase all thermal history.
RESULTS AND DISCUSSION
HEAT SEAL STRENGTH
The seal strength as a function of the programmed temperature of seal clamp for blends con-
taining 10, 15, 20 and 33% weight of metallocene polyethylene (m-PE) are presented in
Figure 2.
As the content of metallocene polyethylene (m-PE) increases from 10 to 33% the tem-
perature to obtain the maximal values of seal strength decreases from 125 to 105oC. The
temperature to obtain the maximal values of seal strength for the 15 and 20% blends was
around 110oC. An optimal value for seal strength of 21.0 N/15 mm was obtained for 15%
blend. The seal strength for the 20% blend was very close to the optimal.
HOT TACK VALUES
The hot tack value as a function of the programmed temperature of seal clamp for blends con-
taining 10, 15, 20 and 33% weight of metallocene polyethylene (m-PE) are presented in
Figure 3. The hot tack is reported as the length of seal that remains intact under a certain
weight hanged immediately the seal is done.
Effect of Metallocene Polyethylene 55
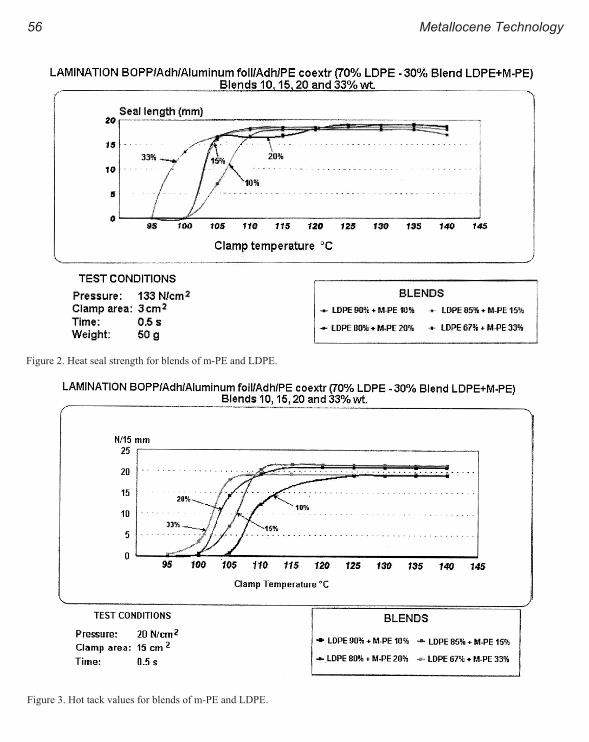
56 Metallocene Technology
Figure 2. Heat seal strength for blends of m-PE and LDPE.
Figure 3. Hot tack values for blends of m-PE and LDPE.

The content of
metallocene polyethylene
(m-PE) has a dramatic ef-
fect on the temperature to
obtain acceptable hot tack
values. The blend of 33%
metallocene polyethylene
(m-PE) exhibited high hot
tack at lower temperatures
but the maximal value was
observed at higher temper-
atures. Blends of 15 and
20% exhibited a similar
behavior, characterized by
a rapid increase of hot tack
around 100oC and full de-
velopment of the hot tack
around 115oC.
DIFFERENTIALSCANNING
CALORIMETERY
A unique value of glass
transition of blends be-
tween the values observed
for m-PE and LDPE al-
lows us to conclude that
both resins have total
compatibility for the com-
positions studied (see Fig-
ure 4). The total
compatibility of both res-
ins guarantees not only the
possibility of high degree
of interdiffusion of chain
segments across the inter-
face (excellent seal prop-
Effect of Metallocene Polyethylene 57
Figure 4. Glass transition of m-PE/LDPE and blends.
Figure 5. Melting point of m-PE/LDPE and blends.
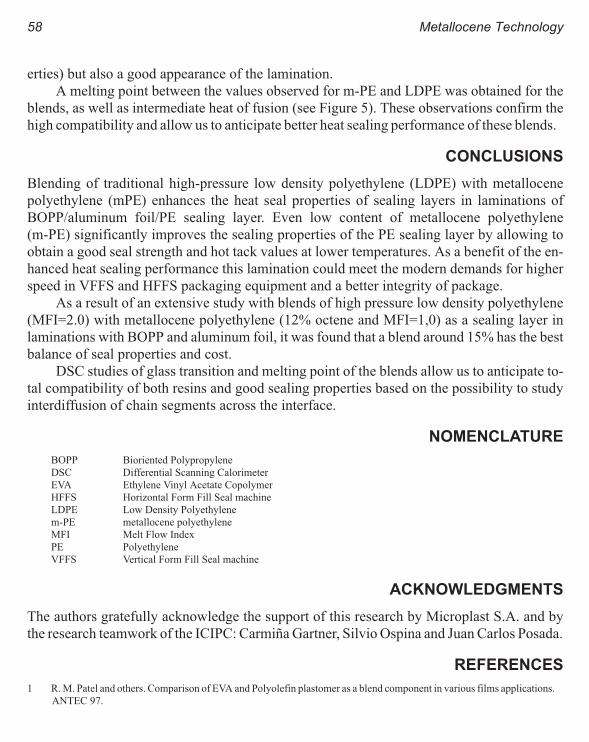
erties) but also a good appearance of the lamination.
A melting point between the values observed for m-PE and LDPE was obtained for the
blends, as well as intermediate heat of fusion (see Figure 5). These observations confirm the
high compatibility and allow us to anticipate better heat sealing performance of these blends.
CONCLUSIONS
Blending of traditional high-pressure low density polyethylene (LDPE) with metallocene
polyethylene (mPE) enhances the heat seal properties of sealing layers in laminations of
BOPP/aluminum foil/PE sealing layer. Even low content of metallocene polyethylene
(m-PE) significantly improves the sealing properties of the PE sealing layer by allowing to
obtain a good seal strength and hot tack values at lower temperatures. As a benefit of the en-
hanced heat sealing performance this lamination could meet the modern demands for higher
speed in VFFS and HFFS packaging equipment and a better integrity of package.
As a result of an extensive study with blends of high pressure low density polyethylene
(MFI=2.0) with metallocene polyethylene (12% octene and MFI=1,0) as a sealing layer in
laminations with BOPP and aluminum foil, it was found that a blend around 15% has the best
balance of seal properties and cost.
DSC studies of glass transition and melting point of the blends allow us to anticipate to-
tal compatibility of both resins and good sealing properties based on the possibility to study
interdiffusion of chain segments across the interface.
NOMENCLATURE
BOPP Bioriented Polypropylene
DSC Differential Scanning Calorimeter
EVA Ethylene Vinyl Acetate Copolymer
HFFS Horizontal Form Fill Seal machine
LDPE Low Density Polyethylene
m-PE metallocene polyethylene
MFI Melt Flow Index
PE Polyethylene
VFFS Vertical Form Fill Seal machine
ACKNOWLEDGMENTS
The authors gratefully acknowledge the support of this research by Microplast S.A. and by
the research teamwork of the ICIPC: CarmiÔa Gartner, Silvio Ospina and Juan Carlos Posada.
REFERENCES
1 R. M. Patel and others. Comparison of EVA and Polyolefin plastomer as a blend component in various films applications.
ANTEC 97.
58 Metallocene Technology

2 H. Shih and others. Effect of Polyethylene blend on heat sealing properties. ANTEC 98.
3 Mueller C., Hiltner A., Baer E. Interdiffusion and crystallization of LLDPE: relationships to heat sealability. ANTEC 96.
4 Nicastrol C. and others. Change in crystallinity during heat sealing of cast polypropylene film. J. Plastic Film & Sheeting,
9, No. 2, April 1993. P. 159-167.
Effect of Metallocene Polyethylene 59
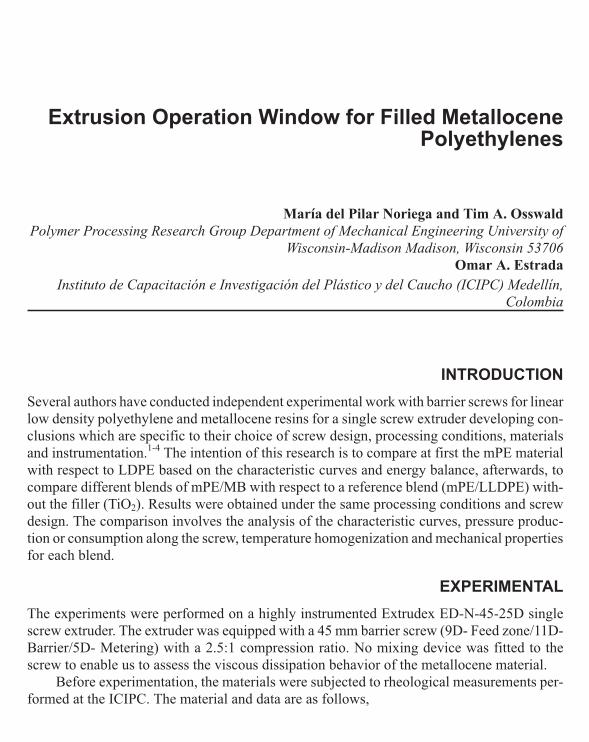
Extrusion Operation Window for Filled Metallocene
Polyethylenes
MarÍa del Pilar Noriega and Tim A. Osswald
Polymer Processing Research Group Department of Mechanical Engineering University of
Wisconsin-Madison Madison, Wisconsin 53706
Omar A. Estrada
Instituto de CapacitaciÙn e InvestigaciÙn del Pl«stico y del Caucho (ICIPC) MedellÍn,
Colombia
INTRODUCTION
Several authors have conducted independent experimental work with barrier screws for linear
low density polyethylene and metallocene resins for a single screw extruder developing con-
clusions which are specific to their choice of screw design, processing conditions, materials
and instrumentation.1-4 The intention of this research is to compare at first the mPE material
with respect to LDPE based on the characteristic curves and energy balance, afterwards, to
compare different blends of mPE/MB with respect to a reference blend (mPE/LLDPE) with-
out the filler (TiO2). Results were obtained under the same processing conditions and screw
design. The comparison involves the analysis of the characteristic curves, pressure produc-
tion or consumption along the screw, temperature homogenization and mechanical properties
for each blend.
EXPERIMENTAL
The experiments were performed on a highly instrumented Extrudex ED-N-45-25D single
screw extruder. The extruder was equipped with a 45 mm barrier screw (9D- Feed zone/11D-
Barrier/5D- Metering) with a 2.5:1 compression ratio. No mixing device was fitted to the
screw to enable us to assess the viscous dissipation behavior of the metallocene material.
Before experimentation, the materials were subjected to rheological measurements per-
formed at the ICIPC. The material and data are as follows,

1. Metallocene polyethylene (mPE - Affinity 1881) with Carreau indices of
A = 3115 Pa.s, B = 0.0835 s and C = 0.47 at 237.5oC.
2. Linear low density polyethylene (LLDPE - Ipako 6200-1) with Carreau indices
of A = 2580 Pa.s, B = 0.0407 s and C = 0.52 at 237.5oC.
3. Masterbatch (MB) of titanium dioxide at 50 % in weight with linear low density
polyethylene as the carrier.
The trials were conducted under the same heating band temperature profile (270, 260,
250, 240, 230oC) with four different die openings and three screw speeds for a total of twelve
operating points per trial. The performance of each blend was evaluated by means of the char-
acteristic curve and pressure production or consumption. The pressure was measured with
five pressure transducers located at 12D, 16D, 20D, 22D and 25D along the extruder barrel.
The extrudate was a mix of a titanium dioxide master batch (MB) with the respective
polymer. The melt temperature profile measures the thermal homogeneity. The profile was
measured with the use of a five sensor thermal comb located 2D after the end of the screw.
The mechanical properties of the blends were evaluated based on injection molded spec-
imens.
RESULTS
SCREW CHARACTERISTIC CURVES
Depending on the type of blend utilized, the operating window of the extruder will differ. The
extruder performance is not only controlled by the polymer material, but is dependent on the
screw design from the hopper to the die. The screw characteristic curves shown in Figures 1, 2
and 3 reveal the extruder’s operation range.
Figure 1 shows the wider operation window of the metallocene resin compared to the
conventional low density polyethylene. The mPE processing involves higher output, higher
back pressure and torque than for the conventional LDPE.
For the operating range tested, the blend mPE + 5 % MB gives, in general, the lowest
output characteristics. Note how the masterbatch content of 5 % increases slightly the output
compared to the reference blend (mPE + LLDPE) and compared to mPE 100 %. Figure 2
shows the operation window of the blend and its reference.
The blend mPE + 15 % MB gives, in general, the highest output characteristics. The
masterbatch content of 15 % increases remarkable the output and the backpressure compared
to the reference blend (mPE + LLDPE). The curve is completely shifted up to the high output
region. Figure 3 shows the operation window of the blend and its reference.
When comparing the operating points with mPE + MB (Figs. 2 and 3) and mPE +
LLDPE it is seen that the mass throughput for mPE + MB is always greater than the reference
blend. This fact is related to the different bulk density and rheology of the two materials. The
62 Metallocene Technology
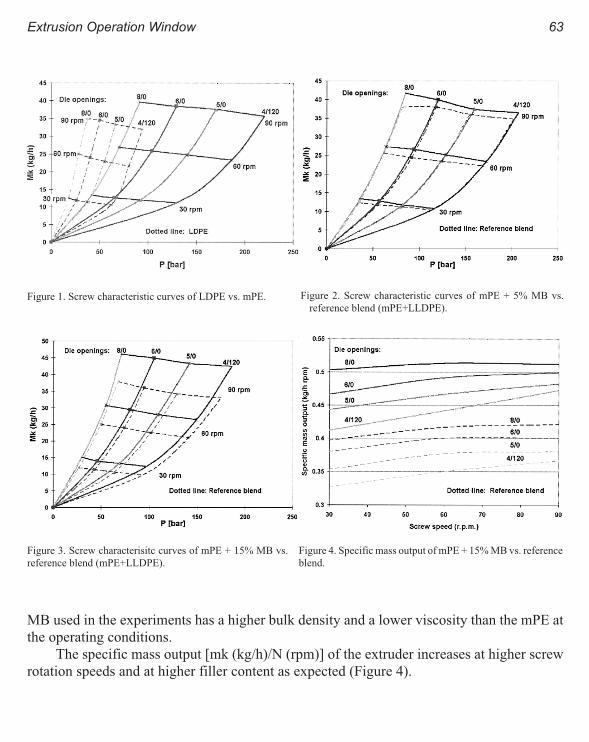
MB used in the experiments has a higher bulk density and a lower viscosity than the mPE at
the operating conditions.
The specific mass output [mk (kg/h)/N (rpm)] of the extruder increases at higher screw
rotation speeds and at higher filler content as expected (Figure 4).
Extrusion Operation Window 63
Figure 1. Screw characteristic curves of LDPE vs. mPE. Figure 2. Screw characteristic curves of mPE + 5% MB vs.
reference blend (mPE+LLDPE).
Figure 3. Screw characterisitc curves of mPE + 15% MB vs.
reference blend (mPE+LLDPE).
Figure 4. Specific mass output of mPE + 15% MB vs. reference
blend.

ENERGY BALANCE
The energy balance of the extruder is a very important parameter to be considered in the pro-
cessing of high viscous polymers. The energy efficiency is defined as the ratio between the
energy absorbed by the polymer (enthalpy change + pumping capacity) and the energy sup-
plied by the motor (= adiabatic assumption).
% E = [(∆H + Pp)/em]100
The Table1 shows the energy efficiency for LDPE vs. mPE for all the operation points. It
is seen from the table that the actual barrier screw is efficient at the highest screw speed and
die restriction. For all the operation points, the polymer was absorbing energy from the motor
and from the heaters (%E >> 100 %).
PRESSURE PROFILE
The pressure profile along the screw in Figure 5 shows how much pressure is required to
overcome the die restriction. The figure shows the pressure at the greatest speed, 90 rpm, at
the most restrictive die and at the highest filler content. This point was chosen because it is
where the screw configuration operates more efficiently. The pressures for the blend mPE +
64 Metallocene Technology
Table 1. Energy balance LDPE vs. mPE for all the operation points
W*N
rpm
LDPE mPE
em, J/s ∆H, J/s Pp, J/s %E, J/s em, J/s ∆H, J/s Pp, J/s %E, J/s
8/0 30 408.4 2028.4 8.3 499 754.0 2544.3 20.6 340
8/0 60 1193.8 4014.4 25.6 338 2324.8 5134.8 68.8 224
8/0 90 2261.9 5526.3 47.2 246 4241.1 7610.7 131.7 183
6/0 30 377.0 1945.2 113. 519 754.0 2412.5 29.9 324
6/0 60 1131.0 3904.1 35.1 348 2324.8 4992.8 98.5 219
6/0 90 2167.7 5526.3 63.0 258 4335.4 7463.7 181.1 176
5/0 30 377.0 1867.9 15.4 500 691.2 2301.1 40.4 339
5/0 60 1131.0 3747.5 46.2 335 2324.8 4795.1 126.9 212
5/0 90 2167.7 5358.9 80.6 251 4335.4 7346.3 233.6 175
4/120 30 408.4 1729.9 24.0 429 754.0 2147.7 52.8 292
4/120 60 1131.0 3513.7 63.2 316 2324.8 4551.6 159.1 203
4/120 90 2167.7 5155.2 109.9 243 4335.4 7026.9 287.1 169
*W=die opening

15 % MB are higher than those for the ref-
erence blend due to the different viscosities
of the materials under these conditions.
Same trend was observed for the blends
with 5 % MB and 10 % MB.
For all the trials, the maximum pres-
sure occurs at about L/D = 20 at the end of
the barrier section and beginning of the metering section. This maximum pressure values de-
crease at higher filler content for a constant screw rotation speed due to the different rheology
of the blends.
Table 2 shows the pressure loss from 20D till 25D, which correspond to the metering
section. The mPE 100% demands the highest pressure because of the highest viscosity. The
blend mPE + 15 % MB exhibits the lowest pressure consumption in Table 2. The pressure loss
with the different blends is reduced further as the die restriction is increased, thus the extruder
becomes more efficient.
MELT TEMPERATURE PROFILE
Figure 6 shows the average melt temperature profile measured by the thermal comb at 90
rpm, at the most restrictive die and at the highest filler content. The temperature at the center
is higher for all the polymer blends due to the viscous dissipation effect, which is quantified in
Extrusion Operation Window 65
Table 2. Temperature results at 90
rpm averaging the 4 different restric-
tions and pressure at the highest
output
BlendTboC
s
%
DTmaxoC
DP
bar
mPE 258 9 197 5.38
mPE+5% MB 256 7.25 167 4.79
mPE+5% LLDPE 256 6.75 153 4.70
mPE+10% MB 255 6.75 153 4.72
mPE+10% LLDPE 255 5.75 134 4.49
mPE+15% MB 253 3.75 146 4.31
mPE+15% LLDPE 253 4.5 109 4.28
LLDPE had MI=20
Figure 5. Extruder pressure profile at highest output (90 rpm, min.
die opening) for blends mPE + 5%, 10%, and 15% MB.

Table 2 by the bulk temperature. Due to the
smaller gap in the metering section, the ma-
terial is subjected to a higher degree of vis-
cous dissipation, which increases with the
screw speed. The maximum temperature
difference in Table 2 between the wall tem-
perature and the center is 7.25oC for mPE +
5 % MB and 3.75oC for mPE + 15 % MB.
The melt temperature homogeneity can be quantified by looking at the maximum tem-
perature difference and the standard deviation of the temperature measurements in Table 2.
The blend mPE + 15 % MB results in the most homogeneous temperature profile and lowest
viscous dissipation. As expected, the melt homogeneity results show the need of a screw mix-
ing head for the processing of metallocene resins.
MECHANICAL PROPERTIES
Figure 7 presents a bar chart comparing the elastic modulus (ASTM 638M) of the different
blends with respect to the reference blend. The highest modulus is obtained for the blend mPE
+ 15 % MB due to the highest filler content as well. It is seen that the filler (TiO2) has a rein-
forcing effect on the blend. This is in agreement with the literature on effect of fillers and rein-
forcements.5 The lowest elastic modulus is obtained for mPE. 100%.
66 Metallocene Technology
Figure 6. Average melt temperature profile at 90 rpm and min.
die opening for blends mPE + 5, 10, and 15% MB.
Figure 7. Elastic modulus of mPE + 5, 10, 15% MB vs.
reference blends.
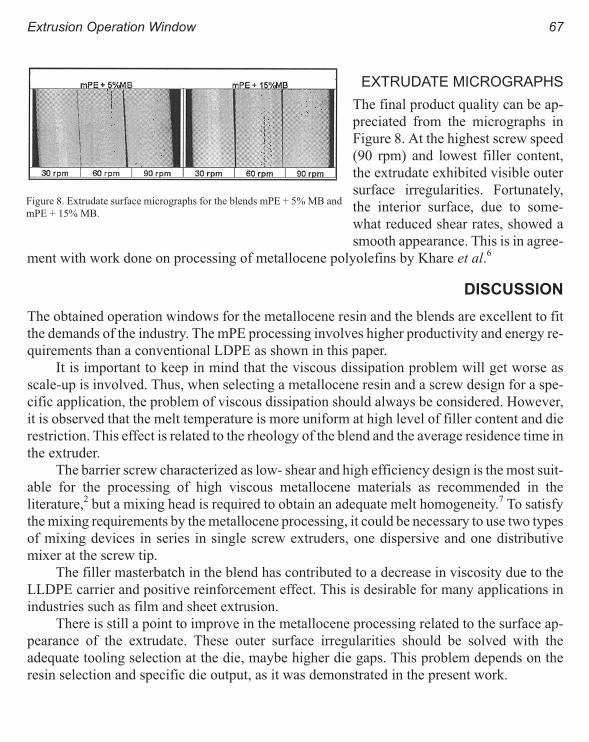
EXTRUDATE MICROGRAPHS
The final product quality can be ap-
preciated from the micrographs in
Figure 8. At the highest screw speed
(90 rpm) and lowest filler content,
the extrudate exhibited visible outer
surface irregularities. Fortunately,
the interior surface, due to some-
what reduced shear rates, showed a
smooth appearance. This is in agree-
ment with work done on processing of metallocene polyolefins by Khare et al.6
DISCUSSION
The obtained operation windows for the metallocene resin and the blends are excellent to fit
the demands of the industry. The mPE processing involves higher productivity and energy re-
quirements than a conventional LDPE as shown in this paper.
It is important to keep in mind that the viscous dissipation problem will get worse as
scale-up is involved. Thus, when selecting a metallocene resin and a screw design for a spe-
cific application, the problem of viscous dissipation should always be considered. However,
it is observed that the melt temperature is more uniform at high level of filler content and die
restriction. This effect is related to the rheology of the blend and the average residence time in
the extruder.
The barrier screw characterized as low- shear and high efficiency design is the most suit-
able for the processing of high viscous metallocene materials as recommended in the
literature,2 but a mixing head is required to obtain an adequate melt homogeneity.7 To satisfy
the mixing requirements by the metallocene processing, it could be necessary to use two types
of mixing devices in series in single screw extruders, one dispersive and one distributive
mixer at the screw tip.
The filler masterbatch in the blend has contributed to a decrease in viscosity due to the
LLDPE carrier and positive reinforcement effect. This is desirable for many applications in
industries such as film and sheet extrusion.
There is still a point to improve in the metallocene processing related to the surface ap-
pearance of the extrudate. These outer surface irregularities should be solved with the
adequate tooling selection at the die, maybe higher die gaps. This problem depends on the
resin selection and specific die output, as it was demonstrated in the present work.
Extrusion Operation Window 67
Figure 8. Extrudate surface micrographs for the blends mPE + 5% MB and
mPE + 15% MB.

CONCLUSIONS
It is confirmed that the extrusion of metallocene resins is very different compared to the
LDPE processing due to the fact that these materials have an extended Newtonian plateau.
Fortunately, the obtained operation windows are more attractive for the industry due to the
high productivity levels.
The filler masterbatches act mainly as a processing aid due to the carrier selection (resins
with a high melt index) and at the same time, a positive reinforcing effect can be achieved.
It appears further tailoring of the optimum screw design with a barrier section and differ-
ent mixing devices but keeping under control the viscous dissipation problem. Processability
improvements of these resins and their blends are required. A future contribution to this pro-
ject will be to analyze the same blends using different screw configurations including novel
mixing heads, and to compare the agreement between simulations and experimental results.
ACKNOWLEDGMENTS
All the measurements were performed at the Instituto de CapacitaciÙn e InvestigaciÙn del
Pl«stico y del Caucho (ICIPC in MedellÍn, Colombia. Thanks are due to DOW QUIMICA DE
COLOMBIA S.A. who donated the mPE, COMAI S.A. for the master batch and
QUIMICOPLASTICOS LTDA for the LLDPE.
REFERENCES
1 Knights, M., Plastics Technology, p.44, February 1995.
2 Butler, T., Plastics Technology, p.50, February 1995.
3 Cheng, C. Y., SPE ANTEC, p.2019, (1996).
4 Cheng, C. Y. and J. W. C. Kuo, SPE ANTEC, p.1942, (1997).
5 Domininghaus, H., Plastics for Engineers, Carl Hanser Verlag, Munich, Germany, (1993).
6 Khare A., C. Qin, M. T.K. Ling and L. Woo, SPE ANTEC, p.2198, (1998).
7 Rios A., T. Osswald, M. Noriega and O. Estrada, SPE ANTEC, p.262,(1998).
68 Metallocene Technology

Processing Trends of Metallocene Linear Low
Density Polyethylenes and Their Influence on Single
Screw Design
K. R. Slusarz, C. A. Ronaghan, and J. P. Christiano
Davis-Standard Corporation, Technical Center Pawcatuck, Connecticut 06379, USA
INTRODUCTION
The changes in molecular architecture for these new metallocene LLDPE (m-LLDPE) have a
dramatic impact on their physical properties. The physical properties of metallocene resins
that are affected included the frictional, rheological, and melting behavior. These properties
affect extrusion performance and screw design.1,2 Specifically, it has been observed that the
melting rate of m-LLDPE is strongly influenced by the material density and the amount of
chain branching.3 This study was undertaken to investigate the effect of these variables on the
extrusion process and how they relate to screw design.
The first material was a conventional Ziegler-Natta (ZN) catalyzed LLDPE with a den-
sity of 0.920 g/cc and was used as a baseline for comparison. Two metallocene resins, which
are produced using Constrained Geometry Catalyst Technology, and contain controlled long
chain branching (LCB), were chosen. The two materials have densities of 0.908 and 0.902
g/cc respectively. These materials will be studied to see the effect of density on process per-
formance. A second type of m-LLDPE produced on a single site catalyst such that it contains
controlled short chain branching (SCB) with a density of 0.900 g/cc was selected to evaluate
the effect of chain branching. The final comparison was with an identical m-LLDPE as previ-
ously described except that it contains a processing aid (PA) and antioxidant package. All of
these resins have a melt index in the range of 1.0 to 1.2 g/cc and are representative of
LLDPE’s that are suitable for blown film applications.
Three different screws were evaluated to see the effect of screw geometry on the pro-
cessing performance of these metallocene resins. These screws included two barrier designs,
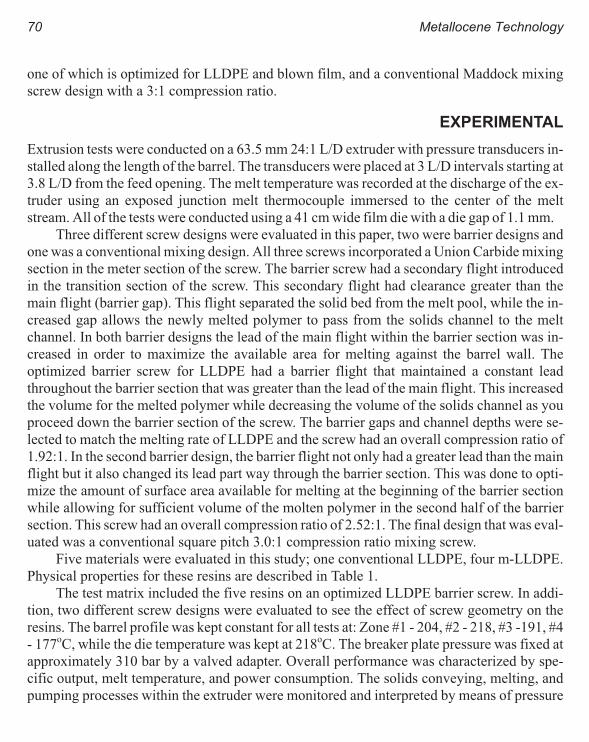
one of which is optimized for LLDPE and blown film, and a conventional Maddock mixing
screw design with a 3:1 compression ratio.
EXPERIMENTAL
Extrusion tests were conducted on a 63.5 mm 24:1 L/D extruder with pressure transducers in-
stalled along the length of the barrel. The transducers were placed at 3 L/D intervals starting at
3.8 L/D from the feed opening. The melt temperature was recorded at the discharge of the ex-
truder using an exposed junction melt thermocouple immersed to the center of the melt
stream. All of the tests were conducted using a 41 cm wide film die with a die gap of 1.1 mm.
Three different screw designs were evaluated in this paper, two were barrier designs and
one was a conventional mixing design. All three screws incorporated a Union Carbide mixing
section in the meter section of the screw. The barrier screw had a secondary flight introduced
in the transition section of the screw. This secondary flight had clearance greater than the
main flight (barrier gap). This flight separated the solid bed from the melt pool, while the in-
creased gap allows the newly melted polymer to pass from the solids channel to the melt
channel. In both barrier designs the lead of the main flight within the barrier section was in-
creased in order to maximize the available area for melting against the barrel wall. The
optimized barrier screw for LLDPE had a barrier flight that maintained a constant lead
throughout the barrier section that was greater than the lead of the main flight. This increased
the volume for the melted polymer while decreasing the volume of the solids channel as you
proceed down the barrier section of the screw. The barrier gaps and channel depths were se-
lected to match the melting rate of LLDPE and the screw had an overall compression ratio of
1.92:1. In the second barrier design, the barrier flight not only had a greater lead than the main
flight but it also changed its lead part way through the barrier section. This was done to opti-
mize the amount of surface area available for melting at the beginning of the barrier section
while allowing for sufficient volume of the molten polymer in the second half of the barrier
section. This screw had an overall compression ratio of 2.52:1. The final design that was eval-
uated was a conventional square pitch 3.0:1 compression ratio mixing screw.
Five materials were evaluated in this study; one conventional LLDPE, four m-LLDPE.
Physical properties for these resins are described in Table 1.
The test matrix included the five resins on an optimized LLDPE barrier screw. In addi-
tion, two different screw designs were evaluated to see the effect of screw geometry on the
resins. The barrel profile was kept constant for all tests at: Zone #1 - 204, #2 - 218, #3 -191, #4
- 177oC, while the die temperature was kept at 218oC. The breaker plate pressure was fixed at
approximately 310 bar by a valved adapter. Overall performance was characterized by spe-
cific output, melt temperature, and power consumption. The solids conveying, melting, and
pumping processes within the extruder were monitored and interpreted by means of pressure
70 Metallocene Technology
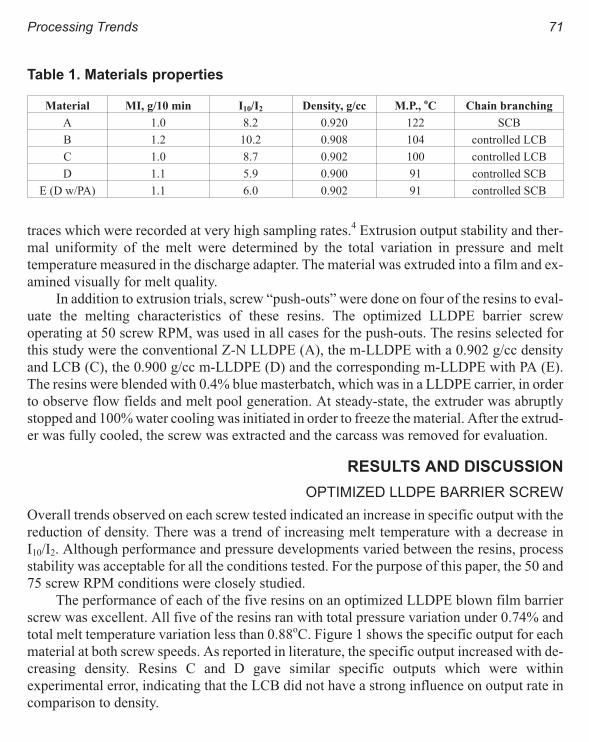
traces which were recorded at very high sampling rates.4 Extrusion output stability and ther-
mal uniformity of the melt were determined by the total variation in pressure and melt
temperature measured in the discharge adapter. The material was extruded into a film and ex-
amined visually for melt quality.
In addition to extrusion trials, screw “push-outs” were done on four of the resins to eval-
uate the melting characteristics of these resins. The optimized LLDPE barrier screw
operating at 50 screw RPM, was used in all cases for the push-outs. The resins selected for
this study were the conventional Z-N LLDPE (A), the m-LLDPE with a 0.902 g/cc density
and LCB (C), the 0.900 g/cc m-LLDPE (D) and the corresponding m-LLDPE with PA (E).
The resins were blended with 0.4% blue masterbatch, which was in a LLDPE carrier, in order
to observe flow fields and melt pool generation. At steady-state, the extruder was abruptly
stopped and 100% water cooling was initiated in order to freeze the material. After the extrud-
er was fully cooled, the screw was extracted and the carcass was removed for evaluation.
RESULTS AND DISCUSSION
OPTIMIZED LLDPE BARRIER SCREW
Overall trends observed on each screw tested indicated an increase in specific output with the
reduction of density. There was a trend of increasing melt temperature with a decrease in
I10/I2. Although performance and pressure developments varied between the resins, process
stability was acceptable for all the conditions tested. For the purpose of this paper, the 50 and
75 screw RPM conditions were closely studied.
The performance of each of the five resins on an optimized LLDPE blown film barrier
screw was excellent. All five of the resins ran with total pressure variation under 0.74% and
total melt temperature variation less than 0.88oC. Figure 1 shows the specific output for each
material at both screw speeds. As reported in literature, the specific output increased with de-
creasing density. Resins C and D gave similar specific outputs which were within
experimental error, indicating that the LCB did not have a strong influence on output rate in
comparison to density.
Processing Trends 71
Table 1. Materials properties
Material MI, g/10 min I10/I2 Density, g/cc M.P.,oC Chain branching
A 1.0 8.2 0.920 122 SCB
B 1.2 10.2 0.908 104 controlled LCB
C 1.0 8.7 0.902 100 controlled LCB
D 1.1 5.9 0.900 91 controlled SCB
E (D w/PA) 1.1 6.0 0.902 91 controlled SCB
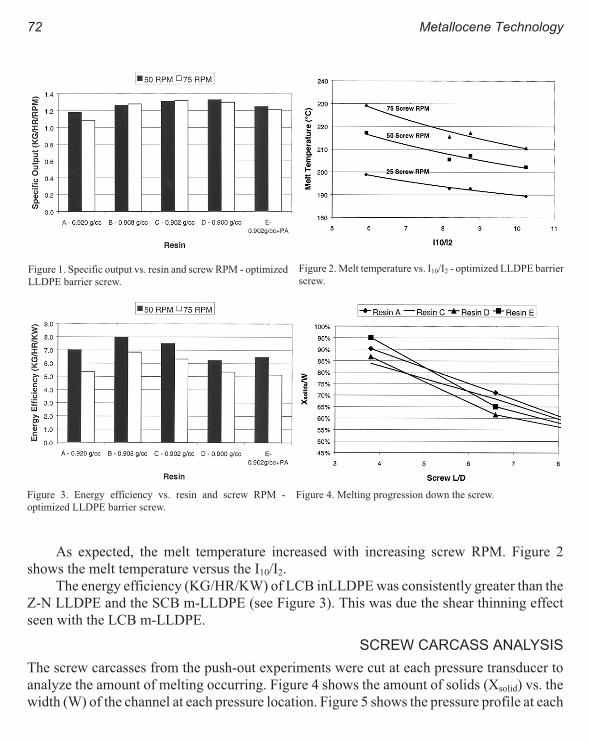
As expected, the melt temperature increased with increasing screw RPM. Figure 2
shows the melt temperature versus the I10/I2.
The energy efficiency (KG/HR/KW) of LCB inLLDPE was consistently greater than the
Z-N LLDPE and the SCB m-LLDPE (see Figure 3). This was due the shear thinning effect
seen with the LCB m-LLDPE.
SCREW CARCASS ANALYSIS
The screw carcasses from the push-out experiments were cut at each pressure transducer to
analyze the amount of melting occurring. Figure 4 shows the amount of solids (Xsolid) vs. the
width (W) of the channel at each pressure location. Figure 5 shows the pressure profile at each
72 Metallocene Technology
Figure 1. Specific output vs. resin and screw RPM - optimized
LLDPE barrier screw.
Figure 2. Melt temperature vs. I10/I2 - optimized LLDPE barrier
screw.
Figure 3. Energy efficiency vs. resin and screw RPM -
optimized LLDPE barrier screw.
Figure 4. Melting progression down the screw.

pressure transducer for all the resins at 50
screw RPM. These figures indicate that
resin C had the greatest amount of melt
along with the highest pressures in the feed
zone of the screw. This indicates the fric-
tional coefficient along with the initial rate
of melting were greater for resin C that of
the conventional Z-N LLDPE.6 The lower
density m-LLDPE initiated melting earlier
and at a higher rate than the Z-N LLDPE re-
sulting in a greater specific output.
When comparing resin D to resin A,
there was a similar trend. There was a
greater initial amount of melt that is formed
with resin D, which was consistent with
lower density. In addition, resin D had a
greater pressure profile along the screw yielding in a higher specific output.
When comparing resin C to resin D, resin C had a greater amount of melt and higher
pressure initially. At P2, resin D had a greater amount of melt along with higher pressure.
From these observations, one can infer that the LCB yields to greater frictional coefficients
causing earlier melting, while the SCB narrow molecular weight inLLDPE melts much more
rapidly once melting had initiated. Analysis of the cross channel pressure gradient for resin D,
shows a much larger differential pressure, indicating a much higher melt viscosity resulting in
a greater amount viscous energy dissipation once the melt film had established.
Figure 4 shows that resin E with PA delayed the start of melting. It also resulted in a
lower pressure profile along the screw. This was most likely due to the interaction of PA on
the screw and barrel surface. When the PA interacts at the polymer metal wall interface, it can
decrease the shear stress transmitted at the wall. Once resin E initiated melting, its rate of
melting was very high. This was observed at P2 where resin E had the second greatest amount
of melt. Work has been published on the effect of PA that suggest that the PA coats the screw
and barrel wall and change the interaction of the molten polymer with the metal resulting in
reducing gels.7 Our trials showed a significant improvement in the visual melt quality of the
film, lower melt temperature, a slight reduction in specific output, and less cooling demand in
barrel Zones #3 and #4.
ADDITIONAL SCREW DESIGNS
A second barrier screw with shallower channel geometry showed a similar trend with specific
output versus density. Figure 6 shows the specific output of all the resins at 50 and 75 screw
Processing Trends 73
Figure 5. Nominal pressure profile along the screw - optimized
LLDPE barrier screw.

RPM. As the figure indicates, the specific output of all the resins was lower than the opti-
mized LLDPE barrier screw design. Melting instability was observed on this screw design.
This was because the barrier design was not optimized for the high rate of melting that is typi-
cal of m-LLDPE. The melting instability compromises the integrity of the solid bed and up-
sets the steady state process. This is referred to as solid bed breakup (SBB).5 Analysis of the
pressure traces showed a repeatable steady-state upset that manifested itself as a spike in both
the melt temperature and pressure measured in the adapter pipe.
The conventional Maddock mixing screw had the lowest specific output of all the
screws. However., the trend of increased output rate with decreasing density was still appar-
ent. Figure 7 shows the specific output as a function of material and screw speed. This screw
design showed increased tendency for SBB along with greater spikes in the melt temperature
and adapter pressure.
CONCLUSIONS
The results from this paper showed that changes in material properties due to recent advances
in catalyst technology must be carefully considered in the design of single screws for
metallocene polyethylenes. This study of m-LLDPEs showed increased melting rates and
higher specific output rates. The optimized LLDPE barrier screw that was tested, processed
both the LCB and SCB inLLDPE’s successfully. However, further optimization is possible
for the m-LLDPE based on the unique characteristics of each metallocene resin tested. Addi-
tional screw designs tested showed that instabilities due to the feeding and melting character-
istics of the polymer can occur if the screw design cannot accommodate the high melting
74 Metallocene Technology
Figure 6. Specific output vs. resin and screw RPM -
non-optimized LLDPE barrier screw.Figure 7. Maddock mixing screw - specific output vs. resin
and screw RPM.

rates. As new polymers are produced with lower densities, high melting rates and high fric-
tional coefficients, screw designs will have to change to accommodate these resin character-
istics.
ACKNOWLEDGMENTS
We would like to thank Tom Butler of the Dow Chemical Company and Craig Erderly of Ex-
xon Chemical Company for their contributions of materials and expertise.
REFERENCES
1 J. P. Christiano and K. R. Slusarz, TAPPI PLC Conference Tech. Papers, 483, (1998)
2 T. I. Butler, M. A. Spalding and A. Mayer, “A Processing Comparison of POP and EPE Polymers in Blown Film.”
3 Y. S. Kim, C. I. Chung, S. Y. Lai, T. I. Butler and K. S. Hyun, SPE ANTEC, 42, 216, (1996).
4 C. D. Han, K. Y. Lee, and N. W. Wheeler, Polym. Eng. Sci., 31, 831, (1991).
5 R.T. Fenner, A. P. D. Cox, and D. P. Isherwood, Polymer, 20, 733, (1979).
6 Y. S. Kim, C. I. Chung, S. Y. Lai, and K. S. Hyun, SPE ANTEC, 42, 207, (1996).
7 S. S. Woods and S. E. Amos, TAPPI PLC Conference Tech. Papers, 675, (1998)
Processing Trends 75

Influence of mPE Grades on the Dynamic Properties
of PP/mPE-Blends
Frank Raue and Gottfried W. Ehrenstein
Lehrstuhlf fòr Kunststofftechnik (LKT), University of Erlangen-Nuremberg, Am
Weichselgarten 9, 91058 Erlangen, Germany
INTRODUCTION
The development of metallocene catalyst systems has led to numerous new materials. The
new materials are built up of well-known monomer units but exhibit unique property profiles.
The differences in the property profiles are attributed to the capability of the systems to allow
the design of new molecular chains. An important group of polymers, which is synthesized
with these catalysts, is metallocene polyethylene (mPE). This material has a very homoge-
neous copolymer distribution and a narrow molecular weight distribution. In particular, very
low density mPE possesses elastomeric properties superior to commonly used PE grades.
In addition to the elastomeric behavior, mPE shows good dispersion in polypropylene
(PP). Taking into consideration that PP exhibits low fracture toughness at low temperatures, it
is often blended with an elastomeric material. Thus, it is being suggested to use mPE as a
modifier for PP. In similar applications, mPE can also be used as a substitute for the ethylene
propylene diene terpolymer (EPDM) in PP/EPDM-blends.1,2 In our previous work, we have
shown that some quantities like the tensile and dynamic behavior can be improved when sub-
stituting EPDM with mPE. This relationship can be pronounced if the soft phase is not
crosslinked.3 Low cost and a wide range of achievable mechanical properties favor com-
pounding of the desired blend composition. For improved blend homogeneity, processing
with twin extruders is preferred.
This work deals with the deformation behavior of PP/mPE-blends under static and dy-
namic loading. Dynamic load limits of the blend, which are necessary for several
applications, are obtained using the hysteresis measurement method. Via this method the in-
fluence of the mPE grade on different mechanical properties is examined.

THE HYSTERESIS
MEASUREMENT METHOD
The common S-N testing approach for mate-
rial fatigue gives the number of cycles to
failure for a given load. In contrast to this,
the hysteresis method possesses two basic
advantages when characterizing the dy-
namic material properties.4 The first is an in-
crease in information on the fatigue process,
i.e., structural changes. The second advan-
tage is a decrease in duration of the test. This
becomes possible by evaluating the hyster-
esis-loop subjected to cyclic loading. The
viscoelastic material behavior and material
damage induce the loop in the stress-strain
diagram as shown in Figure 1. Four different
characteristic quantities; stress, strain,
moduli and mechanical energy can describe
the hysteresis loop itself. Basic properties
shown in Figure 1 include the dynamic
modulus Edyn and the damping factor Λ:
E dyn u l u l= − −( ) / ( )σ σ ε ε [1]
Λ =W Wl s/ [2]
Also the stiffness ratio
E Eu l u l/ tan / tan= α α [3]
is very useful in the determination of the
changes in the loop shape, i.e., for a thermo-
plastic elastomer.5
For the hysteresis measurement
method, two different test patterns were per-
formed. The first profile was the Stepwise
78 Metallocene Technology
Figure 1. Construction of hysteresis loop and characteristic
quantities derived from the hysteresis loop.

Load Increase Procedure (SLIP) which increases the dynamic load by a constant load ratio af-
ter a specified number of cycles. This profile is suitable for the rapid determination of load
dependent characteristics. The second profile was used to determine the time dependent
changes in characteristic quantities measured via the Single Load Level Procedure (SLLP)
which uses a specified load amplitude. The load ratio R used for the SLIP analysis is defined
as:
R l u= σ σ/ [4]
EXPERIMENTAL
MATERIAL AND SAMPLE PREPARATION
For these examinations, a block copolymer polypropylene (Vestolen P9500, DSM) was used
as the matrix material. With the use of a twin screw extruder (Leistritz LSM 30/34 GL, mass
temperature: 200oC, rotational velocity: 100 rpm), the PP was compounded with four differ-
ent metallocene ethylene-octene copolymer grades: Engage EG 8100, EG 8150, EG 8200 and
EG 8842 by DuPont Dow Elastomers SA. Engage EG 8100 has a density of 0.868 g/cm3
(co-monomer content: 25 wt%). EG 8150 EG 8200 have a density only 0.002 g/cm3 greater
than EG 8100 (24 wt% co-monomer), however these metallocene copolymers have a melt
flow index at temperature of 190oC and mass of 2.16 kg of 1.0, 0.5, and, 5.0 g/l0 min, respec-
tively. EG 8842 has a density of 0.857 g/cm3, a melt flow index of 1.0 g/l0 min, and is talcum
powdered to reduce tacking of the pellets. Characteristic quantities of the materials as pro-
vided in the data sheets are given in Table 1.
After compounding the blends at a ratio of 60 wt% PP and 40 wt% mPE, the blend was
molded into test specimens with the use of an Engel ES 200/50 HL at a mass temperature of
200oC, a mold temperature of 40oC, and a flow front velocity of 275 mm/min. The test speci-
mens used for the experimental investigations had the sample geometry depicted in Figure 2.
Influence of mPE Grades 79
Table 1. Quantities for the neat materials according to data sheets (MFI at
190oC, 2.16 kg, n.v.: no value)
Pure material Shore A/D σmax, MPa εmax, % MFI, g/10 min
P 9500 n.v. 32.0 >50 n.v.
EG 8150 75/20 11.9 750 0.5
EG 8100 75/22 10.3 800 1.0
EG 8200 75/21 7.6 >1000 5.0
EG 8842 n.v. n.v. >1000 1.0

TESTING EQUIPMENT ANDPROCEDURES
In order to characterize the viscosity of the
various blend components over the complete
range of shear rates in the processing steps,
the apparent shear viscosity was determined
with a high pressure capillary rheometer
(Verirel 7, Rosand, melt temperature: 200oC).
All mechanical tests were carried out at
23oC and 50 % relative humidity. Tensile tests
for the static mechanical charac-
terization of the material were run
on a Zwick 1465 tensile testing
machine. The crosshead speed
during testing was 200 mm/min.
Tension-tension fatigue tests
were performed on a Schenck
servo-hydraulic testing machine.
A load cell and an extensiometer,
respectively, measured the force
and longitudinal strains for the
calculation of the hysteresis curve
as shown in Figure 3.
The samples were subjected
to stress controlled sinusoidal
forced oscillation. The frequency
in the tests was 0.35 Hz in order to
avoid viscous heating of the sam-
ples. SLIP with a load ratio
R=0.01 was conducted in order to obtain load limits for dynamic loading. The stress was kept
constant during a period of 250 cycles and then stepped to the next higher level. SLIP show
the validity of the resulting load limits.
80 Metallocene Technology
Figure 2. Testing geometry.
Figure 3. Test configuration.

RESULTS AND DISCUSSION
VISCOSITY
Figure 4 shows the viscosity of the ex-
amined materials at 200oC. The vis-
cosity of the different mPE’s is
comparable at higher shear rates, rele-
vant to the shear rates obtained during
the injection molding process. At
lower shear rates, the high MFI grade
EG 8200 exhibits the lowest viscosity.
The PP has a lower MFI-value than
the mPE’s, i.e., higher viscosity at low
shear rate, and is also slightly less vis-
cous when high shear rates are applied. Since the phase with the lower viscosity usually forms
the matrix in a copolymer system, PP would represent the major phase. However, at a viscos-
ity ratio close to 1.0, an interpenetrating network may also be possible. Examinations to de-
fine the morphological states are yet to be investigated for the blends obtained under these
processing conditions.
TENSILE TESTS
The stress-strain diagrams of the
matrix material, the blends with
40 wt% soft phase, and the pure
mPE grades are shown in Figure
5. As expected, the modulus and
the tensile strength both de-
crease while the elongation at
break is improved as the elasto-
mer content increases. Investi-
gating the results of the four
blends further, it is evident that
the blend partners with a low
MFI EG 8150 and EG 8100 lead
to a higher modulus and tensile
strength than the other two
Influence of mPE Grades 81
Figure 4. Viscosities of the pure materials at 200oC.
Figure 5. Stress-strain diagram of PP, mPE and their blends (23oC, 200 mm/min).

mPE’s, also shown in Figure 6. These results correlate well with the lower values for these
pure materials.
A different result is obtained when calculating the yield and break energy by the area un-
derneath the stress-strain curve up to the strain at yield stress or the break strain, respectively,
as shown in Figure 7. Here, the better elongation behavior results in a considerably improved
energy value for EG 8842, the material that contains talcum and has the lowest density,
whereas the other blends do not differ much.
DYNAMIC EXPERIMENTS
Figure 8 depicts characteristic
quantities of the hysteresis mea-
surements on specimens of the
60%PP/40%EG8100 and 60%PP/
40%EG8200 blends, respectively
(stress-strain diagrams show the
upper, mean, and lower values).
The dynamic modulus of the EG
8200 blend starts of at a lower level
than the EG 8100 blend, which is in
accordance with the tensile test re-
sults. The slope of the curves is similar, giving proof for a comparable deformation mecha-
nism. However, differences do arise due to the different mechanical characteristic quantities.
The EG 8200 blend shows a more dramatic decrease in the modulus and an increase in the
82 Metallocene Technology
Figure 6. Young’s modulus and tensile strength of PP/mPE
blends (23oC, 200 mm/min).
Figure 7. Yield and break energy of PP/mPE blends (23oC, 200
mm/min).
Table 2. Quantities for PP/mPE blends with 60
wt% PP and 40 wt% mPE
Blend
(PP+...)
E
MPa
σmax
MPa
εmax
%
σΛMPa
EG 8150 614 17.2 102 10.5
EG 8100 612 17.3 97 10.5
EG 8200 469 14.5 110 8.5
EG 8842 481 15.1 129 8.0

damping, strain and the stiffness ratio of the upper to lower modulus of the hysteresis loop
than the EG 8100 blend at low stress levels. Therefore, EG 8100 possesses a higher dynamic
load limit. Table 2 lists the determined load levels at which dramatic changes in the damping,
dynamic modulus, or stiffness ratio were observed.
CONCLUSIONS
PP modification was conducted in this research by the compounding of a PP with four differ-
ent grades of mPE. Considering equal densities of the blends, the low viscosity grades
showed a higher modulus and tensile strength, whereas at a similar viscosity, the grade with
the lowest density gave the best energy absorption. The determination of the dynamic quanti-
ties using the hysteresis measurement method has shown load limits at which the values
change dramatically. The influence of processing parameters on the mechanical behavior of
PP/mPE-blends, especially at different frequencies and temperatures, as well as the morphol-
ogy resulting from the processing conditions are the subject for further investigations.
Influence of mPE Grades 83
Figure 8. PP/mPE blends in SLIP (R=0.01, f=0.35 Hz).

ACKNOWLEDGMENTS
The financial support by the Deutsche Forschungsgemeinschaft (DFG) and the material sup-
port by DuPont Dow Elastomers, Geneva,. and DSM, Gelsenkirchen, is gratefully acknowl-
edged.
REFERENCES
1 Karger-Kocsis, J. (Ed.), Polypropylene - Structure, Blends and Composites. Chapmann & Hall, London (1994).
2 Sylvest, R. T.; Lancester, G.; Betso, S. R., New Elastomers from Insite Technology, Kautschuk, Gummi, Kunststoffe,
50 (1997) 3, p. 186 - 191.
3 Raue, F.; Ehrenstein, G.W., The Static and Dynamic Behavior of PP/EPDM- and PP/POE-Blends using the Hysteresis
Measurement Method, ANTEC, Atlanta (1998), p. 1442-1446.
4 Hoffmann, L.; Pavsek, V.; Schernme, M.; Dratschmidt, F.; Raue, F. Zysk, T.; Ehrenstein, G.W., Hysteresis Measurements -
Making Fatigue Testing More Expressive. 1st Int. Conf. Mechanics of Time Dependent Materials, Ljubljana (1995),
p. 17-22.
5 Raue, F.; Ehrenstein, G.W., Elastomermodifizierte Thermoplaste unter statischer und dynamischer Beanspruchung. Conf.
Proced. Polymerwerkstoffe, Merseburg (1996), p. 85-89.
84 Metallocene Technology

“Single-Site” Catalyzed Polyolefin for Fresh-Cut
Produce Packaging. A Comparison Between
Monoextruded Blends and Coextruded Film
V. Patel, S. Mehta, S. A. Orroth and S. P. McCarthy
Institute for Plastics Innovation, University of Massachusetts, Lowell, MA 01854
INTRODUCTION
Produce packaging demand has increased rapidly over the last two decades. The retail (con-
sumer) market trend is more and more towards fresh-cut produce because of convenience, nu-
tritional concerns, and higher spoilage of the fresh produce before consumption. After
harvest, the quality of produce declines due to changes in color, texture, aroma, flavor and de-
terioration of vitamins, which makes them less acceptable to the consumer. The quality of
produce is affected mainly by two factors, the chemical effect of atmospheric oxygen and
growth of aerobic spoilage microorganisms. These factors are highly sensitive to temperature
and can be slowed down considerably in cold storage but this is not sufficient to adequately
extend the shelf life of produce. Thus, the requirement of modified atmosphere produce pack-
aging is highly desirable to extend the shelf life of fresh produce. The most important criteria
for good produce packaging are the selective permeability to specific gases such as oxygen,
carbon dioxide, ethylene and water vapor at normal storage temperatures. Prior to the 1980s
there was not a single film that met both the permeability and other performance requirements
of fresh-cut produce packaging. Hence, artificial permeability of a film was achieved by in-
complete sealing or by perforating the film. Gas and water transmission through the perfora-
tions is proportional to the effective hole diameter, the number of holes per unit film area and
the uniformity of hole distribution over the package surface.1
The concept of atmosphere modification inside the package has developed rapidly over
the last decade. The artificial atmosphere created inside the package slows down the meta-
bolic processes in the produce and significantly prolongs self-life of the commodity. Film
ventilation by perforation is not suitable for this type of packaging, because gas and water

transmission properties vary and depend largely on the perforations and not on the permeabil-
ity properties of the film. Simultaneously growth of packaged produce, which is not only
pre-washed but also precut, is increasing tremendously. Fresh-cut produce (FCP) has larger
surface area, which gives higher respiration rates than whole fresh produce. Hence the de-
mand for films with higher oxygen transmission rates and lower moisture transmission rates
is ever increasing.2
Modified atmosphere packaging (MAP) is a newly developed technique where the shelf
life of pre-cut produce is extended by inhibiting chemical, enzymatic and microbial spoilage.3
This allows preservation of the fresh state of the produce without the chemical treatments
used for other shelf life extension processes. Traditionally, ethylene vinyl acetate copolymers
(EVA) and ultra low-density polyethylene (ULDPE) have been used for these types of appli-
cations. However, new single-site catalyzed resins have replaced these resins because of
some significant advantages such as excellent optical properties, very high oxygen transmis-
sion rate and outstanding seal performance. Typical product structure used by many film
processors is one-component monolayer films; resin blends extruded into monolayer films,
or coextruded films. Linear low-density polyethylene (LLDPE) and plastomer resins are used
extensively in fresh-cut produce packaging applications. Each resin has its advantages and
disadvantages in terms of processing, gas transmission characteristics and physical properties
due to the difference in their molecular structure. However, comparative information on the
processability, gas transmission rate and film physical behavior of these blends is still limited
in the literature.
The purpose of this research is to compare the properties of monoextruded film of
LLDPE/plastomer blends with coextruded film from the same materials at the same resin ra-
tio. A new bimodal resin film will also be compared with these films for required properties
of fresh-cut produce packaging.
EXPERIMENTAL
Plastomers (POP1 & POP2), bimodal resin, LLDPE resins and coextruded films used in this
study were supplied by Dow Chemical Co. POP1 and POP2 have densities, 0.9308 & 0.8996
g/cc, slip additives, 2000 & 3500 ppm, antiblocks 3000 & 6000 ppm respectively. Bimodal &
LLDPE resins have densities 0.9175 & 0.922 respectively. The monolayer (single layer)
blown film was made by using sterling blown film extrusion line. The die (die diameter, 5";
die gap, 0.03") used in this study is a spiral mandrel die. All films were extruded at same tem-
perature profile (149oC, zone 1; 171oC, zone 2; 216oC zone 3, & 205oC, zone 4). Adapter &
die temperatures were kept at 205oC & 215oC respectively. Blow up ratio (BUR = 2) and
screw speed (60 rpm) were also kept constant throughout processing. To obtain desired film
thickness, varying takeoff speed varied the draw down ratio (DDR). Coextruded films were
86 Metallocene Technology

supplied by Dow Chemical Co., Freeport, TX for comparative study. The feed block type
blown film die was used for coextrusion.
A DuPont TA 2000 with dual cell DSC-912 calorimeter was used to determine the ther-
mal transitions of the polymer blends. The weight of the sample was about 6 mg. Scans were
carried out from 0 to 160oC at a constant heating rate of 10oC /min. Tensile testing of the films
was carried out according to ASTM D882 using an Instron 1137 tensile tester. Test was car-
ried out at cross-head was 500 mm/min (20 in/min) and load cell was 200 pound. The
standard deviation values for modulus were found to vary between 5 to 15%. Tear resistance
testing was performed using an Elmendorf Tear tester (3200 gm) instrument, in accordance
ASTM D1922. The standard deviation values for tear resistance were found to be within 4%.
Impact resistance testing was performed using a Free-Falling Dart Impact Tester, in accor-
dance with ASTM D1709 (Type-A).
Oxygen transmission rate (OTR), carbon dioxide transmission rate test (CO2TR) & wa-
ter vapor transmission rate (WVTR) were carried out at Dow Chemical Co. OTR was
performed using moist gases at ambient temperature on an Ox Tran 10/50 unit, in accordance
with ASTM D3985-81. Oxygen concentration was 1% and data has been adjusted to 100%
oxygen concentration values. CO2TR was done on Mocon MultiTRan unit, using a Dow Test
procedure. OTR & CO2TR values are reported in cubic centimeters at standard temperature
and pressure (STP = 0oC and 1 atm) and normalized for thickness. WVTR test was performed
using Mocon Permatran W unit according to ASTM F1249-90. Heat seal strength & hot tack
strength tests were carried out at Dow Chemical Co. using Dow test procedure. Heat sealing
strength was performed by mounting one-inch (25.4 mm) wide strips on a Topwave Hot Tack
Tester. Dwell time was 0.5 s and seal pressure was 40 psi (0.275 MPa). Sealed samples were
stored at ASTM conditions (22oC, 50%RH) for 24 hrs and then tested on an Instron
Tensiometer at a crosshead speed of 2 in/min (50 mm/min). Hot tack strength was performed
at the same Topwave tester with seal time of 0.5 s, delay time of 0.2 s, peel speed of 150 mm/s,
and seal pressure of 40 psi.
RESULTS AND DISCUSSION
The film obtained by the blown film process is known to be influenced by many variables. It
is interesting to note that at equal melt flow index (1 g/10 min), the polyolefin plastomers
(POPs) produced via INSITE technology are easier to process (lower back pressure and mo-
tor amps) than a conventional linear low density polyethylene (LLDPE). Generally, as molec-
ular weight distribution (MWD) becomes narrower, materials behave more like a Newtonian
fluid and become less shear sensitive. However, POPs with the incorporation of long chain
branching (LCB) exhibit improved processability. Improved processing is defined as higher
“Single-Site” Catalyzed Polyolefin 87

output rates at a given shear stress, less susceptibility to melt fracture, and sufficient melt
strength for good bubble stability during blown film fabrication.
DSC scans of selected film samples indicate that the POP2 has lower melt temperature
(98oC) and heat of fusion (50 J/g) than POP1 (102oC & 70 J/g). This results from higher
comonomer concentration, which controls the amount of short chain branches, the length of
which depends on comonomer type, and thus the resin density. The higher the comonomer
concentration, lower the crystallinity, which lowers the density of resin. The LLDPE film
shows both higher melting temperature (124oC) and heat of fusion (106 J/g) compared to
POPs.
This is due to high crystalline structure. DSC scans of monoextruded film of the
POP1/LLDPE (40/60 wt%) blend and the coextruded film show that the components retained
their identity in the coextruded film, with little co-crystallization and the endothermal peaks
did not overlap. This shows that the POP1 & LLDPE crystallize separately. On the other
hand, the monoextruded blend shows intimate mixing of both materials. Martinez4 observed
similar results for cooling curves for a 50/50 LDPE/LLDPE blend. The bimodal resin film
shows the highest crystalline melting temperature and a much broader peak as compared to
the other three pure materials. This indicates that the bimodal resin might require different
processing conditions than were used in this study.
The tensile modulus (stiffness) and tear resistance in both machine direction (MD) and
transverse direction (TD) increases with increasing percentage of LLDPE for both POPs. Fig-
ures 1 and 2 show the comparison between monoextruded blends and coextruded film of 60
wt% of LLDPE with bimodal resin film for tensile modulus and tear resistance respectively.
Most of the films show higher tensile modulus and tear resistance in TD than in MD. Figure 1
shows that the modulus of monoextruded and coextruded film of POP1 and bimodal resin
film is almost equal and higher than that of monoextruded film of POP2. This was because
stiffness is related to film density (crystallinity). DSC results show that the POP2/LLDPE
blend film has a little lower heat of fusion in comparison to the POP1/LLDPE blend, however
it has broader melting transition. It could be due to inhomogeneity of the blend caused by
comonomer concentration and distribution that might affect the crystalizability of the compo-
nents in the blend and finally the mechanical properties. For most of the cases as draw dawn
ratio (DDR) increases, modulus in the MD increases. This is because as DDR increases,
amorphous phase orientation and chain extension along MD increases. Tensile modulus in
TD remained almost constant as blow up ratio (BUR) remained constant. Figure 2 demon-
strates that monoextruded blend films have a little higher tear resistance than coextruded film.
Figure 3 shows that both the POP/LLDPE blend films did not fail at the 1050 g test maxi-
mum load limit up to 60 wt% LLDPE. This indicates that both POPs provides excellent
toughness. However, for 80 and 100 wt% LLDPE impact resistance decreases. This is be-
cause as density (crystallinity) increases the film becomes more brittle. Thus, fracture
88 Metallocene Technology
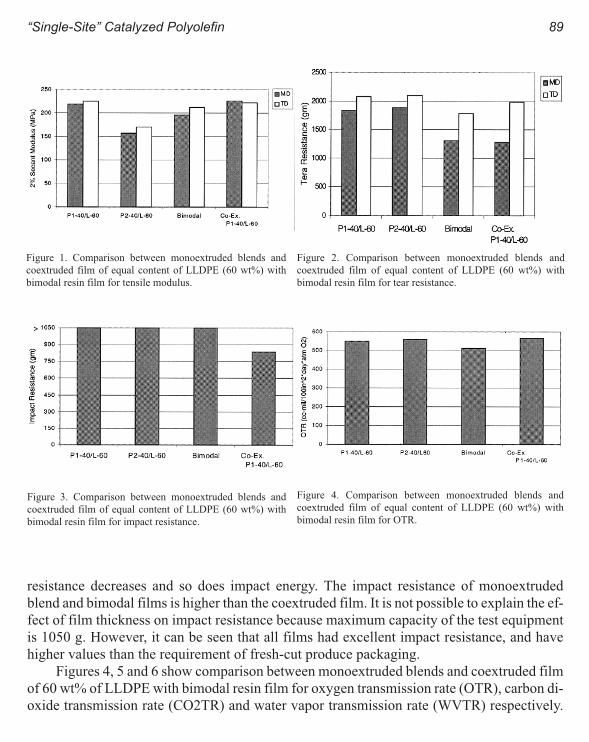
resistance decreases and so does impact energy. The impact resistance of monoextruded
blend and bimodal films is higher than the coextruded film. It is not possible to explain the ef-
fect of film thickness on impact resistance because maximum capacity of the test equipment
is 1050 g. However, it can be seen that all films had excellent impact resistance, and have
higher values than the requirement of fresh-cut produce packaging.
Figures 4, 5 and 6 show comparison between monoextruded blends and coextruded film
of 60 wt% of LLDPE with bimodal resin film for oxygen transmission rate (OTR), carbon di-
oxide transmission rate (CO2TR) and water vapor transmission rate (WVTR) respectively.
“Single-Site” Catalyzed Polyolefin 89
Figure 1. Comparison between monoextruded blends and
coextruded film of equal content of LLDPE (60 wt%) with
bimodal resin film for tensile modulus.
Figure 2. Comparison between monoextruded blends and
coextruded film of equal content of LLDPE (60 wt%) with
bimodal resin film for tear resistance.
Figure 3. Comparison between monoextruded blends and
coextruded film of equal content of LLDPE (60 wt%) with
bimodal resin film for impact resistance.
Figure 4. Comparison between monoextruded blends and
coextruded film of equal content of LLDPE (60 wt%) with
bimodal resin film for OTR.

As LLDPE contents increases per-
meability of the film decreases for
both POPs. This is because perme-
ability requires free volume, so
gases permeating through the
polymer are limited to the amor-
phous phase in semicrystalline
polymers. Diffusion occurs mainly
in the amorphous region, and mo-
tion around the crystalline area is a
tortuous and difficult path.5 Per-
meability depends upon both
solubility and diffusion; since
crystallinity reduces both, it has
even a greater effect in reducing
their product. Thus, as LLDPE content increases, total crystallinity of the film increases,
which reduces the permeability of the film. It can be noted that all film samples has almost
equal OTR and WVTR values even though some film samples have different crystallinity.
This was unexpected and might be the result of crystalline alignment/orientation, which
could alter permeability and affect the pathway available for diffusion.6 Orientation of the
amorphous phase also decreases permeability. The CO2TR for the coextruded film was
higher than for POP2 blend with 60 wt% LLDPE, which was unexpected and might be be-
90 Metallocene Technology
Figure 5. Comparison between monoextruded blends and
coextruded film of equal content of LLDPE (60 wt%) with
bimodal resin film for CO2TR.
Figure 6. Comparison between monoextruded blends and
coextruded film of equal content of LLDPE (60 wt%) with
bimodal resin film for WVTR.
Figure 7. Comparison between monoextruded blends and coextruded film of
equal content of LLDPE (60 wt%) with bimodal resin film for heat sealing
strength. Codes: S3:P1-40/L-60; S7:P2-40/L-60; S11:bimodal; S12:Co-ex.
P1-40/L-60.

cause of differences in processing conditions. Generally, permeability of the film decreases
with increase in orientation (DDR) of the amorphous region as well as the crystalline region
that creates a more tortuous pathway. Processing conditions (e.g. cooling, DDR) can cause
variation in film permeability as a result of degree of orientation.
Figure 7 shows comparison between monoextruded blends and coextruded film of 60
wt% of LLDPE with bimodal resin film for heat seal strength. Superior sealing strength is
achieved, when two polymer surfaces are pressed together under adequate pressure for suffi-
cient time so that the polymer chains can diffuse and intermix across the surface boundary. As
LLDPE content increases, heat seal initiation temperature also increases. This is expected be-
cause as LLDPE content increases, crystallinity and melting point of the film increases,
which reduces the mobility of segments of the adjacent amorphous polymer phase and thus
increases the heat seat temperature at which they have enough mobility to produce an ade-
quate heat seal. Also POP2 blends have lower heat sealing temperatures than POP1 for equal
LLDPE content because of lower overall crystallinity. Coextruded film shows lower heat
sealing temperature and higher hot tack strength over a wide sealing range compared to other
films. This is an important advantage of coextruded film over monoextruded film. In case of
the coextruded film 100% POP1 (narrow melting point range and a lower melting point), both
heat seal layers maximized the rate of polymer diffusion and chain entanglement between the
layers. Heat seal initiation temperature of all films is the same even though film thickness var-
ied. This may be due to the fact that dwell time and pressure applied are too high at the time of
seating and could not differentiate the values for variable film thickness. It is observed that ul-
timate heat seal strength increases as the film thickness increases. This was because heat seal
strength (lb/in) and hot tack strength (N/in) were normalized by width of the films and not by
the thickness. All films exhibit similar ultimate hot tack values, ranging only from 2.5-3.0
N/in.
CONCLUSIONS
The combination of narrow MWD and CD with LCB of the POPs is shown to have better
processability than a similar melt index LLDPE polymer. Within a given family of
polyolefins, crystallinity generally increases linearly as density increases. Crystallinity in-
creases stiffness at the expense of toughness, permeability and sealability. Controlling
crystallinity and degree and extent of crystalline orientation can alter these properties. DSC
scans confirm that each material (POP1/LLDPE) retains its identity in the coextruded film,
while blended film shows an intimate mixing of both materials. Bimodal resin film shows
high crystallinity, which might affect its flexibility performance.
The monoextruded blend of POP1 40 wt%/ LLDPE 60 wt%, shows somewhat better me-
chanical properties than the coextruded film of same polymers at the same resin ratio, except
“Single-Site” Catalyzed Polyolefin 91

for CO2TR. The bimodal resin film presents a good option, where superior mechanical prop-
erties are required. Permeability of the monoextruded blend and the coextruded film of the
same materials at the same resin ratio appears to be the same. Bimodal resin film with moder-
ate permeability could be used for low respiration rate fresh-cut produce. Overall, all films
had their distinct advantages and disadvantages. The permeability of the package must be
carefully matched to the respiration rate of the fresh-cut produce inside the package. For mod-
erate to low respiration fresh-cut produce, coextruded film would be better than
monoextruded films because of excellent sealing performance. In monoextruded film, bi-
modal resin film could be more useful than POP blends for low respiration rate fresh-cut
produce. For high respiration requirements, coextrusion of a thin layer of LLDPE (provides
modulus) with a thick layer of POP (provides OTR) is an alternative solution.
ACKNOWLEDGMENT
The authors would like to thank Dr. Jeffrey Wooster and the Dow Chemical Co. for supplying
materials & other support.
REFERENCES
1 Peleg, K., Produce Handling Packaging & Distribution, AVI Publishing Co., Inc., CT, 1985.
2 Wooster, J., J. Plastic Film Sheeting, 14, Jan. 1998, pp.77-89.
3 Farber, J., and Dodds, K., Principles of Modified Atmosphere and Sous Vide product Packaging, Technomic
Publishing Co., Inc., PA, 1995.
4 Martinez, F., Mazuera, G., and Parikh, D., J. Plastic Film Sheeting, 6, 1990,44.
5 Deanin, R., Polymer Structure Properties & Applications, Canhers, MA 1972.
6 Krohn, J., et.al., J. Plastic Film Sheeting, 13, 1997, 327-335.
92 Metallocene Technology
Rheology and Processing Experience of New
Metallocene Polyolefins
Atul Khare, Chuan Qin, Michael T. K. Ling, and L. Woo
Baxter International, Inc. Round Lake, IL 60073
INTRODUCTION
The so called metallocene revolution has created new families of polyolefins with unprece-
dented properties. Very high comonomer contents in polyethylenes gives low modulus, high
flexibility and some cases, thermoplastic elastomeric properties. The ability to incorporate
short chain branches homogeneously have created polyethylenes of excellent optical clarity.
This property is very important in medical and food packaging.1 However, due to the high
productivity and homogeneous short chain branching distribution and the very narrow molec-
ular weight distribution, very Newtonian flow curves2 are quite common for these polymers.
A rheological comparison on these polyolefins will be presented and related to actual large
scale processing experiences.
EXPERIMENTAL
Linear viscoelastic studies in the melt were conducted using either a Rheometrics Fluid Rhe-
ometer (RFR) or the Advanced Rheology Expansion System (ARES) in the dynamic mode
with 2.5 cm diameter parallel plate fixtures. Sample thickness of between 1.5 to 2 mm was
used. Frequency range of between 0.1 and 300 radians sec-1 was covered with strain ampli-
tudes of between 10 and 25%, depending on the viscosity of samples. In most cases, before
data were taken, a strain amplitude sweep at 1 Hz was conducted between 1% and 35% to en-
sure that linear response were observed. In selected cases, capillary flow rheometry was also
carried out by an Instron capillary rheometer with a capillary of 25:1 length to diameter ratio.
Processibility studies were conducted on a commercial scale Davids Standard 3.5" sin-
gle screw extrusion line with a barrier screw of 24:1 L/D ratio and tubing fixtures to produce
tubing of about 60 mm OD and 800 µm wall thickness.
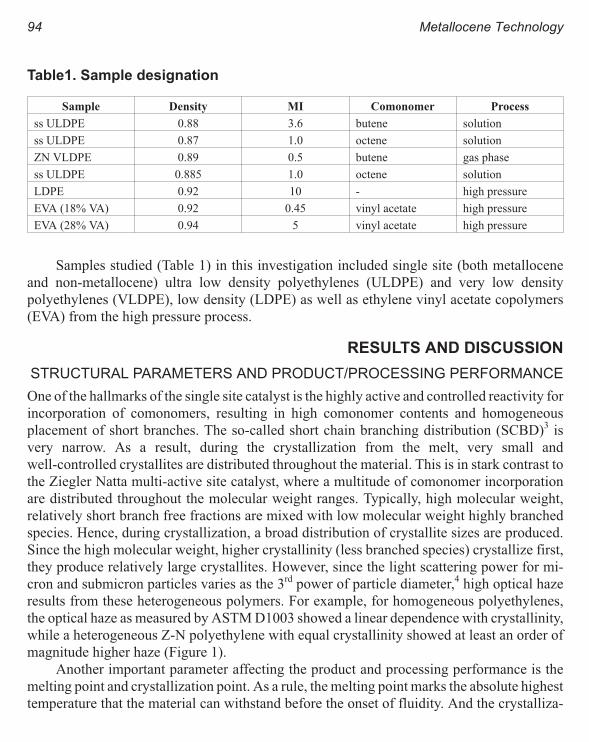
Samples studied (Table 1) in this investigation included single site (both metallocene
and non-metallocene) ultra low density polyethylenes (ULDPE) and very low density
polyethylenes (VLDPE), low density (LDPE) as well as ethylene vinyl acetate copolymers
(EVA) from the high pressure process.
RESULTS AND DISCUSSION
STRUCTURAL PARAMETERS AND PRODUCT/PROCESSING PERFORMANCE
One of the hallmarks of the single site catalyst is the highly active and controlled reactivity for
incorporation of comonomers, resulting in high comonomer contents and homogeneous
placement of short branches. The so-called short chain branching distribution (SCBD)3 is
very narrow. As a result, during the crystallization from the melt, very small and
well-controlled crystallites are distributed throughout the material. This is in stark contrast to
the Ziegler Natta multi-active site catalyst, where a multitude of comonomer incorporation
are distributed throughout the molecular weight ranges. Typically, high molecular weight,
relatively short branch free fractions are mixed with low molecular weight highly branched
species. Hence, during crystallization, a broad distribution of crystallite sizes are produced.
Since the high molecular weight, higher crystallinity (less branched species) crystallize first,
they produce relatively large crystallites. However, since the light scattering power for mi-
cron and submicron particles varies as the 3rd power of particle diameter,4 high optical haze
results from these heterogeneous polymers. For example, for homogeneous polyethylenes,
the optical haze as measured by ASTM D1003 showed a linear dependence with crystallinity,
while a heterogeneous Z-N polyethylene with equal crystallinity showed at least an order of
magnitude higher haze (Figure 1).
Another important parameter affecting the product and processing performance is the
melting point and crystallization point. As a rule, the melting point marks the absolute highest
temperature that the material can withstand before the onset of fluidity. And the crystalliza-
94 Metallocene Technology
Table1. Sample designation
Sample Density MI Comonomer Process
ss ULDPE 0.88 3.6 butene solution
ss ULDPE 0.87 1.0 octene solution
ZN VLDPE 0.89 0.5 butene gas phase
ss ULDPE 0.885 1.0 octene solution
LDPE 0.92 10 - high pressure
EVA (18% VA) 0.92 0.45 vinyl acetate high pressure
EVA (28% VA) 0.94 5 vinyl acetate high pressure

tion point marks the minimum temperature
that a fabricated article- either by extrusion
or injection molding, can begin to assume its
solid shape. In Figure 2, one sees that the ho-
mogenous polyethylene has a monotonic
dependence of melting and crystallization
points with crystallinity. It is quite obvious,
that some of the low crystallinity
polyethylenes pose serious challenges for heat removal during the fabrication process. Like-
wise, the metallocene produced syndiotactic polypropylene (Figure 3) despite the excellent
optical clarity and toughness, exhibits a crystallization temperature of nearly 80oC (Figure 4)
some 40oC lower than conventional isotactic polypropylenes.
RHEOLOGY DEPENDENCE ON STRUCTURE
Yet another characteristic of the single site polyethylene is the narrow molecular weight dis-
tribution (MWD) of around 2. This results in a rather Newtonian flow behavior toward vary-
ing shear rates or frequency. In other words, the viscosity versus shear rate curve is rather flat.
Rheology and Processing 95
Figure 1. Homogeneous PE optical haze vs. crystallinity. Figure 2. Homogeneous PE melting, crystallization point.
Figure 3. Metallocene syndiotactic polypropylene.
Figure 4. Syndiotactic PP crystallization.

For broad MWD materials, the low shear or shear independent viscosity h0 depends on the
weight average molecular weight Mw for equal Mn. Hence, a rather high h0 can be obtained.
While at high shear rates, the low end of the molecular weight distribution becomes dominant
resulting in a reduction in the apparent viscosity - hence a highly non-Newtonian behavior.
Although the Newtonian behavior is desirable for controlling the melt relaxation times, im-
portant for processes like fiber spinning, for melt extrusion and injection molding the reduced
shear thinning leads to excessive back pressure and reduced production rates. In addition, the
excessively high shear stresses at production could also lead to melt fracture and other flow
instabilities, causing drastic reductions in production speed.
Certain single site polyethylene, due to their catalyst’s steric control and high activity,
can contain low levels of long chain branching (LCB). The existence of long chain branching
can benefit the flow behavior in two ways:
1 LCB tends to make the molecule more compact for equal molecular weights,
and hence more shear thinning at higher shear rates.
2 In an analogous situation with high pressure polymerized low density PE
(LDPE), a greater sensitivity of viscosity toward temperature is seen. This higher
temperature dependence as measured by Arrhenius activation energy, can make
the melt more “forgiving” during fabrication.
In Figure 5, for clarity we compare a selected subset of our samples in terms of shear
thinning behavior. It can be clearly seen that a narrow MWD 3.6 MI single site PE in the ab-
sence of LCB was very Newtonian indeed. In comparison, a 1.0 MI, still narrow MWD single
site PE exhibited higher Newtonian viscosity proportional to the MI, but crossover the 3.6 MI
96 Metallocene Technology
Figure 5. Rheology comparison. Figure 6. Flow activation energies.

line to achieve lower viscosity at higher fre-
quencies. However, the most dramatic
difference lies with a high pressure polymer-
ized EVA with 0.45 MI. The presence of both
LCB and broad MWD allowed a much higher
low shear viscosity, or in processing terms,
“melt strength,” or “melt tension,” while main-
taining a high shear viscosity equal or even
lower than the two previous examples. The high low shear viscosity and the shear sensitivity
frequently results in a strain hardening behavior when the elongational viscosity is measured,
leading to much greater bubble stability in blown film and better parison strength in extrusion
blow molding.
Figure 6 shows the Arrhenius plot for several of the samples. It is generally seen that
long chain branched (LCB) samples exhibiting higher activation energies. Table 2 tabulates
the measured activation energies.
MELT INSTABILITIES DURING PROCESSING:
Earlier, we stated that narrow MWD long chain branched polyethylenes possesses shear thin-
ning behavior intermediate between the narrow distribution without LCB and the high pres-
sure counter parts with both broad MWD and LCB. In a large scale processing trial, we
compared the maximum output rates (linear line speed) of a tubing extrusion line up to the on-
set of melt instability. For comparison purposes, a commercial PVC TygonTM tubing’s surface
Rheology and Processing 97
Table 2. Activation energies
Material LCB ∆H, kcal/mole
LDPE Y 10.8
18% EVA Y 12.6
28% EVA Y 11.1
0.88 C4Sol. N 7.5
0.89 C4Gas N 6.9
0.87 C8Sol. Y 9.8
Figure 7 TygonTM tubing surface.
Figure 8. ULDPE tubing surface.

morphology was used (Figure 7). At equal
production line speed of flexible PVC, the
0.885 density 1 MI resin exhibited visible
outer surface irregularities (Figures 8 and 9).
Fortunately, the interior surface, due to the
somewhat reduced shear rates, showed a
much smoother appearance (Figure10). This
combination of considerable external rough-
ness and smooth interior surface qualifies
the tubing from a production rate consider-
ation, although marginally. An additional
comment is during typical medical tubing
production, special surface texturing is applied to roughen the surface for better handling
(Figure 11). Hence, the ULDPE rough surface caused by melt instability is quite acceptable,
so long the overall tubing dimension can be maintained.
CONCLUSIONS
A broad based rheology and processing study was conducted on a series of single site and
metallocene polyethylenes using high pressure LDPE and EVA as references. Confirming to
what had been widely reported, the single site polymers with narrow molecular weight distri-
bution and very Newtonian flow curves were significantly more difficult to process. Dra-
matic lowering of the melting and crystallization points also posed heat removal challenges.
Incorporation of long chain branching (LCB) increased shear thinning and the Arrhenius acti-
98 Metallocene Technology
Figure 9. High rate ULDPE surface. Figure 10. ULDPE interior surface.
Figure 11. Textured PVC tubing exterior surface.
vation energy of flow. Both factors helped to improve processibility sufficiently to be condi-
tionally acceptable, but still inferior to that of the high pressure polymers like LDPE and
EVA. It appears further tailoring of the molecular weight distribution would be required for
processibility improvements.
REFERENCES
1 L. Woo, T. K. Ling, S.P. Westphal, Proc. Polyolefins VIII Intl. Conf. (Houston), 242, (1993).
2 S. H. Wasserman, Soc. Plas Eng. ANTEC Proc. 1129, (1997).
3 L. Wild, T. R. Ryle, D. C. Knobelloch, I. R. Peat, J. Polym. Sci. Phys., 20, 441, (1982).
4 C. B. Bucknall, Toughened Plastics, Applied Science, London, (1977).
Rheology and Processing 99

Properties and Film Applications of
Metallocene-Based Isotactic Polypropylenes
Aiko Hanyu and Rusty Wheat
Fina Oil and Chemical Company, Deer Park, TX
INTRODUCTION
Polypropylene metallocene technology allows molecular engineering that can control
MW/MWD (molecular weight/MW distribution), various CC/CCD (comonomer composi-
tion/CC distribution), stereochemistry and stereoregularity.1 All of these aspects of molecular
structure control crystallizability, degree of crystallinity and morphology, which in turn influ-
ence processability and define final properties of end-use products. Because most of these
molecular parameters do vary simultaneously with the structure of the metallocene catalyst
system,2 it becomes critical to understand the general relations among catalyst structure,
polymerization mechanism, molecular structure, morphology, and processing to design ulti-
mate end use properties.
Polypropylenes produced by the metallocene technology are expected to provide com-
petitive properties over the conventional Z-N product.1 Fina recently presented3 high-MW
miPPs which showed resin characteristics unique to the metallocene product, including low
xylene solubles level, low MWD, low DSC melting point, etc. In the BOPP film application,
the miPP oriented film demonstrated enhanced properties in terms of stiffness, COF, and
permeabilities to water vapor and oxygen, as well as satisfactory optical properties. This pa-
per presents more results from additional miPP products in both the BOPP and cast film
applications.
Highly isotactic polypropylenes are a result of the predominant head-to-tail addition
(1-2 insertion) of propylene monomer units, where methyl groups always have the same con-
figuration with respect to the polymer backbone. A disruption of the long isotactic sequences
creates a stereo defect, which lowers the isotacticity. The 2-1 insertion is a type of stereo de-
fects resulting of the head-to-head insertion of propylene monomers, which leads to a

sequence of two adjacent methyl groups and two CH2
groups shown in Figure 1.2 The 2-1 insertion defects
are present only in certain miPPs, but not in Z-N iPPs.3
The significant melting point depression ob-
served in the miPPs3 might be inherent to the
distribution of the 2-1 insertion defect among
chains.2,4 The occasional 2-1 insertion defects may be-
have somewhat in the manner of random ethylene
propylene copolymers where ethylene units in the chain function as the main defects. As for
copolymer,5 it may be understood that the decrease in melting point results from a distortion,
caused by a defect, of the propylene helix and that this distortion is excluded from the
lamellar crystallite, which consequently reduces the thickness of the lamella and thus lowers
the melting point. Since the mechanical and thermal properties of the final products are
closely related to the molecular structural homogeneity of the resins, it is valuable to charac-
terize the defects sequence distribution.6 This is attempted in this work using a segregation
fractionation technique based on a stepwise isothermal crystallization by DSC7 to make a
comparable study of the heterogeneity in defect unit distribution between the standard Z-N
and metallocene iPPs.
EXPERIMENTAL
MATERIALS
The resin characteristics of
the representative samples
employed here are summa-
rized in Table 1. The sample
labels STD and HCP stand
for standard and high
crystallinity polypropylene
produced by Z-N catalyses,
respectively. The MET
stands for miPPs and
METC for metallocene co-
polymers. The suffix de-
notes melt flow rate (MFR)
of a specific sample. All the
resins were produced on the
Fina’s commercial lines.
102 Metallocene Technology
Figure 1. Schematic presentation of 2-1 insertion
defect in isotactic propylene homopolymer.2
Table 1. Sample characterization of Z-N and
metallocene iPP products
Sample STD-3 HCP-2 MET-3 MET-6 METC-5
MFRa 2.7 1.9 3.3 5.5 5.0
XSb 4.5 0.7 0.2 0.3 0.7
C2c 0 0 0 0 0.5
mmmmd 94.7 97.3 96.3 94.0 -
racemicd 1.5 0.2 0.7 1.5 -
2-1 ins.d 0 0 1.0 0.6 -
ZSVe 6.1 9.9 4.1 3.2 2.9
Jorf 4.4 3.6 1.6 1.7 1.3
Mw/Mng 6.5 7.3 3.0 3.9 3.3
Tm2h 160 163 151 150 148
Tch 107 111 108 109 107
Notes: a - MFR in g/10 min, b - xylene solubles in wt%, c - ethylene in wt%, d - by 13C
NMR for the xylene insolubles fraction in mol%, e - zero shear viscosity by rheometry
@ 210oC in x103 Pa-s, f - recovery compliance in x10-4 Pa-1, g by GPC, h - DSC melting
and recrystallization peaks in oC with heat/cool rates of 10oC/min.
The miPPs exhibit characteristics, such as low xylene solubles level, narrow MWD, low re-
covery compliance (J0r), presence of 2-1 insertion defect, and low DSC melting point.
DSC AND SIST
All the DSC runs were obtained using a Perkin Elmer DSC-7 apparatus under nitrogen. Two
DSC procedures were employed. Method A was a common one, where a weighed sample was
melted at 210oC for 5 min and then cooled at 10oC/min to 50oC, subsequently heated at
20oC/min up to 190oC to obtain the melting endotherm. Method B was a stepwise isothermal
segregation technique (SIST),6-8 where a weighed sample was first melted at 210oC for 20
min and then quenched to the highest temperature to be crystallized isothermally. Subse-
quently, the sample was subjected to isothermal crystallization successively at intervals of
5oC over its melting range. The time for each step of isothermal crystallization was about 9-10
h. In the present set of experiments the temperatures of isothermal crystallization were
155-135oC and 100oC for 0.5 h for Sample MET-3, and 175-135oC for Sample STD-2. At
last, the cooled sample was heated at 20oC/min and the endotherms were recorded as for
Method A. The endotherms were normalized by sample weights.
LABORATORY BOPP FILM PROCESS
The sample resins were first extruded on a 1.25" (3.2 cm) extruder and casted into sheets of
4.1 mm. The standard extrusion parameters were modified for the miPPs by lowering the melt
temperature and screw speed by approximately 18oC and 17%, respectively. Subsequently, si-
multaneous-biaxial orientations were carried out on a laboratory scale film stretcher,
TMLong®. Each sheet was normally stretched to four times of its original dimension at a con-
stant rate of 5 cm/s. The draw temperature was varied. Outputs of force vs. time (or stress vs.
strain) data were collected and processed for analyses.
BOPP FILM PROCESS
The BOPP film processing was conducted on a 60" (1.5 m) continuous pilot tenter line. The
sample resins were subjected to biaxial orientation procedures in two sequential steps. The
draw ratio was five first in the machine direction (MD) and then eight in the transverse direc-
tion (TD) to produce a monolayer film of 18µm. Properties of the BOPP films were evaluated
according to ASTM procedures and listed in Table 2.
CAST FILM PROCESS
The miPP resins were extruded on a 3.5" (8.9 cm), 32:1 L/D extruder and cast into films of
0.05 mm at approximately 215oC melt, 260oC die and 16oC cast roll temperatures, and at 30.5
m/min line speed. The melt temperature of the standard iPP resins was kept at 230oC. Prop-
erties of the cast films were evaluated according to ASTM procedures and listed in Table 3.
Properties and Film Applications 103
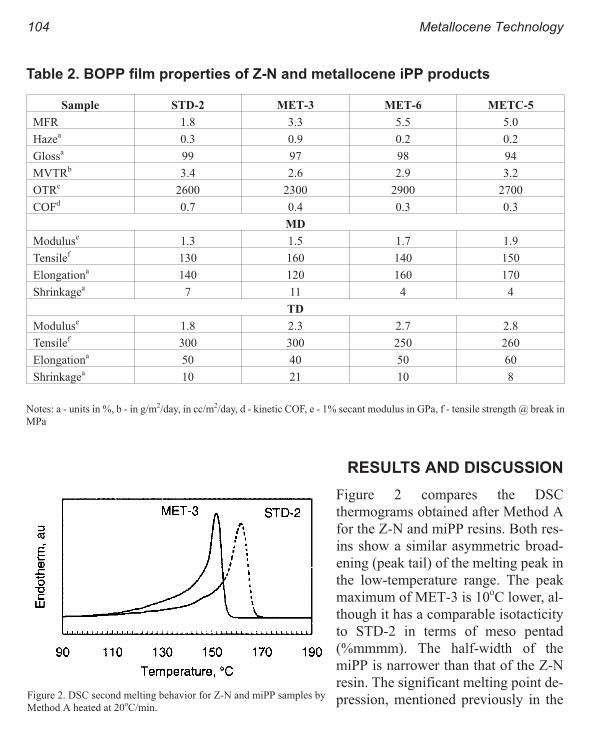
RESULTS AND DISCUSSION
Figure 2 compares the DSC
thermograms obtained after Method A
for the Z-N and miPP resins. Both res-
ins show a similar asymmetric broad-
ening (peak tail) of the melting peak in
the low-temperature range. The peak
maximum of MET-3 is 10oC lower, al-
though it has a comparable isotacticity
to STD-2 in terms of meso pentad
(%mmmm). The half-width of the
miPP is narrower than that of the Z-N
resin. The significant melting point de-
pression, mentioned previously in the
104 Metallocene Technology
Table 2. BOPP film properties of Z-N and metallocene iPP products
Sample STD-2 MET-3 MET-6 METC-5
MFR 1.8 3.3 5.5 5.0
Hazea 0.3 0.9 0.2 0.2
Glossa 99 97 98 94
MVTRb 3.4 2.6 2.9 3.2
OTRc 2600 2300 2900 2700
COFd 0.7 0.4 0.3 0.3
MD
Moduluse 1.3 1.5 1.7 1.9
Tensilef 130 160 140 150
Elongationa 140 120 160 170
Shrinkagea 7 11 4 4
TD
Moduluse 1.8 2.3 2.7 2.8
Tensilef 300 300 250 260
Elongationa 50 40 50 60
Shrinkagea 10 21 10 8
Notes: a - units in %, b - in g/m2/day, in cc/m2/day, d - kinetic COF, e - 1% secant modulus in GPa, f - tensile strength @ break in
MPa
Figure 2. DSC second melting behavior for Z-N and miPP samples by
Method A heated at 20oC/min.

Introduction section, might be inherent to the
presence of 2-1 insertion defect. It implies
that the miPPs tend to crystallize the thinner
lamellae and/or less perfect crystallites. The
narrow half-width might come from the nar-
row distributions of the 2-1 insertion and
racemic defects. It is noted that for phenom-
ena of melting peak depression the MWD ef-
fect, i.e., chain ends as defects, can be
ignored in the range of MW over 10,000
g/mol.8
The thermograms according to Method
B (SIST) are presented in Figure 3 for the
miPP and Z-N samples. The miPP is resolved to have three endotherms, whereas only a single
melting peak for the Z-N iPP. The miPP might have possibly more peaks by conducting the
isothermal crystallization in the wider temperature range. The three peaks formed represent
Properties and Film Applications 105
Table 3. Cast film properties of Z-N and metallocene iPP products
Sample STD-8 MET-6 MET-9 MET-14 METC-5
MFR 7.9 5.5 9.4 13.7 5.0
Hazea 4.6 2.0 1.2 0.4 1.8
Glossa 59 75 79 81 77
Impactb 440 460 410 440 440
MD
Modulusc 480 520 500 560 480
Tensiled 46 44 36 40 47
Elongationa 760 710 690 760 750
Teare 77 98 85 120 94
TD
Modulusc 480 530 500 570 480
Tensiled 34 36 35 38 35
Elongationa 830 830 820 820 830
Teare 280 220 190 180 230
Notes: a - units in %, b - dart drop impact in g, c - 1% secant modulus in MPa, d - tensile strength @ break in MPa, e - Elmendorf
tear strength in g
Figure 3. DSC melting endotherm for Z-N and miPP samples
by Method B (SIST) heated at 20oC/min.

distinct families of homogeneous
macromolecules in defect type, composition
and distribution. Each family forms lamellar
crystallites of different thickness and inter-
nal perfection.6,7
The single melting peak appearing at
above 165oC for both the samples seems to
be the monoclinic α crystal form, which is
thermodynamically most stable and com-
mon in iPP.9,10 The miPP appears to have
less than a half of the a phase with the nar-
row distribution in thickness. The Z-N resin
indicates only the α form iPP with the broad
distribution in thickness. The complication of multiple endotherms is not observed, which of-
ten arises in iPPs from various effects, for the ZN resin because it has high MW and tacticity
and because of the Method B conditions including high crystallization temperatures and long
crystallization time.11
The lower melting endotherms, only showing in the miPP, can arise from: different poly-
morphic forms such asβ, discrete morphological population of theα form but differing in size
and perfection, or segregation effects by tacticity and defect distribution.11 Nevertheless, the
lower endotherms of the miPP are probably due to the unique presence of the 2-1 insertion de-
fect. It is interesting that a distinct peak of about 150oC is at the proximity of the
pseudo-hexagonal β crystal form, which is usually found in iPPs that have been subjected to
high orientation or deformation in the melt.9 This crystal structure will be investigated in the
future. It is postulated that the miPP is effective for crystallization in the lower melting phase
due to the presence of 2-1 insertion defect.
Figure 4 shows the first melting behavior of BOPP films scanned at 20oC/min for the
miPP and Z-N samples. Multiple endotherms are observed for the both film samples. These
endotherms, drawn at above 130oC to a greater degree of extension, may stem from the exis-
tence of distinct crystalline species with different levels of crystal disorder, crystal sizes,
crystal forms or morphological forms.12 In each film, the double peaks at higher temperatures
are associated with the α crystal form with various degrees of crystal disorder and/or crystal
sizes.9 The miPP film seems to have the thinner lamellae with the less perfect crystallites than
the Z-N iPP. The small crystalline size of the miPPs may be associated with the superior opti-
cal properties in quenched film applications to be discussed below. The higher melting points
above that of the isotropic one (2nd melting) for each film imply to the higher degrees of crys-
tal order and size due to the orientation. The lowest endotherm at about 155oC in the Z-N film
106 Metallocene Technology
Figure 4. DSC first melting behavior for the BOPP films of Z-N
and miPP resins heated at 20oC/min.

sample may be assigned to the β form com-
mon in the highly deformed iPPs.9 Although
the highly oriented miPP has a significantly
high fraction of the phase at 150oC, the βform is not detected using WAXS (wide an-
gle x-ray scattering).
The BOPP processability can be corre-
lated to the stress vs. strain behaviors
obtainable using a laboratory scale film
stretcher.13,14 The effect of draw temperature
on the yield stress is shown in Figure 5. The
yield stress decreases linearly with increas-
ing temperature. The gradual slopes and
wider draw temperature range imply a good processing window. The yield stress is lower for
all the miPPs at a given draw temperature. At an equivalent yield stress, the mJPPs require ap-
proximately 5-10oC lower draw temperature than the standard Z-N iPPs. This may be applied
for a tenter frame process to control oven temperatures.
Figures 6 and 7 compare stress-strain curves for the three samples selected from Figure 5
at an equivalent yield stress and at the same draw temperature. Each sample deforms by a pro-
cess of yielding, neck elongation and strain hardening. The miPPs yield rather rapidly
compared to the gradual transformation of the standard ZN iPPs. For the yielding behavior,
the miPPs are very similar to the high crystallinity iPP sample attributing to their high
isotacticity. MET-3 noticeably exhibits an earlier onset and sharp increase in strain harden-
Properties and Film Applications 107
Figure 5. Effects of temperature on yield stress for Z-N and
metallocene products.
Figure 6. Biaxial stretching curves for samples selected from
Figure 5 with comparable yield stress.
Figure 7. Biaxial stretching curves for samples selected from
Figure 5 at draw temperature of 138oC.

ing. The earlier strain hardening and higher growth rate as well as the lower yield stress may
relate to the relatively high fraction of the low melting species observed in the DSC
thermograms. The high fraction of these low melting species of the miPP is largely crystalline
in the MD orientation in the BOPP process, but it is much less crystalline at tenter oven condi-
tions and may reduce the draw stresses required.14 This high strain hardening effect may
result in the enhanced film properties such as stiffness, COF and barrier discussed below.
Results of the BOPP and cast film properties are listed in Table 2 and 3, respectively. For
the cast films, the miPPs show high MD tear strengths and superior optical properties to the
Z-N iPP. The miPP homopolymers have a high stiffness. NMT-14 exhibits significantly im-
proved overall properties. For the BOPP films, the miPPs show significant improvements in
stiffness, COF, and MVTR (moisture vapor transmission rate), while satisfactory in optical
properties. MET-3 exhibits a very low OTR (oxygen transmission rate). Optimizing process
conditions would further enhance these film properties. The benefits of these properties have
been described in the previous paper,3 such as for a longer shelf-life of packaged foods, better
down-stream handling, aesthetic appeal, down gauging, etc.
CONCLUSIONS
The DSC fractionation method gives possibilities to miPPs for identification of distinct fami-
lies of molecular species. There are at least three families of species in the miPP examined
here. It is postulated that the miPP is effective for crystallization in the lower melting phase
due to the presence of 2-1 insertion defect, which is not present in the Z-N iPPs. The high frac-
tion of the lower melting species might explain behaviors of BOPP processing and superior
film properties demonstrated in the cast and BOPP film applications.
ACKNOWLEDGMENTS
We owe special thanks to Ben Hicks for his work of the cast film and TMLong® pro-
cesses, and Rebecca Davis for the DSC measurements. We acknowledge Fina Oil and
Chemical Company for the support and approval to publish this paper.
REFERENCES
1 Metallocene Polypropylene 1995, Phillip Townsend Associates Inc., Houston, TX, 1995.
2 K. Hungenberg, J. Kerth, F. Langhauser, H. Muller, and P. Muller, Makromol. Chemie, 227, 159 (1997).
3 R. Wheat and A. Hanyu, SPO ‘97 (1997).
4 K. Hungenberg, J. Kerth, F. Langhauser, B. Marczinger, and R. Schlund, Ziegler Catalysts, G. Fink, R. Mulhaupt, and
H. H. Brintzinger, ed., Springer Verlag, Heidelberg, 363 (1995).
5 H. J. Zimmermann, J. Macromol. Sci., B32, 141 (1993).
6 E. Adisson, M. Ribeiro, A. Deffieux, and M. Fontanille, Polymer, 33, 4337 (1992).
7 P. Starck, Polymer International, 40, 111 (1996).
8 T. Kamiya, N. Ishikawa, S. Karnbe, N. Ikegami, H. Nishibu, and T. Hattori, ANTEC ‘90, 871 (1990).
108 Metallocene Technology

9 S. Vleeshouwers, Polymer, 38, 3213 (1997).
10 A. J. Ryan, J. L. Stanford, W. Bras, T. M. W. Nye, Polymer, 38, 759 (1997).
11 R. A. Phillips and M. D. Wolkowicz, Polymer Handbook, E. P. Moore, Jr., ed., Hanser, Munich, 1996.
12 R. J. Yan and B. Jiang, J. Polym. Sci. Polym. Phys., 31, 1089 (1993).
13 E. K. Bullock and W. W. Cox, TAPPI ‘95, 571 (1995).
14 W. W. Cox and E. K. Bullock, Polyolefins RETEC’97, 397 (1997).
Properties and Film Applications 109
Phase Structure Characterization and
Processing-Structure-Property Relationships in
Linear Low-Density Polyethylene Blown Films
Jianjun Lu, Baiyi Zhao and Hung-Jue Sue
Polymer Technology Center, Department of Mechanical Engineering, Texas A&M Univer-
sity, College Station, TX 77843-3123
INTRODUCTION
Processing-structure-property (P-S-P) relationships in polyethylene (PE) blown films have
been studied for more than four decades. The purpose of such study is to enable the manufac-
turers to predict the processing conditions required for achieving certain film properties for a
certain PE resin. Although there is a wealth of knowledge generated by the polyolefins indus-
try related to the production of PE blown films, this wealth of knowledge is largely based on
empirical and semiempirical relationships established for known systems. When the
polyolefin structure is altered, the pre-existing empirical or semi-empirical knowledge is no
longer valid. The fundamental understanding concerning how to relate the molecular struc-
ture and processing condition to the morphology and properties of blown films is still lacking.
In film blowing process, the primary molecular parameters, such as molecular architec-
ture, molecular weight and its distribution, and processing condition can all affect film
morphology. The morphological structure of film, in turn, determines the final film proper-
ties. Therefore, the characterization of film morphological structure is crucial for the
understanding of P-S-P relationships.
It is known that a semi-crystalline polymer consists of crystalline, crystal-
line-amorphous interfacial and amorphous regions. The tubular film blowing process is
characterized by a very complex structure formation caused by different parallel crystalliza-
tion and orientation processes.1 The resultant film morphology is very different from that of
bulk material. Much research has been done on the morphological characterization of PE
blown films. In 1954, Keller2,3 proposed that the crystal b-axis in PE blown films has a pre-

ferred orientation perpendicular to the machine direction (MD) while the a- and c-axes are
randomly distributed with cylindrical symmetry. He also raised a concept of row orientation
in which the crystalline lamellar overgrowth occurs epitaxially from the c-axis oriented fibrils
with radial growth in the b direction and the a- and c-axes rotating about that growth direc-
tion. Using the method of pole figures for HDPE extruded films, Lindenmeyer and Lustig
found support for the row structure.4 In 1967 Keller and Machin5 further modified the model
of “row nuclei” based on the level of stress for both LDPE and HDPE extruded films. Accord-
ing to the modified model, two major crystallizations take place depending upon the
magnitude of the stress in the melt, namely “low-stress” and “highstress” crystallizations.
They suggested that the row nucleated structure is similar to the “shish-kebabs” crystallized
from the stirred solution state.
In the 1970’s, Maddams and Preedy published a series of papers based on a very exten-
sive texture investigation on very different HDPE blown films.6-8 Noticeably, they found an
additional orientation maximum of b-axis in the normal direction (ND) connected with a
transcrystalline portion of material. The finding of the transcrystallization process was con-
firmed by Eby,9 Fitchmun and Newman.10
Choi, Spruiell and White11 used WAXS, SAXS and birefringence to characterize films
fabricated under conditions ranging from uniaxial to biaxial extension, with concurrent mea-
surement of the machine direction and transverse direction (TD) stresses at the frost line.
They proposed morphologies consisting of local lamellar stacks with a distribution of stack
orientations that is determined by the MD/TD stress balance at crystallization.
Although the crystalline morphology characterization led to a great improvement in the
understanding of the morphological structure of PE blown films, knowledge about the crys-
talline phase is not sufficient for making a structure-property correlation. The effect of the
structure of noncrystalline phase on film properties is also very significant. Although the
noncrystalline phase is composed of a noncrystalline interfacial region with limited molecu-
lar mobility and a rubbery amorphous region with high molecular mobility, the PE blown
films in most previous studies were just treated as composites of crystalline lamellae and
amorphous material. There are a few publications concerning amorphous phase orientation in
PE blown films.12-14 Some researchers utilized solid-state NMR15,16 and Raman17,18 spectros-
copy to study noncrystalline interfacial region in bulk crystallized and/or solution crystallized
polyethylene samples. However, not enough attention has been given to the characterization
of crystalline-amorphous interphase in the films.
The previous investigations on polyethylene blown films were mainly carried out on
high-density polyethylene (HDPE), due to its simplicity of molecular architecture. Neverthe-
less, the blown films based on LLDPE give improved transparency and mechanical
properties. Moreover, recent developments of new catalysts (metallocene catalysts) and pro-
cesses enable producers to exercise greater control over short chain branching distribution
112 Metallocene Technology

and molecular weight distribution. At this stage, no extensive morphological investigation
has been performed on LLDPE blown films as on HDPE ones.
As part of a larger effort to investigate P-S-P interactions in polyethylene blown films,
this study chose two LLDPE blown films made under different processing conditions. Mor-
phology investigation was carried out using solid-state NMR, DSC, TEM, and IR dichroism.
Morphological features are then correlated with the mechanical properties and processing
condition.
EXPERIMENTAL
MATERIALS
Two LLDPE blown films (Films A and B) were provided by Phillips Petroleum Company.
The resin has a density of 0.922 g/cm3 and a melt index of 0.22 g/10 min. The thickness of the
films is around 25 µm. Film A was made by using a conventional bubble geometry for
LLDPE (i.e., a low stalk bubble configuration), while Film B was blown by using a high stalk
bubble configuration.
SOLID-STATE NUCLEAR MAGNETIC RESONANCE SPECTROSCOPY1H diplor-decoupling/magic-angle spinning 13C NMR measurements were carried out at
room temperature on a MSL-300 spectrometer operating at a field strength of 7.0 T. Each
sample was packed into a 7 mm diameter zirconia rotor. The magic angle spinning was per-
formed at 4.4 to 4.6 kHz. 13C NMR chemical shifts were expressed as values relative to
tetramethylsilane (Me4Si). 13C NMR spin-lattice relaxation time (T1) was measured by inver-
sion recovery pulse sequence with cross-polarization. The recycle delay for T1 measurement
was 2500 s and the number of scans per spectrum was 8. 13C NMR spin-spin relaxation time
(T2) measurement was performed by spin-echo pulse sequence. The recycle delay for T2 ex-
periment was 2 s.
DIFFERENTIAL SCANNING CALORIMETRY
The DSC experiments were performed on a Perkin Elmer Pyris-1 differential scanning calo-
rimeter. Each experiment includes 3 steps: 1) temperature scan from -30oC to 180oC at a heat-
ing rate of 10oC/min; 2) cooling from 180oC to -30oC at a cooling rate of 20oC/min; and 3)
repeating the first step. A sample weight ranging from 7 to 10 mg was used.
TRANSMISSION ELECTRON MICROSCOPY
Samples for TEM study were embedded in an epoxy and cured overnight at room tempera-
ture. The blocks were trimmed, faced-off, and then stained with RuO4. Ultra-thin sections,
ranging from 60 to 80 nm, were obtained using a Reichert-Jung Ultracut E microtome with a
Phase Structure Characterization 113

diamond knife. The thin sections were placed on 100-mesh Formvar-coated copper grid and
examined using Zeiss-10C TEM operating at an accelerating voltage of 100 kV.
INFRA-RED DICHROISM
A Nicolet Avatar 360 FTIR equipped with a polarizer was used to determine IR dichroism.
The absorption bands at 730 and 719 cm-1 were employed to evaluate the orientations of crys-
tal a-axis and b-axis, respectively. The spectral separation procedure described by Kissin19
was utilized to obtain the real absorbances from the measured absorbances of the bands. A
dichroic ratio (D) was taken as the ratio of the absorbance measured with radiation polarized
in MD to that with radiation polarized in TD. The method developed by Read and Stein20 was
used to approximate the orientation functions of crystal axes a and b, fa and fb, respectively,
from the dichroic ratios. Once fa and fb are obtained, fc can be calculated since the sum of fa, fb,
and fc must be zero.
RESULTS
CRYSTALLINE AND NONCRYSTALLINE CONTENTS
The weight percentage crystallinity of the PE films was obtained from DSC by comparing the
heat of fusion with 100% crystalline polyethylene heat of fusion of 293 J/g.21 From the
solid-state 13C NMR spectra, the crystalline, interfacial and rubbery phase contents in the
blown films can be resolved by using the method described by Horii et al.15 The crystalline
and noncrystalline content data obtained on DSC and solid state NMR are summarized in Ta-
ble 1.
LAMELLAR THICKNESS DISTRIBUTION
In principle, DSC melting endotherms can be used to calculate the lamellar thickness distri-
bution. In this study, a DSC profile (heat flow versus temperature) is converted into a lamellar
thickness distribution curve (relative probability of the weight percentage of lamellae versus
lamellar thickness) by using the Gibbs-Thomson equation.22 The lamellar thickness distribu-
tion curves are shown in Figure 1.
For each film, several independent DSC tests were performed. It is found that the shape
of melting peak upon the first temperature scan, thus the lamellar thickness distribution in the
film, varies significantly from test to test, although the heat of fusion stays constant. After the
specimen was cooled to -30oC again, the second temperature scan was performed. The second
scans, give melting peaks with the same shape in all tests on both films. This is due to that the
thermal history in the original films was eliminated upon the first melting. This also indicates
that the variation of melting peak shape upon the first temperature scan is not an experimental
error, and the morphological structure is not uniform in the films. However, it is interesting to
114 Metallocene Technology

Phase Structure Characterization 115
Table 1. Morphological parameters and mechanical properties of films A and B
Film A Film B
Crystalline content, DSC 46 46
Crystalline content, NMR 59 52
Interfacial content, NMR 24 32
Amorphous content, NMR 17 16
D730 1.852 1.405
D710 0.317 0.580
fa 0.221 0.119
fb -0.294 -0.162
fc 0.073 0.043
MD tensile modulus, MPa 144.4 @ 1% 102.8 @ 1%
TD tensile modulus, MPa 226.2 @ 1% 102.8 @ 1%
MD Elmendorf tear, g 14 81
TD Elmendorf tear, g 666 480
Dart impact resistance, g 53 341
Figure 1. Lamellar thickness distribution curves obtained from DSC: (a) and (b) are from two independent tests on Film A; (c)
and (d) are from two independent tests on Film B.

note that each of these melting
peaks is seemingly composed of
two overlapped peaks with dif-
ferent peak temperatures. The
magnitudes of these two peaks
vary, but the sum of the two is
relatively constant. Since each
melting temperature corre-
sponds to a lamellar thickness, it
appears that there exists a bi-
modal lamellar thickness
distribution.
CRYSTALLINEORIENTATION
Figures 2a-2b are TEM micro-
graphs taken in the MD-ND
plane of Films A and B. It is
clearly shown that Film A pos-
sesses a significant higher
lamellar orientation than Film
B. Film B exhibits a rather ran-
dom crystalline texture, but a
lamellar orientation with the
lamellar normal preferentially
aligned with MD can still be ob-
served.
The IR dichroic ratios and
calculated orientation functions
are listed in Table 1. IR
dichroism results suggest that
the crystallites in Film A are
more orientated than in Film B.
This result is consistent with the
TEM result.
116 Metallocene Technology
Figure 2. TEM micrographs of (a) Film A and (b) Film B.

DISCUSSION
High stalk bubble configuration is somehow novel for LLDPE film blowing as it is normally
used for HDPE blown films. The region between the die face and the stalk (bubble expansion
zone) provides a region of low elongation rate in which a portion of the MD orientation intro-
duced in the die can be relaxed.23-25 A higher stalk height gives a longer time for orientation
relaxation, thus less MD orientation is “frozen” into the final blown films. This is the reason
why Film A possesses a higher chain backbone orientation (c-axis orientation, fc) than Film
B.
The use of the high stalk bubble configuration has another effect on the crystallization
and orientation processes. For this bubble configuration, the film blowing process is divided
into two distinct deformation regimes,25 namely, a nearly planar extension in the stalk and a
biaxial stretching in the bubble expansion zone. In the stalk region, a significant portion of
MD stretching takes place, and the bubble diameter decreases (neck-in).26 Consequently, the
magnitude of TD strain from the neck to the frost line can be much larger than the overall
blow-up ratio, and the overall MD/TD stretch ratio becomes closer to 1. So, Film B has a
more random lamellar orientation compared with Film A.
For convenience, some film mechanical properties obtained from the manufacture are
also listed in Table 1. From the table, we can see that tear resistance can be correlated with the
chain orientation. The crystal c-axes in both films are preferentially oriented in MD. This re-
sults in a larger Elmendorf tear strength in TD for both films. As the c-axis orientation in Film
B decreases, the difference between the tear strengths in MD and TD decreases. This may be
why Film B has a higher dart impact resistance than Film A, since the dart drop impact resis-
tance is believed to be related to the balance of mechanical properties between MD and TD.
The effect of crystalline orientation on Young’s modulus can be well illustrated by the
“laminated composite” model.27 Considering a film in which crystalline lamellae are uniaxi-
ally oriented with lamellar normal preferentially aligned parallel to MD, it can be viewed as a
“laminated composite” of a hard crystalline phase and a soft amorphous phase stacked along
MD. If the film is stretched in MD, the material can be considered as the composite being de-
formed in an isostress pattern; therefore, the modulus is dominated by that of the soft
amorphous phase. On the other hand, if the film is stretched in TD, the material can be consid-
ered as the composite being deformed in an isostrain pattern; therefore, the modulus is
dominated by that of the hard crystalline phase. However, the modulus difference between
the two films in this work can hardly be explained in terms of crystalline orientation, because
film A has a higher modulus than Film B in both MD and TD. This leads us to consider the ef-
fect of crystallinity.
Phase Structure Characterization 117

Surprisingly, the crystalline contents measured by DSC are same for the two films. Simi-
lar results were obtained on some HDPE blown films made from the same resin, but which
differ by bubble stalk height.28 However, the solid-state NMR results show a significant dif-
ference between the two films in terms of crystalline and interfacial contents. Film A has a
higher crystalline content and a lower interfacial content than Film B. The rubbery contents in
these two films are similar. The higher modulus of Film A seemingly can be attributed to its
higher crystalline content.
It is worthwhile to mention that DSC and solid-state NMR rely on different principles to
measure the crystalline and noncrystalline contents. While DSC measures the energy re-
quired to destroy the order in crystalline phase, NMR distinguishes crystalline, interfacial and
amorphous regions by the difference in molecular mobility. The disagreement arises from this
difference in measurement mechanism. We are planning to investigate this issue further.
There are several possible reasons for the bimodal distribution of lamellar thickness.
First, the two most probable lamellar thickness peaks might correspond to crystallites formed
in two different regions of the bubble during the film blowing process, i.e., stalk region and
bubble expansion region. Second, different parallel crystallization processes may take place
in film blowing. While the stress crystallization is caused by nucleation in the volume, for the
blown films there also exists an additional possible crystallization mechanism, i.e., the
transcrystallization process,1 in which crystallization starts from the nuclei at the surface of
the melt. This results in a preferential orientation of b-axis towards the ND of the film. These
two different crystallization processes may produce crystallites with different sizes. Another
possible reason is the temperature gradient across the thickness of the film. The crystalliza-
tion temperature may be different between the interior and the surface, or between the inside
and outside surfaces of the bubble. It will be of interest to figure out the nature of this bimodal
lamellar thickness distribution.
CONCLUSIONS
Compared with the conventional bubble geometry for LLDPE blown films, the high stalk
bubble configuration can result in a more random lamellar texture and more balanced me-
chanical properties. DSC and solid-state NMR gave significantly different crystalline con-
tents for the same LLDPE film in this study. The results of NMR can be used to interpret the
modulus difference between the two films, which otherwise can not be explained by DSC or
by the crystalline orientation data alone. A bimodal lamellar thickness distribution is found
for both films studied. Investigating this bimodal lamellar thickness distribution would give
more insight to the crystallization mechanisms during the film blowing process.
118 Metallocene Technology

ACKNOWLEDGMENTS
The authors would like to thank Polyolefins Films Consortium for financial support and pro-
viding PE blown films. Special thanks are also given to Mr. E. I. Garcia-Meitin for his valu-
able instruction on TEM work.
REFERENCES
1 D. Hofmann et al., J. Appl. Poly. Sci., 39, 1595 (1990).
2 A. Keller, Nature, 174, 826 (1954).
3 A. Keller, J. Polymer Sci., 15, 31 (1955).
4 P. H. Lindenmeyer and S. J. Lustig, J. Appl. Polym. Sci., 9, 227 (1965).
5 A. Keller and M. J. Machin, J. Macromol. Sci., B1, 41(1967).
6 W. Maddams and J. Preedy, J. Appl. Polym. Sci., 22, 2721 (1978).
7 W. Maddams and J. Preedy, J. Appl. Polym. Sci., 22, 2738 (1978).
8 W. Maddams and J. Preedy, J. Appl. Polym. Sci., 22, 2751 (1978).
9 R. K. Eby, J. Appl. Phys., 35, 2720 (1964).
10 D. Fitchmun and S. Newman, J. Polym. Sci., B7, 301(1969).
11 K. Choi, J. Spruiell, and J. White, J. Polym. Sci., Polym. Phys. Ed., 20, 27 (1982).
12 R. M. Patel et al., Polym. Eng. Sci., 34, 1506 (1994).
13 A. M. Sukhadia, SPE ANTEC, 160 (1998).
14 Y. Kim and J. Park, J. Appl. Polym. Sci., 61, 2315 (1996).
15 R. Kitamaru, F. Horii, and K. Murayama, Macromolecules, 19, 636 (1986).
16 K. Kuwabara, et al., Macromolecules, 30, 636 (1997).
17 G. R. Strobl and W. Hagedorn, J. Polym. Sci., Polym. Phys. Ed., 16,1181 (1978).
18 M. Glotin and L. Mandelkern, Colloid & Polymer Sci., 260, 182 (1982).
19 Y. V. Kissin, J. Polym. Sci., Polym. Phys. Ed., 30, 1165 (1992).
20 B. E. Read and R. S. Stein, Macromolecules, 1(2), 116(1968).
21 L. Mandelkern, Crystallization of Polymers, McGraw Hill, New York (1964).
22 J. D. Hoffman, Treatise on Solid State Chemistry, Vol. 3, Plenum Press, New York (1976).
23 H. H. Winter, Pure and Appl. Chem., 55, 943 (1984).
24 T. Kanai, M. Kimura, and Y. Asano, J. Plastic Film and Sheeting, 2, 224 (1986).
25 P. P. Shirodkar and S. D. Schregenberger, SPE ANTEC, 37 (1987).
26 E. J. Dormier et al., SPE ANTEC, 696 (1989).
27 H.Zhou and G. L. Wilkes, J. Mater. Sci., 33, 287 (1998).
28 Unpublished data.
Phase Structure Characterization 119

The Relative Influences of Process and Resin
Time-Scales on the MD Tear Strength of
Polyethylene Blown Films
Rajendra K. Krishnaswamy and Ashish M. Sukhadia
Phillips Petroleum Company, 94-G, Bartlesville, OK 74004, USA
BACKGROUND
Commercial production of polyethylene in the United States alone is more than ten million
metric tons, of which approximately 30% is LDPE, 25% is LLDPE, and 45% is HDPE. Be-
sides, LLDPE is at the onset of a major growth process initiated by the advent of single site
catalysts that allow substantially better control of the polymer’s molecular architecture. Al-
most 70% of the commercial LLDPE and LDPE are used in the form of blown and/or cast
films.1
It is recognized that the orientation state of the crystalline and non-crystalline phases
largely dictates the performance of blown films in their intended application. We are aware of
the fact that the ultimate morphology of a blown film develops over a short region in the vi-
cinity of the process frost line. Also, the final semi-crystalline morphology that develops is
very likely to be dependent on the state of the macromolecules prior to the onset of crystalli-
zation. The state of the molecules prior to and during the crystallization process, in turn, is
dependent on the influence exerted by the process stress profiles in orienting the
macromolecules and subsequently either preserving or relaxing their extended state. Thus, if
the ultimate performance of blown films is a function of their orientation characteristics, what
happens to the macromolecules as they exit the die and subsequently crystallize under
extensional deformation will obviously have an impact on the performance of the ultimate
product. Consequently, our objective here is to identify possible morphological features that
drive the performance of polyethylene blown films, specifically, the MD tear strength.

BLOWN FILM PROCESS MD EXTENSION RATE
Momentum balance of the blown film process leads to an equation for the extension rate pro-
file along the bubble as a function of distance from the die exit. The extension rate along the
film MD is expressed by Ghaneh-Fard et al.2,3 as follows:
&ε θMD
zz
dv
dzv
dr
dz
d
dz= +
2 2 [1]
where vz is the axial film velocity, r is the bubble radius, and θ is the bubble inflation angle.
Video tracing techniques are typically required to measure strain rate profiles along the bub-
ble. However, as the video tracing method is difficult to incorporate with every film run, the
machine direction extension rate at the frost line can be approximated as follows (from equa-
tion 1):
&ε MDFL diev v
FLH≈ −
2 [2]
where the subscripts FL and die indicate frost-line and die exit, respectively, and FLH is the
frost-line height. The above equation is a useful tool to point differences or magnitude of dif-
ferences in the process MD extension rates of films blown under different conditions.
EXPERIMENTAL
Firstly, a single lot of Phillips low density linear polyethylene (LDLPE; pellet density = 0.924
g/cc) resin was blown into film at various processing conditions. It is important to note that
this LDLPE resin is different from conventional LLDPE resins in that it is very broad in mo-
lecular weight distribution (Mw/Mn ~ 20). All the films were blown at high-stalk conditions
and the thickness of all films was approximately 25 microns (1 mil). The process conditions
that were varied were blow-up ratio, extrusion rate and temperature, frost-line height and die
gap. This provided us with several blown films (from a single resin) varying in process strain
rate profiles and ultimate performance. This sample set will be referred to as SERIES-1.
In a second series, several experimental LDLPEs were blown in the in-pocket (conven-
tional LLDPE) configuration. These LDLPEs were of comparable density, molecular weight,
molecular weight distribution, and melt index. However, the melt relaxation times of these
resins varied between 3 s and 25 s. The spread in relaxation times is speculated to be due to the
presence of different levels of long chain branching in the polymer. The relaxation times of
122 Metallocene Technology

these resins are based on Carreau-Yasuda fits to small-amplitude oscillatory measurements at
190oC; the details of the data treatment can be found elsewhere.4 Each of these resins was
converted into two films of different thickness, with all other processing conditions remain-
ing constant. This series will be referred to as SERIES-2. SERIES-2 contains two subsets;
one processed at high extension rates (75 micron thickness) and the other processed at low ex-
tension rates (125 micron thickness), with all other processing conditions remaining constant.
All of the film blowing was carried out using a 38 mm diameter single screw Davis Stan-
dard extruder (L/D = 24; 2.2:1 compression ratio), which is fitted with a barrier screw with a
Maddock mixing section at the end. A 5.1 cm diameter Sano film die equipped with a single
lip air ring was employed for SERIES-1, and a 10.2 cm diameter Sano film die equipped with
a dual lip air ring was employed for SERIES-2. For SERIES-2, the temperature setting along
the extruder and die were 220oC, the blow-up ratio was 15, the die gap was 60 mm, and the ex-
trusion rate was approximately 27 kg/hr.
For all blown films, the approximate MD extension rate at the frost line was estimated as
shown in the previous section (equation 2). For SERIES-1, the White/Spruiell biaxial orienta-
tion factors of the crystalline phase were estimated by a method described elsewhere.5 The
biaxial orientation factors of the non-crystalline phase for some select SERIES-1 blown films
were estimated by coupling the crystalline orientation data with birefringence (in-plane and
out-of-plane) measurements as documented in literature.6-9 For blown film birefringence
data, refractive index measurements were obtained using a Metricon Prism Coupler instru-
ment. The MD tear strengths of all
blown films were measured accord-
ing to ASTM D1922.
RESULTS AND DISCUSSION
In Figure 1, the MD tear strength of
the SERIES-1 blown films are plot-
ted as a function of the average MD
extension rate at the frost-line as esti-
mated using equation 2. Here, the
films with the highest MD tear
strengths were processed at low MD
extension rates. At low extension
rates, the stresses experienced by the
polymer will be lower relative to pro-
cessing at higher extension rates.
Thus, it appears that high extensional
The Relative Influences of Process 123
Figure 1. MD tear vs. average MD extension rate.

stresses along the MD of a blown film
process are detrimental from a MD tear
performance perspective. At high MD
extension rates, the degree of molecular
orientation prior to crystallization is an-
ticipated to be high. This can result in
preferential orientation of the chain seg-
ments along the MD and this imbalance
in orientation can have significant im-
plication on the tear performance of the
corresponding blown film.
The extension rate dependence
discussed above suggests that the blown
film MD tear strength of LDLPE resins,
at fixed process conditions, is a function
of the resin melt viscosity and/or relax-
ation time as measured under planar or biaxial extensional deformation. In order to test this
hypothesis, several LDLPE resins of different melt relaxation times and comparable molecu-
lar weights (and distribution) were blown into film at two separate conditions and their
properties were compared (SERIES-2, Figure 2). It should be cautioned that the relaxation
times of the resins in SERIES-2 were measured under dynamic shear deformation, while sim-
ilar estimates under extensional deformation are more representative and hence preferred.
With this in mind, we clearly observe (Figure 2) that the MD tear strength of the blown film
increases systematically with decreasing relaxation times. This trend is evident for both sets
of films which differ only in the draw-down ratios (ultimate thickness) and hence average
MD extension rate at the frost line. In Figure 2, we also observe that the films processed at
lower extension rates consistently display higher MD tear strengths for all four LDLPE res-
ins. Thus, it is clear that not only is the relaxation time of the resin important, but its relative
magnitude with respect to the timescale of the process is also critical. In other words, when
the Deborah number (relaxation time/process time) is low, the MD tear strength of the result-
ing blown films will be high.
In LDLPE resins, the melt relaxation times can increase due to the presence of long
branches or a fraction of substantially high molecular weight molecules. Thus, we conclude
that both long, branches and small amounts of very high molecular weight molecules are both
detrimental from a blown film MD tear performance perspective.
The Elmendorf tear test is a process of mechanical deformation at relatively high rates.
Such a deformation process involves substantial molecular rearrangement in the crystalline
and non-crystalline phases. Some of the more prominent deformation mechanisms identified
124 Metallocene Technology
Figure 2. Series-2. Tear vs. extension rate.
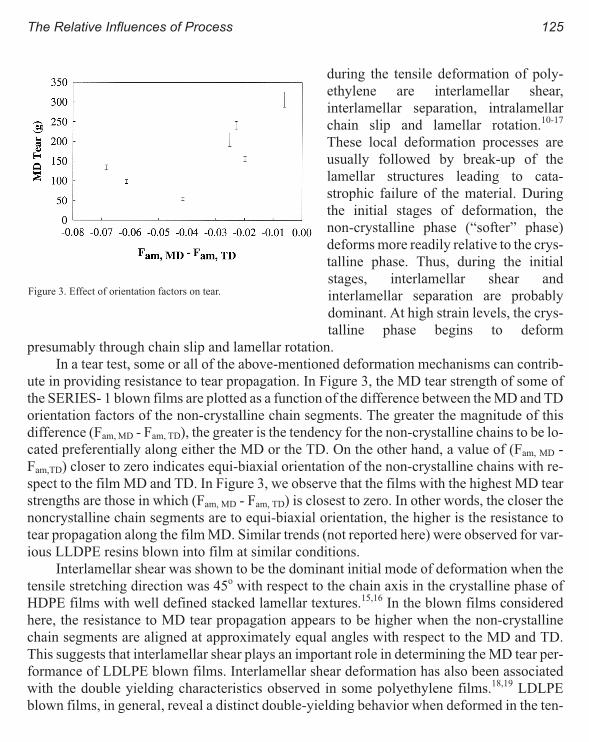
during the tensile deformation of poly-
ethylene are interlamellar shear,
interlamellar separation, intralamellar
chain slip and lamellar rotation.10-17
These local deformation processes are
usually followed by break-up of the
lamellar structures leading to cata-
strophic failure of the material. During
the initial stages of deformation, the
non-crystalline phase (“softer” phase)
deforms more readily relative to the crys-
talline phase. Thus, during the initial
stages, interlamellar shear and
interlamellar separation are probably
dominant. At high strain levels, the crys-
talline phase begins to deform
presumably through chain slip and lamellar rotation.
In a tear test, some or all of the above-mentioned deformation mechanisms can contrib-
ute in providing resistance to tear propagation. In Figure 3, the MD tear strength of some of
the SERIES- 1 blown films are plotted as a function of the difference between the MD and TD
orientation factors of the non-crystalline chain segments. The greater the magnitude of this
difference (Fam, MD - Fam, TD), the greater is the tendency for the non-crystalline chains to be lo-
cated preferentially along either the MD or the TD. On the other hand, a value of (Fam, MD -
Fam,TD) closer to zero indicates equi-biaxial orientation of the non-crystalline chains with re-
spect to the film MD and TD. In Figure 3, we observe that the films with the highest MD tear
strengths are those in which (Fam, MD - Fam, TD) is closest to zero. In other words, the closer the
noncrystalline chain segments are to equi-biaxial orientation, the higher is the resistance to
tear propagation along the film MD. Similar trends (not reported here) were observed for var-
ious LLDPE resins blown into film at similar conditions.
Interlamellar shear was shown to be the dominant initial mode of deformation when the
tensile stretching direction was 45o with respect to the chain axis in the crystalline phase of
HDPE films with well defined stacked lamellar textures.15,16 In the blown films considered
here, the resistance to MD tear propagation appears to be higher when the non-crystalline
chain segments are aligned at approximately equal angles with respect to the MD and TD.
This suggests that interlamellar shear plays an important role in determining the MD tear per-
formance of LDLPE blown films. Interlamellar shear deformation has also been associated
with the double yielding characteristics observed in some polyethylene films.18,19 LDLPE
blown films, in general, reveal a distinct double-yielding behavior when deformed in the ten-
The Relative Influences of Process 125
Figure 3. Effect of orientation factors on tear.

sile mode along the MD. Therefore, it is reasonable to anticipate that interlamellar shear can
play a noticeable role when these blown films are deformed along their MD. However, further
research is required to determine if interlamellar shear is the limiting factor that determines
the MD tear performance of LDLPE and LLDPE blown films. It is cautioned that other mo-
lecular factors and orientation features, not considered here, may influence the MD tear
performance of polyethylene blown films as well.
Finally, we know that the polymer molecules close to the die exit (neck region) tend to be
highly oriented along the MD. In order for the non-crystalline chain segments to be oriented
equi-biaxially with respect to the film MD and TD, they will not only need to relax their ex-
tended conformation to a certain extent but they will also be required to respond to the
transverse stresses exerted during the blow-up. Therefore, in situations wherein the MD ex-
tension rate is very high relative to the TD extension rate or when the relaxation time of the
resin is substantially longer than the process time-scale, the probability of attaining
equi-biaxial orientation of the non-crystalline chain segments along the plane of the film is
low. Consequently, we observe that the dependence of LDLPE blown film MD tear on the
process and resin time scales is reasonably consistent with the proposed interlamellar shear
deformation mechanism.
CONCLUSIONS
For several blown films made from a broad molecular weight distribution, linear low density
polyethylene type material (LDLPE), it was clearly shown that the MD tear performance was
favored by low process MD extension rates and short polymer melt relaxation times. The rel-
ative magnitude of the polymer relaxation time and process time was also shown to be impor-
tant, with low Deborah numbers favoring better MD tear performance. Orientation of the
noncrystalline chain segments in these blown films appears to suggest that interlamellar shear
plays an important role in determining the MD tear performance of LDLPE and LLDPE
blown films.
ACKNOWLEDGMENTS
The encouragement and assistance offered by Prof. Garth Wilkes (VPI&SU) is greatly appre-
ciated. David Rohlfing and Mike Hicks are appreciated for the rheological characterization of
the resins. Jay Janzen and David Register are acknowledged for all their encouragement and
useful discussions. Jerry Stark, David Higbee and John Wehmeyer were responsible for all
the film blowing and testing. John Jackson of Metricon Corporation is acknowledged for re-
fractive index measurements on the LDLPE blown films. The authors also express their grati-
tude to the Phillips Petroleum Company for encouragement and for permission to publish and
present this work.
126 Metallocene Technology

REFERENCES
1 J. F. Ross and J. L. MacAdams, “Polyethylene (Commercial)”, from The Polymeric Materials Encyclopedia,
pg. 5953-5965, CRC Press (1996).
2 A. Ghaneh-Fard, P. J. Carreau, and P. G. Lafleur, Polymer Engineering and Science, 37, 1148 (1997).
3 A. Ghaneh-Fard, P. J. Carreau, and P. G. Lafleur, International Polymer Processing, 12, 136 (1997).
4 J. Janzen, D. C. Rohlfing, and M. J. Hicks, Journal of Rheology, In Press (1998).
5 R. K. Krishnaswarny, SPE-ANTEC Proceedings, (1999).
6 J. L. White and J. E. Spruiell, Polymer Engineering and Science, 21, 859 (198 1)
7 J. L. White and M. Cakmak, Advances in Polymer Technology, 8, 27 (1988).
8 G. L. Wilkes, “Rheooptical Properties”, from Encyclopedia of Polymer Science and Engineering, Mark, Bikales,
Overberger, & Menges editors, vol 14, 261-298 (1985).
9 R. J. Pazur and R. E. Prud’homme, Macromolecules, 29, 119 (1996).
10 A. Keller and D. P. Pope, Journal of Material Science, 6, 453 (1971).
11 D. P. Pope and A. Keller, Journal of Polymer Science: Polymer Physics Edition, 13, 533 (1975).
12 A. Peterlin, Colloid and Polymer Science, 265, 357 (1987).
13 L. Lin and A. S. Argon, Journal of Material Science, 29, 294 (1994).
14 R. S. Porter and L. H. Wang, Journal of Macromolecular Science - Macromol. Chem. Phys., C35, 63 (1995).
15 H. Zhou and G. L. Wilkes, Macromolecules, 30, 2412 (1997).
16 H. Zhou and G. L. Wilkes, Journal of Material Science, 33, 287 (1998).
17 M. F. Butler and A. M. Donald, Macromolecules, 31, 6234 (1998).
18 N. W. Brooks, R. A. Duckett and 1. M. Ward, Polymer, 22, 1975 (1992).
19 N. W. Brooks, A. P. Unwin, R. A. Duckett and 1. M. Ward, Journal of Macromolecular Science: Physics Edition, 34,
29 (1995).
The Relative Influences of Process 127
Metallocene Catalyzed Polyethylene in Blown Film
Applications. A Comparison Between Monoextruded
Blended Films and Coextruded Films
C. M. Beagan, G. M. Mc Nally & W. R. Murphy
Polymer Processing Research Center Department of Chemical Engineering, The Queens
University of Belfast, David Keir Building, Stranmillis Road, Belfast BT9 5AG, N. Ireland.
INTRODUCTION
Metallocene catalysts are finding ever increasing application due to their ability to create
polymers with properties that can be precisely controlled over a wide range of limits.2
Metallocene catalyzed polyethylenes are reported to have superior properties over conven-
tional polyethylenes, principally due to their narrow molecular weight distribution and more
uniform co-monomer distribution.3 However, these polymers are more difficult to process be-
cause of the higher viscosity’s encountered during melt processing.4 Films produced from
these resins are also susceptible to blocking.5 However, in order to overcome some of these
difficulties, mPE’s may be blended or coextruded with other conventional polyethylenes.
The blending of polymers to achieve a superior product is used widely in industry. Many
studies have been conducted on blends of LDPE and linear low density polyethylene (Linear
Low Density Polyethylene).6-10 These have shown that addition of increasing amounts of
LLDPE will generally result in an increase in tensile properties. Martinez et al.11 have com-
pared blends of LDPE/LLDPE with coextruded films containing LLDPE as the middle layer
and LDPE as the inner and outer layers and found, that in general the coextruded films
showed the superior mechanical properties.
The aim of this paper is to determine the best way to utilize these resins in the blown film
process to achieve optimum mechanical properties. Monolayer blended films of mPE and
LDPE were compared to three layer coextruded films of A:B:A structure where A is LDPE
and B is mPE. Crystallinity of the blended films was studied and the rheological behavior was
also considered.

EXPERIMENTAL PROCEDURES
MATERIALS SELECTION
For this study two types of polyethylene, suitable for thin film gauges were used, a low den-
sity polyethylene (LDPE) from Exxon ( MFI 2 g/l0 min) and a mPE grade from BASF (MFI
1.4 g/l0 min). For the blended materials a Shulmann antiblocking agent was added.
SAMPLE PREPARATION
The films were manufactured using a Killion blown film coextrusion line comprising one 38
mm extruder and two 25 mm extruders, fitted with a 75 mm diameter die, die gap of 2.0 mm.
Barrel temperature profiles were maintained throughout the trials from 160oC at the feed sec-
tion to 200oC at the die. Films were produced at a constant blow up ratio of 2.0 and a constant
screw speed of 27 rpm set to produce a film thickness of 50µm at a haul off speed of 3 m/min.
To reduce film thickness haul off speed was then increased to 6 m/min, 9 m/min and l2 m/min
and samples taken at each stage. At the highest haul off speed film thickness was approxi-
mately 12 µm.
Blends of LDPE and mPE were tumble mixed prior to extrusion in the following w/w ra-
tios 80/20, 60/40, 40/60, 20/80. Previous experience at these laboratories has shown that
films manufactured from mPE’s are susceptible to excessive blocking, therefore an antiblock
agent (5% w/w) was incorporated into the blend mixtures prior to extrusion.
Three layer coextruded films were also produced, with the mPE polyethylene as the mid-
dle layer. The ratio of mPE to LDPE in these films was the same as that in the blended films so
all films were comparable.
The blended materials were also compounded using a four strand compounding die to
produce well dispersed samples suitable for rheological analysis, described later.
TENSILE TESTING
All films were tested to BS 2782: Part 3 using an Instron 4411 universal tensile tester.
Crosshead speed was set at 500 mm/min with a gauge length of 50 mm. For each film a mini-
mum of ten samples were prepared and tested in both machine and transverse direction.
From the resultant data, values for break strength, % elongation and Young’s modulus
were obtained.
DSC ANALYSIS
Crystallinity of various films were determined using Differential Scanning Calorimetry. This
was carried out using a Perkin Elmer DSC 6, over the temperature range 20 to 150oC with a
scan rate of 10oC/min. Thermograms from first heating were used to determine crystallinity
130 Metallocene Technology

developed during processing. A value of 289.9 J/g was used to represent a 100% crystalline
sample.5
RHEOLOGICAL ANALYSIS
Rheological data on the various polymer blends was obtained using a Rosand RH7 dual capil-
lary rheometer. Each compounded blend was subjected to a range of shear rates (10-103 s-1) at
a constant temperature of 200oC.
RESULTS AND DISCUSSION
Break strengths in the machine and
transverse directions for both
coextruded and blended films, man-
ufactured at a haul off speed of 3
m/min, are shown in Figures 1 and 2.
Generally, it is shown that as per-
centage mPE increases the break
strength increases, up to a maximum
of 80% mPE content in all cases.
Note that the break strength of 100%
mPE film was always less than that
of films containing 80% mPE.
The results also show that
coextruded films generally had con-
siderably higher break strength than
that of the blended films, for exam-
ple at 20% mPE content the
coextruded film is over 17% stronger
than the monolayer blended film in
the machine direction. In the trans-
verse direction the coextruded films
exhibit an even greater increase in
break strength over the blended films
as mPE content is increased, with the
coextruded film being over 20%
stronger than the blended film for
80% mPE. Martinez11 suggested from optical microscopy studies, that row nucleation, in-
duced through melt orientation, occurs at the interface between the layers in the coextruded
Metallocene Catalyzed Polyethylene 131
Figure 1. Comparison of break strength in MD for blended and coextruded
films at haul of 3 m/min.
Figure 2. Comparison of break strength in TD for blended and coextruded
films at haul off 3 m/min.

film. This enhanced nucleation could account for the greater break strengths observed in the
coextruded films.
The effect of haul off speed on break strength in the machine direction for blended and
coextruded films is shown in Table 1. For 100% LDPE it is evident that break strength in-
creases with increasing haul off. As mPE is incorporated into the film, however, break
strength decreases with progressively higher haul off rates. This becomes evident at 60%
mPE for the blended film and 40% mPE for the coextruded film. This would suggest that mo-
lecular orientation increased up to these processing conditions, but further increase in haul off
resulted in weakening the morphological structure of the film. This is confirmed by signifi-
cant reduction in elongation for these films, for example for 60% mPE blended film
elongation falls from 833% at 3 m/min to 254% at 12 m/min. Note that the results for 100%
mPE blended film at 9 m/min and l2 m/min are not included in the data. This was due to se-
vere bubble instability at these haul off rates therefore no samples were taken. Also at 80%
mPE for the blended film no value of break strength for l2 m/min haul off is included. This is
because that while it was possible to manufacture this film, excessive blocking of the lay flat
film occurred (even with 5% antiblock agent added), making it impossible to separate. This
again was the case 100% mPE coextruded film at haul off 12 m/min.
The effect of incorporating mPE on the elongation of the films is shown in Figures 3 and
4. The results show considerable increase in elongation with increasing mPE content, with
the greatest change in elongation being recorded in the machine direction, around a 45% in-
crease (approximately 500% to 900% for both the blended and coextruded films). Addition of
20% mPE resulted in a 16% increase in elongation for the blended films and over 36% in-
crease in elongation for the coextruded films in the machine direction. Again, it is interesting
to note that although the highest elongations were recorded for films containing 80% mPE
(900%), a decrease in elongation is evident for 100% mPE films. In almost all cases the re-
corded elongation’s for coextruded films were higher than that of the blended films.
132 Metallocene Technology
Table 1. Effect of haul off speed on the machine direction break strength for
blended and coextruded films
mPE, % Blended film break strength, MPa Coextruded film break strength, MPa
HO 3 6 9 12 3 6 9 12
0 19 24 24 32 18 23 28 34
20 20 22 25 25 25 24 20 24
40 26 26 24 25 29 22 22 18
60 31 25 27 24 32 27 20 20
80 33 22 27 39 28 24 18
100 31 21 34

The effect of increasing the mPE content on the Young’s modulus of the various films
was also studied. The results, in
Table 1, show that this modulus gen-
erally decreases with increasing
mPE content for all films, with a
greater decrease being apparent for
the blended films.
The increase in elongation and
decrease in modulus with increasing
mPE content would tend to suggest
changes in the crystallinities of the
films. DSC analysis on the blended
films show this to be the case.
Metallocene Catalyzed Polyethylene 133
Figure 3. Comparison of percentage elongation in MD for blended and coextruded films at haul off 3 m/min.
Figure 4. Comparison of percentage elongation in TD for blended and coextruded films at haul off 3 m/min.
Table 2: Young’s modulus for blended and
coextruded films in MD and TD
mPE, %Blended film, MPa Coextruded film, MPa
MD TD MD TD
0 176 162 137 143
20 134 136 129 130
40 118 109 105 119
60 89 101 95 103
80 74 79 68 80
100 55 56 74 80

Table 2 shows a significant difference in crystallinity was recorded for 100% LDPE
(36%) and 100% mPE (24%). The results also show considerable decrease in crystallinity in
films containing even small percentages of mPE, for example incorporation 20% mPE results
in a drop of over 10% crystallinity. Recent studies12 on α -olefin copolymers have shown that
higher molecular weights will lead to a decrease in crystallinity. Since the molecular weight
of mPE’s are generally very high, this could account for the fall in recorded crystallinity . The
thermograms for all blends showed only one peak at this cooling rate. The table also shows a
decrease in melting point of the films as percentage mPE is increased.
During extrusion of the blended films torque measurements were recorded. Figure 5
shows an almost linear increase in torque with increasing mPE up to 80% mPE (290 Nm).
However, extrusion of 100% mPE resulted in a smaller torque value. Following this observa-
tion, rheological studies on these blends were performed. The recorded shear viscosity data
134 Metallocene Technology
Figure 5. Comparison of torque and shear viscosity data for blended films at shear rate 10 s-1.
Figure 6. Shear viscosity vs. shear rate for mPE/LDPE blends.
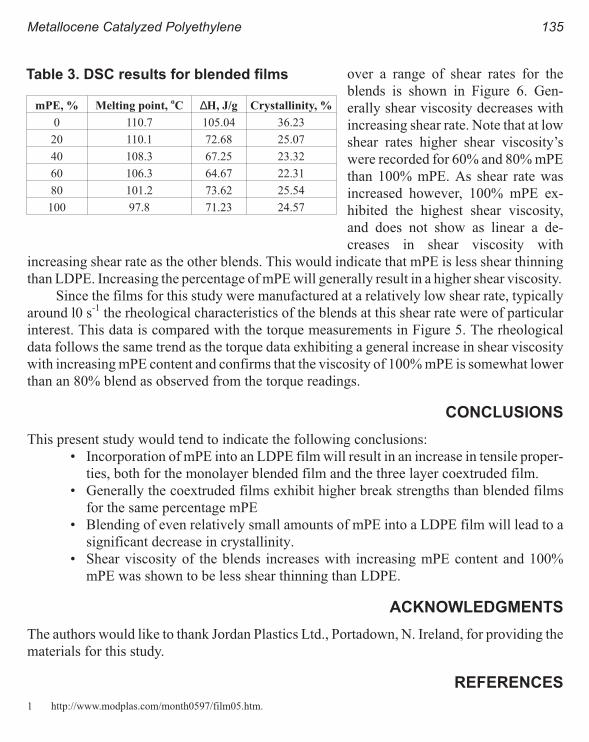
over a range of shear rates for the
blends is shown in Figure 6. Gen-
erally shear viscosity decreases with
increasing shear rate. Note that at low
shear rates higher shear viscosity’s
were recorded for 60% and 80% mPE
than 100% mPE. As shear rate was
increased however, 100% mPE ex-
hibited the highest shear viscosity,
and does not show as linear a de-
creases in shear viscosity with
increasing shear rate as the other blends. This would indicate that mPE is less shear thinning
than LDPE. Increasing the percentage of mPE will generally result in a higher shear viscosity.
Since the films for this study were manufactured at a relatively low shear rate, typically
around l0 s-1 the rheological characteristics of the blends at this shear rate were of particular
interest. This data is compared with the torque measurements in Figure 5. The rheological
data follows the same trend as the torque data exhibiting a general increase in shear viscosity
with increasing mPE content and confirms that the viscosity of 100% mPE is somewhat lower
than an 80% blend as observed from the torque readings.
CONCLUSIONS
This present study would tend to indicate the following conclusions:
• Incorporation of mPE into an LDPE film will result in an increase in tensile proper-
ties, both for the monolayer blended film and the three layer coextruded film.
• Generally the coextruded films exhibit higher break strengths than blended films
for the same percentage mPE
• Blending of even relatively small amounts of mPE into a LDPE film will lead to a
significant decrease in crystallinity.
• Shear viscosity of the blends increases with increasing mPE content and 100%
mPE was shown to be less shear thinning than LDPE.
ACKNOWLEDGMENTS
The authors would like to thank Jordan Plastics Ltd., Portadown, N. Ireland, for providing the
materials for this study.
REFERENCES
1 http://www.modplas.com/month0597/film05.htm.
Metallocene Catalyzed Polyethylene 135
Table 3. DSC results for blended films
mPE, % Melting point,oC ∆H, J/g Crystallinity, %
0 110.7 105.04 36.23
20 110.1 72.68 25.07
40 108.3 67.25 23.32
60 106.3 64.67 22.31
80 101.2 73.62 25.54
100 97.8 71.23 24.57

2 Kaminsky, Macromol. Chem. Phys., 197, 3907-3945 (1996).
3 UK Freezer Film Symposium, Birmingham, November 12, 1996.
4 Kim, Y. J., Chung, C., Lai, S.Y., Hyun, K. S., Korean J. of Chem. Eng., 13(3), 294-303 (1996).
5 Ramesh, N.S., Malwitz, N., Antec 1954-1961 (1997)
6 McNally, G.M., Bermingham, C., Murphy, W.R., Trans IChem.E, Vol 71, Part A, 223-231 (1993).
7 Hill, M.J., Barham, P.J., Keller, A., Polymer, 33(12), 2530-2541 (1992).
8 Iragorri, J.1.,Rego, J.M., Katime, I., Polymer, 33(3), 461-467 (1992).
9 Norton, D.R., Keller, A., J. of Mat. Sci., 19, 447-456 (1984).
10 Datta, N.K., Birley, A.W., Plastics and Rubber Processing Applications, 3, 237-242 (1983).
11 Martinez, F., Mazuera, G.E, Plastic Film Technology, 2, 120-138 (1993).
12 Kennedy, M. A., Peacock, A. J., Failla, M. D., Lucas, J. C., Mandelkern, L., Macromolecules, 28, 1407-1421 (1995).
136 Metallocene Technology

Trade-offs in Blown Film
Processing-Structure-Property Behavior of LLDPE
Type Resins from Chromium, Metallocene and
Ziegler-Natta Catalysts
Ashish M. Sukhadia
Phillips Petroleum Company, 94-G PRC, Bartlesville, OK 74004
INTRODUCTION
Polyethylene (PE) is most versatile polymer available today. It is inherently “simple” in it’s
chemical make-up, consisting essentially of carbon and hydrogen atoms bonded together co-
valently. However, the wide variety of molecular chain architectures that have been made
possible in the last 50 years or so have given rise to a tremendous number of PE resin-end user
performance combinations.
Within the family of PE resins, linear low density PE (LLDPE) resins have found exten-
sive applications in the areas of food packaging (e.g. bakery, candy, frozen foods, ice-bags,
etc.), non-food packaging (e.g. garment bags, heavy duty sacks, stretch and shrink wrap, etc.)
and non-packaging (e.g. industrial can liners, agricultural films, medical, trash bags etc.).
These numerous applications demand a vast range of application performance benefits that
can rarely be met by one resin alone. This has essentially resulted in the development of an ar-
ray of catalysts, processes and end use resins over the last five decades. However, a
comprehensive review of these variations is well beyond the scope of this paper.
Chromium catalyst PE resins are typified by a high molecular weight (Mw), broad mo-
lecular weight distribution (MWD) and often very low levels of long chain branching
(LCB).1,2 Ziegler-Natta (Z-N) resins are typically narrower in MWD than chromium resins
and contain no LCB.1,2 Metallocene resins are typically even narrower in MWD than Z-N res-
ins and may3 or may not4,5 contain any LCB depending on the catalyst and process employed.
Thus it is clear that these three catalysts viz. chromium, Z-N and metallocene can yield PE
resins with widely different molecular and rheological properties. In this paper, we examine

the blown film processing - structure - property behavior and trade-offs with three different
LLDPE resins from each catalyst mentioned above.
EXPERIMENTAL
BLOWN FILM RESINS
Three LLDPE type resins made using chromium, metallocene and Z-N catalysts were used in
this study. All three resins are hexene copolymers. For the sake of brevity, the chromium,
metallocene and Z-N resins will be designated as Resins C, M and Z, respectively. The basic
characterization data of these three resins is shown in Table 1. Note that resins M and Z are
nominally 1 MI while resin C is 0.22 MI. This particular chromium catalyst resin C was cho-
sen since it is a commercial resin and is therefore readily available. This difference in MI is
not expected to affect the general interpretations and basic theme of this paper.
BLOWN FILM EVALUATIONS
The film blowing experiments were conducted on a laboratory scale blown film line. The line
consists of a 38 mm (1.5 inch) diameter single screw Davis Standard extruder (L/D=24; 2.2:1
compression ratio) fitted with a barrier screw with a Maddock mixing section at the end. The
die used was 100 min (4 inch) in diameter and was fitted with a Dual Lip Air Ring using ambi-
ent cooling air. The die gap was 1.52 min (0.060 inch). The film blowing was done using typi-
cal LLDPE conditions as follows: 2.5:1 blow up ratio (BUR), “in-pocket” bubble and 190oC
extruder and die set temperatures. Films of three different gages viz. 25 micron (1 mil), 75 mi-
cron (3 mil) and 125 micron (5 mil) were made by varying the take-up speed while keeping
the output rate constant for all resins and film gages. The evaluations were made at an output
rate of 27.2 kg/hr (60 lb/hr) which was achieved by varying the extruder screw speed as
needed. The film blowing conditions were chosen since the film properties so obtained scale
directly with those from larger commercial scale film blowing operations.6
BLOWN FILM PROPERTIES
The film properties were measured as follows:
1 Dart impact strength - ASTM D- 1709 (method A)
2 Machine (MD) and transverse (TD) direction Elmendorf tear strengths
- ASTM D-1922
RHEOLOGY
Melt index (MI) was measured as per ASTM D-1238, Condition F (190oC, 2.16 kg). High
load melt index (HLMI) was measured as per ASTM D-1238, Condition E (190oC, 21.6 kg).
The rheological data was obtained on a Rheometrics Mechanical Spectrometer (model
RMS-800) using the time-temperature superposition procedure outlined elsewhere.5 The
138 Metallocene Technology

master curve was fitted with a sim-
plified three parameter
Carreau-Yasuda (CY) empirical
model to obtain the CY parameters
viz. zero shear viscosity - Eta(0),
characteristic maximum relax-
ation time - Tau Relax and ‘A’
parameter. Details of the signifi-
cance and interpretation of these
three parameters may be found
elsewhere.8,9
Apparent extensional viscos-
ity was experimentally obtained
using the converging flow method
proposed by Cogswell.10 A two-part die consisting of a 2 mm diameter entry die with a 90o en-
try cone angle and a 2 mm die diameter land die (L/D=15) were fitted to the end of a 2.54 cm
diameter extruder. The temperature profile used was 190oC flat across the extruder, adapter
and dies.
RESULTS
We begin by examining the basic resin molecular and rheological characteristics for the three
LLDPE type resins, C, M and Z. The gel permeation chromatograms (GPC) for the three res-
Trade-offs in Blown Film 139
Figure 1. Gel permeation chromatrogram traces of LLDPE
resin C, M, and Z.
Figure 2. Comparison of the complex viscosity of LLDPE resin
C, M, and Z.
Table 1. Description of LLDPE resins C, M and Z
Property Resin C Resin M Resin Z
MI, g/10 min 0.22 1.0 1.0
HLMI, g/10 min 18 17 37
HLMI/MI 82 17 37
Density,g/cc 0.922 0.918 0.921
Eta(0), Pa.s
Tau Relax, s
‘A’
Ea, kJ/mol
2.87E5
1.03
0.206
33.9
7.18E3
0.014
0.579
23.3
1.15E4
0.028
0.339
23.9
Mw, kg/mol
Mn, kg/mol
MWD
219.22
10.22
21.5
101.08
39.58
2.6
122.04
25.55
4.8
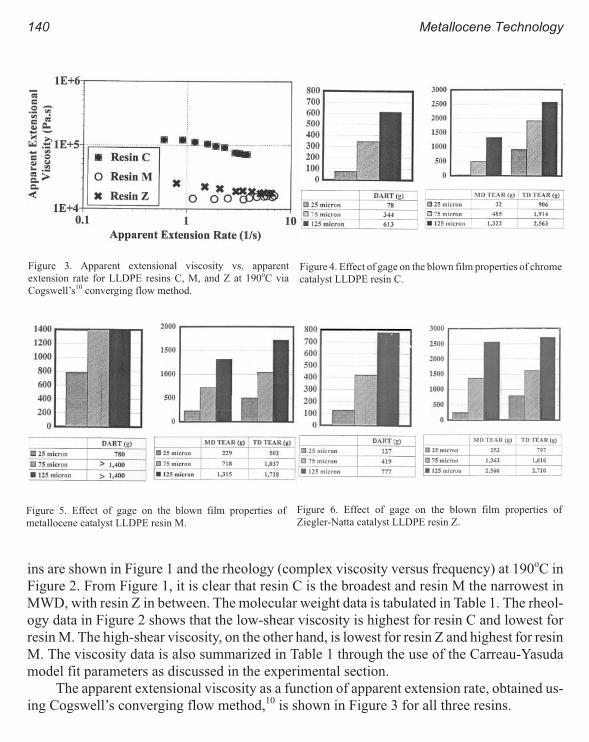
ins are shown in Figure 1 and the rheology (complex viscosity versus frequency) at 190oC in
Figure 2. From Figure 1, it is clear that resin C is the broadest and resin M the narrowest in
MWD, with resin Z in between. The molecular weight data is tabulated in Table 1. The rheol-
ogy data in Figure 2 shows that the low-shear viscosity is highest for resin C and lowest for
resin M. The high-shear viscosity, on the other hand, is lowest for resin Z and highest for resin
M. The viscosity data is also summarized in Table 1 through the use of the Carreau-Yasuda
model fit parameters as discussed in the experimental section.
The apparent extensional viscosity as a function of apparent extension rate, obtained us-
ing Cogswell’s converging flow method,10 is shown in Figure 3 for all three resins.
140 Metallocene Technology
Figure 3. Apparent extensional viscosity vs. apparent
extension rate for LLDPE resins C, M, and Z at 190oC via
Cogswell’s10 converging flow method.
Figure 4. Effect of gage on the blown film properties of chrome
catalyst LLDPE resin C.
Figure 5. Effect of gage on the blown film properties of
metallocene catalyst LLDPE resin M.
Figure 6. Effect of gage on the blown film properties of
Ziegler-Natta catalyst LLDPE resin Z.
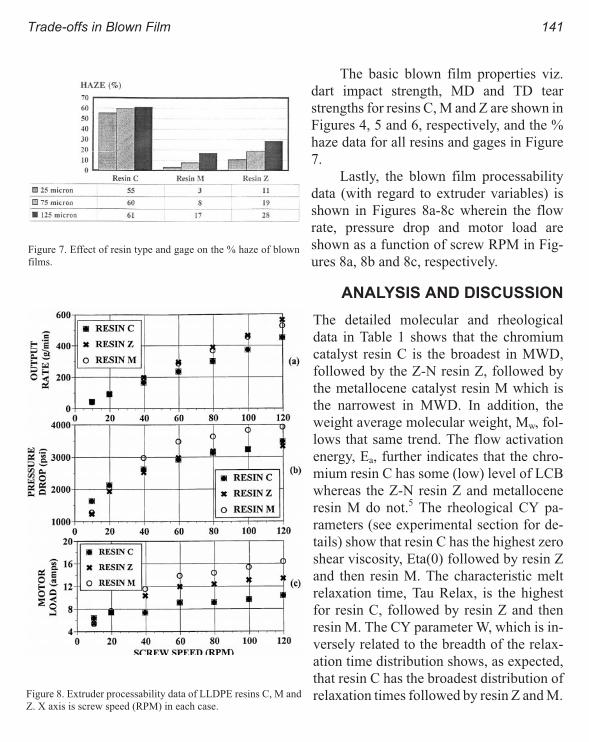
The basic blown film properties viz.
dart impact strength, MD and TD tear
strengths for resins C, M and Z are shown in
Figures 4, 5 and 6, respectively, and the %
haze data for all resins and gages in Figure
7.
Lastly, the blown film processability
data (with regard to extruder variables) is
shown in Figures 8a-8c wherein the flow
rate, pressure drop and motor load are
shown as a function of screw RPM in Fig-
ures 8a, 8b and 8c, respectively.
ANALYSIS AND DISCUSSION
The detailed molecular and rheological
data in Table 1 shows that the chromium
catalyst resin C is the broadest in MWD,
followed by the Z-N resin Z, followed by
the metallocene catalyst resin M which is
the narrowest in MWD. In addition, the
weight average molecular weight, Mw, fol-
lows that same trend. The flow activation
energy, Ea, further indicates that the chro-
mium resin C has some (low) level of LCB
whereas the Z-N resin Z and metallocene
resin M do not.5 The rheological CY pa-
rameters (see experimental section for de-
tails) show that resin C has the highest zero
shear viscosity, Eta(0) followed by resin Z
and then resin M. The characteristic melt
relaxation time, Tau Relax, is the highest
for resin C, followed by resin Z and then
resin M. The CY parameter W, which is in-
versely related to the breadth of the relax-
ation time distribution shows, as expected,
that resin C has the broadest distribution of
relaxation times followed by resin Z and M.
Trade-offs in Blown Film 141
Figure 7. Effect of resin type and gage on the % haze of blown
films.
Figure 8. Extruder processability data of LLDPE resins C, M and
Z. X axis is screw speed (RPM) in each case.

From Figure 4, the chromium resin C exhibits very low MD tear and dart impact strength
at the lowest gage of 25 microns. Both these properties improve with increasing gage. How-
ever, it is remarkable that the increase in properties, particularly MD tear strength, is more
than proportional to the change in gage. Going from 25 to 75 to 125 microns i.e., increasing
film gage by a factor of 3 to a factor of 5, respectively, increases MD tear strength from 32 to
485 to 1,322 g which is an improvement of almost 16 times to 40 times, respectively, over the
25 micron film. The dart impact strength for resin C see similar, but much less dramatic, im-
provements with gage. The TD tear strength, on the other hand, increases less than
proportionally with gage.
From Figure 5, the blown film data as a function of film gage for the metallocene resin M
show very different trends than those observed above for resin C. First, the resin M exhibits
very high impact strength even at 25 micron gage. At the 75 and 125 micron gages, the dart
impact strength is in excess of 1,400 g which was the highest impact strength measurable with
the current equipment. The MD tear strength at 25 micron is better for resin M than resin C
while the TD tear strength is lower. At higher gages, resin M exhibits a change in MD tear that
is roughly proportional to the change in gage while the TD tear strength increases less than
proportionally with gage. It is interesting to note that at the 125 micron gage the MD tear
strength of resin C and M are comparable while the TD tear strength of resin C is much higher
than resin M.
From Figure 6, the blown film data as a function of film gage for the Z-N resin Z shows
yet different behavior. The properties at 25 micron gage show the tear properties of resin Z to
be equivalent to resin M and better than resin C. Dart impact strength of resin Z is higher than
resin C but lower than resin M. At higher gages, the dart impact and MD tear strength increase
more than proportionally while the TD tear strength increases less than proportionally with
film gage. At higher gages, resin Z exhibits clearly superior MD tear strength compared to
resins C and M.
At least some of these film properties and trends can be explained reasonably well on the
basis of the molecular and rheological characteristics of these different polymers. The low
MD tear strength of resin C, particularly at low gages, is attributed to the high degree of MD
molecular orientation developed in the film during blowing. At low gages, i.e., high film line
speeds, the process time (time for melt to go from die exit to freeze line height (FLH)) is short
relative to the relaxation time of the polymer. Thus the polymer does not have a chance to re-
lax much and a high degree of molecular orientation is “frozen-in”. In addition, the high Mw
and broad MWD of resin C, coupled with the fact that a small degree of LCB is also present in
the resin, results in relatively high extensional viscosity for resin C compared to resins M and
Z as shown in Figure 3. The higher extensional viscosity of resin C most likely results in a
higher level of stress in the bubble prior to the FLH which further contributes to the genera-
tion of high MD orientation in the final film. In fact, wide angle x-ray scattering (WAXS) and
142 Metallocene Technology

infrared dichroism (IR) results (not presented here) confirm these postulations of very high
molecular orientation along the MD in the 25 micron blown film from resin C. As the resin
gage is increased, i.e., drawdown or line speed is decreased, there is a simultaneous increase
in the process time (which allows for greater molecular relaxation) and a decrease in stress in
the bubble due to lower drawdown stresses. These two effects combine to decrease the final
orientation developed and retained in the film, thereby increasing the MD and TD tear proper-
ties of resin C.
It is of interest to note that the positive effect of thicker gage on tear strengths, particu-
larly MD tear, is significantly greater for resin C compared to resins M or Z as noted earlier.
This is because the rheological properties of resin C viz. zero shear viscosity, melt relaxation
time and extensional viscosity are all considerably higher for resin C than either resin M or Z
as discussed earlier. Thus any processing changes (such as lower line speeds) during film
blowing that provide for added molecular relaxation to occur will affect the orientation state
and solid state morphology of resin C to a much greater degree than resins M or Z as ob-
served. As a final note on the tear strength properties, it should be added that the Z-N resin Z
exhibits far superior MD and TD tear strengths and balance at all gages compared to resins C
and M.
With regard to the impact strengths of these resins at the various gages, it is very clear
that the metallocene resin M exhibits clearly superior toughness compared to resins C and Z.
In fact, from Figures 3, 4 and 5, we observe that the dart impact strength of 25 micron resin M
film is higher than even the 125 micron film properties of either resin C or Z. This is truly a re-
markable difference in solid state properties. Metallocene resins are characterized by narrow
MWD and homogenous short chain branching distribution (SCBD).3-5 This homogenous
SCBD is more efficient at forming a greater number of tie-molecules because of the fact that
the evenly distributed comonomer (across the entire MWD5) disrupts the process of regular
chain-folding into lamella more effectively. The benefits of increased tie-molecule concen-
tration on the solid state properties11-13 and toughness properties14,15 of polyethylene have
been discussed many times by other researchers.
In Figure 7, the % haze for all the blown films is shown. The metallocene resin M is far
superior in clarity (as determined by low % haze) at all gages compared to either resin C or Z.
The reasons for the superior clarity of this family of metallocene resins has been discussed
elsewhere.5 It is perhaps worthwhile to point out here that the high haze for resin C at all gages
was determined (by applying a light coating of silicone oil of similar refractive index on both
sides) to be largely due to fine-scale surface roughness (i.e., external haze not internal) . The
surface roughness is postulated to be caused at the die exit due to the high polymer melt elas-
ticity of this resin. On the other hand, the higher haze of resin Z compared to resin M is
thought to be due to surface roughness caused by growth and aggregation of crystallites at or
Trade-offs in Blown Film 143
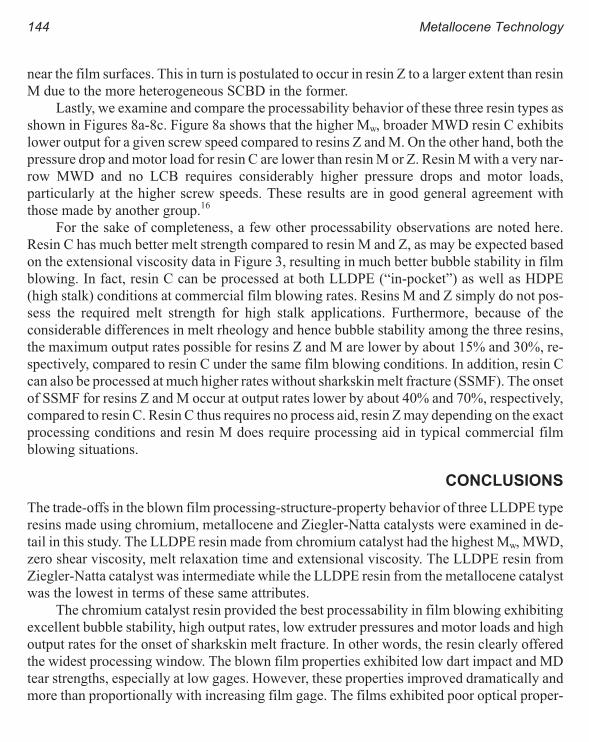
near the film surfaces. This in turn is postulated to occur in resin Z to a larger extent than resin
M due to the more heterogeneous SCBD in the former.
Lastly, we examine and compare the processability behavior of these three resin types as
shown in Figures 8a-8c. Figure 8a shows that the higher Mw, broader MWD resin C exhibits
lower output for a given screw speed compared to resins Z and M. On the other hand, both the
pressure drop and motor load for resin C are lower than resin M or Z. Resin M with a very nar-
row MWD and no LCB requires considerably higher pressure drops and motor loads,
particularly at the higher screw speeds. These results are in good general agreement with
those made by another group.16
For the sake of completeness, a few other processability observations are noted here.
Resin C has much better melt strength compared to resin M and Z, as may be expected based
on the extensional viscosity data in Figure 3, resulting in much better bubble stability in film
blowing. In fact, resin C can be processed at both LLDPE (“in-pocket”) as well as HDPE
(high stalk) conditions at commercial film blowing rates. Resins M and Z simply do not pos-
sess the required melt strength for high stalk applications. Furthermore, because of the
considerable differences in melt rheology and hence bubble stability among the three resins,
the maximum output rates possible for resins Z and M are lower by about 15% and 30%, re-
spectively, compared to resin C under the same film blowing conditions. In addition, resin C
can also be processed at much higher rates without sharkskin melt fracture (SSMF). The onset
of SSMF for resins Z and M occur at output rates lower by about 40% and 70%, respectively,
compared to resin C. Resin C thus requires no process aid, resin Z may depending on the exact
processing conditions and resin M does require processing aid in typical commercial film
blowing situations.
CONCLUSIONS
The trade-offs in the blown film processing-structure-property behavior of three LLDPE type
resins made using chromium, metallocene and Ziegler-Natta catalysts were examined in de-
tail in this study. The LLDPE resin made from chromium catalyst had the highest Mw, MWD,
zero shear viscosity, melt relaxation time and extensional viscosity. The LLDPE resin from
Ziegler-Natta catalyst was intermediate while the LLDPE resin from the metallocene catalyst
was the lowest in terms of these same attributes.
The chromium catalyst resin provided the best processability in film blowing exhibiting
excellent bubble stability, high output rates, low extruder pressures and motor loads and high
output rates for the onset of sharkskin melt fracture. In other words, the resin clearly offered
the widest processing window. The blown film properties exhibited low dart impact and MD
tear strengths, especially at low gages. However, these properties improved dramatically and
more than proportionally with increasing film gage. The films exhibited poor optical proper-
144 Metallocene Technology

ties at all gages as evidenced by high % haze. This chromium catalyst resin (and other resins
similar in molecular and rheological characteristics) are thus best suited for non-clarity, high
gage applications where high output rates and a broad processing window are desired.
The metallocene LLDPE resin had the narrowest processing window exhibiting the low-
est bubble stability, highest extruder pressures and motor loads and lowest output rate for the
onset of sharkskin melt fracture. The blown films from this resin, however, had the best opti-
cal properties as evidenced by very low % haze. The blown film properties increased roughly
proportionally with film gage. The impact strengths of these films were excellent at all gages
with the 25 micron metallocene LLDPE film notably exhibiting higher dart impact strength
than 125 micron films from either the chromium or Ziegler-Natta resins. This metallocene
resin (and other similar resins) are thus best suited in applications where high clarity and opti-
cal properties, excellent toughness and good tear strength are desired, at the possible expense
of processability relative to other LLDPE resins.
The Ziegler-Natta resin had a processing window intermediate to the chromium and
metallocene resins. The blown films exhibited reasonably good optical properties which were
much better than the chromium resin but much worse than the metallocene resin. The blown
film properties at all gages exhibited very good MD and TD tear strengths. Dart impact
strength, however, was much poorer compared to the metallocene resin. This resin (and other
similar resins) are thus best suited in applications where medium clarity or optical properties,
medium impact or toughness, high MD and TD tear strengths and good processability are de-
sired.
As a final note, it is important, worthwhile and necessary to clarify that many other
blown film end use properties and attributes e.g. blocking, gas and water transmission rates,
hexane extractables (FDA approval), sealing strengths and initiation temperatures, tensile
properties, etc. were not included in this study, primarily due to space limitations. Thus the
comparisons and tradeoffs discussed here, while still entirely valid and legitimate in their
own regard, should not be considered as absolute but rather a starting point at differentiating
these resin classes. The ultimate choice of a resin for a given application will depend on the
complete balance and tradeoffs it offers in terms of both performance and price.
ACKNOWLEDGMENTS
The author would like to sincerely thank the following for their help: D. C. Rohlfing, T. W.
Johnson, D. E. Higbee, J. D. Stark. Also, the support of Phillips Petroleum Company in pub-
lishing this work is gratefully acknowledged.
Trade-offs in Blown Film 145

REFERENCES
1 Ser van der Ven, Polypropylene and other Polyolefins: Polymerization and Characterization, Elsevier Science
Publishers, Amsterdam (1990).
2 M. P. McDaniel, Adv. Catal., 33, 47-98 (1985).
3 T. I. Butler, S. Y. Lai and R. Patel, J. Plast. Film Sheeting, 10, 248 (1994).
4 D.J. Michiels, Worldwide Metallocene Conference, Metcon’94, May 25-27, Houston, TX, USA (1994).
5 A. M. Sukhadia, J. Plast. Film Sheeting, 14(l), 54(1998).
6 A. M. Sukhadia, J. Plast. Film Sheeting, 10(3), 213 (1994).
7 J. D. Ferry (ed.), Viscoelastic Properties of Polymers, 3rd edn., John Wiley and Sons, New York, 1980.
8 C. A. Hieber and H. H. Chiang, Rheol. Acta, 28, 321 (1989).
9 C. A. Hieber and H. H. Chiang, Polym. Eng. Sci., 32, 931(1992).
10 F. N. Cogswell, Trans. Soc. Rheol., 16(3), 383 (1972).
11 A. Lustiger and N. Ishikawa, J. Polym. Sci. Polym Phys., 29, 1047 (199 1).
12 A. Lustiger and R. L. Markham, Polymer, 24, 1647 (1983).
13 N. Brown and I. M. Ward., J. Mater. Sci., 18, 1405 (1983).
14 T. M. Liu and W. E. Baker, Polym. Eng. Sci., 32(14), 944(1992)
15 K. C. Koch and B. V. Volkenburgh, SPE ANTEC Conf. Proc., 1879 (1996).
16 R. E. Christensen and C. Y. Cheng, Plast. Eng., June, 31 (1991).
146 Metallocene Technology

Transparent Metallocene-Polypropylene for Injection
Molding
J. RØsch
BASF AG, Central Polymer Research Laboratory, Ludwigshafen, Germany
J. R. Grasmeder
TARGOR GmbH, Application Technology, Ludwigshafen, Germany
INTRODUCTION
PP is among the fastest growing plastics with annual growth rates of up to 6%. The versatility
of polypropylene (PP) continues to expand as resin producers implement improvements in
catalyst and process technologies and refine post reactor modification. Recently, several ap-
proaches towards the production of polypropylene with improved clarity have become avail-
able in the marketplace. Transparent polypropylenes are gaining an ever widening acceptance
for packaging applications. State of the art transparent polypropylenes challenge polysty-
renes in many applications and offer the additional benefit of improved toughness.
BACKGROUND
The intrinsic reason for the turbidity of conventional polypropylene is its semicrystalline
state, unlike long-established transparent and amorphous polymers like polystyrene. Light
scattering, occurring at spherulite boundaries, gives rise to the opaque appearance of most
semicrystalline polymers. The key to improved clarity is the control of the number and size of
the spherulites. This can be done with different approaches described in the following.
One of the earliest attempts to improve the clarity of polypropylene was to use low levels
of external stereomodifiers during the catalytic polymerization of propylene. This yielded
products with decreased stereoregularity and therefore decreased ability to crystallize. These
polypropylenes, rich in chain defects, reduced the overall crystallinity and also produced
small spherulites with low perfection. Both effects improved clarity. However, these products
did not succeed in the market place, because the reduced stereoregularity was inevitably ac-

companied by high levels of xylene solubles. These high levels of extractables rendered the
products sticky and were unacceptable in most applications.
One of the most popular approaches towards transparent polypropylene is the
post-reactor modification with selected nucleating agents. First generation nucleating agents
like sodium benzoate produce a spherulitic morphology with spherulite diameters around 1
µm. Unfortunately this size is comparable to the wavelength of visible light and therefore pro-
duces a maximum scattering intensity according to the Mie-theory. For even smaller
spherulites, a higher number of nuclei would be required. In sodium benzoate and other
salt-type nucleating agents, minimum particle size and dispersion are limited by the ability to
grind and disperse such non-fusable salts.
Additionally a small number of highly birefringent β-spherulites can often be found in
samples of PP, especially below the surface layers. These highly birefringent inclusions also
contribute to increased turbidity.
EXPERIMENTAL
Ziegler-Natta PP’s were standard grades from BASF Novolen grade range. Metallocene PP’s
were TARGOR’s Metocene development grades.
Nucleating agents were mixed with polypropylene powders by standard compounding
equipment (Werner &Pfleiderer ZSK 30).
The sol-gel transition temperatures of PP-PDTS (PDTS=para-ditoluylidene sorbitol)
mixtures at different PDTS levels were measured by oscillatory shear rheometry
(Rheometrics RMS 800, temperature sweeps).
Transmission electron microscopy was performed on a Zeiss CEM 902 using ruthenium
tetroxide stained and microtomed thin sections.
Haze values were determined according to ASTM D 1003 on 1 mm thick injec-
tion-molded samples. Transparency is represented as “100 - Haze”.
RESULTS AND DISCUSSION
To increase clarity, an effective nucleating agent has to prevent the formation of highly
birefringentβ-modification and most important to reduce spherulite size to a minimum. To do
so, the number of nuclei has to be increased drastically. Therefore dispersion of nucleating
agents on a nanometer scale has to be accomplished. However, on a nanometer scale, disper-
sion cannot be achieved any longer by mixing operations. Thus “nanodispersion” nucleating
agents require compounds to be soluble in a PP matrix. To be effective as a nucleating agent,
however, there has to be a liquid(PP)/solid(nucleating agent)-interface. To create this inter-
face, “nanodispersion” nucleating agents have to phase-separate prior to crystallization of the
PP matrix. How this phase separation together with “nanodispersion” can be accomplished
148 Metallocene Technology
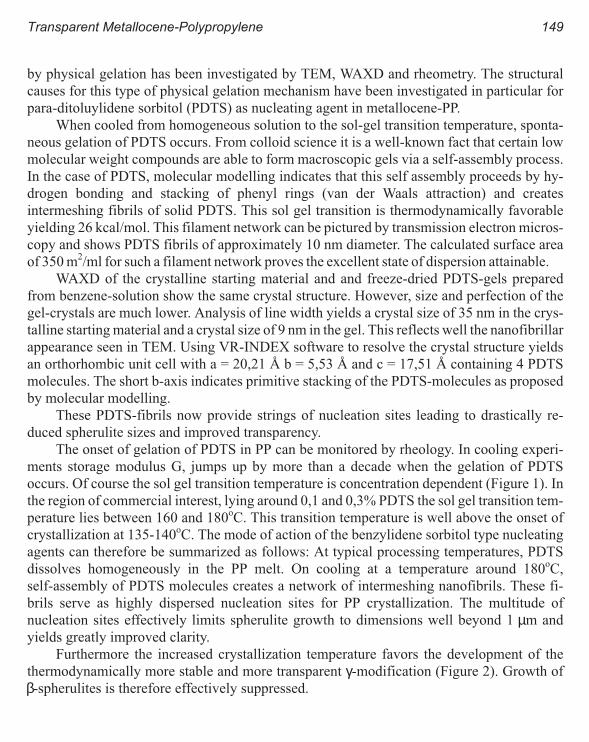
by physical gelation has been investigated by TEM, WAXD and rheometry. The structural
causes for this type of physical gelation mechanism have been investigated in particular for
para-ditoluylidene sorbitol (PDTS) as nucleating agent in metallocene-PP.
When cooled from homogeneous solution to the sol-gel transition temperature, sponta-
neous gelation of PDTS occurs. From colloid science it is a well-known fact that certain low
molecular weight compounds are able to form macroscopic gels via a self-assembly process.
In the case of PDTS, molecular modelling indicates that this self assembly proceeds by hy-
drogen bonding and stacking of phenyl rings (van der Waals attraction) and creates
intermeshing fibrils of solid PDTS. This sol gel transition is thermodynamically favorable
yielding 26 kcal/mol. This filament network can be pictured by transmission electron micros-
copy and shows PDTS fibrils of approximately 10 nm diameter. The calculated surface area
of 350 m2/ml for such a filament network proves the excellent state of dispersion attainable.
WAXD of the crystalline starting material and and freeze-dried PDTS-gels prepared
from benzene-solution show the same crystal structure. However, size and perfection of the
gel-crystals are much lower. Analysis of line width yields a crystal size of 35 nm in the crys-
talline starting material and a crystal size of 9 nm in the gel. This reflects well the nanofibrillar
appearance seen in TEM. Using VR-INDEX software to resolve the crystal structure yields
an orthorhombic unit cell with a = 20,21 b = 5,53 and c = 17,51 containing 4 PDTS
molecules. The short b-axis indicates primitive stacking of the PDTS-molecules as proposed
by molecular modelling.
These PDTS-fibrils now provide strings of nucleation sites leading to drastically re-
duced spherulite sizes and improved transparency.
The onset of gelation of PDTS in PP can be monitored by rheology. In cooling experi-
ments storage modulus G, jumps up by more than a decade when the gelation of PDTS
occurs. Of course the sol gel transition temperature is concentration dependent (Figure 1). In
the region of commercial interest, lying around 0,1 and 0,3% PDTS the sol gel transition tem-
perature lies between 160 and 180oC. This transition temperature is well above the onset of
crystallization at 135-140oC. The mode of action of the benzylidene sorbitol type nucleating
agents can therefore be summarized as follows: At typical processing temperatures, PDTS
dissolves homogeneously in the PP melt. On cooling at a temperature around 180oC,
self-assembly of PDTS molecules creates a network of intermeshing nanofibrils. These fi-
brils serve as highly dispersed nucleation sites for PP crystallization. The multitude of
nucleation sites effectively limits spherulite growth to dimensions well beyond 1 µm and
yields greatly improved clarity.
Furthermore the increased crystallization temperature favors the development of the
thermodynamically more stable and more transparent γ-modification (Figure 2). Growth of
β-spherulites is therefore effectively suppressed.
Transparent Metallocene-Polypropylene 149

It is only recently with the advent of metallocene catalysts that PP homo- and copoly-
mers with uniform molecular and compositional distribution have become available.3
Selected properties of Z-N PP and metallocene PP are compared in Table 1. The homoge-
neous composition of metallocene PP homopolymers synergistically works together with
third generation nucleating agents to achieve a level of clarity that was previously only
thought possible in random copolymers, while retaining the high stiffness of PP
homopolymers. Figure 3 shows the different correlation of transparency and stiffness for Z-N
PP and metallocene PP homo- and random-copolymers containing equivalent amounts of
clarifier.
One of the reasons for the improved stiffness at constant transparency of metallocene PP
over conventional Z-N PP is the compositional homogeneity of metallocene PP. High levels
of xylene solubles occurring in conventional Z-N-random-PP act as undesirable plasticizers
and decrease stiffness. Figure 4 shows this increase in xylene solubles for Ziegler-Natta
random-PP with decreasing melting point (i.e., higher comonomer content). In contrast
150 Metallocene Technology
Figure 1. Concentration dependence of PDTS gelation
temperature in PPFigure 2. Dependence of γ-phase content on crystallization
temperature.
Table 1. Characteristics of metallocene PP compared with Ziegler-Natta PP
Property Unit Metallocene homopolymer Ziegler-Natta homopolymer
DSC melting point oC 148 162
Melting enthalpy J/g 97 105
Mw/Mn - 1.9 3.3-5
Xylene solubles wt% 0.4 1.5-5
Chlorine content ppm trace 20
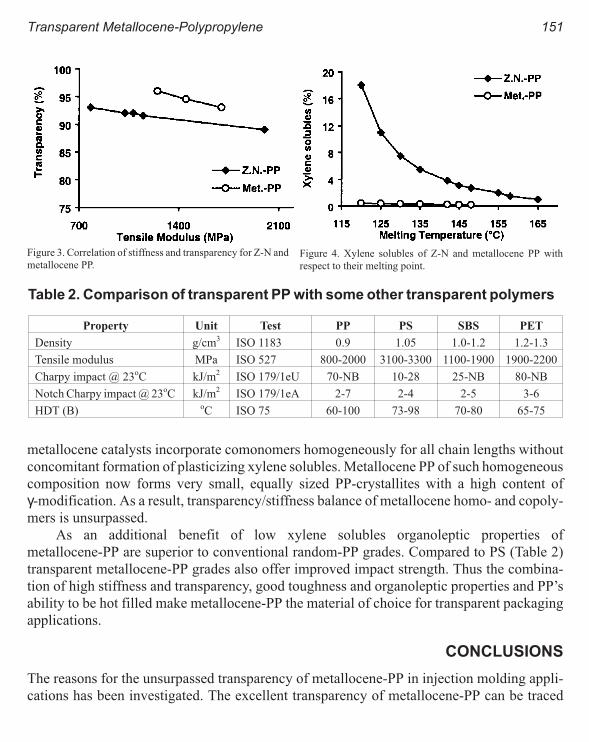
metallocene catalysts incorporate comonomers homogeneously for all chain lengths without
concomitant formation of plasticizing xylene solubles. Metallocene PP of such homogeneous
composition now forms very small, equally sized PP-crystallites with a high content of
γ-modification. As a result, transparency/stiffness balance of metallocene homo- and copoly-
mers is unsurpassed.
As an additional benefit of low xylene solubles organoleptic properties of
metallocene-PP are superior to conventional random-PP grades. Compared to PS (Table 2)
transparent metallocene-PP grades also offer improved impact strength. Thus the combina-
tion of high stiffness and transparency, good toughness and organoleptic properties and PP’s
ability to be hot filled make metallocene-PP the material of choice for transparent packaging
applications.
CONCLUSIONS
The reasons for the unsurpassed transparency of metallocene-PP in injection molding appli-
cations has been investigated. The excellent transparency of metallocene-PP can be traced
Transparent Metallocene-Polypropylene 151
Figure 3. Correlation of stiffness and transparency for Z-N and
metallocene PP.Figure 4. Xylene solubles of Z-N and metallocene PP with
respect to their melting point.
Table 2. Comparison of transparent PP with some other transparent polymers
Property Unit Test PP PS SBS PET
Density g/cm3 ISO 1183 0.9 1.05 1.0-1.2 1.2-1.3
Tensile modulus MPa ISO 527 800-2000 3100-3300 1100-1900 1900-2200
Charpy impact @ 23oC kJ/m2 ISO 179/1eU 70-NB 10-28 25-NB 80-NB
Notch Charpy impact @ 23oC kJ/m2 ISO 179/1eA 2-7 2-4 2-5 3-6
HDT (B) oC ISO 75 60-100 73-98 70-80 65-75

back to two causes. PDTS based nucleating agents achieve a “nanodispersion” of nucleation
sites by a physical gelation mechanism that is related to the peculiar structure of the
benzylidene sorbitols. Such highly dispersed nucleation sites drastically reduce spherulite
size and increase the content of γ-modification both resulting in dramatically improved trans-
parency. This nucleation mechanism synergistically works together with the excellent
compositional homogeneity of metallocene homo- and random copolymers of propylene.
This compositional homogeneity further improves transparency and stiffness. Transparent
metallocene PP will therefore continue to challenge PS in transparent packaging applications
especially when higher toughness is required.
ACKNOWLEDGMENT
The work and the results presented in this paper have been funded and commissioned by
TARGOR GmbH.
REFERENCES
1 R. D. Leaversuch, Modern Plastics Intl.,Vol. 26, No. 12, p. 54 - 57 (1996).
2 J. R. Grasmeder, Proceedings of Metallocenes ‘97 Europe, Dòsseldorf, April 8 - 9, 1997.
3 W. Bidell et al., Proceedings of MetCon ‘96, June 13, 1996.
4 Data from own measurement and G. Lindenschmidt & N. Niessner, Kunststoffe, 85, 1066 - 1074 (1995).
152 Metallocene Technology
Equipment Design Considerations for Processing
with Metallocene Resins
Andrew W. Christie
The Black Clawson Co., 46 North First Street Fulton, NY 13069
INTRODUCTION
Material suppliers are continuously improving and upgrading their offerings to enhance the
performance of the finished product. Periodically dramatic changes occur which significantly
alter the material performance and open new product opportunities. The metallocene cata-
lyzed polyethylenes in the 1970’s, adoption of the new materials into new and existing appli-
cations is initially slow. There are several reasons for this delay in acceptance including:
1 Misunderstandings of the new material capabilities
2 Risk associated with customer acceptance and balance of properties
3 Costs which are initially high
4 Processability on existing equipment
This paper will discuss the factors affecting processability of these new resins and the
impacts on equipment design.
FACTORS AFFECTING PROCESSABILITY
In any manufacturing process there are three key ingredients that go into making a product.
These are the raw materials, the tools or equipment required to manufacture, and the human
interaction to control the tools and convert the raw material into the finished product. The fin-
ished product has some target specification in physical dimensions and performance charac-
teristics with an associated tolerance on what deviation from the target is acceptable. The
variability in each of the three key ingredients influences the ability to reach the target. The
process of making the final product is the synergistic interaction between the three ingredi-
ents. To understand the role of the equipment design in processing metallocene resins we

must first look at the interactions between all three com-
ponents of the process. The following three tables list
selected variables that have a significant impact on
plastics processing.
The structure of the polymer will dictate the poly-
mer properties. The metallocene catalyst technology
allows tailoring of the polymer structure to obtain spe-
cific finished product properties. The primary structural
elements considered are:
1 molecular weight (MW)
2 molecular weight distribution (MWD)
3 long chain branching (LCB)
4 short chain branching (SCB)
5 comonomer type and amount.
Adjusting these structural elements of the polymer also
affects processing. Increasing the MW while improving
toughness causes the polymer to be more viscous during
processing yielding higher processing temperatures. A
narrow MWD improves strength properties but again
reduces shear thinning yielding higher processing tem-
peratures. A broad MWD will provide higher melt
strength and improved optical properties. A high level
of SCB will reduce crystallinity and stiffness providing
toughness, good optics, and increased permeability.
LCB will increase melt elasticity and surface haze and
reduce gloss. The power of the metallocene technology
is it allows one to build on this combination of proper-
ties as required. The next step is to review how these
polymer property characteristics interact with the equip-
ment design.
EQUIPMENT DESIGN CONSIDERATIONS
We can separate the equipment into three basic areas for
the purpose of this design discussion, the extruder, the
transport system, and the forming system. The key ele-
ments in the extruder being the drive system, the feed
screw with mixer, and the temperature control system.
154 Metallocene Technology
Table 1. Polymer properties
Feed Size & shape
Uniformity
C.O.F. external
C.O.F. internal
Yield strength
Polymer Melting point
Heat capacity
Thermal conductivity
Viscosity
Elasticity
Shear sensitivity
Temperature sensitivity
Thermo-mechanical stability
Melt density
Additives
Table 2. Operation variables
Feed regulation
Screw speed
Temperature set points
Screen pack selection
Back pressure level
Table 3. System properties
Power/torque
Length/diameter
Temperature control
Screw design
Mixer design
Screen changer design
Back pressure valve design*
Melt pump design*
Pipes - length/diameter
Stationary mixer design
Coextrusion adapter design
Die manifold design
Die shape adjustment
* where applicable

The transport system would include all elements in the flow path between the extruder and the
forming system. This could include screen changer, back pressure valve, transfer pipes, sta-
tionary mixer, and metering pump. The forming system may include the coextrusion combin-
ing adapter and the forming die. In most instances the new polymers will be introduced to
enhance the performance of an existing product and will be processed on existing equipment.
It is recommended by the commercial suppliers of metallocene resins to process on
equipment intended for processing linear low density resins. From the previous discussion on
material properties it is apparent as you target higher MW and narrow MWD and reduced
SCS the material will become more difficult to process. Due to the higher crystallinity, higher
viscosity, and reduced shear thinning it will require more energy. On existing equipment this
translates into more horsepower or higher torque with higher processing temperatures and op-
erating pressures. It is not unusual to see an increased power requirement as high as 25%. If
this drive power is not available the options are to increase the drive motor horsepower or
re-gear to a lower screw speed. Care should be taken to maintain an adequate service factor on
both the gear box and the screw root.
The extrusion feed screw and mixer design will control the melt quality during process-
ing. It is impossible to have a single feed screw design that is optimized for all the resins it
may potentially run. For this reason it is most important to consider all current and potential
materials that will be run on the screw and the amount of time they will be run. If the new res-
ins are only a small part of the product mix to be run on a particular machine more
compromise on the performance on that resin can be expected. Some of the short comings of a
particular screw design may be offset by the operating conditions such as an inverted temper-
ature profile to reduce drive amps and keep the temperature low. Again the commercial
suppliers of metallocene polyethylene recommend the use of a barrier screw design.
Typically barrier screw designs achieve higher melting efficiencies with lower shear energy
input. As the energy input to the melt is a linear function of the materials viscosity a material
that exhibits reduced shear thinning will gain more energy during processing. This material
will also develop more pressure in the screw, transport system, and die. The higher system
pressure means increased residence time in the screw contributing to yet higher temperatures.
When a variety of materials are run a back pressure valve may be used to improve the perfor-
mance of a deep screw on less viscous materials by increasing the effective shear rates and
residence times. If a particular machine will be dedicated to running one material an opti-
mized screw design can be developed.
It is important to discuss mixing in regards to screw design. Current state of the art of
screw designs incorporates a mixing element. Typically this will allow increased outputs with
improved quality. These mixing devices will breakdown through shear input (disperse) addi-
tives or unmelt or systematically rearrange (distribute) the flow stream to improve melt
homogeneity and temperature uniformity. Some mixing devices serve both functions. A long
Equipment Design Considerations 155

barrier in a screw design is a form of dispersive mixer. When processing at its design point no
additional dispersive mixing should be required. This is significant as inclusion of a second
high shear mixer will consume more energy and may tend to overheat the polymer. In addi-
tion, many high shear mixers create a considerable pressure drop. This can create a
potentially dangerous situation as most production extruders only have pressure indication
downstream of the mixer. Actual operating pressures in the extruder may be 1-2 thousand psi
higher than indicated by the pressure transducer with a poor pumping high shear mixer. An
optimized mixer design then for metallocene resins should have low to moderate shear, pro-
vide forward conveying to reduce pressure losses, and create multiple flow re arrangements.
The transfer system and the forming system each provide resistance to the polymer flow.
The extruder and feed screw must generate the pressure to overcome this resistance at the
flow rate desired. Changing to a metallocene resin will generally increase the operating pres-
sure of the system. Typically 1/3 or more of the system pressure drop occurs in the final
forming lands of the die. High resistance also occurs in the screen changer and back pressure
valve. Changes through the transfer system that will improve the pressure performance in-
clude increase the screening area, increase pipe diameters, increase valve clearances, and
reduce transport pipe lengths and turns. Note that these first three actions will also each in-
crease the average residence time in the system.
The forming system offers the greatest opportunity to reduce the overall system pres-
sure. Increasing the final die opening is frequently possible by a simple die adjustment. In
other cases it maybe accomplished through minor modifications to the die. A die replacement
is a simple if somewhat costly procedure.
SUMMARY
A new family of metallocene catalyzed polymers has been introduced offering improved per-
formance properties. When targeting increased MW, narrow MWD, and reduced SCB these
polymers will be more difficult to process. Increased extruder torque, low shear screw de-
signs to keep melt temperatures down, as well as low pressure transport and forming systems
will be required for optimum processing. Many existing systems will be adequate for limited
processing at reduced outputs and using operation special operating techniques to keep tem-
peratures and pressures down. Particular attention should be given to mixing devices to en-
hance performance and protect from excessive pressures.
ACKNOWLEDGMENTS
I would like to thank Dr. Harry Mavridas at Black Clawson-SANO for his assistance and
background information. Also Dow and Exxon for their assistance with technical literature
and materials for laboratory trials.
156 Metallocene Technology
Product and Process Developments in the Nitrogen
Autoclave Process for Polyolefin Foam Manufacture
D. E. Eaves and N. Witten
Zotefoams plc, Croydon, UK
INTRODUCTION
There are several processes used for the production of cross-linked polyolefin foams1-3 of
which the two best known are:
THE CONTINUOUS ROLL PROCESS
In which a polymer sheet containing blowing agent and crosslinking additives is extruded and
subsequently passed through a series of ovens which effect both the crosslinking and the de-
composition of the blowing agent to initiate the foaming process. Alternatively, the
crosslinking agent can be omitted and crosslinking is then achieved using on-line electron
beam irradiation, although the absorption characteristics of the irradiation limits sheet thick-
ness and process speed. The blowing agent is normally azodicarbonamide (ADC), and the
crosslinking agent dicumyl peroxide.
THE BLOCK FOAM PROCESS
This involves pre-compounding of polymer, blowing agent, and crosslinking additive before
transferring to a heated, heavy duty press where, at a higher temperature, both the
cross-linking reaction and blowing agent decomposition are initiated. Foams of density down
to around 70 kg/m3 may be produced by this means. A process variant involves a second stage
expansion in a separate mold which can yield foams of density down to 25 kg/m3.
Both processes are widely used and account for the majority of crosslinked polyolefin
foam production. However these processes have some disadvantages, namely:
• The foams can carry a characteristic, often unpleasant, odor resulting from the per-
oxide, together with ADC decomposition products (which include ammonia).

• The foams, particularly block process materials, can suffer from density variations
(and hence property variations) through the thickness.
• Residual solids from the blowing agent are left in the foams.
• The foam cell structure is non-uniform.
• Dimensional changes can occur post manufacture through diffusional exchange of
blowing agent gases with air.
• Property anisotropy can result from non-uniform expansion during processing.
THE NITROGEN AUTOCLAVE PROCESS
This process, although not widely used, has been operated commercially for over 60 years (by
Zotefoams plc, Croydon, UK). There are three main stages i.e.:
STAGE I - EXTRUSION
A solid sheet of polymer is extruded and crosslinked using peroxides or irradiation. The solid
extrudate is cut to size with profile, surface quality, dimensions, and crosslink level all being
regularly assessed. There is no blowing agent addition at this stage.
STAGE 2 - GASSING & NUCLEATION
The cut slabs are loaded into autoclaves typically rated up to 69 MPa (10000 psi). The tem-
perature is raised above the softening point of the polymer and pure nitrogen (the blowing
agent) is introduced at high pressure. The solubility of nitrogen in polyethylene at a given
temperature is linearly related to gas pressure by Henry’s Law and this relationship controls
the amount of nitrogen dissolved in the polymer and hence the final foam density. A further
factor is crosslinking, which not only
improves the physical strength of the
finished foam, but stabilizes the sheet at
the gas uptake stage, preventing poly-
mer flow. When complete saturation
with nitrogen has been achieved, a rapid
reduction in the pressure effects nucle-
ation as the gas comes out of solution.
This nucleation step is critical and is ac-
curately controlled since variation of the
rate of gas release affects the cell size of
the finished foam. The autoclave is then
cooled and slabs removed for transfer to
stage 3. The product at this stage is some
30% greater in volume than the original
158 Metallocene Technology
Figure 1. SEM micrograph showing the nucleated celles in a
semi-solid (prior to expansion) sheet.

and is essentially a foam of density ~ 720 kg/m3. The size of the nucleated cells, which con-
tain trapped nitrogen at the pressure of the autoclave, is of the order of 80 to 100 microns (see
Figure 1).
STAGE 3 - FINAL FOAM EXPANSION
This final stage involves reheating the slabs under low pressure in a second autoclave to
above the softening point of the polymer. At this point pressure is reduced and the slabs ex-
pand fully to a size dependent on the gas pressure in the cells and the original extruded solid
size. Although the foam at this stage contains only nitrogen, eventually diffusion occurs ex-
changing the internal gas with air. However, since air is mostly nitrogen, there are no signifi-
cant dimensional changes and no maturing is needed.
PROCESS & PRODUCT ADVANTAGES/DISADVANTAGES
Advantages are:
• Ability to control density and cell size by process, not formulation, variations.
• Environmental acceptability - the expansion agent is “borrowed” from the atmo-
sphere, used to expand the foam, and then returned.
• Purity of product - there are no solid residues from blowing agent.
Product and Process Developments 159
Figure 2. (left) SEM micrograph showing the cell structure of a LDPE foam from the autoclave process. (right) SEM micrograph
showing the cell structure of a typical chemically blown, irradiation crosslinked PE foam.

• Uniform cell structure, close to a pentagonal dodecahedron. Comparison with a
chemically blown foam is shown in Figures 2(left) and 2(right). The structural dif-
ferences are manifested in such foam properties as tensile strength and compres-
sion set, as shown in Table 1.
Disadvantages are:
• The restricted product form, i.e., thin block, typically 1 m x 2 m x 30 mm (although
long rolls and thick blocks can be produced post manufacture by heat welding).
• The high capital cost of the process equipment. (Running costs however, tend to be
lower than chemical blow processes, particularly at densities below 60 kg/m).
PRODUCT AND PROCESS DEVELOPMENTS FROM THE AUTOCLAVE
PROCESS
HIGH DENSITY POLYETHYLENE (HDPE) FOAM
The process can provide a clear separation between extrusion to produce polymer slabs, sub-
sequent crosslinking by off-line irradiation, and introduction of blowing agent (N2) in the
high pressure autoclave. This allows high temperatures to be used at extrusion (e.g. > 200oC)
which in other processes would result in premature decomposition and reaction of
crosslinking agent and/or blowing agent. Thus, foams based on HDPE (polymer density 0.96
g/cm3, extrusion temperature around 200oC) can be produced using the autoclave process and
are commercially available. Properties of these foams (designated HD) are shown in Table 2.
Applications are mainly in areas requiring either cushioning performance at higher impact
levels (e.g., lining for trauma protection in military helmets), or higher operating tempera-
tures.
160 Metallocene Technology
Table 1. Representative properties of autoclave processed vs. chemically
blown foams (ASTM test methods)
Property UnitsAutoclave
process
Chemical blow process
Block Continuous roll
Polymer raw material - LDPE LDPE LDPE
Foam density kg/m3 42 48 41
Tensile strength kPa 585 320 330
Elonagation @ break % 146 120 80
Compression set (50%/22 h)
2 h recovery
24 h recovery
%
8
7
27
15
17
14

MEDIUM DENSITY POLYETHYLENE (MDPE) FOAM
Low density polyethylene (LDPE) has a density of about 0.92 g/cm3. A range of polyethylene
variants is available in the density range between LDPE and HDPE, and the properties (e.g.
stiffness) of such materials can also be approached by blending polyethylenes of appropriate
densities. Such materials have higher processing temperatures than LDPE, but may be
foamed by the autoclave process using the irradiation crosslink route, as for HDPE above.
Such foams (designated HL) are also in commercial production, and properties are again
shown in Table 2. The higher stiffness, compression strength, and creep resistance of these
foams compared with LDPE foams, together with retention of the ability to recover from high
compression strain (due to the uniform cell structure), gives these foams exceptional perfor-
mance in cushion packaging applications.
Examples of cushion curves comparing HL foams with non-crosslinked (non-YL) pack-
aging foams based on LDPE are shown in Figure 3. Performance of the non-XL LDPE foam
is matched by an HL foam at half the non-XL foam density. A comparison of cushioning effi-
ciency of different foam types can be made by calculating the weight efficiency factor:4
WFoam density
Energy absorbed per unit volume at CR =
min
Table 3 shows such a comparison, again illustrating the effectiveness of HL foams in
cushioning applications.
Product and Process Developments 161
Table 2. Summary of the properties of HDPE and HD/LD blend foams produced
using the nitrogen autoclave process
DensityCompressive
strength
Tensile
strength
Elongation
at break
Flexural
modulus
Tear
strength
Compression
set
Test
method
ISO
845:
1988
BS 4370: Pt
1: 3a:1988
ISO
1798:
1983
ISO
1798:1983
BS 4370:
Pt 4:14:
1988
ISO
8067:
1991
ISO
1856:C:1980
Units kg/m3 kPa kPa % MPa N/m %
HD 30
HD 60
HD 115
30
60
115
115
300
710
825
2230
2860
55
110
110
3.6
11.0
23.0
1320
2725
6000
7
11
11
HL 34
HL 47
HL 79
34
47
79
90
130
275
700
800
1350
50
50
100
2.2
5.2
11.9
1200
2000
4500
9
9
9

162 Metallocene Technology
Figure 3. Cushion curves comparing HL grade foams from autoclave process with typical non-crosslinked polyethylene
packaging grade foams. Note the density of the respective grades.
Table 3. Cushioning-weight efficiency factors (WR) for HL, LD and non-cross-
linked packaging foam grades
Foam grade Density, kg/m3 1
stdrop WR,
10-4
m-1 1
stdrop mean
3rd
drop WR,
10-4
m-1 3
rddrop mean
LD
21
29
44
69
44
48
54
46
48
48
63
66
62
60
HL
33
47
56
26
30
22
26
44
42
35
41
Non-crosslinked
35
54
100
57
57
57
57
74
76
84
78

METALLOCENE BASED FOAMS
Polyethylenes and other polyolefins produced using metallocene catalysts are now commer-
cially available, and are claimed to have advantageous properties (e.g. film strength) com-
pared with other polymers of comparable density and MFI although some disadvantages in
processing have been reported.5
A range of metallocene catalyzed polyethylenes have been foamed using the autoclave
process, and foam properties evaluated. It has been found that not all polymers are readily ex-
panded by the process, nor are clear property advantages always demonstrated. However,
selected grades have been found to foam without significant process difficulties and excep-
tional properties (tear strength, tensile strength, elongation and thermoformability) in
comparison with LDPE based foams have been obtained. Properties of autoclave foams
based on metallocene catalyzed polyethylene (polymer density 0.91-0.92 g/cm3, designated
W) are shown in Table 4 (note the high tear and tensile strengths).
The versatility of metallocene catalysts also allows production of polyethylenes of lower
polymer density and with a flexibility similar to EVA copolymers. These grades have also
been evaluated using the autoclave process. Again, not all grades are readily “foamable” or
give advantageous foam properties, but some grades can be foamed and show improved ten-
sile and tear strength compared with EVA foams. A comparison of a flexible metallocene
foam (using polymer density 0.87-0.89 g/cm3, designated MV) with EVA foam, both from the
autoclave process, is shown in Table 5.
Product and Process Developments 163
Table 4. Property comparison of nitrogen autoclave processed foams based
on a metallocene-catalyzed polyethylene (MP) and standard density polyethyl-
ene (LD)
Property Test method UnitDensity=24 kg/m
3Density=33 kg/m
3Density=45 kg/m
3
MP LD MP LD MP LD
Comp. stress
@ 25% strainISO 3386/1 kPa 42 35 50 40 61 50
Comp. stress
@ 50% strainISO 3386/1 kPa 117 100 134 115 155 135
Tensile strength ISO 1798 kPa 585 340 707 455 931 600
Elongation
at breakISO 1798 % 170 105 205 135 224 150
Tear strength ISO 8067 N/m 896 410 1433 690 2335 1030
Comp. set ISO 1856/C % 8 8 5 7 4 7

POLYPROPYLENE FOAM
In comparison with polyethylene, polypropylene has a temperature performance some 30oC
higher owing to its higher softening point. The main problem in production of a crosslinked
polypropylene foam, where superior performance at elevated temperatures can be antici-
pated, has always been the different reactivity to peroxide or irradiation, which will crosslink
polyethylene but will cause chain scission of polypropylene.
An approach to overcoming this problem is to use a blend of polypropylene copolymer
and polyethylene (which also reduces processing temperature) together with a crosslink pro-
moter such as tri-allyl cyanurate (TAC). However, the presence of polyethylene in the blend
reduces temperature performance, and many crosslink promoters present health risks if used
in open processes.
It has been found possible by using selected polypropylene copolymers to achieve a pro-
cessing window within which the polymer slabs have sufficient stability to retain their shape
during autoclave gassing, and expand subsequently without collapse. This process window is
retained by the foam and allows the foam to be thermoformed similarly to a crosslinked foam.
Since no polyethylene is incorporated, good performance at elevated temperature is assured,
and the absence of covalent crosslinks together with a 100% polypropylene system, result in
total recyclability if temperatures are raised above the process window.
This foam, (designated PA) has been developed over the last few years and is now com-
mercially available. Properties are shown in Table 6.
164 Metallocene Technology
Table 5. Comparison of properties of foams produced by the nitrogen auto-
clave process based on EVA copolymers with differing vinyl acetate contents
and a low density (0-67-89 g/cm3) metallocene-catalyzed polyethylene elasto-
mer (MV)
Property Method UnitEVA
(9% VA)
EVA
(18% VA)
EVA
(18% VA)MV
Density ISO 845 kg/m3 35 30 50 35
Comp. stress @ 25% strain ISO 3386/1 kPa 35 35 40 37
Comp. stress @ 50% strain ISO 3386/1 kPa 105 100 110 103
Tensile strength ISO 1798 kPa 620 740 930 1050
Elongation at break ISO 1798 % 200 200 220 246
Tear strength ISO 8067 N/m 730 800 1300 1384
Compression set ISO 1856 % 7 9 6 8

SPECIALITY FOAMS
Incorporation of FR additives (antimony trioxide/halogen compounds) at the extrusion stage
provides self-extinguishing foams; incorporation of electrically conducting additives, such as
high structure carbon black, provides foams with electrical conductivity. A recent develop-
ment has been foam having electrical conductivity in the static dissipative (SD) range
(105-109 1/sq surface resistivity). SD properties are not easy to achieve by the use of conduc-
tive additives since conductivity is very sensitive to additive level in this range - foams tend to
change from insulative (> 1012 1 /sq) to conductive (< 104 1/cm) with only a small increase in
additive level. However, by suitable choice of carbon black it has been found possible to de-
crease this sensitivity, and this together with additional mixing control at the extrusion stage,
has made possible the production of an LDPE foam with static dissipative properties, as
shown in Table 7.
Product and Process Developments 165
Table 6. Properties of 100% polypropylene copolymer foam produced by the ni-
trogen autoclave process. Benefits include the higher temperature resistance
and the recyclability of the foam
Property Test method Unit Polypropylene foam (PA)
Density ISO 845:1988 kg/m3 30
Compression stress at 25% strain ISO 3386/1:1986 kPa 60
Compression stress at 50% strain ISO 3386/1:1986 kPa 150
Tensile strength ISO 1798:1983 kPa 575
Elongation at break ISO 1798:1983 % 24
Tear strength ISO 8067:1991 N/m 875
Compression set ISO 1856:C:1980 % 7
Table 7. Properties of conductive (CN) and static dissipative (SD) foam based
on low density polyethylene produced using the nitrogen autoclave process
Property Test method Unit LD 32 CN LD 50 CN LD 30 SD
Density ISO 845 kg/m3 30 50 30
Compression stress at 25% strain ISO 3386/1 kPa 55 80 45
Compression stress at 50% strain ISO 3386/1 kPa 130 175 120
Tensile strength ISO 1798 kPa 370 610 300
Elongation at break ISO 1798 % 50 50 65
Volume resistivity ASTM D991 Ω.cms 5x10³ 1x10³ -
Surface resistivity EOS S-11.11 Ω/sq - - 1x10⁷

FUTURE DEVELOPMENTS
In crosslinked foam processes other than the autoclave process it becomes increasingly diffi-
cult to manufacture foams having densities below about 25 kg/m3. The restrictions are partly
technical (compounding problems with high levels of blowing agent, handling problems with
very low density foam in the hot state and the presence in the foam of substantial amounts of
solid residues) and partly economic (the high cost of additional blowing agent). The auto-
clave process allows lower foam densities to be produced by raising either the gassing tem-
perature or the gassing pressure, both of which increase the quantity of nitrogen dissolving in
the polymer, and hence the degree of expansion. Development materials with foam densities
as low as 10 kg/m3 have been produced, and the physical limit of expansion has not yet been
reached. Plant modifications are in hand to enable commercial production of 15 kg/m3 foam,
initially based on LDPE, and properties of such materials are shown in Table 8.
ACKNOWLEDGMENTS
Thanks are due to the staff of the Technical department at Zotefoams plc for producing much
of the data contained in this paper and to the management of the company for permission to
publish.
REFERENCES
1 Eaves D.E., Cellular Polymers, 7, 4, 1988, p 297.
2 Puri R.R. & Collington K.T., Cellular Polymers, 7, 1, 1988, p 56.
3 Puri R.R. & Collington K.T., Cellular Polymers, 7, 3, 1988, p 2l9.
4 Eaves D.E., 2nd Intl. Conference on Cellular Polymers, Edinburgh, 1993.
5 Oxley D., European Plastics News, May 1997, p 2l.
166 Metallocene Technology
Table 8. Comparative properties of foams based on low density polyethylene
with densities as low as 10 kg/m3, produced using the nitrogen autoclave pro-
cess
Property Test method UnitFoam density, kg/m
3
10 24 45
Compression stress at 25% strain ISO 3386/1 kPa 26 35 50
Compression stress at 50% strain ISO 3386/1 kPa 86 100 135
Tensile strength ISO 1798 kPa 174 340 600
Elongation at break ISO 1798 % 100 105 150
Tear strength ISO 8067 N/m 339 410 1030
Compression set ISO 1856:C % 12 8 7

Properties of Syndiotactic Polypropylene Fibers
Produced from Melt Spinning
Mohan Gownder
Fina Oil and Chemical Company
INTRODUCTION
Research on sPP has gained momentum in recent years primarily due to its ease of synthesis.
Even though Natta2 reported the first preparation of sPP in 1960, it was not possible to pro-
duce sPP of high stereo-regularity until
recently.3 Now, with the advent of
metallocene catalysts, and coupled with
their high activity, it is possible to syn-
thesize propylene into a highly
syndiospecific polypropylene.
The rules that govern the conforma-
tion of molecules, and their
crystallographic packing (polymor-
phism) have been well established in the
literature for sPP.4 It’s single chain con-
formation is helical with two methyl
(CH3) groups per repeat unit (see picture). In comparison, there are three methyl groups per
repeat unit for iPP.
The first crystal structure of a polymorph of sPP was reported by Corradini et al. in 1967
based on x-ray diffraction studies.5 This is generally referred to as Cell-I in the literature and
presented in Figure 1. Cell-I contains a C-centered structure with the helical chains packed
isochirally (similar hand) in an orthorhombic unit cell with axes a=14.5 , b=5.6 and c=7.4
, where c is the chain axes. Recently, Lotz et al.6 were successful in showing two additional
interchain packing of the helical chains (shown as Cell-II and Cell-III in Figure 1.) based on
their electron diffraction results. Cell-II has the same dimensions as Cell-I but the helical
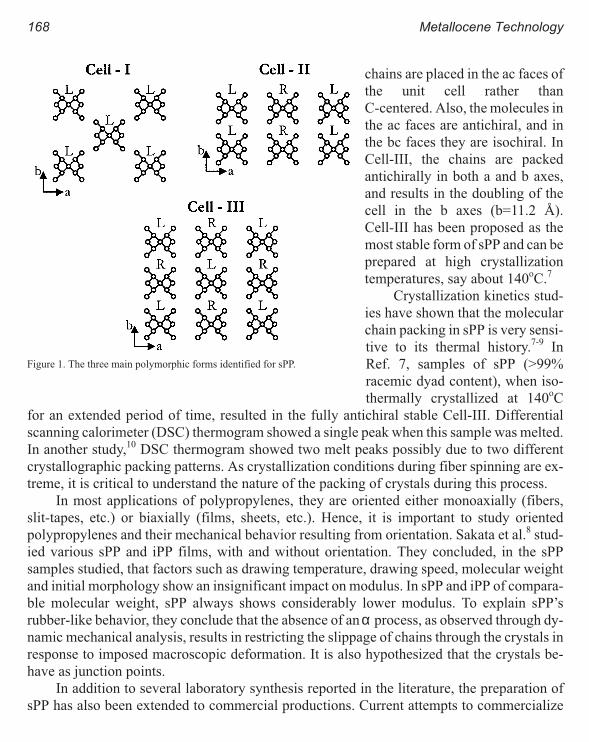
chains are placed in the ac faces of
the unit cell rather than
C-centered. Also, the molecules in
the ac faces are antichiral, and in
the bc faces they are isochiral. In
Cell-III, the chains are packed
antichirally in both a and b axes,
and results in the doubling of the
cell in the b axes (b=11.2 ).
Cell-III has been proposed as the
most stable form of sPP and can be
prepared at high crystallization
temperatures, say about 140oC.7
Crystallization kinetics stud-
ies have shown that the molecular
chain packing in sPP is very sensi-
tive to its thermal history.7-9 In
Ref. 7, samples of sPP (>99%
racemic dyad content), when iso-
thermally crystallized at 140oC
for an extended period of time, resulted in the fully antichiral stable Cell-III. Differential
scanning calorimeter (DSC) thermogram showed a single peak when this sample was melted.
In another study,10 DSC thermogram showed two melt peaks possibly due to two different
crystallographic packing patterns. As crystallization conditions during fiber spinning are ex-
treme, it is critical to understand the nature of the packing of crystals during this process.
In most applications of polypropylenes, they are oriented either monoaxially (fibers,
slit-tapes, etc.) or biaxially (films, sheets, etc.). Hence, it is important to study oriented
polypropylenes and their mechanical behavior resulting from orientation. Sakata et al.8 stud-
ied various sPP and iPP films, with and without orientation. They concluded, in the sPP
samples studied, that factors such as drawing temperature, drawing speed, molecular weight
and initial morphology show an insignificant impact on modulus. In sPP and iPP of compara-
ble molecular weight, sPP always shows considerably lower modulus. To explain sPP’s
rubber-like behavior, they conclude that the absence of anα process, as observed through dy-
namic mechanical analysis, results in restricting the slippage of chains through the crystals in
response to imposed macroscopic deformation. It is also hypothesized that the crystals be-
have as junction points.
In addition to several laboratory synthesis reported in the literature, the preparation of
sPP has also been extended to commercial productions. Current attempts to commercialize
168 Metallocene Technology
Figure 1. The three main polymorphic forms identified for sPP.

sPP have aimed at the same applications isotactic polypropylenes are being used. In this
study, a sPP and iPP of comparable MFI will be compared for their carpet fiber applications.
It will be seen that even though sPP and iPP belong to the same group, as polyolefins, the
properties vary widely. To study the structure, DSC and X-ray diffraction were used. All the
fiber samples in this study were prepared in a melt spinning machine.
EXPERIMENTAL
Both the sPP and iPP used in this study were produced commercially in the pellet form by
Fina Oil and Chemical Company in La Porte, TX. The sPP, synthesized using a metallocene
catalyst, has a melt flow index of 8 and the iPP, synthesized using a Ziegler-Natta catalyst, has
a melt flow index of 9. The molecular weight (Mw) for sPP is 107,000 and that for iPP is
248,000. The syndiotacticity of sPP measured by 13C NMR shows the racemic pentad (rrrr)
content to be 77% and the racemic dyad content to be 91%. The isotacticity measurement on
the iPP shows the meso pentad content to be 91% and the meso dyad content to be 95%.
The melt temperature in a fiber spinning machine was set at 235oC for sPP and 230oC for
iPP. Two 60-hole, trilobal spinnerettes were used to collect fibers with a linear density of
about 1100 denier (denier = g/9000 m). One set of fibers, collected at various spinning speeds
(hence orientation only in the melt state), was subjected to wide-angle x-ray diffraction
(WAXD). Another set of fibers was collected at different draw ratios with the final speed kept
at 1000 m/min. These were tested for their physical properties using an Instron tensile testing
machine (elongation, tenacity, elastic recovery and permanent deformation when cyclically
deformed). For the elastic recovery test, a deformation sequence based on ASTM D1774-90
is followed. It consists of a constant rate (10%/min) loading and unloading, with a maximum
strain of 10% (and also 50%) maintained for 1 min duration in between the ramps. This cycle
is repeated after a 3 min interval. Fibers for both sPP and iPP drawn at 3:1 were also tested for
elongation and tenacity after 3 months to determine if aging had any effect on the properties.
WAXD patterns were recorded at room temperature with a Siemens diffractometer using
Ni-filtered CuKα radiation (λ= 1.54 ) and a step-scan procedure. The range of 2θ diffraction
angle examined was between 3 and 35o with a step-scanning rate of 0.08o/sec and a counting
time of 8 sec at each step. For the fiber samples, x-ray diffraction was along the fiber axis (me-
ridional scans).
Dynamic mechanical tests were performed on the fibers using a rheometer (Mark-IV of
Rheometrics Scientific). The fibers were deformed sinusoidally in the axial direction with a
static deformation also applied on the fiber during the test. The tests were conducted in the
linear viscoelastic range. Dynamic moduli (G’ and G’’) and tanδwere measured for a temper-
ature range of -30 to 100oC at 10 Hz.
Properties of Syndiotactic Polypropylene 169

RESULTS AND DISCUSSION
During melt spinning, the
polymer melt is formed into
filaments by extrusion
through a spinnerette. After
the filaments thin down and
solidify, they are also ori-
ented (drawn) to improve
their mechanical properties.
Table 1 shows the process-
ing conditions during the spin and draw of sPP and iPP fibers. The sPP fibers extruded from
the spinnerette were sticky due to their low solidification rate. Hence, it was not possible to
measure its spin tension (the strands stuck to the tensiometer). The very low draw tension of
sPP was due to its extreme softness even until the drawing stage. Increasing the quench rate or
reducing the quench temperature did not improve this condition. The maximum draw ratios
for both the materials were the same. The sPP fibers produced were also elastic in nature and
texturizing the fibers did not provide enough bulk to the yarn. The fibers were soft compared
to a commonly used bulk-continuous-fiber (bcf).
As has been observed in the literature, the as-prepared sPP tested in the DSC showed two
melting peaks (Tm), one at 115oC and the other at 130oC. The iPP melting peak was at a much
higher temperature of 160oC. Study of fiber structure dependency with orientation using DSC
will improve our understanding of the melt spinning of sPP. This will be the subject of a future
study.
Figure 2 shows the tenacity of sPP
and iPP fibers, drawn to 3:1 ratio during
melt spinning, extended until break. Fig-
ures 3 and 4 show the maximum
elongation and tenacity of the fibers pre-
pared at various draw ratios. The
elongation for sPP fibers is independent
of the draw ratio. Normally for an iPP, as
seen in Figure 3, the elongation decreases
with draw ratio. In iPP fibers, an increase
in melt orientation aligns the molecular
chains in the direction of the fiber axis and
upon solidification the molecules are re-
170 Metallocene Technology
Table 1. Processing conditions during fiber spinning
Property iPP sPP
Melt temperature 230 235
Spin tension at 3:1 draw and G2= 1000 m/min (gf) 54 -
Draw tension at 3:1 draw and G2=1000 m/min (gf) 2000 150
Max draw at G2=1000 m/min 3.6 3.6
Figure 2. Tenacity vs. extension for both sPP and iPP fibers drawn at
3:1 during fiber spinning.

tained in the same state. In the case of sPP
fibers, since solidification is delayed, the
molecules have time to relax and keep the
same conformation even though they are ex-
tended in varying degrees during the melt
spinning process. This can also be seen in
Figure 4 for the plot of tenacity vs. draw ra-
tio. The tenacity for sPP fibers is
independent of the draw ratio whereas for
iPP, it increases with draw ratio. It has been
surmised in the literature11 that the presence
of entanglements and crystallites in sPP pre-
vent molecules from sliding past each other
thereby reducing the maximum elongation.
The free shrinkage of the two fibers were tested at 125oC. The sPP shows a much higher
shrinkage compared to iPP. This is probably due to the highly entropic nature of drawn sPP,
and when the thermal energy is supplied, the stretched molecular chains revert to their origi-
nal conformation thus causing excessive shrinkage in the fiber.
During processing in a textile operation, the fibers come under varying degrees of load.
To estimate the capability to withstand these loads and also to estimate the elastic recovery
without any permanent deformation, the two sPP and iPP fibers were subjected to
load-deformation and cyclic tests. Figure 5 shows the tenacity at 5 consecutive cycles of load-
ing and unloading of the sPP and iPP fibers. The elastic nature of sPP is quite evident in that
Properties of Syndiotactic Polypropylene 171
Figure 3. Elongation as a function of draw ratio for iPP and
sPP fibers.
Figure 4. Tenacity as a function of draw ratio for iPP and sPP
fibers.
Figure 5. Tenacity vs. extension for sPP and iPP fibers (3:1 draw)
for 5 cycles. The cyclic input is shown in the inset.
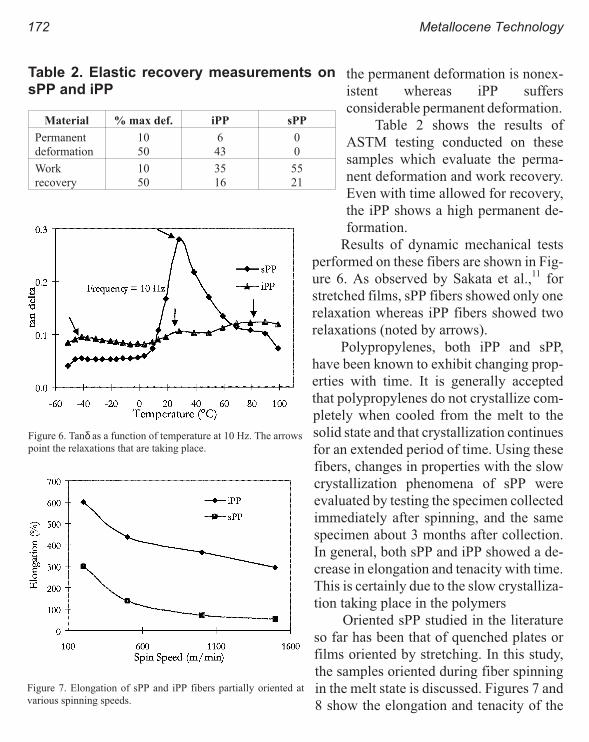
the permanent deformation is nonex-
istent whereas iPP suffers
considerable permanent deformation.
Table 2 shows the results of
ASTM testing conducted on these
samples which evaluate the perma-
nent deformation and work recovery.
Even with time allowed for recovery,
the iPP shows a high permanent de-
formation.
Results of dynamic mechanical tests
performed on these fibers are shown in Fig-
ure 6. As observed by Sakata et al.,11 for
stretched films, sPP fibers showed only one
relaxation whereas iPP fibers showed two
relaxations (noted by arrows).
Polypropylenes, both iPP and sPP,
have been known to exhibit changing prop-
erties with time. It is generally accepted
that polypropylenes do not crystallize com-
pletely when cooled from the melt to the
solid state and that crystallization continues
for an extended period of time. Using these
fibers, changes in properties with the slow
crystallization phenomena of sPP were
evaluated by testing the specimen collected
immediately after spinning, and the same
specimen about 3 months after collection.
In general, both sPP and iPP showed a de-
crease in elongation and tenacity with time.
This is certainly due to the slow crystalliza-
tion taking place in the polymers
Oriented sPP studied in the literature
so far has been that of quenched plates or
films oriented by stretching. In this study,
the samples oriented during fiber spinning
in the melt state is discussed. Figures 7 and
8 show the elongation and tenacity of the
172 Metallocene Technology
Table 2. Elastic recovery measurements on
sPP and iPP
Material % max def. iPP sPP
Permanent
deformation
10
50
6
43
0
0
Work
recovery
10
50
35
16
55
21
Figure 6. Tanδ as a function of temperature at 10 Hz. The arrows
point the relaxations that are taking place.
Figure 7. Elongation of sPP and iPP fibers partially oriented at
various spinning speeds.
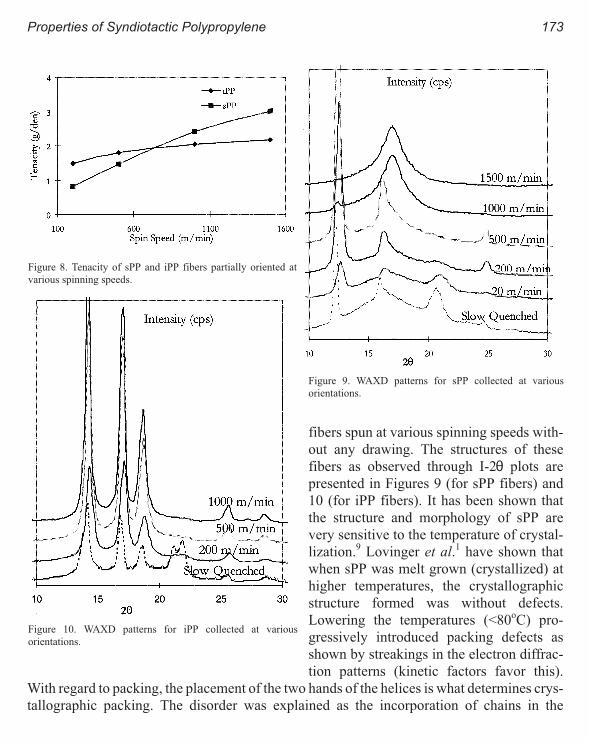
fibers spun at various spinning speeds with-
out any drawing. The structures of these
fibers as observed through I-2θ plots are
presented in Figures 9 (for sPP fibers) and
10 (for iPP fibers). It has been shown that
the structure and morphology of sPP are
very sensitive to the temperature of crystal-
lization.9 Lovinger et al.1 have shown that
when sPP was melt grown (crystallized) at
higher temperatures, the crystallographic
structure formed was without defects.
Lowering the temperatures (<80oC) pro-
gressively introduced packing defects as
shown by streakings in the electron diffrac-
tion patterns (kinetic factors favor this).
With regard to packing, the placement of the two hands of the helices is what determines crys-
tallographic packing. The disorder was explained as the incorporation of chains in the
Properties of Syndiotactic Polypropylene 173
Figure 8. Tenacity of sPP and iPP fibers partially oriented at
various spinning speeds.
Figure 9. WAXD patterns for sPP collected at various
orientations.
Figure 10. WAXD patterns for iPP collected at various
orientations.

c-centered (Cell I) manner together with row vacancies.6 Lovinger et al.1 concluded that in
single crystals of highly syndiotactic polypropylenes, the preferred mode of packing is Cell
III. In Figure 9, the occurrence of 010 reflection at 2θ=16.0o reveals the packing mode of the
kind Cell II. Fiber samples collected with slight orientation, at 20 m/min, the three basic re-
flections are present. With increasing speed (as a result melt orientation), the 100 peak gets
sharper. The 010 peak gets higher in intensity and at the same time, broader. When the speed
is increased from 500 m/min to 1000 m/min, there is a drastic change in the fiber spectra as
100 reflection almost disappears and the 010 peak widens further. At 1500 m/min, there can
be seen only one broad peak. According to Lovinger,1 the breadth of the peak is a result of
substantial packing disorder. Figure 10 shows the reflections of the iPP fibers collected at var-
ious spinning speeds. The crystalline content of iPP increases with spin speed as the peaks are
getting sharper with increase in speed. The x-ray diffraction patterns clearly differentiates the
crystallization tendencies of the sPP and iPP fibers.
Lovinger et al.1 also identified anisotropic thermal properties and the mobility of point
vacancies and state these have a profound effect on the weakening of the mechanical proper-
ties of sPP. This is severe in processes such as fiber spinning where rapid cooling of the sPP
melt is involved.
CONCLUSIONS
The crystallographic packing of the sPP molecules are highly dependent on the thermal and
mechanical history. It is shown here, from x-ray diffraction patterns, that quenching the sPP
melt at lower temperatures (due to cool air at 10oC from the quench column of fiber spinning
machine) and simultaneously orienting has introduced packing defects in the structure of sPP
fiber. It was proposed earlier1 that this would have a negative effect on the mechanical proper-
ties of sPP. This is reflected in the lower elongation and tenacity of the spun and drawn fibers.
However sPP possesses a high work recovery and low permanent deformation which are es-
sential for spinning carpet fibers.
ACKNOWLEDGMENTS
The author gratefully acknowledges the assistance of Jay Nguyen in preparing the fiber sam-
ples, Ed Zamora, Sam Curtis and Rebecca Davis in characterization. The author wishes to
thank Al Baumgartner and David Rauscher for their helpful conversations during this study.
The author also wishes to thank Michel Daumerie, and Fina Oil and Chemical Company for
their encouragement and support.
REFERENCES
1 Lovinger, A.J.; Lotz, B.; Davis, D.D.; Schumacher, M., Macromolecules, 1994, 27, 6603.
174 Metallocene Technology

2 Natta, G.; Pasquon, I.; Corradini, P.; Peraldo, M.; Pegoraro, M.; Zambelli, A., Rend. Acd Naz. Lincei, 1960, 28, 539.
3 Ewen, J.A.; Jones, R.L.; Razavi, A.; Ferrera, J.D., J. Am. Chem. Soc., 1988, 110, 6255.
4 Lotz, B.; Wittmann, J.C.; Lovinger, A.J., Polymer, 1996, 37, 4979.
5 Corradini, P.; Natta, G.; Ganis, P.; Temussi, P.A., J. Polym. Sci., Part C, 1967, 16, 2477.
6 Lotz, B.; Lovinger, A.J.; Cais, R.E., Macromolecules, 1988, 21, 2375.
7 Lovinger, A.J.; Lotz, B.; Davis, D.D.; Padden, Jr. F.J., Macromolecules, 1993, 26, 3494.
8 Lovinger, A.J.; Davis, D.D., Macromolecules, 1991, 24, 552.
9 Rodriguez-Amold, J.; Zhang, A.; Cheng, S. Z. D. et al., Polymer, 1994, 35, 1884.
10 Loos, J.; Buhk, M.; Petermann, J.; Zoumis, K.; Kaminsky, W., Polymer, 1996, 37, 387.
11 Sakata, Y.; Unwin, A.P.; Ward, I. M., J. Mater. Sci., 1995, 30, 5841.
Properties of Syndiotactic Polypropylene 175

Melt Spinning of Syndiotactic Polypropylene:
Structure Development and Implications for Oriented
Crystallization
Ravi K. Sura, Prashant Desai and A.S. Abhiraman
Polymer Education & Research Center, Georgia Institute of Technology Atlanta, GA 30332
INTRODUCTION
Stereoregular polymers prepared using metallocene catalyst systems have become quite im-
portant. The different molecular configurations of these polymers leads to changes in crystal-
lization and melting behavior. These changes affect the properties of products made from
these polymers. In the present study, syndiotactic polypropylene (sPP) was melt spun and the
fibers analyzed to understand development of structure and morphology.
Most studies of sPP have focused on conformational structure and the nature of crystals,
usually in the form of isotropic films. Only a few studies1,2 have examined oriented products
such as fibers. It is well known that orientation has a profound effect on the rate and extent of
crystallization in melt spinning. A theoretical framework has been developed that explains
the enhancement in crystallization kinetics because of enhanced orientation.3 Higher strain
rate, at higher spinning speed, results in greater segmental orientation prior to crystallization.
However, it can also change the conformational composition of the sPP segments and, conse-
quently, the crystallization behavior of oriented sPP filaments.
EXPERIMENTAL DETAILS
MATERIALS AND PROCESSING
Syndiotactic polypropylene (sPP) with melt flow rate of 8 at 230oC was used in this work.
Melt spinning was conducted at 230oC in a PP research melt spinning line at a commercial re-
search laboratory. A 7-hole spinneret was used, fed from a twin-screw extruder via a metering
pump. Take-up speeds were varied from 100 to 2000 m/min with the throughput adjusted to
give a linear density of 2 denier per filament (denier = g/9000 m).

CHARACTERIZATION TECHNIQUES
The melt spun fibers were studied using WAXD, thermal analysis (DSC and DMS), tensile
testing, sonic modulus, birefringence, and solid-state CP/MAS measurements.
Since fibers are usually drawn to obtain superior properties, a simulated drawing experi-
ment was also conducted by Thermal Deformation Analysis (TDA). This involves the
measurement of changes in length of filaments when they are subjected to a constant axial
force and heated rapidly to a temperature between Tg and Tm. The apparatus consists of a tem-
perature controlled tubular heater mounted on a mobile platform that can be moved rapidly
over rails to enclose the loop of filaments being tested. The fiber is connected at each end to
Kevlar yarns, one of which is connected to a fixed support while the other is passed over a
smooth pulley and attached to a weight. A pointer is attached to the moving end so that the de-
formation can be read against a scale. The deformation of the Kevlar yarn can be neglected
when compared to that of a filament loop. In one type of this analysis, called the Isothermal
Deformation Analysis (ITDA), the temperature of the heater is set and the experiment is
started by hanging a constant weight to the fiber loop. The heater is then moved rapidly over
the fiber so that it completely encloses it, maintained in this position for a period of 10 sec-
onds to ensure complete deformation of the fiber under the applied stress and temperature,
and rapidly withdrawn. The deformation is obtained from the change in length of the loop.
The fiber samples after deformation are collected for analysis.
A similar set-up was used to perform a non-isothermal stress analysis (NTSA) where the
fiber is attached to a load cell at one end and constrained at the other end. It is enclosed in a tu-
bular heater and the temperature increased from room temperature to the failure point of the
fibers. The stress developed in the fiber, as a function of temperature, is recorded.
RESULTS AND DISCUSSION
sPP was melt spun at various wind-up speeds ranging from 100 to 2000 m/min. It was ob-
served that at spinning speeds greater than 1000 m/min, the fibers tended to stick to each other
on the take-up roll, which was not the case for lower speeds. This suggested that the high
speed spun (HSS, greater than 1000 m/min) fibers were not as well crystallized. Flat plate
WAXD photographs (Figure 1) show that the low speed spun (LSS, up to 1000 m/min) fibers
are distinctly semi-crystalline with high crystal orientation. The WAXD data also suggest that
there is a change in the crystal structure for the high speed spun.
DSC scans for the various fibers are shown in Figure 2. The typically observed multiple
melting peaks for sPP can be seen for the LSS fibers, while the higher melting peak disap-
pears for the HSS fibers. It has been suggested in the literature that these peaks arise due to
melting and recrystallization while heating the sample. However, there was no shift in the
178 Metallocene Technology

melting peaks when the heating rate
was increased to 40oC/min, which
suggests that the peaks arise from
factors other than purely kinetic
ones. Cold crystallization is detected
in HSS fibers around 75oC.
Sonic modulus and birefrin-
gence decreased with spinning
speed (Figure 3), indicating a de-
crease in overall orientation with
increase in spinning speed. How-
ever, the extent of free shrinkage at
100oC increases from 10% to 70%
as the spinning speed increases from
200 to 2000 m/min (Figure 4). These
data are consistent with increased
orientation of chains in the spinline
at higher speeds, but higher extent of
oriented crystallization at the lower speeds. The tensile properties, shown in Figure 5, support
this view. The breaking stress increases and elongation to break decreases with increasing
speed.
Non-isothermal stress analysis results are shown in Figure 6. Initially there is a reduction
in the shrinkage force due to thermal expansion and orientational relaxation. The LSS fibers
show an increase in shrinkage force close to the melting point (~130oC), possibly due to pro-
gressive melting of oriented crystals and the tendency of the oriented noncrystalline chain
Melt Spinning 179
Figure 1. X-ray photographs of sPP melt spun fibers.
Figure 2. DSC scans of sPP melt spun fibers: 1 - 2000, 2 -
1500, 3 - 1200, 4 - 1000, 5 - 700, 6 - 400, 7 - 200 m/min.Figure 3. Sonic modulus and birefringence of sPP melt spun
fibers as a function of spinning speed.

segments thus formed to coil. However, the
HSS fibers show an increase in shrinkage
force immediately after the relaxation phase
is over. This could be due to chains in the all
trans conformation converting to the helical
-(T2G2)2- conformation, a state in which they
can crystallize. Calculations show that the
conformational change requires approxi-
mately 40% reduction in length. Close to the
melting point, the HSS fibers behave in a
manner similar to LSS fibers.
In order to examine the conformational
sequences in the sPP fibers, solid-state
CP/MAS NMR spectroscopy was conducted.
Melt-cast and solution-cast samples showed the stable, preferred conformation of a -(T2G2)2-
helical structure. The LSS fibers also exhibit a -(T2G2)- conformation, albeit in a different
crystal structure as seen from WAXD equatorial scans. This gradually transforms to an all
trans -(TTTT)- conformation in HSS fibers. The peak assignments were based on literature
values.4-7
NMR measurements were also taken on fibers that were annealed under constraint at
100oC for 3 minutes in an air-circulated oven, to simulate the conditions seen in
nonisothermal stress analysis. It was seen that the LSS fibers continue to remain in the helical
-(T2G2)-conformation, while the HSS fibers transform from an all trans to a helical -(T2G2)2-
conformation.
180 Metallocene Technology
Figure 4. Shrinkage of sPP melt spun fibers as a function of
spinning speed (3 min @ 100oC.)
Figure 5. Breaking stress and elongation to break of sPP melt
spun fibers.
Figure 6. Non-isothermal stress analysis of sPP melt spun
fibers - stress development as a function of temperature in a
constrained fiber.
The as-spun fibers were subjected to nonisothermal deformation analysis to observe the
change in structure under simulated drawing conditions. At low stress levels, the fibers ex-
hibit shrinkage, while higher stress levels are required to “draw” the fibers. The LSS fibers
undergo lower shrinkage at low stress levels and higher elongation at high stress levels, when
compared to the HSS fibers, consistent with the lower noncrystalline orientation in the LSS
fibers. The noncrystalline chains in the LSS fibers can be extended from their almost helical
conformation to a more stretched conformation. X-ray scattering reveals that the fibers sub-
jected to nonisothermal deformation analysis are well crystallized and oriented.
The sPP melt spun fibers were subjected to constrained length annealing (CLA) and free
length annealing (FLA). WAXD data suggest that while LSS fibers do not significantly
change their crystal structure, the HSS fibers become distinctly semi-crystalline and attain a
crystal structure, similar to the LSS fibers, on annealing. The higher sonic modulus on CLA is
consistent with the development of oriented amorphous phase in CLA fibers.
It is well known that the most stable and preferred crystal structure conformation for sPP
is that of helical -(T2G2)2- sequences. At low spinning speeds, the chains do not get stretched
too much out of their helical conformation. As the polymer fiber cools down, crystals are eas-
ily formed as the chains are close to the preferred conformation. However, as the spinning
speed increases, the stress increases and the chains are stretched into the extended all trans
conformation, which is not favorable for crystallization. Thus, there is a decrease in the rate of
crystallization. Coupled with the lesser time for crystallization at higher speeds, this results in
reduced extent of crystallization. On annealing HSS fibers, even for relatively short times, the
chains revert to the preferred helical conformation. This happens even under constrained con-
ditions, as there are not many physical constraints against conformational changes due to the
absence of crystals. The appropriate conformational sequence can have a rapid rate of incor-
poration into crystals, due to high chain orientation.
However, on FLA, the HSS fibers attain a relaxed amorphous phase and a stable helical
crystal structure. The relaxed amorphous phase contributes to large extensions (~450%) ob-
served for HSS fibers which were subjected to FLA.
Our results show that the sPP fibers are demonstrably poorly crystallized at higher spin-
ning speeds in contrast to well crystallized, oriented fibers formed at lower spinning speeds.
This behavior occurs at a relatively low spinning speed. The HSS fibers have the more ex-
tended -(TTTT)- conformation compared to the helical -(T2G2)- conformation in the LSS
fibers. However, crystallization of oriented all trans sequences would require change in con-
formation to form helical sequences that can crystallize. Thus the rate of crystallization is, in
fact, reduced. This effect must be taken into account in developing theories of oriented crys-
tallization. Work is underway to address this aspect of oriented crystallization.
Melt Spinning 181

ACKNOWLEDGMENTS
The authors express their gratitude to Dr. Mohan Gownder and Dr. Joseph Sehardl of Fina Oil
and Chemical Company for supplying the polymer. They also thank Karthik Nagapudi for the
NMR experiments.
REFERENCES
1 Gownder, M., ANTEC Conf. Proc., 1998,1511.
2 Chatani, Y.; Maruyama, M.; Asanuma, T.; Shiomura, T., J. Polym. Sci., Pt. B: Polym. Phys., 1991, 29, 1649.
3 Desai, P.; Abhiraman, A. S., J. Polym. Sci., Part B: Polym. Phys. Ed., 1989, 27, 2469.
4 Asakura, T.; Aoki, A.; Date, T.; Demura, M.; Asanuma, T., Polym. J., 1996, 28(l), 24.
5 Auriemma, F.; Born, R.; Spiess, H.W.; Rosa, C.; Corradini, P., Macromolecules, 1995, 28, 6902.
6 Sozzani, P.; Monutti, R.; Galimberti, M., Macromolecules, 1993, 26, 5782.
7 Sozzani, P.; Galimberti, M.; Balbontin, G., Makromol. Chem., Rapid Commun., 1992, 13, 305.
182 Metallocene Technology

New Polyolefins Characterization by Instrumental
Analysis
Carmina Gartner and Juan D. Sierra
Instituto de CapacitaciÙn e InvestigaciÙn del Pl«stico y del Caucho, ICIPC, Medellin,
Colombia, P.O. Box 2629
Roger Avakian
General Electric Specialty Chemicals, Parkersburg, WV, USA
INTRODUCTION
Given the multiple synthesis methods, polyolefins, PO, are found within a wide property
range that are determined primarily by their basic chemical structure. The study of their
chemical features can be difficult due to the many possibilities of structural arrangements and
increasing complexity which requires the conjunction of many instrumental techniques.
The main purpose of this research is to define the structure of PO, basically polyethyl-
ene, PE and polypropylene, PP of highest commercial importance, through a comparative
study of the infrared spectra, in order to find all the information which is possibly available by
this technique. Besides infrared spectroscopy, differential scanning calorimeter results, DSC,
are frequently used for determining certain important thermal properties directly associated
with morphology and crystallinity.
EXPERIMENTAL
This report data analysis is based on measurements made on Fourier Transform Infrared
Spectrophotometer, FTIR, Nicolet Magna-IR 550, with resolution of 0.50 cm-1, autoaligning
digital system and detector in the middle infrared range, and a Differential Scanning Calorim-
eter, DSC, TA Instruments, 2910, a heat flow type calorimeter, with an standard cell.
The tested materials were commercially used PO, except for three of the PP, which were
kindly supplied by the manufacturer from the polymerization reactor ; none of them had addi-
tives that could affect the results. The analyzed PE, were chosen to be from different

polymerization processes and densities: high pressure, Ziegler and Phillips processes and
metallocene catalysis, varying from low to high density. PP were homopolymers and ethylene
copolymers.
For FTIR measurements, the tested materials were prepared as thick films, by heating
the samples between two metallic plates inside an aluminum foil, at approximately 200oC for
half an hour, then quench cooled to avoid light scattering due to crystals, measuring the thick-
ness with a Vernier and taking the spectra by the transmission technique at the same
184 Metallocene Technology
Table 1. Characteristic IR absorptions for PE: wavenumbers between 1500 and
700 cm-1
λ, cm-1
Assignment λ, cm-1
Assignment
1471 symmetric bending of methylene (tentative) 910 terminal groups along with 990
1463 asymmetric bending of methylene 908 also associated with terminal vinyl groups
1378 symmetric bending of methyl 903
along with 889 it is assigned to terminal
methyl groups from alkidic chains longer
than ethyl
1367 scissoring of methylene 889
bending vibrations of methyl groups from
n-hexyl. If there is an overtone in 745 it
corresponds to n-butyl
1353 torsion bending of methylene 888 vinylidene type unsaturations
1346bending of methylene for a regular pack
structure849
vibration of CH2 related with a crystalline
conformation of the chain
1304bending of methylene associated with the
amorphous part839
possibly due to 3 substituted alkenes, like
a diallyl group (tentative)
1176 wagging of C-C from methylene 802 like the one at 839 (tentative)
1151 vibration of C-C from methyl 784vibrations of methylene longer than ethyl
(tentative)
990 vibration of CH of terminal vinyl groups 762-70vibrations of CH from ethyl group (two
consecutive CH2 groups)
967Vibration CH of vinylidene groups (internal
trans unsaturations)745
this band along with the one at 890 can be
related to n-butyl branches
954 vibration of the allyl type (tentative) 730
indicative of the long aliphatic
semicrystalline chains of carbon bonds.
Attributed to the rocking of methylene in
the crystal of polyethylene
937out of plane tension of terminal methyl
groups720
rocking vibrations of minimum 4
consecutive CH2 groups
The assignations for the bands in 1471, 954, 859, 839, 802 and 784 cm-1 are tentative and have not been well correlated for a
specific vibration.

conditions. For DSC measurements, the materials were cut until obtaining the appropriate
weight of 10 ± 1 mg, then samples were heated and annealed at 200oC for 10 minutes, (to
erase the thermal history), next they were cooled at a rate of 10oC/min and reheated at the
same rate to study the melting curve.
RESULTS AND DISCUSSION
INFRARED ANALYSIS, IR
The analyzed IR spectra holds the region between 1500 and 400 cm-1 as wavenumbers, λ,
which has been studied on what refers to PO microstructure. All the absorption bands were
New Polyolefins Characterization 185
Table 2. Characteristic IR absorptions for polypropylene: wavenumbers be-
tween 1500 and 700 cm-1
λ, cm-1
Assignment λ, cm-1
Assignment
1467 scissoring bending of methylene 972*assigned to two or more head to tail units
in PP
1456 asymmetric bending of methyl 960sequence of two contiguous units in
polypropylene
1379 symmetric bending of methyl 940 rocking of methyl group
1356 scissoring bending of methylene 899*assigned to a helicoidal conformation of
polypropylene
1304 torsion and wagging stretching of methylene 840
*helicoidal conformation. It is also
attributable to a length of isotactic
sequences of 13 to 15 units
1255vibrations of carbon backbone for C-CH3
bonding809
*related also to helicoidal conformation
similar the other bands with asterisks at
1219, 1167, 997, 899 and 840
1219*attributed to the helicoidal conformation of
polypropylene732
only presented in random copolymer, due
to a sequence of 3 contiguous CH2 groups
1167 *as the band at 1219 728sequence of four contiguous methylene
groups
1153
stretching wagging of methyl assigned to
solely propylene units, presented on in
copolymers
720
only presented in block copolymer.
Assigned to a sequence of five or more
contiguous methylene groups
997
*helicoidal conformation. It also can be due
to a length of isotactic sequences from 11 to
12 units
Bands with asterisks (*) correspond to the helicoidal conformation of polypropylene associated with an isotactic structure
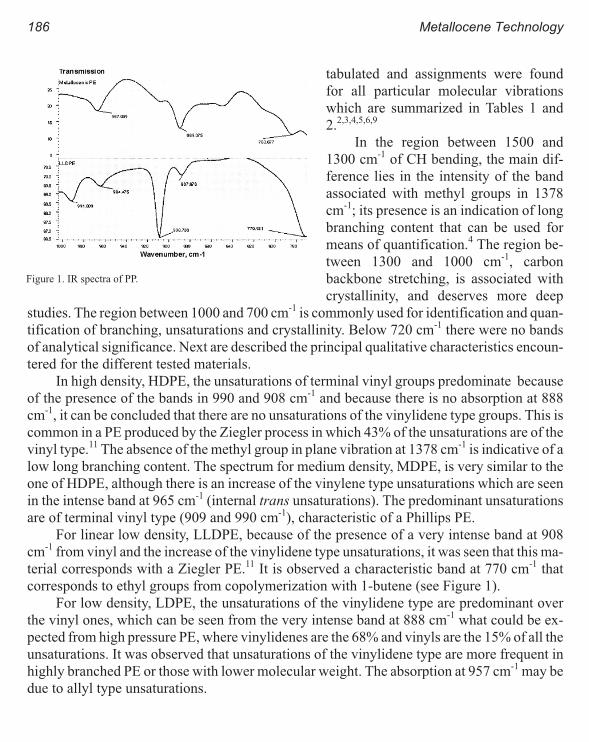
tabulated and assignments were found
for all particular molecular vibrations
which are summarized in Tables 1 and
2.2,3,4,5,6,9
In the region between 1500 and
1300 cm-1 of CH bending, the main dif-
ference lies in the intensity of the band
associated with methyl groups in 1378
cm-1; its presence is an indication of long
branching content that can be used for
means of quantification.4 The region be-
tween 1300 and 1000 cm-1, carbon
backbone stretching, is associated with
crystallinity, and deserves more deep
studies. The region between 1000 and 700 cm-1 is commonly used for identification and quan-
tification of branching, unsaturations and crystallinity. Below 720 cm-1 there were no bands
of analytical significance. Next are described the principal qualitative characteristics encoun-
tered for the different tested materials.
In high density, HDPE, the unsaturations of terminal vinyl groups predominate because
of the presence of the bands in 990 and 908 cm-1 and because there is no absorption at 888
cm-1, it can be concluded that there are no unsaturations of the vinylidene type groups. This is
common in a PE produced by the Ziegler process in which 43% of the unsaturations are of the
vinyl type.11 The absence of the methyl group in plane vibration at 1378 cm-1 is indicative of a
low long branching content. The spectrum for medium density, MDPE, is very similar to the
one of HDPE, although there is an increase of the vinylene type unsaturations which are seen
in the intense band at 965 cm-1 (internal trans unsaturations). The predominant unsaturations
are of terminal vinyl type (909 and 990 cm-1), characteristic of a Phillips PE.
For linear low density, LLDPE, because of the presence of a very intense band at 908
cm-1 from vinyl and the increase of the vinylidene type unsaturations, it was seen that this ma-
terial corresponds with a Ziegler PE.11 It is observed a characteristic band at 770 cm-1 that
corresponds to ethyl groups from copolymerization with 1-butene (see Figure 1).
For low density, LDPE, the unsaturations of the vinylidene type are predominant over
the vinyl ones, which can be seen from the very intense band at 888 cm-1 what could be ex-
pected from high pressure PE, where vinylidenes are the 68% and vinyls are the 15% of all the
unsaturations. It was observed that unsaturations of the vinylidene type are more frequent in
highly branched PE or those with lower molecular weight. The absorption at 957 cm-1 may be
due to allyl type unsaturations.
186 Metallocene Technology
Figure 1. IR spectra of PP.

For metallocenes PE the intensity of
the bands corresponding to unsaturated
groups are much lower. The band in 888
cm-1 moves to 889 cm-1 where the vibrations
of saturated chains greater than two carbons
are presented and that could correspond to
hexyl groups originated from the
comonomer 1-octene; even though the reso-
lution of 0.5 cm-1 would be enough to
resolve these two bands, it becomes neces-
sary to eliminate possible unsaturations to
correct overlapping. It is seen from absorp-
tion at 784 cm-1 which can be related to
longer branches than ethyl, (probably hexyl)
(see Figure 1).
For ethylene vinyl acetate copolymers,
EVA, the vibrations of ester groups predominate and the basic differences between these co-
polymers are the intensity of the carbonyl tension, which increases along with the
comonomer content and that is used for quantification. There are ethyl branches and
unsaturations of the vinylidene, allyl and vinyl type, characteristic of a highly branched PE
(produced by the high pressure method).
The presence and intensity of the two bands at 730 cm-1 and 720 cm-1 are indicators of
long aliphatic semi-crystalline chains. The intensity of the band at 730 cm-1 increases with
crystallinity and hence with density of PE, and diminishes for the lower crystalline materials.
For metallocenes it can be seen the decrease in absorption for the band at 730 cm-1 as the
comonomer content increases, because the addition of a comonomer disrupts the
stereoregularity and thus the crystallinity (see Figure 2) - a feature that can be observed for
LLDPE and EVA copolymers, as well.
Polypropylenes: For PP two regions were studied: the CH bending between 1500 and
840 cm-1 (corresponding to tensions of the carbon backbone chain), that presented a sequence
of bands that deal with stereoregularity, and between 840 and 400 cm-1 (assigned to CH out of
plane bending), where the vibrations for comonomer sequences are seen.
For all the analyzed PP, the characteristic absorptions of isotactic segments at 1219,
1167, 997, 899, 840 and 809 cm-1 were seen. Particularly the bands at 997 and 840 cm-1 show
that the isotactic segments are long, from 11 to 15 units, and their intensities ratio can be used
for measuring the degree of isotacticity. It can also be observed that PP are highly symmetri-
cal presenting many head to tail bonds, because of the intense band at 972 cm-1. For none of
the PP it was possible to see the atacticity or syndiotacticity fractions that show characteristic
New Polyolefins Characterization 187
Figure 2. Effect of concentration of 1-octane on IR.
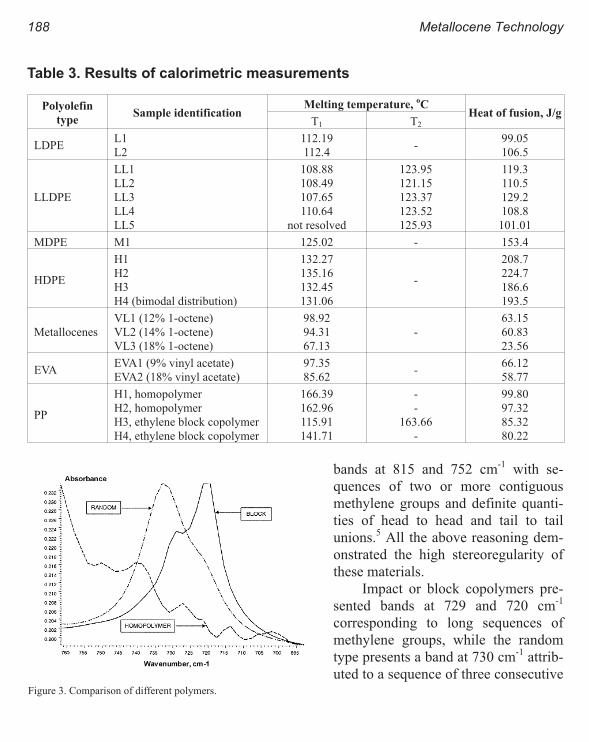
bands at 815 and 752 cm-1 with se-
quences of two or more contiguous
methylene groups and definite quanti-
ties of head to head and tail to tail
unions.5 All the above reasoning dem-
onstrated the high stereoregularity of
these materials.
Impact or block copolymers pre-
sented bands at 729 and 720 cm-1
corresponding to long sequences of
methylene groups, while the random
type presents a band at 730 cm-1 attrib-
uted to a sequence of three consecutive
188 Metallocene Technology
Table 3. Results of calorimetric measurements
Polyolefin
typeSample identification
Melting temperature,oC
Heat of fusion, J/gT1 T2
LDPEL1
L2
112.19
112.4-
99.05
106.5
LLDPE
LL1
LL2
LL3
LL4
LL5
108.88
108.49
107.65
110.64
not resolved
123.95
121.15
123.37
123.52
125.93
119.3
110.5
129.2
108.8
101.01
MDPE M1 125.02 - 153.4
HDPE
H1
H2
H3
H4 (bimodal distribution)
132.27
135.16
132.45
131.06
-
208.7
224.7
186.6
193.5
Metallocenes
VL1 (12% 1-octene)
VL2 (14% 1-octene)
VL3 (18% 1-octene)
98.92
94.31
67.13
-
63.15
60.83
23.56
EVAEVA1 (9% vinyl acetate)
EVA2 (18% vinyl acetate)
97.35
85.62-
66.12
58.77
PP
H1, homopolymer
H2, homopolymer
H3, ethylene block copolymer
H4, ethylene block copolymer
166.39
162.96
115.91
141.71
-
-
163.66
-
99.80
97.32
85.32
80.22
Figure 3. Comparison of different polymers.
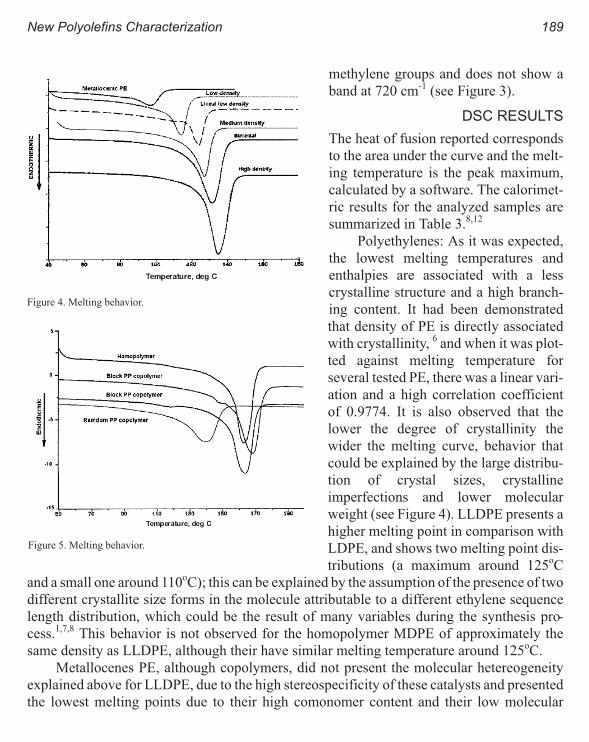
methylene groups and does not show a
band at 720 cm-1 (see Figure 3).
DSC RESULTS
The heat of fusion reported corresponds
to the area under the curve and the melt-
ing temperature is the peak maximum,
calculated by a software. The calorimet-
ric results for the analyzed samples are
summarized in Table 3.8,12
Polyethylenes: As it was expected,
the lowest melting temperatures and
enthalpies are associated with a less
crystalline structure and a high branch-
ing content. It had been demonstrated
that density of PE is directly associated
with crystallinity, 6 and when it was plot-
ted against melting temperature for
several tested PE, there was a linear vari-
ation and a high correlation coefficient
of 0.9774. It is also observed that the
lower the degree of crystallinity the
wider the melting curve, behavior that
could be explained by the large distribu-
tion of crystal sizes, crystalline
imperfections and lower molecular
weight (see Figure 4). LLDPE presents a
higher melting point in comparison with
LDPE, and shows two melting point dis-
tributions (a maximum around 125oC
and a small one around 110oC); this can be explained by the assumption of the presence of two
different crystallite size forms in the molecule attributable to a different ethylene sequence
length distribution, which could be the result of many variables during the synthesis pro-
cess.1,7,8 This behavior is not observed for the homopolymer MDPE of approximately the
same density as LLDPE, although their have similar melting temperature around 125oC.
Metallocenes PE, although copolymers, did not present the molecular hetereogeneity
explained above for LLDPE, due to the high stereospecificity of these catalysts and presented
the lowest melting points due to their high comonomer content and their low molecular
New Polyolefins Characterization 189
Figure 4. Melting behavior.
Figure 5. Melting behavior.

weights. It can be seen from data in Table 3 that with the increase of comonomer content, the
temperature and heat of melting decreases. The same reasoning can be made for EVA copoly-
mers when the vinyl acetate content is increased.
Polypropylenes: The heat of fusion and melting temperature for PP homopolymer is
higher in comparison with its ethylene copolymers (see Table 3 for results). The introduction
of an ethylene comonomer changes the thermal behavior of PP. In a random distributed addi-
tion of comonomer, the copolymer forms mixed crystals sharing a common crystal lattice
(isomorphism), or else only one of the comonomer unit crystallizes and the other remains in
the amorphous region.5,10 which explains the lower crystallinity when compares with the
homopolymer. For the block copolymer there is a sequential distribution of comonomer
which permits each fraction of them to crystallize in their own structure as in the correspond-
ing homopolymer; this is seen in the two melting peaks obtained for the block copolymer: 115
and 163oC (see Figure 5).
CONCLUSIONS
PE of different densities can be distinguished by certain characteristic features in the structure
which are perfectly seen in the IR spectra and in the DSC curves. These differences are
mainly short branching as hexyl and ethyl, unsaturations of the internal trans vinylene, vinyl,
vinylidene and allyl type. The typical absorption bands that were found may be used for fu-
ture quantitative studies of degree of short and long chain branching, unsaturations and per-
centage of comonomer content. For the PP tested the series of IR bands related to isotacticity
were detected which opens the possibility to quantify the degree of tacticity by FTIR, with a
correlation with solid state nuclear magnetic resonance, NMR. Some important features
about crystallinity and structure were concluded by DSC studies. The correlation between
DSC and FTIR measurements, along with other techniques, will be carried out in a next phase
of this study. There are many possibilities to study PO molecular structures - this study is only
the first approach.
REFERENCES
1 Alizadeh, et al., Polymer, vol 38, # 5, 1997, 1207-1214.
2 Balta Calleja et al., Spectrochimica Acta, vol 35A, 1979, 847- 849.
3 Bryant, W.; Voter, R. Journal of The American Chemical Society, 75, 953, 6113-6118.
4 Harvey, M.; Peters, L. Analytical Chemistry, 32,12,1960, 1725.
5 Karger-Kocsis, J. Polypropylene. Structure, blends and composites. Volume 1: Structure and Morphology.
Chapman & Hall, London, 1995, 350.
6 Lomonte, J., Analytical Chemistry, 34,1,1962, 129-131.
7 Mathot, V. Calorimetry and Thermal Analysis of Polymers, Hanser, Munich,1994, 353.
8 Mathot. Journal of Applied Polymer Science, 1990, 39, 979.
9 Mitchell, J., Applied Polymer Analysis and Characterization. Vol. II. Hanser, New York, 1991, 460.
10 Moore et al. Polypropylene Handbook, Hanser, 1996. Pp 419.
190 Metallocene Technology

11 Scroder; Muller; Arndt, Polymer Characterization. Hanser, New York, 1989, 344.
12 Widmann and Riesen. Thermoanalyse. Huethig, Heildelberg, 1990, 133.
New Polyolefins Characterization 191

Dynamic Melt Rheometry Used to Study Degradation
of Metallocene Polyethylene
Scott H. Wasserman, George N. Foster, Douglas J. Yacka
Univation Technologies, P. 0. Box 670, Bound Brook, New Jersey 08805
INTRODUCTION
THE RELAXATION SPECTRUM INDEX
Dynamic oscillatory shear tests are often used to measure the low shear theology of polymers.
The resulting data can be used to calculate, among other things, the discrete relaxation spec-
trum. Increasing the breadth of the molecular weight distribution (MWD) or level of long
chain branching (LCB) in the polymer system is reflected by an enhanced relaxation spec-
trum, particularly at high relaxation times. In order to differentiate polymers in terms of their
relaxation spectra, we have introduced a quantity known as the Relaxation Spectrum Index
(RSI) (see Figure1). The equations used to calculate the RSI are analogous to those used to
calculate the polydispersity index (PDI) which describes the breadth of the MWD from size
exclusion chromatography (SEC).1,2 The RSI has proven to be a sensitive indicator of molec-
ular structure, especially where the structure affects molecular entanglements.
MECHANISMS OF POLYMER DEGRADATION
Polyolefins are often exposed to short residence times at high processing temperature
(≤320oC) in air or dilute oxygen conditions during fabrication. Either chain breakage, chain
branching and/or chain enlargement (or crosslinking) can occur, affecting processing behav-
ior or end-use product performance. Alternately, polyolefin end-use applications can involve
extended exposure time in low-temperature (< 150oC), oxidizing environments where chain
breakage dominates causing eventual property loss. Often one mechanism dominates as a
function of temperature and polymer composition, oxidant type, and concentration.
Illustration of chain breakage and its effect on MWD as measured by SEC for a broad
MWD (V catalyzed) PE aged in air at 90oC is given in Figure 2. Anticipated property changes
are shown in relation to the progressive MWD change as the polymer undergoes oxidative

degradation. The long polymer chains are
being degraded preferentially. To measure
such polymer degradation, the MWD
change can be measured directly by SEC, or
rheological measurements can be used. It is
often easier to use measure melt flow
changes or rheological shifts with dynamic
oscillatory shear rheometry, as will be dis-
cussed shortly.
The free radical mechanism for chain
branching in PE having vinyl end group
unsaturation is summarized in Figure 3. The
proposed mechanism leads to three or four-arm star, long chain branching (LCB) configura-
tions that significantly increase low shear viscosity, increasing the low shear melt flow
indices such as melt index (MI), I2.1. The higher load melt flow indices at somewhat higher
shear rates show proportionally less reduction. Therefore, melt flow ratio (MFR), I21/I2.1, in-
creases when chain branching dominates over chain breakage.
PE with little or no unsaturations shows predominant chain breakage, especially at high
temperatures. As such, it resembles polypropylene (e.g., propylene homopolymer, random
propylene copolymers, etc.). This leads, of course, to a MW decrease with breakage of the
longer chains being favored statistically. Accordingly, both solution and melt viscosity de-
crease while MWD narrows and MFR decreases. Again, the presence of even trace amounts
194 Metallocene Technology
Figure 1. RSI calculation and representative spectra for
conventional linear and branched LDPE.
Figure 2. Effect of chain breakage on MWD for a broad
MWD (V catalyzed) PE aged in air at 90oC.
Figure 3. Free radical mechanism for chain branching in PE
having vinyl end group unsaturation.

of unsaturation (e.g., vinyl-end type) promotes chain enlargement or chain branching (LCB)
versus chain breakage. The net effect of chain branching will be a low shear viscosity increase
(MI decrease) while intrinsic viscosity will decrease slightly. In addition, PDI corrected for
LCB will increase, as will MFR.
RHEOLOGICAL STUDY OF POLYMER STABILITY
For stabilization and product performance control, melt rheological tests can be used to rap-
idly assess the structural modification of an ethylene polymer. Standard solution character-
ization techniques such as SEC-MWD may be unable to delineate the effects uncovered by
the melt rheology without complicated SEC-coupled viscometry or light scattering systems
supported by specialized software. Even then, melt rheology tests are easier to conduct and
are probably more sensitive to alterations in the long chain structure. Thus, melt rheology
measurements provide a sensitive means for following changes in molecular structure result-
ing from thermal degradation of the polymer during melt processing. Dynamic rheometry and
relaxation spectrum analysis leading to the RSI were recently described.1
Low deformation experiments such as dynamic oscillatory shear are considered to be the
best for detecting features of molecular structure such as PDI and levels of long-chain branch-
ing (LCB). In earlier work, the RSI was used to follow thermo-oxidative degradation during
extrusion of unstabilized LLDPE and to quantify its effect.2 The RSI was shown to be a more
sensitive and reliable indicator than the flow activation energy, for example, of the resulting
change in molecular structure.
In summary, RSI increase, MI decrease and MFR increase are all related to the develop-
ment of LCB structures. However, the RSI gives a more sensitive measure of molecular
structure changes caused by degradation mechanisms than either the MI or MFR.
EXPERIMENTAL
METHODS
Dynamic oscillatory shear experiments used to calculate the RSI were conducted with a
Weissenberg Rheogoniometer manufactured by TA Instruments. Frequency sweep experi-
ments at 190oC and 2% strain in parallel plate mode were run under nitrogen from 0. 1 to 100
sec-1. Discrete relaxation spectra were calculated with the commercially available IRISTM
software. RSI is a measure of the breadth of a material’s distribution of relaxation times or re-
laxation spectrum. This dimensionless index has proven to be a sensitive and reliable indica-
tor of long range melt state order (e.g. molecular entanglements) and is a function of polymer
MW, MWD, and LCB, as well as temperature.
Melt process stability testing was done using a three pass recycle extrusion method. For
the extrusion, the additives in powder form were dry blended with the granular polymer. The
Dynamic Melt Rheometry 195

method involved the use of a
25 mm diameter single-screw
Killion to provide pelleted ma-
terial using a single strand die,
water bath and strand dicer
mill. The 1st pass extrusion
was done at 210oC; the 2nd
and 3rd pass extrusions were
done at 260oC. The extruded
tape or pellets from each pass
were characterized using the
test methods noted above.
Standard flow indices (i.e., MI
and MFR) were measured us-
ing ASTM methods.
SAMPLES
The series of five low-density ethylene polymers used in the melt extrusion experiment in-
cluded Univation Technologies Type I and Type II mLLDPE (mLLDPE A and B, respec-
tively). Ti/Mg or Z-N cat. LLDPE, Cr cat. LLDPE and a HP-LDPE were included to compare
their inherent stability and associated stabilization ease to that for the mLLDPEs. The poly-
mers were made in commercial UNIPOL® gas phase PE processes with the exception of
mLLDPE B, which is an experimental resin selected for this study because of its higher cata-
lyst residue relative to mLLDPE A and the other LLDPEs. Table 1 summarizes the melt flow,
and total tertiary hydrogen and unsaturation for the five base resin polymers. In addition to the
RSI, the table lists values for the quantity RSI.MI0,6 which effectively adjusts the RSI to a
common MI of 1.0.1 Stabilizers used include primary (hindered phenolic type) and secondary
(aryl phosphite ester) antioxidants (PAO-1 and SAO-1) and a catalyst reside deactivator
(CRD-1, Zn stearate).3
RESULTS AND DISCUSSION
The melt flow and RSI results of the recycle experiments are presented in a series of nine fig-
ures (Figures 4-12) using percent change in those properties relative to the five neat or
unstabilized polymers. The “P1” and “P3” versions of each polymer refer to samples taken af-
ter the first and third passes, respectively. Of the five unstabilized samples presented in Fig-
ures 4-6, Z-N LLDPE shows the greatest change in MI, MFR and RSI (normalized to 1.0 MI)
even though its unsaturation level is less than either that of the HP-LDPE or Cr cat. LLDPE
196 Metallocene Technology
Table 1. Base resin characterization data
Sample MI MFR RSI RSI.MI0.6
Z-N LLDPE 0.96 28 4.5 4.1
mLLDPE A 2.90 18 1.8 3.4
Cr LLDPE 0.75 79 22.0 17.7
HP-LDPE 1.57 61 11.0 14.5
mLLDPE B 1.28 29 8.9 10.3
SampleTotal tertiary H
(per 1000C)
Unsaturations
(per 1000C)
Z-N LLDPE 19 low
mLLDPE A 17 low
Cr LLDPE 19 high
HP-LDPE 16 moderate
mLLDPE B 11 moderate
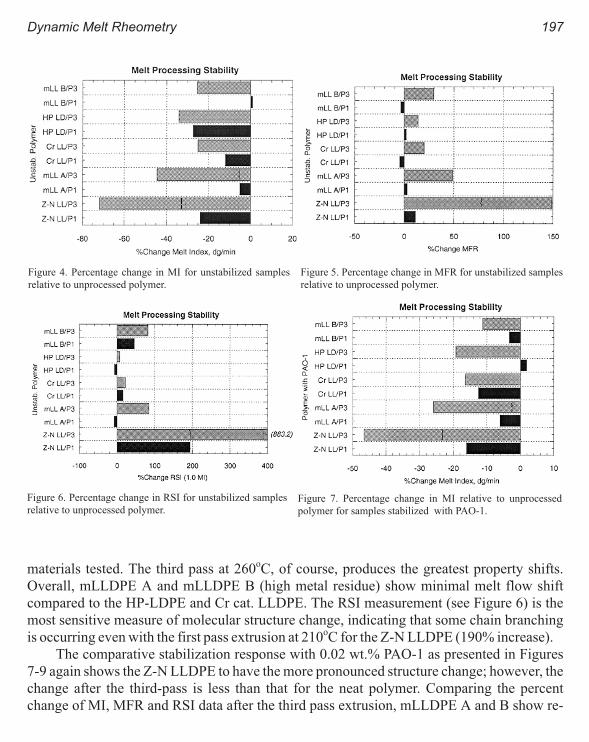
materials tested. The third pass at 260oC, of course, produces the greatest property shifts.
Overall, mLLDPE A and mLLDPE B (high metal residue) show minimal melt flow shift
compared to the HP-LDPE and Cr cat. LLDPE. The RSI measurement (see Figure 6) is the
most sensitive measure of molecular structure change, indicating that some chain branching
is occurring even with the first pass extrusion at 210oC for the Z-N LLDPE (190% increase).
The comparative stabilization response with 0.02 wt.% PAO-1 as presented in Figures
7-9 again shows the Z-N LLDPE to have the more pronounced structure change; however, the
change after the third-pass is less than that for the neat polymer. Comparing the percent
change of MI, MFR and RSI data after the third pass extrusion, mLLDPE A and B show re-
Dynamic Melt Rheometry 197
Figure 4. Percentage change in MI for unstabilized samples
relative to unprocessed polymer.
Figure 5. Percentage change in MFR for unstabilized samples
relative to unprocessed polymer.
Figure 6. Percentage change in RSI for unstabilized samples
relative to unprocessed polymer.Figure 7. Percentage change in MI relative to unprocessed
polymer for samples stabilized with PAO-1.
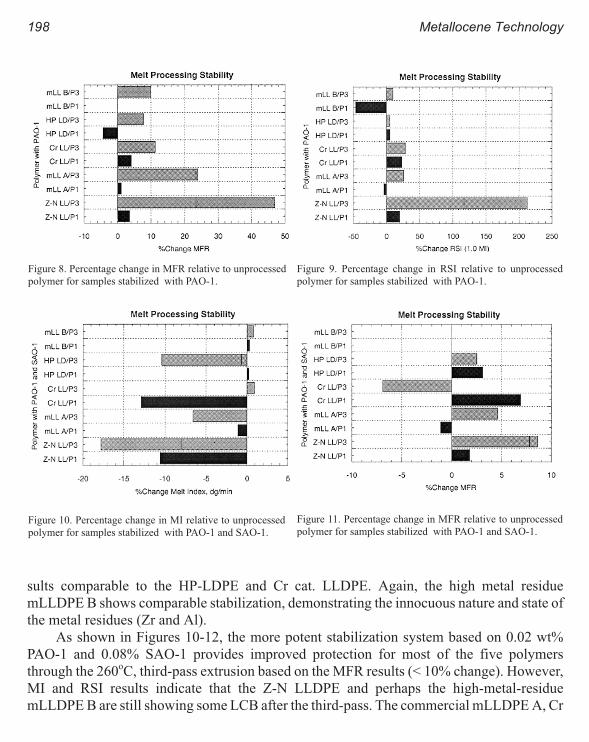
sults comparable to the HP-LDPE and Cr cat. LLDPE. Again, the high metal residue
mLLDPE B shows comparable stabilization, demonstrating the innocuous nature and state of
the metal residues (Zr and Al).
As shown in Figures 10-12, the more potent stabilization system based on 0.02 wt%
PAO-1 and 0.08% SAO-1 provides improved protection for most of the five polymers
through the 260oC, third-pass extrusion based on the MFR results (< 10% change). However,
MI and RSI results indicate that the Z-N LLDPE and perhaps the high-metal-residue
mLLDPE B are still showing some LCB after the third-pass. The commercial mLLDPE A, Cr
198 Metallocene Technology
Figure 8. Percentage change in MFR relative to unprocessed
polymer for samples stabilized with PAO-1.
Figure 9. Percentage change in RSI relative to unprocessed
polymer for samples stabilized with PAO-1.
Figure 10. Percentage change in MI relative to unprocessed
polymer for samples stabilized with PAO-1 and SAO-1.
Figure 11. Percentage change in MFR relative to unprocessed
polymer for samples stabilized with PAO-1 and SAO-1.

cat. LLDPE and HP LDPE all show evi-
dence of excellent stability and comparable
stabilization ease.
CONCLUSIONS
At melt processing temperatures (>150oC),
the presence of even trace amounts of vinyl
end group unsaturation promotes chain en-
largement or LCB versus chain breakage in
either unstabilized or under stabilized poly-
mer compositions. Chain breakage, of
course, leads to MW decrease with breakage
of the long chains being favored statistically.
As the high MW fraction decreases, MI in-
creases, and MWD and MFR decrease. With
chain branching predominating over chain
breakage, intrinsic viscosity, will decrease. In contrast, low shear viscosity will increase (MI
decrease) because of the introduction of LCB. PDI corrected for LCB will increase as will
MFR.
Melt rheology measurement provides a sensitive means for following subtle changes in
molecular structure resulting from thermal degradation of the polymer as during melt pro-
cessing. Dynamic oscillatory shear measurements are able to distinguish molecular structure
change at low and moderate frequencies for ethylene polymers undergoing thermo-oxidative
degradation - i.e., either chain breakage, chain enlargement or chain branching (of a long
chain nature). The method is simpler, more straightforward and more sensitive than coupled
SEC-viscometry or light scattering methods.
Univation Technologies’ mLLDPE having low unsaturation and metal residue which are
non-catalytic to the auto-oxidation show excellent intrinsic oxidative stability. Stabilization
ease for Univation Technologies’ Type I and Type II mLLDPE is equivalent to LLDPE coun-
terparts (similar MI and density) made using high activity, state-of-the-art Cr or Ti/Mg
catalyst systems designed for use in the Unipol® gas phase PE process.
ACKNOWLEDGMENTS
The fine experimental work done in our rheology and solution characterization laboratories is
acknowledged.
Dynamic Melt Rheometry 199
Figure 12. Percentage change in RSI relative to unprocessed
polymer for samples stabilized with PAO-1 and SAO-1.

NOMENCLATURE
CRD-1 catalyst residue deactivator
gi strength of mode in relaxation spectrum
HP-LDPE high-pressure low density polyethylene
LCB long chain branch
LLDPE linear low density polyethylene
MFR melt flow ratio, I21/I2.1
MI melt index, I2.1
mLLDPE metallocene catalyzed LLDPE
MWD molecular weight distribution
PAO-1 primary antioxidant
PDI polydispersity index
RSI relaxation spectrum index
SAO-1 secondary antioxidant
SEC size exclusion chromatography
Z-N Ziegler-Natta
λ1 relaxation time of mode in relaxation spectrum
REFERENCES
1 S. H. Wasserman, SPE ANTEC Technical Papers, vol. XLIII, Toronto, Canada, p. 1129 (1997).
2 S. H. Wasserman and G. N. Foster, Proc. XIIth Intl. Congress on Rheology, Quebec, Canada, p. 48 (1996).
3 for details, see G. N. Foster, S. H. Wasserman, D. J. Yacka, Proc. 19th Ann. Intl. Conf on Stabilization and Degrad.
of Polymers, Lucern, Switzerland, p. 21 (1997).
200 Metallocene Technology
Melt Rheology and Processability of Conventional
and Metallocene Polyethylenes
Choon K. Chai
BP Chemicals s.n.c., Research and Technology Centre, Bofte Postale No 6, 13117 Lav¾ra,
France
INTRODUCTION
As the dominating deformation in a number of polymer fabrication processes (e.g., in film
blowing) is elongational, the Rheotens extensional equipment was developed1,2 to measure
the melt strength and drawability of the polymer melt. It has since proved to be very sensitive
to small changes in polymer structure3,4 and very useful for assessing the bubble stability in
film blowing operations.5 However, until recently, only qualitative interpretation of the
Rheotens data could be made as all of these experiments were performed under constant mass
flow rate conditions which introduce complex prehistory of the polymer melt in the extrusion
die.
Recent developments have shown that Rheotens mastercurves for thermo-rheologically
simple polymer melts is dependent only on the extrusion pressure or wall shear stress in the
extrusion die and the relative molecular weight distribution (MWD), in variant to changes of
melt temperature and the average molecular weight.6
In the following, we show that by performing Rheotens experiments at different extru-
sion pressure, a plot of the melt strength (MS) with extrusion pressure or the corresponding
shear rate, allows two derivatives of the melt strength to be defined:
Melt Strength Pressure Derivative = ∂(MS)/∂(P)
Melt Strength Shear Rate Derivative = ∂(MS)/∂(log &γ)
The sensitivity and usefulness of these two MS derivatives, in conjunction with the tradi-
tional measured melt strength at a typical extrusion rate, for assessing the processability of a
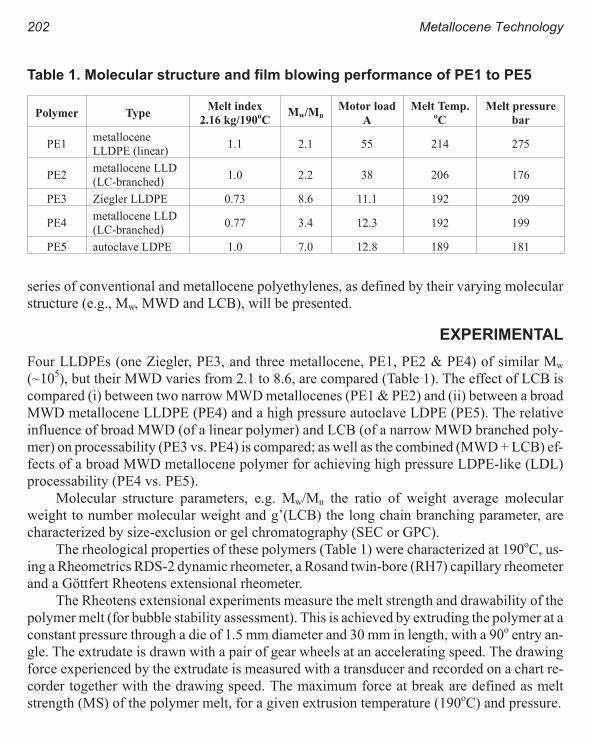
series of conventional and metallocene polyethylenes, as defined by their varying molecular
structure (e.g., Mw, MWD and LCB), will be presented.
EXPERIMENTAL
Four LLDPEs (one Ziegler, PE3, and three metallocene, PE1, PE2 & PE4) of similar Mw
(~105), but their MWD varies from 2.1 to 8.6, are compared (Table 1). The effect of LCB is
compared (i) between two narrow MWD metallocenes (PE1 & PE2) and (ii) between a broad
MWD metallocene LLDPE (PE4) and a high pressure autoclave LDPE (PE5). The relative
influence of broad MWD (of a linear polymer) and LCB (of a narrow MWD branched poly-
mer) on processability (PE3 vs. PE4) is compared; as well as the combined (MWD + LCB) ef-
fects of a broad MWD metallocene polymer for achieving high pressure LDPE-like (LDL)
processability (PE4 vs. PE5).
Molecular structure parameters, e.g. Mw/Mn the ratio of weight average molecular
weight to number molecular weight and g’(LCB) the long chain branching parameter, are
characterized by size-exclusion or gel chromatography (SEC or GPC).
The rheological properties of these polymers (Table 1) were characterized at 190oC, us-
ing a Rheometrics RDS-2 dynamic rheometer, a Rosand twin-bore (RH7) capillary rheometer
and a GØttfert Rheotens extensional rheometer.
The Rheotens extensional experiments measure the melt strength and drawability of the
polymer melt (for bubble stability assessment). This is achieved by extruding the polymer at a
constant pressure through a die of 1.5 mm diameter and 30 mm in length, with a 90o entry an-
gle. The extrudate is drawn with a pair of gear wheels at an accelerating speed. The drawing
force experienced by the extrudate is measured with a transducer and recorded on a chart re-
corder together with the drawing speed. The maximum force at break are defined as melt
strength (MS) of the polymer melt, for a given extrusion temperature (190oC) and pressure.
202 Metallocene Technology
Table 1. Molecular structure and film blowing performance of PE1 to PE5
Polymer TypeMelt index
2.16 kg/190oC
Mw/MnMotor load
A
Melt Temp.oC
Melt pressure
bar
PE1metallocene
LLDPE (linear)1.1 2.1 55 214 275
PE2metallocene LLD
(LC-branched)1.0 2.2 38 206 176
PE3 Ziegler LLDPE 0.73 8.6 11.1 192 209
PE4metallocene LLD
(LC-branched)0.77 3.4 12.3 192 199
PE5 autoclave LDPE 1.0 7.0 12.8 189 181

Film blowing performance of PE1 and PE2 were evaluated on a 50 mm Reifenhauser ex-
truder with a die diameter of 150 mm, die gap of 2.3 mm, BUR of 2:1 and a constant output of
50 kg/h, for a 38µm thick film. PE3 to PE5 were blown on a 45 mm Collin extruder with a die
diameter of 100 mm, die gap of 0.8 mm, BUR of 3:1 and a constant output of 13 kg/h.
RESULTS AND DISCUSSION
The MS-Pressure and MS-(Shear Rate) plots of Figures 1 and 2 provide very useful informa-
tion regarding the processability of the polymer: e.g. for the film blowing process - good bal-
ance between extrusion melt pressure and bubble stability is required. This novel approach
represents an advancement over the traditional method of measuring just a single melt
strength curve at a fixed shear rate. These figures clearly demonstrate and distinguish the var-
ious types of polyethylenes in terms of their processability: (i) poor processability typical of a
narrow MWD metallocene LLDPE (e.g. PE1), (ii) easy processing narrow MWD long chain
branched, metallocene LLDPE (e.g. PE2), (iii) excellent processing typical of a high pressure
LDPE (e.g. PE5) and (iv) low pressure LDPE-like (LDL) processability with broad MWD
long chain branched metallocene LLDPE (e.g. PE4). These differences can be quantified,
apart from the traditional melt strength measured at a typical extrusion rate, e.g. of 500 s-1,
MS(500 s-1) as determined from Figure 2, with the slopes of these plots:∂(MS)/∂P in Figure 1
and ∂(MS)/∂(log &γ), in Figure 2, which yield some of the very important processing and mo-
lecular structure information. These two melt strength derivatives, ∂(MS)/∂P and
∂(MS)/∂(log &γ), together with MS(500 s-1) and its associated extrusion pressure, P(500 s-1)
form the essential information needed to characterize the processability of a polymer, if the
flow is stable or the instability duration is outside the processing window. The melt strength
derivatives are strongly dependent on MWD and LCB while MS(500 s-1) and P(500s-1) vary
Melt Rheology and Processability 203
Figure 1. Processability. Melt strength at 190oC. Figure 2. Processability. Melt strength at 190oC.

with molecular weight, MWD
and LCB. The dependence of
the latter include its concentra-
tion, type and distribution
within the MWD.
To illustrate this new con-
cept, Figure 3 shows the plot
of MS(500 s-1) against∂(MS)/
∂P for PE1 to PE5, and other
polymers not shown in Table
1, with melt index ~ 1.
In general, it is desirable
for a polymer to be at the right
top corner (e.g. PE5 - high
pressure LDPEs exhibit high
∂(MS)/∂P values and hence their excellent bubble stability and extrudability balance charac-
teristics) rather than at the lower left hand comer (e.g. PE1), though too high a MS(500 s-1)
value may incur drawability (i.e. drawdown potential) problem or limitation in some polymer
processing applications. However, high value of ∂(MS)/∂P is very desirable as it signifies the
degree of improvement in bubble stability per unit (MPa) increase or penalty in extrusion
melt pressure.
To illustrate this point further, the ∂(MS)/∂P for PE5 is ~1 cN/MPa as compared to ~ 0.1
cN/MPa for PE1, indicating that the extrusion melt pressure of PE1 will increase ~ 10 times
faster than PE5 for an improvement of 1 cN in melt strength (i.e. bubble stability). That is the
processability of PE1 will be melt pressure (and melt fracture) limited well ahead of PE5. In
particular, PE5 exhibits higher melt strength at a typical processing rate, i.e. MS(500 s-1) ~ 16
cN as compared to ~ 4 cN for PE1. Their corresponding extrusion pressures, P(500 s-1) are 14
and 30 MPa respectively. Thus, it will be practically impossible for PE1 to achieve the same
melt strength level as PE5, as it requires a corresponding melt pressure of ~150 MPa! In fact
PE1 exhibits shark-skin and melt fracture at melt pressure below ~ 30 MPa. This new method
clearly demonstrates the expected poor processability for the standard, linear narrow MWD
metallocene LLDPEs with no LCB.
MOLECULAR WEIGHT DISTRIBUTION (MWD) EFFECT
One approach to improve processability is by broadening the MWD. As respectively shown
in Figures 3 and 4, both melt strength and its pressure derivative∂(MS)/∂P for the linear poly-
mers increase as their MWD broadens: e.g. PE1 to PE3. However, these improvements do not
continue indefinitely: both MS(500s-1) and∂(MS)/∂P reach a maximum and then begin to de-
204 Metallocene Technology
Figure 3. Processability. Bubble stability at 190oC.
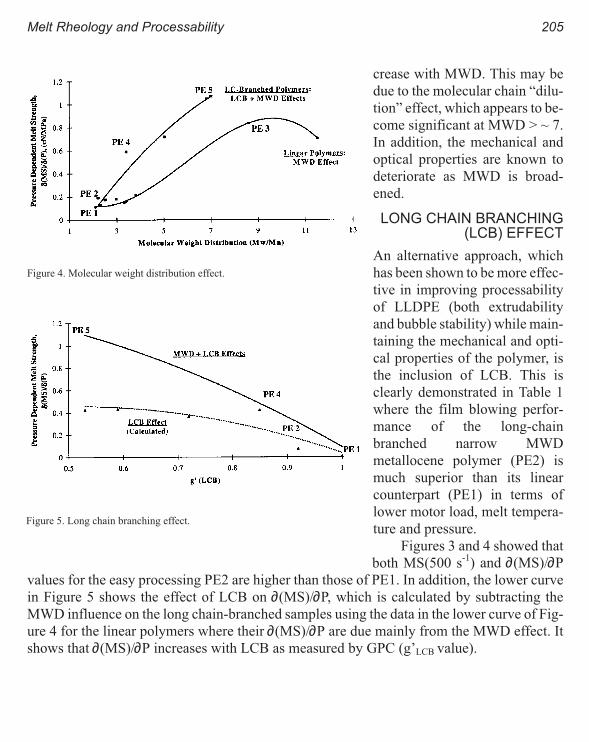
crease with MWD. This may be
due to the molecular chain “dilu-
tion” effect, which appears to be-
come significant at MWD > ~ 7.
In addition, the mechanical and
optical properties are known to
deteriorate as MWD is broad-
ened.
LONG CHAIN BRANCHING(LCB) EFFECT
An alternative approach, which
has been shown to be more effec-
tive in improving processability
of LLDPE (both extrudability
and bubble stability) while main-
taining the mechanical and opti-
cal properties of the polymer, is
the inclusion of LCB. This is
clearly demonstrated in Table 1
where the film blowing perfor-
mance of the long-chain
branched narrow MWD
metallocene polymer (PE2) is
much superior than its linear
counterpart (PE1) in terms of
lower motor load, melt tempera-
ture and pressure.
Figures 3 and 4 showed that
both MS(500 s-1) and ∂(MS)/∂P
values for the easy processing PE2 are higher than those of PE1. In addition, the lower curve
in Figure 5 shows the effect of LCB on ∂(MS)/∂P, which is calculated by subtracting the
MWD influence on the long chain-branched samples using the data in the lower curve of Fig-
ure 4 for the linear polymers where their ∂(MS)/∂P are due mainly from the MWD effect. It
shows that ∂(MS)/∂P increases with LCB as measured by GPC (g’LCB value).
Melt Rheology and Processability 205
Figure 4. Molecular weight distribution effect.
Figure 5. Long chain branching effect.
COMBINED MWD AND LCB EFFECTS: LOW DENSITY POLYETHYLENE-LIKE(LDL) PROCESSABILITY
To achieve the conventional high pressure low-density polyethylene-like (LDL)
processability (e.g. that of PE5), it appears that broadening MWD alone is not sufficient (e.g.,
PE3). This is clearly demonstrated in Table 1, Figures 3 and 4 where with a MWD ~ 9, the
melt pressure and bubble stability-extrudability balance of PE3 is not nearing that of the
LDPE (PE5).
Figures 3, 4 & 5 show that the excellent processability of the LDPE (PE5) is achieved
with a broad MWD and the presence of LCB. It appears that LCB roughly doubles the∂(MS)/
∂P values for a given MWD (upper curves of Figures 4 and 5) and extends the melt strength
values for polymers of similar melt index (upper curve of Figure 3).
The improvement in processability of sample PE4 over PE2 is achieved with the com-
bined MWD and LCB effects. As shown in Figures 3 to 4, the combined effects have just
approached about mid-way the processability of PE5, thus the film blowing performance of
PE4, as shown in Table 1, is better than PE3 (improvement by MWD broadening effect only)
but, as expected, is not similar to that of PE5. However, it is clear that the LDPE-like
processability is achievable, by broadening the MWD of the long chain branched metallocene
LLDPEs and by modifying the concentration, type and distribution of LCB, as indicated by
the directions of the upper curves of Figures 3, 4 & 5.
CONCLUSIONS
An improved Rheotens melt strength test, based on measurements performed at different ex-
trusion pressures, has been developed. It has been used to investigate the processability, in
particular, the bubble stability and extrudability balance, of a series of conventional and
metallocene polyethylenes. Two new parameters:∂(MS)/∂P, the melt strength pressure deriv-
ative and ∂(MS)/∂(log &γ), the melt strength shear rate derivative, have been defined.
These two melt strength derivatives, together with melt strength measured at a typical
extrusion rate, e.g. of 500 s-1, MS(500 s-1) and its associated extrusion pressure, P(500 s-1)
form the essential information needed to characterize the processability of a polymer, if the
flow is stable or the instability duration is outside the processing window. The sensitivity of
these parameters to features of molecular structures (e.g. Mw, MWD and LCB) make them
best suited for characterizing the processability of entire polyethylene families.
For example, the excellent processability of LDPE is characterized by its high∂(MS)/∂P,
∂(MS)/∂(log &γ) and MS(500 s-1) values, and a low value in its associated extrusion pressure
P(500 s-1). Conversely, the poor processability of the standard narrow MWD metallocene
LLDPE exhibits low values in melt strength and its two derivatives but high extrusion pres-
sure P(500 s-1).
206 Metallocene Technology

The LDPE-like processability is achievable, by broadening the MWD of the long chain
branched metallocene LLDPEs and by modifying the concentration, type and distribution of
LCB.
ACKNOWLEDGMENTS
The author thanks Mr Ren¾ Giraud for the rheological measurements, colleagues for useful
discussion and BP Chemicals for permission to publish this work.
REFERENCES
1 J. Meissner, Deutsche Offenlegungsschrift DOS 1904079(1969).
2 J. Meissner, Rheol. Acta, 10, 230-242 (1971).
3 J. Meissner, Basic Parameters, Melt Rheology, Processing and End-use Properties of Three Similar Low Density
Polyethylene Samples, Pure Appl. Chem., 42, 553-612 (1975).
4 F. P. LaMantia and D. Acierno, Influence of Molecular Structure on the Melt Strength and Extensibility of Polyethylenes,
Polym. Eng. Sci., 25, 279-283 (1985).
5 A. Ghijsels, J. J. S. M. Ente and J. Raadsen, Melt Strength Behavior of PE and Its Relation to Bubble Stability in Film
Blowing, IPP, 5, 284-286 (1990).
6 M. H. Wagner, V. Schize and A. Goettfert, Rheotens-Mastercurves and Drawability of Polymer Melts, Polym. Eng. Sci.,
36, 925-935 (1996).
Melt Rheology and Processability 207

Rheology of Metallocene-Catalyzed Polyethylenes.
The Effects of Branching
Sujan E. Bin Wadud and Donald G. Baird
Department of Chemical Engineering, Virginia Polytechnic Institute and State University,
Blacksburg, VA 24061-0211
INTRODUCTION
It is known that LDPE, followed by HDPE and then LLDPE, is the most stable in the film
blowing process.1 The stability is related to the extensional viscosity exhibited in general by
the three different types of polyethylenes (PE’s). In particular, LDPE which is highly
branched exhibits a significant degree of extensional strain-hardening, whereas LLDPE ex-
hibits none and HDPE can exhibit some as a result of a broad molecular weight distribution
(MWD).2 LDPE also exhibits an onset of shear-thinning at very low shear rates, usually less
than 0.1 s-1 whereas LLDPE does not shear-thin readily. With the advent of
metallocene-catalyzed polyethylenes (m-PE’s) some of the problems associated with LLDPE
such as processing stability and the lack of shear thinning, readily arise as a result of the nar-
row MWD possible with these systems.3 In an effort to improve on the processing perfor-
mance of m-PE’s, researchers at Dow4 have indicated that branching can be incorporated into
m-PE’s by forming copolymers containing an alpha-olefin such as octene. However, it is not
clear what the effect of branching is on the flow behavior of these systems. There is some in-
dication that the addition of a few long chain branches can promote shear-thinning behavior.
Furthermore, it is extremely difficult to identify branching analytically without assuming that
it is present. The purpose of this paper is to present studies concerned with the extensional and
shear viscosity behavior, supercooling effect, and other stress-strain relationships of three
PE’s which have apparently different degrees of long chain branching but similar melt flow
indexes.
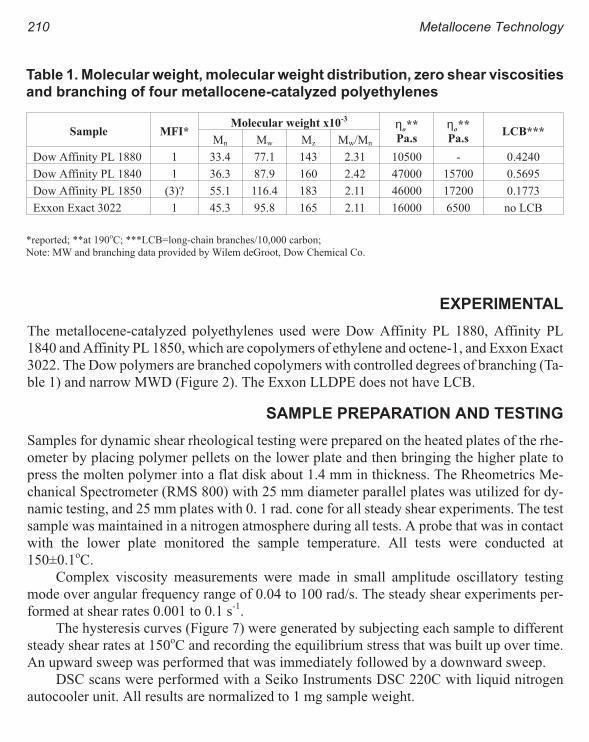
EXPERIMENTAL
The metallocene-catalyzed polyethylenes used were Dow Affinity PL 1880, Affinity PL
1840 and Affinity PL 1850, which are copolymers of ethylene and octene-1, and Exxon Exact
3022. The Dow polymers are branched copolymers with controlled degrees of branching (Ta-
ble 1) and narrow MWD (Figure 2). The Exxon LLDPE does not have LCB.
SAMPLE PREPARATION AND TESTING
Samples for dynamic shear rheological testing were prepared on the heated plates of the rhe-
ometer by placing polymer pellets on the lower plate and then bringing the higher plate to
press the molten polymer into a flat disk about 1.4 mm in thickness. The Rheometrics Me-
chanical Spectrometer (RMS 800) with 25 mm diameter parallel plates was utilized for dy-
namic testing, and 25 mm plates with 0. 1 rad. cone for all steady shear experiments. The test
sample was maintained in a nitrogen atmosphere during all tests. A probe that was in contact
with the lower plate monitored the sample temperature. All tests were conducted at
150±0.1oC.
Complex viscosity measurements were made in small amplitude oscillatory testing
mode over angular frequency range of 0.04 to 100 rad/s. The steady shear experiments per-
formed at shear rates 0.001 to 0.1 s-1.
The hysteresis curves (Figure 7) were generated by subjecting each sample to different
steady shear rates at 150oC and recording the equilibrium stress that was built up over time.
An upward sweep was performed that was immediately followed by a downward sweep.
DSC scans were performed with a Seiko Instruments DSC 220C with liquid nitrogen
autocooler unit. All results are normalized to 1 mg sample weight.
210 Metallocene Technology
Table 1. Molecular weight, molecular weight distribution, zero shear viscosities
and branching of four metallocene-catalyzed polyethylenes
Sample MFI*Molecular weight x10
-3 ηo**
Pa.s
ηo**
Pa.sLCB***
Mn Mw Mz Mw/Mn
Dow Affinity PL 1880 1 33.4 77.1 143 2.31 10500 - 0.4240
Dow Affinity PL 1840 1 36.3 87.9 160 2.42 47000 15700 0.5695
Dow Affinity PL 1850 (3)? 55.1 116.4 183 2.11 46000 17200 0.1773
Exxon Exact 3022 1 45.3 95.8 165 2.11 16000 6500 no LCB
*reported; **at 190oC; ***LCB=long-chain branches/10,000 carbon;
Note: MW and branching data provided by Wilem deGroot, Dow Chemical Co.

Cylindrical samples of the polymers were molded using a molding fixture. The mold
was heated to 150oC and polymer pellets were dropped in. Vacuum was pulled through the
system in order to avoid polymer degradation in air. A plunger was used to pack the molten
polymer in a hydraulic press at about 2270 kg (5000 lbs) and then cooled at room tempera-
ture. The cylinder diameter ranged from 5.72 mm to 5.79 mm. These samples were glued to
clips using two-part epoxy adhesive (EPOXI-PATCH, Dexter Adhesives and Structural Ma-
terials). Constant extension rate uniaxial elongational tests were performed using
Rheometrics Extensional Rheometer (RER 9000). The test sample remained immersed in a
neutrally buouyant oil bath whose temperature was maintained at 150± 0.1oC. This tempera-
ture was selected because there was uniform deformation along the length of the sample with
minimum necking.
RESULTS AND DISCUSSION
In general, the metallocene-catalyzed PE’s are known to have narrow MWD’s (Figure 1)
which is reflected in their viscosity behavior (Figure 2). The filled points in Figure 2 were ob-
tained from steady-shear experiments using cone-and-plate geometry, and the open points
from dynamic oscillatory tests using parallel plates. In particular, sample Ex3022 exhibits a
long Newtonian plateau, i.e. the viscosity stays constant up to high values of ω (which is
equivalent to high shear rates by Cox-Merz rule5) and only barely begins to exhibit
shear-thinning behavior. On the other hand, the two branched samples PL1840 and PL1850
The Effects of Branching 211
Figure 1. Molecular weight distribution of PL 1840, PL 1850,
PL 1880, and Exact 3022.
Figure 2. Flow curves of PL 1840, PL 1850, PL 1880 and Exact
3022 at 150oC.

exhibit higher zero shear viscosities (Table 1) and an earlier onset of shear-thinning. It is in-
teresting that even though Ex3022 has higher MW than PL1840, its zero-shear viscosity is
much lower (by 80%, Table 1). Again, branching and MW seem to be having opposite effects
on zero-shear viscosity for PL1840 and PL1850, because despite the fact that the former poly-
mer has a much lower MW, its zero-shear viscosity is almost identical to that of PL1850. This
higher viscosity may be attributed to either its higher LCB content or higher MWD. At higher
frequencies, the viscosity curves of PL1840 and PL1850 do seem to separate out which sug-
gests that the two polymers have similar relaxation behavior at long times only.
The activation energy of PL1840, PL1850 and Ex3022 are shown in Table 2. These were
obtained by measuring ′′G at different temperatures (Figure 3), and then shifting them to
170oC using time-temperature superposition principle.6,7 As can be expected, the activation
energy of the linear polymer, namely Ex3022, is lower than its branched counter-part with
similar MW, PL1840 (Table 2). There are no discernable differences in activation energy of
PL1840 (35±2 kJ/mol) and PL1850 (362 kJ/mol).
Melting points of PL1840, 1850 and Exact 3022 are shown in Table 2. DSC diagrams in
Figure 4 show that in the cooling cycle, there is evidence of a “soft” crystallization peak at
212 Metallocene Technology
Table 2. Melting point and activation energies of metallocene-catalyzed PEs
Material Melting point,oC ∆Ea, K ∆Ea, kJ/mol ∆Ea, kcal/mol
Exxon Exact 3022 112 3240±310 27.0±2.5 6.4±0.6
Dow Affinity PL 1840 108 4200±244 35.0±2.0 8.3±0.4
Dow Affinity PL 1850 103 4330±252 36.0±2.0 8.6±0.5
Figure 3. Mastercurves of ′′G for PL 1840 and Exact 3022 at
Tref=170oC.
Figure 4. DSC heating and cooling curves of PL 1840, PL 1850
and Exact 3022.

lower temperatures. This is more pronounced in Ex3022 around 60oC than the Dow materials.
Hill et al.8 concluded that such a broad peak is due to the phase-separation of low MW mate-
rial and high MW fractions. This “soft” peak is more pronounced for conventional LLDPE’s
which have heterogeneous branching distributions, as observed by Gabriel et al.9
Temperature sweeps (Figure 5) at 2.5 and 5oC/min show that supercooling is enhanced
in PL 1840 and PL 1850 and not so in Ex3022. When the sweep is conducted at a faster rate,
the branched polymers are able to remain in the molten state at lower temperatures, but not so
for linear Ex3022. This suggests that the presence of long-chain branches may be hindering
the nucleation process, i.e. the initiation step toward crystallization.
Under extension, as shown in Figure 6, PL1840 exhibited some strain-hardening
whereas PL1850 behaved more like the linear systems. In fact, even though the shear viscos-
ity is highest for sample PL1850, the extensional viscosity of sample PL1840 rises above that
of sample PL1850, more so at lower extension rates. These results support the fact that sam-
ple PL1840 has more number of branches/10,000 carbon than sample PL1850 (Table 1).
Another interesting finding is that when the branched polymer PL1840 was subjected in-
creasing shear rates, the path that the equilibrium stress takes is different from that when
subjected to decreasing shear rates (Figures 7 & 8). The filled squares are equilibrium stresses
for upward rate sweep, and the open circles, the downward sweep. Hence, there seems to be a
stress-strain hysteresis effect for PL1840. But this is not the observed in the case of Ex3022
(Figure 8), which has the similar MW as PL1840. The linear material retraces its way back to
the lower shear rate stress value almost exactly the way as the stress grew. Hence, the with the
The Effects of Branching 213
Figure 5. Cooling curves of PL 1840, PL 1850, and Exact
3022 at 2.5 and 5oC/min lines on temperature axis indicate
melting points.
Figure 6. Transient extensional viscosity and dynamic viscosity
at 150oC.
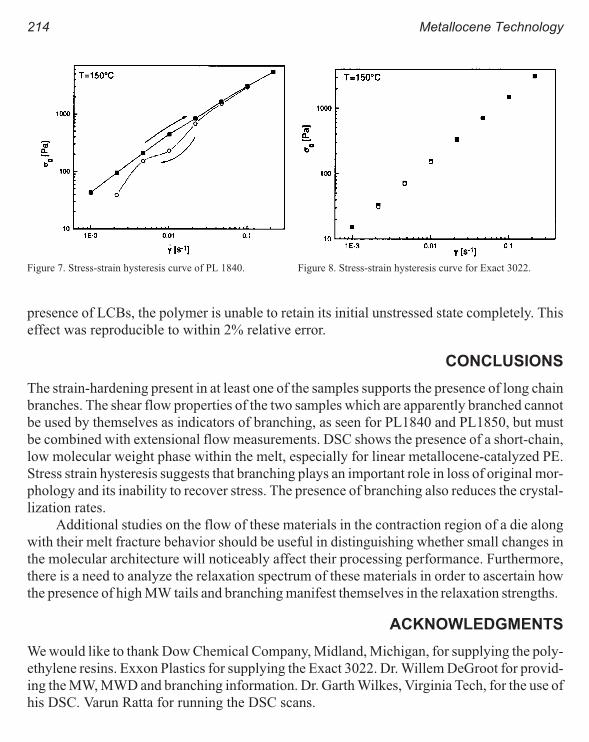
presence of LCBs, the polymer is unable to retain its initial unstressed state completely. This
effect was reproducible to within 2% relative error.
CONCLUSIONS
The strain-hardening present in at least one of the samples supports the presence of long chain
branches. The shear flow properties of the two samples which are apparently branched cannot
be used by themselves as indicators of branching, as seen for PL1840 and PL1850, but must
be combined with extensional flow measurements. DSC shows the presence of a short-chain,
low molecular weight phase within the melt, especially for linear metallocene-catalyzed PE.
Stress strain hysteresis suggests that branching plays an important role in loss of original mor-
phology and its inability to recover stress. The presence of branching also reduces the crystal-
lization rates.
Additional studies on the flow of these materials in the contraction region of a die along
with their melt fracture behavior should be useful in distinguishing whether small changes in
the molecular architecture will noticeably affect their processing performance. Furthermore,
there is a need to analyze the relaxation spectrum of these materials in order to ascertain how
the presence of high MW tails and branching manifest themselves in the relaxation strengths.
ACKNOWLEDGMENTS
We would like to thank Dow Chemical Company, Midland, Michigan, for supplying the poly-
ethylene resins. Exxon Plastics for supplying the Exact 3022. Dr. Willem DeGroot for provid-
ing the MW, MWD and branching information. Dr. Garth Wilkes, Virginia Tech, for the use of
his DSC. Varun Ratta for running the DSC scans.
214 Metallocene Technology
Figure 7. Stress-strain hysteresis curve of PL 1840. Figure 8. Stress-strain hysteresis curve for Exact 3022.
REFERENCES
1 W. Minoshima and J. L. White, J. Non-Newt. Fluid Mech., 19, 275-302 (1986).
2 H. Muenstedt and H. Laun, Rheol. Acta, 20, 211-221 (1981).
3 J. F. Vega, A. Munoz-Escalona, A. Santamaria, M. E. Munoz, and P. Lafuente, Macromolecules, 29, 960-965(1996).
4 Y. S. Kim, C. I. Chung, S. Y. Lai, and K. S. Hyun, SPE Technical Papers, 41, 1122-1128(1995).
5 E. H. Cox and W. P. Merz, Journal of Polymer Science, 28, 619-621 (1958).
6 J. D. Ferry, Viscoelastic Properties of Polymers, 2ed, 1970.
7 D. G. Baird and A. Collias, Polymer Processing.
8 M. J. Hill, P. J. Barham, J. van Ruiten, Polymer, 34(14), 2975-2980 (1993).
9 C. Gabriel, J. Kaschta and H. Muestedt, copy of manuscript submitted to Rheologica Acta.
The Effects of Branching 215

Extensional and Shear Rheology of
Metallocene-Catalyzed Polyethylenes
Sujan E. Bin Wadud and Donald G. Baird
Department of Chemical Engineering, Virginia Polytechnic Institute and State University,
Blacksburg, VA 24061-0211
INTRODUCTION
It is known that LDPE, followed by HDPE and then LLDPE, is the most stable in the film
blowing process.1 The stability is related to the extensional viscosity exhibited in general by
the three different types of polyethylenes (PE’s). In particular, LDPE which is highly
branched exhibits a significant degree of extensional strain-hardening, whereas LLDPE ex-
hibits none and HDPE can exhibit some as a result of a broad molecular weight distribution
(MWD).2 LDPE also exhibits an onset of shear-thinning at very low shear rates, usually less
than 0.1 s-1 whereas LLDPE does not shear-thin readily. With the advent of
metallocene-catalyzed polyethylenes (m-PE’s) some of the problems associated with LLDPE
such as processing stability and the lack of shear thinning, readily arise as a result of the nar-
row MWD possible with these systems.3 In an effort to improve on the processing perfor-
mance of m-PE’s, researchers at Dow4 have indicated that branching can be incorporated into
m-PE’s by forming copolymers containing an alpha-olefin such as octene. However, it is not
clear what the effect of branching is on the flow behavior of these systems. There is some in-
dication that the addition of a few long chain branches can promote shear-thinning behavior.
Furthermore, it is extremely difficult to identify branching analytically without assuming that
it is present. The purpose of this paper is to present studies concerned with the extensional and
shear viscosity behavior, supercooling effect, and other stress-strain relationships of three
PE’s which have apparently different degrees of long chain branching but similar melt flow
indexes.

EXPERIMENTAL
MATERIALS
The metallocene-catalyzed polyethylenes used were Dow Affinity PL 1880 (65), Affinity PL
1840 (66) and Affinity PL 1850 (67), which are copolymers of ethylene and octene-1, and Ex-
xon Exact 3022 (68). The Dow polymers are branched copolymers with controlled degrees of
branching and narrow MWD. The Exxon LLDPE is unbranched.
SAMPLE PREPARATION AND TESTING
Samples for dynamic shear rheological testing were prepared on the heated plates of the rhe-
ometer by placing polymer pellets on the lower plate and then bringing the higher plate to
press the molten polymer into a flat disk about 1 mm in thickness. The Rheometrics Mechani-
cal Spectrometer (RMS 800) with 25 mm diameter parallel plates was utilized. The test sam-
ple was maintained in a nitrogen atmosphere during all tests. A probe that was in contact with
the lower plate monitored the sample temperature. Complex viscosity measurements were
made in small amplitude oscillatory testing mode over angular frequency range of 0.04 to 100
rad/s. All tests were conducted at 150±0.1oC.
Cylindrical samples of the polymers were molded using a molding fixture. The mold
was heated to 150oC and polymer pellets were dropped in. Vacuum was pulled through the
system in order to avoid polymer degradation in air. A plunger was used to pack the molten
polymer in a hydraulic press at about 2270 kg (5000 lbs) and then cooled at room tempera-
ture. The cylinder diameter ranged from 5.72 mm to 5.79 mm. These samples were glued to
clips using two-part epoxy adhesive (EPOXI-PATCH, Dexter Adhesives and Structural Ma-
terials). Constant extension rate uniaxial elongational tests were performed using
Rheometrics Extensional Rheometer (RER 9000). The test sample remained immersed in a
neutrally buouyant oil bath whose temperature was maintained at 150±0.1oC. This tempera-
ture was selected because there was uniform deformation along the length of the sample with
minimum necking.
RESULTS AND DISCUSSION
As a point of reference the extensional stress versus strain of a conventional LDPE (c-LDPE)
is compared to that of conventional LLDPE(c-LLDPE) in Figure 1. The temperatures were
selected so that the shear viscosity of c-LLDPE was similar to that of c-LDPE. There is a dis-
tinct difference in the growth of extensional stress for the two PE's. In particular, for
c-LLDPE the stress rises rapidly to steady state and tends to level off. The rapid rise to steady
state is due to the short relaxation times which are related to a somewhat narrow MWD for the
c-LLDPE. On the other hand, the extensional stress of c-LDPE rises more slowly with
218 Metallocene Technology

strain(and hence time) but continues to rise above that for c-LLDPE. This increase of
extensional stress with increasing strain is referred to as strain-hardening. The transient re-
sponse of the highly branched PE is related to a broad MWD which provides longer relax-
ation times and the attempt of the fluid to rise to a high steady state stress value, which is
related to the presence of long chain branches. Hence, even though the shear viscosity of
these two PE's is similar at these temperatures, the extensional viscosity of the branched PE is
higher.
Before looking at the extensional viscosity of the metallocene-catalyzed
PE's(m-LLDPE), we investigate their dynamic shear behavior to provide a common point of
reference. The metallocene-catalyzed PE's are known to have narrow MWD's which is re-
flected in their viscosity behavior. In particular, as shown in Figure 2 for sample 68, the
viscosity stays constant up to high values of ω(which is equivalent to high shear rates) and
only barely begins to exhibit shear-thinning behavior. On the other hand, the two branched
samples (66 and 67) exhibit higher zero shear viscosities and an earlier onset of
shear-thinning. Although it is thought that this behavior is related somehow to the presence of
long chain branching, these changes could also be due to changes in MW and MWD. How-
ever, as observed in Figure 2, η* at 150oC for samples 66 and 67 are nearly identical which
suggests MW and MWD are very similar for the two PE's. What is more intriguing is the fact
that at 190oC (Figure 3) the shape of the flow curves for the two branched samples resemble
each other. In fact the data can be superimposed on each other by shifting mostly vertically
Extensional and Shear Rheology 219
Figure 1. Stress vs. strain curve for LDPE at 170oC and LLDPE
at 150oC at constant strain rates 0.215 and 1.00.
Figure 2. Complex viscosity vs. frequency for samples 65, 66,
67 and 68 at 150oC over frequency range 0.04 to 100 rads/s.
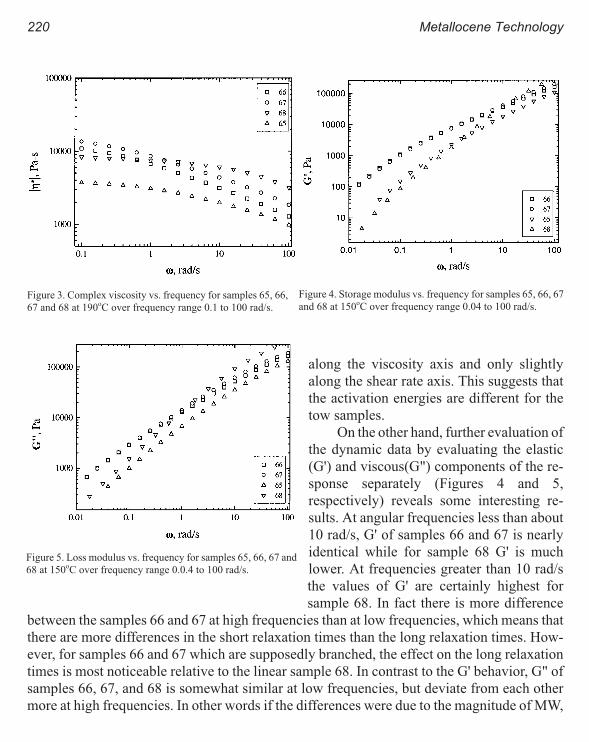
along the viscosity axis and only slightly
along the shear rate axis. This suggests that
the activation energies are different for the
tow samples.
On the other hand, further evaluation of
the dynamic data by evaluating the elastic
(G') and viscous(G") components of the re-
sponse separately (Figures 4 and 5,
respectively) reveals some interesting re-
sults. At angular frequencies less than about
10 rad/s, G' of samples 66 and 67 is nearly
identical while for sample 68 G' is much
lower. At frequencies greater than 10 rad/s
the values of G' are certainly highest for
sample 68. In fact there is more difference
between the samples 66 and 67 at high frequencies than at low frequencies, which means that
there are more differences in the short relaxation times than the long relaxation times. How-
ever, for samples 66 and 67 which are supposedly branched, the effect on the long relaxation
times is most noticeable relative to the linear sample 68. In contrast to the G' behavior, G" of
samples 66, 67, and 68 is somewhat similar at low frequencies, but deviate from each other
more at high frequencies. In other words if the differences were due to the magnitude of MW,
220 Metallocene Technology
Figure 3. Complex viscosity vs. frequency for samples 65, 66,
67 and 68 at 190oC over frequency range 0.1 to 100 rad/s.
Figure 4. Storage modulus vs. frequency for samples 65, 66, 67
and 68 at 150oC over frequency range 0.04 to 100 rad/s.
Figure 5. Loss modulus vs. frequency for samples 65, 66, 67 and
68 at 150oC over frequency range 0.0.4 to 100 rad/s.

then we might expect the behavior of G" to
resemble more closely that of G'. In any
event the dynamic response is somewhat
contradictory to having just changes in MW.
The most revealing results seem to be
in examining the extensional viscosity of
the samples. The extensional viscosity for
sample 68, basically a linear PE of narrow
MWD, which is not shown, is basically sim-
ilar to that shown for LLDPE. In particular,
the extensional viscosity rises rapidly to
steady state and because of the lack of
strain-hardening the samples tended to neck
and become unstable on extension. How-
ever, as shown in Figure. 5, sample 66
exhibited some strain-hardening whereas
sample 67 behaved more like the linear systems. In fact, even though the shear viscosity is
highest for sample 67, the extensional viscosity of sample 66 rises above that of sample 67.
These results suggest that sample 66 has more branches than does sample 67. Although the
extensional behavior of sample 67 more resembles that of a linear polymer or at least one with
a few short chain branches, there are still subtle signs of branching present.
CONCLUSIONS
The strain-hardening present in at least one of the samples is very suggestive of the presence
of long chain branches. The shear flow properties of the two samples which are apparently
branched can not be used by themselves as indicators of branching but must be combined
with extensional flow measurements. Additional studies on the flow of these materials in the
contraction region of a die along with their melt fracture behavior should be useful in distin-
guishing whether small changes in the molecular architecture will noticeably affect their pro-
cessing performance.
ACKNOWLEDGMENTS
We would like to thank Dow Chemical Company, Midland, Michigan, for supplying the poly-
ethylene resins.
Extensional and Shear Rheology 221
Figure 6. Elongational viscosity vs. strain curve for samples 66
and 67 at 150oC at constant strain rate 0.05.

2 H. Muenstedt and H. Laun, Rheol. Acta, 20, 211-221(1981).
3 J. F. Vega, A. Munoz-Escalona, A. Santamaria, M. E. Munoz, and P. Lafuente, Macromolecules, 29, 960-965(1996).
4 Y. S. Kim, C. I. Chung, S. Y. Lai, and K. S. Hyun, SPE Technical Papers, 41, 1122-1128(1995).
222 Metallocene Technology
REFERENCES
1 W. Minoshima and J. L. White, J. Non-Newt. Fluid Mech., 19, 275-302(1986).

A Criterion for the Onset of Gross Polyolefins:
Molecular Structure Effect
Seungoh Kim and John. M. Dealy
McGill University, Montreal, Canada
INTRODUCTION
In polymer melt extrusion, gross melt fracture, generally characterized by a chaotic distortion
of the extrudate, is often observed when the extrusion rate is increased beyond a certain value.
Since gross melt fracture limits the production rate, much attention has been devoted to un-
derstanding its origin. However, there is still no general understanding of the origin of this
phenomenon.3 Most of the previously proposed mechanisms and criteria for the onset of
gross melt fracture (OGMF) are based on quantities calculated assuming shear flow ; e.g., a
critical value of apparent wall shear rate or shear stress at the wall in capillary flow. These cri-
teria, while useful in comparing similar materials under the same flow conditions, sometimes
give inconsistent results when comparing data from different temperatures and die geome-
tries.1 They are also affected by slip at a certain stress level.
Moreover, correlating the onset of gross melt fracture with shear flow quantities has not
provided a satisfactory correlation of experimental observations. Direct visualization studies
and streaming birefringence patterns at the entrance of a capillary indicate that gross melt
fracture is initiated at the capillary inlet, where the fluid deformation is primarily an
extensional flow.5 This implies that extensional flow plays an important role in gross melt
fracture.
From a practical point of view, it is more important to establish a reliable criterion for
OGMF than to formulate a complete theory of its origin. The objective of this paper is not
concerned directly with the origin of gross melt fracture, but the conditions under which gross
melt fracture will be expected to occur.
A criterion for the onset of gross melt fracture based on extensional properties is pro-
posed. Extensional properties are estimated from the entrance pressure drop using the
analyses of Cogswell1 and Binding.2 The effects of molecular weight (MW), molecular
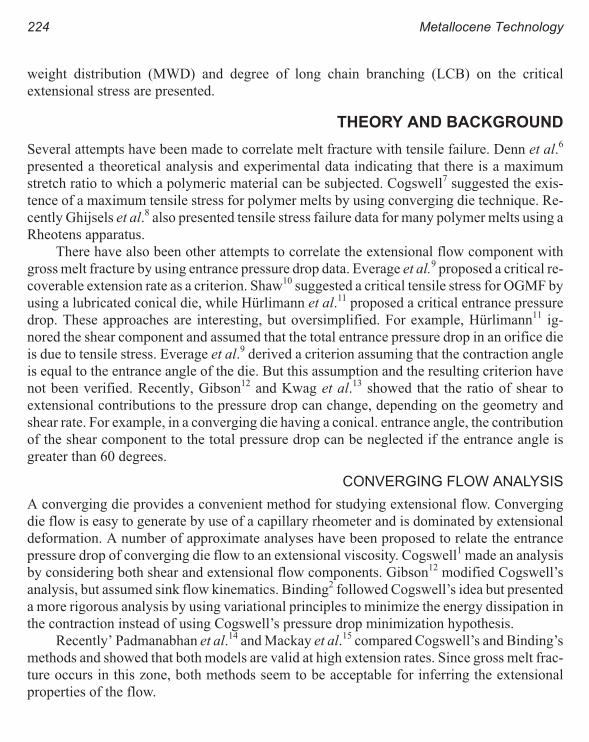
weight distribution (MWD) and degree of long chain branching (LCB) on the critical
extensional stress are presented.
THEORY AND BACKGROUND
Several attempts have been made to correlate melt fracture with tensile failure. Denn et al.6
presented a theoretical analysis and experimental data indicating that there is a maximum
stretch ratio to which a polymeric material can be subjected. Cogswell7 suggested the exis-
tence of a maximum tensile stress for polymer melts by using converging die technique. Re-
cently Ghijsels et al.8 also presented tensile stress failure data for many polymer melts using a
Rheotens apparatus.
There have also been other attempts to correlate the extensional flow component with
gross melt fracture by using entrance pressure drop data. Everage et al.9 proposed a critical re-
coverable extension rate as a criterion. Shaw10 suggested a critical tensile stress for OGMF by
using a lubricated conical die, while Hòrlimann et al.11 proposed a critical entrance pressure
drop. These approaches are interesting, but oversimplified. For example, Hòrlimann11 ig-nored the shear component and assumed that the total entrance pressure drop in an orifice dieis due to tensile stress. Everage et al.9 derived a criterion assuming that the contraction angleis equal to the entrance angle of the die. But this assumption and the resulting criterion havenot been verified. Recently, Gibson12 and Kwag et al.13 showed that the ratio of shear toextensional contributions to the pressure drop can change, depending on the geometry andshear rate. For example, in a converging die having a conical. entrance angle, the contributionof the shear component to the total pressure drop can be neglected if the entrance angle isgreater than 60 degrees.
CONVERGING FLOW ANALYSIS
A converging die provides a convenient method for studying extensional flow. Converging
die flow is easy to generate by use of a capillary rheometer and is dominated by extensional
deformation. A number of approximate analyses have been proposed to relate the entrance
pressure drop of converging die flow to an extensional viscosity. Cogswell1 made an analysis
by considering both shear and extensional flow components. Gibson12 modified Cogswell’s
analysis, but assumed sink flow kinematics. Binding2 followed Cogswell’s idea but presented
a more rigorous analysis by using variational principles to minimize the energy dissipation in
the contraction instead of using Cogswell’s pressure drop minimization hypothesis.
Recently’ Padmanabhan et al.14 and Mackay et al.15 compared Cogswell’s and Binding’s
methods and showed that both models are valid at high extension rates. Since gross melt frac-
ture occurs in this zone, both methods seem to be acceptable for inferring the extensional
properties of the flow.
224 Metallocene Technology
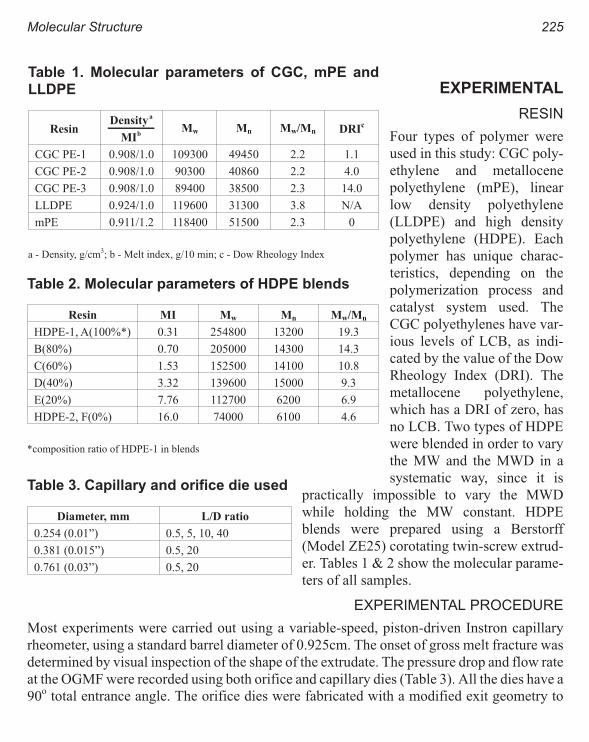
EXPERIMENTAL
RESIN
Four types of polymer were
used in this study: CGC poly-
ethylene and metallocene
polyethylene (mPE), linear
low density polyethylene
(LLDPE) and high density
polyethylene (HDPE). Each
polymer has unique charac-
teristics, depending on the
polymerization process and
catalyst system used. The
CGC polyethylenes have var-
ious levels of LCB, as indi-
cated by the value of the Dow
Rheology Index (DRI). The
metallocene polyethylene,
which has a DRI of zero, has
no LCB. Two types of HDPE
were blended in order to vary
the MW and the MWD in a
systematic way, since it is
practically impossible to vary the MWD
while holding the MW constant. HDPE
blends were prepared using a Berstorff
(Model ZE25) corotating twin-screw extrud-
er. Tables 1 & 2 show the molecular parame-
ters of all samples.
EXPERIMENTAL PROCEDURE
Most experiments were carried out using a variable-speed, piston-driven Instron capillary
rheometer, using a standard barrel diameter of 0.925cm. The onset of gross melt fracture was
determined by visual inspection of the shape of the extrudate. The pressure drop and flow rate
at the OGMF were recorded using both orifice and capillary dies (Table 3). All the dies have a
90o total entrance angle. The orifice dies were fabricated with a modified exit geometry to
Molecular Structure 225
Table 1. Molecular parameters of CGC, mPE and
LLDPE
ResinDensity
MI
a
bMw Mn Mw/Mn DRI
c
CGC PE-1 0.908/1.0 109300 49450 2.2 1.1
CGC PE-2 0.908/1.0 90300 40860 2.2 4.0
CGC PE-3 0.908/1.0 89400 38500 2.3 14.0
LLDPE 0.924/1.0 119600 31300 3.8 N/A
mPE 0.911/1.2 118400 51500 2.3 0
a - Density, g/cm3; b - Melt index, g/10 min; c - Dow Rheology Index
Table 2. Molecular parameters of HDPE blends
Resin MI Mw Mn Mw/Mn
HDPE-1, A(100%*) 0.31 254800 13200 19.3
B(80%) 0.70 205000 14300 14.3
C(60%) 1.53 152500 14100 10.8
D(40%) 3.32 139600 15000 9.3
E(20%) 7.76 112700 6200 6.9
HDPE-2, F(0%) 16.0 74000 6100 4.6
*composition ratio of HDPE-1 in blends
Table 3. Capillary and orifice die used
Diameter, mm L/D ratio
0.254 (0.01”) 0.5, 5, 10, 40
0.381 (0.015”) 0.5, 20
0.761 (0.03”) 0.5, 20

prevent the extrudate from touching the die exit. The entrance pressure drop data were deter-
mined using an orifice die. The true wall shear stress in the capillary die was determined by
use of the Bagley end correction, while the true wall shear rate was determined using the
Rabinowitch correction. All experiments were carried out over a broad temperature range,
which included the extrusion temperature used in industry.
The Rheometrics Dynamic Analyzer (RDA-II) was used to determine the linear
viscoelastic properties: storage modulus (G’), loss modulus (G") and complex viscosity (η*).
Samples were prepared by compression molding. Parallel plate fixtures (25 mm diameter)
were used with a gap of 1.0 mm and experiments were conducted under a nitrogen atmo-
sphere to prevent degradation. The frequency was varied in the range of 0.0126-500
(rad./sec). Strain sweeps were carried out to determine the linear viscoelastic regime for each
material at the various test temperatures and frequencies. To estimate the parameters of
power-law viscosity model, a regression technique was used. The power law exponent, n, is
especially important as it is used as an index for estimating the extensional stress in Binding’s
and Cogswell’s approximate analyses. All experiments were carried out at least three times to
ensure reproducibility of results. Finally, critical extensional stress and strain rate at OGMF
were estimated by using Cogswell’s and Binding’s analyses for the free convergence flow,
even though all dies used have a 90o total entrance angle.
RESULTS AND DISCUSSION
Figure 1 shows the flow curve obtained for HDPE-1 using capillary and orifice dies. The on-
set of gross melt fracture is indicated by the arrows. While oscillatory flow was observed in
the capillary dies before OGMF, this did not
appear when the orifice dies were used. This
implies that oscillatory flow originates in
the die land. It is believed that slip-stick and
melt compressibility are essential elements
of oscillatory flow in the flow of conven-
tional linear polymers. All samples used in
this study show behavior similar to HDPE-l.
Figure 2 shows the effect of the degree of
LCB on the viscosity of CGC and
metallocene polyethylenes. It is clear that
the levels of LCB in CGC polyethylenes en-
hance the zero shear viscosity dramatically.
Figure 3 shows the effect of high and low
molecular weight fractions on complex vis-
226 Metallocene Technology
Figure 1. Flow curve for HDPE-1 (diameter = 0.015 inch,
temperature = 180oC.

cosity. Decreasing the high molecular weight fraction decreases the zero shear viscosity, as
expected. However its contribution to shear thinning is not so strong. The effects of MWD on
the complex viscosity are shown Figure 4. LLDPE has a broad MWD and shows shear thin-
ning behavior at lower frequencies than mPE.
Figure 5 shows the effect of temperature on the critical extensional stress and strain rate.
The critical extensional stress is almost independent of temperature over a wide range of tem-
peratures. In contrast, the critical extensional strain rate shows a very strong temperature
dependence. This implies that the critical extensional stress is an intrinsic property of a mate-
rial. We therefore adapted the critical extensional stress as a criterion for OGMF. Figure 6
shows the effect of molecular weight on the critical extensional stress and strain rate as esti-
Molecular Structure 227
Figure 2. Complex viscosity curve of CGC and mPE (R = 2.5
cm, gap = 1.0 mm, temperature = 150oC).Figure 3. Complex viscosity curve of HDPE blends (R = 2.5
cm, gap = 1.0 mm, temperature = 160oC).
Figure 4. Complex viscosity curve of two different MWD
samples (R = 2.5 cm, gap = 1.0 mm, temperature = 150oC).
Figure 5. Temperature effect on critical extensional stress and
strain rate (CGC PE-1, Cogswell’s analysis).
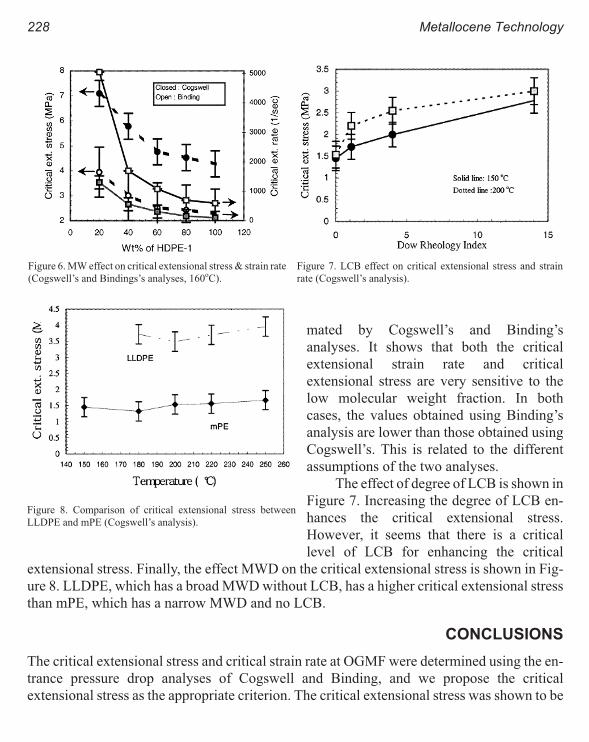
mated by Cogswell’s and Binding’s
analyses. It shows that both the critical
extensional strain rate and critical
extensional stress are very sensitive to the
low molecular weight fraction. In both
cases, the values obtained using Binding’s
analysis are lower than those obtained using
Cogswell’s. This is related to the different
assumptions of the two analyses.
The effect of degree of LCB is shown in
Figure 7. Increasing the degree of LCB en-
hances the critical extensional stress.
However, it seems that there is a critical
level of LCB for enhancing the critical
extensional stress. Finally, the effect MWD on the critical extensional stress is shown in Fig-
ure 8. LLDPE, which has a broad MWD without LCB, has a higher critical extensional stress
than mPE, which has a narrow MWD and no LCB.
CONCLUSIONS
The critical extensional stress and critical strain rate at OGMF were determined using the en-
trance pressure drop analyses of Cogswell and Binding, and we propose the critical
extensional stress as the appropriate criterion. The critical extensional stress was shown to be
228 Metallocene Technology
Figure 6. MW effect on critical extensional stress & strain rate
(Cogswell’s and Bindings’s analyses, 160oC).
Figure 7. LCB effect on critical extensional stress and strain
rate (Cogswell’s analysis).
Figure 8. Comparison of critical extensional stress between
LLDPE and mPE (Cogswell’s analysis).
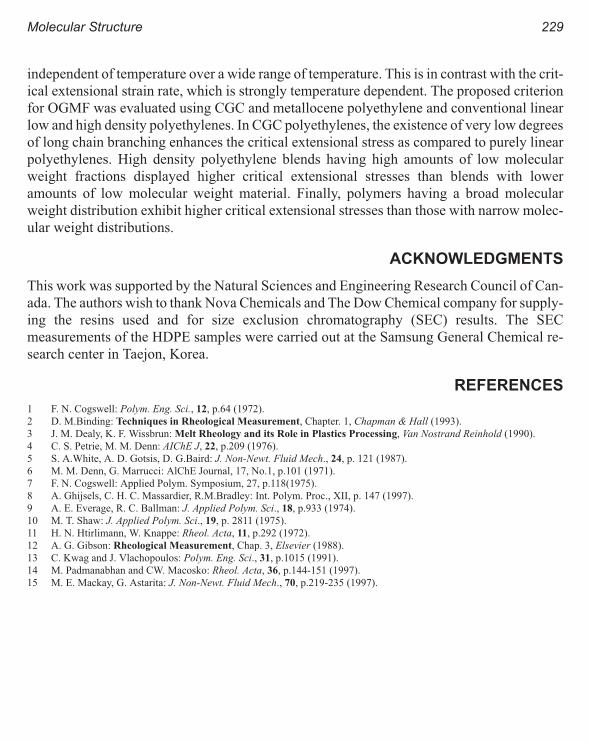
independent of temperature over a wide range of temperature. This is in contrast with the crit-
ical extensional strain rate, which is strongly temperature dependent. The proposed criterion
for OGMF was evaluated using CGC and metallocene polyethylene and conventional linear
low and high density polyethylenes. In CGC polyethylenes, the existence of very low degrees
of long chain branching enhances the critical extensional stress as compared to purely linear
polyethylenes. High density polyethylene blends having high amounts of low molecular
weight fractions displayed higher critical extensional stresses than blends with lower
amounts of low molecular weight material. Finally, polymers having a broad molecular
weight distribution exhibit higher critical extensional stresses than those with narrow molec-
ular weight distributions.
ACKNOWLEDGMENTS
This work was supported by the Natural Sciences and Engineering Research Council of Can-
ada. The authors wish to thank Nova Chemicals and The Dow Chemical company for supply-
ing the resins used and for size exclusion chromatography (SEC) results. The SEC
measurements of the HDPE samples were carried out at the Samsung General Chemical re-
search center in Taejon, Korea.
REFERENCES
1 F. N. Cogswell: Polym. Eng. Sci., 12, p.64 (1972).
2 D. M.Binding: Techniques in Rheological Measurement, Chapter. 1, Chapman & Hall (1993).
3 J. M. Dealy, K. F. Wissbrun: Melt Rheology and its Role in Plastics Processing, Van Nostrand Reinhold (1990).
4 C. S. Petrie, M. M. Denn: AIChE J, 22, p.209 (1976).
5 S. A.White, A. D. Gotsis, D. G.Baird: J. Non-Newt. Fluid Mech., 24, p. 121 (1987).
6 M. M. Denn, G. Marrucci: AlChE Journal, 17, No.1, p.101 (1971).
7 F. N. Cogswell: Applied Polym. Symposium, 27, p.118(1975).
8 A. Ghijsels, C. H. C. Massardier, R.M.Bradley: Int. Polym. Proc., XII, p. 147 (1997).
9 A. E. Everage, R. C. Ballman: J. Applied Polym. Sci., 18, p.933 (1974).
10 M. T. Shaw: J. Applied Polym. Sci., 19, p. 2811 (1975).
11 H. N. Htirlimann, W. Knappe: Rheol. Acta, 11, p.292 (1972).
12 A. G. Gibson: Rheological Measurement, Chap. 3, Elsevier (1988).
13 C. Kwag and J. Vlachopoulos: Polym. Eng. Sci., 31, p.1015 (1991).
14 M. Padmanabhan and CW. Macosko: Rheol. Acta, 36, p.144-151 (1997).
15 M. E. Mackay, G. Astarita: J. Non-Newt. Fluid Mech., 70, p.219-235 (1997).
Molecular Structure 229

Relationship Between Structure and Rheology of
Constrained Geometry Catalyzed and Metallocene
Polyethylenes
Paula Wood-Adams and John M. Dealy
Department of Chemical Engineering, McGill University, Montreal, Canada
INTRODUCTION
Constrained geometry catalyzed and metallocene polyethylenes, referred to as mPEs, have
narrow MWDs with polydispersity indexes of approximately 2. In the case of ethyleneα -ole-
fin copolymers produced with these catalysts, the SCBs are distributed randomly and. uni-
formly along the backbone and homogeneously among the molecules. Within the general
class of mPE there are two subclasses: linear and branched mPEs. The linear mPEs, have ei-
ther no branches or only short chain branches but no LCB. The branched mPEs, which are
produced by INSITETM Technology, have precisely controlled levels of LCB. These materials
are referred to as substantially linear to distinguish them from highly branched LDPE.
The narrow MWD provides the good physical properties characteristic of mPE.1 How-
ever, it also causes decreased shear thinning, resulting in higher energy requirements for
processing. The LCB in the AFFINITYTM materials increase the amount of shear thinning in-
crease melt strength and reduce susceptibility to melt fracture and draw resonance2 and
therefore improve their processability.
The LCB found in mPEs produced with constrained geometry catalysts is a very impor-
tant molecular characteristic. One of the most reliable analytical methods for detecting and
quantifying LCB is nuclear magnetic resonance (NMR).3 However by using NMR alone it is
difficult to distinguish between short branches that are 6 carbons in length or longer and long
branches (which are in this case approximately the same length as the backbone). Therefore,
another technique for the quantification of LCB is desired. Since rheological properties are
very much affected by LCB they provide the basis for such a technique.
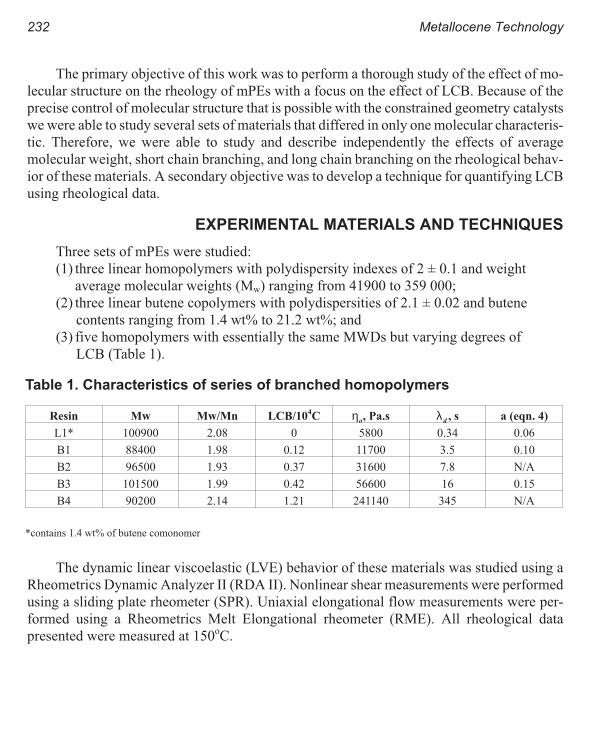
The primary objective of this work was to perform a thorough study of the effect of mo-
lecular structure on the rheology of mPEs with a focus on the effect of LCB. Because of the
precise control of molecular structure that is possible with the constrained geometry catalysts
we were able to study several sets of materials that differed in only one molecular characteris-
tic. Therefore, we were able to study and describe independently the effects of average
molecular weight, short chain branching, and long chain branching on the rheological behav-
ior of these materials. A secondary objective was to develop a technique for quantifying LCB
using rheological data.
EXPERIMENTAL MATERIALS AND TECHNIQUES
Three sets of mPEs were studied:
(1) three linear homopolymers with polydispersity indexes of 2 ± 0.1 and weight
average molecular weights (Mw) ranging from 41900 to 359 000;
(2) three linear butene copolymers with polydispersities of 2.1 ± 0.02 and butene
contents ranging from 1.4 wt% to 21.2 wt%; and
(3) five homopolymers with essentially the same MWDs but varying degrees of
LCB (Table 1).
The dynamic linear viscoelastic (LVE) behavior of these materials was studied using a
Rheometrics Dynamic Analyzer II (RDA II). Nonlinear shear measurements were performed
using a sliding plate rheometer (SPR). Uniaxial elongational flow measurements were per-
formed using a Rheometrics Melt Elongational rheometer (RME). All rheological data
presented were measured at 150oC.
232 Metallocene Technology
Table 1. Characteristics of series of branched homopolymers
Resin Mw Mw/Mn LCB/104C η
o, Pa.s λ
d, s a (eqn. 4)
L1* 100900 2.08 0 5800 0.34 0.06
B1 88400 1.98 0.12 11700 3.5 0.10
B2 96500 1.93 0.37 31600 7.8 N/A
B3 101500 1.99 0.42 56600 16 0.15
B4 90200 2.14 1.21 241140 345 N/A
*contains 1.4 wt% of butene comonomer

EFFECT OF MOLECULAR STRUCTURE ON THE RHEOLOGY OF mPEs
It was found that the linear mPEs follow the relation between zero shear viscosity (150oC)
and Mw in Eqn 1. The coefficients in Eqn 1 are in good agreement with those reported by Raju
et al.4 for polyethylene.
ηo wM= × −39 10 15 3 65. . [1]
We found that SCB has no significant effect on the LVE behavior.
The complex viscosity curves for the high density mPEs are compared in Figure 1. The
presence of LCB has four main effects on the complex viscosity:
(1) the zero shear viscosity is increased for the same molecular weight,
(2) the amount of shear thinning is increased,
(3) the transition zone between the zero shear viscosity and the power law zone
is broadened, and
(4) the curve takes on a sigmoidal shape.
We also see the expected broadening of the relaxation spectrum with increased degree of LCB
as demonstrated by the longest relaxation times (Table 1) calculated from the Doi-Edwards
model (Eqn 2).
λπ
ηd o s
oJ=
102
[2]
Structure and Rheology 233
Figure 1. The effect of LCB on complex and shear viscosity. Figure 2. Separable stress relaxation behavior (B3).
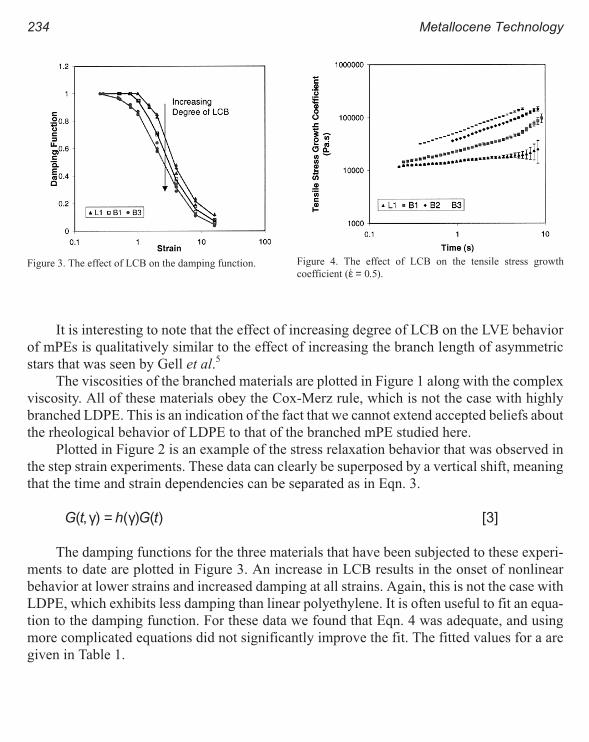
It is interesting to note that the effect of increasing degree of LCB on the LVE behavior
of mPEs is qualitatively similar to the effect of increasing the branch length of asymmetric
stars that was seen by Gell et al.5
The viscosities of the branched materials are plotted in Figure 1 along with the complex
viscosity. All of these materials obey the Cox-Merz rule, which is not the case with highly
branched LDPE. This is an indication of the fact that we cannot extend accepted beliefs about
the rheological behavior of LDPE to that of the branched mPE studied here.
Plotted in Figure 2 is an example of the stress relaxation behavior that was observed in
the step strain experiments. These data can clearly be superposed by a vertical shift, meaning
that the time and strain dependencies can be separated as in Eqn. 3.
G t h G t( , ) ( ) ( )γ γ= [3]
The damping functions for the three materials that have been subjected to these experi-
ments to date are plotted in Figure 3. An increase in LCB results in the onset of nonlinear
behavior at lower strains and increased damping at all strains. Again, this is not the case with
LDPE, which exhibits less damping than linear polyethylene. It is often useful to fit an equa-
tion to the damping function. For these data we found that Eqn. 4 was adequate, and using
more complicated equations did not significantly improve the fit. The fitted values for a are
given in Table 1.
234 Metallocene Technology
Figure 3. The effect of LCB on the damping function. Figure 4. The effect of LCB on the tensile stress growth
coefficient (& .ε = 0 5).

ha
( )γγ
=+
1
1 2[4]
The tensile stress growth functions for several of the high density mPEs at a Hencky
strain rate of 0.5 are plotted in Figure 4. As the degree of LCB increases, the tensile stress
growth coefficient increases. We see also that the branched materials exhibit strain hardening
while the curve for the linear material is essentially flat. It was not possible to obtain steady
state values, i.e. the extensional viscosity, for the branched materials.
QUANTIFICATION OF LONG CHAIN BRANCHING
A useful rheological technique for inferring the level of LCB must meet three criteria:
(1) It must distinguish between linear and branched mPEs
(2) It must distinguish between branched mPEs and traditional polyethylenes
(3) It must quantify LCB.
To meet the first criterion, a technique must involve a parameter that is independent of
Mw but highly sensitive to LCB. Since mPEs typically have polydispersity indexes of 2, the
shape of the MWD is not a complicating factor in meeting this criterion. Traditional
polyethylenes (LLDPE and HDPE) can have almost any shape and breadth of MWD, there-
fore to meet the second criterion the parameter must also be independent of MWD. Finally, to
quantify LCB, the parameter must have a unique value for any given degree of LCB within a
reasonable range.
Initially extensional flow measurements were investigated as a basis for an LCB quanti-
fication technique. Since we were able to collect only transient data over relatively narrow
strain range, and these data were quite noisy, we began to doubt their utility for this applica-
tion. To establish precisely the information contained in the extensional data that was not
present in the linear data, we made use of the reduced tensile stress growth coefficient defined
in Eqn. 5.
η ε η εηERE
o
tt
t
++
+=( , &)
( , &)
( )3[5]
The linear shear stress growth coefficient (ηo
+ ) was calculated using the discrete spec-
trum. The reduced tensile stress growth coefficient curves are compared for four of the high
density mPEs in Figure 5. We see that while the data for the linear material are distinct, the
curves for the branched materials are not affected by the degree of LCB. Therefore, the
extensional flow data do not contain any more information about the degree of LCB than is
Structure and Rheology 235

contained in the LVE data. Since the LVE data are easier to measure and more precise than the
extensional flow data we decided that they were more likely to be useful for inferring the level
of long chain branching.
Since both LCB and MWD affect the LVE behavior, the challenge was to find a way to
separate these two effects. If the material is known to be linear, then a reliable estimate of the
MWD can be obtained using the LVE data.
Many techniques have been proposed to do this; a particularly useful one is that devel-
oped by Shaw and Tuminello6 that allows the transformation of the complex viscosity curve
into the MWD. For branched materials such a transformation is not possible, since the com-
plex viscosity curve is strongly affected by degree of LCB. In fact for a branched material the
MWD predicted from LVE data (referred to as the viscosity MWD) will deviate from the true
MWD with the degree of deviation being related to the degree of LCB. Therefore, we decided
to look for a technique for quantifying LCB based on comparing the gel permeation chroma-
tography MWD with the viscosity MWD.
The technique used for calculating the viscosity MWD is a modified version of that de-
veloped by Shaw and Tuminello.6 The transform equation is given below.
w mm
d
d
d
o
(log )ln( ) * ln *
ln
l/
= −
+10
12
2
ηη
α ηω
αn *
ln
ln *
ln
ηω
ηωd
d
d+
2
[6]
where: ω ω α= c
-m and m M / Mw≡
236 Metallocene Technology
Figure 5. The effect of LCB on the reduced tensile stress
growth coefficient (& .ε = 0 5).Figure 6. Comparison of viscosity and GPC MWDs for L1.
Open symbols represent experimental data. Filled symbols
represent extrapolated data.

To use Eqn. 6, one must have η* data that include the Newtonian plateau and the power
law region. Since this range of behavior is not usually experimentally available, the experi-
mental data must be extrapolated. We use the discrete relaxation spectrum to extrapolate at
the low frequency end and the Vinogradov fluidity model to extrapolate at the high frequency
end.
The accuracy of the viscosity MWD is illustrated by the data for the linear material, Ll,
in Figure 6. For this material and most other linear materials we have excellent agreement be-
tween the viscosity and GPC MWDs. A study was performed with several linear mPEs and
LLDPEs to determine the effect of molecular weight, polydispersity, and short chain branch-
ing on the accuracy of the viscosity MWD. It was found that lowering the average molecular
weight or increasing the polydispersity decreased the quality of the predicted MWD and that
short chain branching had no effect on the quality. Even in the cases with the worst predic-
tions for MWD, significant details of the distribution such as peak molecular weight were still
well predicted.
The effect of LCB on the viscosity MWD can be seen in Figure 7, where the viscosity
and GPC MWDs for material B3 are compared. The viscosity MWD is significantly different
from the true GPC; the primary peak is shifted to a lower molecular weight, and a false peak is
added at the high molecular weight end. The viscosity MWD can be thought of as the MWD
of a linear polyethylene that would have the same complex viscosity curve as the branched,
narrow MWD material. It was found that the location of the primary peak in the viscosity
MWD relative to the peak in the GPC MWD was dependent on LCB. As the degree of LCB
increases the primary peak shifts to a lower molecular weight.We were able to correlate the
Structure and Rheology 237
Figure 7. Comparison of viscosity and GPC MWDs for B3.
Open symbols represent experimental data. Filled symbols
represent extrapolated data.
Figure 8. Peak molecular weight ration correlation.

shifting of the primary peak to degree of LCB using Eqn. 7. The quality of this fit is shown in
Figure 8.
( )[ ]LCB
Cfor r and
LCB
Cr for rp p p
100 1
10266 1
4 4
2
= < = ≥. log [7]
where: rp = GPC peak m/viscosity peak m.
CONCLUSIONS
The presence and degree of LCB significantly affects the linear and the nonlinear viscoelastic
behavior of constrained geometry catalyzed polyethylenes. The rheological data most suit-
able for quantification of LCB are linear viscoelastic data. It was found that these data could
be used in combination with gel permeation chromatography MWD data to predict the degree
of LCB.
ACKNOWLEDGMENTS
This work was supported by the Natural Sciences and Engineering Council of Canada and
The Dow Chemical Company. The authors wish to thank The Dow Chemical Company for
supplying the resins, performing the molecular structure analyses (GPC and NMR) and al-
lowing us to use their extensional rheometer.
NOMENCLATURE
G relaxation modulus ηE
+ tensile stress growth coefficient
h damping function ηER
+ reduced tensile stress growth coefficient
Js
o steady state compliance ηo zero shear viscosity
Mw weight average molecular weight η* complex viscosity&ε Hencky strain rate ω frequency
γ strain ωc critical frequency
λd longest relaxation time
REFERENCES
1 Lai, S. and G. W. Knight, SPE-ANTEC, 1188-1192 (1993).
2 Lai, S. T. A. Plumley, T. I. Butler, G. W. Knight, C. I. Kao, SPE-ANTEC, 1814-1815 (1994).
3 Randall, J.C., Am. Chem. Soc. Symp., 142, 93-118 (1980).
4 Raju, V.R., G.G. Smith, G. Marin, J.R. Knox, W.W. Graessley, J. Polym. Sci.: Phys. Ed., 17, 1183-1195 (1979).
5 Gell, C. B., W. W. Graessley, V. Efstratiadis, M. Pitsikalis, N. Hadjichristidis, J. Polym. Sci. B; Polym. Phys.,
Vol 35, 1943-1954 (1997).
6 Shaw, M. T. and W. H. Tuminello, Polym. Eng. Sci., 34, 159-165 (1994).
238 Metallocene Technology

The Influence of Sequence Length Distribution on
the Linear Crystal Growth of Ethylene-Octene
Copolymers
John E. Wagner, Samir Abu-Iqyas, Kenneth Monar and Paul J. Phillips
Dept of Materials Science and Engineering. University of Tennessee, Knoxville, TN
37996-2200
INTRODUCTION
Linear low-density polyethylenes (LLDPE) are a commercially important class of
polyethylenes, produced through the copolymerization of ethylene and comonomers such as
hexene or octene, thereby producing butyl or hexyl branches, respectively. In order to sepa-
rate the effects of copolymer content from molecular weight, a series of cross-fractionated co-
polymers has been investigated and reported in the recent past.1,2 The copolymers which had
been cross-fractionated for us by Dow Chemical had been synthesized using traditional
Ziegler-Natta type catalysts, which are well-known to produce molecules in which the copol-
ymer content varies with molecular weight. What was not well known at that time, or even
now, was the sequence length distributions of the octene and ethylene mers within each mole-
cule. It has been assumed to be random in the absence of contradictory information.
The regime theory which describes linear crystal growth in flexible polymers comprises
two separate processes. The first process is the deposition of secondary nuclei on the growth
face, usually denoted as occurring at a rate, i, the second process being the subsequent growth
along the face at the niches formed by the secondary nuclei, often referred to as the rate of sur-
face spreading, and denoted by the rate, g. The relative rates of these two processes determine
the regime at which the crystallization occurs. The concept of transitions was first introduced
in 1972 by Lauritzen and Hoffman2 and has since been extensively evaluated by Phillips and
others.3-6 Studies of the cross-fractionated Ziegler-Natta ethylene-octene copolymers showed
clearly that the effect of copolymerization was to reduce the linear growth rate. When ana-
lyzed further it was demonstrated that copolymerization reduced the rate of secondary

nucleation in an exponential manner, whilst reducing the rate of surface spreading only in a
somewhat linear manner. The net result was a depression of the regime I - regime II and re-
gime II - regime III transitions to lower temperatures by a few degrees. The effect of
increasing molecular weight was to negate the effect of increasing copolymer content as far as
the transition temperature was concerned, but also to reduce the linear growth rate.
Similar copolymers have now been produced using metallocene catalysts which are be-
lieved to produce random copolymers because of the nature of catalytic process. Dow
Chemical have now synthesized for us metallocene copolymers with molecular characteris-
tics as near as possible identical to those of the cross-fractionated samples. Prior studies of the
melting point - lamellar thickness relations have shown that the equilibrium melting points
are depressed by a factor greater than that predicted by the Flory equation. It will be shown in
this paper that for one of these copolymers the linear growth is depressed much more that in
the equivalent fraction of a Ziegler-Natta polymer, the regime I - regime II transition tempera-
ture being depressed much more and regime III appears. The conclusion resulting is that the
fractions of the Ziegler-Natta polymer contained non-random inclusion of the octene mers
and that this study generates a very important new variable for crystallization studies, namely
the sequence length distribution.
EXPERIMENTAL
LLDPE fractions, copolymers synthesized using metallocene catalysts and linear fractions
were supplied and characterized by the Dow Chemical Co. All copolymers contain octene as
the comonomer.
The fractions have been described previously.1,2 In sample designation, L and H refer to
low molecular weight and high molecular weight, respectively. The suffix M refers to materi-
als synthesized using metallocene catalysts and ZN to materials synthesized using
Ziegler-Natta catalysts (the latter are all fractions). Samples denoted by LPE are the linear
samples which contain no branching. Ta-
ble 1 gives the molecular weight
characteristics of the samples.
Linear spherulitic growth kinetics
experiments were performed using an
Olympus polarizing microscope with an
attached 35 mm camera and temperature
controlled hot stage. The change in the
morphological size was measured by
taking photographs as a function of time.
Samples were held at the melt tempera-
240 Metallocene Technology
Table 1. Molecular weight characteristics
Sample Mn Mw Branches*
LPE-13/18 13040 18120 0
LPE-54/101 53900 101300 0
L4-ZN 13400 23600 4.22
L4-M 27300 59900 3.98
H7-M 43600 94000 6.84
L11-M 21200 43700 10.86
* branches/1000 CH3
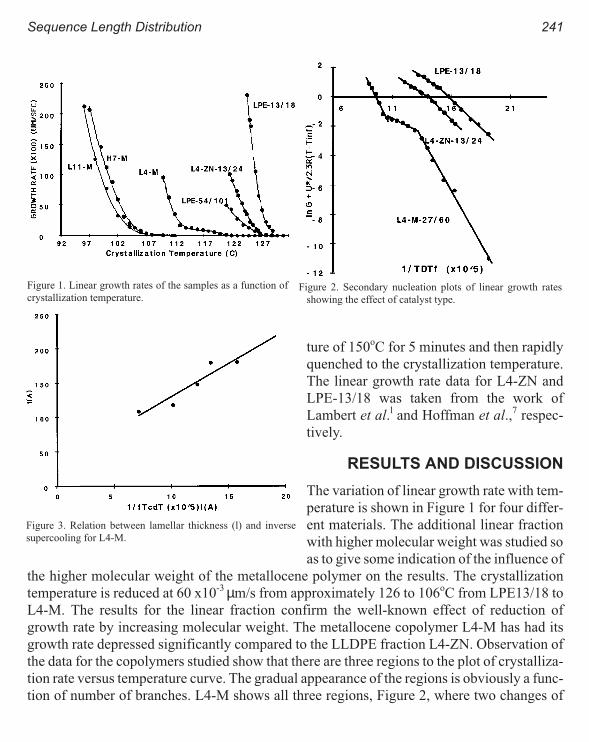
ture of 150oC for 5 minutes and then rapidly
quenched to the crystallization temperature.
The linear growth rate data for L4-ZN and
LPE-13/18 was taken from the work of
Lambert et al.l and Hoffman et al.,7 respec-
tively.
RESULTS AND DISCUSSION
The variation of linear growth rate with tem-
perature is shown in Figure 1 for four differ-
ent materials. The additional linear fraction
with higher molecular weight was studied so
as to give some indication of the influence of
the higher molecular weight of the metallocene polymer on the results. The crystallization
temperature is reduced at 60 x10-3 µm/s from approximately 126 to 106oC from LPE13/18 to
L4-M. The results for the linear fraction confirm the well-known effect of reduction of
growth rate by increasing molecular weight. The metallocene copolymer L4-M has had its
growth rate depressed significantly compared to the LLDPE fraction L4-ZN. Observation of
the data for the copolymers studied show that there are three regions to the plot of crystalliza-
tion rate versus temperature curve. The gradual appearance of the regions is obviously a func-
tion of number of branches. L4-M shows all three regions, Figure 2, where two changes of
Sequence Length Distribution 241
Figure 1. Linear growth rates of the samples as a function of
crystallization temperature.Figure 2. Secondary nucleation plots of linear growth rates
showing the effect of catalyst type.
Figure 3. Relation between lamellar thickness (l) and inverse
supercooling for L4-M.
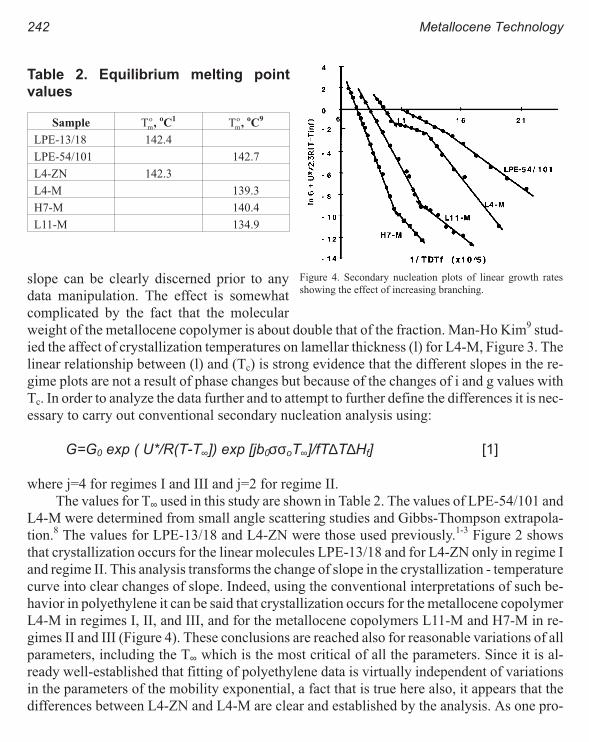
slope can be clearly discerned prior to any
data manipulation. The effect is somewhat
complicated by the fact that the molecular
weight of the metallocene copolymer is about double that of the fraction. Man-Ho Kim9 stud-
ied the affect of crystallization temperatures on lamellar thickness (l) for L4-M, Figure 3. The
linear relationship between (l) and (Tc) is strong evidence that the different slopes in the re-
gime plots are not a result of phase changes but because of the changes of i and g values with
Tc. In order to analyze the data further and to attempt to further define the differences it is nec-
essary to carry out conventional secondary nucleation analysis using:
G=G0 exp ( U*/R(T-T∞]) exp [jb0σσoT∞]/fT∆T∆Hf] [1]
where j=4 for regimes I and III and j=2 for regime II.
The values for T∞ used in this study are shown in Table 2. The values of LPE-54/101 and
L4-M were determined from small angle scattering studies and Gibbs-Thompson extrapola-
tion.8 The values for LPE-13/18 and L4-ZN were those used previously.1-3 Figure 2 shows
that crystallization occurs for the linear molecules LPE-13/18 and for L4-ZN only in regime I
and regime II. This analysis transforms the change of slope in the crystallization - temperature
curve into clear changes of slope. Indeed, using the conventional interpretations of such be-
havior in polyethylene it can be said that crystallization occurs for the metallocene copolymer
L4-M in regimes I, II, and III, and for the metallocene copolymers L11-M and H7-M in re-
gimes II and III (Figure 4). These conclusions are reached also for reasonable variations of all
parameters, including the T∞ which is the most critical of all the parameters. Since it is al-
ready well-established that fitting of polyethylene data is virtually independent of variations
in the parameters of the mobility exponential, a fact that is true here also, it appears that the
differences between L4-ZN and L4-M are clear and established by the analysis. As one pro-
242 Metallocene Technology
Table 2. Equilibrium melting point
values
Sample Tm
o ,oC
1Tm
o ,oC
9
LPE-13/18 142.4
LPE-54/101 142.7
L4-ZN 142.3
L4-M 139.3
H7-M 140.4
L11-M 134.9
Figure 4. Secondary nucleation plots of linear growth rates
showing the effect of increasing branching.

gresses from right to left in Figure 2 the
effect of the catalysts used in synthesis can
be seen. The Ziegler-Natta catalysts have
higher crystallization temperatures and
higher growth rates while the metallocene
catalysts have lower crystallization temper-
atures and lower growth rates. Figure 5
shows the effect of molecular weight.
LPE-13/18 with a lower molecular weight
than LPE-54/101 has the higher crystalliza-
tion temperature and higher growth rate but
both show regimes I and II. In Figure 4 it is
demonstrated that increasing branching is
more important than molecular weight. As
can be seen for the series LPE-54/101,
L4-M, and L11-M as well as LPE-54/101,
L4-M, and H7-M higher branching lowers the growth rate value offsetting the differences in
molecular weight.
Hoffman and Miller7 have demonstrated the use of secondary nucleation theory and ex-
perimental results to estimate the rate of deposition of secondary nuclei, i, and the rate of
surface spreading, g, found in regime theory. These parameters can only be estimated at the
regime transition temperature. The equations used for this study are too detailed to list here
but are dealt with thoroughly by Hoffman and Miller and had been used previously by Lam-
bert and Phillips.1,2 The results obtained are presented in Table 3, where the values obtained
by Lambert and Phillips have been combined with those currently calculated. All data is for
the regime I - II transition point except for L11-M and H7-M which has data reported for the
Sequence Length Distribution 243
Figure 5. Secondary nucleation plots of linear growth rates
showing the effect of molecular weight.
Table 3. Regime transition analysis results
SampleTransition
temperature,oC
Rate
cm/s
Growth rate
x10-3
cm/s
Reeling-in
x106
ncl/cm
g
x10-5
cm-1
LPE-13/18 (I-II) 125.3 1.73x10⁻⁴ - 458 5.2
LPE-54/101 (I-II) 125.6 9.46x10⁻⁶ 1.83 560 4.64
L4-ZN-13/24 (I-II) 124.2 4.47x10⁻⁵ - 13.7 4.73
L4-M (I-II) 119.5 5.45x10⁻⁶ 1.64 109 4.12
L4-M (II-III) 113.5 1.52x10⁻⁵ 1.44 1850 3.63
H7-M (II-III) 115.1 4.28x10⁻⁹ 1.49 1410 3.78
L11-M (II-III) 114.2 5.00x10⁻⁹ 1.50 2980 3.85

regime II-III transition point and L4-M which shows both the regime I-II transition point and
the regime II-III transition points. The most striking result of the tabulated data is the remark-
ably constant value of the rate of surface spreading. Of course, there is the expected reduction
between LPE-3/18 and LPE-54/101, see Figure 5, expected because of the increase in molec-
ular weight and presumably a result of a decrease in the rate of reptation. L4-M and L4-ZN
copolymers have approximately the same rate of surface spreading, close to the value of
LPE-54/101. However, L4-M, L11-M, and H7-M show a small reduction in g values, where
regimes II and III appear.
It is phenomenologically clear that the actual rate of surface spreading, or, by inference,
the rate of reptation, is the controlling variable. The regime transition temperature occurs at
whatever temperature is necessary for the rate of secondary nucleation to equal the rate of
spreading, when expressed in equivalent units, of course. The molecular variables alter the
rate of secondary nucleation in an exponential manner and the I-II regime transition occurs
whenever that rate equals the scarcely varying rate of surface spreading. From the point of
view of traditional nucleation theory the rate of spreading is essentially a rate of tertiary nu-
cleation, which should be sensitive to molecular variables in a similar, but not identical,
manner to secondary nucleation. Clearly this is not happening, a fact which has been alluded
to before.11 It therefore appears that the rate of surface spreading is essentially controlled by a
local mobility rate, i.e., the rate of reptation. Perhaps this should not be a surprise as it was
shown by Hoffman and coworkers a decade ago that the rate of reptation is just large enough
to permit the measured value of the rate of surface spreading in linear polyethylene at the re-
gime I - II transition. At lower crystallization temperature the rate of secondary nucleation
increases.
The second important conclusion lies in the interpretation of the major difference be-
tween the LLDPE fraction (L4-ZN) and the metallocene copolymer (L4-M) of identical
comonomer content. It is clear from previous work on the effect of molecular weight on the
crystallization behavior of fractions, and from the results on the molecular weight depend-
ence of linear polymers in the present study, that the influence of the molecular weight
disparity is minimal and that the differences, which are major, have to be ascribed to another
variable. The only remaining variable is the distribution of the sequence lengths of
methylenes in the polymers. Metallocene copolymers are widely regarded as random copoly-
mers and there is no evidence for non-randomness in the distribution from NMR studies. This
aspect of their behavior is ascribed to the catalyst in the synthesis being present in solution.
They are often referred to as single site catalysts. Ziegler-Natta copolymers are well-known
to have complex copolymer content - molecular weight characteristics because of the cata-
lysts being present on the surfaces of, and in the pores of, substrate particles. This gives rise to
the widely known variety of copolymer content present in any material. When combined with
the likelihood of chain scission occurring in the vicinity of an incorporated monomer (tertiary
244 Metallocene Technology

carbon at the branch) the well-known characteristics of high molecular weight - high methy-
lene sequence length and low molecular weight - low methylene sequence length emerge.
These characteristics are, of course, average characteristics over the materials produced dur-
ing fractionation experiments. It was for this reason that the fractions studied1,2 were
produced by cross- fractionation, in which the materials were first fractionated by copolymer
content. The state of micro-chemical analysis does not permit the estimation of the sequence
length distribution in a copolymer. The most that can be produced is evidence regarding short
sequences of the comonomer present in the polymers. The differences in composition of
LLDPE molecules are determined by the surface characteristics of the substrate particles, by
the relative abilities of the monomers to penetrate the pores in which the catalyst sites are lo-
cated and by local chemical interactions. It is also believed that catalyst sites can become
poisoned during polymerization, changing their characteristics. It seems likely therefore that
the sequence length distribution of the copolymer molecules need not be ideally random and,
indeed, might be expected to be non-random.
In the course of isothermal crystallization it is to be expected that the longest
polymethylene sequence lengths will crystallize first. This principle has long been recog-
nized and was first enunciated mathematically in Andrews’ copolymer crystallization
theory.11 Similarly in dynamic crystallization such long polymethylene sequences will be ex-
pected to crystallize at higher temperatures than shorter sequences. Hence, a copolymer
having an unusually large fraction of long polymethylene sequences will be expected to be-
have in a manner that is more similar to linear polyethylene than a copolymer containing an
average number of long polymethylene sequences, predictable using random
copolymerization theory. We therefore suggest that the differences in behavior between these
two copolymers of the same octene content be ascribed to differences in polymethylene se-
quence distribution caused by the different polymerization methods.
It is suggested that the behavior reported here is the first firm evidence available for the
inclusion of sequence length distribution in the list of essential molecular variables to be con-
sidered in understanding the behavior of copolymers, whereas all currently available theories
consider only random copolymers.
CONCLUSIONS
Studies of a random ethylene-octene copolymer containing four octenes per 1,000 car-
bon atoms show that it behaves differently from a fraction of a Ziegler-Natta copolymer of the
same octene content.
The random copolymer shows three different ranges of radial growth rate in the temper-
ature range studied. When analyzed using secondary nucleation theory it is found to show all
three regimes of growth. The range of temperature over which growth occurs is wider than
Sequence Length Distribution 245
that of both linear polyethylene and the aforementioned ZN fraction, but overlaps their ranges
only in their low supercooling regions. They both show only regimes I and II. Increasing
branch content shifts regimes from the I-II transition to II-III transition and reduces the
growth rate significantly.
Analysis of the data yielded estimates of the rates of secondary nucleation and of surface
spreading. The rate of surface spreading at the regime I-II transition and regime II-III transi-
tion scarcely varied across the polymers studied, whereas the rate of secondary nucleation
varied significantly.
Differences between the random metallocene copolymer and the ZN fraction are as-
cribed to differences in the polyethylene sequence length distribution in the two types of
copolymer synthesis.
ACKNOWLEDGMENTS
This research has been supported by the National Science Foundation under grants
DMR9408678 and DMR9711986, by the Dow Chemical Company and by the Center of Ex-
cellence in Materials Processing at the University of Tennessee.
REFERENCES
1 Lambert, W. S.; Phillips, P. J., Macromolecules, 1994, 27, 3537.
2 Hoffman, J. D.; Frolen, L. J.; Rose, G. S.; Lauritzan, J. I., Res. Nat. Bur. Stand., Sect. A, 1975, 79A, 671.
3 Phillips, P. J., Polym. Prepr. (Am. Chem. Soc., Div. Polym. Chem), 1979, 20, 438.
4 Hoffman, J. D., Polymer, 1983, 24, 3.
5 Hoffman, J. D. and Miller, R. L., Polymer, 1997, 38, 3151.
6 Phillips, P. J.; Lambert, W. S., Macromolecules, 1990, 23, 2075.
7 Hoffman, J. D.; Miller, R. L., Macromolecules 1988, 21, 3038.
8 Flory, P. J., J. Chem. Phys., 1949, 17, 223.
9 Kim, Man-Ho, 1996,"The Melting Behavior and Structure of Ethylene Copolymers from Metallocene Catalysts.",
Ph.D. Dissertation, University of Tennessee.
10 Flory, P. J.; Vrij, A., J. Am. Chem. Soc., 1963, 85, 3548.
11 Andrews, E. H. Owen, P. J., and Singh A., Proc. R. Soc. A, 1971, 324, 79.
246 Metallocene Technology

Crystallization and Microstructure of Ziegler-Natta
and Metallocene Based Isotactic Polypropylenes:
Simulation and Experiment
Y. Churdpunt and A. I. Isayev
Institute of Polymer Engineering, The University of Akron, Akron, Ohio 44325-0301
INTRODUCTION
Metallocene catalysts seem to get great attention from both researchers and manufacturers.
However, there are only few research papers concerning the crystallization of metallocene
based i-PP.1-3 Typically, the cooling rates obtained in crystallization experiments are low in
comparison with those in the real material processing such as injection molding. Therefore,
many researchers have used various methods to get the cooling rate as close as possible to the
real process.4-6 The quenching of slabs with a thermocouple placed in them is a very useful
method to study the crystallization at high cooling rates. Using this technique, De Carvalho et
al.6 were able to modify the approach to the simulation of the crystallization process in
quenched slabs of i-PP’s.5 They introduced the modified equation to obtain the nuclei concen-
tration along the gapwise direction and incorporated the temperature dependence of physical
properties. Their equation for calculating the nuclei concentration led to a better description
of the spherulite diameters. In particular, simulated spherulite size distribution in quenched
slabs was found to be in good agreement with the corresponding experimental results. In the
present paper, quenching experiments and simulations of the morphology of metallocene and
Ziegler-Natta based i-PP were performed along with DSC experiments to obtain isothermal
and nonisothermal rate of crystallization and induction time. Also, spherulitic growth rate ex-
periments were carried out. The differences and similarities of crystallization processes in
these polymers were discussed.

EXPERIMENTAL
MATERIALS AND METHODS OF INVESTIGATION
Two commercial grades of metallocene based i-PP’s, Achieve grades 3904 and 3825, sup-
plied by Exxon Chemical Company and one grade of Ziegler-Natta based i-PP, H444, sup-
plied by Himont USA, Inc. were used. The fundamental properties of these polymers are
listed in Table 1. The symbol mPP3904 and mPP3825 represents metallocene based i-PP’s
grade 3904 and 3825, respectively, and ZNPP444 represents Ziegler-Natta based i-PP’s grade
H444. It is seen from Table 1 that mPP3825 has the same molecular weight as ZNPP444 sam-
ple. Isothermal and nonisothermal crystallization studies were performed by using a Perkin
Elmer Differential Scanning Calorimeter (DSC-7). The evolution of heat during crystalliza-
tion obtained from nonisothermal crystallization experiment at various cooling rates was
used to calculate the degree of crystallinity as a function of temperature after the temperature
lag correction. The master curve approach to crystallization kinetics was performed to obtain
the nonisothermal rate constant from the nonisothermal experiment.7 The nonisothermal rate
constants from the nonisothermal experiments were combined with the nonisothermal rate
constants determined from isothermal experiments to get the wide range of crystallization
temperatures. The growth rate was obtained by measuring the diameter of spherulites as a
function of time during isothermal and nonisothermal crystallization using a special device
built in our laboratory.5 Quenching experiments were carried out on sheets approximately 3.3
mm thick, 2H. An iron-constantan thermocouple connected to a PC with a data acquisition
system was inserted into the sample in order to record the temperature trace during crystalli-
zation. The sample was heated to 200oC for about 10 minutes to remove any potential nuclei
and quenched into various quenching mediums, i.e. water and air. The diameter of spherulites
was measured across the slab using a Leitz 12 Pol S Optical microscope.
248 Metallocene Technology
Table 1. Fundamental properties of i-PP’s
Polymer MFR Polydispersity Mw Tm,oC ≅ H, J/g Ultimate crystallinity, %
mPP3904 22 2.0 161000 147.5 98.23 0.47
mPP3825 32 1.9 144800 148.7 105.66 0.51
ZNPP444 73 4.4 144000 162.0 121.90 0.58
THEORETICAL CONSIDERATIONS
CRYSTALLIZATION PROCESS
The overall crystallization kinetics for isothermal crystallization has been widely described
by the Avrami-Kolmogoroff equation.8,9 The half time of crystallization, t1/2, which is the
elapsed time from the crystallization onset time until the relative crystallinity reaches a value
of 0.5, has the form:
tk
n
1 2
1
2/
/
ln=
[1]
where k(T) is the isothermal rate constant as a function of temperature, T, and n is the Avrami
exponent.
During polymer processing, crystallization takes place under the nonisothermal condi-
tions. In order to describe the crystallization occurring in the real process, the nonisothermal
crystallization model has been used. One of the most accepted equations was proposed by
Nakamura et al.10 The differential form of the Nakamura equation is
d
dtnK T n nθ θ θ= − − − −( )( )[ ln( )]( ) /1 1 1 [2]
where K(T) is the non-isothermal crystallization rate constant which can be related to k(T) by
K T k Tt
nn
( ) [ ( )](ln )/
/
/
= =11
1 2
2[3]
Based on Equation (3) and according to Hoffman et al.11 the nonisothermal rate constant
can be expressed as
K Tt
U R
T T
n
o
( ) (ln ) exp* /
exp/
/
=
−
−
∞
211
1 2
−
k
T Tf
k
∆[4]
where R is the universal gas constant, Tm
o is the equilibrium melting point, ∆T=Tm
o - T, and
f=2T/(T + Tm
o ).
Crystallization and Microstructure 249
From the expression, the kinetic model has four parameters: (1/t1/2)o is a pre-exponential
factor that includes all terms independent of temperature, kk is the nucleation exponent, U* is
the activation energy for the transport of crystalline units across the phase boundary and T∞ is
taken as the glass-transition temperature minus 30oC. The isothermal induction time, ti, for
the crystallization process was obtained from the nonisothermal experiments as described by
Isayev et al.12 The nonisothermal induction time, ti, can be obtained by13
tdt
t Ti
t i
= =∫ ( )1
0
[5]
where t is the induction time index which becomes unity when the quiescent crystallization
starts. The isothermal induction time can be assumed to follow the Godovsky and
Slonimsky14 equation
t t T Ti m m
o a= − −( ) [6]
where tm and a are material constants independent of temperature.
Growth rates, G(T), can be determined from Hoffman-Lauritzen growth rate equation11
as follows
G T GU R
T T
k
T Tfo
g( ) exp
* /exp= −
−
−
∞ ∆[7]
where Go is a pre-exponential factor independent of temperature. The remaining factors have
the same meaning as outlined in Equation 4.
To calculate the gapwise distribution of spherulite diameter, the nuclei concentration,
N(T), can be determined by
N TV k T
G T( )
( )
( )= ∞3
4 3π[8]
where V∞ is the maximum volume fraction of spherulites at infinite time. The spherulite di-
ameter is assumed to be equal to L which is the average distance between nuclei. According to
Equation 8, for instantaneous three-dimensional growth, the constant L takes the form
250 Metallocene Technology

LV
N=
∞
8
1 2
π
/
[9]
where N is the average nuclei concentration. Considering N as an average for the whole crys-
tallization process based on the remaining amorphous fraction, because new nuclei can be
formed only in this phase, the average nuclei concentration can be expressed as follows:
N N T d= −∫ ( )( )10
1
θ θ [10]
with N(T) given by Equation 8.
SIMULATION OF MICROSTRUCTURE AND CRYSTALLIZATION IN QUENCHEDSLABS
In order to predict the crystallinity distributions and morphology of i-PP slabs of finite thick-
ness, an infinitely extended slab is considered. For this case, a one dimensional heat transfer,
incorporating a heat of crystallization term, was used. The rate of crystallization was obtained
from the Nakamura model.
RESULT AND DISCUSSION
QUIESCENT CRYSTALLIZATION KINETIC PARAMETERS
The result for the ultimate degree of crystallinity is listed in Table 1. Ziegler-Natta based i-PP
shows the highest value of the ultimate degree of crystallinity and melting point compared to
metallocene based i-PP’s which is also found by Bond and Spruiell.3 Moreover, the higher
molecular weight of metallocene based i-PP’s shows higher ultimate degree of crystallinity.
Figures 1 and 2 show the nonisothermal rate of crystallization and the spherulitic growth
rate, respectively. The nonisothermal rate of crystallization of metallocene based i-PP’s in-
creased as the molecular weight increased. When comparison was made at the same
molecular weight between metallocene and Ziegler-Natta based i-PP’s, metallocene based
i-PP has a lower crystallization rate constant. The growth rates of both grades of metallocene
based i-PP’s are the same but lower than the Ziegler-Natta based i-PP. However, metallocene
based i-PP’s have a much lower melting point compared to the conventional Ziegler-Natta
based i-PP as indicated in Table 1. This makes the difference in the degree of supercooling,
which plays an important role as the driving force of crystallization and should be taken into
consideration. Bond and Spruiell3 suggested that the lower melting point of metallocene
based i-PP’s is caused by the less stable lamellae and is due to the defects being more uni-
Crystallization and Microstructure 251

formly distributed from chain to chain compared to the Ziegler-Natta based i-PP. The fitted
curves for the growth rate and the nonisothermal rate constant were obtained by a nonlinear
fit to the kinetic equation, Equation 4, and the growth equation, Equation 7. The values of the
parameters obtained from the fittings are required for the simulation of spherulite size. From
our experiences, the predicted spherulite sizes are very sensitive to these values. Very high
cooling rates or at the low temperatures can not be achieved in our DSC and growth rate ex-
periments. Therefore there is still an uncertainty for the fitting at the low temperature region,
even though an attempt was made to incorporate the isothermal and nonisothermal experi-
ments to extend the range of the temperatures.7,15,16 Unless this problem is solved, it may
introduce some errors in the prediction of spherulite size. This low temperature region is more
important than the high one because it is the-temperature region where crystallization in the
real process occurs, especially in the quenching process in this study.
INDUCTION TIME PARAMETERS
In order to simulate the temperature profile, the induction time parameters, a and tm, in Equa-
tion 6, were obtained by fitting the experimental induction time from DSC and quenching ex-
periments as a function of cooling rates for each polymer. Figure 3 shows the temperature
traces with the measured and predicted induction time of slabs during quenching in air. The
252 Metallocene Technology
Figure 1. Nonisothermal crystallization rate constants as a
function of temperatures for various i-PP’s. Symbols
represent experimental data while lines represent non-linear
fit to the Hoffman-Lauritzen equation ( Equation 4).
Figure 2. Spherulite growth rates as a function of temperatures
for various i-PP’s. Symbols represent experimental data while
lines represent non-linear fit to the Hoffman-Lauritzen growth
equation (Equation 7).
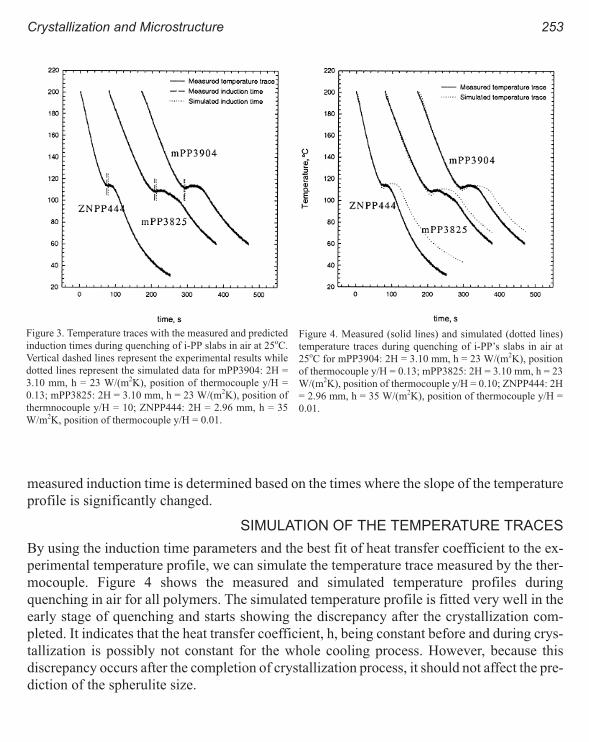
measured induction time is determined based on the times where the slope of the temperature
profile is significantly changed.
SIMULATION OF THE TEMPERATURE TRACES
By using the induction time parameters and the best fit of heat transfer coefficient to the ex-
perimental temperature profile, we can simulate the temperature trace measured by the ther-
mocouple. Figure 4 shows the measured and simulated temperature profiles during
quenching in air for all polymers. The simulated temperature profile is fitted very well in the
early stage of quenching and starts showing the discrepancy after the crystallization com-
pleted. It indicates that the heat transfer coefficient, h, being constant before and during crys-
tallization is possibly not constant for the whole cooling process. However, because this
discrepancy occurs after the completion of crystallization process, it should not affect the pre-
diction of the spherulite size.
Crystallization and Microstructure 253
Figure 3. Temperature traces with the measured and predicted
induction times during quenching of i-PP slabs in air at 25oC.
Vertical dashed lines represent the experimental results while
dotted lines represent the simulated data for mPP3904: 2H =
3.10 mm, h = 23 W/(m2K), position of thermocouple y/H =
0.13; mPP3825: 2H = 3.10 mm, h = 23 W/(m2K), position of
thermnocouple y/H = 10; ZNPP444: 2H = 2.96 mm, h = 35
W/m2K, position of thermocouple y/H = 0.01.
Figure 4. Measured (solid lines) and simulated (dotted lines)
temperature traces during quenching of i-PP’s slabs in air at
25oC for mPP3904: 2H = 3.10 mm, h = 23 W/(m2K), position
of thermocouple y/H = 0.13; mPP3825: 2H = 3.10 mm, h = 23
W/(m2K), position of thermocouple y/H = 0.10; ZNPP444: 2H
= 2.96 mm, h = 35 W/(m2K), position of thermocouple y/H =
0.01.

SPHERULITE SIZE DISTRIBUTION IN THE QUENCHED SLABS
The morphology developed in the quenched slab of all polymers has the spherulitic structure.
The samples quenched in water usually show the spherulite diameters smaller than the sam-
ples quenched in air. Also, water quenched samples show a lot of very fine and bright spheru-
lites at the surface. This type of spherulites were not observed in the samples quenched in air.
Instead, the sample quenched in air showed large row nucleated spherulites at the surface.
As shown in Figures 5 and 6, Ziegler-Natta based iPP has much larger spherulites than
metallocene based iPP’s. Between two metallocene based i-PP’s, the one with the lower mo-
lecular weight showed somewhat larger spherulite size. Moreover, samples quenched in air
and water show an increase in size of spherulites as the distance from the wall increases. The
distribution of the spherulite size is more evident in the samples quenched in water because
the cooling rate is higher and much different from the wall to the core. It is obvious that all
simulated results coincide with the experiment rather well. Simulated spherulite diameter dis-
tribution of the samples quenched in water showed more dramatic variation in sizes across the
thickness than that in the air. This simulated result is in very good agreement with the mor-
phology observed in the experiment.
254 Metallocene Technology
Figure 5. The gapwise distribution of measured (symbols)
and simulated (lines) spherulite diameters of i-PP slabs
quenched in air at 25oC.
Figure 6. The gapwise distribution of measured (symbols) and
simulated (lines) spherulite diameters of i-PP slabs quenched in
water at 25oC.

CONCLUSIONS
Ziegler-Natta and metallocene based i-PP’s exhibit different growth rates and rates of crystal-
lization. Both experimental and simulated results from quenching showed that Ziegler-Natta
based i-PP has much larger spherulite sizes than both grades of metallocene based i-PP’s.
Moreover, the lower molecular weight of metallocene based i-PP’s produces the larger
spherulite sizes.
REFERENCES
1 E. B. Bond and J. E. Spruiell, SPE ANTEC Tech. Papers, 388, 1754 (1997).
2 C. Y. Cheng and J. W. C. Kuo, SPE ANTEC Tech. Papers, 302, 1942 (1997).
3 E. B. Bond and J. E. Spruiell, SPE ANTEC Tech. Papers, 388, 1750 (1997).
4 Z. Ding and J. E. Spruiell, J. Polym. Sci. Polym. Phys., Part B, 35, 1077 (1997)
5 A. I. Isayev and B .F. Catignani, Polym. Eng. Sci., 37 (1997)
6 B. De Carvalho, R. E. S. Bretas and A. I. Isayev, J. Appl. Polym. Sci. (submitted).
7 T. Chan, L. Guo and A. I. Isayev, SPE Tech Papers, 41,1471(1995)
8 M. Avrami, J. Chem. Phys., 7, 1103 (1939); 8, 212 (1940) ; 9, 177 (1941)
9 A. N. Kolmogoroff, Isvestiya Akad. Nauk SSSR, Ser.Math., 1, 355 (1937)
10 K. Nakamura, K. Katayama and T. Amano, J. Appl. Polym. Sci., 17, 1031 (1975).
11 J. D. Hoffman, G. W. Davis and S.I. Lauritzen, Treatise on Solid State Chemistry, Vol.3, Ch7, N. B. Hannay ed., Plenum,
New York (1976).
12 A. I. Isayev, T. W. Chan, K. Shimojo and M. Gmerek, J. Appl. Polym. Sci., 55, 807 (1995).
13 W. L. Sifleet, N. Dinos and J. R. Collier, Polym. Eng. Sci., 13, 10 (1973).
14 Y. K. Godovsky and G. L. Slonimsky, J. Polym. Sci. Polym. Phys. Ed., 12, 1053 (1974).
15 T. W. Chan and A. I. Isayev, Polym. Eng. Sci., 34, 461 (1994).
16 T. W. Chan, G. D. Shyu and A. I. Isayev, Polym. Eng. Sci., 35, 733 (1995).
Crystallization and Microstructure 255

Crystallization of Ethylene-Octene Copolymers at
High Cooling Rates
Paul J. Phillips and John Wagner
Department of Materials Science & Engineering University of Tennessee, Knoxville, TN
37996-2000
INTRODUCTION
Linear low-density polyethylenes (LLDPE) are a commercially important class of
polyethylenes, produced through the copolymerization of ethylene and comonomers such as
hexene or octene, thereby producing butyl or hexyl branches, respectively. In order to sepa-
rate the effects of copolymer content from molecular weight, a series of cross-fractionated co-
polymers has been investigated and reported in the recent past.1,2 The copolymers which had
been cross-fractionated for us by Dow Chemical had been synthesized using traditional
Ziegler-Natta type catalysts, which are well-known to produce molecules in which the copol-
ymer content varies with molecular weight. What was not well known at that time, or even
now, was the sequence length distributions of the octene and ethylene mers within each mole-
cule. It has been assumed to be random in the absence of contradictory information. Our stud-
ies of random copolymers produced using metallocene catalysts showed that the
crystallization behavior was very different from that of the Ziegler-Natta materials, a result
which had to be a consequence of the ZN polymers being non-random within each molecule.
Quiescent crystallization is usually separated into its component parts of primary nucle-
ation, linear spherulite (or lamellar) growth and secondary crystallization. In this paper only
the linear spherulite growth rates will be considered. Regime theory, which describes linear
spherulite growth in flexible polymers, comprises two separate processes. The first process is
the deposition of secondary nuclei on the growth face, usually denoted as occurring at a rate i,
the second process being the subsequent growth along the face at the niches formed by the
secondary nuclei, often referred to as the rate of surface spreading, and denoted by the rate g.
The relative rates of these two processes determines the regime at which the crystallization
occurs. The concept of transitions was first introduced in 1972 by Lauritzen and Hoffman2

and has since been extensively evaluated by Phillips and others.3,4,5,6 Studies of the
cross-fractionated Ziegler-Natta ethylene-octene copolymers showed clearly that the effect
of copolymerization was to reduce the linear growth rate. When analyzed further it was dem-
onstrated that copolymerization reduced the rate of secondary nucleation in an exponential
manner, whilst reducing the rate of surface spreading only in a somewhat linear manner. The
net result was a depression of the regime I - regime II and regime II - regime III transitions to
lower temperatures by a few degrees. The effect of increasing molecular weight was to negate
the effect of increasing copolymer content as far as the transition temperature was concerned,
but also to reduce the linear growth rate. Up until the present date, it has been generally as-
sumed that regime theory can describe all known crystallization behavior in polyolefins.
Similar copolymers have been produced using metallocene catalysts, which are believed
to produce random copolymers because of the nature of catalytic process. Dow Chemical
synthesized for us metallocene copolymers with molecular characteristics as near as possible
identical to those of the cross-fractionated samples. Prior studies of the melting point -
lamellar thickness relations have shown that the equilibrium melting points are depressed by
a factor greater than that predicted by the Flory equation. It was shown in the ANTEC 98 pa-
per that for one of these copolymers the linear growth is depressed much more that in the
equivalent fraction of a Ziegler-Natta polymer, the regime I - regime II transition temperature
being depressed much more and regime III appears. The conclusion resulting was that the
fractions of the Ziegler-Natta polymer contained non-random inclusion of the octene mers
and that this study generated a very important new variable for crystallization studies, namely
the sequence length distribution.
In the study being reported in ANTEC 99, the studies of the metallocene copolymers
have been extended to the very high supercoolings characteristic of commercial processing
operations. It will be demonstrated that, under such conditions, the polymer behavior changes
dramatically and no longer is dependent on comonomer content and, apparently also, molecu-
lar weight. This process is envisioned as being similar to a congealing process in which the
copolymer molecules wiggle into place as the growing crystal sweeps through them, the
hexyl branches being included in the metastable crystals. Presumably, these crystals anneal
and perfect through a variety of subsequent processes, in which some of the hexyl branches
are ejected from the crystals. It is suggested that these later events control the final mechani-
cal and physical properties, rather than the effective crystallization temperature.
EXPERIMENTAL
LLDPE fractions, copolymers synthesized using metallocene catalysts and linear fractions
were supplied and characterized by the Dow Chemical Co. All copolymers contain octene as
the comonomer. The fractions have been described previously,1,2 as also have the metallocene
258 Metallocene Technology

copolymers.7 In sample designation
L and H refer to low molecular
weight and high molecular weight
respectively. The suffix M refers to
materials synthesized using
metallocene catalysts and ZN to
materials synthesized using
Ziegler-Natta catalysts (the latter
are all fractions). The numbers fol-
lowing the letters refer to the num-
ber of hexyl branches per 1,000
carbon atoms. Samples denoted by
LPE are the linear samples, the
numbers following the LPE refer-
ring to the molecular weights in
1,000s.
Linear spherulitic growth kinetics experiments were performed using an Olympus polar-
izing microscope with an attached 35 mm camera and temperature controlled hot stage. The
change in the morphological size was measured by taking photographs as a function of time.
Samples were held at the melt temperature of 150oC for 5 minutes and then rapidly quenched
to the crystallization temperature. Crystallization experiments at high supercoolings were
carried out in the original Ding - Spruiell rapid cooling equipment.8,9
RESULTS AND DISCUSSION
The variation of linear growth rate with temperature is shown in Figure 1 for several different
materials, where the filled symbols represent points obtained in conventional isothermal
crystallization experiments. The open symbols represent data points obtained in rapid cooling
experiments, where the polymer generates its own pseudo-isothermal crystallization temper-
ature. It can be seen clearly that as high supercoolings are approached the curves of all the co-
polymers are tending to merge into a single curve, regardless of comonomer content or
molecular weight. It has to be remembered that the equilibrium melting point is dependent on
molecular weight and comonomer content and the data should be corrected for that variable
using the supercooling, relative to the equilibrium melting point of each copolymer. When the
data are plotted as a function of supercooling (Figure 2), the same merging phenomenon can
be seen, perhaps even more clearly. The third type of plot normally made is the secondary nu-
cleation, or regime, plot in which the logarithm of the growth rate, less a mobility term, is
plotted against the reciprocal of supercooling. It is this plot that permits the different regimes
Crystallization 259
Figure 1. Growth rate.

to be identified and is, in many ways,
the defining plot for the crystalliza-
tion behavior of a polymer. Such a
plot is shown in Figure 3.
The entire crystallization be-
havior of the copolymers can now be
analyzed. First, the filled points, in-
dicative of conventional isothermal
studies, show the expected decrease
in crystallization rate as comonomer
content is increased (e.g. compare L4
with L11). Also apparent is the de-
crease of crystallization rate with
increasing molecular weight (e.g. H7
is slower than Ll1). Also shown are
the data for the Ziegler-Natta frac-
tion, (L4-ZN), which crystallizes
much more rapidly than for the com-
parable metallocene copolymer
L4-M. When the open symbols, in-
dicative of rapid cooling
experiments, are considered, it can
be seen that initially they continue on
the same lines as the filled points.
This is a very important observation,
since it tells us that there is no signif-
icant difference between an
experiment carried out isothermally
and one that is carried out dynami-
cally in a rapid manner, and in which
the polymer generates its own
pseudo-isothermal crystallization condition. It is, however, clear that as the experiments pro-
ceed to successively higher and higher cooling rates that there is a slow downward change in
the slope for all the copolymers. Ultimately, the copolymers are attaining the same growth
rates. This cannot occur if the normal selection rules of copolymer crystallization, based on
exclusion of the comonomer units, continue to apply. Nor can the merging of the curves to a
common line, regardless of molecular weight, occur unless there is essentially a lack of long
range movement of the polymer chains during the crystallization process. In other words, the
260 Metallocene Technology
Figure 2. Effect of supercooling.
Figure 3. Crystallization behavior.
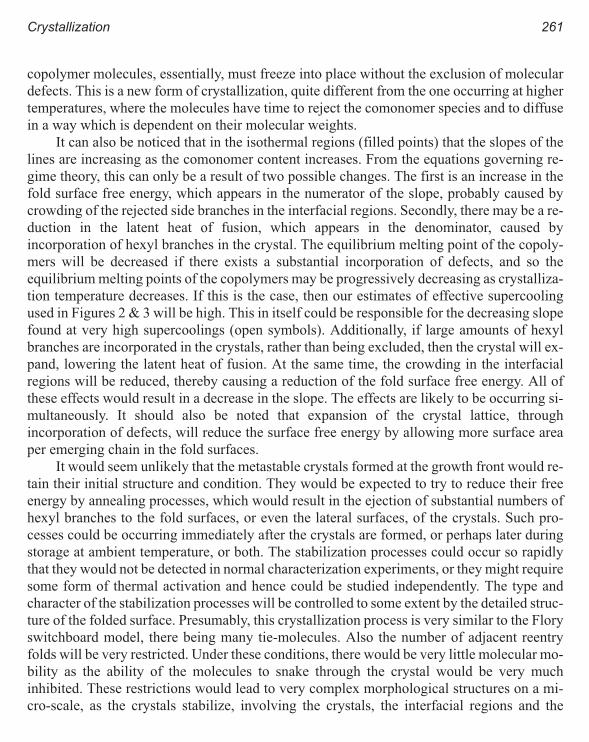
copolymer molecules, essentially, must freeze into place without the exclusion of molecular
defects. This is a new form of crystallization, quite different from the one occurring at higher
temperatures, where the molecules have time to reject the comonomer species and to diffuse
in a way which is dependent on their molecular weights.
It can also be noticed that in the isothermal regions (filled points) that the slopes of the
lines are increasing as the comonomer content increases. From the equations governing re-
gime theory, this can only be a result of two possible changes. The first is an increase in the
fold surface free energy, which appears in the numerator of the slope, probably caused by
crowding of the rejected side branches in the interfacial regions. Secondly, there may be a re-
duction in the latent heat of fusion, which appears in the denominator, caused by
incorporation of hexyl branches in the crystal. The equilibrium melting point of the copoly-
mers will be decreased if there exists a substantial incorporation of defects, and so the
equilibrium melting points of the copolymers may be progressively decreasing as crystalliza-
tion temperature decreases. If this is the case, then our estimates of effective supercooling
used in Figures 2 & 3 will be high. This in itself could be responsible for the decreasing slope
found at very high supercoolings (open symbols). Additionally, if large amounts of hexyl
branches are incorporated in the crystals, rather than being excluded, then the crystal will ex-
pand, lowering the latent heat of fusion. At the same time, the crowding in the interfacial
regions will be reduced, thereby causing a reduction of the fold surface free energy. All of
these effects would result in a decrease in the slope. The effects are likely to be occurring si-
multaneously. It should also be noted that expansion of the crystal lattice, through
incorporation of defects, will reduce the surface free energy by allowing more surface area
per emerging chain in the fold surfaces.
It would seem unlikely that the metastable crystals formed at the growth front would re-
tain their initial structure and condition. They would be expected to try to reduce their free
energy by annealing processes, which would result in the ejection of substantial numbers of
hexyl branches to the fold surfaces, or even the lateral surfaces, of the crystals. Such pro-
cesses could be occurring immediately after the crystals are formed, or perhaps later during
storage at ambient temperature, or both. The stabilization processes could occur so rapidly
that they would not be detected in normal characterization experiments, or they might require
some form of thermal activation and hence could be studied independently. The type and
character of the stabilization processes will be controlled to some extent by the detailed struc-
ture of the folded surface. Presumably, this crystallization process is very similar to the Flory
switchboard model, there being many tie-molecules. Also the number of adjacent reentry
folds will be very restricted. Under these conditions, there would be very little molecular mo-
bility as the ability of the molecules to snake through the crystal would be very much
inhibited. These restrictions would lead to very complex morphological structures on a mi-
cro-scale, as the crystals stabilize, involving the crystals, the interfacial regions and the
Crystallization 261

interlamellar material. They would also lead to complex molecular trajectories and hence net-
work structures. It would be these morphological - molecular features that would interact to
control the resultant mechanical and physical properties. The ultimate properties, such as
strain to failure and fracture toughness might be affected most by these features.
CONCLUSIONS
The random copolymers show up to three different ranges of radial growth rate in the isother-
mal temperature range studied, assigned to all three regimes of growth. Increasing branch
content shifts regimes from the I-II transition to II-III transition and reduces the growth rate
significantly.
When studies are extended to rapid cooling experiments, in which the polymer generates
its own pseudo-isothermal crystallization temperature, the applicable existing regime III re-
gion is continued for a restricted range of temperature. When very high supercoolings are
approached a new form of crystallization occurs, in which the comonomer units are no longer
excluded and molecular weight dependencies appear to be eliminated. The copolymers be-
come indistinguishable from one another on the basis of their spherulite growth rates.
ACKNOWLEDGMENTS
This research has been supported by the Polymers Program of the National Science Founda-
tion under grants DMR9408678 and DMR9711986 and by the Center of Excellence in Mate-
rials Processing at the University of Tennessee.
REFERENCES
1 Lambert, W. S.; Phillips, P. J., Macromolecules, 1994, 27, 3537.
2 Hoffman, J. D.; Frolen, L. J.; Ross, G. S.; Lauritzen, J. I., J. Res. Nat. Bur. Stand., Sect. A, 1975, 79A, 671.
3 Phillips, P. J., Polym. Prepr. (Am. Chem. Soc., Div. Polym. Chem), 1979, 20, 438.
4 Hoffman, J. D., Polymer, 1983, 24, 3.
5 Hoffman, J. D. and Miller, R. L., Polymer, 1997, 38, 3151.
6 Phillips, P. J.; Lambert, W. S., Macromolecules, 1990, 23, 2075.
7 Kim. M-H; Phillips, P. J., J. Appl. Polym.Sci., 1998, 70, 1893.
8 Ding, Z.; Spruiell, J. E., J. Polym. Sci., B, Polym. Phys. Ed., 1996, 34, 2783.
9 Supaphol, P.; Sprueill, J. E., J. Polym. Sci., B, Polym. Phys. Ed., 1998, 36, 681.
262 Metallocene Technology

Kinetics of Non-Isothermal Crystallization
Syndiotactic Polypropylene:
Avrami, Ozawa, and Kissinger Approaches
Pitt Supaphol and Joseph E. Spruiell
Dept. of Materials Science and Engineering, University of Tennessee, Knoxville, TN 37996
INTRODUCTION
Syndiotactic polypropylene (sPP) has largely been a laboratory curiosity since it was first
produced in 1960s by Natta et al.1,2 It has gained more interest in terms of industrial applica-
tions since 1988 when Ewen et al.3 reported that highly stereoregular and regioregular sPP
can be synthesized using novel metallocene catalysts. Since then, industrial applications of
sPP have been extensively explored in the areas such as films,4,5 injection molding,6 and
melt-spun fibers7 by researchers at both Fina Oil and Chemical Company in Dallas, Texas and
Mitsui Toatsu Chemical Company in Osaka, Japan, which are the business partners and major
commercial producers of sPP. Other physical properties related to applications have also been
investigated and reported.8,9
It is well known that a semi-crystalline polymer, such as sPP, will crystallize when sub-
jected to a cooling regime whether it is isothermal or non-isothermal. The physical properties
of semi-crystalline polymers are strongly dependent on the crystalline structure formed and
the extent of the crystallization during processing. It is therefore very important to understand
the processing-structure-property inter-relationships of the studied materials, which in this
case is sPP. Studies related to the chain conformation, crystal structure, morphology, and
phase transitions in sPP have been reported extensively in recent years. These researches up
to 1995 were reviewed and published by Rodriguez-Amold et al.10 Published studies on crys-
tallization kinetics of sPP include isothermal Avrami crystallization kinetics,11-14 and the
isothermal kinetics of the linear growth rates.11,15-17 There have been a number of published
reports concerning non-isothermal crystallization behavior of sPP,11,18-19 but none had re-
ported on the kinetics of non-isothermal crystallization.

In this manuscript, we focus on the kinetics of nonisothermal crystallization of sPP using
a differential scanning calorimeter (DSC). The data were analyzed based on the modified
Avrami and Ozawa approaches. The activation energy for non-isothermal melt crystallization
was also calculated based on the Kissinger method.
THEORETICAL
The most common approach used to describe the overall isothermal crystallization kinetics is
the Avrami equation:20
( )1 1− = − = −∞
χχ
θtt
nt k t( ) exp [1]
whereχ t andχ∞ are the transient and ultimate absolute crystallinity, respectively,θ(t) the rela-
tive crystallinity, kt the isothermal bulk crystallization rate constant (which constitutes the
growth and nucleation behavior), n the Avrami exponent, and t the time taken during the crys-
tallization process (the incubation time, to, is excluded). Both kt and n are constants typical of
a given crystalline morphology, and type of nucleation at a particular crystallization condi-
tion.21
Alternatively, Equation (1) can be written in its logarithmic form:
ln[ ln( ( ))] ln ln( )− − = +1 θ t k n tt [2]
Based on Equation (2), parameters kt and n can readily be calculated from the
least-square line fit to the double logarithmic plot of ln[-ln(1-θ(t))] versus ln(t), where kt is
taken as the anti-logarithmic value of the y-intercept and n is simply the slope (calculated for
10% to 80% relative crystallinity only).
In the study of non-isothermal crystallization using DSC, the energy released during the
crystallization process appears to be a function of temperature rather than time as in the case
of isothermal crystallization. Therefore, the relative crystallinity as a function of temperature,
θ(T), can be formulated as
θ( )T
dH
dTdT
H
c
T
T
c
o=∫
∆[3]
264 Metallocene Technology

where To and T represent the onset and an arbitrary temperature, respectively, and dHc the
enthalpy of crystallization released during an infinitesimal temperature range dT, and ∆Hc the
overall enthalpy of crystallization for a specific cooling condition.
In an attempt to use Equations (1) and (2) to analyze the non-isothermal crystallization
kinetics data in DSC, we need to assume that the sample experiences the same thermal history
as determined by the DSC furnace. This may be realized only when the thermal lag between
the sample and the furnace is kept minimal. If this assumption is valid, the relation between
crystallization time, t, and temperature, T, is given as
tT To= −
φ[4]
where φ is the cooling rate. According to Equation (4), the horizontal temperature axis ob-
served in a DSC thermogram can readily be transformed into the time scale.
Based on the mathematical derivation of Evans,22 Ozawa23 extended the Avrami theory20
to be able to describe the non-isothermal case. Mathematically, the relative crystallinity can
be written as a function of cooling rate as
1 1− = − = −
∞
χχ
θφ
T T
mT
k( ) exp [5]
where χT is the absolute crystallinity developed at temperature T, χ∞ the ultimate absolute
crystallinity, kT the rate function, and m the Ozawa exponent (which is similar to the Avrami
exponent).
Analysis of the non-isothermal crystallization data can be performed through the use of
the logarithmic form of Equation (5):
ln[ ln( ( ) ] ln ln− − = −1 0θ φT k mT [6]
By plotting ln[-ln(l -θ(T))] versus ln(φ) for a fixed temperature, the parameters kT and m
can be extracted as the anti-logarithmic value of the y-intercept and the negative value of the
slope, respectively.
EXPERIMENTAL
The sPP sample used in this study was supplied in the pellet form by Fina Oil and Chemical
Company in La Porte, Texas. Molecular characterization data, kindly measured by Dr. Roger
Kinetics of Non-Isothermal Crystallization 265

A. Phillips and his coworkers at Montell USA, Inc. in Elkton, Maryland, shows the following
molecular weight information: Mn = 76 200, Mw = 165 000, Mz = 290 000, and Mw/Mn = 2.2.
In addition, the syndiotacticity measured by 13C NMR shows the racemic pentad content,
[%rrrr], to be 77.1%, the racemic triad content, [%rr], to be 87.3%, and the racemic dyad con-
tent, [%r], to be 91.4%.
A film of sPP sample was prepared from sliced pellets melt-pressed at 190oC between a
pair of Kapton films which in turn were sandwiched between a pair of stainless steel platens,
in a Wabash compression molding machine under a pressure of 67 kpsi. After ten minutes
holding time, the film of approximately 280 µm thick was taken out and immediately
quenched in an ice-water bath, while it was still between the two steel platens. This treatment
assumes that previous thermal and mechanical histories formed during the pelletization pro-
cess were essentially erased, and provides a controlled starting condition for our experiments.
A Perkin-Elmer Series 7 Differential Scanning Calorimeter was used to study
non-isothermal crystallization in this manuscript. The DSC7 equipped with internal cooling
unit reliably provided a cooling rate up to 200oC min-1. Temperature calibration was per-
formed using an indium standard (Tm
o = 156.6oC and ∆Hf
o = 28.5 J g-1). The consistency of the
temperature calibration was checked every other run to ensure reliability of the acquired data.
The DSC sample was in the form of disc cut from the film prepared. The sample weight was
kept around 4.9 ± 0.3 mg.
The experiment started with heating the sample from 40oC at a scanning rate of 80oC
min-1 to 190oC where it was held for 5 min before cooling down at a desired constant cooling
rate, φ (in the range of 1oC min-1 to 100oC min-1), to -40oC. The cooling exotherms were re-
corded and analyzed accordingly. It is worth noting that the 5 min holding time at 190oC is
ample to erase the previous crystalline memory.
RESULTS AND DISCUSSION
NON-ISOTHERMAL CRYSTALLIZATION KINETICS BASED ON MODIFIEDAVRAMI EQUATION
The crystallization exotherms of sPP for nonisothermal crystallization from the melt at 6 dif-
ferent cooling rates ranging from 1oC min-1 to 10oC min-1 are presented in Figure 1. It is evi-
dent that, as the cooling rate increases, the temperature at 1% relative crystallinity, T0.0l, the
peak temperature, Tp, and the temperature at 99% relative crystallinity, T0.99, are shifted to
lower temperatures. It should be noted that T0.01 and T0.99 represent the temperatures at which
the crystallization process began and ended, respectively. The values of T0.01, Tp, and T0.99,
along with the corresponding enthalpy of crystallization, ∆Hc, are tabulated in Table 1.
Apparently, the values of T0.01, Tp, and T0.99 decrease as the cooling rate increases. This
leads to the fact that the higher the cooling rate, the later the crystallization begins and ends
266 Metallocene Technology

(based on the temperature domain). In addition, the enthalpy of crystallization also decreases
as the cooling rate increases. This relates directly to the fact that the higher the cooling rate,
the lower the ultimate absolute crystallinity obtained.
The relative crystallinity,θ(T), as a function of crystallization temperature for each cool-
ing rate can be taken from the corresponding exotherm shown in Figure 1 using Equation (3),
and is shown in Figure 2. As mentioned previously, in order for these data to be analyzed us-
ing the Avrami equation,20 the horizontal temperature scale must be transformed into the time
domain using the relationship defined in Equation (4). The plots of relative crystallinity, θ(t),
as a function of time for various cooling rates are shown in Figure 3. It is apparent that the
Kinetics of Non-Isothermal Crystallization 267
Table 1. Values of T0.01, Tp, and T0.99 and ∆Hc for non-isothermal crystallization
exotherms of sPP
Cooling rate,oC min
-1T0.01,
oC Tp,
oC T0.99,
oC ∆Hc, J g
-1
1 94.3 82.1 77.6 39.2
2 88.3 76.0 70.3 37.2
4 82.0 70.9 44.8 36.1
6 78.2 63.7 40.6 33.9
8 76.9 61.1 41.6 33.3
10 77.6 57.1 29.9 32.0
Figure 1. Non-isothermal melt crystallization exotherms of
sPP at 6 different cooling rates (oC min-1):¡ 1,l 2, 4, 6,
∆ 8,p 10.
Figure 2. Relative crystallinity as a function of temperature of
sPP at 6 different cooling rates (oC min-1):¡ 1,l 2, 4, 6, ∆8,p 10.

faster the cooling rate, the shorter the time needed for the completion of the crystallization
process (though the plots for the cooling rates of 8oC min-1 and 10oC min-1 are very similar).
Based on Equation (1), Avrami crystallization kinetics parameters (n and kt) can be ex-
tracted through the double logarithmic plots of ln[-ln(l - θ(t))] versus ln(t), as mentioned
previously. Such plots are shown in Figure 4. The values of n and kt as well as the crystalliza-
tion half-time, t0.5 (taken directly from the data shown in Figure 3), and its reciprocal value,
t0.5
-1 , are listed in Table 2.
The Avrami exponent, n, ranges from 4.5 to 6.1, and decreases in value as the cooling
rate increases. The Avrami exponent observed suggests that the primary stage for
268 Metallocene Technology
Figure 3. Relative crystallinity as a function of time of sPP at 6
different cooling rates (oC min-1):¡ 1, l 2, 4, 6, ∆ 8,p
10.
Figure 4. Typical Avrami analysis of the data shown in Figure 3
at 6 different cooling rates (oC min-1):¡ 1,l 2, 4, 6, ∆ 8,
p 10.
Table 2. Non-isothermal crystallization kinetics of sPP based on modified
Avrami approach
Cooling rate,oC min
-1n kt, min
-nt0.5, min t0.5
-1 , min-1
1 5.25 3.83x10⁻⁷ 15.64 0.06
2 6.08 1.23x10⁻⁶ 8.85 0.11
4 5.60 9.11x10⁻⁵ 4.89 0.20
6 5.00 5.87x10⁻⁴ 4.09 0.24
8 4.80 2.31x10⁻³ 3.26 0.31
10 4.48 3.10x10⁻³ 3.32 0.30
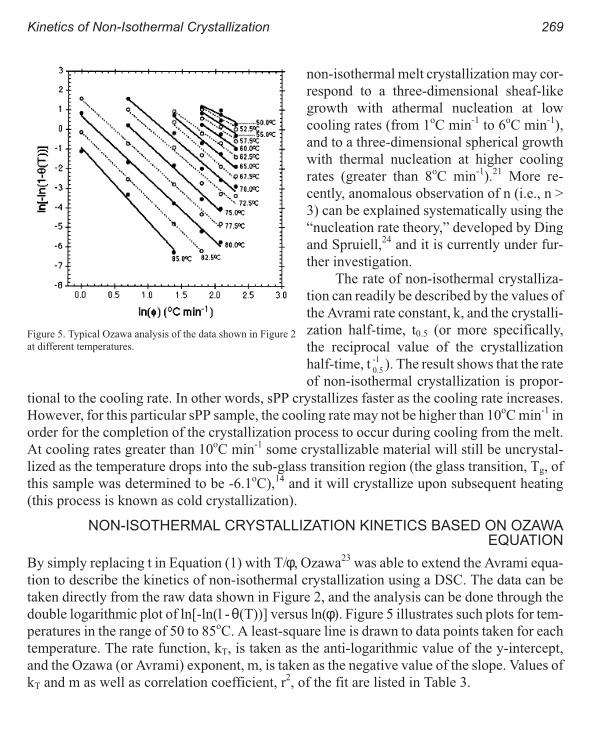
non-isothermal melt crystallization may cor-
respond to a three-dimensional sheaf-like
growth with athermal nucleation at low
cooling rates (from 1oC min-1 to 6oC min-1),
and to a three-dimensional spherical growth
with thermal nucleation at higher cooling
rates (greater than 8oC min-1).21 More re-
cently, anomalous observation of n (i.e., n >
3) can be explained systematically using the
“nucleation rate theory,” developed by Ding
and Spruiell,24 and it is currently under fur-
ther investigation.
The rate of non-isothermal crystalliza-
tion can readily be described by the values of
the Avrami rate constant, k, and the crystalli-
zation half-time, t0.5 (or more specifically,
the reciprocal value of the crystallization
half-time, t0.5
-1 ). The result shows that the rate
of non-isothermal crystallization is propor-
tional to the cooling rate. In other words, sPP crystallizes faster as the cooling rate increases.
However, for this particular sPP sample, the cooling rate may not be higher than 10oC min-1 in
order for the completion of the crystallization process to occur during cooling from the melt.
At cooling rates greater than 10oC min-1 some crystallizable material will still be uncrystal-
lized as the temperature drops into the sub-glass transition region (the glass transition, Tg, of
this sample was determined to be -6.1oC),14 and it will crystallize upon subsequent heating
(this process is known as cold crystallization).
NON-ISOTHERMAL CRYSTALLIZATION KINETICS BASED ON OZAWAEQUATION
By simply replacing t in Equation (1) with T/φ, Ozawa23 was able to extend the Avrami equa-
tion to describe the kinetics of non-isothermal crystallization using a DSC. The data can be
taken directly from the raw data shown in Figure 2, and the analysis can be done through the
double logarithmic plot of ln[-ln(l -θ(T))] versus ln(φ). Figure 5 illustrates such plots for tem-
peratures in the range of 50 to 85oC. A least-square line is drawn to data points taken for each
temperature. The rate function, kT, is taken as the anti-logarithmic value of the y-intercept,
and the Ozawa (or Avrami) exponent, m, is taken as the negative value of the slope. Values of
kT and m as well as correlation coefficient, r2, of the fit are listed in Table 3.
Kinetics of Non-Isothermal Crystallization 269
Figure 5. Typical Ozawa analysis of the data shown in Figure 2
at different temperatures.

Based on the plots shown in Figure 5 and the correlation coefficients, r2, listed in Table 3,
the Ozawa approach23 is found to be a satisfactory description of the non-isothermal crystalli-
zation kinetics of sPP, especially in the temperature range of 57.5 to 85oC where the r2 value is
greater than 0.95. The Ozawa exponent, m, is found to increase with an increase in tempera-
ture, and lies in the range of 2.3 to 3.7 (within the temperature range of 60 to 85oC). The result
is in a good agreement with our earlier results14 on isothermal bulk crystallization kinetics of
sPP which showed that the Avrami exponent, n, ranges from 2.7 to 3.2 (within the same tem-
perature range).
ACTIVATION ENERGY FOR NON-ISOTHERMAL MELT CRYSTALLIZATION BYKISSINGER METHOD
According to the data listed in Table 1, it is obvious that the peak temperature, Tp, is a certain
function of cooling rate. This relationship can be described by an Arrhenius-type equation.
Such a relationship was introduced by Kissinger,25 which can be written in the following
form:
270 Metallocene Technology
Table 3. Non-isothermal crystallization kinetics of sPP based on Ozawa
approach
Temperature,oC m kT, (
oC min
-1)
mr
2
50.0 1.66 6.81x101 0.85
52.5 1.88 8.82x101 0.90
55.0 2.19 1.27x10² 0.92
57.5 2.23 1.03x10² 0.95
60.0 2.33 8.65x101 0.96
62.5 2.48 7.69x101 0.99
65.0 2.82 9.43x101 0.99
67.5 3.00 7.90x101 0.97
70.0 2.94 3.79x101 0.98
72.5 2.93 1.94x101 0.97
75.0 3.18 1.15x101 0.99
77.5 3.13 4.51 1.00
80.0 3.20 2.00 1.00
82.5 3.37 8.47x10⁻¹ 1.00
85.0 3.72 3.75x10⁻¹ 0.99
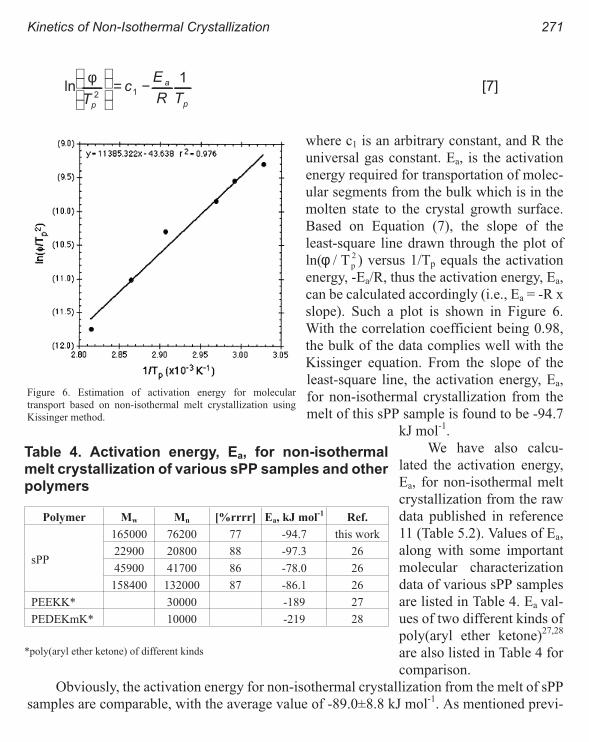
lnφ
Tc
E
R Tp
a
p2 1
1
= − [7]
where c1 is an arbitrary constant, and R the
universal gas constant. Ea, is the activation
energy required for transportation of molec-
ular segments from the bulk which is in the
molten state to the crystal growth surface.
Based on Equation (7), the slope of the
least-square line drawn through the plot of
ln(φ / Tp
2 ) versus 1/Tp equals the activation
energy, -Ea/R, thus the activation energy, Ea,
can be calculated accordingly (i.e., Ea = -R x
slope). Such a plot is shown in Figure 6.
With the correlation coefficient being 0.98,
the bulk of the data complies well with the
Kissinger equation. From the slope of the
least-square line, the activation energy, Ea,
for non-isothermal crystallization from the
melt of this sPP sample is found to be -94.7
kJ mol-1.
We have also calcu-
lated the activation energy,
Ea, for non-isothermal melt
crystallization from the raw
data published in reference
11 (Table 5.2). Values of Ea,
along with some important
molecular characterization
data of various sPP samples
are listed in Table 4. Ea val-
ues of two different kinds of
poly(aryl ether ketone)27,28
are also listed in Table 4 for
comparison.
Obviously, the activation energy for non-isothermal crystallization from the melt of sPP
samples are comparable, with the average value of -89.0±8.8 kJ mol-1. As mentioned previ-
Kinetics of Non-Isothermal Crystallization 271
Figure 6. Estimation of activation energy for molecular
transport based on non-isothermal melt crystallization using
Kissinger method.
Table 4. Activation energy, Ea, for non-isothermal
melt crystallization of various sPP samples and other
polymers
Polymer Mw Mn [%rrrr] Ea, kJ mol-1
Ref.
sPP
165000 76200 77 -94.7 this work
22900 20800 88 -97.3 26
45900 41700 86 -78.0 26
158400 132000 87 -86.1 26
PEEKK* 30000 -189 27
PEDEKmK* 10000 -219 28
*poly(aryl ether ketone) of different kinds

ously, the activation energy, Ea, relates to the ability of the molecule to extricate itself from the
melt onto the crystal growth surface. In fact, this ability is controlled by a number of factors,
one of which is molecular stiffness. This effect can be illustrated with the fact that the Ea val-
ues of poly(aryl ether ketone)s are much higher in magnitude than those of sPP samples.
The activation energy for molecular transport, Ed, is often calculated from the combina-
tion of the Arrhenius-type and WLF equations.29 Eckstein et al.30 reported the Ed value of a
sPP sample (Mw = 137 600, Mn = 62 800, Mw/Mn = 2.2, and [%rrrr] = 79.6%) to be 73.7 kJ
mol-1. Evidently, the values of Ea and Ed calculated for sPP are comparable and related. The
discrepancy between the values obtained from these two different methods may be a result of
the uncertainty in the peak temperature measured from a DSC non-isothermal crystallization
exotherm. Thermal lag is likely the most probable cause for the unreliability in the peak tem-
perature value obtained, hence the Ea value calculated.
CONCLUSIONS
The non-isothermal melt crystallization exotherms showed that as the cooling rate increases
the temperature at 1% relative crystallinity, the peak temperature, and the temperature at 99%
relative crystallinity moves towards the lower temperature range. The crystallization
half-time is found to decrease in value as the cooling rate increases. This suggested that crys-
tallization is completed in a shorter time period as the cooling rate increases. Analysis of the
time dependent relative crystallinity revealed that the Avrami exponent lies in the range of 4.5
to 6.1. Whereas, analysis of the temperature dependent relative crystallinity suggested that
the Ozawa exponent ranges from 1.7 to 3.7 (within the temperature range of 50 to 85oC).
Using the Kissinger method, the activation energy for non-isothermal melt crystalliza-
tion was determined to be -94.7 kJ mol-1. This value was found to be in a good agreement with
the values calculated from the nonisothermal crystallization data of other sPP samples avail-
able in the literature. Comparison of the value with the activation energy for molecular
transport determined from the WLF equation suggested that these two parameters may be re-
lated.
REFERENCES
1 G. Natta, I. Pasquon, P. Corradini, M. Peraldo, M. Pegoraro, and A. Zambelli, Rend. Acd. Naz. Lincei., 28, 539 (1960).
2 G. Natta, I. Pasquon, and A. Zambelli, Ibid., 84, 1488 (1962).
3 J. A. Ewen, R. L. Johns, A. Razavi, and J. D. Ferrara, J. Am. Chem. Soc., 110, 6255 (1988).
4 J. Schardl, L. Sun, S. Kimura, and R. Sugimoto, Society of Plastics Engineers, Annual Technical Conference (ANTEC)
Proceedings, 3414 (1995).
5 J. Schardl, L. Sun, S. Kimura, and R. Sugimoto, J. Plastic Film & Sheeting, 12, 157 (1996).
6 L. Sun, E. Shamshoum, and G. DeKunder, Society of Plastics Engineers’ Annual Technical Conference (ANTEC)
Proceedings, 1965 (1996).
7 M. Gownder, Society of Plastics Engineers’ Annual Technical Conference (ANTEC) Proceedings, 1511 (1998).
272 Metallocene Technology

8 W.R. Wheat, Society of Plastics Engineers’ Annual Technical Conference (ANTEC) Proceedings, 2275 (1995); 565
(1997).
9 K. Yoshino, X.H. Yin, R. Sugimoto, N. Uchikawa, M. Kawata, T. Murakami, and H. Kato, Institute of Electrical Engineers
of Japan’s 1995 Int’l Symp. on Electrical Insulating Materials Proceedings, 355 (1995).
10 J. Rodriguez-Arnold, Z. Bu, and S. Z. D. Cheng, J. M. S.-Rev. Macromol. Chem. Phys., C35(1), 117 (1995).
11 J. Rodriguez-Arnold, in Ph.D. Dissertation, University of Akron, 1994.
12 J. Rodriguez-Arnold, A. Zhang, S. Z. D. Cheng, A. J. Lovinger, E. T. Hsieh, P. Chu, T. W. Johnson, K. G. Honnell,
R. G. Geerts, S. J. Palackal, G. R. Hawley, and M. B. Welch, Polymer, 35(9), 1884 (1994).
13 P. Supaphol, J. J. Hwu, P. J. Phillips, and J. E. Spruiell, Society of Plastics Engineers’ Annual Technical Conference
(ANTEC) Proceedings, 1759 (1997).
14 P. Supaphol and J. E. Spruiell, submitted to J. Polym. Sci., Polym. Phys.
15 R. L. Miller and E. G. Seeley, J. Polym. Sci., Polym. Phys., 20, 2297 (1982).
16 J. Rodriguez-Arnold, Z. Bu, S. Z. D. Cheng, E. T. Hsieh, T. W. Johnson, R. G. Geerts, S. J. Palackal, G. R. Hawley, and
M. B. Welch, Polymer, 35(24), 5194 (1994).
17 P. Supaphol and J. E. Spruiell, submitted to Polymer.
18 J. Sclunidtke, G. Strobl, and T. Thurn-Albrecht, Macromolecules, 30, 5804 (1997).
19 G. Strobl, Acta Polymer., 48, 562 (1997).
20 M. Avrami, J. Chem. Phys., 7, 1103 (1939); 8, 212 (1940); 9, 177 (1941).
21 B. Wunderlich, in Macromolecular Physics, Vol. 2, Academic Press, New York, 1976, page 147.
22 U. R. Evans, Trans. Faraday Soc., 41, 365 (1945).
23 T. Ozawa, Polymer, 12, 150 (1971).
24 Z. Ding and J. E. Spruiell, J. Polym. Sci., Polym. Phys., 35, 1077 (1997).
25 H. E. Kissinger, J. Res. Nat’l. Bur. Stand., 57, 217 (1956).
26 Calculated from the non-isothermal crystallization data listed in Table 5.2 of the reference 11.
27 T. Liu, Z. Mo, S. Wang, and H. Zhang, Polym. Eng. Sci., 37(3), 568 (1997).
28 T. Liu, Z. Mo, and H. Zhang, J. Appl. Polym. Sci., 67, 815 (1998).
29 D.W. Van Krevelen, in Properties of Polymers, Vol. 3, Elsevier, Amsterdam, 1990, pages 595-598.
30 A. Eckstein, C. Friedrich, A. Lobbrecht, R. Spitz, and R. Muelhaupt, Acta Polymer., 48, 41 (1997).
Kinetics of Non-Isothermal Crystallization 273

High Temperature Flexible Polyolefins a User’s
Perspective
Atul Khare, Samuel Y Ding, Michael T. K. Ling, and L. Woo
Baxter Healthcare, Round Lake, IL 60073
INTRODUCTION
MEDICAL MATERIAL REQUIREMENTS
Before we proceed, it would be rational to examine some of the special requirements specific
to the medical device and packaging industries, that set our needs apart from other markets.
Medical industry always attaches a premium to material’s optical clarity. A material’s ability
to allow light transmission un-impeded is not just a desire to be “clean”, but rather rooted in
good clinical practice. For example, in many primary packaging, prior to administration of
the medical fluid to the patient, the nurse is required to inspect visually for particulate matter
(PM) contamination. This inspection is required to protect patients against the danger of ex-
posure to the visible contaminants. In situations where medications in the powder form need
to be mixed or compounded prior to administration, the ability to visually inspect for the com-
pletion of dissolution is another important safeguard for patient’s safety. Recently, transfu-
sion therapies involving harvested, stored, and cultured cellular components became
widespread. During the in-vitro phase, these cellular components frequently need to be ma-
nipulated through separation, fractionation, and incubation for diagnostic or therapeutic pur-
poses. In many of the steps, the ability to inspect contents visually or microscopically is
crucial to the clinical protocol. These are just a few reasons optical clarity is a prerequisite cri-
terion for material selection.
Another attribute specific to the medical industry is the need to deliver therapies in a
sterile manner. As a consequence, compatibility with common sterilization methods is a
must. These methods include: steam autoclaving, ethylene oxide and ionizing radiation (ei-
ther gamma or electron beam). Ethylene oxide is currently being phased out due to worker
exposure and environmental concerns, while long term shelf life stability is an issue for the
material post radiation sterilization. Steam autoclaving has a long history in sterilization dat-

ing back to the canning preservation of food in the 19th century. Steam is benign, non-toxic,
and effective, although it creates a serious challenge on the material properties with the high
temperature (121oC) and pressure.
A third requirement that has received increasing attention is the environmental compati-
bility. As professionals concerned with healthcare, we obviously cannot, in the course of
mending our patients, destroy the environment that we live in and our children will inherit. Of
course, the quantitative “environmental score” is quite elusive and often subjected to passion-
ate debate. However, some of the basic tenets are very obvious; progressive companies have
already adopted many of the practices in this direction.
THERMOPLASTIC ELASTOMER PROPERTIES
In order to achieve thermoplastic elastomer (TPE) property, there must be thermally revers-
ible physical crosslinks on the polymer chain. For the familiar styrene diene block copoly-
mers of the ABA type, when the outer blocks are the glassy styrene domains, phase separation
from incompatibility forces the styrene blocks to aggregate into domains that trap the
elastomeric diene segments between them. At elevated temperatures above the styrene glass
transition (Tg), the overall structure becomes deformable and shapeable, giving rise to the
thermoplastic property. Therefore, a necessary condition for the thermoplasticity is the exis-
tence of phase separated blocky sequences on the main chain where soft, elastomeric blocks
are flanked by aggregating hard chain segments. At elevated processing temperatures, these
crosslinks are melted or softened sufficiently to allow plastic shaping, and reforms upon cool-
ing to give the elastic property. Hence, thermally reversible formation of physical crosslinks
of the hard segments are the basis for the TPE behavior.
RESULTS AND DISCUSSION
PVC PROPERTIES
Since the 1950’s, PVC has achieved and maintained a prominent position in the medical
packaging and devices industry due mainly to its high performance/cost ratio. Some of the ad-
vantages commonly cited include low cost, infinite latitude in formulation that covered
modulus ranging from greater than 1 GPa to less than 10 MPa, excellent optical clarity
throughout this composition range, with measured haze values less than 5%. In addition, in
the flexible formulations, good to excellent elastomer properties in many instances rivaling
that of the natural rubber are obtained. These properties make flexible PVC one of the earliest
known (but not generally recognized) thermoplastic elastomer (TPE). PVC achieves many of
its remarkable properties by the possession of a small by distinct amount of crystallinity. The
crystalline domains are substantially melted during processing, which allows for thermoplas-
tic deformation and flow, but reforms upon cooling.
276 Metallocene Technology

It is well known in the PVC industry that the plasticizer selected does not fully dissolve
the crystals, upon which all properties are lost. The crystalline domains act as tie points be-
tween elastomeric plasticizer swollen amorphous main chains to confer the elastomeric
properties at room temperature. Since these crystalline domains have melting temperatures
upwards of 230oC, they are critical in maintaining the shape, preventing bulk flow at elevated
temperatures like autoclaving. On the subject of autoclavability, one is reminded for PVC,
typically only flexible, or high plasticizer formulations are autoclavable, for more rigid for-
mulations, due to the relatively low glass transition of lower than 90oC, severe distortions due
to molded in stresses are seen. Due to this "anomaly", the heat distortion property for PVC has
a complex relationship with plasticizer content. Today, we see PVC being used in applica-
tions ranging from food packaging films to primary medical solution containers, to delivery
tubing and catheters, to rigid housings for devices, truly an ubiquitous presence in the food
and medical industry.
METALLOCENE POLYETHYLENES
Recently, metallocene catalyzed polyolefins have become commercially available. In
strong contrast with the traditional Ziegler-Natta catalyst, the metallocene catalyst is the re-
sult of cyclic organo ligands coordinating on a group IIb transition element usually
zirconium. The active catalytic center can be isolated and studied in detail, and more impor-
tantly, for the first time in history, the catalyst and the coordination ligand structure were
found to control the polymerization activity and selectivity. This fundamental discovery is the
basis of the tremendous success and the huge commercial scramble we are witnessing. From
our own studies and data available from the literature, we can say the following:
• The catalyst produces extremely high yield.
• Broad monomer class can be polymerized.
• Homogeneous activity toward comonomers.
• Exquisite structural controls are possible.
• Novel polymers are emerging.
With the medical industry's concern for material cleanliness and patient safety, the ex-
tremely high yield is a welcoming attribute indeed. For polyethylene, yields as high as 40
million grams of polymer per gram of zirconium have been reported. This translates to about
25 parts per billion (ppb) of transition metal contamination in the final product if the entire
amount of catalyst were left in the product. If, as expected, these catalyst yields are main-
tained in full-scale productions, metallocene based polyolefins will represent some of the
cleanest polymers available to the medical industry.
When co-monomers are introduced to adjust the density or crystallinity of polyethylene,
unlike with Ziegler-Natta catalysts, a single reaction site with uniform reactivity toward both
co-monomers is present during the entire polymerization process. As a result, a very homoge-
High Temperature Flexible Polyolefins 277

neous placement of short branches across the entire molecular weight distribution is evident.
Instead of multiple melting points (or, broad melting ranges) representing various
crystallinity fractions, a single melting point proportional to the co-monomer content is cre-
ated. The significantly lower melting point leads to easier fabrications in heat seal initiation
temperatures.
One of the major benefits to the medical industry from the homogeneous structure is the
drastic reduction in light scattering from larger crystallites (the higher melting fraction). Su-
perbly clear films can be fabricated without resorting to special processing techniques or
additives.
Unfortunately, the homogeneous incorporation of monomers, which led to superb clarity
and flexibility, also reduces the melting point in a monotonic fashion, with reduced high tem-
perature properties.
HIGH TEMPERATURE TPE AND ALLOYS
It is well known, that through polymer alloys, prop-
erties not present in the parent polymers can be ob-
tained. For example, high melting point
polypropylenes can be blended with flexible, high
content ethylene vinyl acetate copolymers (EVA),
to get moderately flexible, marginally autoclavable
compounds. However, since the constituent compo-
nents are not thermo-dynamically miscible, the
overall performance was not deemed acceptable for
broad usage. In a similar way, propylene and styrene
based block copolymers, especially the hydroge-
nated mid-block polymers (SEBS), or styrene-(eth-
ylene butene)-styrene has been used in certain
autoclavable applications (Figure 1). Although the
stress whitening tendencies were much reduced, the
high cost of the SEBS block copolymer again hampered wide acceptance.
When polybutelene terephthalate (PBT) hard segments are co-polymerized with soft
segments of polytetramethylene ether (PTMO), a multiblock thermoplastic elastomer is pro-
duced. By adjusting the ratio of PTMO in the hard segment, melting points ranging from
about 150 to about 220oC can be obtained. These high performance TPE’s are very tough, oil
resistant, and due to their high melting points, autoclavable. Unfortunately, they tend to be
opaque; thus rendering them somewhat unsuited for packaging applications.
Another class of thermoplastic polyester elastomers are based on the same PTMO soft
segments, but with a hydrogenated aromatic diol (cyclohexyl dimethanol) as the hard PBT
278 Metallocene Technology
Figure 1. SEBS/PP alloy modulus vs T.

segment modifier resulted in a very minute crystallinity with a melting point of about 190oC.
The material is flexible, very tough, optically transparent, and passed medical extractable
testing. However, the apparent high cost has limited its use to niche autoclaving applications.
PROPYLENE BASED ELASTOMERS:
In the rubber and elastomer industry, propylene based products are well known. Both ethyl-
ene propylene rubber (EPR) and terpolymers with a crosslinkable diene monomer like
1,4-hexadiene or ethylene norbornene (EPDM) possess good high temperature elastomeric
properties when crosslinked. However, the need for crosslinking and the lack of optical clar-
ity has limited the application for medical uses.
However, propylene based elastomers with a high crystalline melting point of about
160oC could be very attractive as candidates of thermoplastic elastomers. This is the case if
blocky sequences of isotactic and atactic conformations can be produced on the same poly-
mer chain. Indeed, historically, several examples have been offered.
Early in the pioneering studies by Ziegler and Natta on coordination catalysis of olefins,
it was discovered certain classes of titanocene compounds exhibited only moderate stereo
regulation on the placement of methyl side group during the polymerization of propylene.
The resultant polymer exhibited, not surprisingly, the elastomeric properties. However, since
at the time, high isotactic yield was the aim, combined with relatively low polymer yield, this
significant discovery was soon forgotten.
Later, in more systematic studies of stereo regularity control, J. Chien and co-workers at
the University of Massachusetts discovered a family of higher productivity elastomeric PP
catalysts. Still, lack of commercial interest hampered
the full-scale development. Similarly, work at the E.
I. Dupont company led to the discovery of moderate
productivity catalyst, elastomeric products (Figure 2)
with interesting properties. Furthermore, these
Dupont researchers conducted extensive studies on
the melt blending of the elastomeric PP and commer-
cial high isotactic content PP. Since in the molten
state, both types of polymer should be miscible with
each other, a single phase is expected. Upon cooling,
some of the crystallizable segments from the
elastomeric PP could co-crystallize with the isotactic
PP, thus forming the physical crosslink sites required for TPE behavior. In this way, very dif-
ferent mechanical properties can be achieved simply by varying the ratio of the elastomeric
and isotactic PP fractions. Although research along this catalyst family continued, to-date, no
commercial production of this very novel invention has been available.
High Temperature Flexible Polyolefins 279
Figure 2. Dupont elastomeric PP catalyst.
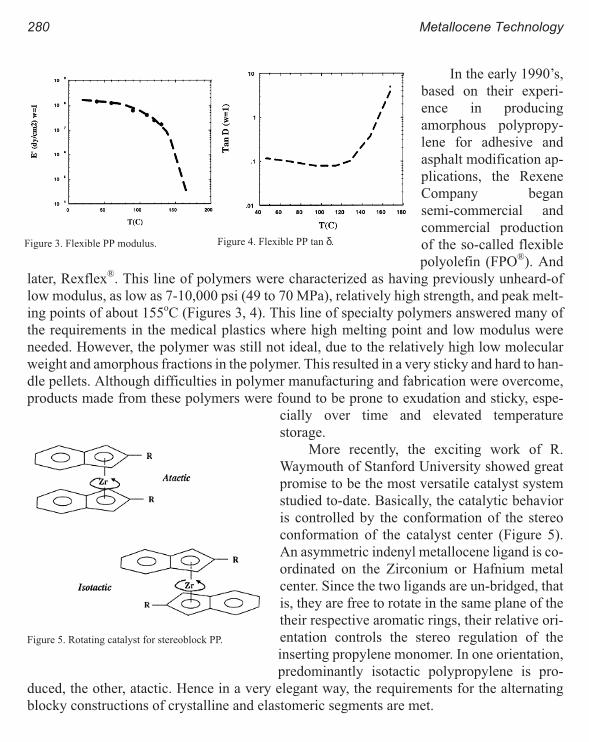
In the early 1990’s,
based on their experi-
ence in producing
amorphous polypropy-
lene for adhesive and
asphalt modification ap-
plications, the Rexene
Company began
semi-commercial and
commercial production
of the so-called flexible
polyolefin (FPO®). And
later, Rexflex®. This line of polymers were characterized as having previously unheard-of
low modulus, as low as 7-10,000 psi (49 to 70 MPa), relatively high strength, and peak melt-
ing points of about 155oC (Figures 3, 4). This line of specialty polymers answered many of
the requirements in the medical plastics where high melting point and low modulus were
needed. However, the polymer was still not ideal, due to the relatively high low molecular
weight and amorphous fractions in the polymer. This resulted in a very sticky and hard to han-
dle pellets. Although difficulties in polymer manufacturing and fabrication were overcome,
products made from these polymers were found to be prone to exudation and sticky, espe-
cially over time and elevated temperature
storage.
More recently, the exciting work of R.
Waymouth of Stanford University showed great
promise to be the most versatile catalyst system
studied to-date. Basically, the catalytic behavior
is controlled by the conformation of the stereo
conformation of the catalyst center (Figure 5).
An asymmetric indenyl metallocene ligand is co-
ordinated on the Zirconium or Hafnium metal
center. Since the two ligands are un-bridged, that
is, they are free to rotate in the same plane of the
their respective aromatic rings, their relative ori-
entation controls the stereo regulation of the
inserting propylene monomer. In one orientation,
predominantly isotactic polypropylene is pro-
duced, the other, atactic. Hence in a very elegant way, the requirements for the alternating
blocky constructions of crystalline and elastomeric segments are met.
280 Metallocene Technology
Figure 3. Flexible PP modulus. Figure 4. Flexible PP tan δ.
Figure 5. Rotating catalyst for stereoblock PP.

SUMMARY
Various ways to achieve optically clear thermoplastic elastomeric behavior and high tempera-
ture properties were examined. The flexible plasticized PVC was used as a standard of com-
parison. To attain the attributes such as optical clarity, easy processibility, high temperature
stability as well as cost for medical devices, the metallocene catalyzed thermoplastic
elastomeric polypropylenes hold a great promise and bright future.
REFERENCES
1 G. H. Llinas, S. H. Dong, D. T. Mallin, M. D. Rausch, Y. G. Lin, H. H. Winter, and J. C. W. Chien,
“Crystalline- Amorphous, Block Polypropylene and Non-symmetric Metallocene-Catalyzed Polymerization”
Macromolecules, 25, 1242-125 3, (1992).
2 C. K. Shih, A. C. Su, Poly-(α-olefin Based Thermoplastic Elastomers, 91-116, Thermoplastic Elastomers, N. R. Legge,
G. Holden, H. E. Schroede eds. Hanser, New York, (1987).
3 M. Gahleitner, H. Ledwinka, N. Hafner, W. Neissl, Supersoft PP-New Properties from a Novel Molecular Structure.
283-290, Proceeding of SPO’96, Houston, (1996).
4 B. J. Pellon, Novel, High Melting Point Flexible Polyolefin Products, 401-420, Proceedings of SPO’95, Houston, (1995).
High Temperature Flexible Polyolefins 281

An Outlook for Metallocene and Single Site Catalyst
Technology into the 21st
Century
Kurt W. Swogger
Global R&D Director, Polyethylene & INSITE Technology R&D, Dow Plastics, B-1607
Building, Freeport, Texas
INTRODUCTION
Single site catalysts have come to be very commercially significant with the latest two cata-
lyst families-metallocenes and con-
strained geometry catalysts. In 1991,
Exxon announced its metallocene chem-
istry called Exxpol, followed by Dow in
1992 with the constrained geometry fam-
ily. Both of these catalysts (see Figure 1)
have a single site polymerization center
and are able to incorporate a variety of al-
pha-olefin comonomers at high incorpo-
ration level.1-4
Much has been written about the im-
pact of these catalysts on the
polyethylene and polypropylene indus-
tries. There are many of the major players
such as Dow, Exxon, Fina, Hoechst,
Mobil, Mitsui, Idemitsu, and Millennium
involved in the technology race to establish competitive advantage in these fields. Less has
been written about these materials in other markets such as elastomers, adhesives, and engi-
neering thermoplastic; even though in these markets, the impact of this new chemistry may be
more significant than in the more well known markets. This discussion will offer an outlook
for the materials made by these catalysts in several of these markets.
Figure 1. Single-site catalysts.

DISCUSSION
Since 1991, over two billion pounds of capacity has been installed by several companies in
gas phase, slurry phase, solution phase and high pressure processes using supported and un-
supported single site catalysts. Products being developed are plastomers, polyethylene,
polypropylenes, elastomers, ethylene-styrene polymers, cyclic olefins and others. Alliances
and partnerships have been formed or will be formed, such as Dupont-Dow Elastomers,
Univation and the Dow-BP joint development, to name a few. More of these partnerships will
come as the industry tries to maximize the return from these inventions by leveraging other
companies and their strengths.
Why does our industry have this tremendous investment and activity? These new cata-
lysts have high activity and incorporation rates, plus being single sited.
Figure 2 shows a schematic with the implications of these two facets of these catalysts.
Polymers from these catalysts have narrow composition distribution which lend themselves
284 Metallocene Technology
Figure 2. Use of single site catalyst for molecular architecture.
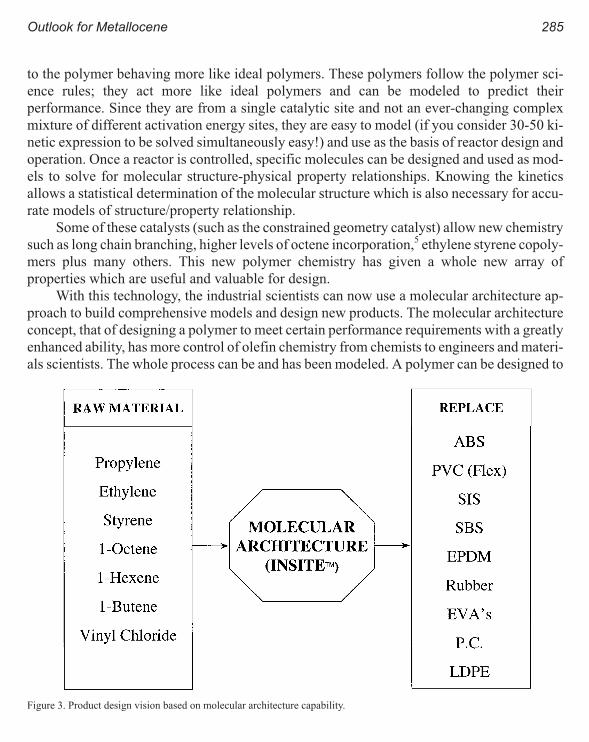
to the polymer behaving more like ideal polymers. These polymers follow the polymer sci-
ence rules; they act more like ideal polymers and can be modeled to predict their
performance. Since they are from a single catalytic site and not an ever-changing complex
mixture of different activation energy sites, they are easy to model (if you consider 30-50 ki-
netic expression to be solved simultaneously easy!) and use as the basis of reactor design and
operation. Once a reactor is controlled, specific molecules can be designed and used as mod-
els to solve for molecular structure-physical property relationships. Knowing the kinetics
allows a statistical determination of the molecular structure which is also necessary for accu-
rate models of structure/property relationship.
Some of these catalysts (such as the constrained geometry catalyst) allow new chemistry
such as long chain branching, higher levels of octene incorporation,5 ethylene styrene copoly-
mers plus many others. This new polymer chemistry has given a whole new array of
properties which are useful and valuable for design.
With this technology, the industrial scientists can now use a molecular architecture ap-
proach to build comprehensive models and design new products. The molecular architecture
concept, that of designing a polymer to meet certain performance requirements with a greatly
enhanced ability, has more control of olefin chemistry from chemists to engineers and materi-
als scientists. The whole process can be and has been modeled. A polymer can be designed to
Outlook for Metallocene 285
Figure 3. Product design vision based on molecular architecture capability.

meet customer performance requirements based on its materials science and then using pro-
cess models-the plant conditions can be set to make that polymer.
Implications of this new chemistry include the new control of molecular structure and
this modelability help extend olefin chemistry into new markets, help bring new designs of
olefin molecules into existing markets quickly and greatly enhance the product development
cycle.
As can be seen in Figure 3, a vision for this new capability can be shown simply by this
model. The lowest cost monomers such as ethylene, propylene, styrene etc. are used as build-
ing blocks using low cost polyolefin processes to build polymers that can replace the
performance of higher cost polymers such as ABS, SEBS, flexible PVC, high pressure
polyethylenes and so on. This does not mean all of the applications of these higher value poly-
mers-just some of them. That “some” will mean much more value for the practitioners of the
new chemistry and some capacity issues for the incumbents.
This vision does not ignore improved polyethylenes and polypropylenes-these will be
developed but will have less relative value than other markets.
A traditional development process for polyolefin took many months to years to com-
plete. See Figure 4 for an illustration. As mentioned previously, the single site catalyst
technology allow the industrial scientists to design new products using molecular architecture
286 Metallocene Technology
Figure 4. Development process.

approach. This greatly enhances the development process and shortens the time to develop
and deliver a designed product to the customers. Figure 4 illustrates the traditional develop-
ment process as well as the philosophy for the new development process using molecular
architecture approaches. A polymer was developed based on a catalyst in a process; then ap-
plications were developed based on the polymer properties. Refining the polymer to meet the
needs of the applications took much iteration and time. With the advent of the new chemistry
allowing molecular architecture, a new approach is possible. Performance requirements are
used to start the process-these being defining material and processing properties required to
make the product be successful in the application. These properties are used to define a poly-
mer structure using structure property relationships as mentioned earlier. The process
conditions are established to make the polymer using reactor models. All of these models are
on a computer which means the whole process takes only minutes. These models can quickly
give the desired polymer or tell if it is not possible.6-7
This approach implies a tremendous market and customer focus. Technology is matched
to a market need with specific requirements needing total definition. The high cost of technol-
ogy questions by marketing has been dramatically cut-putting the focus on marketing to pick
applications and customers, put together a value proposition, seeking from technology a veri-
fication or not of the feasibility of the hypothesis and doing all of this inexpensively.
Remember, you can only model what you know. Establishing the structure-property
models is a major task. Once a relationship is established, it is part of the model; but, new ap-
plications often require an understanding of structures on a property not yet modeled. Over
time, most desired properties will be modeled.
To summarize, my vision is that these low cost monomers can be polymerized in a low
cost process to replace higher value polymers. The product development cycle will be greatly
enhanced using computer models and an accelerated new product development process.
The benefits to our industry are several, including lower system costs for our customers,
enhanced recyclability, lower costs and lower density. Lower system costs can come from
lower density, lower material costs, improved physical properties and better conversion costs.
By using some of the new materials, all olefin structures such as automobile applications, can
be recycled much more readily. The lower density and downgaugeability of these materials
generally allow less use of polymer per application, cutting costs as well as reducing material
to the landfill.
Some examples of these new materials and their benefits are illustrative of the potential
impact. Figure 5 illustrates the range of crystal morphology for ethylene/octene copolymers
made possible by constrained geometry catalyst.8 It clearly shows fringed micelle crystals are
formed in high octene polyolefin elastomers and lamellar crystal for the main structure of
lower octene polyethylenes. The properties of these polymers with different crystal morphol-
ogy are drastically different. Even they are all made of ethylene and octene. Figure 6 shows
Outlook for Metallocene 287

the range of physical properties from just two monomers that is possible using these new cata-
lysts. Elastomers with high levels of octene can be used as impact modifiers. New improved
performance polyethylenes can be developed using copolymers with lower levels of octene.
Impact modification of polypropylene by these materials gives an improved range of
properties as shown in Figure 7. With this improved range of properties, TPOs can be used
even more broadly in applications such as automotive.9
By using the molecular architecture approach, new polyethylenes can be designed that
will allow more product down-gauging. Figure 8 shows some comparisons of physical prop-
erties comparing the new polymers to more established polymers.10 Customers will take
advantage of the properties to down-gauge.
288 Metallocene Technology
Figure 5. Range of crystal morphology for ethylne/octene copolymers made by INSITETM technology catalyst.
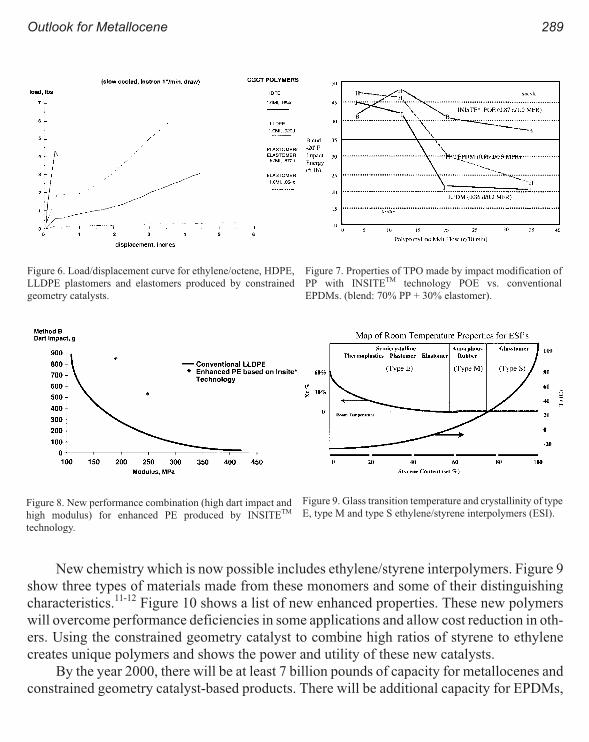
New chemistry which is now possible includes ethylene/styrene interpolymers. Figure 9
show three types of materials made from these monomers and some of their distinguishing
characteristics.11-12 Figure 10 shows a list of new enhanced properties. These new polymers
will overcome performance deficiencies in some applications and allow cost reduction in oth-
ers. Using the constrained geometry catalyst to combine high ratios of styrene to ethylene
creates unique polymers and shows the power and utility of these new catalysts.
By the year 2000, there will be at least 7 billion pounds of capacity for metallocenes and
constrained geometry catalyst-based products. There will be additional capacity for EPDMs,
Outlook for Metallocene 289
Figure 6. Load/displacement curve for ethylene/octene, HDPE,
LLDPE plastomers and elastomers produced by constrained
geometry catalysts.
Figure 7. Properties of TPO made by impact modification of
PP with INSITETM technology POE vs. conventional
EPDMs. (blend: 70% PP + 30% elastomer).
Figure 8. New performance combination (high dart impact and
high modulus) for enhanced PE produced by INSITETM
technology.
Figure 9. Glass transition temperature and crystallinity of type
E, type M and type S ethylene/styrene interpolymers (ESI).

E/O elastomers, plastomers,
new polyethylene and
polypropylenes, cycle olefins,
and ethylene/styrene
interpolymers.
There will be single site ca-
pacity in gas, solution, slurry
and high pressure units around
the world. These materials will
be high performance, easy to
model, and have lower cost.
They will be making inroads
into major non-olefin markets
such as automobiles, rubbers, and elastomers.
While there are currently two leaders in the industry, many others will be able to partici-
pate in various segments of the market. The race will be very quick to establish franchises and
will continue to pressure each party to keep on track. Leadership, money, survival are all parts
of this desire to push these programs.
What will slow the race? Intellectual property disputes will be targeted for quite a while.
Which companies are serious and not serious about these positions? Can we get enough
highly skilled people to do the necessary development? These are critical issues that, depend-
ing on how a company responds, will determine success or failure.
The metallocene and constrained geometry catalyst systems produce polymers that have
valuable properties. There is no longer any doubt. They will have a profound impact on the in-
dustry not only in materials, but who will be the technology leaders and even what the
structure of the industry will be. This technology change truly will transform the plastics
world.
REFERENCES
1 K. W. Swogger, “The Material Properties of Polymers Made from Constrained Geometry Catalyst”, Proceedings of the
Second Int’l Business Forum on Special Polyolefin, SPO ‘92, pp. 115 (1992).
2 B. A. Story and G. W. Knight, “The New Family of Polyolefins from INSITE Technology”, Proceedings of Metcon ‘93,
pp. 112 (1993).
3 C. S. Speed, B. C. Trudell, A.K. Mehta, F.C. Stehling, “Structure/Property Relationships in ExxpolTM Polymer”,
Proceeding of Polyolefins VII International Conference, pp. 45 (1991).
4 S. P. Chum, C. 1. Kao and G. W. Knight, “Structure and Properties of Polyolefin Plastomers and Elastomers Produced from
the Single Site, Constrained Geometry Catalyst”, Proceeding of Polyolefins IX International Conference, pp. 471 (1995).
5 G. W. Knight and S. Lai, “Dow Constrained Geometry Catalyst Technology: New Rules for Ethylene/Alpha-Olefin
Interpolymers-Unique structure and Property Relationships”, Proceedings of Regional Polyolefin Technology
Conference, SPE 10 RETEC ‘93 (1993).
290 Metallocene Technology
Figure 10. Top ten ESI attributes.

6 K. W. Swogger, “Expanding Polymer Structure Control and Design Capabilities Through INSITE* Technology”,
Proceedings of SPO ‘94 (1994).
7 S. P. Chum and J. Ruiz, “Using Polymer Structure/Property Model for Molecular Architecture Product Design”,
Proceedings of 1997 Aspenworld Technology Conference (1997).
8 S. Bensason, J. Minick, A. Moet, S. Chum, A. Hiltner and E. Baer, “Classification of Homogeneous Ethylene-Octene
Copolymers Based on Comonomer Content”, J. Polym. Sci., Part B: Polym. Phys., 34, 1301-1315 (1996).
9 H. C. Silvis, R. C. Cieslinski, D. J. Murray and S. P. Chum, “The Use of New Polyolefin Elastomers for Impact
Modification of Polypropylene”, SAE Technical Paper Series #950559 (1995).
10 K. W. Swogger and S. P. Chum, “Enhanced Polyethylene Using INSITE* Process Technology”, Proceedings of Global
Metallocene Technology Conference Metcon ‘96 (1996).
11 K. W. Swogger and S. P. Chum, “Material Properties of Ethylene Styrene Interpolymers”, Proceeding of Metallocene
Technology Conference Metcon ‘97 (1997).
12 Y. W. Cheung, M. J. Guest, “Structure, Thermal Transitions and Mechanical Properties of Ethylene/Styrene Copolymers”,
Proceeding of Antec ‘96 (1996).
Outlook for Metallocene 291

World Olefins Markets: Issues Influencing
Availability and Pricing
Robin G. Harvan
Bonner & Moore Associates, Inc.
BACKGROUND
Plastics is a generic term used to describe large hydrocarbon-based molecules that, when
heated, soften enough that they can be shaped. The word polymer is often used interchange-
ably with plastics, though its technical definition encompasses other categories of products.
What is important is not the definition of polymer or plastic, but rather the knowledge that
polymers consist of smaller molecular building blocks called monomers. Put simply, there-
fore, a polymer is made up of monomers.
Monomers are composed of carbon and hydrogen, and fall into two basic groupings
which relate to the manner in which the carbon and hydrogen atoms are arranged. Aromatic
monomers are circular in arrangement, while olefin monomers are linear. We mention all this
simply because we will be addressing only olefin monomers in this discussion.
There are three basic olefins: ethylene, from which polyethylene is made; propylene,
from which polypropylene is made; and butadiene, from which an array of plastics materials
such as acrylonitrile-butadiene-styrene (ABS) resin and synthetic rubbers are made.
Olefins are made by breaking long-chained hydrocarbon molecules into smaller lengths
by the application of heat and pressure in the presence of a catalyst. There are several pro-
cesses for doing this, all of which carry the generic name cracking. It is from this generic term
that we derive the name steam cracker for the production unit in which olefins are manufac-
tured.
While the materials being cracked, the so-called “cracker feedstocks,” are several with
variations that are both regional and situation in aspect the products and byproducts of the
olefins process are more or less identical around the world. This similarity also tends to result
in manufacturing costs and prices being relatively comparable, once region-/site- specific

factors such as transportation and
scale-economies are standardized. All this
only further supports the statement that the
olefins business is a truly worldwide one.
ANALYSIS AND FORECAST
As may already be apparent, we contend that
a clear link exists between changes in olefins
production operating rates, and prices for
those olefins. This linkage is such that
olefins prices will tend to follow movement
in utilization. The validation of this premise
is shown in Figure 1, which presents data on
average annual pricing and average annual
operating rates for the U.S. ethylene market for the period 1985 to 1995. The nature of the
olefins business is such those ethylene market conditions tend to provide directionality to all
olefins activity. The reason for this is quite simple: most propylene and butadiene are derived
as byproducts of ethylene manufacture. With this being the case, the movements in propylene
and butadiene operating rates and prices will tend to mirror those of ethylene.
From this graph, one can see that prices tend to rise once ethylene utilization rates move
past 94 percent. Just such a situation occurred in the 1985 to 1988 timeframe. Prices remained
relatively stable advancing, though, at less than the rate of inflation through early 1987. At
that time, operating rates moved upwards to average 95.2 percent for the year. Concurrently,
ethylene prices moved up abruptly, advancing from an average price of 14.8 cents/pound in
1986 to 15.1 cents/pound to 1987.
It should be noted that these average prices imply a high/low configuration for the year.
And 1987 was no exception. Ethylene prices rose steadily all year, finishing in December at
17 cents/pound. The following year saw utilization push past 98 percent, and prices almost
doubled to a 28.8 cents/pound average.
In 1989, operating rates dropped sharply to an average of 91 percent, as capacity addi-
tions and a slowdown in ethylene derivative demand-itself a sign of the approaching
recession-caused a market reversal. However, while utilization rates moved down, the ethyl-
ene price coasted higher to an average of 30.4 cents/pound. The word “coasted” is
particularly appropriate, because we believe that it effectively describes the dynamics in play;
namely, that once operating rates do rise, there appears also to be a slight lag in the price
fallback.
294 Metallocene Technology
Figure 1. Relationship between ethylene operating rate and
price. United States Gulf Coast.

We attribute this price momentum to the fact that ethylene is very much a
just-in-time-delivery type of product. Ethylene derivative manufacture is a continuous pro-
cess. As such, producers want assurance that not only is capacity available to make ethylene,
but also those on-hand stocks of ethylene are sufficient. It is typical in the olefins industry-and
for ethylene in particular-to view sufficient on-hand stocks as a number equal to one week of
industry production (this unit of measurement being average quarterly capacity divided by
the number of days in that quarter).
As such, both buyers and sellers pay especially close attention to inventory levels. This
is particularly so in time of high utilization, as on-hand inventories tend to be depleted at
those times. This often leaves the market with a sense of perceived shortage despite there be-
ing sufficient capacity to meet real demand.
Still, operating rates below 94 percent will lead to lower prices. The effect will tend to be
exacerbated by the prolonging of the downturn. This can be seen in the 1989 to 1993 period,
when the U.S. economy was deeply in a recession. Here we find prices slumped from a 30.4
cents/pound average in 1989 to an average of just 20.3 cents/pound in 1992. This 30-plus per-
centage drop in prices was a primary causal factor in the slowdown and virtual cessation of
steam cracker construction during this period of time.
And, as we would expect, prices did not begin to rise until the same happened to operat-
ing rates. We see that from 1993 on, as operating rates moved towards and then past 94
percent (as they did in 1994), ethylene prices were also on the rise.
Why is it, then, that prices stayed on the rise in 1995, a year when the average operating
rate retreated? The answer to this is the one stated above: prices can rise if the perceptions or
the reality of on hand inventory levels implies a shortage. In August 1994, Exxon Chemical
and Shell Chemical both had steam cracker explosions which put these units out of action for
six months. During this period, inventories were drawn well down. In the resultant environ-
ment, most buyers and sellers believed another accident, were it to occur, would leave the
industry unable to meet demand. This being the case, ethylene was perceived to be at a pre-
mium; this situation was reflected by the rise in the 1995 average price for ethylene to some
27 cents/pound.
In 1996, another anomaly occurred, as utilization rebounded to 95.2 percent, while
prices slipped to an average of 23.6 cents/pound. Here, we find the reverse of 1995. Capacity
additions-both new and repaired brought so much output into operation that avails rose
sharply ... sharply enough, in fact, that the market shifted briefly in favor of buyers. This situ-
ation led to a fallback in prices.
Looking to 1997, prices and operating rates are both on the rise, as more normal condi-
tions become extant. Ethylene should average 26.7 cents/pound in a market where steam
cracker utilization is 98.7% percent.
What, then, does the future hold for olefins prices?
Availability and Pricing 295
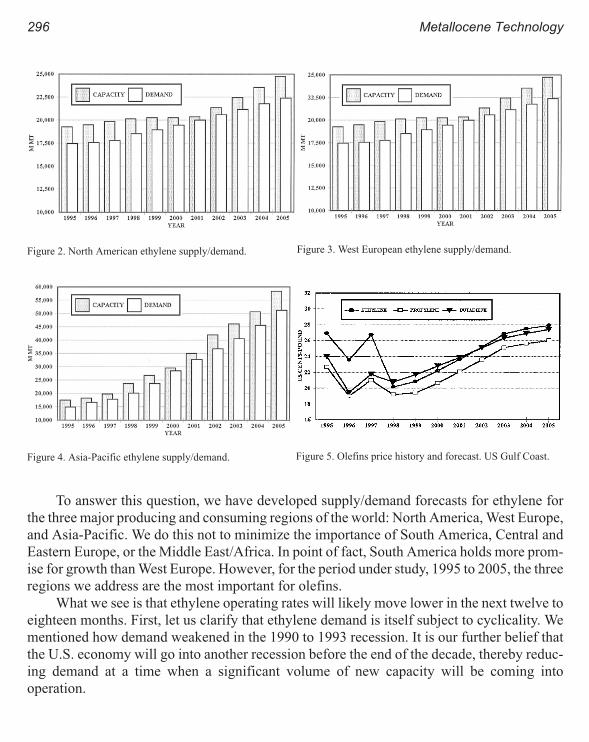
To answer this question, we have developed supply/demand forecasts for ethylene for
the three major producing and consuming regions of the world: North America, West Europe,
and Asia-Pacific. We do this not to minimize the importance of South America, Central and
Eastern Europe, or the Middle East/Africa. In point of fact, South America holds more prom-
ise for growth than West Europe. However, for the period under study, 1995 to 2005, the three
regions we address are the most important for olefins.
What we see is that ethylene operating rates will likely move lower in the next twelve to
eighteen months. First, let us clarify that ethylene demand is itself subject to cyclicality. We
mentioned how demand weakened in the 1990 to 1993 recession. It is our further belief that
the U.S. economy will go into another recession before the end of the decade, thereby reduc-
ing demand at a time when a significant volume of new capacity will be coming into
operation.
296 Metallocene Technology
Figure 2. North American ethylene supply/demand. Figure 3. West European ethylene supply/demand.
Figure 4. Asia-Pacific ethylene supply/demand. Figure 5. Olefins price history and forecast. US Gulf Coast.

Figure 2 shows that in North America, ethylene capacity will rise by some 3.5 MM met-
ric tons between 1997 and 1999. At the same time, demand should rise far less; this
conclusion is certain whether or not a recession occurs. With supply growing more rapidly
than demand, operating rates should be moving lower during this period. And, as seen from
the past, successive years of retreating operating rates have triggered price fallbacks.
Figure 3 and Figure 4 show similar scenarios likely for West Europe and Asia-Pacific,
respectively, though the degree of the capacity overhang is less. Nevertheless, the effect
should be sufficient as to cause olefin prices also to retreat in these regions.
How do we see prices moving during the forecast period? Figure 5 presents our forecast
of current dollar prices for ethylene, propylene, and butadiene during the 1995 to 2005
timeframe.
We expect prices to fall in 1998 and to stay somewhat depressed through late 1999.
Thereafter, prices should begin to recover, as we project that incremental demand growth will
be gradually absorbing existing capacity.
CONCLUSION
Olefins prices tend to move directionally with industry operating rates. We have seen that be-
tween 1985 and 1997, two pricing peaks occurred at a time when industry utilization moved
past 94 percent. With this being the case for operating rates at or above 94 percent, it follows
that operating rates moving below 94 percent will tend to pull prices down, also. As operating
rates are projected to retreat in the 1997 to 1999 timeframe, we think olefins prices will do the
same.
Availability and Pricing 297
World Polypropylene Demand
Russ DeLuca
Amoco Polymers Inc. Alpharetta, GA 30005-3914, U.S.A.
NEW PRODUCT GRADES
Polypropylene can take on many “forms” when we consider its performance characteristics.
It can be rigid and durable when needed for houseware or automotive interior applications. It
can offer specific barrier properties and flexibility for packaging. It can also provide comfort-
able but wear resistant performance for carpeting.
Further, the performance of polypropylene in 1997 is significantly improved over prod-
ucts of 5-10 years ago. Continual improvements in process and catalyst technology as well as
additives have yielded these improvements. The outlook is for this trend to continue. We are
seeing tougher and stiffer reactor products as well as a myriad of improved additives which
enhance performance. These new additives can range from clarifiers to improve functional
transparency to new elastomers to increase toughness. Beyond all this is the prospect of
metallocene catalyst providing a new range of performance. To date, there has been limited
commercial impact but this may change over the next five years.
It is easy to see how the combination of an essentially versatile performing polymer,
with broad based technology improvements, yields a powerful foundation for growth.
POLYPROPYLENE VALUE EQUATION
This driver is easy to understand. Polypropylene is the lowest density commodity polymer
thus giving it a major head start in the economic equation for materials evaluation.
Polypropylene also is quite versatile in fabrication options. It is readily extruded in many
ways; fiber, film and sheet. It can be thermoformed at high speed and readily blow-molded. It
is injection molded in a wide array of applications. Developments in non-wovens and thin
wall-molding extend the options.

Thus, the material engineer has a cost effective product that can be fabricated in many
ways. While we would anticipate continual improvement in fabrication, it is not likely to pro-
vide major new incentive for growth by itself.
POLYPROPYLENE PROCESS TECHNOLOGY
Technology developments have moved ahead rapidly in both polymer process and catalyst ar-
eas. This has driven the capital and operating cost per ton down over time thus providing a ba-
sis for continuing investment in new capacity. For example a world scale plant today is
250,000 tons per year where it was 125,000 tons in 1990 in the developed regions of the
world.
Given the status of technology today we would project slower improvement in cost over
the next ten years compared to the last ten. First, as the scale of plants increases the next incre-
ment provides less benefit. Next the major catalyst (metallocene) focus is targeted on
property improvements not cost reduction. These factors, however, will not inhibit the steady
increase in capacity to meet demand.
Propylene availability could be a factor in some regions. Propylene derivatives are
growing faster than ethylene derivatives; thus, creating a possible barrier where the prime
source of propylene are crackers. This is not likely to impact North America, but could have
impact in parts of Asia and Europe.
Thus, we can see that the three key drivers of growth are in place for the future. These
now provide the basis for the marketplace to continue the trend of continually growing our
existing applications and developing new ones.
Polypropylene is used in a wide array of applications. Some of the key areas where we
see increased penetration include;
• automotive exterior fascia
• food packaging
• bottles
• non-wovens
• prepared food containers
Certainly we will see many new applications appear over the future years; the combina-
tion of performance versatility and value assure this.
There is a further very important aspect to overall polypropylene growth. That is the de-
velopment of many emerging regions of the world. In each of these areas, the plastics
consumption per capita is a fraction of that in U.S. or Western Europe. This usage will grow
steadily as the economies in these regions mature. The key regions for this growth will be the
Mercosur trade region of South America, eastern Europe, eastern Mediterranean and large
parts of Asia including China, India and the array of countries in southeast Asia.
300 Metallocene Technology
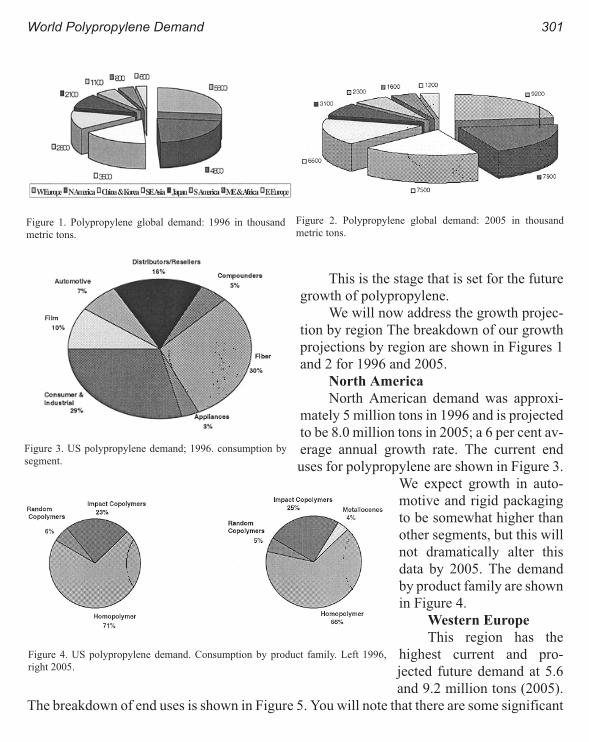
This is the stage that is set for the future
growth of polypropylene.
We will now address the growth projec-
tion by region The breakdown of our growth
projections by region are shown in Figures 1
and 2 for 1996 and 2005.
North America
North American demand was approxi-
mately 5 million tons in 1996 and is projected
to be 8.0 million tons in 2005; a 6 per cent av-
erage annual growth rate. The current end
uses for polypropylene are shown in Figure 3.
We expect growth in auto-
motive and rigid packaging
to be somewhat higher than
other segments, but this will
not dramatically alter this
data by 2005. The demand
by product family are shown
in Figure 4.
Western Europe
This region has the
highest current and pro-
jected future demand at 5.6
and 9.2 million tons (2005).
The breakdown of end uses is shown in Figure 5. You will note that there are some significant
World Polypropylene Demand 301
Figure 1. Polypropylene global demand: 1996 in thousand
metric tons.
Figure 2. Polypropylene global demand: 2005 in thousand
metric tons.
Figure 3. US polypropylene demand; 1996. consumption by
segment.
Figure 4. US polypropylene demand. Consumption by product family. Left 1996,
right 2005.
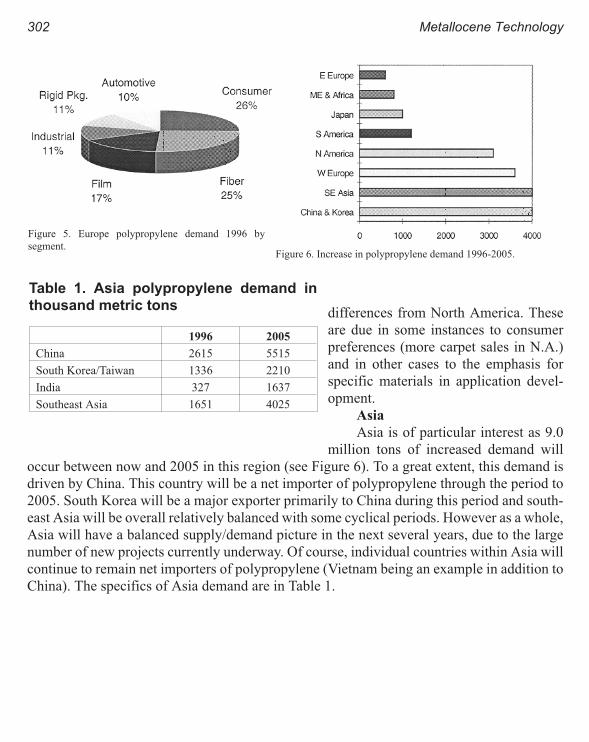
differences from North America. These
are due in some instances to consumer
preferences (more carpet sales in N.A.)
and in other cases to the emphasis for
specific materials in application devel-
opment.
Asia
Asia is of particular interest as 9.0
million tons of increased demand will
occur between now and 2005 in this region (see Figure 6). To a great extent, this demand is
driven by China. This country will be a net importer of polypropylene through the period to
2005. South Korea will be a major exporter primarily to China during this period and south-
east Asia will be overall relatively balanced with some cyclical periods. However as a whole,
Asia will have a balanced supply/demand picture in the next several years, due to the large
number of new projects currently underway. Of course, individual countries within Asia will
continue to remain net importers of polypropylene (Vietnam being an example in addition to
China). The specifics of Asia demand are in Table 1.
302 Metallocene Technology
Figure 5. Europe polypropylene demand 1996 by
segment.Figure 6. Increase in polypropylene demand 1996-2005.
Table 1. Asia polypropylene demand in
thousand metric tons
1996 2005
China 2615 5515
South Korea/Taiwan 1336 2210
India 327 1637
Southeast Asia 1651 4025
PVC Markets, Today and in 2020
Donald Goodman
Occidental Chemical Corporation, Pottstown, PA 19464
PVC TODAY
Because of PVC’s combination of versatile performance and low price, PVC will continue to
grow at about 7±3% for the decade. The variability will result from new production capacity
relative to world economies. The areas of highest growth are in global construction activities
and export to developing nations for all applications. There have been and continue to be a
number of environmental challenges that have been irritating to outright menacing of particu-
lar PVC markets. The following outline will attempt to highlight these drivers and barriers to
PVC markets.
In the emerging and survival economies, there are opportunities of infrastructure devel-
opment that are favorable for PVC. For delivery of clean water systems, for example, there
will be high demand for PVC pipe. Similarly, for sewage treatment, transport, and general
sanitation improvement, much PVC will be used. Inexpensive PVC modular housing is gain-
ing popularity. The increased use of PVC will prevent, or significantly reduce, deforestation
and subsequent soil loss. The use of PVC for basic irrigation, without overuse of water, is an
established practice. The point is that for both domestic and overseas construction applica-
tions, there will continue to be high demand for PVC.
PVC has been winning many moderate performance/low cost plastics applications. This
should continue for a number of years. There is expected to be an impact of metallocene cata-
lyzed polyolefins on flexible PVC markets in the next two decades.1 Higher performance PE
and PP can be tailor made with new metallocene complexes. As these catalysts become less
expensive and as the properties improve, then some impact on PVC flexible markets may be
expected. This impact should be gradual but substantial (up to 15%) over the next 20 years.
On the environmental front, PVC has remained steady and equal to all the challenges.
The marketing difficulty is that the perceived rather than the real problems are being believed.
The PVC industry has undergone a revolution in recent years from a closed private aspect to a

transparent and open industry. Measurements of dioxin and vinyl chloride, for example, in
products, byproducts, and emissions are known to regulators, to antagonists, and most impor-
tantly, to industry itself which continues to strive to further improvements in reducing toxic
emissions.
Even as the products and processes are becoming cleaner, the propaganda attacks to
PVC have become more pointed. The Dusseldorf airport fire created problems for PVC mar-
kets because PVC was mistakenly blamed as a fuel in the fire, and injury from dioxins was
supposed to have hurt people. These claims were later proved to be untrue, and PVC was
proved to have had very little involvement in the fire. The adverse publicity during this inves-
tigation, however, turned out to be harmful to vinyl markets. Similarly, claims of lead
chalking on vinyl slat blinds gave the industry unnecessary heartburn because lead stabilizers
are not used for these applications at all in the United States.
The environmentalists have invented a “poison soup” concept around PVC. Even as the
PVC resin comes out clean and environmentally friendly, claims are made against phthalate
plasticizers used to make flexible PVC; tin stabilizers are a problem in Sweden although they
are approved in the United States; and toys containing plasticizers and possible heavy metal
colorants are all under attack. These allegations all have an impact on markets, particularly
when competing materials continue the allegations.
Vinyl has had a long history of defending itself against environmental claims starting in
the mid seventies with the vinyl chloride toxicity problems. Since then the industry has had
considerable success in managing issues from fire science to concerns about the use of heavy
metals in compounding. Despite all these issues and problems, the business impact on mar-
kets has been marginal.
PVC TOMORROW
In the Vinyl Institute2 report “2020" prepared by Dr. Gary Gappert in 1996,3 four futuristic
scenarios are presented: (1) vinyls boom in second and third worlds; (2) there is a major re-
placement of vinyl in the 25 years; (3) there is selective sunsetting of vinyl products; and (4)
PVC is saved by advancing technology and is thriving. These scenarios are analyzed against
four economic conditions (a) continuation of existing economic trends; (b) acceleration of
new trends; (c) maturation of existing trends; and (d) there are restrictions on the use and
manufacture of vinyl.
The scenarios are based on adverse political pressure to decrease PVC production or par-
ticipation in particular markets. The other major variable is the level of innovation or
technical change and improvement. The prediction is made that the industry could grow to as
much as $61 billion by 2020. Adverse political policies and technical stagnation may restrict
that growth to less than $23 billion in 2020. The $38 billion potential difference between the
304 Metallocene Technology

most favorable and least favorable scenarios requires serious attention to political policy in-
tervention and to advanced technology development.
Among the areas listed in “2020" that are favorable for technical development are:4
global warming and rising ocean levels; deforestation and rising cost of wood; worldwide ur-
banization and housing demand; cultural changes and regional conflicts; the need to conserve
fossil fuel supplies by designing more energy efficient vehicles; health care revolution; com-
munications revolution; and environmental requirements.
The PVC industry was given a wake-up call by Mr. Bill Patient, CEO of Geon, at the
World Vinyl Forum5 to develop the technology so that the PVC industry will continue to grow
and prove to be a robust sustainable plastic into 2020 and beyond.
REFERENCES
1 “The Impact of Metallocenes on PVC,” R.B. Wilson, Jr., presented at the First World Vinyl Forum.
2 Vinyl Institute, 65 Madison Ave., Morristown, NJ 07960, Tel: 973-898-6699.
3 “2020: Progress. Challenge. Prospects for the next Quarter Century,” commissioned by the Vinyl Institute, April 1996.
4 Ibid., page 37.
5 First World Vinyl Forum, Akron, OH, Sept. 9, 1997.
PVC Markets 305

A
ABS 293
activation energy 29, 97, 212, 271
agricultural films 137
amorphous 9, 23, 37, 112, 147
agent 130
appearance 67
atactic 9, 23, 29, 37, 187, 279
autoclaving 275
Avrami
equation 249
kinetics 263
theory 157, 265
B
bags 137
barrel 73
birefringence 178, 223
birefringent 148
blends 17, 27, 29, 38, 48, 53, 62, 77, 129, 164
blow molding 87, 117, 122
blowing agent 157
branches 5, 261
branching 193, 217, 232
brittleness 29
bubble 118, 122
stability 204
C
can liners 137
capillary flow 223
cell structure 159
chain 13
chromium 1
clarity 47, 147
cobalt 1
coextrusion 129
compatibility 17
conductivity 165
conformation 167, 180, 279
contamination 275
cooling 247
copolymers 6, 31, 164, 194, 209, 258
distribution 77
copolymerization 10, 239
Cox-Merz rule 234
CP/MAS 178
critical stress 227
crosslinking 157, 193
crystalline 23
modifications 29
crystallinity 94, 107, 264
crystallites 105
crystallization 18, 54, 112, 117, 150, 177, 239,
257, 263
kinetics 168
cushioning 160
cyclic loading 78
D
damping factor 78
debonding 38
defects 102
degradation 194
die 64, 224
diffusion 54, 159
DMS 178
Doi-Edwards model 233
driving force 13
Index
DSC 15, 26, 30, 55, 87, 103, 113, 130, 135, 170,
178, 183, 248, 252, 264, 266
dynamic modulus 82
E
elastic recovery 172
elasticity 41
elongation 20, 132, 171
endotherm 106
EPDM 77, 279
EPR 279
equipment design 154
ethylene 1
ethylene/styrene interpolymer 37
EVA 53, 86, 94, 163, 278
exotherm 267, 272
expansion 157
extensional
flow 224
viscosity 217
extractables 148
extruder 48, 61, 138, 154, 177
extrusion 17, 69, 86, 97, 170, 197, 201, 223
F
fatigue 78
fiber 168, 177
film 17, 38, 69, 85, 111, 117, 122, 129, 168, 177,
201
flexural modulus 27
Flory equation 240, 258
foam 38, 157
fold surface 261
food 93, 137
free energy 261
fresh-cut produce 85
FTIR 183
microscopy 26
fusion 189
G
gas permeability 47
gelation 150
GPC 6, 18, 236
growth rate 263
H
hafnium 9
half-titanocene 12
haul off speed 132
haze 95
head-to-head insertion 101
heat
of fusion 88, 261
resistance 42
transfer 54
Henry’s Law 158
heterogeneous 5
HIPS 29
Hoffman-Lauritzen equation 250
homogeneous 5
hot tack 55
housing 303
hysteresis-loop 78
I
immiscible 17
impact 28, 50, 89, 138
impurities 23
injection molding 41, 81
interaction 19
interpenetrating network 81
IR dichroism 113
iron 1
isomorphism 190
isostrain 117
isostress 117
isotactic 9, 101, 279
308 Metallocene Technology
K
Kaminsky 1
Kraton 29
L
lamellae 23, 32, 102, 251, 257
lamellar thickness 115, 240
M
markets 283
masterbatch 62
medical 93, 137, 275
melt 23, 129, 170, 177
fracture 223
index 69, 138, 204
instability 97
strength 201
temperature 62
melting 18, 190
behavior 69
instability 74
point 31, 58, 95, 102, 258
methylaluminoxane 1
microscopy 30
Mie-theory 148
military helmets 160
miscibility 27
modeling 38
modified atmosphere 86
modulus 19
molecular
stiffness 272
weight 77
morphology 3, 29, 38, 41, 111, 148, 247
N
nanodispersion 148
nanoscale 25
Newtonian flow 95
nickel 1
NMR 112, 231
NRA 29
nucleating agent 27, 148
nucleation 131, 158, 244, 257, 269
nuclei concentration 247
O
olefins 293
operation variables 154
optical
clarity 275
properties 48, 101
orientation 32, 90, 116, 177
output 62
oxygen 86
Ozawa exponent 265
P
packaging 53, 85, 93, 137, 147, 275, 299
packing 167
PBT 278
permeability 85
pipe 303
plasticizer 277
platelets 23
polydispersity 1, 13, 18, 193, 232
polyethylene 17, 41, 47, 53, 62, 77, 86, 93, 111,
121, 129, 137, 153, 161, 183, 202, 209, 234,
239, 257, 277, 283, 293
polymerization 2
polymorphism 29, 167
polyolefins 9, 111, 157, 183, 258, 277
polypropylene 10, 18, 23, 77, 101, 147, 164,
167, 177, 183, 194, 263, 278, 283, 293, 299
polystyrene 29, 37, 147
pressure 50, 65
prices 295
printability 41
processability 153, 203
propylene 13
PTMO 278
pumping capacity 64
Index 309

PVC 277, 303
Q
quality 67
R
Raman 112
refractive index 42
relaxation
spectrum 193
studies 17
respiration 86
rheology 38, 62, 96
rheometer 80, 131, 169, 232
rotation 10
rubber 293
rubbery phase 114
S
SAXS 112
screw 61
design 69
seal 54
sealability 41
sealing strength 91
SEBS 278
SEC 193
segregation 23, 25
SEM 158
shear rate 213
shear thinning 217
sheets 168
shrinkage 171
silica 2
SIST 103
slit-tapes 168
slurry process 47
sol-gel transition 149
solidification 38
spherulite 23, 33, 147, 247, 252, 257
spinning 168, 177
stabilization 195
stereochemistry 9, 101
stereomodifiers 147
stereoregularity 101, 188
sterilization 275
stiffness 27, 88, 150
storage 85
strain hardening 108, 235
stress analysis 178
stress-strain 78
styrene 10
supercooling 217, 251, 258
surface 67, 98
syndiotactic 12, 29, 187
T
TDA 178
tear
resistance 89
strength 51, 123, 138
TEM 113
tenacity 171
tensile
modulus 88
strength 50, 132, 178
texture 116
Tg 37, 276
thermoformability 41
tie-molecules 261
titanium 9
dioxide 62
torque 134
toughness 27, 47
TPE 276
transcrystallization 112, 118
transparent 148
triisobutylaluminium 2
tubing 97
310 Metallocene Technology

U
unsaturations 186, 195
V
vinyl 186
vinylidene 186
viscoelastic studies 93
viscosity 80, 134, 139, 195, 210, 233
W
WAXD 169, 178
WAXS 31, 112
wetting 54
Y
yield stress 108
yielding 107
Young’s modulus 82, 117, 133
Z
Ziegler-Natta 1, 17, 69
zirconium 9
Index 311


![SYNTHESIS AND BIOLOGI CAL EVALUATION OF NOVEL ...rushim.ru/books/biochemie/epibatidine-analogues.pdf2-(hydroxyalkylpyridyl)-7-azabicyclo[2.2.1]heptane derivatives were synthesized](https://img.dokumen.tips/doc/110x75/60f88dd84a7e5669bd2167eb/synthesis-and-biologi-cal-evaluation-of-novel-2-hydroxyalkylpyridyl-7-azabicyclo221heptane.jpg)