Embed Size (px)
Citation preview

SHARING; IN A PRIVATELY OWNED WORKSTATION ENVIRONNENT
MATT WALTER MUTKA
Computer Sciences Technical Report #78 1
July 1988
i

SHARING IN A PRIVATELY OWNED WORKSTATION ENVIRONMENT
by
MATT WALTER MIJTKA
A thesis submitted in partial fulfillment of the requirements for the degree of
Doctor of Philosophy (Computer Sciences)
at the
UNIVERSITY OF WISCONSIN - MADISON
1988

i i
i
ABSTRACT
Private workstations interconnected by networks have become widely available as sources of computing cycles. Each workstation is typically owned by a single user in order to provide a high quality of service for the owner. In most cases, an owner does not have computing demands as large as the capacity of the workstation. Therefore, most of the workstations are often under utilized. Nevertheless, some users have demands that exceed the capacities of their workstations. The desire to satisfy the requirements of users who need extra capacity without lowering the quality of service of owners of under utilized workstations raises the following challenging question: Can we provide a high quality of service in a highly utilized workstation cluster?
The problem identified by this question is how to share workstation capacity with minimal interference with the local activity of workstation owners. This thesis addresses this problem of capacity sharing by exploring issues involved with the formation of a processor bunk from a workstation cluster. The capacity of the processor bank comes from the donation of workstations during periods that the stations are not used locally. During periods of local usage, the workstations are withdrawn from the processor bank. We examined the amount of capacity available for donation, and the characteristics of the donation and withdrawal periods.
A design of a system that enables users to share capacity on the basis of time and availability is presented. Since users who want to share capacity might have widely varying demands, we developed an algorithm that gives a high quality of service to light users in the presence of heavy users. If naive algorithms are used for allocating capacity, the quality of service experienced by light users will degrade when a few heavy users try to monopolize the processor bank.
Condor is the realization of our design of a system that allocates capacity on the basis of availability. It has been operating in our computing environment for several months. During this time, heavy and light users have benefited from the capacity they received from a processor bank. A performance profire gives evidence that the quality of service of light users is almost not affected by heavy users. Condor has shown that a processor bank foImed from a workstation cluster can be an effective means of improving the productivity of a computing environment.

ii
ACKNOWLEDGEMEXTS
I am indebted to my advisor, Professor Miron Livny, who has guided me in this research and helped me organize my ideas so that they could be more clearly expressed. I am thankful for his persistent support of this work.
I wish to thank the readers on my thesis committee: Professors David DeWitt and Mary Vernon. They provided insightful comments and criticisms. I appreciate the time and energy that Professor Mary Vernon has given to the weekly performance seminar. I thank the non-readers on the committee, Professors Bart Miller and Charles Kime, for taking the time to provide their useful comments.
Michael Litzkow deserves special credit for his implementation work on the Condor system, from which I was able to obtain data for my research. I thank him for his willingness to make modifications in the system to accommodate the data collection that I needed. Yeshayahu Artsy, Hung-Yang Chang, and Phil Krueger, fellow students of Professor Livny, deserve thanks for their discussion of issues that arose in the course of this work.
Professor David DeWitt provided me with a research assistantship for several semesters as part of the Crystal and Topaz projects, of which I am thankful. This research was supported in part by the National Science Foundation under grants MCS81-05904 and DCR-8512862, and by a Digital Equipment Corporation External Research Grant.
On a personal level, I wish w thank my parents, Walter and Ann Mutka, for the many years of support that they have given me. The high value which they placed on education encouraged me to continue with my graduate study. My most special thanks goes to my wife, Janice Marie Mutka, for all of her encouragement and support. I appreciate the hours she spent proofreading this dissertation. She has been a valuable parmer and friend, and it is to her that I dedicate this dissertation.

iii
TABLE OF CONTENTS
ABSTRACT ...................................................................................................................................................... ACKNOWLEDGEMENTS ............................................................................................................................... Chapter 1 Introduction ..................................................................................................................................
1.1. A Processor Bank .................................................................................................................................. 1.1.L Forming the Processor Bank ........................................................................................................ 1.1.2. Allocating the Power of the Processor Bank to Users ................................................................. 1.13. Long TeIm Scheduling .................................................................................................................
1.2. Thesis Structure .................................................................................................................................... 1.1.4. Design andEvaluation Issues for a Long TeIm Scheduler ..........................................................
Chapter 2 Related Work ................................................................................................................................ 2.1. Related Distributed Systems ................................................................................................................. 2.2. Scheduling Remote Capacity For Users ............................................................................................... 2.3. Recent Workload Characterizations .....................................................................................................
Chapter 3 Workstation Usage Profile ........................................................................................................... 3.1. Introduction ........................................................................................................................................... 3.2. Technique Of Acquiring Data ............................................................................................................... 33 . Monthly And Daily Variation Of Availability Of Woxkstations .......................................................... 3.4. Model of Workstation Usage Patterns ..................................................................................................
3.4.1. Distribution Of Usage Patterns .................................................................................................... 3.4.2. Correlation Of Available And Non-Available States .................................................................. 3.4.3. Development Of Stochastic Models .............................................................................................
3.5. Summary ............................................................................................................................................... Chapter 4 Sharing the Resources of a Processor Bank ...............................................................................
4.1. Inboduction ........................................................................................................................................... 4.2. System Design ......................................................................................................................................
4.2.1. Scheduling Structure .................................................................................................................... 4.2.2. TheRemoteUnix (RU) Facility ................................................................................................... 4.23. Checkpointing ..............................................................................................................................
4.3. Allocation of Capacity of theProcessor Bank ...................................................................................... 4.4. Scheduling Remote Jhocessing Cycles .................................................................................................
4.4.1. The Up-Down Algorithm ............................................................................................................. 4.4.2. Algorithms Used For Comparisons .............................................................................................. 4.43. Simulation Study Results .............................................................................................................
4.5. Summary ...............................................................................................................................................
1
ii
1 1 2 .2 3 4 5
9 9 9
10 14 15 18 19 20
21 21 21 22 23 23 24 25 25 27 28 31
Chapter 5 Performance Profile of the Condor System ............................................................................... 32 5.1. Introduction 32 5.2. Performance .......................................................................................................................................... 32
35
........................................................................................................................................... 5.2.1. Impact on Local Workstations .....................................................................................................

iv
5.3. Discussion ............................................................................................................................................. 5.4. Summary ...............................................................................................................................................
Chapter 6 Reserving Capacity of the Processor Bank ................................................................................ 6.1. Introduction ........................................................................................................................................... 6.2. Usage Patterns of Workstations ............................................................................................................ 63 . Design of the Reservation System ........................................................................................................
63.1. The Free-Market Algorithm ......................................................................................................... 63.2. User Interface of the Reservation System .................................................................................... 6 3 3 . Reservation Coordinator's Tables ................................................................................................ 63.4. Tables Used By The Local Handler .............................................................................................
6.4. Summary ............................................................................................................................................... Chapter 7 Conclusions and Future Research Directions ............................................................................
7.1. Conclusions ........................................................................................................................................... 7.2.Future Research Directions ...................................................................................................................
Protection Issues ................................................................................................................................................ Scheduling Parallel Computations on a Cluster of Workstations ...................................................................... Enhancements to Condor ................................................................................................................................... RJ3ERF.NC %S ..................................................................................................................................................
Sharing Capacity in a Wide Area Network .......................................................................................................
37 38
39 39 39 45 46 49 50 54 55
56 56 57 57 57 57 58 59
i

V
LIST OF FIGURES
Figure 3.1: Availability Of Remote Cycles (Month To Month) ....................................................................... Figure 3.2 Availability of Remote Cycles During Weekdays ........................................................................ Figure 3.3: Availability of Remote Cycles During Weekends ........................................................................ Figure 3.4 System And Individual Station Utilization ..................................................................................... Figure 3.5 Bernoulli and Binomial Probability Density Functions ................................................................. Figure 3.8 Distribution of AV State Lengths of All Stations ........................................................................... Figure 3.9 Distribution Of NA State Lengths Of All Stations ......................................................................... Figure 3.10: Ilistribution Of AV State Lengths Of All Stations ....................................................................... Figure 3.11: Distribution Of NA State Lengths OF All Stations ....................................................................... Figure 3.12 Conditional Probability of AV. NA State Changes ....................................................................... Figure 3.13: Conditional Probability of AV to AV State Changes .................................................................... Figure 3.14: conditional Probability of NA toNA State Changes .................................................................... Figure 4.1: The Scheduling Structure .............................................................................................................. Figure 4.2 Modification Of Station i Schedule Index ...................................................................................... Figure 4.3: Remote Cycle Wait Ratio (LighrSrurions ) ..................................................................................... Figure 4.5: Percent Of LighrStun'ons Job Cycles Executed Remotely ............................................................. Figure 4.6 Remote Response Ratio (LighfStutions) ........................................................................................ Figure 5.1: Profile Of Service Demand ...........................................................................................................
Figure 5.3: Average Wait Ratio ....................................................................................................................... Figure 5.4: Utilization of Remote Resources .................................................................................................. Figure 5.6 One Week Queue Length .............................................................................................................. Figure 5.7: Rate Of Checkpointing .................................................................................................................. Figure 5.8: Remote Execution Leverage ......................................................................................................... Figure 6.1: Hourly Availability ....................................................................................................................... Figure 6.2 System Availability Profile ............................................................................................................ Figure 6.3: Average Hourly Preemption Rate .................................................................................................. Figure 6.4: Weekday Preemption Rate ............................................................................................................. Figure 6.5: Preemption Rate Experienced by Users ........................................................................................ Figure 6.6 Reservation System Structure ....................................................................................................... Figure 6.7: Local Handler's Flow Chart ...........................................................................................................
Figure 4.4 Remote Cycles Wait Ratio (MediumStution) .................................................................................
Figure 5.2 Queue Length ................................................................................................................................
Figure 5.5 Utilization for One Week ..............................................................................................................
11 12 12 14 14 15 15 17 17 18 19 19 23 28 30 30 31 31 33 33 34 35 36 36 37 37 40 40 41 41 42 45 51
J
I

*
LIST OF TABLES
Table 3.1: Availability Of Stations From Month To Month ........................................................................... Table 3.2 Utilization Of Individual Stations For One Hour Periods .............................................................. Table 3.3: Relative Frequency Distribution Of System Utilization. SU ......................................................... Table 4.1: Simulation Parameters .................................................................................................................... Table 4.2 Allocation Of Processor Bank Nodes For Background Jobs .......................................................... Table 4.3: Modification Of The Schedule Index Table (SI) ............................................................................ Table 4.4: Simulation Parameter Settings ....................................................................................................... Table 4.5: Up-Down Schedule Index Functions ............................................................................................. Table 5.1: Profile of User Service Requests ..................................................................................................... Table 6.1: Utilization During Weekdays and Weekends ................................................................................. Table 6.2 Long Reservable Intervals ............................................................................................................... Table 6.3: Free-Market Algorithm ParameteIs ............................................................................................... Table 6.4 Free-MaIket Algorithm Suggested Parameter Settings ................................................................... Table 6.5: Reservation System User Commands ................................................................ ............................ Table 6.6 System Table ................................................................................................................................... Table 6.7: Accounting List ............................................................................................................................... Table 6.8: Global Reservation Table ................................................................................................................ Table 6.9: List Of Reservations ........................................................................................................................ Table 6.10 Global Availability Table .............................................................................................................. Table 6.11: Reservation Request Table ............................................................................................................ Table 6.12 Reservation Request Acknowledgement .......................................................................................
11 13 13 24 26 27 28 29 32 43 44 47 48 50 52 53 53 53 54 54 55

CHAFTER 1
Introduction
In recent years the computing power at a broad range of institutions has proliferated. This creates opportunities for people to explore many avenues when searching solution paths of new problems. Modem computing facilities are composed of multiuser computers, private workstations, file servers, printers, and specialized hardware interconnected by high capacity networks. Networks enable resource sharing and information exchange through computer mail and file transfer systems.
Workstations are a resource whose numbers have increased dramatically in the last few years, accounting for most of the proliferation of computing power. Modem workstations are powerful machines capable of computing several million instructions each second. Each workstation is generally the private resource of its owner, so that the ownership of the computing capacity is, in many institutions, distributed among the users.
Akhough several users could jointly own a workstation, workstations are typically owned by a single user. An user has her own workstation in order to receive immediate access to computing resources without interference from other users. The owner has full contrql of the access of others to the station’s resources. In most cases an owner does not have computing demands as large as the capacity of the workstation. This means most workstations are under utilized. Nevertheless, some users face the problem that the capacity of their workstations is much too small to meet their processing demands. These users would like to take advantage of any available capacity they can access to support their needs. The capacity available fiom clusters of under utilized workstations has the potential to satisfy users who have large service demands. Therefore, modern processing environments that consist of large clusters of workstations interconnected by high capacity networks raise the following challenging question: Can we satisfy the needs of the users who need extra capacity without lowering the quality of service experienced by the owners of under utilized workstations? In other words, can we provide a high quality of service in a highly utilized cIuster of workstations?
The solution to the problem identified by this question requires the sharing of workstation capacity with minimal interference with the local activity of workstation owners. Computing environments composed of individually owned workstations generally have been shared with only crude and ineffective methods. For example, an owner of a workstation might offer an account on her machine to several foreign users. A foreign user is one who does not own the workstation he is using. Regardless that foreign users have been given access to a workstation, the owner might demand exclusive access when she has jobs to run. She does not want foreign users to interfere with her local activity. When the owner is not using the woIkstation, the foreign users compete for its capacity. A foreign user consuming resources on a workstation should be prepared to leave the station when the owner returns. Otherwise, all work the foreign user had in pxog~ess might be destroyed by the returning owner when she demands exclusive access to the workstation.
The lack of facilities for resource sharing creates a cumbersome environment for both workstation owners and foIeign users. The owners suffer since it is difficult to control the periods that foreign users consume resources once access rights have been given to them. The foreign users suffer because the resources will often remain available when they would like to receive them. This is due to their inadequate knowledge of when the owners are using their workstations, and the need for an account on the machines ta use them. This unfortunate situation is an example of the wait while idle condition [Livny82], where jobs wait while resources are idle.
1.1. A Processor Bank A much more effective approach of resource sharing of a cluster of workstations is through the concept of a
processor bunk. A group of computing resources designated for users to share is a processor bank. It can include piocessors that are dedicated for public usage, and private woIkstations that are donated and withdrawn dynamically. An owner donates the capacity of her workstation to the processor bank when the workstation is not needed locally. Capacity is withdrawn during periods of local activity when the owner no longer wants to share.
1
2
This thesis addresses the issues involved in the formation of a processor bank built from a cluster of workstations and the sharing of its capacity. Due to the expanding number of environments where workstations are the primary source of computing cycles, we focus our attention on a processor bank that is composed only of private workstations. No computers are dedicated exclusively to the processor bank. The processor hank is a dynamic collection of resources which grows when capacity is donated and shrinks when capacity is withdrawn.
We distinguish between the allocation and ownership of the resources of the processor bank. A private workstation is donated to the processor bank by its owner without relinquishing ownership. Although the donated capacity of the processor bank is temporarily allocated to users who do not own it, each individual resource remains under the control of its owner. The owner can regain the allocation of the resource whenever she wishes.
1.1.1. Forming the Processor Bank The processor bank is formed by users who donate the capacity of their workstations. Capacity can be
donated to and withdrawn from the processor bank by either manual or automatic mechanisms. Manual mechanisms are implicit or explicit actions that an owner conducts. An example of an implicit mechanism is the use of the login program to determine if the workstation is donated or withdrawn. The donation occurs when the owner "logs off" the workstation, and the withdrawal occurs when the owner "logs on" the workstation. In an explicit mechanism, the user has a specific command to donate or withdraw the workstation.
An owner is insured by a manual mechanism that a foreign job will not be placed on her workstation when she explicitly or implicitly withdraws the station from the processor bank. Nevertheless, capacity sharing through the processor bank by a manual mechanism can be ineffective. For example, an implicit manual mechanism by means of the login program causes an inadequate amount of capacity to be donated to the processor bank. Owners rarely "log off" of their workstations even if they leave them inactive for long periods. Likewise, an explicit manual mechanism is deficient because a user forgets to donate a workstation when he leaves it available, or fails to withdraw it when he resumes local activity. If he forgets to withdraw the capacity, he will suffer a decrease in his quality of service locally. This might inhibit his desire to donate his workstation at a later time. An automatic donation and withdrawal mechanism can overcome this problem.
An automatic mechanism withdraws capacity when an owner resumes local activity on a workstation, and donates capacity when there is no local activity, However, an owner loses some control of his workstation with an automatic mechanism. The automatic mechanism might not withdraw a workstation from the processor bank at a precise moment that the owner wants it withdrawn, which causes him to suffer some interference from a user of the piocessor bank. Nevertheless, we believe that an automatic mechanism can bring a large amount of capacity to the processor bank while insuring little intexference of foreign users with workstation owners. In order to construct an automatic donation and withdrawal mechanism, one must define the tolerance an owner has to sharing capacity with others. On one hand, many owners tolerate a small amount of sharing even at times that the owners execute local programs, and on the other hand some owners might strongly object if any of their workstations' capacity is shared with foreign users. The differing attitudes among workstation owners cause a range of possible definitions of when a workstation is available for donation to the processor bank.
A critical issue, given the mechanism used to form the processor bank, is whether enough capacity is available for sharing. Do a workstation owner's usage patterns allow for many long periods that a station can be donated? Are large amounts of donated capacity available when users demand it the most? These questions, which are concerned with the profile of workstation activity and the amount of capacity the owners donate to a processor bank, must be addressed. To address this issue, we have observed the usage of a cluster of workstations, and have found that more than 70% of the capacity of workstations can be donated to the processor bank for sharing. For our observations, a workstation was available for donation to the processor bank only if it had not been used locally within the last five minutes. A workstations was withdrawn as soon as it had local activity. With this approach to defining availability, we observe a large amount of capacity donated to the processor bank with little intexference to workstation owners. We believe that our automatic mechanism is a good approach for forming the processor bank.
1.1.2. Allocating the Power of the Processor Bank to Users The capacity of the processor bank can be allocated to a user on the basis of time or availability. Capacity is
allocated on the basis of time to a user who reserves one or more machines for a particular time of day. A user may need to reserve capacity during specified periods to conduct research or software development activities in a
3
distributed environment. Specific periods might be reserved by a user to interactively debug his distributed program. Other allocations are made as capacity becomes available, regardless of the time of day. A user with a number of jobs wants to be allocated several stations to execute his jobs whenever he can get them.
When a user is allocated capacity fmm the processor bank, he receives apartifion of machines. A partition is a group of machines that is allocated to a user on the basis of time or availability. A user obtains the resources of a partition for his own use and does not share it with others for the duration of the allocation.
There is a large demand for a processor bank to allocate partitions on the basis of availability. Within our department there are users working on problems that require the execution of many computationally intensive jobs, called background jobs, that run for long periods of time without any interaction with their users. A few example problems include studies of load-balancing algorithms [Krueger88], simulation of real-time scheduling algorithms [Chang85], studies of neural network learning models LSandon871, and mathematical combinatorial problems lChavey861. Users want to acquire capacity from the processor bank to execute these background jobs.
Some jobs are served better on their local workstation and are inappropriate for execution at the processor bank. These jobs require a lot of interaction with files or with their users (which we call interactive jobs), or are short, requiring only a small amount of CPCJ capacity. There are two reasons for executing these jobs at their local workstation. First, the overhead required to allocate capacity of the processor bank to a user for his interactive and short jobs might be large when compared to the service demands of these jobs. If these jobs were executed at the processor bank, they might spend much of the time waiting relative to their processing requirements. The second reason is that our observations indicate that the load of a workstation is more affected by background jobs which
background jobs to the processor bank, instead of short and interactive jobs. The processor bank is an especially attractive vehicle to allocate capacity on the basis of time or availability
since its computing cycIes are obtained from workstations that otherwise a e unused. We will present a design of a system that brings the power of the processor bank to users for support of their Iequests for partitions. In addition, we will show a peIformance profile that comes from an implementation of a system that allocates partitions to serve background jobs.
consume a lot of capacity than by interactive or short jobs. Users receive greater benefit by distributing the load of I
1.13. Long Term Scheduling The facility for sharing the capacity of a processor bank among its users is called long term scheduling. Long
term scheduling allocates capacity, on the basis of time and availability, to serve reservation requests and background jobs. A long term scheduler, which implements long term scheduling policies, minimizes the wait while idle condition by collecting information about available capacity, waiting jobs, and reservations, and by allocating partitions for background jobs and reservations.
Long term scheduling is one of the three levels of scheduling in a processor bank. To clarify the responsibilities of long term scheduling, we show how it relates to the two other levels: short and middle tern scheduling.
The short term scheduler allocates the resources of a machine to processes in its ~ u n queue. The processes are scheduled by the short term scheduler so that they frequently receive short busts of capacity. A higher level of scheduling is conducted by the middle term scheduler. It decides when and where within a par tition of woIkstations to place or move jobs. A middle term scheduler distributes jobs within a partition to keep machines in a partition busy or to balance the load of machines in a partition.
Long term schedulers allocate machines from the processor bank to workstation owners to form a partition. Since we assume that each workstation has a single owner, one might classify a long term scheduler as one that a b a t e s available machines to a home workstation. This is contrasted with short term schedulers which allocate processes to their local machine's resources and middle term schedulers which allocate processes to remote machines' resources.
In this thesis we focus on long term scheduling for a processor bank. It is a problem that has not been addressed by others, whereas short term scheduling [Kleiwock75, Kleinxock761 and middle term scheduling Eager86, Krueger88, Livny82, Stankovic84, Stumm88, Wang851 has been studied extensively.
When an owner of a workstation withdraws her station from the processor bank, the long term scheduler stops the foreign computations on the station and causes them to leave the station. A computation isforeign to station if it

4
is conducted by a user who does not own the station on which the computation is executing, or is a background job submitted to the processor bank for execution. Part of the duties of a long term scheduler is to save the processing state of a foreign computation in case the computation is preempted or when the machine on which it runs fails. A processing state of a computation is the information necessary to resume on a different machine a computation in pIogress. It is the responsibility of long term scheduling to minimize the work that must be redone when a foreign computation is preempted or a remote location fails. This is accomplished by restarting the computation fiom a saved processing state.
Both short and middle term schedulers do not save the processing state of a computation in order to handle a preemption of a machine in a partition or a machine failure. A short term scheduler handles CPU preemptions for jobs in its run queue, but if the CPU fails or the workstation is withdrawn from the processor bank, a short term scheduler loses the jobs. This is because it does not save their intermediate states in non-volatile storage. A middle term scheduler might have facilities to move executing jobs within a partition, but if a machine in the partition is taken away from a user by the long term scheduler, the middle term scheduler does not save the intermediate states of the jobs it manages. A long term scheduler recovers a job even when there is no location to put it for execution, because it keeps an intermediate state of a job in non-volatile storage.
1.1.4. Design and Evaluation Issues for a Long Term Scheduler Several design issues must be explored when constructing a long term scheduler. One issue concerns the
stmcture of the scheduling system. This issue requires a decision to be made about the distribution of responsibilities in the cluster of workstations. The structure has an effect on the amount of interference that the scheduling functions have on workstations in the system. A second set of issues concerns protection, which arise when users are given access to woIkstations owned by other users. Protection issues are important, whether they are concerned with the possible attacks that foreign users might have on the workstations that they have temporarily acquired by means of the long term scheduler, or the protection of the long term scheduler itself. We do not address the complex protection issues, which is a large topic in itself. A third issue is the amount of transparency viewed by users when they execute jobs remotely at the processor bank. The transparency issue is concerned with how users acquire resources of the processor bank. Do users explicitly name which available machines they acquire for their partitions, or is the allocation of partitions transparent to them?
The design of a long term scheduling system includes the choice of algorithms for allocating capacity to users on the basis of availability. The algorithm decides which users are allocated capacity of the processor bank, and which users must wait to receive allocations. In order for the algorithm to be evaluated, performance criteria have to be chosen to quantify the quality of service provided. The choice of such criteria is affected by the quality of service wanted by users. Goad service for some people might simply mean that jobs will eventually receive service, or that the variation of waiting time of jobs is small Francez861. For others, the quality of service is measured with respect to the amount of waiting each user (not job) has endured in order to receive requested resources. The quality of service that users receive from the processor bank should be based on their demands for capacity from the processor bank. A light user will be encouraged to contribute his workstation to the processor bank if he knows that his requests receive a good quality of service fIom the bank. A heavy user does not object to giving higher priority to a light user if it encourages the light user to add his machine to the system. A greater the number of machines in the processor bank means that heavy users will have more capacity for the eventual consumption of heavy users. In our study, we use the amount of capacity users receive, and the waiting time they suffer to receive capacity as the basis of our performance criteria. This criteria means we cannot look only at the response time of jobs without considering who owns them. We believe that the amount of remote execution time an owner of a workstation received divided by his wait time, which is the remole cycle wait ratio, is a good criterion when evaluating algorithms that allocate capacity on the basis of availability. The remote execution time is defined as the total iemote processing time allocated to a woIkstation owner. The wait time is the amount of time the workstation owner wanted remote cycles but had no cycles allocated. We will present an evaluation of three capacity allocation algorithms of a long term scheduler using this criterion. Through observation of an implemented system, we show how an algorithm that performs well with this criterion, called the IJp-Down algorithm, affects the users' wait ratios.
In addition to the allocation of partitions on the basis of availability, another issue is the choice of an algorithm to allocate partitions on the basis of time. To provide good service to users who reserve capacity, each user should have an opportunity to reserve capacity. The heavy users who frequently reserve capacity should not
i

5
inhibit access to capacity by light users. With this goal in mind, we designed an algorithm to allocate capacity on the basis of time, called the free-market algorithm.
This thesis will present an investigation of the structure of the scheduling system, design of algorithms for allocating capacity, and the evaluation of an algorithm for allocating capacity on the basis of availability. The smcture of the system enables users to transparently receive partitions on the basis of availability, and both transparently and non-transparently receive partitions on the basis of time. We need a profile of reservation requests of users to obtain an appropriate workload for an evaluation of algorithms that reserve partitions of a processor bank. We would like to obtain this information by observing the patterns of reservation requests from a reservation system, which we leave for future study.
1.2. Thesis Structure The remainder of this chapter introduces four areas of research which address issues involved in the formation
of a processor bank and the shaxing of its capacity. These areas are presented in detail in chapters 3-6 of the thesis. The first area of research explores the feasibility of using donated workstations to form a processor bank for
allocating partitions where background jobs are executed. Kleinrock IJUeinrock851 noted that the number of MIPS (Millions of Instructions Per Second) from installed workstations is an order of magnitude greater than the number of MIPS from mainframes. Although it had not been shown, he stated his belief that the capacity from private workstations is left unused most of the time. It is important to learn how to use this untapped power. To evaluate approaches of capacity sharing, we need to understand the characteristics of workstation usage. Therefore, we must properly profile the workload of workstation activity. Chapter 3 of this thesis explores the patterns of activity owners have with thek workstations, and characterizes the extent which capacity can be donated to the processor bank. A model of the workstation utilization is developed as a stochastic process so that others can use realistic workloads when evaluating capacity sharing policies.
The second area of research is the design of a long term scheduling structure and algorithms for allocating the capacity of a processor bank on the basis of availability. Design issues involved in the structure of a long term scheduling system, and the design and evaluation of algorithms to allocate available capacity on the basis of availability are discussed in Chapter 4.
The investigation of the performance of an implementation of a long term scheduling system is the third area of research. Chapter 5 portrays the performance profile of the system and the enhancements the system brings to the computing environment. It shows the costs involved in sharing the processor bank and the support required to execute jobs at the bank.
Since the amount of capacity in the processor bank is dynamic, the reservation of capacity can be a problem. We are faced with the following interesting questions: Are partitions of the processor bank available often enough and for long periods so that they could be reserved in advance? Can we predice the amount of reservable capacity in a processor bank? For the fourth area of research, Chapter 6 shows that the amount of capacity in a processor bank for particular times of a day can be predicted. This leads to our presentation of a design of a reservation system for a processor bank.
Chapter 7 gives conclusions and presents future directions for research. The next step in the presentation of this thesis is to provide background for our study. Chapter 2 gives an overview of work that relates to the sharing of a processor bank constructed from a cluster of workstations.
i 1 i
i

CHAPTER 2
Related Work
In this chapter, work related to the problem of forming a processor bank from a cluster of workstations and sharing its resources is presented We present three areas where similar issues have been studied. First, we discuss several distributed systems that have features which resemble a processor bank. Second, resource sharing strategies are presented which are directed toward providing a good quality of service for users in spite of their diverging individual demands, which are similar to our long term scheduling policy. Workload characterizations of jobs (not activity of workstation users) that show non-exponential behaviors is the third area presented.
The first area includes implementations of remote execution facilities for clusters of workstations and a system that allows partitions of computers to be reserved. We begin the discussion with a look at a system that originated the concept of a processor bank.
2.1. Related Distributed Systems The concept of a processor bank was introduced with the development of the Cambridge Distributed system
pk~dham82, Craft831. The processor bank of the Cambridge system is a group of interconnected processors with no owners. A cluster of personal computers are used to access the processor bank. The processors in the bank appear as cycle servers to users when they receive allocations. The system manages the resources of the heterogeneous facility and helps users acquire needed hardware and software components. Users manually place and schedule their jobs on the allocated resources.
Following the implementation of the Cambridge Distributed system, researchers at the University of Wisconsin developed the Crystal Multicomputer DeWitt871 which has management features resembling long term scheduling. The Crystal Multicomputer is a loosely-coupled partitionable multicomputer with a static number of computing nodes at its disposal. It seIves as a test bed for experimentation in distributed computing. Crystal has the ability to schedule reservations for users on a partition of computers. A user acquires a partition to conduct experiments without interference from users of other partitions. The reservation feature is the basis for our study of reserving partitions of a dynamic processor bank formed fram workstations.
A powerful feature of the Crystal Multicomputer is its remote system call facility for a Unix@ environment (Pitchie781, called remote unix (RU). RU allows available Crystal nodes to be servers of remote computing cycles for Unix program. It serves as the basis of a facility that was implemented by Litzkow [14itzkow87bl to turn available workstations into cycle servers. Included in the facility is the ability to checkpoint jobs. A checkpoint is an intermediate state of a job that has already begun execution. The intermediate state of the job has enough information to restart the job on a different machine at a later time. The topic of checkpointing has been confronted both in implementations and in theoretical studies by several researchers. Work by [Borg83, Powell83bl used checkpointing in the implementation of systems to allow job recoveries from failures. Chandy and Lamport [Chandy85b] presented an algorithm for taking a checkpoint of a distributed computation, where each process in the computation takes a checkpoint of its own state and records the messages that it sends and receives after the checkpoint. Papers by several researchers [Chandy’lJ, Chandy85a7 Gelenbe85, Gelenbe79, Krishna83, Young741 have studied the optimal period in which to checkpoint jobs, which is typically optimized for the mean response time.
The Cambridge Distributed system and the Crystal Multicomputer are examples of implementations of loosely-coupled systems which have a resource manager that allocates partitions of publicly owned processors to users. Many loosely-coupled systems have developed transparent process placement facilities and process migration facilities to improve their utilization [Artsy86, Lazowska81, Popek81, Powell83a, Walker83]. With the
@ Unix is a trademark of AT&T Bell Laboratories.
6

growth of computing environments composed of private workstations, researchers have implemented facilities aimed at improving their utilization. The emphasis has been directed towards the implementation of systems that support remote executions and allow jobs to migrate to available workstations, without addressing the problem of long term scheduling. These include the NEST research project [Agrawal85], the V-Kernel [Chenton83, Theimer851, the Sprite System IDouglis87, Ousterhout881, and the Butler System INichois87, Dannenberg8fil. With the exception of the Butler system, the systems do not view workstations as private resources with owners. The Nest, V-Kernel, and Sprite systems view clusters of private workstations as loosely-coupled multicomputers. This means that foreign jobs can interfere with a user’s local activity on his workstation.
The remote execution facilities of the NEST, V-Kernel, Sprite, and the Butler systems allow programs to be off-loaded on available workstations. This increases the computational resources available to a user to be beyond what is provided by his personal workstation. The NEST research project is concerned with creating a computing environment that consists of a cluster of highly autonomous yet cooperating personal computer workstations and shared servers. The paper which describes the NEST project discusses the implementation of an augmentation to the Unix environment where process location can be transparent.
Primarily due to the complexities in the Unix system, the migmtion of executing processes is not studied in the NEST project. Process migration implementations appear in the V-Kernel and Sprite systems. The V-Kernel allows the migration of a process to be overlapped with its execution. While a process’s address space is being moved, the process continues to execute. Pages of the address space that have been modified after they were previously moved would need be moved again. When the operating system is ready to commit the process to the new location, the process is suspended and all remaining address pages are moved. The migrating technique differs in the Sprite system, where a process is suspended during the entire time it is being migrated
The NEST, V-Kernel, and Sprite systems do not form a processor bank from a cluster of WoIkstations, and manage the allocation of the capacity of a processor bank. The system that most closely resembles an implementation of long term scheduling for a processor bank is the Butler system. By means of the Butler system, users acquire workstations from an available pool to execute their jobs remotely. The Butler system provides a shared file system and a network window manager that can display windows of remotely executing programs. A program called the butler manages the pool of available workstations. The login facility is used to identify workstations in the pool. By observing whether a user is logged into a workstation, the Butler system registers a workstation as being available for remote execution or busy with local activity.
The Butler system provides users with transparent access to remote capacity, but it does not allocate capacity to users on the basis of availability. A user with many background jobs explicitly requests remote machines, rather than queuing jobs for later execution when capacity becomes available. An intermediate state of a remotely executing job is not saved when preemption occurs at the remote site at which the job is executing. The remotely executing job is lost, with the work that it has performed.
The NEST, V-Kernel, Sprite, and Butler systems present important developments regarding sharing the resources of clusters of workstations. With the exception of the Butler system, they view a cluster of workstations as a loosely-coupled multicomputer, which sharply differs from our view that owners of private workstations should suffer little interference from foreign users.
2.2. Scheduling Remote Capacity For Users Most schedulers concentrate on the response time or response ratio of individual jobs without considering
which users submitted the jobs. When the quality of service is based on the response times of jobs, users who submit the greater number of jobs in a steady stream are given a better quality of service. Work aimed at studying the quality of service the users obtain when they present varying demands to a system appears in papers by Kay and Lauder By881 and Klingner Ifllingner8 13.
Kay and Lauder describe the implementation of the Share scheduler [Kay88]. It is used to schedule jobs for a Unix based multiuser computer. Shares are allocated to users to represent their priority to computing capacity. Users receive resources according to the shares they possess. When users consume computing capacity, shares are taken away. The number of shaes allocated to users is detexmined by a system administrator. The rate of consumption of shares is a function of current and past resource usage.
I

8
This scheme relates to remote capacity allocation strategies we explore. However, the fair share scheduler operates on a multiuser computer, and does not have a dynamic processor bank to manage. The fair share scheduler does not need to deal with issues of how to distribute scheduling responsibilities as required for a processor bank. It does not manage resources owned by individual users who require little interference from foreign jobs.
A system that manages users’ access to several machines is the FOCUS scheduling system Wingner811. FOCUS gives users the view of several CRAY machines as a single production resource at the Los Alamos Computing Center. The computing resource is shared among major divisions of the laboratory according to the director’s allocations. It allows an organization to have control over which jobs are m within the organization’s allocation. Each organization is allocated a percentage of the total computing resource. FOCIJS schedules jobs with the goal that each organization receives the same percentage of total throughput from the processors as their predefined allocations. One problem with this approach is that it may be impossible to achieve the intended result if the resowe requirements of each organization differs significantly from their allocation. Those organization with large allocation may not have the demands that make it possible to achieve their prescribed percentage of processor utilization. Other organizations with smaller allocations but with larger demands may be forced to stifle their demands in order for the CPU utilizations to match the allocations.
Part of the duties of a long term scheduler is to allocate reservations to users. In our study of a reservation system for a processor bank, we introduce an economic model for allocating reservations. We are not the first to consider such an approach to study computer resource management problems. For example, an economic model has been used by Kurase, Schwartz, and Yemini lKurose85l for maximizing multiple access channel protocols of a communication network. A similar one by Ferguson, Yemini, and Nikolaou [Ferguson88] studies middle term sharing algorithms in a distributed system. In their systems, a competitive pricing scheme determines a device’s privilege for accessing either a computing or a communication resource. We will propose a different type of economic scheme for deciding how to allocate reservation capacity.
23. Recent Workload Characterizations In the next chapter we will show a characteIization of the availability of capacity at a processor bank. This
characterization differs from an assumption of exponential distribution, which is often used when representing a workload for performance evaluation studies. A number of researchers have observed that the CPlJ requirements of jobs on multiuser computers are not exponential. However, these studies profiled processes and not users’ activities. One example is of Leland and Ott IIAeland86] who presented a study from the observation of 9.5 million Unix processes and showed that the probability distribution of CPU time used is far from exponential. The distribution of CPU capacity used by processes was approximately l-rx-, where 1.05 c c < 1.25. Another example is presented by Zhou IZhou871 who traced Unix processes on a VAX 11/780@ computer. The trace included the arrival patterns and CPU demands of the jobs. The arrival and CPU demands were observed to have a large coefficient of variation.
Much of the study of long teIm scheduling for a processor bank is a new research area. This thesis provides new insights to the exploration of this area. The presentation in the next chapter looks at the characterization of workstation usage pattems, and demonstrates the feasibility of using their available capacity in the formation of a processor bank.
-_- UI VAX is a registered trademark of Digital Equipment Corporation.

CHAPTER 3
Workstation Usage Profile
3.1. Introduction A processor bank is valuable if its users have access to Iarge amounts of capacity for long intervals. The
amount of capacity depends on the utilization of workstations by their owners, and the willingness of users to donate their workstations’ resources. If a workstation is donated to the processor bank only when it has no local activity, the impact on the local activity of a workstation owner is minimized. Since the impact is minimized, owners are more willing to donate their workstations. We show that the processor bank will contain large amounts of capacity even if donations occur only during intervals that owners do not use their workstations locally. This result is obtained by profiling the usage patterns of a group of workstations.
To obtain a workstation usage profile, we monitored several stations at our deparunent for a period of 5 months. The information obtained by monitoring the stations provided insight on how workstations are used, and how much capacity is available. We profiled the distribution of workstations’ available and non-available intervals, and characterized the correlation between available and non-available intervals. We looked at how the availability on a station changes from hour to hour, day to day, and month to month.
Our study goes beyond understanding the amount of capacity available in the processor bank by examining the patterns of workstation activity in detail. Based on the analysis of the patterns of workstation activity, a model of the utilization of workstations as a stochastic process is developed. This model enables others to use realistic workload models when evaluating resource sharing policies for clusters of workstations. It is important to develop realistic workload models since a major component of any performance study is the workload used. No system evaluation study can avoid confronting the problem of modeling a workload Ferrari721. If inappropriate workload models are chosen when studying scheduling policies, then inappropriate results can occur. Also, when usage patterns are understood, algorithms can be designed that take advantage of those patterns.
In section 3.2 we describe the technique used for acquiring data about workstation usage. An analysis of this data is presented in sections 3.3 and 3.4. Section 3.3 describes the amount of available capacity and how it varies from hour to hour, day to day, and month to month. The distributions of workstations’ available and non-available intervals, and a characterization of their correlation are presented in section 3.4. A summary of the results regarding the workstation usage is given in section 3.5.
3.2. Technique Of Acquiring Data We have monitored the usage patterns of 11 DEC VAXstationII workstations running under Bexkeley Unix
4.2BSD over a period of five months from the first of September, 1986 to the end of the following January. The stations observed were owned by a variety of users. They wexe 6 workstations owned by faculty, 3 by systems programmers, and 2 by graduate students. Two additional stations used by systems programmers that were only available for monitoring from September through November have their traces included in the iesults reported.
We have obtained the profile of available and non-available periods of each of the workstations. An unavailable period, NA, occurs when a workstation is being used, or was recently used by its owner so that the average user cpu usage is above a threshold (one-fourth of one percent [Litzkow87al ) or was above the threshold within the previous 5 minutes. The average cpu usage follows the method the Unix operating system uses for the calculation of user load in a similar way as the ps(1) wnixl command (process status) computes the cpu utilization of user processes &itzkow87bJ. This load is a decaying average that includes only the user processes, and not the system processes. Activities resulting from programs such as time of day clocks or graphical representations of system load do not generate user loads that arise above the threshold. An available period, AV, occurs whenever a workstation’s state is not NA.
9

10
The workstation usage patterns were obtained by having a monitoring program executing on each workstation. The monitor on each station executes as a system job and does not affect the user load. The monitor on each woIkstation looks at the user's load every minute when the workstation is in the NA state. If the user's load is below the low threshold for at least 5 minutes, the workstation's state becomes AV. During this time the workstation's monitor will have its "screen saver" enabled. The monitor looks at the user's load every 30 seconds when the workstation is in the AV state. Any user activity, even a single stroke at the keyboard or mouse, will cause the "screen saver" to be disabled and all user windows on the workstation's screen to be redrawn. This activity brings the user load above the threshold, and causes the state to become AV. If no further activity occurs, approximately seven minutes pass before the station's state changes to AV. This is because it takes the user load average 2-3 minutes to drop below the threshold, and an imposed waiting time of 5 minutes. The waiting period is imposed so the users who stop working only temporarily are not disturbed by the "screen saver" reappearing as soon as they are ready to type another command. The waiting time is adjustable, but it has been observed that it is a good value to choose without causing an annoyance to users [Litzkow87a]. "his conservatively decides whether a station should be a target for remote cycles. Stations are idle much more than what appears in the AV state. The user load with the imposed waiting time is used as a means of detecting availability because the station should not be considered a source of remote cycles if an owner is merely doing some work, thinking for a minute, and then doing some more work. Otherwise a station would be a source of remote cycles as soon as the owner stopped momentarily. The workstation's owner would suffer from the effect of swapping in and out of her processes, and the starting and stopping activities of the remote processes.
The monitor keeps records of the workstation's last 100 state changes. Every ten hours, one of the workstations gathers the records from all other workstations and maintains a log for the entire workstation cluster. When records aie gathered from a Workstation, the user load is not affected. This is because the monitor on the workstation which sends the records executes as a system job. Because less than 9 state changes would occur within an hour because NA states last at least 7 minutes, we will not lose records due to our sampling rate. Some record were lost because a few stations had their monitors disabled for a short while, and then enabled later. This happened rarely and has little significance on our traces. During inteIvals when station monitors were disabled, the time was marked as an NA interval.
33. Monthly And Daily Variation Of Availability Of Workstations This section reports the amount of available capacity in the Observed cluster of workstations. The amount of
available capacity was large over the observed period, and varied little from month to month. There was variation on a daily basis, and from station to station.
The average amount of available capacity was moxe that 70% for the observed time. Table 3.1 shows the percentage of time each station was available for remote cycles from month to month. The row labeled as system gives the system availability of cycles. Notice how the system availability remained steady in the range 69-74'31. This means that there was a large steady amount of available cycles. The column and row labeled "COV" represent the coefficient of variation, which is the standard deviation of the availability divided by the average. The coefficient of variation was computed for each station and for each month. There was a small variation in most cases. Overall, the stations' availability was stable. Figure 3.1 graphically shows how some individual stations varied their availability, while the system availability remained steady. We emphasize that the actual idle time of the woxkstations was much larger than the available time reported. Ow available time value was conservative. Any user activity causes a workstation to be unavailable for at least seven minutes. If the seven minute interval for each busy period did not wcur, the system availability would increase approximately 4%. Therefore, if we were less consewative, there would have been greater observed availability.
The availability of remote cycles varied during the course of a day. It varied during the work week and the weekend. It is assumed that there would be a lot of available capacities during the evenings, and on the weekends when most people were not working. One might wonder if there was large available capacity during normal working times. Figure 3.2 shows how the availability of remote cycles varied during the week from Monday through Friday between 8am and 5pm (8-17 hour). It shows how some individual stations' availability changed during the day. Ea~ly in the morning the system availability was large, and then dropped to about 50% between 2-4 in the afternoon (14-16 hour). Even at the busiest time of the day thexe was a large amount of capacity to use. Figure 3.3 shows the system availability of capacity on the weekends between midnight and llpm (0-23 hour). It

11
September Machine
Name . Station I Station 2 Station 3 Station 4 Station 5 Station 6 Station 7 Station 8 Station 9 Station 10 Station 11 Station 12 Station 13- System cov
October 89 86 73 87 21 78 67 85 79 82 81 3
80 70
----...-- .-.- .-.-
0.4 -I
80 89 28 84 0
81 27 72 88 89 84 96 86 70 ---..-... 0.4
-- s Monitored. November
81 91 26 85 45 74 87 70 83 82 86 17 75 69
-...-. .- -..-..._.-
.- 0.4
-..-- !ercent of Ti .- December
88 94 63 86 45 63 57 70 85 80 81
----- 74 ---- 0.2 .--
---- e In Avail Jannary-
84 90 67 81 32 69 91 47 80 78 86
- ------..- 73 0.3 -.-
Table 3.1: Availability Of Stations From Month To Month.
loo 1
t I '\ \
\ a 501 \ g
j l /
I \
,I--- System Station 1 / . - --' - ___,__.__, Station 2
-. - .-- Station 3
\ \
I \ L '.-I .-_ _., ,J
30
7-- I - - - - ' F - - ' - - 7
Sept. Oct. N O ~ . Dec. Jar Month
-
e
_I.----..--.....----.-....-
Figure 3.1. Availability Of Remote Cycles (Month To Month)
ile State Average
84 90 51 85 29 73 66 69 83 82 84 39 80 71 --
0.3 -..--
- cov 0.1 0.0 0.4 0.1 0.6 0.1 0.3 0.2 0.0 0.1 0.0
.-
confirms the intuition that there was a larger amount of capacity available at those times. The availability on weekends was between 70-80%. The busiest time for the workstations on weekends is shown to be between 2pm and 5pm (14-17 hour).

12
e \
/ I \ I
8 9 10 11 12 13 14 15 16 17 Hour
0 3 6 9 12 15 18 21 24 Hour
Figure 3 . 2 Availability of
(Mon-Fri, 8am-5pm) Remote Cycles During Weekdays
Figure 3.3: Availability of Remote Cycles During Weekends
(Sat-Sun)
A xemote capacity scheduler is likely to want to know on an hourly basis how individual stations are used. It might wish to know the likelihood that a job placed at a station will be preempted in the next hour. Table 3.2 gives a profile of the utilization of individual workstations over one hour intervals. A station's utilization of an hour is the percentage of the hour the station was in the NA state. It shows that overall, 53% of all individual hours were NA for less than 6 minutes (O-10% of the hour). Twenty-one percent of all hours were NA for more than 54 minutes (90-100% of the hour). This information means that if each hour was observed individually, a station was likely to be available for almost the entire 60 minutes, or was busy for the whole hour.
As in Table 3.1, the row labeled "COV" is the coefficient of variation. Across all the stations, the variation of the utilization of the hours was small with the exception of the hours that were 10-20% and 90-100% utilized. Although most stations were often busy for the entire hour if they were busy at all, the larger variation in the 90- 100% utilization occurred because some infrequently used stations such as stations 1 and 2 were rarely kept busy for an entire hour at a time. The large variation in the 10.20% category occurred because some stations, such as station 3, automatically ran short programs periodically even when the owner was not at the console. These programs kept the station unavailable for at least 7 minutes of an hour so that the utilization was 10-20%. Most stations do not have these program, and therefore we observe a greater variation for this utilization category.
In addition to the utilization of individual stations, the utilization of the entire system is of interest to a remote capacity scheduler. It would be beneficial to know the relative frequency distribution of the system utilization, SUl , of all intervals of length I . The system utilization during an interval is the average number of stations in the NA state during the interval divided by the total number of stations. The SU, would help a scheduler estimate the fIaction of the system capacity that is available for the next I minutes. Of special interest, the SU, would help a scheduler know how likely all stations would be in the NA state simultaneously. Our analysis of the traces of the stations shows that it was highly unlikely that all stations were in theNA state at the same time. The 11 stations that were monitored for the entire measurement pexiod were examined. We observed that during the five months the system was monitored, the longest period in which no station was available was 10 minutes. This means that from a practical point of view,

13
- - _ -
Machine Name 40-
50 2 2 2 2 4 2 1 3 2 2 1 1 1
station 1 station 2 station 3 station 4 station 5 station 6 station 7 station 8 station 9 station 10 station 11 station 12 stations 13 ---
50- 60 2 2 2 2 3 2 1 3 2 2 1 1 1
-..-...-__
..--.-_3.._....-- Average cov --
30 3 3 2 3 8 7 2 6 3 5 1 1 2
- 0- 10 72 72 8
73 10 46 59 41 69 59 67 55 58 53 - - 0.4 -..---,.
40 3 3 2 2 5 4 1 5 2 3 1 1 1
-._-_-.-.-
- 10-
20 8 8 44 7 4 17 3
13 5 14 5 2 3
--
3 1 2 1 2 1 2 1 1 0.5 I 0.3 I 0.4 I 0.5 I 0.4
Percentage 20- I 30-
2 21 . 0.1 0.8
is Util 60- 70 2 2 2 2 3 4 1 4 1 2 2 1 1
-
--
ation gg-T 2 1 2 2 2 1 3 1 1 1 1
2 2 2 4 3 1 3 2 2 2 1
3 36 7
58 11 31 18 14 9 19 37
1 I 1 1 3 1
Table 3.2 Utilization Of Individual Stations For One Hour Periods.
there was always one or more stations available. The longest period that one would have to wait for 2 stations to become available was 25 minutes. The longest period that one would have to wait for 3 stations to become available was 2 hours.
Table 3.3 shows the relative frequency distribution of the system utilization for intervals lengths of 60 minutes, 30 minutes, 10 minutes. and 1 minute. Notice that the system utilization was less than 40% for almost 80% of all hour intervals. This means that the probability that at least 6 stations were available is almost 80%. There was never an hour where the average number of NA stations was greater than 9 stations.
Figure 3.4 shows how on an hourly basis the system utilization and individual station utilization compare. The solid curve in the figure comes from data in Table 3.3 and the dashed line comes from data in Table 3.2. Individual stations were likely to be AV or NA for entire hours, while the system was likely to have a total of 2-4 stations in the NA state. Because individual stations are likely to be either AV or NA for the entire hour, the prediction of whether a station is available for an entire hour can be approximated by a Bernoulli distribution. We can view the station as having a probability p that it is in the NA state, and 1-p that it is in the AV state. If we
10 ip< 20 20 sp< 30 30 <p< 40 40 Ip< 50 50 <p< 60 60 Ip< 70 70 Ip< 80 80 Ip< 90 90 <p<100 -
1.6 0.3 0.0
4.4
0.4 -_
.--
... El. 18.0 24.6 22.7 13.4 7.8 5.7 4.0 2.3 1.1 0.4 ----
,I
Table 3.3 Relative Frequency Distribution Of System Utilization, SU

14
r---i I 1 , I I 1 I 1 I t I 1
0 10 20 30 40 50 60 70 80 90 10( Utilization
Figure 3.4: System And Individual Station Utilization
P e
e
o 30 f
H 20
10
0 u
s
0
Binomial - - .. -- ., -. Bernoulli ---
I , I : ! L1 I 1 I
1 20 30 40 50 60 70’80 90 lo( Utilization
Figure 3.5 Bernoulli and Binomial Probability Density Functions
assume that the behavior of each station is independent, then the probability that k stations are in the NA state, n k , can be approximated by the binomial distributiop
The dashed line in Figure 3.5 is the BernoulliCdensity funchon for p = 0.3 and the solid line is the conesponding binomial density function. This BemouIli density function with p = 0.3 is shown because the utilization of the individual stations was more than 50% for approximately 30% of the hour intervals observed. Notice the similarity of the shapes of the curves in Figures 3.4 and 3.5. This indicates that the stations can be viewed as independent and the system utilization can be approximated by a binomial distribution.
Large availability of system capacity means that if a long running sequential job can be distributed, several stations are likely to be available to serve it. Suppose a user has a job that would execute on a station for 5 hours. Because it is very likely that more than 6 stations are available simultaneously for an hour interval, a version of the long running job distributed into 6 or more processes is likely 10 be able to acquire enough available processing cycles to complete within an hour.
3.4. Model of Workstation Usage Patterns We want to represent the usage patterns of the workstations as a stochastic process so it can be used to model
availability a processor bank. Such a model can be used in performance evaluation studies of processor banks, or to support design decisions of resource management algorithms that rake advantage of knowing the properties of the usage pattern. A model improves the quality of the prediction of the amount of available remote capacity. With the workload modeled as a stochastic process, we do not need to use traces to drive simulation models.
In order to define a stochastic process we have to know the distxibutions of AV and NA state lengths, and how state lengths are correlated. The data gathered from each workstation was analyzed to determine the relative frequency distributions of the AV and NA state lengths. Individuals stations were analyzed and the characteristics of their distributions are reported. We show how the length of AV intervals was correlated to the length of subsequent

15
NA intervals, and vice versa.
3.4.1. Distribution Of Usage Patterns A graph of the cumulative relative frequency of the AV states for all of the stations during the entire time
monitored is shown in Figure 3.8 (the solid line). For each time t on the horizontal axis, the corresponding percentage on the vertical axis is the percentage of AV intervals that were less than t+l minutes. The figure shows that there were many short AV intervals of less than a few minutes and many very long intervals of an hour or longer. The solid line curve in Figure 3.9 shows the cumulative relative frequency of NA state lengths. As in Figure 3.8, for each time t on the horizontal axis of Figure 3.9, the corresponding percentage on the vertical axis was the pexcentage of NA intervals less than t+l minutes.
When we look at Figures 3.8 and 3.9, we notice that there were many short intervals for both the AV and NA graphs. This leads us to believe that a signi6cant component in the relative frequency was from shoxt intervals. However, there were more long intexvals than what one would expect to see in an exponential distribution. The graphs show that the percentage of intervals larger than one hour is greater for AV intervals than for NA intervals. In Figure 3.8 we see that there was a large number of AV intervals beyond 5 hours long (300 minutes). This leads us to the belief that the AV periods were dominated by three types of periods: short, medium, and long. For the NA periods we have identified two types of periods: short and long. With this intuition, we seek to match a distribution to each of the relative frequencies observed. Figures 3.8 and 3.9 appear to have exponential components because they increase similarly to an exponential distribution and have long tails. A mixture distribution of exponentials seems to be a good candidate to fit the observed data privedi821. This distribution is sometimes referred to as a k- stage hyperexponential distributions, when the distribution has k components Kobayashi8 I]. The k-stage hyperexponential distribution function of a random variable T is defined as
1001
C - Monitored Data n ----- Fitted Distribution t
g e 30 "i 20
- o i20 x u t : 6 o 480 600
Figure 3.8: Distxibution of AV State Lengths of All Stations
P e r
e n t a g e
C - Monitored Data 501i ----- Fitted Distribution
4011 30
2 0 ~ 10
0 120 240 360 480 60C Minutes
I
Figure 3.9: Distribution Of NA State Lengths Of All Stations

16
i =k i=k
i=l i =1 F ( T ) = X q F i ( t ) , where Fi(r)=l--e-Lr, and Xq=1. (3.1)
We look for a k-stage distribution that fits our monitored data well and has a small number of components. Each component i of a k-stage distribution introduces two parameters that must be adjusted Xi and ai. On one hand, the more components introduced the better the fit is, but on the other hand it is more complex to assign values to a large number of parameters. It is important to capture the characteristics of a relative frequency distribution with as few components as possible. For the AV relative frequency distribution, a good match was achieved by using a 3-stage hyperexponential distribution. The stages represent the small, medium, and large AV intervals. The components were assigned the expected values of 3,25, and 300 minutes. Short intervals occurred when users did some work, and then stopped to think for a while before resuming the use of their workstations. Medium intervals were the result of users leaving their desk for short intervals, or stopping to do other work during the day. Since users left their offices in the evening and weekends, scheduled long meeting, and taught or attended classes, long available intervals occurred. Weights were assigned by using a least-squares fit [James771 for these components to obtain the following 3-stage distribution
-1 - -I -r F (T~)=0.33(1-e '?)+0.44(1-e E}+0.24(1-e 300).
The small component contributes to 113 of the distribution. The larger components account for 2/3 of the distribution of which a little less than 213 is the medium component, and the remainder is the largest component.
Figure 3.10 shows the march of the cumulative distribution to the monitored traces for AV intervals smaller than 60 minutes. The curve derived analytically for Figure 3.10 was generated from equation 3.2. The distribution of intervals that were less than 60 minutes is an important portion of the distribution to match. This is the region where one must study to determine whether it is waIthwhile to use in forming a processor bank. Intervals that were several hours long couId be broken into two intervals which are both longer than an hour and it would not greatly affect any remote capacity allocation strategies. We see that the match is excellent between the two curves. Figure 3.8 shows the match for AV intervals that were up to 600 minutes in length. The overall difference between the fitted distribution and the relative' frequency distribution is very small.
Less complexity is introduced when matching the NA intervals because its relative frequency distribution has fewer long intervals. A good match for the NA intervals, TNA , is obtained if we use a 2-stage hyperexponential distribution. The two components have the expected values of 7 and 55 minutes. The short component is the result of frequent short activities. The user typed a few simple commands and then stopped to do something else. The user might have had some jobs that executed for short intervals even when she was not at the station. These short jobs contributed to the user load which briefly made the station unavailable. The long components are the result of prolonged activity by the user. Long intervals occurred if the user had long running jobs to execute, which continued to execute even when the user was away fiom the station. Since each NA interval lasted at least 7 minutes, the distribution is modified so that the probability that an interval is less than 7 minutes is zexo. The distribution of NA intervals is defined as
-t -r
0.68(1--e -i-)+0.32( 1-e z), if t 21 ( T N A = 0, if ort <7. (3.3) [
Figure 3.1 1 shows the match between the cumulative distributions of TNA and the monitored relative frequency for NA intervals less than 60 minutes. The curve derived analytically for Figure 3.11 is generated from equation 3.3. The match in Figure 3.11 is very good. Figure 3.9 shows the match for NA intervals that were up to 600 minutes in length.
Beyond the first five minutes, the greatest amount the fitted curve in Figure 3.8 deviates from the curve of the monitored data at any point is approximately 2.5% from below and 1.0% from above the monitored data. For Figure 3.9, the greatest the fitted curve deviates beyond the seven minute interval from the observed data is 1.0% from below and 1.5% from above. By using the Kolmogorov-Smirnov test (KS test) for curve matching [KnuthSl], we calculate the likeliness that our observed data could be generated from a random sequence of our fitted

17
20 - 10-
distribution. If random sequences were generated from the distribution of equation 3.2, it would have approximately an 45% chance of deviating from below as much as our monitored data, and an 85% chance from abve. Random sequences generated from a distribution like equation 3.3 would have approximately an 85% chance of deviating from below, and an 80% chance from above as much as our observed data These ranges mean that random sequences with distributions of equations 3.2 and 3.3 are likely to deviate as much as our monitored data This gives added confidence in using equations 3.2 and 3.3 as matches for our observed data. We believe that equations 3.2 and 3.3 can serve as means of artificially describing AV and NA interval characteristics for studies involving remote allocation strategies of workstations in a processor bank.
Each individual workstation had its own usage patterns. The pattern of some stations varied greatly from the others. Nevertheless, each workstation can be characterized by its own mixture distribution as defined,by equation 3.1. Each workstation had three components for its AV interval characteristics, and two components for its NA intervals. A good fit was obtained for each station taken individually. Although the magnitude and contribution of each component varied, each station had a AV short component with expected values that ranged from 3-5 minutes, a medium component that ranged from 25-60 minutes, and a large component that ranged from 150-600 minutes. All stations followed these characteristics except two, which were station 5 and station 12. Stations 5 and 12 were available very little, and did not match well with these ranges. Station 12 had an unusual large number of short AV and NA intervals. Without station 12, the overall relative frequency distributions would have fewer very short intervals, but there would stil l be a three-component hyperexponential distribution that matched the AV and a two- component distribution to match the NA intervals. The same exponential distributions would be used with only a small difference in the weighting of each component. For the NA components, all other stations had short components ranging from 7-11 minutes, and long components &om 45-95 minutes. The station's long NA components were between 45-55 minutes.
P e r
e n t a g
C
e
I
I i
1° i 04--l--r- . 1
0 10 20 -30 40 50 60 Mrnutes
P e r
e n t a g e
C
'0°1
0 10 20 30 40 50 60 Minutes
Figure 3.10 Distribution Of AV State Lengths Of All Stations
Figure 3.11: Ilistribution OPNA State Lengths O F All Stations

18
3.4.2. Correlation Of Available And Non-Available States When we build an artificial workload generator, information beyond the distribution <f the states is needed.
Given that distributions that closely match the observed distributions of the two types of intervals can be generated, we need to know how the length of AV and NA intervals correlate. What can the length of the current interval tell us about the length of the next interval?
Pairs of NA and AV periods weIe analyzed to deteImine whether such a correlation exists. We looked at the traces and labeled AV intervals as short, medium, or long samples. All samples that were less than 9 minutes were labeled short samples. (Ninety-five percent of intervals of an exponential distribution with mean of 3 minutes are less than 9 minutes.) Intervals greater than 9 minutes and less than 75 minutes (which is the 95 percentile of an exponential of the medium distribution with mean 35 minutes) were called medium samples. The remaining available AV samples were labeled large samples. We similarly class5ed NA samples less than 21 minutes (the 95 percentile of an exponential distribution with mean of 7 minutes ) to be short samples, and the remaining samples long.
With this labeling method, we show a conditional probability graph in Figure 3.12. It shows that 41% of all AV samples were short, 36% were medium, and 23% were long. Equation 2 weighted the components as 32% short, 44% medium, and 24% long. Our labeling gave a greater peIcentage of sho1.t intervals than what appears in equation 3.2. This was expected since some intervals from the medium and long components are less than 9 minutes in length and therefore counted as short. This is demonstrated in Figure 3.10 by the curve generated by the distribution function of equation 3.2. About 41% of its intervals shown in Figure 3.10 are less than 9 minutes. Of the NA samples, Figure 3.12 shows that 74% were short, and 26% were long.
We show how NA periods followed AV periods in Figure 3.12. The conditional probability distribution is very close to the unconditional probability distribution. ShoIt, medium, and long AV periods followed NA intervals in approximately the same propoItion that they occurred. From this graph there does not appear to be a correlation between the length of the AV and NA peIiods. This observation was verified by computing the correlation coefficient [Knuth81] of NA and AVperiods. It was a very small positive value.
Although the AV and NA intervals were uncorrelated, pairs of AV intervals, and pairs of NA intervals were correlated. An AV pair is two AV periods that are separated by a single NA period. Likewise, an NA pair is two NA periods that are separated by a single AV period. A correlation was expected because of Ihe way individuals use their workstations. Users tend to have a cluster of shoIt idle periods, or a cluster of several long idle periods. Some
I I
I I AVAILABLE I NOT-AVAILABLE I AVAILABLE
Figure 3.12. Conditional Probability of AV, NA State Changes

users work on their workstations infrequently, so they have mostly long AV intervals separated by long or short NA intervals. Figure 3.13 shows the conditional probability graph of AV pairs. Short AV intervals were more likely (64%) to be followed by short AV intervals. Medium AV intexvals were more likely (52%) to be followed by medium AV intervals. Similarly, long AV intervals were more likely (48%) to be followed by long AV intervals. Furthermore, if a long interval was not followed by a long interval, then it was more likely to be followed by a medium interval instead of a short interval. Short, medium, and long AV intervals were nearly twice as likely to follow the corresponding short, medium, or long AV interval than any other kind of AV interval. A correlation also existed for the NA intervals as shown in Figure 3.14. However, it was much less significant. Short NA intervals followed short NA intervals only slightly more than they followed long NA intervals.
3.43. Development Of Stochastic Models From the results we can define a family of models that describe the behavior of the users at different levels of
accuracy. A first approximation is a model where state times are independent random variables. In this model, the
AVAILABLE AVAILABLE
I I
I I
'AILABLE

20
state lengths are distributed exponentially. The expected value of the distribution is the mean of the observed AV and NA state lengths.
A better model includes the observations that 3-stage and 2-stage hyperexponential distributions closely fit the relative frequency distributions of the AV and NA state lengths. In this model the distribution of the state lengths of the first approximation are replaced by the 3-stage and 2-stage hyperexponential distributions.
A more accurate model takes into account the correlation of the state lengths. This leads to our stochastic model of workstation usage. The length of the next AV period depends on the length of the current AV period. Likewise, the length of the next NA period depends on the length of the current NA period. In this model, the type of next interval, whether it is small, medium, or large, is based on the conditional probabilities described in the conditional probability diagrams of Figures 3.13 and 3.14. When the next interval’s type is known (small, medium, or large), the next sample’s length is specified as a random sample from an exponential disaibution that is a component of equations 3.2 or 3.3 that represent the sample’s type. For example, long AV samples are chosen from an exponential distribution that has an expected value of 300 minutes.
Further accuracy can be introduced into the model by giving each workstation its own distributions and correlations of state lengths. A workstation’s availability depended on the time of day, and the day of the week A model which includes this information is more complex, and more precise. We plan to continue our study to understand if further complexity is necessary in order to capture the characteristics of workstation availability.
3.5. Summary From observing a cluster of workstations, we have shown that a processor bank has huge capacities to share.
The system availability was approximately 70% for the time observed. Although availability varied from station to station, the variation of each station was typically small. The system availability was stable from month to month. Not only during evenings and weekends was the availability large, but also during the busiest times of weekdays. When stations were observed for hour intervals, they typically were available for mos‘t of the hour, or unavailable for the entire hour.
We have presented the profile of the workload of a processor bank formed from workstations and a stochastic model that matches this pmfile very closely. Since performance evaluation studies are critically dependent on the workload processed by a system, the workload descxiption is especially important.
The model of workstation activity presented is based on the observed distributions of AV and NA intexvals, and their correlation. An exponential distribution does not adequately represent the relative frequency distributions of AV and NA state lengths. Observations pxesented in this chapter show that a 2-stage and 3-stage hyperexponential distribution fit the relative frequency distribution extremely well. The components that characterize the workstations’ AV intervals have expected values of 3, 35, and 300 minutes. NA intervals are derived from short and long exponential distributions with expected values of 7 and 55 minutes. The length of AV intervals was not correlated with the length of NA intervals, but the length of pairs of AV and pairs of NA intervals were correlated. The stochastic model presented captured this correlation of interval lengths of the workstations. Additional observations show that each workstation has its own distributions of AV and NA patterns. The complexity of a stochastic model depends on the level of details of observed behavior included in the model. A more complicated model would include these observations. However, the choice of a model should be one that captures the characteristics of the observed behavior with the least amount of complexity.
This chapter has shown the amount of capacity that can potentially be shared through the processor bank. The next chapter explores that design of a long term scheduling system that takes advantage of the capacity in the processor bank.
CHAPTER 4
Sharing the Resources of a Processor Bank
4.1. Introduction Given the large amount of capacity available in a workstation cluster, as shown in Chapter 3, the potential
amount of capacity that can be donated to the processor bank is huge. We present in this chapter a design of a long term scheduling system to harness this potential. The design shows our approach of allocating capacity of a processor bank to users.
The amount of capacity that users want from a processor bank differs greatly among individual users. We observed that some users try to acquire as much capacity as they can for long periods, while other users want capacity only occasionally. The diverging demands for capacity among users influences our design of a capacity allocation algorithm. Our capacity allocation algorithm, called the Up-Down Algorithm, gives heavy users a large amount of capacity while protecting the high quality of service of light users. The Up-Down algorithm maintains a high quality of service for light users in spite of a large continuous demand for cycles by heavy users. In contrast to the Up-Down algorithm, naive algorithms cause light users' quality of service to degrade. The Up-Down algorithm trades off reward (remote capacity allocated) and penalty (waiting time suffered when a resource is wanted but denied).
To evaluate the quality of service that allocation algorithms provide for users, we use the Remote Cycle Waif Ratio criterion. The remote cycle wait ratio is the amount of remote execution time a workstation user receives divided by his wait time. ?'he remote execution time of a workstation user is defined as the total remote processing time allocated to the workstation user. The wait time is the amount of time the workstation user wanted remote cycles but had no cycles allocated. This criterion guards against the domination of computing cycles by heavy users. Algorithms that protect the high quality of service of light users will have a steady remote cycle wait ratio for light users even though heavy users increase their demand of remote capacity. A decrease in the light users' remote cycle wait ratio occurs for algorithms that do not protect light users' high quality of service.
Section 4.2 discusses the design issues of the system and the decisions made to resolve these issues. Part of the design is the algorithm for allocating available capacity from the processor bank. A model of the system used to study allocation algorithms is given in section 4.3. The performance of the Up-Down algorithm, used for allocating the capacity of the processor bank, is presented in Section 4.4. Section 4.5 gives a summary of the design.
4.2. System Design Within our department there are many users working on problems that need large amounts of computing
capacity. A few example problems include studies of load-balancing algorithms [Krueger88], simulation of real- time scheduling algorithms [Chang85], studies of neural network learning models [Sandon87], and mathematical combinatorid problems [Chavey86]. These jobs typically require several hours of CPU time and IittIe interaction with their users. We designed our system to serve these users by executing their background jobs at available woIkstations in a processor bank. In order to make our system attractive to these users, several issues must be addressed. First, the placement of background jobs should be tiansparent to users. The system should be mspnsible for knowing when workstations are available and users should not need to know where their remote jobs execute. Second, if a remote site running a background job fails, the job should be restarted automatically at some other location to guarantee job completion. Third, since an owner's workstation can serve as a source of remote cycles for others when it is not used by its owner, the owner expects to receive fair access to cycles when he wants remote capacity. Fourth, the mechanisms implementing the system are expected to consume very little capacity. Otherwise users would not allow their workstations to be part of a system if it interferes with their local activity.
We will describe our remote job execution and recovery facilities, and the method of job scheduling. We begin with a description of the structure of the scheduling system.
21

4.2.1. Scheduling Structure
22
The remote job scheduling structure s.mld be transparent to the user. When users have background jobs to mn, they should not need to request the remote machines explicitly or know on which machines their jobs are placed. A wide spectrum of scheduling structures could provide this objective. On one end of the spectrum, a centralized, static coordinator would assign background jobs to execute at the processor bank. The cooxdinator would gather system information in order to implement the long-term scheduling policy that the system administrator has chosen. It would know which jobs were waiting and which were executing, and the location of available stations. At the other end of the spectrum is a distributed approach. The assignment of available processors is accomplished by each workstation cooperating to conduct a scheduling policy. This approach requires negotiations among the workstations to resolve contentions for the available processors,
Both the centralized and the distributed approaches have well known advantages and disadvantages. The centralized approach can efficiently decide which job is next granted processor bank capacity because each job submitted is registered with the central coordinator. The central location knows both the number of available workstations in the processor bank and the number of jobs demanding service. The important duties of this location require that it is protected from users so that they do nor have direct access to it. Direct access compromises the security of the scheduling policy. A system with a static central coordinator that keeps all jobs’ state and workstation availability information is not easily extendible and is critically subject to failure. If the central coordinator fails, all scheduling in the system would cease. In the distributed scheduling system, each requesting workstation does its own searching for processor bank capacity. Message exchanges among contending workstations would be required to place jobs at available workstations. This is less efficient than a centralized scheme when deciding which job should be next allocated a processor. However, the distributed scheduling approach is not subject to failure if a single station quits operating.
We have decided to follow an approach for structuring the background job scheduler that lies between a centralized, static approach and the fully distributed approach. This approach uses the efficiency of scheduling with a central node to avoid the overhead of messages to decide which workstations should be allocated available capacity. The jobs’ state information is kept at individual workstations. Each workstation has the responsibility of scheduling its own jobs. A workstation decides which jobs in its queue have the highest pIiority, The central coordinator merely assigns capacity to wokstations which they use to schedule their own jobs.
Figure 4.1 illustrates our approach to structuring the system scheduling. On each workstation is a local scheduler and a background job queue. The jobs that the user submits are placed in the background job queue. One workstation holds the central coordinator in addition to a local scheduler and background job queue. In our implementation which will have a performance profile presented in Chapter 5, every two minutes the central coordinator polls the stations to see which stations are available to serve as sources for remote cycles, and which stations have background jobs waiting. Between successive polls, each local scheduler monitors its station to see if it is available to be donated to the processor bank. If a background job is running on the workstation, the local scheduler checks every ?4 minute to see if the background job should be preempted because the local user has resumed using the station. If a user has resumed using the station (the workstation is removed from the processor bank), the local scheduler will immediately preempt the background job so that the user can have the workstation’s capacity under his control. The central coordinator allocates capacity from available workstations to local schedulers on workstations that have background jobs waiting. A local scheduler with more than one background job waiting makes its own decision of which job should be executed next.
Our structure follows the principle that workstations are autonomous computing resources and they should be managed by their own users. This also helps to keep the responsibilities of the coordinator simple. Simplicity is important so that a central site is not required to maintain a great amount of information about each woxkstation. This allows the system to be extendible to a large number of workstations and eases the required recovery when the centralized coordinator fails. Local schedulers are not affected if a remote site discontinues service. If the site on which the coordinator is executing fails, remotely executing jobs initiated and executing on olher machines are not af€ected. Only the allocation of new capacity to xequesting users is affected. Since the coordinator has few duties, its recovery at another site is simplified in relation to a fully centralized strategy. In order to balance the burden of coordination, the central coordinator can be moved to other locations. However, we have observed that the coordinator contributes less than 1% to the CPU consumption of a workstation so that there is probably little need to move the coordinator.

23
. . . . . . . 1
Figure 4.1: The Scheduling Struchue.
In order to schedule jobs remotely, a remote execution facility is needed. Since our workstations operate under the Berkeley BSD 4.3 Unix operating system, we decided to have a remote execution facility that is compatible with our local job execution facility. This led to the development of the Remote Unix (RU) facility [Litzkow87b]. The RU facility is implemented outside of the kernel of the Unix operating system. No modifications are needed to the user program. A program executed by the RU facility must first be linked with a library to handle the remote system calls.
4.2.2. The Remote Unix (RU) Facility Remote Unix turns available workstations of a processor bank into cycle servers. When RTJ is explicitly
invoked, a shadow process runs locally as the surrogate of the process running on the remote machine. Any UniX system calls of a program on the remote machine invokes a library routine which communicates with the shadow process. A message indicating the type of system call is sent to the shadow process on the local machine.
The Remote Unix for workstations which was implemented by Litzkow Lzitzkow871 is based a system implemented by Virgilio and Neuhengen for the Crystal [DeWitt87] Multicomputer. On the Crystal Multicomputer system, jobs could be executed remotely on Crystal nodes. AlLsystem calls of the job would be executed by the shadow on the host which sent the job to the Crystal node.
When someone resumes using a workstation that is executing a remote job, the job must be stopped. If the state of the stopped job is not preserved, as is the case in the Butler system INichols871, all the work accomplished by the job is lost. Because background jobs can require several hours of capacity, it is important that the system restart background jobs without losing all the woxk previously accomplished. In our system, the intermediate state from which background jobs can be restarted is made possible by a checkpointing feature of the RU facility.
4.2.3. Checkpointing The RU facility checkpoints jobs when they are removed from remote locations. The checkpointing of a
piogram is the saving of the state of the program so that its execution can be restarted. The state of an RU program is the text, data, bss, and the stack segments of the program, the registers, the status of open files, and any messages sent by the program to its shadow for which a reply has not been received. In our system, we do not need to save

24
messages since checkpointing is deferred until the shadow's reply has been received. The text of the program contains the executable code, the data segment contains the initialized variables of the program, and the bss segment holds the uninitialized variables. Because it is assumed that there is no self-modifying code in the program, the text segment remains unchanged during the execution of the program. Therefore the text segment is expected not to be essential in a checkpoint file. However, programs can execute for a very long time, perhaps months. A user might want to modify a program that has its executable file running as an RU job. For this reason, we save the text segment. Otherwise, the user would have to make sure that the new program's executable file is given a new name when thexe is an old version running.
An important component of the checkpointing facility is how it manages files used by a job. As with all system calls, interactions with files are handled by the shadow process. The shadow maintains information of the name, descriptor, position, and flags of all open files. When a job is restarted from the checkpoint, the state of the files can be restored as they were at the time of the checkpoint.
The checkpointing feature for the system is an evolution of a checkpointing feature that we implemented for the remote system call facility of the Crystal Multicomputer. Our implementation allowed two different ways to trigger the saving of a checkpoint. It could be triggered external by sending a "checkpoint" signal to the Iemote site, or internally by the expiration of a checkpoint timer. The value of the checkpoint timer could be set as a command line argument when the job was submitted to the system.
43. Allocation of Capacity of the Processor Bank We want to evaluate methods that the coordinator uses to allocate processor bank capacity to workstation
users. We need to model our long term scheduling system in order to study its behavior and evaluate its performance. Ow model for the study of long term scheduling algorithms consists of a processor bank formed from a cluster of workstations. Table 4.1 shows the parameters of the model. The number of workstations is designated by NumWorkstations. Workstations will either be in the AV, or NA state. These states are determined by the workstation workload pattern obtained by the traces as discussed in Chapter 3. If the workstation's state is AV, it can be executing a background job or waiting to receive a background job for execution.
The background jobs of station i have exponentially distributed service times with mean servemean(i). We model two different types of background job arrival pattens. One type is where jobs arrive according to a Poisson process to station i with interarrival mean arrive(i}. This arrival pattern represents light users. The other type of loading pattern models heavy users. A heavily loaded workstation will have a permanent number of jobs it wants executed. The number of permanent jobs of station i is NumPennanent(i}. When a job of a heavy user completes, another job will immediately appear.
The cluster of workstations has a scheduling coordinator to assign remote cycles to workstations. It determines which workstations request remote cycles and which is willing to supply remote cycles. The coordinator resolves contention. When remotely executed jobs complete, the coordinator will check to see if other woxkstations
-..--.-...--
NumPermanent(i)
Schednterval JobTransferCost
-_-..-..--- .---.-.-. __- -.- Meaning
Exponentially distributed mean service time at workstation i
Exponentially distributed mean interarrival time of jobs at workstation i
Number of jobs workstation i permanently wishes to execute
Periodic scheduling interval for the coordinator Time it takes to checkpoint a job and
move it remotelv
i
I NumWorkstations 1 Number of workstakons simulated ---- Table 4.1: Simulation Parameters.
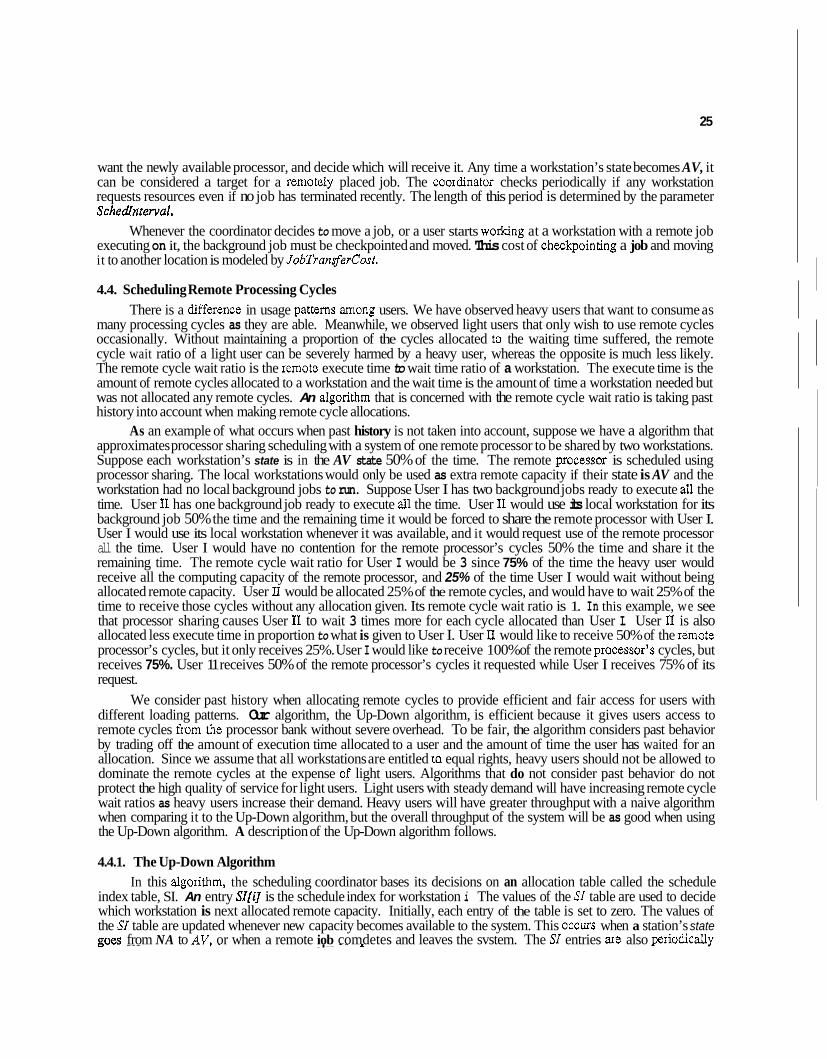
25
want the newly available processor, and decide which will receive it. Any time a workstation’s state becomes AV, it can be considered a target for a Iemotely placed job. The cooIdinator checks periodically if any workstation requests resources even if no job has terminated recently. The length of this period is determined by the parameter Schedlnterval.
Whenever the coordinator decides to move a job, or a user starts working at a workstation with a remote job executing on it, the background job must be checkpointed and moved. This cost of checkpointing a job and moving it to another location is modeled by JobTransferCost.
4.4. Scheduling Remote Processing Cycles There is a diffeIence in usage patterns aniong users. We have observed heavy users that want to consume as
many processing cycles as they are able. Meanwhile, we observed light users that only wish to use remote cycles occasionally. Without maintaining a proportion of the cycles allocated to the waiting time suffered, the remote cycle wait ratio of a light user can be severely harmed by a heavy user, whereas the opposite is much less likely. The remote cycle wait ratio is the Iemote execute time to wait time ratio of a workstation. The execute time is the amount of remote cycles allocated to a workstation and the wait time is the amount of time a workstation needed but was not allocated any remote cycles. An dgorithm that is concerned with the remote cycle wait ratio is taking past history into account when making remote cycle allocations.
As an example of what occurs when past history is not taken into account, suppose we have a algorithm that approximates processor sharing scheduling with a system of one remote processor to be shared by two workstations. Suppose each workstation’s state is in the AV state 50% of the time. The remote processor is scheduled using processor sharing. The local workstations would only be used as extra remote capacity if their state is AV and the workstation had no local background jobs to run. Suppose User I has two background jobs ready to execute all the time. User I1 has one background job ready to execute all the time. User I1 would use its local workstation for its background job 50% the time and the remaining time it would be forced to share the remote processor with User I. User I would use its local workstation whenever it was available, and it would request use of the remote processor all the time. User I would have no contention for the remote processor’s cycles 50% the time and share it the remaining time. The remote cycle wait ratio for User I would be 3 since 75% of the time the heavy user would receive all the computing capacity of the remote processor, and 25% of the time User I would wait without being allocated remote capacity. User II would be allocated 25% of the remote cycles, and would have to wait 25% of the time to receive those cycles without any allocation given. Its remote cycle wait ratio is 1. In this example, we see that processor sharing causes User I1 to wait 3 times more for each cycle allocated than User I. User I1 is also allocated less execute time in proportion to what is given to User I. User I1 would like to receive 50% of the Iemote processor’s cycles, but it only receives 25%. User I would like to receive 100% of the remote pIocessor’s cycles, but receives 75%. User 11 receives 50% of the remote processor’s cycles it requested while User I receives 75% of its request.
We consider past history when allocating remote cycles to provide efficient and fair access for users with different loading patterns. Our algorithm, the Up-Down algorithm, is efficient because it gives users access to remote cycles fmm &he processor bank without severe overhead. To be fair, the algorithm considers past behavior by trading off the amount of execution time allocated to a user and the amount of time the user has waited for an allocation. Since we assume that all workstations are entitled to equal rights, heavy users should not be allowed to dominate the remote cycles at the expense OP light users. Algorithms that do not consider past behavior do not protect the high quality of service for light users. Light users with steady demand will have increasing remote cycle wait ratios as heavy users increase their demand. Heavy users will have greater throughput with a naive algorithm when comparing it to the Up-Down algorithm, but the overall throughput of the system will be as good when using the Up-Down algorithm. A description of the Up-Down algorithm follows.
4.4.1. The Up-Down Algorithm In this algoIithm, the scheduling coordinator bases its decisions on an allocation table called the schedule
index table, SI. An entry SI[i] is the schedule index for workstation i. The values of the SI table are used to decide which workstation is next allocated remote capacity. Initially, each entry of the table is set to zero. The values of the SI table are updated whenever new capacity becomes available to the system. This occurs when a station’s state goes from NA to AV. or when a remote iob comdetes and leaves the svstem. The SI entries are also DeriodicaIlv cI--- --- .I-- - - =

26
updated after a scheduling time interval Schedlnterval has expired. The interval should not occur too often due to the overhead of placing and preempting jobs on a remote processor, and it should occur often enough to give stations with low SZ entries access to a node without toa much waiting. Workstations with smaller SZ entries are given priority over workstations with larger SZ entries. Also, the workstations with smaller entries that want a node but do not have one will preempt workstations with larger SZ entries that have nodes. Workstations with smaller SZ entries are given a remote processor first, and then other workstations are given a chance. If extra capacity is available, then the workstations with the lower SI entries are again given preference. No workstations with smaller SZ entries that have already acquired remote cycles for the next interval can preempt other workstations with larger SI entries. Any time two or more workstations with the same schedule index contend for cycles, the workstation allocated the cycles is randomly chosen. Table 4.2 outlines the allocation algorithm for remote cycles.
We want the algorithm to adjust to changes in background load patterns. Light users that increase their loads significantly will have their priority decreased so that they will be considered heavy users, and heavy users that decrease their loads significantly will be considered light users. Table 4.3 summarizes the update policy for the SZ table. Four schedule index functions (f, g, h, and I ) are employed to adjust for changes in load patterns. The functionfis the assessed charge given to workstations (amount SI entry is increased) for using remote cycles. This wouId cause a light user that incieases its load significantly to have its pIiority decreased until it is viewed no differently from a heavy user. For each scheduling interval a station is granted a processor from the processor bank, the SZ entry is increased proportionally to the number of processors granted for that interval as shown by the Function f. The function g is the credit awarded to workstations (amount SZ entry is decreased) for waiting for cycles. The SZ entry is decreased if a station wants a remote processor but was denied one according to the function g. The functions h and 1 stablize the priority of the workstations when they do not want cycles. Any station that
Allocation Of Processor Bank Nodes For Background Jobs
at each scheduling interval ( S1+ [ bag of workstations that have nodes allocated 1 S2 t [ set of workstation that want nodes allocated J
1 for the number of nodes free (
if S2 <> EMPTY ( s = workstation in S2 with smallest SI entry allocate a node to s s2 t s2 - [sl
I else break,
1 while S2 <> EMPTY (
s = workstation in S2 with smallest SI entry t = wokstation in S1 with largest SI enuy if SI[s] c SI[t] (
preempt a node From t allocated a node to s S 2 t S 2 - s s1 t- s1 - t
1 else break;
-.A.----. --...- - --.- -.- Table 4.2.

27
does not want a remote processor and has a positive SI entry will have its schedule index decreased by the function h every intend until the entry reaches zero. This means that a heavy user that significantly decreases its load will have its index lowered until it is viewed no differently from a light user. Any station that does not want a remote processor and has a negative SZ entry will have its entry increased every interval until it reaches zero as shown by function 1. Once a station’s SI entry reaches zero, it will stay there until it wants a processor. Figure 4.2 illustrates how the Up-Down algorithm modities the SZ table. The figure represents the value of the index of station i , SIji], over time. The figure shows how the index for a station changes when a station waits to receive remote cycles, when remote cycles are allocated, after a job has completed, and when there is no need for remote cycles. Depending on the accessed reward and penalty received by each station, the index for each station goes up and down. This gives the name to the Up-Down algorithm. In Figure 4.2, the SZ[i] is initially zero. When a job arrives and there is no allocation given, the index decreases according to g(Sl[i]). Afer an allocation is made, the index rises according to f(SI[i]). If two allocations are given, the index rises twice as fast, namely, 2*f (SZV]). The completion of one of the jobs causes the index to rise according to f(SZ[i]). When the second job completes and there are no alIocations or jobs waiting, the index decreases to zero by the function h(Sl[i]).
4.4.2. Algorithms Used For Comparisons For comparison with the Up-Down algorithm, we have selected two algorithms that do not use past behavior
when deciding how to allocated remote capacity. These two selected are the Random and Round-Robin algorithms. All of the decisions of the Random algorithm are made without reference to any past decisions. The Round-Robin algorithm makes its allocation decisions in a cyclic order to determine which workstation is next given remote capacity. We compare the Up-Down algorithm with the Random and Round-Robin algorithms to show that less sophisticated algorithms are not adequate to fairly &locate remote cycles and to provide steady performance results. The Up-Down dgorithm, Random, and Round-Robin algorithms are simple to implement and are efficient in providing extra cycles when they are wanted. They differ in the way they treat users with diffeIent workloads.
The Random algorithm’s name tells a lot about it. Whenever there is contention for cycles, the Random algorithm randomly picks one of the contenders to receive the resource. Whenever there is no contention, a requester is given the resource. Whenever a workstation is allocated a remote processor, the workstation will keep the remote processor until either the job terminates, or the remote processor becomes busy by its local user.
The Round-Robin scheduling algorithm requires the scheduling coordinator to maintain an order whenever it allocates remote cycles to contenders. Each workstation is given a chance in a particular order to receive remote cycles if they want them. If they do not need them when their chancq occurs, they will have to wait until everyone else gets one chance before another chance is received. Once allocated a remote processor, a workstation keeps the
Modification Of The Schedule Index Table (SI) During Each Scheduling Interval For Each workstation (i)
for each i ( if i wants a pIocessor bank node (
if i has a node then SI[i] :=
else SI[i] := SI[i] - g(S1.i); SI[i] + NumProcessors*f(SI,i);
I elsif SI[i] > 0 then SI[i] := SILi] - h(S1.i); elsif SI[i] c 0 then SI[i] := SI[i] + l(S1,i);
1
Table 4.3.

I Allocation ' Allocation
Figure 4.2: Modification Of Station i Schedule Index
--.- - Parameter servemean(i) arrive(LightStati0n) arrive(MediumStati0n) arrive(HeavyStati0n) NumPermanent(LightStation) NumPermanent(MediumStation) NumPermanent(HeavyStation) Schedlnterval JobTransfer Cost - NumWorkstations
28
-----_.-
Value _-.-- 5 hours for all stations i 2000 minutes no such arrivals no such arrivals 0 2 2-10 10 minutes 1 minute 13
allocation until either the job terminates or the remote processor becomes busy with some local activity. When a remote job completes, the scheduling coordinator asks the next station if it wants the available processor and continues in order until all processors are allocated or all woIkstations have been asked. If remote processors are available but no workstation wants them, the scheduling coordinator periodically checks, with interval Schedlnterval, to see if any background jobs have anived to use one of the available processors.
4.4.3. Simulation Study Results In order to evaluate the performance of the Up-Down algorithm and the two naive algorithms, we conducted a
simulation study using the DeNet ILivny881 simulation language. DeNet is a discrete event simulation language built on top of the general purpose programming language Modula-2 W i 8 3 1 . The simulation study was done with the simulation parameter settings shown in Table 4.4. We have assigned NumWorkstations with a value of 13 which is the number of workstations we monitored as described in Chapter 3.

29
To show how workstations with a light background load perform in the face of different demand levels from heavy users, we made all but two of the workstations in the experiments to have a light user, labeled by LightStations. The two remaining stations were designated as MediumStation and HeavyStation. The first of the two, MediumStation, has two permanent jobs ready for execution (Numl'emzanent(h4ediumStation) = 2). For the HeavyStation, we varied NumPermunent(HeavyStation) from 2 to 13 jobs. The background jobs have a mean service demand of 5 hours (servemean(i) = 5, for all 9.
Table 4.5 summarizes the schedule index functions selected for the Up-Down algorithm. We have observed that at high utilizations, the SI of a station might become very large and would slowly reach zero when the station changes from a heavy to a light load. We chose to concentrate on the function g to decrease the time it takes a station's index to reach zero. Functionsf, h, and I will always return one as their value.
Our results show that the Up-Down algorithm maintains a fair allocation of resouxces to all types of users. Under the Random and Round-Robin algorithms, light users suffer. IJnder the Up-Down algorithm, they do not suffer. We compared the performance of the IJpDown algorithm with the other two algorithms based the criteria defined in the inuoduction which are: (1) the remote cycle wait ratio, (2) the remote cycle percentage of light users, and (3) the remote response time. The remote cycle wait ratio of Lightstations is computed by averaging the local remote cycle wait ratios of the individual LightStarions. Likewise, the remote response time of LightStations is computed by averaging the local remote response times of the individual LightStations. On the basis of these criteria we will show that the quality of service LightStations and MediumStation enjoy in face of increasing loads of the HeavyStation remains steady when we use the Up-Down algorithm. When we use the Random and Round- Robin algorithms, the quality of service for Lightstations and MediumStation suffers as HeavyStation increases its load.
We use the outlined performance criteria to compare the Up-Down algorithm with the Random and Round- Robin algorithms. We see in Figures 4.3 through 4.6 that the Up-Down algorithm shows an improved quality of service for Lightstations and MediumStations. Figure 4.3 presents the remote cycle wait ratio of LightStutions as a function of NumPermnent(HeavyStation). We see that Lightstations in the Up-Down system maintain nearly constant quality of service even as NumPermanent(HeavyStution) increases while the Random and Round-Robin systems suffer a significant loss in remote cycle wait ratio for the LightStations. The improved ratio means the Lightstations wait less to receive service from a remote resource. The medium loaded users, the workstations with 2 permanent jobs, maintain steady access to remote cycles as shown in Figure 4.4. In the Random and Round-Robin systems, MediumStution suffers as HeuvyStation increases its load. For all the algorithms, the wait time of HeavyStation is nearly zero since HeuvyStation almost always has some remote capacity assigned to it.
The light users as displayed in Figure 4.5 maintain a good quality of service in spite of increased loading by others. It shows that the Up-Down system maintains a steady remote cycle percentage for LightStutions. The other algorithms cause Lightstation to lose access to remote cycles as NumPermanent(HeavyStation) increases. Since background jobs execute locally if their workstation's state is AV, not all background jobs execute remotely. For this workload, the Up-Down algorithm provided remote capacity for 54% of the capacity submitted by the lightly loaded machines. This remote cycle percentage remains steady as NumPermnent(HeavyStation) increases. The remote cycle percentage of the the Round-Robin algorithm decreases from that level to about 44% of its cycles. The Random algorithm's remote cycle percentage decreases to 41% of the cycles only because some other user wanted more cycles.
= 2, else if SIli] - min (SI) >= 3
= I, for all workstations i
= 3, if SI[i] - min(S1) >= 6
= 1, otherwise.
I ValueRetumed -- --- l(S1,i)
-_.--_--.....- Table 4.5: Up-Down Schedule Index Functions.

30
1501
2 4 6 a 10 NumPermanen t(I1eavyStation)
Figure 4.3. Remote Cycle Wait Ratio
(LightStutions )
R 500 e m 0
400 e
C Y c 300 1 e
w 200 a i t
R a t i
100 '\, \
'\ \
0 0 2 4 6 8 10
NumPermanen t(Heav yS tation) _- -
Figure 4.4. Remote Cycles Wait Ratio
(Mediudtation)
1
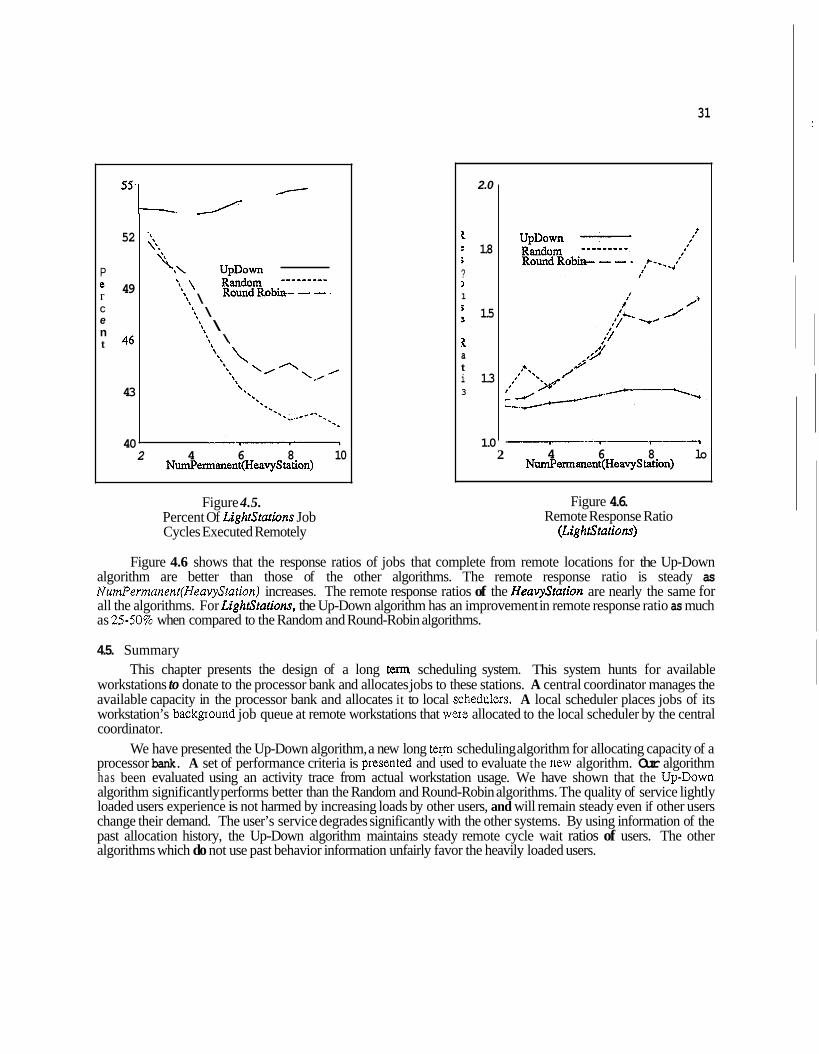
31
55,
52
P
r
e
49 C
n t 46
43
‘\\ UpDown s,, \ Rmdom *--------
Round Robin- - - \
’\, \ \\, \
‘\\ \ ’, \
40 4 6 8 10
NumPemanent(HeavyStation) 2
2.0
2 1.8
5
3 1
:
?
’ 1.5
x a
i 1.3 t
3
1.0 4 6 8 lo
Ndermanent(HeavyStation) 2
Figure 4.5. Percent Of LightStations Job Cycles Executed Remotely
Figure 4.6.
(Zig htStafions) Remote Response Ratio
Figure 4.6 shows that the response ratios of jobs that complete from remote locations for the Up-Down algorithm are better than those of the other algorithms. The remote response ratio is steady as NumPermanent(HeavySfution) increases. The remote response ratios of the HeuvyStation are nearly the same for all the algorithms. For LighfStutions, the Up-Down algorithm has an improvement in remote response ratio as much as 2550% when compared to the Random and Round-Robin algorithms.
4.5. Summary This chapter presents the design of a long term scheduling system. This system hunts for available
workstations to donate to the processor bank and allocates jobs to these stations. A central coordinator manages the available capacity in the processor bank and allocates it to local schedulers. A local scheduler places jobs of its workstation’s backgound job queue at remote workstations that weIe allocated to the local scheduler by the central coordinator.
We have presented the Up-Down algorithm, a new long te;m scheduling algorithm for allocating capacity of a processor bank. A set of performance criteria is pIesented and used to evaluate the new algorithm. Our algorithm has been evaluated using an activity trace from actual workstation usage. We have shown that the UpDown algorithm significantly performs better than the Random and Round-Robin algorithms. The quality of service lightly loaded users experience is not harmed by increasing loads by other users, and will remain steady even if other users change their demand. The user’s service degrades significantly with the other systems. By using information of the past allocation history, the Up-Down algorithm maintains steady remote cycle wait ratios of users. The other algorithms which do not use past behavior information unfairly favor the heavily loaded users.

CHAPTER 5
Performance Profile of the Condor System
5.1. Introduction A better understanding of a design is possible when the design is actually implemented. Condor is the
implementation of a long term scheduling system described in Chapter 4. In Chapter 5 we portray a performance profile of Condor. The performance portrayal comes from observations during one month in which background jobs were profiled and the system utilization was monitored. We show the pattern of service demands of users, as well as the quality of service users received. The results display Condor’s ability to increase the utilization of a processor bank formed from a cluster of workstations. There is little inteIference between the jobs Condor schedules and the activities of people who own workstations.
The performance portrayal of Condor introduces a new performance measure called leverage. Leverage is the ratio of capacity consumed remotely at the processor bank to the capacity consumed locally for the support of Iemote executions. When little local capacity is needed to support the execution of jobs at the processor bank, the leverage of the jobs is large. A small leverage means it is better to execute jobs locally than to consume a great amount of local capacity to support the execution at the processor bank. We obsemed the leverage of jobs executing on our system to quantify the benefit the Condor system provided to its users.
Section 5.2 gives a performance profile of the Condor system, which includes the utilization of the processo1 bank, the quality of service given to background jobs, and the impact that remote execution has on the home workstation. In section 5.3, we present a discussion of issues that became apparent due to the implementation of the Condor system. A summary of the performance of Condor is given in section 5.4.
5.2. Performance The performance results we report are from observations of the Condor system over a 1 month period. We
present details of the way the system was used and analyze the quality of service it provided. This analysis includes the wait ratios users endure when they submit background jobs and the cost suffered by users at their local workstation to support remotely executing jobs. Our results are based on observing 23 workstations. Table 5.1 summarizes the activity of users during the period. It presents the number of jobs each user submitted, and the average service demand of a job per user. User A accounted for most of the consumption of remote capacity. This heavy user often tried to execute as many remote jobs as there were workstations in the system. The other users of Condor consumed capacity occasionally and can be classified as light users.
Average Demand/Job Total Demand Percentage of (in I~ollrs) (in Hours) ,--Total Demand -- ...---
6.2 4278 90 2.5 345 7 2.6 101 2
D 40 0.7 28 0.6
Table 5.1: Profile of User Service Requests.
32

33
401 I
P e r
e n t a g e
0 f
J
b
C
0
0 2 4 Service Time (in hours)
6
--I ---I.--p____.----
Figure 5.1: Profile Of Service Demand.
2 e
e
L e
g
h
U
U
n
t
1 15 30 Davs In Month
Figure 5.2 Queue Length.
The service demand of jobs submitted to the system were typically several hours in length. With the exception of User D, all users had an expected demand per job that was greater than 1 hour. Figure 5.1 shows the cumulative frequency distribution of jobs Served by the system. For each hour i, the curve shows the percentage of jobs whose service demand was less than i hours. The average service demand was about 5 hours. The median service demand was less than 3 hours because shorter jobs were submitted more frequently than longer jobs.
Jobs axrived at the system in batches. Figure 5.2 depicts the queue Iength of jobs in the system on an hourly basis. The dotted line represents the queue length of light users. Jobs in service are considered part of the queue. The difference between the total and light users’ queue lengths is the heavy user’s queue length. The figure shows that the heavy user kept more than 30 jobs in the system for long periods.
’ We evaluated the quality of service users receive for the remote execution of their jobs. One measure of the quality of service is the wait ratio of jobs submitted for remote execution. The wait ratio of a job is the ratio between the amount of time a job waits for service and its service time. ?’he average of observed wait ratios is illustrated in Figure 5.3. The solid line is the average wait ratio of all jobs, whexeas the dashed line is the wait ratio of the light users. Note that in most cases light users did not wait at all. The average wait ratio results are dominated by the wait ratio of the heavy user who waited significantly more. This is due to the Up-Down algorithm giving steady access to light users without allowing heavy users to dominate the system. Light users obtained remote resources regardless of whether the heavy user increased or decreased their load. Requests of the light users were typically small enough that available capacity could be immediately allocated to them. The Up-Down algorithm allocated remote capacity to light users and preempted the heavy user. When the light users’ jobs were completed, the heavy user’s jobs were resumed to consume available capacity. Typically the heavy user was allocated some capacity since the light users’ requests were not large enough to consume all available capacity.
We measured the amount of extra capacity the 23 workstations provided to Condor users. During the observed period, 12438 hours were available for remote execution, of which 4771 machine hours of capacity was consumed by the Condor system, Note that almost 200 machine days of capacity that otherwise would have been lost were consumed by the Condor system! Figure 5.4 shows how the utilization varied over time. The solid line is the system utilization which is the combination of local activity and remote executions, whereas the dashed line shows the local workstation utilization. Local activity remained low for the month period. One the average, local

34
Average
---.-.*-----
Light Users
0
- Figure 5.3: Average Wait Ratio.
2 4 Service Time (in hours)
6
i
!

35
u t i 1 i
a t i 0 n
z
I I U
I ~ c d Activity
1 15 30 Days of Month
Figure 5.4 Utilization of Remote Resources.
utilization for the month was 25%. However, due to the Condor system, we observed long periods that all workstations were utilized. The Condor system identified available capacity and allocated it to its users.
Each day of the month the amount of available capacity in the system varied. Figure 5.5 gives a closer view of the utilization of the system over one working week (Monday through Friday). Notice the peaks of local activity during the day, and how the capacity decreased in the evenings. The range of utilization generally varied from 20% in the evenings and nights to 50% for short peak periods in the afternoons. Figure 5.6 presents the the queue length of light users and the total queue length for that week. Notice the sharp rises in the queue length which represents batch arrival of jobs. Much of the time duing the week the queue length of the heavy user was larger than the number of machines available.
5.2.1. Impact on Local Workstations The implementation of remote execution facilities should-be efficient so that users at workstations need not
use much of their local capacity to support remote executions. We studied the impact the remote execution facility has on users at their workstations. A user has to devote some local capacity to support the placement and checkpointing of remote jobs and the execution of system calls. In addition, a local scheduler and the coordinator consume some resources.
It is important to keep the capacity consumed by the coordinator and each local scheduler small since some users might rarely use the remote execution facility. Our observations show that these cost are indeed small. The local scheduler of a station with background jobs running has been observed to consume less than 1% of a station’s capacity. This capacity is independent of the size of the system. The consumption of capacity by the coordinator has been observed to be less than 1% of a workstation’s capacity as well. The size of the system is expected to affect the amount of capacity consumed by the coordinator. We have observed a system with as many as 40 workstations. Even with this system size, the coordinator consumes less than 1%. This leads us to believe that a coordinator can manage as many as 100 workstations with only a small impact on the workstation that hosts it.

36
;J t i 1 1 2
t a
i a n
0.0 c--Y--I--l Mm Tms * Wad lbur Fd
ONE WEEK - Figure 5.5 Utilization for One Week.
50
40 2 1 !
E 30
.4
; 20 I
t 1
10
0 Mon nLcr wad nur Fri
ONE WEEK
Figure 5.6 One Week Queue Length.
We measured the costs that remotely executing jobs bring on their home workstations. To support the remote execution of background jobs, the home workstation has to transfer jobs to remote sites, checkpoint them when they are preempted, and execute their system calls. This support can have a significant impact on the home woIkstation. The costs associated with this support depend on the costs and rates of these activities.
The capacity required to place and checkpoint a remote job ‘depends on the size of the job. Placing and checkpointing jobs consume approximately 5 seconds of CPU time per megabyte of the checkpoint fiIe. We observed that the average checkpoint file size was ‘/z megabyte. Therefore, the average cost of placement and checkpointing was approximately 2% seconds.
The rate at which jobs were checkpointed after they were initially placed is shown in Figure 5.7. This rate is the number of times per hour that a remotely executing job is moved from one location to another. Jobs are checkpointed when the location at which they have been running becomes unavailable for remote execution. In addition, jobs can be checkpointed when the coordinator decides that one user requesting remote cycles has priority over another user. The rate of checkpointing was relatively steady over the range of service demands, with the exception of the short jobs. The reason that longer jobs have a lower rate of checkpointing can be explain in terms of the local usage patterns of workstations. When jobs are preempted due to local user activity, they will be placed at another remote location if one is available. Since local workstation activity is not uniform across the system, some workstations tend to be available for short periods, and other workstations tend to be available for much longer periods. Long jobs have a lower checkpoint-rate because eventually they are placed at a woIkstation that experiences no local activity.
System calls by a remotely executing job can have a significant impact on a local workstation. The average capacity consumed on a VAXstation I1 to support a remote job executing a system call is approximately 10 msec of CPU time. This is 20 times the cost of a Unix system call, due to the cost to support remote communications. Programs executing large numbers of system calls, such as reads or writes, in pxoportion to other instructions would be better off if they were executed locally instead of remotely. For a remotely executing job with an extreme number of system calls, a Iocal workstation supporting the remote system calls would consume more capacity than the amount of useful work accomplished at the remote site.

37
c h o*81 e
k P
i n
C
0
t S
P e I
H 0 U r
2 4 6 Service Time (in hours)
0 I I-.-.-
Figure 5.7: Rate Of Checkpointing.
20001
.. . - 0 2 4
Service Time (in hours) 6
Figure 5.8: Remote Execution Leverage.
We define a new performance measure called leverage to compare the amount of effort a local workstation must endure to benefit from having useful woIk conducted remotely. The leverage of a remote job is defined as the amount of remote capacity consumed to execute a job divided by the amount of local capacity consumed to support remote execution. The local capacity is the combination of capacity used to support placement, checkpointing, and system calls. If more capacity is consumed locally to support remote executions than what is actually accomplished remotely, the leverage of the job is less than 1. Figure 5.8 shows a profile of the Ieverage of jobs. The average leverage was approximately 1300. This means for every 1 minute of local capacity consumed to support remote execution of jobs, nearly 22 hours of remote capacity was received by the users! Longer jobs had a larger leverage than shorter jobs. This is because the rate of checkpointing for short jobs was higher than for long jobs, and the amount of input/output for the short jobs was relatively the same as that of long jobs. Neveqtheless, the leverage for jobs with service demands less than 2 hours averaged approximately 600. This means that even a short job with only a service demand of 1 hour required only about 6 seconds of local capacity to support remote execution.
5.3. Discussion The implementation of the Condor system brought a clearer understanding of several issues. Many of these
issues relate to the nature of background jobs and the Iarge amount of memory needed for their remote execution. For example, in our system a job that is executed remotely is placed on the remote station's disk. Because users of workstations often do little to manage their own disk space, users let their disk become full. When a disk is full, a remote job cannot be placed on the workstation for remote execution. Even if a workstation is available, the disk might be full so that no remote job can execute there. The coordinator must know not only which workstation's processor is available, but has to keep track of available disk space. The checkpoint file is placed at a remote location's disk since the placement, checkpointing, and the handling of system calls for remote jobs is conducted outside of the kernel of the local operating system.
The issue of disk space affects users in another way. Users often like to execute many background jobs at a time. If users do not have much local disk available, they will be restricted on the number of background jobs that can be executing simultaneously. The restriction occurs since checkpoint files of remotely executing background jobs axe kept locally. Space can be saved if disk servers axe dedicated for storing checkpoint files. Another solution

38
to the disk space problem is to share text segments. This is effective since users often submit several occurrences of the same job to the system with only different parameters to evaluate. An example is when users submit simulation programs to the system, Only one copy of the text segment might be needed for several executions.
Because placing and checkpointing remote jobs has an impact on a local workstation and the network, our implementation does not cry to place or checkpoint several jobs simultaneously. We have noticed that if several machines are available, and users have several background jobs waiting for service, the performance experienced by a user of his local workstation is severely degraded if all jobs are placed at the same time. Our current implementation of the local scheduler places a single job remotely every two minutes to distribute over time the impact on local workstations and the network.
Our design philosophy has been to ensure that the Condor system does not interfere with users and their local activity. Remote jobs are only executed when there is no local activity. However, one element of our implementation differs with our design philosophy. When local activity resumes at a workstation where a foreign job is running, the foreign job is stopped on the station and is kept there to see if the workstation will soon be available. If it does not become available within 5 minutes, the job will be checkpointed and moved from the location. The strategy has worked well since many of the workstations' unavailable intervals are short. However, it does not completely follow a model where users reclaim all local resources as soon as they return to their wokd'tations. The CPUs are immediately returned, but disk space consumed by remote jobs is not released until the checkpoint files are moved. If a user has Little local available disk space, the checkpoint file might interfere with local activity until the file is moved. We consider a modification to our strategy so that checkpoints of remote executions are periodically taken. When a workstation's owner resumes activity at a location executing a remote job, the new strategy is to kill the job immediately. This minimizes any interference a remote job has with the owner of a workstation. The only work lost is that between the job's most recent checkpoint and the time it was terminated.
5.4. Summary Condor has proven to be an exttemely effective means of improving the productivity of our computing
environment. For a system of 23 workstations, large amounts of capacity were observed to be available for remote execution. About 75% of the time the workstations were available as sources of remote cycles. The effectiveness of Condor is demonstrated because the system caused the workstations to be fully utilized for long periods. Over a one-month period, users consumed as much as 200 machine days of computing cycles from available workstations. The checkpointing feature of our remote execution facility insured users that their jobs would complete if their jobs were preempted by users at remote locations, or if remote locations failed. We showed that users need only to dedicate an extremely small amount of workstation capacity locally to received huge amounts of remote cycles. We report that the leverage of remote execution observed was 1300, which means for every minute of local capacity supplied, almost 1 day of remote CPU capacity was received.

CHAYTER 6
Reserving Capacity of the Processor Bank
6.1. Introduction A processor bank can docate capacity on the basis of time or availability. Chapter 4 discussed the design of
a system that provides capacity on the basis of availability. This chapter presents a design of a system that allocates capacity on the basis of time. Users want to reserve capacity (in the form of partitions of computers) in advance to insure access to capacity at specific times. For example, a researcher might want to reserve a partition for specific periods in order to develop distributed computations. During the pexiod of a reservation, the partition that is allocated to the researcher is not shared with other users of the processor bank. Nevertheless, the researcher suffers outside interference when a station in the allocated partition is withdrawn from the processor bank by its owner. To compensate for this interference, the researcher is allocated another station to replace the withdrawn station if a machine is available.
To evaluate the effectiveness of Ieserving capacity, the rate of replacing a machine in a partition (due to an owner withdrawing his workstation fiom the processor bank) needs to be quantified. We refer to this rate as the preemption rate. When a machine in a partition is preempted, an unreserved available machine is obtained as a replacement. In order for users to be satisfied with the processor bank for support of reservations, the preemption rate must be low. By observing a cluster of workstations, we found that the preemption rate is low and replacement machines are available in most cases, even when as many as 40% of the workstations in the cluster are reserved.
Encouraged by our observations of preemption rates and the availability of replacements, we proceeded to design a reservation system to extend the Condor system. The design of the system aims to provide a good quality of service to those requesting reservations. To provide good service, each user should receive opportunities to reserve capacity, The heavy users who frequently reserve capacity should not inhibit the access to capacity by light users who reserve partitions of the processor bank infrequently. An algorithm for allocating reservations should insure that light users are able to make reservations, yet enable heavy users to reserve unused capacity. This chapter includes the presentation of an algorithm, called the free-market resenation algorithm, with this goal. It is designed to pxovide users with steady access to reservable partitions of the processor bank for those who infrequently reserve capacity. By means of the algorithm, users trade privileges of receiving future reservations. Each user spends "money" to obtain a reservation. The "price" of a reservation is partially determined by the supply and demand of reservation periods.
The design of the reservation system, which includes the design of the free-market algorithm, is given in section 6.3. Section 6.2 presents a study of the usage patterns of a cluster of workstations. This study shows that it is feasible to reserve partitions OF a processor bank that is formed from a cluster of workstations. Section 6.4 gives a summary of the reservation system design,
6.2. Usage Patterns of Workstations Stations must be available for long periods to warrant the development of a processor bank that supports
reservations. In order to gain insight into the extent of workstation availability for reservations, we need to observe activity on a large cluster of workstations to understand the size of partitions that could be allocated on the basis of time. We would like to obtain inFormation from a large number of woxkstations over a long period. If we look only a small number of stations, a single user's activity will greatly affect the observed percentage of stations that is available for reservation, and the average preemption rate experienced by users who reserve partitions.
The study presented in Chapter 3 showed the average amount of available capacity from 11 stations over a 5 month peIiod. Two additional stations were observed for 3 months. The study of Chapter 3 analyzed data over a long period to understand the amount that can be expected for allocation to background jobs from month to month, day to day, and how to hour. However, we would like to observe a larger number of stations to better understand
39

40
the percentage of workstations in a cluster that could be reserved. We were fortunate to be able to observe 23 stations for one month. These stations were owned by a variety of users: 5 by faculty, 5 by systems programmers, and 13 by graduate students. Although we wish our observations could have lasted for a longer period, we feel that the obsefvation of a larger number of stations gives more insight on the size of partitions that can be allocated for reservations. Therefore, we use this observation for analyzing the availability of workstations for reservations.
In this section, we characterize the availability of partitions for reservations, and study the preemption rate that users would have experienced if the observed available workstations were foImed into a partition of reserved machines. Figure 6.1 gives the availability of the observed period. Each paint on the curve is the expected percentage of workstations in the AV state. It displays availability information that is similar to that described Chapter 3, but the time graph helps to illustrate how the profile of availability changes daily. We want to take advantage of our knowledge of the daily change of availability. As discussed in Chapter 3, we denote available stations as being in the AV state, and non-availabIe stations in the NA state. The dashed lines help identify the rates in which the system availability changed with respect to a given level of availability. For example, the horizontal line for 40% availability indicates that 40% of the machines were always available. The 60% availability occurred the majority of the time with only short intervals lower than this level. Notice that the peaks and valleys of the curve had similar characteristics throughout the month. The peaks represent periods of high availability such as evenings and weekends, and the valleys show weekday afternoons. The valleys rarely went lower than 50% and the peaks were well above 70%. A reservation scheduler could assume that it would find 50% of the woxkstations available for allocations during peak periods, and more that 70% at lightly loaded intervals.
Figure 6.2 profiles workstation availability levels. It represents the probability of maintaining each availability level. For a given percentage of workstations in the AV state, the curve shows the corresponding amount of time the system stays at that level. The solid line is the average profile over the month. Since the availability level vaies for different times of the day, we show it for day, evening, and night hours. The dotted line presents the profile of hours duxing the day between 8ani and 5pm. The alternating dashed line gives the profile of
I -__ --. 1 15 3(
Days of Month
i t
0 i
n 0
Figure 6.1: Hourly Availability
~ - Figure 6.2 System Availability ProEle

41
evening hours between 5am and 12pm. The night hours between 12am and 8am are shown by the dashed line. The average system availability of Figure 6.2 indicates that there is a high probability (more than 80%) that
60% or mole of the workstations are in the AV state. The 80% workstation availability level occurred as much as 40% of the time. The probability sharply decreases for higher levels of availability. The day, evening, and night curves show the variation of the availability throughout a day. For example, there is nearly 100% certainty during the night and 70% certainty in the evening that the system is 80% available. Eighty percent availability occurs during the day only 20% of the time. These results indicate that a tremendous amount of capacity can be used for our reservation system.
The workstations in the processor bank that are allocated for reservations need to have a low preemption rate. The user of a reservation system is affected by the frequency that an owner reclaims a workstation in a reserved partition. When a preemption by an owner occurs, the user needs to be allocated a replacement station. We analyzed the workstation usage patterns to characterize the rate that preemptions occurred during an hour interval. To analyze the patterns, we observed the number of preemptions that occur during an hour interval for a given partition size. The partition sizes varied from 040% of the total number of stations. (The 40% level of reservable workstations (10 stations) is chosen since Figure 6.2 showed that with this value there is a very high probability that the reservation size can be satisfied.) When a machine in a reserved partition is preempted, an unreserved AV workstation replaces it. If there is no AV workstation for replacement, the hour is counted as an error. The error probability is 100% minus the probability of availability of stations. Therefore, the probability of errors corresponds to 100% minus the availability levels of Figure 6.2.
Two methods for selecting reserved stations from a group of AV stations are studied. The first method is random selection. Stations were randomly chosen with each AV station having an equal probability of being chosen. The second method (Longesr Free) chooses the station that has been in the AV state for the longest time.
1.5
P
e m h . 0
P 1 0 n
b . 5 U
r
0.0 0 10 20 30
% Workstations Reserved 40
Figure 6.3: Average Hourly Preemption Rate
3 .O
P
e m g2.0
P I 0
i, 01.0 U r
I
L I- - Figure 6.4: Weekday Preemption Rate

42
From the distribution of availability intervals that we discussed in Chapter 3, we expect that the Longest Free selection method will have a lower preemption rate than the random selection method. This is because stations that have been in the AV state for a long period have a greater probability of staying in the AV state than those stations which only recently became AV. As presented in Figure 6.3, the Longest Free selection method had significantly lower preemption rates for al l percentages of reservable workstations. Figure 6.4 gives the preemption rates of the Longest Free selection methods for day, evening, and night hours (Monday through Friday only). The evening and night hours have extremely low preemption rates. During these times users could reserve large partitions with little or no interference.
Since several users could be allocated reserved workstations for any hour in an actual system, the preemption rate experienced by users is not the same as the pIeemptian rate of Figure 6.4. When a preemption occurs in an hour interval, all users of reserved workstations are not necessarily affected. We simulated a reservation system where the percentage of reservable workstatians varied from 040%. The simulation computed for each hour the percentage of users that experienced preemptions. In the study, the number of users in an hour interval is obtained randomly at the beginning of the hour and varies between 1 and the number of reservable workstations. Each reservable workstation is randomly allwated to one of the possible users. The Longest Free selection method was used to replace preempted workstations. Figure 6.5 gives results of this study by displaying the percentage of users that experienced preemptions, and the variations for day, evening, and night hours. It shows that few users experienced preemptions in the evening and night hours, and few preemptions occurred during the day when a small percentage of workstations were reserved.
75
A 50 S
S
e r
P r e e m ‘5 25 8
0
, - - - Evening ,a’
- - . _ - Night ,#*’
, , , , ,
I
,
0 10 20 30 40 % Workstations Reserved
--. .__.--- .- Figure 6.5: Preemption Rate Experienced by ‘IJsers

43
Funher investigation of the traces helps us understand how the utilization of workstations varies from station to station. Table 6.1 shows the hourly utilization of individual workstations during weekdays and weekends. The hourly utilization of a workstation is the percentage of an hour interval that the workstation was in the NA state. 'fie utilization of day intervals is the average of the hourly utilizations between the times of 8am and 5pm. The utilization of the evening hours is the average of the hourly utilizations between 5pm and midnight. For the remainder of the time (midnight to 8am), the hourly utilizations are averaged together to produce the night time utilization. The table separates the weekdays (Monday through Friday) from the weekends (Saturday, Sunday). As shown in the table, several of the stations had utilizations that were extremely low during night and weekend hours. Stations 1, 12, and 14 were always available on weekends. All but seven srations had periods where they were utilized less than 4%. Given the low utilization of these machines, many of these stations could have been donated to the reservation system for night times, and for large portions of the weekends.
All of the stations had long periods where they were left available. TabIe 6.2 shows the amount of long available periods occurring during the month. It presents the number of intervals where the stations were available for periods lasting longer than 10,24, and 48 hours. For these times the owners of the workstations could donate their stations to the processor bank. This table also gives the longest available interval for each station during the month. AU but two stations had AV intervals lasting longer than 2 days (48 hours). One station had an AV interval lasting over 11 days. (277 hours).
In the reservation system design presented in the next section, a user can make a reservation without specifying the machines to be included. Nevertheless, sometimes a user wants to reserve a specific machine. A specific machine can be reserved, in our view, only if the machine has been manually donated to the processor bank
... Machine Name
Station 1 Station 2 Station 3 Station 4 Station 5 Station 6 Station 7 Station 8 Station 9 Station 10 Station 11 Station 12 Statbn 13 Station 14 Station 15 Station 16 Station 1 7 Station 18 Station 19 Station 20 Station 21 Station 22 Station 23 Average
-- .-- Jtilization During Weekday! nd Weekends
Dav 16 64 52 55 69 33 40 27 20 25 23 20 25 19 35 26 8 22 11 26 30 30 73 32 - - --
Weekday Evening 14 58 48 26 12 15 39 16 4 10 30 2 6 12 23 3
11 2 8 16 32 37 72 20 --
-I. Night
10 56 39 19 0 14 25 12 1 0
15 0 1 0 22 0 4 0 1 9 13 2 69 11 --
g& 0 51 44 0 10 25 24 4 4 7 2 0 14 0 20 5 3 3 5 32 17 15 50 14 - - -
Weekend Evening
0 51 45 0 0 25 24 0 0 5 9 0 7 0 33 1 12 2 10 28 14 27 50 14 --
_.--..I
Night 0 50 50 0 0 25 33 2 2 0 12 0 0 0 13 8 2 0 6 25 3 0 57 12
-
- Table 6.1.
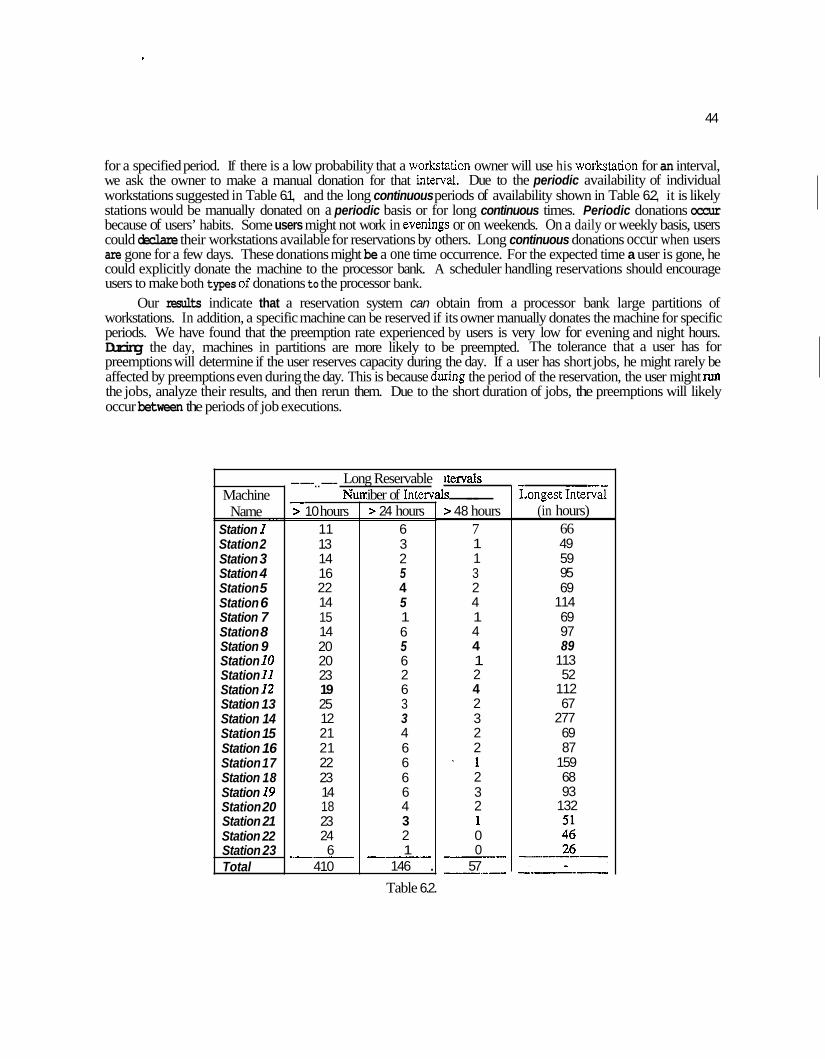
44
for a specified period. If there is a low probability that a woxkstation owner will use his woIkstation for an interval, we ask the owner to make a manual donation for that interval. Due to the periodic availability of individual workstations suggested in Table 6.1, and the long continuous periods of availability shown in Table 6.2, it is likely stations would be manually donated on a periodic basis or for long continuous times. Periodic donations occur because of users’ habits. Some users might not work in evenings or on weekends. On a daily or weekly basis, users could declare their workstations available for reservations by others. Long continuous donations occur when users are gone for a few days. These donations might be a one time occurrence. For the expected time a user is gone, he could explicitly donate the machine to the processor bank. A scheduler handling reservations should encourage users to make both types of donations to the processor bank.
Our results indicate that a reservation system can obtain from a processor bank large partitions of workstations. In addition, a specific machine can be reserved if its owner manually donates the machine for specific periods. We have found that the preemption rate experienced by users is very low for evening and night hours. During the day, machines in partitions are more likely to be preempted. The tolerance that a user has for preemptions will determine if the user reserves capacity during the day. If a user has short jobs, he might rarely be affected by preemptions even during the day. This is because dwing the period of the reservation, the user might run the jobs, analyze their results, and then rerun them. Due to the short duration of jobs, the preemptions will likely occur between the periods of job executions.
Machine Name
Station 1 Station 2 Station 3 Station 4 Station 5 Station 6 Station 7 Station 8 Station 9 Station 10 Station 11 Station 12 Station 13 Station 14 Station 15 Station 16 Station 17 Station 18 Station 19 Station 20 Station 21 Station 22 Station 23 Total
I
Long Reservable iber of Inten
-----..--- NI -.
> 10 hours 11 13 14 16 22 14 15 14 20 20 23 19 25 12 21 21 22 23 14 18 23 24 6
410 ..--..-
> 24 hours 6 3 2 5 4 5 1 6 5 6 2 6 3 3 4 6 6 6 6 4 3 2 1 --.--
146 .
lteNals
> 48 hours 7 1 1 3 2 4 1 4 4 1 2 4 2 3 2 2
- 1 2 3 2 1 0 0
57
S ---
---- --..--.-
- 1.ongest InteGii
(in hours) 66 49 59 95 69
114 69 97 89
113 52
112 67
277 69 87
159 68 93
132
Table 6.2.

I
45
6 3 . Design of the Reservation System I
The usage pattern of workstations support the development of a reservation system for the processor bank. The design of a reservation system requires the consideration of several issues. First, the system should be interactive and easy to use. The interface should d o w users to easily make and cancel reservations. For the second consideration, two kinds of reservation requests should be allowed. The fust type is a reservation for a quantity of machines without attention to the particular machines reserved. The number of machines in the reservation request should be allowed to vary between an upper and a lower bound. The second type of reservation is specific to the machines requested. A user might want station 12 to be reserved for 2 hours. The reservation of station 12 could occur if the machine was manually donated for that period by the owner.
In order to conduct large experiments, a third consideration gives users the potential of reserving all the machines in the processor bank. Nevertheless, the frequency that all machines could be reserved by a single user would be restricted, so that heavy users who reserve large amounts of capacity will not unfairly dominate light users.
Our design intends to allow users to make reservations using these considerations. The design augments the structure presented in Chapter 4 for allocating capacity on the basis of availability. A high level view of our design is given in Figure 6.6. As shown in the figure, workstations are interconnected by a high-speed network. As in the Condor system, each station has a Local Handler. However, this local handler implements the user’s interface to the reservation system. One station in the system holds the Reservation Coordinator, which corresponds to the coordinator of the Condor system. The reservation coordinator maintains system reservation information. When a user wants information from the system or to reserve capacity, a session is opened with the local handler. The local handler requests and receives system information from the coordinator in order to fullill the user’s requests. The coordinator has no more interaction with the local handler until the user wishes to close the session or to acknowledge new reservation requests. When new reservation requests are acknowledged, the local handler synchronizes its tables with the reservation coordinator. Synchronization is needed when new requests are made by
I r---.-.. I I ---.-
- Figure 6.6: Reservation System Structure.

46
a user SO that old requests are not cancelled. A local handler implicitly synchronizes its tables when the user closes a reservation session, or explicitly when a user invokes a sync command. At the time of synchronization, the coordinator either accepts requests, rejects new requests, or withdraws any reservations cancelled by the user. When a request is rejected, the local handler conveys this information to the user who can either make another request or terminate the reservation session.
The duties of the reservation coordinator are simple under the above design. The coordinator only interacts with local handlers when sessions are opened, and when reservations are synchronized. If the reservation coordinator were to handle many messages during a reservation session with a workstation, or many types of messages, the coordinator would not be able to manage many machines without neglecting its own user’s service (the user on whose station the coordinator physically resides).
Since the reservation coordinator is a centralized server of reservation information, it is important that the coordinator remains functional. Otherwise, the reservation system ceases to operate. To maintain the resemation system, another site serves as the coordinator’s backup. This scheme was implemented for the Crystal system meWitt871 to maintain its reservation information if the site which held the reservation information failed. The backup site becomes the reservation coordinator when the original coordinator fails to function. The backup site periodically checkpoints the reservation information to enable it to become the coordinator when necessary. Since the amount of information kept by the coordinator is small, the checkpointing procedure is not complicated. The information that the coordinator maintains is given in section 6.3.3.
The reservation coordinator is required to make a v&ety of decisions. One kind of decision involves accepting or rejecting reservation requests from users. An algoIithm is needed that gives heavy reservation users the ability to reserve large amounts of capacity without excluding the ability of light user to make reservations. The algorithm should leave as little unreserved capacity in the system as possible whenever there is a demand for reservations. We propose a reservation algorithm, called the free-market algorithm, to make the decisions for allocating reservations.
63.1. The Free-Market Algorithm We want a strategy for allocating reservations that gives heavy users access to reservations of partitions
without severely limiting light users’ access. This is a pIoblem that is similar to what the Up-Down algorithm attacks for allocating capacity on the basis of availability. NeveItheless, there are additional problems to be handled when allocating reservations on the basis of time. In a reservation system, allocations are made for future capacity. The user receiving the reservation can cancel it before the future allocation occurs. A reservation algorithm needs to adjust for the cancellation of capacity that has not yet been consumed. Since a reservation that is given to a user can inhibit other users in their attempts to make a reservation, the algorithm should not encourage users to make a number of reservations and then cancel them without any consequences suffered. In addition, reservations cannot be preempted and given to another user in the manner as done, by the Up-Down algorithm. A user who has one of her reservations preempted needs to be aware of its preemption before the date that the reservation is to occur. ‘I’he user should receive a consolation award for relinquishing the reserved capacity.
Simple strategies can be designed for accepting or rejecting reservation requests. Before one designs a complicated algorithm to solve a problem, we should understand if a simple algorithm will work. A simple strategy for allocating reservations is illustrated by the Fht-Come-First-Serve (FCFS) strategy. In the strategy, the first user to request an available slot is allocated it. A reservation slot is the granularity of time for which a reservation can be made. The only reason to reject a request is if all slots are allocated. This strategy lets a heavy user access as much capacity as she would like and therefore deny reservation requests of light users. To prevent this problem, some simple strategies limit the amount of capacity reservable by heavy users. Such a strategy is the Re-Allocated Capacity (PAC) algorithm. The PAC algorithm assigns everyone a specific number of reservation slots that they can use. Once a user reserves her quota of preallocated capacity, no more capacity can be requested. A problem with this method is that reservable capacity is often wasted when light users do not reserve their quota of reservation slots.
To overcome the problems of simple strategies, we have designed a new algorithm called the free-market algorithm. It makes reservable slots available to heavy users, but gives priority to light users when they want to reserve slots. It allows a reservation made by a user to be preempted, and gives consolation award to an user who is

41
Free-&ket Algorithm
Preemptable-Time-Period
Discount-Rate
1 st-class-rate 2nd-class-rate 3nd-class--rate Maximum_income
Initial,-P-Money Initial-NP- Money Early-cancel-time
Middle,-cancel-time
Late.-cancel-time
Last-cancel-time
Early-cancel..-rate Middle-cancel.-rate Late-cancel-rate bt-cancel-rate Num Workstations -
- Parameters Time before which a station can be preempted Amount returned to station when cancelled slot is xesold Cost of 1st-class reservation, in P money Cost of 2nd-class reservation, in P money Cost of 3rd-class Ieservation, in NP money Maximum P money from daily income a station can own Initial P money given w a workstation Initial NP money given to a workstation Days before reservation cancellation that entitles user to early-cancel-rate refund Days before reservation cancellation that entitles user to middle-cancel-rate refund Days before reservation cancellation that entitles user to late refund Last time before reservation that it can be Cancelled Highest refund rate for cancelled reservations Middle refund rate for cancelled reservations Refund rate for late cancelled reservations Lowest refund rate for cancelled reservations Number of Workstations in the network
Table 6.3.
preempted. Table 6.3 gives the parameters of the algorithm which are explained h this section. Suggested parameter settings are listed in Table 6.4.
To make reservations, users must use reservation money. Users can specify the urgency of a reservation by the amount of money spent on a reservation. Those users with the greatest demand for a slot and holding enough money to support the demand are given priority. There are two types of money: Precious (P) and Not-Precious (NP}. P money is for the purchase of priority reservations. This money can be accumulated, spent, and earned. NP money is used as a method of allocating "leftover" reservation slots to users who have either spent all of their P money or have little urgency for reservations. NP money can be spent but not accumulated or earned. The free- market algorithm implements a "market" for buying and selling reservation slots. The reservation coordinator manages the P and NP money.
Three reservation classes are available to stations in the system: lst, Znd, and 3rd class. A priority is associated with each class, with 1st cIass as the highest pIiority. P money is spent when making 1st or 2nd class reservations. To make 3rd class reservations, NP money is used. Reservations of a higher priority class can preempt lower priority reservations. The 3rd class reservations of users with more NP money can preempt 3rd class reservations of users with less available NP money. (The preemption of a reservation slot is unrelated to the preemption rate of owners reclaiming their workstations from the processor bank, which was presented earlier in this chapter.)
The purpose for three classes of reservations is to serve three types of user needs. The 1st class reservations serve urgent requests. IJsers will tend not to have enough P money to make 1st class reservations often. The 2nd class reservations serve users most often, since 2nd class reservations can be obtained at a smaller price. The 3rd dass reservations serves the heaviest users. Heavy users that consume all of their P money use 3rd class reservations to obtain available slots that are otherwise unused.

48
Free-Market Algorithm Suggested Parameter Settings .. -..--- -
Preemptable-Time-Period 1 day Discount-Rate 112 1 st-class-rate P = 2lslot 2nd-class-rate P = llslot 3nd-class-rate NP = llslot Maximum-income P = Nun_Workstation*3 Initial-P.-Money P = Nun-Workstations Initial-NP-Money NP = Num- ,Workstations Early-cancel-time 3 days Middle-cancel-time 2 days Late-cancel-time 1 day
Early-cancel-rate 90% Middle.-cancel-,rate 75% Late-cancel-rate 50%
Last-cancel-_time 2 hours
-- Last cancel rate ..,_. 25% Table 6.4.
Initially, the free-market algorithm gives each station Initial-NP-Money amount of NP money. The amount of NP money in a station’s possession plus the amount used for current 3rd class reservations is always a constant. When a 3rd class reservation is preempted or expires, the station receives back the previously spent NP money,
All stations initially have Initial-P-Money amount of P money. One difference between P money and NP money is that P money can be accumulated through hvo different ways: daily income and capital gains. Income is received by each station through an allotment allocated each day. However, the daily income is tumed off when the amount of income a station accumulates reaches the maximum-income. This prohibits a station fiom remaining available for an extremely long time, and then dominating the system by means of many 1st class reservations. The money owned by a station resulting from capital gains has no limit. This money is earned by selling slots to others at a higher price than what the original station paid. When 2nd class reservations are preempted by others with 1st class reservations, the preempting station pays a small fee to the preempted station to pay for the inconvenience suffered due to the preemption.
To illustrate how preemptions result in capital gains, we fist discuss how ordinary reservations are made. When an user makes a request for a reservation slot, the type of reservation is specified. The reservation will be either lst, 2nd, or 3rd class. Before the local handler will allow the request to be made, the user must have enough money to cover the cost of the reservation. For each interval reserved, 1st class reservations cost P = 1st-class-rate per resexved machine slot, the 2nd class reservations cost P = 2nd-class-rate per reserved machine slot, and the 3rd class reservations cost NP = 3rd-class-rate per reserved machine slot. A user that does not want to risk a preemption from some other user must make a 1st class resexvations. Otherwise, the request is subject to preemption. If a user wants to preempt an existing 2nd class reservation, a 1st class request is issued. The cost for the request will be P=lst-class-rate per reSeNed machine slot and additional fee of P = ?h*2nd-class-rate per reserved machine slot, which is payable to the preempted user. The preempted user has earned a capital gain of P = M*2nd-cfass-rate per machine slot. The preemption of a 3rd class reservation does not pay any extra money to the preempted stations. This is because 3rd class reservations are only for the purpose of serving heavy users who want extra reservation capacity but do not have the funding available to make them. Heavy users can acquire extra capacity not wanted by others, but they will not dominate the system at the expense of others.
Users with 2nd or 3rd class reservations are subject to preemption until the preemptable._timegeriod before the reservation. If a station is not preempted earlier than the preemptable.-time period before the reservation, then the station will not be preempted. This avoids the possibility of users only knowing at the last minute if they have machines reserved to carry out their experiments.
For accounting purposes, the amount of P money a station owns because of daily income is kept separate from the amount acquired by capital gains. When a station spends money for first or second class reservations, the capital gains money is spent fist, and then the W y income money. This keeps the amount of savings under control so that a large savings will not be acquired. A station with a large amount of P money obtained from daily income could later dominate the system for a long time.
There are times that a user would like to cancel a reseIvation. They should be allowed to do this, but excessive cancellations should be discouraged. Otherwise, users could make as many reservations as they think they might like, then at the last possible moment cancel them. If this is done, other users who were prohibited from Ieserving the already allocated slots will be unaware that the reservations were cancelled. To discourage rampant cancellation of requests, a user that makes the cancellation will be partially responsible for the cost of slots even if they do not use them. The amount of partial responsibility depends on the length of time the cancellation occurred before the reservation is scheduled. The greater the time between cancellation and reservation, the less responsibility the user has for the cost of the reservation. For example, if cancellation occurred more than early-cancel-time days before a reservation, an early-cancel. rate refund is given. For time between early-cancel-time and midde-cancel-time days, the user receives m*ddIe.-cancel-rate refund. If cancellation was between middle-cancel-time and late-cancel-time days before the reservation, a late-cancel-rate refund is awarded. Otherwise, until last-cancel-time before the reservation, a last-cancel-rate refund is awarded.
If a user wants to buy slots that were previously cancelled, the user who made the cancellations is entitled to refunds beyond the normal cancellation refund. To encourage buyers of cancelled slots, discounts are given. The discount is the discount-,rate multipried by the difference between the original price, and the normal refund amount. The amount of the discount is also refunded to the o1igina.l buyer of the slots.
The free-market algorithm serves to resolve reservation contention in a processor bank It rewards those who use the system infrequently with high priority to capacity. It penalizes heavy users and those who frequently acquire and cancel reserved capacity. Nevertheless, heavy users can receive additional capacity if they are the only ones requesting it. The dgorithm is only one part of the reservation system. Another part is the interface, which is described in the next section.
6.3.2. User Interface of the Reservation System Table 6.5 shows the command interface that the local handlers provide to users of the reservation system.
The only command with an option is the Reserve command. This option allows users to resewe specific stations if they have been manually donated to the processor bank for the specified reservation time. If specific stations are not reserved, the coordinator will choose any of the available reservable stations. Note that the number of stations requested can vary in a range from a minimum number to a maximum number. The coordinator will hy to meet the request for the maximum number requested. For requests that cannot be met, the coordinator will try to meet the request with as many machines as possible. If the number of available machines is below the minimum allowable request, no reservation will be made.
A model of the flow of action in the reservation system is given in Figure 6.7. It is a chart illustrating the actions of a user and the local handler. The boxes represent actions of the user. The circles show actions of the local handler. Diamonds are conditions that the local handler checks beforb it takes further action. The symbols ResPend, Slotopen, and NeedSync are variables that the local h-mdler maintains when managing the session. The variable ResPend is set when the user has a reservation pending. The variable Slotopen is set if reservable slots are still open. When either new requests are made, or old requests are cancelled, the variable NeedSync is set to represent the need for synchronization with the coordinator. Normally, the local handler waits for a reservation session to open. This is illustrated by the box labeled Wait.
When a session is opened by the user with the MakeReservation command, the local handler asks the coordinator for system tables, and then waits for the user to choose one of the commands. Depending on the command chosen, the local handler carries out the desired action.
Reservation can only be made when slots are available. Likewise, reservations can only be cancelled when there is a pending reservation. When reservations are made or cancelled, the local handler must remember to synchronize with the coordinator when the session is closed. If synchronization fails (the requests are rejected by the coordinator), the user is notified. Successful synchronization allows the session to be closed. Otherwise, the user

50
Reservation System User Commands .,_,_.. MakeReservation
Open a session with the reservation system.
Display Start Stop Display reservation and open slots between the given start and stop times.
Make a reservation, between the start and stop time for the number of stations specified by NumStations. Class is a variable giving the type of reservation made. Optionally list specific stations wanted. NumStations can vary between lower and upper limits.
Reserve Start Stop NumStations Class [Specijic Stations]
Unreserve Start Stop NumStations Remove a reservation, specified by start time, stop time, and NumStations.
Check UserID Check when is a reservation time.
Sync Synchronize reservation updates with the coordinator without ending the session with the reservation system.
Close Close session with the reservation system. Send coordinator the reservation request. Wait for acknowledgement of request.
-.-- Only with acknowledgment is the reseFation appxoved. -_.-- -- Table 6.5.
is notified and is given an opportunity to try something else. The Display and Check commands cause information from the local handler’s tables to be shown to the user.
6.3.3. Reservation Coordinator’s Tables Several tables are needed to implement the reservation system. Some tables are kept by the coordinator, some
by the local handers. A few tables are transferred between the coordinator and the handlers. One table contains the state of the system, from which future reservation information can be derived. This
table is called the System Table, and is shown in Table 6.6. Several fields are needed. These include the name of the workstations and their owners, as represented by the Station ID and Owner fields.
The system administrator decides the poItion of the total number of machines in a cluster that are reservable for each hour of a day. Some of the workstations might be available for a specific time period because they were manually donated to the processor bank. The system state includes the times that stations are donated manudly to the processor bank. Manual donations can be given either gZobally and periodically. A global donation means that stations are reservable for all times of the day, and for every day until the time specified by the field labeled Global Donation. When people expect to be absent from work for several days, they donate their machines globalIy. Some stations might be public resources without owners. These stations are always available for reservations. Stations H and I of Table 6.6 are examples of this type of station. A station with a negative value for the global donation time is not globally available. It might however be available on a periodic basis. A user might donate her machine

51
-.-(--J _I---.. j-r-t---+ NeedSync:=O
Respend: Reservation Pending Slotopen: Slots are Open Needsync: Needs Synchronization
Figure 6.7: Local Handler’s Flow Chart

52
A -1 M-SU 0:00-7:00 NA 6.3 1.0 brown____--^ Sa-Su 22:OO-1000 brown 0.0 B 1159 2/13/87 T-SU 200-600 NA 2.0 4.0
Station ID Global Donation Periodic 1 state PO NP Owner Periodic 2 Client PG
F-Su 23:OO-8:OO smith 3.0 M-F 23:00-5:00 AV 2.0 4.0 Sa-Su 2200-1000 none 1.0 -1 NA 7.0 10.0 -1
-1
-1
- . _ ~ ~ -
hvis ..---.- .-. .----
root 2.0 .-_.--- 000 12/31/99 M-Su 000-2359 FRN 0 0
000 12/31/99 M-Su 000-23:59-- NR 0 0 smith 0 .--. .----. ---.-. - root
root none 0 _-.-.. --- --.----- .-.-.-I--- -- -
Sa-Su 23:OO-9:00 none 1.0
Sa-Su 23:OO-7:00 none 0.0
F-Su 21:OO-1000 ,_ brown 2.0 RES 1.0 5.0
ohon ---- -1 M-Sa 0:00-8:00 AV
0:OO 2/2/87--- M-F 2:00-9:00
-1 T-Th 19:00-8:00 FRN 3.0 6.0 - -- Charles
Monday through Friday (M-F) from the hours of 8PM and 6AM and from 8PM to ZOAM on Saturday through Sunday (Sa-Su). For periodic donation, the stations are only donated for the hours listed. The times shown are the starting and stopping times of periodic donations. The table shown supports two periodic donation periods on a weekly basis.
The system table maintains the state of a workstation. The workstation’s state can be NA, AV, FRN, RES, and NR. The AV state denotes the station is in the processor bank but is not allocated. NA says that the station is not in the processor bank. The FRN state means the station is in the processor bank and allocated to a users, but not as a time reservation. When a station is being used for a reservation, it is in the RES state. A station is in the NR state when it is not-reserved but is available for a specilic reservation.
Other fields in the system table are labeled client, PO , PG , and NP. The client is the user, if any, currently consuming cycles on the workstation. The other fields are used by the coordinator to make decisions controlling the acceptance or rejection of reservation requests, by means of the free-market algorithm. Po represents the amount of P money the station has accumulated through daily income. PG is the P money from capital appreciation.
Other tables kept by the reservation coordinator include die Accounting List, Reservation List, and the GZobaZ Reservation Table. These are shown in Tables 6.7-6.9. The accounting list provides a level of indirection so that several users can be associated with a particular machine. For example, the access to the reservation system for group of graduate students might be linked to a single wokstation. As shown in Table 6.7,jones, smith, baker, and davis are all Linked to station F. This link is established by the students’ supervisor. The students cooperate among themselves to access their workstation’s share of reservation capacity. This feature controls a student’s activity so that he will not dominate the system to the exclusions of others.
The global reservation table of Table 6.8 gives the reservation status for all machines for each time of the day. It is kept in chronological order for each reservation interval (normally each interval is one hour). The global reservation table has a mask that marks the state of the machines during this reservation interval. In general, the mask consists of two bits for each machine in the system. The two bits represent the states Reserved Specifrc, Reserved Non-Specijc, Not-Reserved, and Unreservable. A station is marked Reserved Specific if someone has
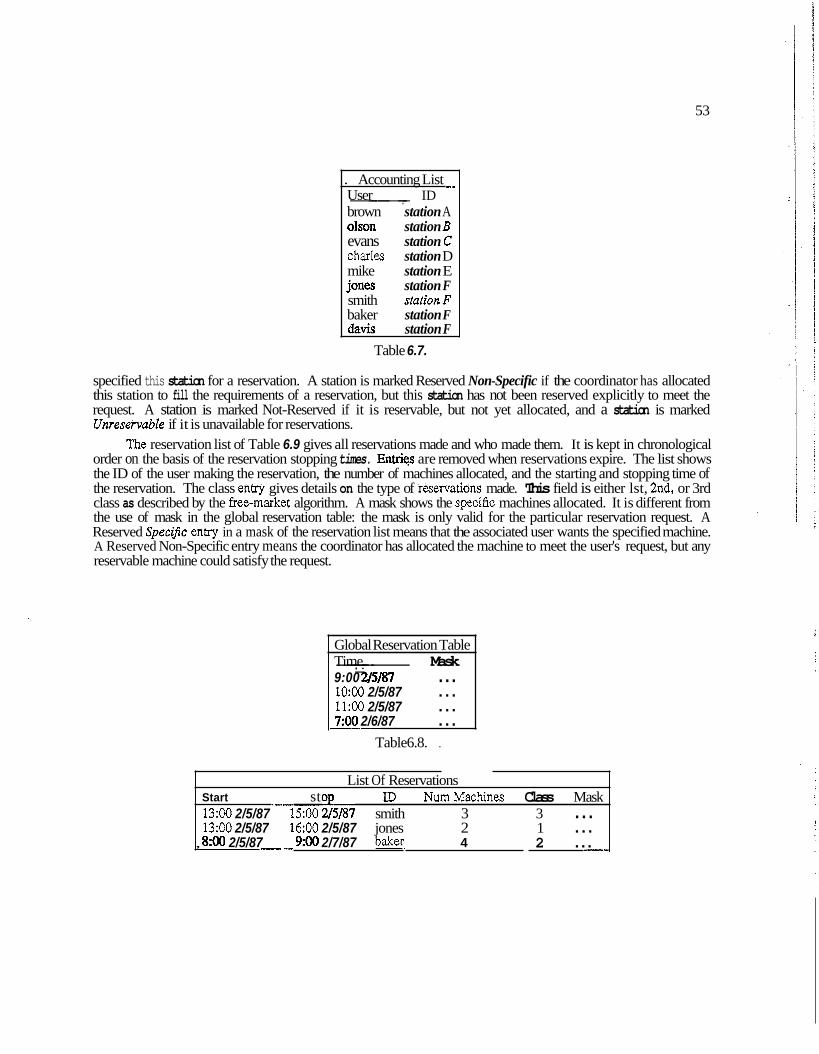
53
List Of Reservations LD NumMachines Class Mask - Start sto
13:OO 2/5/87 '-75:OO &I87 smith 3 3 ... 13:OO 2/5/87 16:OO 2/5/87 jones 2 1 ...
2 ... .-_ , 8:OO 2/5/87 __,__ .._ 9:OO 2/7/87 baker 4
. Accounting List __ User ID brown station A -------.--
Olson station B evans station C Charles station D mike station E jones station F smith stationF baker station F davis station F
Table 6.7.
specified this station for a reservation. A station is marked Reserved Non-Specific if the coordinator has allocated this station to fill the requirements of a reservation, but this station has not been reserved explicitly to meet the request. A station is marked Not-Reserved if it is reservable, but not yet allocated, and a station is marked Unreservable if it is unavailable for reservations.
The reservation list of Table 6.9 gives all reservations made and who made them. It is kept in chronological order on the basis of the reservation stopping times. Entxiqs are removed when reservations expire. The list shows the ID of the user making the reservation, the number of machines allocated, and the starting and stopping time of the reservation. The class enhy gives details on the type of reservations made. This field is either lst, 2nd, or 3rd class as described by the free-market algorithm. A mask shows the specisc machines allocated. It is different from the use of mask in the global reservation table: the mask is only valid for the particular reservation request. A Reserved Specific enay in a mask of the reservation list means that the associated user wants the specified machine. A Reserved Non-Specific entry means the coordinator has allocated the machine to meet the user's request, but any reservable machine could satisfy the request.
i Global Reservation Table Time Mask 9:00 2/5/87 ... 1000 2/5/87 ... 11:OO 2/5/87 ... 7:OO 2/6/87 ...
---.._I---
--.-- Table6.8. .

54
6.3.4. Tables Used By The Local Handler When a user opens a reservation session, the local handler on the user’s station requests tables from the
coordinator in order to conduct the reservation session. The local handler would receive a copy of the Reservation List (“able 6.9) and the Global Reservation Table (Table 6.10). These tables are used by the local handler when the user wants to know who has made reservations and which specific machines are reserved. The local handler also receives information from the coordinator that is extracted from of the System Table (Table 6.6). The information from the System Table helps create the Global Availability Table (Table 6.10). It informs the user of the amount of capacity available in the processor bank
When a user makes a reservation request with its local handler, the local handler generates a Reservation Request Table (Table 6.11). This table associates a Reservation ID with each request. The request is for either the addition of a new reservation, or the cancellation of an old one. The table includes the user’s specified starting and stopping times, their ID, and a lower and upper bound on the number of requested machines. A mask is associated with the entry to request specific machines.
When the requests in the Reservation Request Table are synchronized with the coordinator, the coordinator sends a Reservation Request Acknowledgement Table (Table 6.12) to the local handler. This table holds the xeservation ID, the mask of specific machines request, and an entry that denotes either acceptance or rejection of the reservation.
It is important to note that all operations on the reservation tables are made locally. At time of synchronization, the Coordinator examines the modifications made, and then updates the master copy of the Ieservation tables. The coordinator knows which local handers in the system have copies of the reservation tables. It sends any updates to those local copies. When a local site has a copy of the reservation table and receives some updates from the coordinator, the local site will make those updates in its local copy. If any of those new updates conflict with the modification made to the local copy by the local user, then the user will be notified that their reservation request will not be honored, and the reservation process will need to be repeated.
---.---....--..--.- -.--...--- Global Availability Table
k i e Numb&-?l -- 9:00 2/5/87 10:OO 2/5/87 7 11:OO 2/5/87 6 1200 2/5/87 10 13:OO 2/5/87 10 14:OO 2/5/87 11 15:OO 2/5/87 12
Table 6.10.
.--.- -..- - --.-.---- ---- -- ---__. -.-- Reservation Request Table
Res. Add Start StOP ID Lower Upper Class Mask ID Delete
.,-- .______ .--_.-.- -___----- -. .- - --.-----. ---
5 Add 15:OO 2/8/87 18:OO 2/8/87 jones 2 3 2 ... 19:OO 2/9/87 22:OO 2/9/87 , jones 4 4 2 ... 6 Add .-_--
Table 6.1 1.

55
---.-...--.. - Reservation ID Mask Accept
... Add Table 6.12.
6.4. Summary It has recently become feasible to have computing environments consisting of clusters of powerful
workstations. The challenge presented to designers is to integate woxkstations into processor banks that can be used globally by all users without conflicting with the principle that workstation owners are entitled to have exclusive access to their machines. We present a design that gives users the ability to reserve partitions of a processor bank with little interference experienced by workstations’ owners.
The system distributes the control of a reservation system to workstations by means of local handlers. The local handlers are responsible for handling the interaction between users and reservation tables. A central coordinator is used for synchronization of workstation reservation tables. The coordinator’s duties are kept simple so that the coordinator could be physically located on one of the workstations in the system.
We presented a new reservation scheduling algorithm, called the free-market algorithm. This algorithm enables heavy users to make reservations of available capacity without severely limiting access to capacity by light users. The algorithm has the goal to minimize the amount of time that unreserved capacity exists and a user has been denied a reservation. While giving a high quality of service to light users, the algorithm allows users to reserve large amounts of capacity to conduct their experiments when such capacity is avaiIable.

CHAPTER 7
Conclusions and Future Research Directions
7.1. Conclusions Clusters of private workstations have become prevalent in modem computing environments. These clusters
represent computing resources that were previously only available to users at institutions with supercomputers. Nevertheless, the power in the clusters generally have been unused due to ineffective means of sharing among users. The formation of a processor bank from a cluster of workstations makes the power of the cluster available to users. Users expand their access to capacity by executing background jobs and by reserving partitions of workstations from the processor bank. Background jobs are computationally intensive and have little interaction with their home workstations. The reservation of partitions from the processor bank enable users to experiment with distributed computations. The processor bank is a convenient vehicle for supplying the needed capacity to support these activities.
Special attention must be given to the method of forming the processor bank since workstations are private resources under the control of their owners. Workstations become sources of capacity for sharing in a processor bank only when their owners donate them. It is feasible to implement a processor bank if workstations can be donated for a large amount of time and for long intervals. In Chapter 3 we analyzed the availability of a group of woIkstations and determined that they were available approximately 70% of the time observed. Many of the available intervals were very long, which is ideal for sharing capacity to support background jobs. We observed that as many as 40% of the workstations in a cluster were available for reservation at all times in Chapter 6, showing the suitability of reserving the capacity of a processor bank.
We investigated the patterns of activity to develop a model of workstation availability as a stochastic process. The availability and non-availability periods were recorded to determine the distribution of the periods. A model of workstation availability was derived where we found that 2-stage and 3-stage hyperexponential distributions closely fit the relative frequency distributions of observed patterns of the respective non-available and available intervals.
In order to take advantage of the massive amount of capacity available in a cluster of workstations, a system was designed to form a processor bank and to schedule users’ jobs. Our design approach takes into account both the background jobs that users submit and their reservation activities. Our goal is to provide a good quality of service to users who want to share capacity, while causing little interference to the local activities of workstation owners. Chapter 4 presented the portion of the design of a long term scheduling system for background jobs. An implementation of the system, called Condor, hunts for capacity that is available for donation to the processor bank.
Some users of Condor try to acquire as much capacity as they can for long periods. These user have a large number of jobs to execute because they explole problems that require a great amount of computational resources. These heavy users could inhibit light users’ access to the processor bank. To accommodate the diverging demands of the heavy and light users, capacity is allocated to local schedulers by a central coordinator according to the Up- Down algorithm. The Up-Down algorithm enables heavy users to receive access to capacity without inhibiting light users’ access to capacity. Without such controls, heavy users would dominate the system.
A profile of an implementation of the Condor scheduling system was given in Chapter 5. It showed that Condor has been an extremely effective means of improving the productivity of our computing environment Condor schedules background jobs at available workstations whose capacity otherwise would be unused. Due to Condor’s checkpointing capability, jobs submitted to the system will eventually complete even if a remote location fails.
Many jobs are well suited for scheduling by Condor because of the high leverage they obtain. Leverage is the benefit a user gains by executing a job at the processor bank versus the support required for its execution at the bank. We observed that the average leverage of jobs executed by Condor during one month was 1300. This means
56

57
that users sacrificed one minute of local workstation capacity to receive almost one day of CPU capacity from the processor bank.
In the introduction of this thesis we asked whether we could provide a high quality of service in a highly utilized cluster of workstations. Through the design of the Condor system and the results presented, this pending question is answered affirmatively.
In Chapter 6 we showed the feasibility of reserving partitions of computers for users and extended the design of the Condor system to include a reservation system. Included in the reservation system design is the presentation of the free-market algorithm. The free-market algorithm used for allocating reservation capacity is designed to enable heavy users to make reservations without severely limiting access to reservations by light users.
7.2. Future Research Directions
presented. The following are issues that we intend to study M e r . New design, performance, and implementation issues should be explored to build upon the research we have
Sharing Capacity in a Wide Area Network Clusters of workstations interconnected by local area netwoxks are common in university and industrial sites
throughout the world. A large number of these local area netwoxks are connected by wide area networks such as NFSnet lMilIs87], Bitnet, and the Arpanet [Jennings86]. The interconnection of separate clusters of workstations enables capacity sharing among users separated by long distances. Hierarchies of workstation clusters can be formed for sharing. A processor bank at one location could serve background jobs submitted from a workstation that is located many miles away. The sharing of capacity among separate clusters of workstations increases the importance of prohibiting jobs from one cluster of workstations from monopolizing the processor bank of another cluster of workstations. A group of users from a heavily utilized cluster of workstations could dominate the access of another group of users to their local resources. Extensions to the XJp-Down algoxithm for managing capacity of hierarchies of workstation clusters need to be considered. Questions concerning the cost of handling the placement of remote jobs, checkpointing, and remote system calls should be investigated.
Protection Issues The issue of computer viruses [Israe187, St011881 has become an impoxtant issue as cases of malicious use of
computer systems interconnected by local and wide area networks are brought to light. A computer virus is a program that is disseminated among computer systems which has the purpose of tampering with the security and resources of the computer systems. A user of the program that has been infected with a virus might not be aware that the virus exists in the program. Since the Condor system allows users to execute jobs at remote computers, the threat of Condor placing programs with viruses at remote sites is an important concern to workstation owners. The system call handling routines of Condor need to be made secure, and the entire issue of protection in the Condor system needs serious consideration.
Scheduling Parallel Computations on a Cluster of Workstations The long term scheduling system described in this thesis.schedules sequential background jobs at partitions
allocated to users. The processor bank formed from a cluster of workstations can be an important source of capacity for parallel computations. Partitions could be allocated for the execution of parallel computations on the basis of availability. A size of a partition for a parallel computation can change as workstations are withdrawn fiom the processor bank, or to accommodate other parallel computations.
Many problems arise when introducing parallel computations to a processor bank. For example, research questions are open on how to place the threads of control of a parallel computation on multiple machines in a partition, especially since machines in a partition can be preempted. Due to communication and service demand characteristics of a group of parallel computations, a scheduler might wish to overlap parallel computations on a set of machines. The criteria for evaluating the quality of service provided to users becomes an interesting challenge to define. Problems such as these indicate that the scheduling of multiple paallel computations on a distributed system, such as a prccessor bank, is expected to be an important area of research for many years to come.
58
Enhancements to Condor
Enhancements which we think are important to achieve in the near future are the following: Several enhancements can be made to Condor which would improve the computing environment of its users.
A Simulation Laboratory with Deadline Constraints From our study, we have found that good predictions of the amount of available workstation capacity in a
processor bank can be made. If we have knowledge of the amount of available capacity in the processor bank, and can receive information of the amount of capacity required by jobs that execute at the processor bank, we can make good predictions of when the jobs complete. A simulation job is an example of a type of job which one might have knowledge of its processing demands. By combining knowledge of the processing demands of simulation jobs, and the amount of capacity available to serve them, a simulation laboratory based on a processor bank could be built that makes good predictions of when jobs complete. An enhanced predictor would allow deadlines to be attached to jobs. Jobs would be scheduled to meet their proposed deadlines. Simulation jobs with urgent deadline constraints could be given priority over jobs with less urgent deadlines. The problem of supporting a simulation laboratory with the capability of predicting the completion time of jobs is one which we want to explore.
Scheduling Remote Capacity in a Heterogeneous System Many workstation clusters contain machines of different sizes of memory, varying amounts of processing
power, and different instruction sets. Condor can be extended so that it manages a hetemgeneous processor bank. An interesting question is how to choose the appropriate workstation for executing a job in a heterogeneous cluster. The placement decision takes into account a job’s requirements and the usage patterns of each workstation that can satisfy the job’s demand. A job that is compiled into separate binary files can execute at workstations of different instruction sets. A pIoblem encountered when a job that has begun execution is that it cannot be moved to a workstation of a different instruction sqt without losing all the work done on the first workstation. We intend to study this placement problem encounteIed when sharing capacity in a processor bank composed of a heterogeneous cluster of workstations.
Enhancing Condor with a Reservuzion Cupubility Condor should be enhanced with the ability to reserve partitions in advance. From the implementation of a
reservation system, researchers could study the workload characteristics of reservation requests, and gain insight on good performance criteria to evaluate reservation algorithms. This infoxmation would enable reservation algorithms, such as the free-market algorithm, to be evaluated and tuned to fit the requirements of users of a reservation system of a processor bank.

59
References
[Agrawal85]
[ArtSy861
Dorg831
LChandy75 J
[Chandy85a]
[Chandy85bl
Khang851
[Chavey86]
[Cheriton83]
[Craft831
R. Agrawal and A. E Ezzat, "Processor Sharing In NEST A Network Of Computer Workstations," Proceedings of 1 st International Conjerence on Computer Workstations, (November, 1985).
Y. Artsy, H.-Y. Chang, and R. Finkel, "Processes Migrate in Charlotte," Technical Report #655, University of Wisconsin, (August, 1986).
A. Borg, J. Baumbach, and S. Glazer, "A Message System Supporting Fault Tolerance," Proceedings of the Ninth Symposium on Operating Systems Principles, pp. 90-99, (October, 1983).
K. M. Chandy, J. C. Browne, C. W. Dissly, W. R. Uhrig, "Analytic Models for Rollback and Recovery Strategies in Data Base Systems," IEEE Transactions on Sofrware Engineering, SE-l(l), pp. 100-110, (March, 1975).
K. M. Chandy and C. V. Ramamoorthy, "Rollback and Recovery Strategies for Computer Programs," IEEE Transactions on Computers, C-21(6), pp. 546-556, (June, 1972).
K. M. Chandy and L. Lamport, "Distributed Snapshots: Determining Global States of Distributed Systems," ACM Transactions on Computer Systeh, pp. 64-75, (February, 1985).
R-Y. Chang and M. Livny, "Priority in Distributed Systems," Proceedings of the Real-Time Systems Symposium, (December, 1985).
D. Chavey, Private Correspondence, University of Wisconsin, Madison, Wisconsin, (December, 1986). The job was searching for the existence of certain kinds of combinatorial configurations called Latin squares.
D. R. Cheriton, W. Zwaenepoel, "The Distributed V Kernel and its Performance for Diskless Workstations," Proceedings of the Ninth Symposium on Operating Systems Principles, pp. 110-1 19, (October, 1983).
D. H. Craft, "Resource Management in a Decentralized System," Proceedings of the Ninth Symposium on Operating Systems Principles, pp. 11-19, (October, 1983).
LDanneberg851 R. B. Dannenberg and P. G. Hibbard, "A Butlex Process for Resource Sharing on Spice Machines," ACM Transoctioas on Office Informtion Systems, 3(3), pp. 234-252, (July, 1985).
[DeWitt87]
[Douglis87]
Eager86 J
D. J. DeWitt, R. Finkel, and M. Solomon, "The CRYSTAL Multicomputer: Design and Implementation Experience," IEEE Transactions on Sofrware Engineering, pp. 953-956, (August, 1987).
F. Douglis and J. Ousterhout, "Process Migration in the Sprite Operating System," Proceedings of the 7th International Conference of Distributed Computing System, Berlin, West Germany, pp. 18-25. (September 21-25,1987).
D. Eager, E. Lazowska, and J. Zahojan, "Adaptive Load Sharing in Homogeneous Distributed Systems," IEEE Transactions on Sofware Engineering, SE-12(5), (May, 1986).

iTerguson881
Pe11ari721
Pemi78J
Prancez8q
[Gelenbe83
[Gelenbe791
[Hagmm861
[Israe187]
[James77
[Jennings]
Kay881
[Kleinrock75]
[Kleimock76]
60
D. Ferguson, Y. Yemini, and C. Nikolaou, "Microeconomic Algorithms for Load Balancing in Distributed Computer Systems", Proceedings of the 8th International Cogerenee of Distributed Computing Systems, San Jose, CA, pp. 491-499, (June 13-17,1988).
D. Ferrari, "Workload Characterization And Selection In Computer Performance Measurement," Computer 15(4) pp. 18-24 (July-August, 1972).
I). Ferrari, Computer Systems Peflormance Evaluation, Prentice-€%ill, Englewood Cliffs, NJ. (1978). Chapter 5.
N. Francez, Fairness, Springer-Verlag, New Y ork, (1986).
E. Gelenbe, D. Finkel, S. K. Tripathi, "On the Availability of a Distributed Computer System with Failing Components," Proceedings of the ACM Sigmetrics Conference on Measurement and Modeling of Computer Systems, pp.6-13 (1985).
E. Gelenbe, "On the Optimal Checkpoint Interval," Journal of the ACM, 26(2), pp. 259-270, (Ap~il, 1979).
R. Hagmann, "Processor Server: Sharing Processing Power in a Workstation Environment," Proceedings of the 6th ZEEE Distributed Computing Conference, Cambridge, M A , pp. 260-267, (May, 1986).
H. Israel, Tomputer Viruses: Myth or Reality", Proceedings of the 10th National Security Conference, Baltimore, MD, (September, 21-24,1987).
M. L. James, G. M. Smith, and J. C. Wolfoxd, Applied Numerical Methods for Digital Computation, Harper & Row, Publishers, pp. 285-287, (1977).
I). M. Jennings, L. H. Landweber, I. H. Fuchs, D. J. Farber, W. R. Adrion, "Computer Nehvorks for Scientist", Science, pp. 943-950, (February 28,1986).
J. Kay and P. Lauder, "A Fair Share Scheduler," Communications of the ACM", 32(1) pp. 44-45 (January, 1988).
L. Kleinrock, Queueing Systems, Volume I:. Theory, John Wiley & Sons Publishing Company, (1975).
L. Kleinrock, Queueing Systems, Volume 2: Computer Applications, John Wiley & Sons Publishing Company, (1976).
[Kleinrock85] L. Kleinrock, "Distributed systems", Communications of the ACM", 28(11) pp. 1200- 1213 (January, 1985).
[Klingner81] C. Klingner, "FOCUS Scheduling: Philosophy and Algorithm", Computing Division Technical Report, (June, 1981).
[Kobayashi8 11 K. Kobayashi, Modeling and Analysis: An Introduction to System Performance Evaluation Methodology, Addison-Wesley Publishing Company, (1981).

Weger881
[K urose8 51
&azowska81]
[Leland861
[Litzkow87a]
lJitzkow87b]
lJ,itzkow88]
[Livny82]
ILivny881
MIS871
Wutka87al
61
D. E. Knuth, The Art Of Computer Programming, Vol2 Seminumerical Methods, Addison-Wesley Publishing Company, (198 1).
C. M. Krishna, IS. G. Shin, and Y-H. Lee, “Optimization Criteria for Checkpoint Placement,” Communications of the ACM 27, pp. 1009-1012, (1984).
P. Krueger and M. Livny, “The Diverse Objectives of Distributed Scheduling Policies”, Proceedings of the 7th International Conference of Distri&uted Computing Systems, Berlin, West Germany, pp. 242-249, (September 21-25,1987).
P. Krueger and M. Livny, ”A Comparison of Preemptive and Non-Preemptive Load Balancing”, Proceedings of the 8th International Conference of Distributed Computing Systems, San Jose, California, pp. 123-130, (June 13-17,1988).
J. F. Kurose, M. Schwartz, and Y. Yemini, “A Microeconomic Approach to Decentralized Optimization of Channel Access Policies in Multiaccess Networks”, Proceedings of the 5th International Conference of Distributed Computing Systems, Denver, Colorado, pp. 70-77, (May 13-17.1985).
E. D. Lazowska, 13. M. Ixvy, G. T. Almes, M. J. Fischer, R. J. Fowler, S. C. Vestal, “The Architecture of the Eden System“, Proceedings of the Eighth ACM Symposium on 0. S. Principles, pp. 148-159, (December, 1981).
W. E. Leland and T. J. Ott, “Load-balancing Heuristics and Process Behavior,” Proc. of the 1986 ACM Sigmetrics Conference on Measurement and Modeling of Computer Systems (May, 1986).
M. Litzkow, Private Correspondence, University of Wisconsin, Madison, Wisconsin, (April, 1987). Phoenix, Arizona, (June, 1987).
M. Litzkow, “Remote Unk,” Proceedings of I987 Summer Usenix Conferences, Phoenix, Arizona, (June, 1987).
M. J. Litzkow, M. Livny, and M. W. Mutka, “Condor: A Hunter of Idle Workstations,” Proceedings of the 8th International Conference of Distributed Computing Systems, San Jose, California, pp. 104-111, (June 13-17.1988).
M. Livny and M. Melman, “Load Balancing in Homogeneous Broadcast Distributed Systems,” Computer Network Performance Symposium, pp.‘47-55, (April, 1982).
M. Livny, “DeNet - A Modula-2 Based Simulation Language,” Computer Sciences Department Technical Report, University of Wisconsin, Madison, Wisconsin (in preparation).
D. L. Mills, H-W. Braun, “The NFSNET Backbone Network“, Proceedings of the ACM SigComm ’87 Workshop, Stowe, Vermont, pp. 191-196, August 11-13,1987.
M. W. Mutka and M. Livny, “Scheduling Remote Processing Capacity in a Workstation-Processor Bank Network, Proceedings of the 7th International Conference of Distributed Computing Systems, Berlin, West Germany, pp. 2-9, (September 21-25,1987).

62
Mutka87bI M. W. Mutka and M. Livny, "Profiling Workstations' Available Capacity for Remote Execution", Performance '87, Proceedings of the 12th IFIP WG 7.3 Symposium on Computer Performance, Brussels, Belgium, pp. 529-544, (December 7-9,1987).
[Needham82] R. M. Needham and A. J. Herbert, The Cambridge Distributed Computing System, Addison-Wesley Publishing Company (1982).
INichols87] D. A. Nichols, YJsing Idle Workstations in a Shared Computing Environment", Proceedings of the 1 l th Symp. on Operating System Principles, pp.5-12, (November, 1987).
[Ousterhout88] J. K. Ousterhout, A. R. Cherenson, F. Douglis, M. N. Nelson, and B. B. Welch, "The Sprite Network Operating System," Computer, pp. 23-36, (February, 1988).
[PopekS 1 J
Lpowell83al
[Powell83b]
Wtchie781
[Sandon871
[S tankovic841
[S toll881
IStumm881
[Theher851
[T1ivedi82]
Ivnixl
G. Popek, B. Walker, J. Chow, D. Edwards, and C. Kline, "LOCUS: A Network Transparent Highly Reliable Distributed System," Proceedings of the Eighth Symposium on Operating Systems Principles, (December, 1981).
M. L. Powell and B. P. Miller, "Process Migration in Demos/MP," Proceedings of the Ninth Symposium on Operating Systems Principles, pp. 110-,119, (October, 1983).
M. L. Powell and D. L. Presotto, "Publishing: A Reliable Broadcast Communication Mechanism," Proceedings of the Ninth Symposium on Operating Systems Principles, pp. 100-109, (October, 1983).
D. M. Ritchie and K. Thompson, "The UNIX Timesharing System", Bell Labs Technical Journal, 57(6) (July, 1978).
P. Sandon, "Learning Object-Centered Representations," Ph. D. Thesis, University of Wisconsin, Madison, Wisconsin, (August, 1987).
J. A. Stankovic, "Simulations of Three Adaptive Decentralized Controlled, Job Scheduling Algorithms," Computer Networks, 8(3), (June, 1984).
C. Stoll, "Stallcing the Wily Hacker," Communication of the ACM, 31(5), pp. 484-496, (May, 1988).
M. Stumm, "The Design and Implementation of a Decentralized Scheduling Facility for a Workstation Cluster," Proceedings of the 2nd IEEE Conference on Computer Workstations, pp. 12- 21, (March, 1988).
M. M. Theimer, K. A. Imtz, and D. R. Cheriton, "Preemptable Remote Execution Facilities for the V-System," Proceedings of the 10th Symp. on Operating Systems Principles, pp. 2-12, (December, 1985).
K. S. Trivedi, Probability And Statistics Wilh Reliability, Queueing, And Computer Science Applications, Prentice-Hall, Englewood Clif fs , NJ., (1982). pp. 129-130.
Unix 4.3BSD System Call Manual.

63
Walker83 J
IWang851
mirth831
[Young741
[Zhou871
B. Walker, G. Popek, R. English, C. Kline, and G. Thiel, "The LOCUS Distributed Operating System," Proceedings of the Ninth Symposium on Operating System Principles, (October, 1983).
Y-T Wang and R. J. T. Morris, "Load Sharing in Distributed Systems," IEEE Transactions on Computers, C-34(3), (March, 1985).
N. Wirth, Programming in Modulu-2, Springer-Verlang (1983).
J. W. Young, "A First Order Approximation to The Optimum Checkpoint Interval," Communication ofthe ACM, 17(9), pp. 530-531, (September, 1974).
S. Zhou, "A Trace-Driven Simulation Study of Dynamic Load Balancing," University Of California Technical Report UCB/CSU 87/305, (March, 1987).