Embed Size (px)
Citation preview

HAL Id: hal-00809731https://hal-enpc.archives-ouvertes.fr/hal-00809731
Submitted on 11 Apr 2013
HAL is a multi-disciplinary open accessarchive for the deposit and dissemination of sci-entific research documents, whether they are pub-lished or not. The documents may come fromteaching and research institutions in France orabroad, or from public or private research centers.
L’archive ouverte pluridisciplinaire HAL, estdestinée au dépôt et à la diffusion de documentsscientifiques de niveau recherche, publiés ou non,émanant des établissements d’enseignement et derecherche français ou étrangers, des laboratoirespublics ou privés.
Improving the sustainability of granular iron/pumicesystems for water treatment
Stafania Bilardi, Paolo S. Calabro, Sabine Caré, Nicola Moraci, ChicgouaNoubactep
To cite this version:Stafania Bilardi, Paolo S. Calabro, Sabine Caré, Nicola Moraci, Chicgoua Noubactep. Improvingthe sustainability of granular iron/pumice systems for water treatment. Journal of EnvironmentalManagement, Elsevier, 2013, 121, pp.133-141. <10.1016/j.jenvman.2013.02.042>. <hal-00809731>

1
Improving the sustainability of granular iron/pumice systems for water 1
treatment 2
Stefania Bilardia, Paolo S. Calabròa, Sabine Caréb, Nicola Moracia, Chicgoua Noubactepc,d,∗ 3
aUniversità degli Studi Mediterranea di Reggio Calabria, MECMAT, Mechanics and Materials Department, Faculty of 4
Engineering, Via Graziella, loc. Feo di Vito, 89122 Reggio Calabria, Italy. 5
bUniversité Paris-Est, Laboratoire Navier (UMR 8205), CNRS, ENPC, IFSTTAR, F-77455 Marne-la-Vallée, France; 6
cAngewandte Geologie, Universität Göttingen, Goldschmidtstraße 3, D-37077, Göttingen, Germany. 7
dKultur und Nachhaltige Entwicklung CDD e.V., Postfach 1502, D-37005 Göttingen, Germany 8
* e-mail: [email protected]; Tel. +49 551 39 3191, Fax. +49 551 399379. 9
Abstract 10
Metallic iron (Fe0) is currently used in subsurface and above-ground water filtration systems on a 11
pragmatic basis. Recent theoretical studies have indicated that, to be sustainable, such systems 12
should not contain more than 60 % Fe0 (vol/vol). The prediction was already validated in a Fe0/sand 13
system using methylene blue as an operational tracer. The present work is the first attempt to 14
experimentally verify the new concept using pumice particles. A well-characterized pumice sample 15
is used as operational supporting material and is mixed with 200 g of a granular Fe0, in volumetric 16
proportions, varying from 0 to 100 %. The resulting column systems are characterized (i) by the 17
time dependent evolution of their hydraulic conductivity and (ii) for their efficiency for the removal 18
of CuII, NiII, and ZnII from a three-contaminants-solution (about 0.30 M of each metal). Test results 19
showed a clear sustainability of the long term hydraulic conductivity with decreasing Fe0/pumice 20
ratio. In fact, the pure Fe0 system clogged after 17 days, while the 25 % Fe0 system could operate 21
for 36 days. The experimental data confirmed the view that well-designed Fe0 PRBs may be 22
successful at removing both reducible and irreducible metal species. 23
24 * Corresponding author: Tel. +49 551 39 3191, Fax. +49 551 399379; E-mail: [email protected].

2
Keywords: Column study, Hydraulic conductivity, Reactive walls, Pumice, Zerovalent iron. 1
2
1 Introduction 3
Filter materials for water treatment are ideally used in small quantities. The high required affinity of 4
used aggregates for efficient water treatment is not always readily available in natural materials. On 5
the other hand, efficient filters should be designed to make the best use of these latter with the 6
minimum of processing (Smith et al., 2001). Alternatively, readily available natural materials (e.g. 7
anthracite, gravel, pumice, sand) may be mixed to low cost synthetic aggregates/materials (activated 8
carbon, blast furnace slag, metallic iron) for improving the performance of the resulting water 9
treatment systems. The key properties determining the permeability, the stability and the longevity 10
(sustainability) of granular filters include porosity/texture of used particles, particle size, particle 11
shape and particle size distribution or material sorting (Haarhoff and Vessal, 2010; Kubare and 12
Haarhoff, 2010; Miyajima, 2012; Btatkeu et al., 2013; Caré et al., 2013). Two key interrelated 13
properties required for a sustainable filter include: (i) high permeability combined with resistance to 14
internal erosion of fines and (ii) low susceptibility to chemical attack (prerequisite 1). 15
Granular metallic iron (Fe0), as currently used in water treatment, is a reactive material and its 16
oxidative dissolution by water is a volumetric expansive process (Pilling and Bedworth, 1923; Caré 17
et al., 2008). This means that Fe0 is highly susceptible to chemical attack and the products of this 18
chemical reaction are fines/precipitates (iron hydroxides and oxides). In other words, ‘prerequisite 19
1’ is not satisfied as the sustainability of Fe0 filters is impaired by the same properties making Fe0 20
an attractive material: the chemical reactivity of iron (Liu et al. 2013). However, without 21
considering these key properties, Fe0 permeable reactive barriers (Fe0 PRBs) have become an 22
established technology for the treatment of contaminated groundwater (O'Hannesin and Gillham, 23
1998; Li et al., 2006; Li and Benson, 2010; Comba et al., 2011; Gheju, 2011; Ruhl et al., 2012). 24
Currently, about 180 Fe0 PRBs have been installed worldwide (ITRC, 2011). 25

3
The fundamental mechanisms of contaminant removal in Fe0 filtration systems are adsorption, co-1
precipitation and adsorptive size-exclusion (Noubactep, 2008; 2010; 2011). Contaminant removal 2
also implies iron corrosion (Lavine et el., 2001; You et al., 2005; Jiao et al., 2009; Ghauch et al., 3
2011; Gheju and Balcu 2011). Therefore, due to the volumetric expansive nature of this process 4
(‘prerequisite 1’), the remediation of contaminated groundwater necessarily results in the gradual 5
clogging of the Fe0 PRB, and thus in the deterioration of the permeable barrier hydraulic 6
conductivity (permeability loss) over time (Zhang and Gillham, 2005; Courcelles et al., 2011; 7
Knowles et al., 2011; Jeen et al., 2012; Miyajima, 2012; Noubactep, 2013a). 8
The gradual clogging (permeability loss) of Fe0 filtration systems has several origins: (i) biological 9
activities like biofilm growth or biocorrosion, (ii) chemical processes like (hydr)oxide or calcite 10
precipitation, (iii) physical processes allowing the retention of fine particles in the PRB pores, and 11
(iv) production and accumulation of gases (mainly H2). Pores clogging could generate a decrease in 12
treatment performance and the bypass of untreated contaminated groundwater (Courcelles et al., 13
2011; Knowles et al., 2011; Jeen et al., 2012). Therefore, PRBs clogging issues will require cost-14
intensive reactive material substitution, if satisfactory operational performance has to be 15
maintained. The present work is focused on the characterization of PRB clogging due to pore filling 16
by in-situ generated iron corrosion products neglecting the other possible phenomena that could 17
contribute to permeability reduction (i.e. gas retention, biocorrosion, biofouling) (Henderson and 18
Demond, 2011; Caré et al., 2012; Noubactep, 2013a). 19
The objective of the present work is to characterize the efficiency of Fe0/pumice granular 20
mixtures for contaminant removal in column experiments containing 0 to 100 % Fe0 (vol/vol). Fe0 21
is admixed to a well-characterized pumice specimen (Moraci and Calabrò, 2010; Calabrò et al., 22
2011; Bilardi et al., 2013a), in different volumetric ratios. The model oxic solution (about 8 mg/L 23
O2) contained about 0.30 M of CuII, NiII, and ZnII. The evolution of the systems is characterized by 24

4
determining the (i) extent of contaminant removal (or retention), and (ii) variation of hydraulic 1
conductivity. 2
2 Materials and methods 3
2.1 Chemicals 4
Copper(II) nitrate hydrate (purity 99.999), nickel(II) nitrate hexahydrate (purity 99.999) and zinc(II) 5
nitrate hexahydrate (purity 99.000) were obtained from Sigma-Aldrich. The three heavy metals are 6
used for their different affinity to iron oxides (Wang and Qin, 2007; Moreira and Alleoni, 2010; 7
Vodyanitskii, 2010). In addition, a survey of the electrode potential (E0) of involved couples 8
indicated differential redox behaviours. In fact, ZnII (E0 = -0.763 V) can not be reduced by Fe0 (E0 = 9
-0.440 V) while Cu (E0 = 0.337 V) is readily reduced. The electrode potential of Ni (E0 = -0.250 V) 10
is relatively close to that of Fe (∆E0 = 0.19 V) such that quantitative reduction can not be expected. 11
2.2 Solid materials 12
Pumice: the used pumice originates from Lipari (Aeolian Islands, Sicily – Italy); its mineralogical 13
composition was determined as follows: SiO2: 71.75 %; Al2O3: 12.33 %; K2O: 4.47 %; Na2O: 3.59 14
%; Fe2O3: 1.98 %; moreover it contains about 4 % of bound water (structural water) and traces of 15
other compounds (e.g. CaO, SO3, MgO, TiO2, FeO, MnO, P2O5). Although pumice exhibited a non 16
negligible removal capacity for heavy metals (Moraci and Calabrò, 2010; Calabrò et al., 2011), it 17
was used here as an operational inert material with the virtual capacity of storing corrosion products 18
in its pores and retarding clogging (Moraci and Calabrò, 2010; Noubactep and Caré, 2010; 19
Noubactep et al. 2012a; Noubactep et al. 2012b). The material is characterized by uniform grain 20
size distribution. The mean grain size (d50) is about 0.3 mm and the coefficient of uniformity (U) is 21
1.4 (see Supporting Information). 22
Metallic iron: the used Fe0 is of the type FERBLAST RI 850/3.5, distributed by Pometon S.p.A., 23
Mestre - Italy. The material contents mainly iron (> 99.74 %). Identified impurities included mainly 24
Mn (0.26 %), O, S and C. The material is characterized by uniform grain size distribution. The 25
5
mean grain size (d50) is about 0.5 mm and the coefficient of uniformity (U) is 2 (see Supporting 1
Information). 2
The microstructure of used Fe0 and pumice was characterized using Mercury Intrusion Porosimetry 3
(MIP) measurements and by Scanning Electron Microscopy (SEM) observations (see Supporting 4
Information). 5
2.3 Columns experiments 6
The used solutions were obtained by dissolving copper nitrate, nickel nitrate and zinc nitrate in 7
distilled water. The molar concentration of the resulting solution was as follows: 0.27 M Cu, 0.29 8
M Ni and 0.37 M Zn. The corresponding mass concentrations are 17 mg/L Cu, 17 mg/L Ni, and 23 9
mg/L Zn. 10
No attempt was made to control the mass of dissolved oxygen (DO) present during the column 11
experiments. The main source of molecular oxygen is the air in the headspace of the PE bottles. It 12
can be assumed that the model solutions contained up to 8 mg/L DO. The role of dissolved oxygen 13
in accelerating the kinetics of aqueous iron corrosion is well-documented (e.g. Cohen, 1959; 14
Stratmann and Müller, 1994). Using an oxic solution is a tool to enable the characterization of 15
clogging under relevant conditions at reasonable experimental durations. 16
Simplified model solutions (no carbonates, bicarbonates and relevant cations) were used as this 17
work is a seminal one focused on the impact of molecular O2 on the clogging process of Fe0 PRBs 18
as influenced by pumice addition in various proportions. Testing more complex solutions relevant 19
to simulate natural situation could be built on the results from these simplified systems. 20
Laboratory scale polymethyl methacrylate (Plexiglas) columns were operated in up-flow mode. The 21
influent solution was pumped upwards from a single PE bottle using a precision peristaltic pump 22
(Ismatec, ISM930). In all the tests the flow rate was maintained constant at a value of 0.5 mL/min. 23
Tygon tubes were used to connect inlet reservoir, pump, columns and outlet. Six plexiglas columns 24
(50 cm long, 5.0 cm inner diameter) were used in the experiments (Fig. 1). 25

6
The ratio column diameter (D) to average material particle size (d) ensured the prevention of 1
channelling and wall effects. In fact, used D/d ratio (actually 100 to 165) is by far larger than the 2
threshold value of 50 (Badruzzaman and Westerhoff, 2005). 3
Six different systems were investigated (Systems A through F) (Tab. 1). System A was the 4
operational reference system containing only pumice (0 % Fe0) and system F was a pure iron 5
column (100 % Fe0). The volumetric proportion of Fe0 in the 4 other systems was 10, 25, 50 and 6
75 % following a procedure recently presented (Noubactep and Caré, 2011; Noubactep et al. 7
2012b). In systems B to F, the mass of iron was fixed to 200 g. This mass represented either 100 % 8
of the reactive zone (rz) or the relevant volumetric proportion of rz (Fig. 1, Tab. 1). Tab. 1 9
summarizes the theoretical (rztheor; i.e. the height of the column occupied by the reactive medium if 10
Fe0 and pumice were used in series and not as a mixture) and measured (rzeff i.e. the height of the 11
reactive zone in the column effectively measured) reactive zone for each individual systems. 12
The hydraulic conductivity was determined during the column tests, by either constant-head (k > 13
10-6 m/s) or variable-head (k < 10-6 m/s) permeability methods (Head and Keeton, 2008), at given 14
times to assess the permeability of the systems. During hydraulic conductivity determinations, the 15
test was interrupted and a tank or a burette, filled with the same contaminated solution used during 16
the test, was connected to the column in order to carry out the appropriate procedure. At the end of 17
the permeability test the flow in the column was re-established with the operation mode illustrated 18
before. The duration of these procedures was very limited therefore the disturbance to the test was 19
fully acceptable. The column tests were performed at room temperature (21 ± 4 °C). Solution 20
specimens for analysis were collected from the columns outlet at periodic intervals and the 21
experiments where prolonged until contaminant breakthrough (system A) or a significant loss of the 22
hydraulic conductivity (systems C to F) was observed; only system B was voluntarily stopped after 23
90 days. Tab. SI summarizes the experimental research program (Supporting Information). 24

7
The aqueous concentrations of Cu, Ni and Zn were determined by Atomic Absorption 1
Spectrophotometry (AAS - Shimadzu AA – 6701F) using conventional Standard Methods (APHA 2
2005). 3
2.4 Expression of the experimental results 4
In order to characterize the magnitude of tested systems for contaminant removal, the removal 5
efficiency (E) and the specific removal (Es) were calculated using Eq. 1 and Eq. 2 (Moraci and 6
Calabrò, 2010; Btatkeu et al., 2013). 7
E = mrem/min*100 (1) 8
Es = mrem/mFe*100 (2) 9
where min is the mass of contaminant flowed into the column, mrem is the mass of removed 10
contaminant, and mFe the mass of Fe0 present in the column. 11
3 Results and discussion 12
3.1 Contaminant removal 13
The presentation is based on the concept that tested contaminants are removed in Fe0 columns (at 14
pH > 5) by adsorption, co-precipitation and adsorptive size-exclusion (Noubactep, 2008; 2010; 15
2011). Given the importance of the pH value for this concept, the results of pH monitoring are 16
presented first. 17
3.1.1 pH value 18
Figure 2 summarizes the results of the evolution of the pH value in all investigated systems. It is 19
shown that in the reference system (100 % pumice), the initial pH (6.3) decreased to 5.8 and 20
remained constant for the entire column tests duration. The slight pH decrease could be attributed to 21
acidic sites at the pumice surface (Eq. 3). In all other systems, the pH value first increased to value 22
> 9.0 and progressively decreased to values close to 6.0 – 7.0. The observed pH increase is certainly 23
due to iron corrosion which consumes H+ (Eq. 4). 24
SiO2(s) + 2 H2O � H4SiO4(aq) (3) 25

8
Fe0 + 2 H+ � Fe2+ + H2 (4) 1
The subsequent progressive decrease of the pH value is consistent with lowered kinetics of iron 2
corrosion due to the formation of an oxide scale at the Fe0 surface (Cohen, 1959; Evans, 1969; 3
Aleksanyan et al., 2007; Nesic, 2007). The most important issue from Fig. 2 is that for all Fe0-4
containing systems, the effluent pH value is higher than 5.0. This suggests that contaminant 5
removal by adsorption, co-precipitation and adsorptive size-exclusion (Noubactep, 2011) could be 6
quantitative within these columns. 7
3.1.2 Iron release 8
Figure 3 summarizes the results of the evolution of dissolved iron concentration in the effluent. It is 9
evident from Fig. 3a, that the highest iron release was observed in the system with the lowest Fe0 10
ratio (B, 10 % Fe0). The lowest Fe0 ratio corresponds to the highest amount of pumice (243 g - Tab. 11
1), acidifying the system after Eq. 3. The transport of iron corrosion products is certainly favoured 12
at low pH values and may be favoured by larger porosity (Nimmo, 2004; Woudberg and Du Plessis, 13
2008; Glover and Walker, 2009). In other words, in all other systems, even more iron could be 14
dissolved but it is retained within the system by (i) adsorption onto available iron oxides or onto 15
pumice, or (ii) precipitation as iron (hydr)oxides (Miyajima, 2012; Miyajima and Noubactep, 2013). 16
It is very important to notice that the extent of iron release depends primarily on the intrinsic 17
reactivity of used Fe0. Although data on iron release from column experiments are available in the 18
literature (e.g. Westerhoff and James, 2003) it is impossible to make a quantitative comparison. In 19
fact, a parameter (or an index) to characterize the intrinsic reactivity of Fe0 is still lacking 20
(Noubactep et al., 2009; Noubactep, 2012). 21
Fig. 3b shows that, apart from system B (10:90), in all other systems less than 1 mg/L iron was 22
released in the effluent solution. It is interesting to note that, for the remaining systems, the two 23
columns with the largest proportion of Fe0 (50 and 100 %) exhibited the highest iron release. 24
3.1.3 Metal concentration 25

9
Table 2 summarizes the results of the removal of CuII, NiII and ZnII in terms of removal efficiency 1
E, and of specific removal efficiency Es for all the 5 systems containing Fe0. While, reading this 2
table, it should be kept in mind that the experimental duration was variable as most of the 3
experiments were stopped because of significant permeability loss (see Tab. 1). Nevertheless, it can 4
be seen that 367 to 2881 mg of individual contaminants flowed into the columns and were retained 5
with an efficiency E > 90.0 %. Moreover, the specific efficiency (Es) varied from 1.7 to 13.6 mg 6
contaminant per g of Fe0. 7
An important feature from Tab. 2 regards the suitability of Es values (Eq. 2) for the characterization 8
of processes occurring in Fe0/H2O systems (Btatkeu et al., 2013; Miyajima and Noubactep, 2013). 9
Normalizing the extent of contaminant removal (mrev - Eq. 2) by the available amount of Fe0 (here 10
200 g) is only valid, if there is a clear linear relationship between iron corrosion and contaminant 11
removal. Such a relationship has not been demonstrated in the Fe0 remediation literature despite 12
repeated reports on reaction orders. Moreover, an adequate argumentation for adsorptive processes 13
has been simply transposed to systems, where adsorption is only one (and not necessarily the 14
dominant) removal path. 15
In pure adsorption systems (e.g. activated carbon, iron oxide, clay), the whole mass of adsorbing 16
material is present at the start of the removal process (t0 or t = 0), its adsorption capacity can be 17
exhausted with the time. In a Fe0 system on the contrary, adsorbing species are generated in situ 18
after the start of the experiment (t > t0). Accordingly the extent of contaminant removal depends on 19
the kinetics of iron corrosion and the affinity of contaminants for corrosion products as far as pure 20
adsorption is concerned. Additionally, contaminants are also removed by co-precipitation and size-21
exclusion. In other words, normalizing the extent of contaminant removal by the Fe0 amount 22
requires at least the knowledge of the intrinsic reactivity of used Fe0 and the impact of operational 23
parameters thereon. The most relevant operational parameter in the present work is the volumetric 24
Fe0:pumice ratio. 25

10
Figure 4 shows that the influence of the volumetric Fe0:pumice ratio on the removal efficiency of 1
Cu2+, Ni2+, Zn2+ is very similar to the influence of the adsorbent amount on adsorption of Mn2+ by 2
clay minerals (Goldani et al., 2013). These authors reported on a decreasing trend of the adsorption 3
capacity (qe value / mg g−1) for Mn2+ with increasing adsorbent amount (50 to 500 mg). This 4
observation was mainly rationalized by the fact that a large adsorbent amount reduces the 5
unsaturation of the adsorption sites. Correspondingly, the number of such sites per unit mass comes 6
down resulting in comparatively less adsorption at higher adsorbent amount. In the present work, 7
the Fe0 amount is constant (200 g), only its volumetric ratio in the mixture to pumice varies. 8
Moreover, a higher Fe0 ratio is coupled to a shorter reactive zone (e.g. 2.6 cm for 100 % Fe0 and 9
26.2 cm for 10 % Fe0). Thus, a higher Fe0 volumetric ratio may create particle aggregation 10
(cementation), decreasing the total number of adsorption sites, decreasing the porosity of the 11
reactive zone, and increasing the diffusion path to adsorption sites. Altogether, these factors 12
contribute to the decrease of the amount of contaminant adsorbed, assuming that the same amount 13
of adsorbent is generated in all systems. As summarized in Tab. 2, except system B (10 % Fe0), 14
metal removal was quantitative in all other systems. 15
Contaminant breakthrough was observed in other systems only short before the experiment was 16
stopped and was mainly attributed to transport through preferential flow paths (Miyajima and 17
Noubactep, 2013a and ref. cited therein). Even under such conditions the concentration of Cu and 18
Zn remained below 1 mg/L whereas the concentration of Ni exceeded 4 mg/L for system F (100 % 19
Fe0) and system D (50 % Fe0) but not for system E (75 % Fe0). This anomaly in the sequence D/E/F 20
confirms that the process responsible for metal breakthrough near system clogging is probably a 21
meta-stable one (preferential flow). 22
3.2.4 Mechanism of contaminant removal 23
The experimental data previously described has shown that contaminants are quantitatively 24
removed in columns with volumetric Fe0 ratio higher than 10 % until the system is almost clogged. 25

11
In the system with 10 % Fe0, quantitative iron release is observed (Fig. 5). Quantitative iron release 1
coincided with minimal contaminant removal (or contaminant breakthrough) as discussed above. 2
This section further discusses the behaviour of system B (Fig. 5a). 3
The ionic radii of the investigated cations increase in the order Ni2+ < Cu2+ < Zn2+. The metallic 4
ions are removed by four different mechanisms (Herbert, 1996; Wang and Qin, 2007; Vodyanitskii, 5
2010): (i) co-precipitation with iron hydroxides, (ii) adsorption onto the (hydr)oxide surfaces, (iii) 6
isomorphic substitution for Fe in the iron oxide structure, or adsorptive size-exclusion. In multi-7
element systems, the most common reported affinity sequence for iron oxides and soils is Cu > Zn 8
> Ni (Moreira and Alleoni, 2010). This trend is confirmed by Fig. 5b. 9
Fig. 5a illustrates the fact that contaminants breakthrough occurs when increased iron release is 10
observed. For example, no significant breakthrough was observed in system B until t=30 days 11
although up to 8 mg/L Fe was released into the outlet solution. For t > 30 days Zn and Ni 12
breakthrough occurs and the breakthrough magnitude is in agreement with the affinity sequence for 13
iron oxides (Cu > Zn > Ni). Accordingly, breakthrough is first observed for less bounded Ni 14
followed by Zn. As concerning Cu no breakthrough was observed through the end of the 15
experiment. At first glance, this observation could be attributed to CuII cementation at the surface of 16
Fe0 in the column. In fact, Cu reduction to elemental Cu (Cu0), as mentioned above, is very 17
favourable and is used in many hydrometallurgical processes (Gros et al., 2011a; 2011b). However, 18
because Cu removal in this study occurred at pH > 5 (section 3.2.1), the Fe0 surface was necessarily 19
covered by iron (hydr)oxides (Aleksanyan et al., 2007; Nesic, 2007) and was not directly accessible 20
to CuII (NiII and ZnII). More detailed discussion on the removal of metallic ions by Fe0 in multi-21
elements system is given for instance by Cantrell et al.(1995), Qiu et al. (2000), Bartzas et al. 22
(2006), Komnitsas et al. (2006; 2007) and Scott et al. (2011). 23
It should be recalled that in a Fe0/H2O system, so-called structural FeII (adsorbed FeII) is available 24
and is, in some circumstances, a more efficient reducing agent than Fe0 (White & Peterson, 1996). 25

12
Accordingly, CuII might be quantitatively removed within the oxide scale on iron. Even if CuII is 1
reduced at the surface of Fe0, it will be enmeshed within the matrix of iron oxides as corrosion 2
proceeds. In conclusion, aqueous CuII is also permanently removed by the process of iron corrosion 3
(enmeshment or co-precipitation). It should be also remembered that the stronger affinity of CuII for 4
iron oxides (adsorption) is sufficient to rationalize the absence of Cu breakthrough for 90 days (Fig. 5
5b). 6
3.3 Hydraulic conductivity 7
The results presented in Fig. 6 clearly demonstrate that granular Fe0/pumice mixtures are more 8
sustainable in terms of long term permeability than the pure Fe0 PRB for the decontamination of 9
used model solution. Fig. 6a shows that the pure pumice systems exhibited an initial porosity of 10
72.6 % while the porosity of the pure Fe0 system was 49.6 % (Tab. 1). Fig. 6b shows that the 100 % 11
Fe0 system was clogged after 17 days; the 25 % Fe0 system after 37 days and the 10 % Fe0 system 12
was still highly permeable after 90 days. Even though the 10 % Fe0 system was not efficient at 13
removing Ni and Zn, such systems could be used to generate dissolved Fe for other purposes 14
including: (i) in-situ generation of Fe for contaminant removal (Khan et al., 2000; Pokhrel and 15
Viraraghavan, 2009) and (ii) oxygen scavenger to sink the O2 concentrations in above-ground 16
devices (Mackenzie et al., 1999; Noubactep and Schöner, 2010; Noubactep et al., 2010). 17
A fundamental feature from Fig. 6a is that it combines contaminant removal (here Es value for Zn) 18
and initial porosity. The initial porosity decreases linearly with increasing Fe0 ratio. This behaviour 19
is rationalized by the fact that a compact material (Fe0) is admixed to a porous one (pumice). The 20
initial pore volume will be progressively filled by in situ generated iron corrosion products (Caré et 21
al., 2013) which adsorb and co-precipitate metal ions. Reduced pore volume increases size-22
exclusion efficiency while decreasing permeability. The challenge of designing hybrid Fe0/material 23
systems is to find out the optimal system concealing sustained permeability and efficient 24

13
contaminant removal. Fig. 6a confirms/shows unambiguously that such a system should contain as 1
less Fe0 (volumetric proportion) as possible (Caré et al., 2013; Miyajima and Noubactep, 2013). 2
Considering the factor of 65 times to account for the differential kinetics of Fe0 oxidation under 3
oxic (8 mg/L O2) and anoxic (0 mg/L O2) conditions (Cohen, 1959), it can be argued that the 4
shortest experimental duration (17 days) reported here could corresponds to about 1105 days under 5
anoxic conditions. These are more than 3 years necessary to observe clogging under the 6
experimental conditions of this work after 17 days. This result justifies the use of oxic conditions to 7
investigate target processes under laboratory conditions. By performing parallel experiments with 8
various amounts of molecular O2 (Vidic and Suidan, 1991) a better characterization of the impact of 9
the availability of molecular O2 is possible. This effort is even urgently needed as Fe0 beds have 10
been proposed for an array of applications varying from pure anoxic (groundwater remediation) to 11
oxic (household filter) systems. 12
Fig. 7 depicts the evolution of the experimental duration and the residual porosity (modelled, see 13
below) as a function of the initial porosity of the columns containing Fe0. The lowest porosity (49.6 14
%) corresponds to system F (100 % Fe0) and the largest (70.5 %) to system B (10 % Fe0). It is seen 15
that the experimental duration (system sustainability) increases almost linearly with decreasing Fe0 16
proportion from 100 to 25 %. From 25 to 10 % Fe0 an abrupt increase of the experimental duration 17
is observed. These results are qualitatively confirmed by the evolution of the residual porosity for 18
η = 6.4 (Fig. 7a) where η is the coefficient of volumetric expansion of rust specimens (Caré et al., 19
2008). 20
The residual porosity (Φ(t)/Φ0) is defined as the ratio of the porosity at time t Φ(t) to the initial 21
porosity Φ0 induced by the formation of rust leading to porosity loss according to: 22
V
V1
t
00 �
��
Φ∆−=
ΦΦ
(5) 23
Where ∆V= (η - 1)*V is the effective volumetric expansion of the initial volume V of Fe0. 24

14
The residual porosity which, acting as an indicator of the hydraulic conductivity, is given for all 1
systems in Fig. 7. The observed time-dependant decrease of the hydraulic conductivity is attributed 2
to two different factors: (i) the decrease of the effective pore-size as concentric layers of iron oxides 3
are formed on Fe0, and (ii) the filling of pores by precipitated Fe species that escaped out of the 4
oxide scale. Permeability loss due to in-situ generated particles is retarded when larger particle sizes 5
are used. Accordingly, as the grain-size increases, the loss of hydraulic conductivity should follow 6
the inverse trend. In other words, the kinetics of the occupation of the voids depends on the grain-7
size of used particles (effective pore-size). 8
Theoretically, for spherical grains of uniform size (monosized), the grain diameter will not impact 9
initial porosity but only the void diameter. However, the total porosity generally increases with 10
increasing sorting (grain size distribution), decreases with increasing sphericity and roundness of 11
particles, decreases with the increasing of relative density (closer packing) (Gibb et al., 1984). All 12
these aspects have to be considered to discuss literature results as well. 13
It appears from Fig. 7a that the residual porosity tends to zero (Φ(t)/Φ0 = 0 or permeability loss) for 14
clogged systems (% Fe0 � 25 – clogging precedes Fe0 depletion). For Fe0 < 25 %, Φ(t)/Φ0 � 0 at Fe0 15
depletion in accordance with the evolution of the hydraulic conductivity and the test duration. At 16
first glance, this observation could be misinterpreted as the confirmation of the proposed model. But 17
under the experimental conditions, Fe0 was not completely depleted. Accordingly, this experimental 18
evidence rather suggests that the entrance zone of the column could have been rapidly clogged due 19
to elevated O2 levels (Mackenzie et al., 1999). The presence of O2 leads to iron (hydr)oxides with 20
higher expansion coefficient (η) implying a more rapid decrease of the residual porosity (Fig. 7b). 21
Fig. 7b depicts the modelled variation of the residual porosity for 3 different values of η (2.08, 3.03 22
and 6.4). It is seen that under ideal conditions (uniform corrosion), the sustainability of a Fe0 filter 23
depends on the availability of O2. Accordingly the most sustainable systems is the one operating 24
under conditions where Fe3O4 (η = 2.08) is the major iron corrosion product (anoxic conditions). 25
15
These conditions could be obtained in a second column in series with a first one acting as O2 1
scavenger. 2
The fact that observed preservation of permeability with time is coupled with a decrease of 3
contaminant removal efficiency suggests that for any Fe0/additive couple, an increase of filter 4
sustainability with decreasing Fe0 proportion down to a threshold value (here 25 % Fe0) would be 5
observed. 6
This study has traceably demonstrated that admixing non expansive material with Fe0 is a tool to 7
increase permeable reactive barriers sustainability. In other words, an efficient but not sustainable 8
system (100 % Fe0) is transformed into an efficient and more sustainable one by admixing a certain 9
volumetric proportion of pumice (here ≥ 75 %). The admixing material (here pumice) should 10
necessarily be less expensive than Fe0; thus, cost savings could be regarded as a positive side effect 11
of increased performance. 12
3.4 Significance for future works 13
This study is a continuation of a broad-based work aiming at designing non-site-specific Fe0 14
filtration systems for water treatment and environmental remediation in its third step. 15
The first step consisted in identifying the common underlying mechanisms for contaminant removal 16
(Noubactep, 2007; 2008; 2010; 2011). Adsorption, co-precipitation and size-exclusion were 17
identified as fundamental paths for water treatment in Fe0 packed beds (Noubactep, 2011). This 18
result belittled the importance of chemical reduction in the process of contaminant removal in 19
Fe0/H2O systems and clearly demonstrated that Fe0 is not a relevant reducing agent under 20
environmental conditions. The strong fact that Fe0 is the parent of all reducing species (e.g. FeII, 21
Fe3O4, green rust, H/H2) should never be misinterpreted as ‘contaminant reduction coupled with 22
electrochemical iron corrosion’ (Noubactep, 2013b). 23
The second step consisted in writing the dimensionless equation of a Fe0 packed beds (Noubactep 24
and Caré, 2010; Noubactep et al., 2010; Noubactep and Caré, 2011; Noubactep et al., 2012a; 25

16
Noubactep et al., 2012b; Caré et al., 2013). It is important to notice, that the equation is based on 1
the volumetric fraction of the packed beds available for ‘storing’ corrosion products (total porosity) 2
(Noubactep and Caré, 2011). This theoretical work has shown that the volumetric ratio of Fe0 in a 3
granular mixture should ideally not exceed 60 %. The basics for a systematic research for non-site-4
specific Fe0 filtration systems were established. In particular each Fe0 material should be 5
characterized for its intrinsic reactivity; all used materials should be characterized for their form, 6
homogeneity and shape (Crane and Noubactep, 2012; Noubactep et al., 2012a; Caré et al., 2013). 7
The current third step consists in validation the equation of the column (Calabrò et al., 2011; 8
Biliardi et al., 2013a; Biliardi et al., 2013b). In this effort methylene blue (MB) was positively 9
tested as an operational tracer (Miyajima, 2012; Btatkeu et al., 2013; Miyajima and Noubactep, 10
2013). Experiments with MB confirmed theoretical predictions that a pure Fe0 bed is not 11
sustainable. Moreover, it could be shown that the optimal volumetric Fe0 ratio for sustainable filters 12
is lower 50 %. Given the large density difference between Fe0 (7.8 g cm3) and commonly tested 13
additives (e.g. anthracite, gravel, pumice, sand) (< 3.0 g cm3), this results clearly shows that the 14
commonly used 1:1 weight ratio is not optimal as well. Experiments with MB suggested that the 15
optimal Fe0 volumetric ratio in a dual Fe0/sand system is comprised between 30 and 50 %. 16
The present work has systematically tested the Fe0/pumice system for the first time using Cu, Ni 17
and Zn as model contaminants. The results showed that the optimal Fe0 ratio for a sustainable filter 18
is 25 %. This result could be regarded as close to 30 % as determined by Miyajima and Noubactep 19
(2013). However, under their experimental conditions, these authors could not experimentally 20
document permeability loss. Accordingly, the present work has provided the most reliable optimal 21
Fe0 ratio for sustainable Fe0 filtration systems. In other words, this work provide the following rule 22
of thumb for further research (including pilot plant studies): “mix one volume of Fe0 and 3 volumes 23
of the additive(s)”. The universal validity of this rule of thumb relies on the evidence that it is based 24
on a dimensionless equation. Thus, if a filter has to contain 1 kg Fe0, the volume occupied by this 25

17
Fe0 mass is used as unit and three units volume of the additives of comparable size (and shape) are 1
to be added and homogenized. 2
4. Concluding remarks 3
Environmental remediation and water treatment using metallic iron (Fe0) in packed beds is an 4
established technology. Despite two decades of active research, this technology is still mostly 5
regarded as an innovative one or has been simply declared a developed one. However, a developed 6
technology is a technology that has established the scientific basis of the involved processes. This 7
work has clearly confirmed theoretical predictions that: (i) pure Fe0 beds are not sustainable as a 8
rule, (ii) a bed made up of 25 % Fe0 (vol/vol) and 75 % pumice is probably the most efficient 9
system concealing sustained permeability and increased efficiency for contaminant removal, (iii) 10
the specificity of contaminant removal in Fe0 filters fundamentally depends on the adsorptive 11
affinity to iron oxides (and not on the redox affinity). 12
The knowledge that the most sustainable filter is made up of more than 70 % (vol/vol) of pumice 13
corroborates the view that sustainable Fe0/aggregate filters are Fe0-amended aggregate filters (e.g. 14
Fe0-amended pumice filter or Fe0-amended sand filter). Most common natural aggregates are 15
anthracite, sand, gravel, pumice or crushed rock. However, manufactured aggregates (e.g. blast 16
furnace slag) can also be used as well. Basically there is an infinite number of Fe0-amended filters 17
as relevant aggregates may include activated carbon and biomaterial (e.g. wood and coconut shell). 18
A Fe0-amended filter can be regarded as a size-exclusion system in which size exclusion is 19
improved by in situ generated iron corrosion products. This is a typical case of self-filtration. The 20
challenge for future works is the proper design of these filters. 21
Further research at laboratory scale is needed to develop methodologies for the Fe0 filter design. 22
This effort should be accompanied by numerical modelling. Pilot scale installations are needed 23
afterwards to fine tune determine the practicality of several aspects optimised at lab scale. 24
Acknowledgements 25

18
The authors are grateful to Dott Giuseppe Panzera for its essential assistance during this research 1
activity and to the director and officials of the environmental protection sector of the province of 2
Reggio Calabria for authorisation to use their atomic absorption spectrophotometer. SEM 3
observations were performed at laboratory LMT Cachan, ENS de Cachan / CNRS / Université 4
Pierre et Marie Curie (Paris 6), France. The manuscript was improved by the insightful comments 5
of anonymous reviewers from Journal of Environmental Management. 6
References 7
Aleksanyan A.Y., Podobaev A.N., Reformatskaya I.I., 2007. Steady-state anodic dissolution of iron 8
in neutral and close-to-neutral media. Protection of Metals 43, 66–69. 9
APHA, AWWA, WEF, 2005. Standard Methods for the examination of water and wastewater, 21st 10
ed. American Public Health Association, Washington D.C. (USA). 11
Badruzzaman M., Westerhoff P., 2005. The application of rapid small-scale column tests in iron-12
based packed bed arsenic treatment systems, ACS Symposium Series, 915 (Advances in 13
Arsenic Research): 268-283. 14
Bartzas G., Komnitsas K., 2010. Solid phase studies and geochemical modelling of low-cost 15
permeable reactive barriers. J. Hazard. Mater. 183, 301–308. 16
Bartzas G., Komnitsas K., Paspaliaris I., 2006. Laboratory evaluation of Fe0 barriers to treat acidic 17
leachates. Miner. Eng. 19, 505–514. 18
Bilardi S., Calabrò P.S., Caré S., Moraci N., Noubactep C., 2013a. Effect of pumice and sand on the 19
sustainability of granular iron beds for the removal of CuII, NiII, and ZnII. Clean – Soil, Air, 20
Water, doi: 10.1002/clen.201100472. 21
Bilardi S., Amos R.T., Blowes D.W., Calabrò P.S., Moraci N., 2013b. Reactive Transport Modeling 22
of ZVI Column Experiments for Nickel Remediation. Ground Water Monit. Remed., doi: 23
10.1111/j.1745-6592.2012.01417.x. 24
19
Btatkeu K. B.D., Miyajima K., Noubactep C., Caré S., 2013. Testing the suitability of metallic iron 1
for environmental remediation: Discoloration of methylene blue in column studies. Chem. 2
Eng. J. 215-216, 959–968. 3
Calabrò P.S., Moraci N., Suraci P., 2011. Estimate of the optimum weight ratio in zero-valent 4
iron/pumice granular mixtures used in permeable reactive barriers for the remediation of 5
nickel contaminated groundwater. J. Hazard. Mater. 207–208, 111–116. 6
Cantrell K.J., Kaplan D.I., Wietsma T.W., 1995. Zero-valent iron for the in situ remediation of 7
selected metals in groundwater. J. Hazard. Mater. 42, 201–212. 8
Caré S., Crane R., Calabro P.S., Ghauch A., Temgoua E., Noubactep C., 2012. Modelling the 9
permeability loss of metallic iron water filtration systems. Clean – Soil, Air, Water, doi: 10
10.1002/clen.201200167. 11
Caré S., Nguyen Q.T., L'Hostis V., Berthaud Y., 2008. Mechanical properties of the rust layer 12
induced by impressed current method in reinforced mortar. Cement Concrete Res. 38, 1079–13
1091. 14
Cohen M., 1959. The formation and properties of passive films on iron. Can. J. Chem. 37, 286–291. 15
Comba S., Di Molfetta A., Sethi R., 2011. A Comparison between field applications of nano-, 16
micro-, and millimetric zero-valent iron for the remediation of contaminated aquifers. Water 17
Air Soil Pollut. 215, 595–607. 18
Courcelles B., Modaressi-Farahmand-Razavi A., Gouvenot A., Esnault-Filet A., 2011. Influence of 19
precipitates on hydraulic performance of permeable reactive barrier filters. Int. J. Geomech. 20
11, 142–151. 21
Evans U.R., 1969. Mechanism of rusting. Corros. Sci. 9, 813–821. 22
Ghauch A., Abou Assi H., Baydoun H., Tuqan A.M., Bejjani A., 2011. Fe0-based trimetallic 23
systems for the removal of aqueous diclofenac: Mechanism and kinetics. Chem. Eng. J. 172, 24
1033–1044. 25

20
Gheju M., 2011. Hexavalent chromium reduction with zero-valent iron (ZVI) in aquatic systems. 1
Water Air Soil Pollut. 222, 103–148. 2
Gheju M., Balcu I., 2011. Removal of chromium from Cr(VI) polluted wastewaters by reduction 3
with scrap iron and subsequent precipitation of resulted cations. J. Hazard. Mater. 196, 131–4
138. 5
Gibb J.P., Barcelona M.J., Ritchey J.D., LeFaivre M.H., 1984. Effective porosity of geologic 6
materials: first annual report. Champaign, Ill; Illinois State Water Survey. SWS contract 7
report 351. 8
Glover P.W.J., Walker E., 2009. Grain-size to effective pore-size transformation derived from 9
electrokinetic theory. Geophysics 74, E17–E29. 10
Goldani E., Moro C.C., Maia S.M., 2013. A study employing differents clays for Fe and Mn 11
removal in the treatment of acid mine drainage. Water Air Soil Pollut. 224, doi : 12
10.1007/s11270-012-1401-4. 13
Gros F., Baup S., Aurousseau M., 2011. Copper cementation on zinc and iron mixtures: Part 2: 14
Fluidized bed configuration. Hydrometallurgy 106, 119–126. 15
Gros F., Baup S., Aurousseau M., 2011. Copper cementation on zinc and iron mixtures: Part 1: 16
Results on rotating disc electrode. Hydrometallurgy 106, 127–133. 17
Haarhoff J., Vessal A., 2010. A falling-head procedure for the measurement of filter media 18
sphericity. Water SA 36, 97–104. 19
Head K.H., Keeton G.P., 2008. Permeability, shear strength & compressibility tests, In: Manual of 20
Soil Laboratory Testing, vol. 2. Whittles Publishing: United Kingdom. 21
Henderson A.D., Demond A.H., 2011. Impact of solids formation and gas production on the 22
permeability of ZVI PRBs. J. Environ. Eng. 137, 689–696. 23
Herbert R.B., 1996. Metal retention by iron oxide precipitation from acidic ground water in 24
Dalarna, Sweden. Appl. Geochem. 11, 229–235. 25

21
ITRC (Interstate Technology & Regulatory Council). 2011. Permeable reactive barrier: Technology 1
update. PRB-5. Washington, D.C.: Interstate Technology & Regulatory Council, PRB: 2
Technology Update Team. www.itrcweb.org (access: 12.12.2012). 3
Jeen S.-W., Amos R.T., Blowes D.W., 2012. Modeling gas formation and mineral precipitation in a 4
granular iron column. Environ. Sci. Technol. 46, 6742–6749. 5
Jiao Y., Qiu C., Huang L., Wu K., Ma H., Chen S., Ma L., Wu L., 2009. Reductive dechlorination 6
of carbon tetrachloride by zero-valent iron and related iron corrosion. Appl. Catal. B: Environ. 7
91, 434–440. 8
Khan A.H., Rasul S.B., Munir A.K.M., Habibuddowla M., Alauddin M., Newaz S.S., Hussam A., 9
2000. Appraisal of a simple arsenic removal method for groundwater of Bangladesh. J. 10
Environ. Sci. Health A 35, 1021–1041. 11
Knowles P., Dotro G., Nivala J., García J., 2011. Clogging in subsurface-flow treatment wetlands: 12
Occurrence and contributing factors. Ecol. Eng. 37, 99–112. 13
Komnitsas K., Bartzas G., Fytas K., Paspaliaris I., 2007. Long-term efficiency and kinetic 14
evaluation of ZVI barriers during clean-up of copper containing solutions. Miner. Eng. 20, 15
1200–1209. 16
Komnitsas K., Bartzas G., Paspaliaris I., 2006. Inorganic contaminant fate assessment in zero-valent 17
iron treatment walls. Environ. Forensics 7, 207–217. 18
Kubare M., Haarhoff J., 2010. Rational design of domestic biosand filters. J. Water Supply: Res. 19
Technol. – AQUA 59 (1), 1–15. 20
Lavine B.K., Auslander G., Ritter J., 2001. Polarographic studies of zero valent iron as a reductant 21
for remediation of nitroaromatics in the environment. Microchem. J. 70, 69–83. 22
Li L., Benson C.H., Lawson E.M., 2006. Modeling porosity reductions caused by mineral fouling in 23
continuous-wall permeable reactive barriers. J. Contam. Hydrol. 83, 89–121. 24

22
Li L., Benson C.H., 2010. Evaluation of five strategies to limit the impact of fouling in permeable 1
reactive barriers. J. Hazard. Mater. 181, 170–180. 2
Liu H., Wang Q., Wang C., Li X.-z., 2013. Electron efficiency of zero-valent iron for groundwater 3
remediation and wastewater treatment. Chem. Eng. J. 215–216, 90–95. 4
Mackenzie P.D., Horney D.P., Sivavec T.M., 1999. Mineral precipitation and porosity losses in 5
granular iron columns. J. Hazard. Mater. 68, 1–17. 6
Miyajima K., 2012. Optimizing the design of metallic iron filters for water treatment. Freiberg 7
Online Geoscience 32, 60 pp. 8
Miyajima K., Noubactep C., 2012. Impact of Fe0 amendment on methylene blue discoloration by 9
sand columns. Chem. Eng. J. 217, 310–319. 10
Moraci N., Calabrò P.S., 2010. Heavy metals removal and hydraulic performance in zero-valent 11
iron/pumice permeable reactive barriers. J. Environ. Manage. 91, 2336–2341. 12
Moreira C.S., Alleoni L.R.F., 2010. Adsorption of Cd, Cu, Ni and Zn in tropical soils under 13
competitive and non-competitive systems. Sci. Agric. 67, 301–307. 14
Nesic S., 2007. Key issues related to modelling of internal corrosion of oil and gas pipelines – A 15
review. Corros. Sci. 49, 4308–4338. 16
Nimmo JR. Porosity and pore size distribution. in Hillel D, editor. Encyclopedia of Soils in the 17
Environment: London, Elsevier; 2004; 3:295–303. 18
Noubactep C., 2007. Processes of contaminant removal in “Fe0–H2O” systems revisited. The 19
importance of co-precipitation. Open Environ. J. 1, 9–13. 20
Noubactep C., 2008. A critical review on the mechanism of contaminant removal in Fe0–H2O 21
systems. Environ. Technol. 29, 909–920. 22
Noubactep C., Licha T., Scott T.B., Fall M., Sauter M., 2009. Exploring the influence of operational 23
parameters on the reactivity of elemental iron materials. J. Hazard. Mater. 172, 943–951. 24
Noubactep C., 2010. The fundamental mechanism of aqueous contaminant removal by metallic 25
iron. Water SA 36, 663–670. 26
23
Noubactep C., Caré S., 2010. Enhancing sustainability of household water filters by mixing metallic 1
iron with porous materials. Chem. Eng. J. 162. 635–642. 2
Noubactep C., Caré S., Togue-Kamga F., Schöner A., Woafo P., 2010. Extending service life of 3
household water filters by mixing metallic iron with sand. Clean – Soil Air Water 38, 951–4
959. 5
Noubactep C., Schöner A., 2010. Metallic iron: dawn of a new era of drinking water treatment 6
research? Fresen. Environ. Bull. 19, 1661–1668. 7
Noubactep C., 2011. Aqueous contaminant removal by metallic iron: Is the paradigm shifting? 8
Water SA 37, 419–426. 9
Noubactep C., Caré S., 2011. Designing laboratory metallic iron columns for better result 10
comparability. J. Hazard. Mater. 189, 809–813. 11
Noubactep C., 2012. Characterizing the reactivity of metallic iron in Fe0/As-rock/H2O systems by 12
long-term column experiments. Water SA. 38, 511–517. 13
Noubactep C., Caré S., Crane R.A., 2012a. Nanoscale metallic iron for environmental remediation: 14
prospects and limitations. Water Air Soil Pollut. 223, 1363–1382. 15
Noubactep C., Temgoua E., Rahman M.A., 2012b. Designing iron-amended biosand filters for 16
decentralized safe drinking water provision. Clean: Soil, Air, Water 40, 798–807. 17
Noubactep C., 2013a. On the suitability of admixing sand to metallic iron for water treatment. Int. J. 18
Environ. Pollut. Solutions 1, 22–36. 19
Noubactep C., 2013b. Relevant reducing agents in remediation Fe0/H2O systems. Clean: Soil, Air, 20
Water, doi:10.1002/clen.201200406. 21
O'Hannesin S.F., Gillham R.W., 1998. Long-term performance of an in situ "iron wall" for 22
remediation of VOCs. Ground Water 36, 164–170. 23
Pilling N. B., Bedworth R.E., 1923. The oxidation of metals at high temperatures. J. Inst. Met. 29, 24
529–591. 25

24
Pokhrel D., Viraraghavan T., 2009. Biological filtration for removal of arsenic from drinking water. 1
J. Environ. Manage. 90, 1956–1961. 2
Qiu S.R., Lai H.-F., Roberson M.J., Hunt M.L., Amrhein C., Giancarlo L.C., Flynn G.W., Yarmoff. 3
2000. Removal of contaminants from aqueous solution by reaction with iron surfaces. 4
Langmuir 16, 2230–2236. 5
Ruhl A.S., Ünal N., Jekel M., 2012. Evaluation of two-component Fe(0) fixed bed filters with 6
porous materials for reductive dechlorination. Chem. Eng. J. 209, 401–406. 7
Scott T.B., Popescu I.C., Crane R.A., Noubactep C., 2011. Nano-scale metallic iron for the 8
treatment of solutions containing multiple inorganic contaminants. J. Hazard. Mater. 186, 9
280–287. 10
Smith M.R., Collis L., Fookes P.G., Lay J., Sims I., Smith M.R., West G., 2001. Aggregates for use 11
in filter media. Geological Society, London, Engineering Geology Special Publications 17, 12
291–298. 13
Stratmann M., Müller J., 1994. The mechanism of the oxygen reduction on rust-covered metal 14
substrates. Corros. Sci. 36, 327–359. 15
Vidic R.D., Suidan M.T., 1991. Role of dissolved oxygen on the adsorptive capacity of activated 16
carbon for synthetic and natural organic matter. Environ. Sci. Technol. 25, 1612–1618. 17
Vodyanitskii Y.N., 2010. The role of iron in the fixation of heavy metals and metalloids in soils: a 18
review of publications. Eurasian Soil Sci. 43, 519 –532. 19
Wang X.S., Qin Y., 2007. Relationships between heavy metals and iron oxides, fulvic acids, 20
particle size fractions in urban roadside soils. Environ. Geol. 52, 63–69. 21
Westerhoff P., James J., 2003. Nitrate removal in zero-valent iron packed columns. Water Res. 37, 22
1818–1830. 23
White A.F., Peterson M.L., 1996. Reduction of aqueous transition metal species on the surfaces of 24
Fe(II)-containing oxides. Geochim. Cosmochim. Acta 60, 3799–3814. 25

25
Woudberg S., Du Plessis J.P., 2008. Predicting the permeability of very low porosity sandstones. 1
Transp. Porous Med. 73, 39–55. 2
You Y., Han J., Chiu P.C., Jin Y., 2005. Removal and inactivation of waterborne viruses using 3
zerovalent iron. Environ. Sci. Technol. 39, 9263–9269. 4
Zhang Y., Gillham R.W., 2005. Effects of gas generation and precipitates on performance of Fe0 5
PRBs. Ground Water 43, 113–121. 6
7
8

26
Table 1: Main characteristics of the studied columns. “Volume” is the apparent volume of granular 1
medium. “rztheor” is sum of the volumes occupied by the two media separately. “rzeff” is the 2
measured reactive zone. The estimated porosity and the duration of the experiment are also given. 3
4
5
System Volume Mass Column
Fe0 Pumice Fe0 Pumice rztheor rzeff. Porosity* Duration
(%) (%) (g) (g) (cm) (cm) (%) (day)
A 0 100 0.0 269.7 29.69 30.0 72.6 45
B 10 90 200.0 242.7 26.72 26.2 70.5 90
C 25 75 200.0 80.9 10.48 9.8 64.9 36**
D 50 50 200.0 27.0 5.24 5.0 59.5 28**
E 75 25 200.0 9.0 3.49 3.4 54.8 22**
F 100 0 200.0 0.0 2.62 2.6 49.6 17**
* in this values the internal porosity of the pumice is also included 6
** stopped because of excessive permeability loss 7
8
9
10

27
Table 2: Magnitude of contaminant removal in investigated systems. min is the mass of contaminant 1
flowed into the column, E is the removal efficiency and Es the specific removal. 2
System min E Es
Ni Cu Zn Ni Cu Zn Ni Cu Zn
(mg) (%) (mg/g)
B 2130 2130 2881 90.1 99.8 94.2 9.58 10.6 13.6
C 881.3 881.3 1192 98.7 99.9 99.9 4.53 4.40 5.96
D 612 612 828 93.3 99.9 99.6 2.86 3.06 4.12
E 514.1 514.1 695.5 97.9 99.9 99.9 2.52 2.57 3.47
F 367.2 367.2 496.8 94.7 99.9 99.8 1.74 1.83 2.48
3
4
5
28
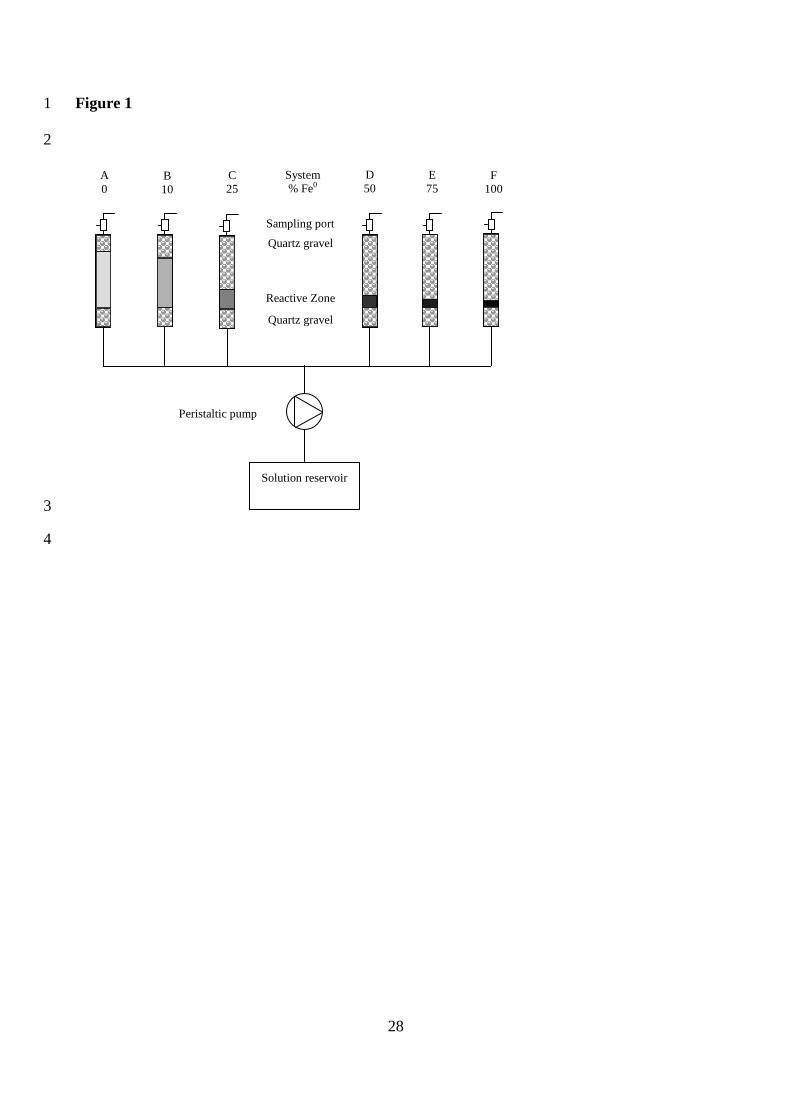
Figure 1 1
2
Sampling port
D 50
E 75
F 100
A 0
B 10
C 25
Peristaltic pump
Solution reservoir
Quartz gravel
Reactive Zone
Quartz gravel
System % Fe0
3
4

29
Figure 2 1
2
0 4 8 12 16 20 24 28 325
6
7
8
9
10 100:0 75:25 50:50 25:75 10:90 0:100
pH
val
ue
/ [-]
elapsed time / [days]
3
4

30
Figure 3 1
2
0 10 20 30 40 50 60 70 80
0
5
10
15
20(a)
Fe0:pumice 100:0 75:25 50:50 25:75 10:90 0:100
iro
n /
[mg/
L]
elapsed time / [days]
3
4
0 10 20 30 40 50
0,0
0,2
0,4
0,6
0,8
1,0 (b)
Fe0:pumice 100:0 75:25 50:50 25:75 0:100
iro
n /
[mg/
L]
elapsed time / [days]
5
6
7

31
Figure 4 1
2
0 20 40 60 80 100
2
4
6
8
10
12
14 Ni Cu Zn
Es
/ [m
g/g
]
Fe0 / [vol %]
3
4
5

32
Figure 5 1
2
0 20 40 60 80
0
4
8
12
16
20 (a)
Fe Cu Ni Zn
elem
ent
/ [m
g/L
]
elaped time / [days]
3
0 20 40 60 80
0
2
4
6
8
10(b)
Cu Ni Zn
elem
ent
/ [m
g/L
]
elapsed time / [days]
4
5
6
7

33
Figure 6 1
2
0 20 40 60 80 10045
50
55
60
65
70
75
initial prorosity specific removal (Zn)
Fe0 / [vol %]
po
rosi
ty /
[%]
0
5
10
15
(a)
Es / [m
g/g
]
3
4
0 12 24 36 48 60 72
-7
-6
-5
-4
-3
-2
-1
(b) Fe0/pumice 100:0 75:25 50:50 25:75 10:90 0:100lo
g K
/ [-
]
elapsed time / [days]
5
6
7

34
Figure 7 1
2
50 55 60 65 700
20
40
60
80
100
(a)
experimental duration residual porosity
initial porosity / [%]
tim
e / [
day
s]
0
20
40
60
80
residu
al po
rosity / [%
]
3
4
50 55 60 65 70
0
20
40
60
80
100
η = 2.1 η = 3.1 η = 6.4
resi
du
al p
oro
sity
/ [%
]
initial porosity / [%]
5
6
7
8

35
Figure captions 1
2
Figure 1: Schematic diagram of the experimental design. Used materials were (i) Fe0 (0 or 200 g), 3
(ii) pumice (0 to 270 g), and (iii) quartz gravel (10 cm at the inlet and balance to fill the column at 4
the outlet). 5
Figure 2: Time-dependant evolution of the pH value of column effluent. The lines are not fitting 6
functions, they simply connect points to facilitate visualization. 7
Figure 3: Time-dependant evolution of the iron concentration of column effluent for a) all 8
experimental duration and b) the first 50 days. The lines are not fitting functions, they simply 9
connect points to facilitate visualization. 10
Figure 4: Influence of the Fe:pumice volumetric ratio on the removal efficiency of CuII, NiII and ZnII as 11
reflected by the Es (mg/g) values. The lines are not fitting functions, they simply connect points to 12
facilitate visualization. 13
Figure 5: Magnitude of Cu, Fe, Ni and Zn release from the column with 10 % Fe0. The lines are not fitting 14
functions, they simply connect points to facilitate visualization. 15
Figure 6: (a) Comparison of the initial porosity and the specific efficiency (Es value for Zn) as 16
influenced by the Fe:pumice volumetric ratio, (b) Time-dependant evolution of the hydraulic 17
conductivity in all six systems. The lines are not fitting functions, they simply connect points to 18
facilitate visualization. 19
Figure 7: (a) Time-dependant evolution of the residual porosity in all six systems and (b) residual 20
porosity Φ(t)/Φ0 for three values of the expansion coefficient η. The residual porosity is Φ(t)/Φ0 = 0 21
for systems with clogging before Fe0 depletion and Φ(t)/Φ0 � 0 at Fe0 depletion. The lines are not 22
fitting functions, they simply connect points to facilitate visualization. 23
24

36
Supplementary Information: Material characterization 1
2
Improving the sustainability of granular iron/pumice systems for water 3
treatment 4
Stefania Bilardia, Paolo S. Calabròa, Sabine Caréb, Nicola Moracia, Chicgoua Noubactepc,d,∗ 5
aUniversità degli Studi Mediterranea di Reggio Calabria, MECMAT, Mechanics and Materials Department, Faculty of 6
Engineering, Via Graziella, loc. Feo di Vito, 89122 Reggio Calabria, Italy. 7
bUniversité Paris-Est, Laboratoire Navier (UMR 8205), CNRS, ENPC, IFSTTAR, F-77455 Marne-la-Vallée, France 8
cAngewandte Geologie, Universität Göttingen, Goldschmidtstraße 3, D-37077, Göttingen, Germany. 9
dKultur und Nachhaltige Entwicklung CDD e.V., Postfach 1502, D-37005 Göttingen, Germany 10
* e-mail: [email protected]; Tel. +49 551 39 3191, Fax. +49 551 399379. 11
12
Content 13
SI1 Material characterization 14
Table SI1: Composition and experimental duration of the studied columns. 15
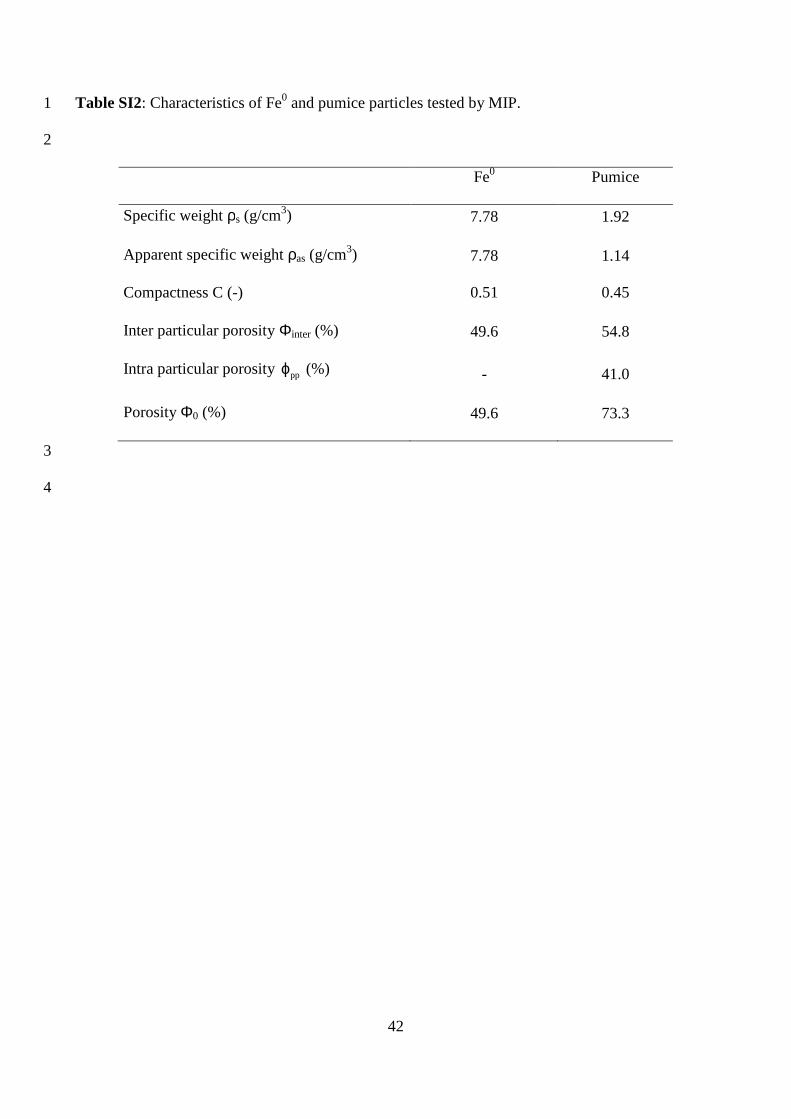
Table SI2: Characteristics of Fe0 and pumice particles tested by MIP. 16
Figure SI1: SEM images of the Fe0 and pumice particles. 17
Figure SI2 : Grain size distributions of Fe0 and pumice. 18
Figure SI3: Cumulative volume intruded and pore size distribution of the pumice particles. 19
20
21
22
* Corresponding author: Tel. +49 551 39 3191, Fax. +49 551 399379; E-mail: [email protected].

37
SI Material characterization 1
SI1 Experimental Section 2
The microstructure of used Fe0 and pumice was characterized using mercury intrusion porosimetry 3
(MIP) measurements and by scanning electron microscopy (SEM) observations. 4
Moreover grain size distribution and the geotechnical parameters (i.e. coefficient of uniformity and 5
mean grain size) derived from it have been determined. 6
SI1.1 MIP 7
MIP is performed by injecting mercury into a desaturated porous material. The in-pore invasion 8
process is supposed to be governed by the Washburn-Laplace equation in which the size of intruded 9
pore accessed, assimilated to cylindrical pores are inversely proportional to the applied pressure 10
according to Eq. 5 (Washburn, 1921): 11
p
2 cosP
R
γ θ= − (SI1) 12
where P is the mercury injection pressure (Pa), γ is the surface tension of mercury (0.485 N/m), θ is 13
the contact angle between solid and mercury (θ = 130°) and Rp is the pore access radius for 14
cylindrical pores (m). MIP measurements have been carried out using a Micromeritics instrument 15
apparatus type (AutoPore IV 9500). The instrument is capable of a minimum intruding pressure of 16
3.4 kPa and a maximum pressure of 227 MPa, so that the pore radius ranges from 2.7 nm to 180 17
µm. 18
For pumice particles the measured pore data allow determining the inter-particular and intra-19
particular porosities of the pumice particles, the apparent specific weight ρas (defined as the ratio of 20
the mass and the apparent volume of the pumice particles) and the specific weight ρs (defined as the 21
ratio of the mass and the volume of the solid phase of the pumice particles). 22

38
SI1.2 SEM 1
During SEM (Hitachi, type: s3400N) observations, secondary electron mode was used. Pumice 2
particles were coated with carbon. The observations enable a characterization of the morphology of 3
both materials and of the inner pore structure of pumice. 4
SI2 Results and Discussion 5
SI2.1 SEM Observations of Fe0 and pumice particles 6
SEM images detailing the microstructures of, respectively, Fe0 and pumice particles are shown in 7
Fig. SI1. These observations show that the Fe0 and pumice particles are irregular. It can be observed 8
that the pumice particles (grains) are porous with oval shaped and fibrous cavities (or pores). The 9
diameter of these cavities at the surface is lower than about 40 µm (radius 20 µm). 10
11
SI2.2 MIP measurements of pumice particles 12
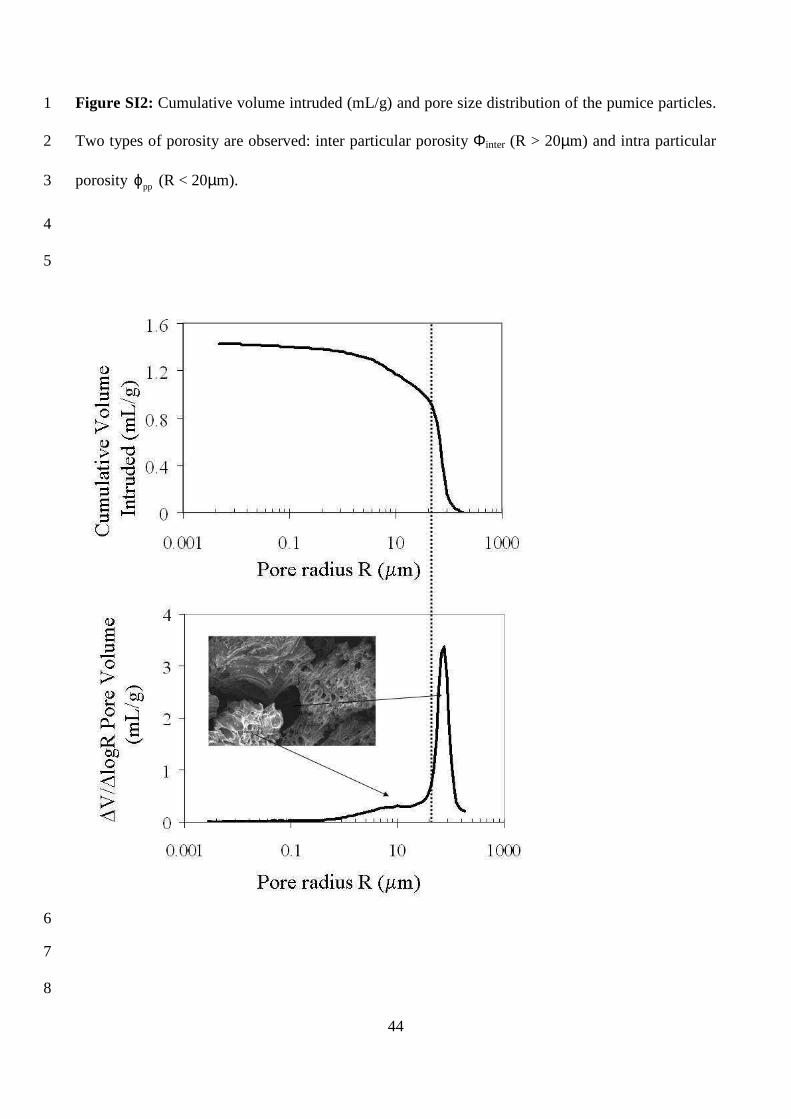
As shown in Fig. SI2, where for graphical convenience the pore size distribution is as usual 13
expressed as ( )
( )d
logd log
iVr
r where Vi is the volume intruded by mercury and R is the pore 14
equivalent radius, pumice exhibits a well defined peak around 70 µm and pores with equivalent 15
radius inferior to 20 µm. According to the SEM observations, these results show that the pores with 16
radius inferior to 20 µm can be attributed to the inner porosity of the pumice particles, so that the 17
pores with equivalent radius superior to 20 µm can be attributed to the inter-particular porosity. The 18
total porosity of the pumice medium Φ0 (%)in the conditions used in MIP tests, is defined as: 19
Φ0 = Vmercury intruded * M / V (SI3) 20
Where Vmercury intruded is the total intrusion volume (mL/g), M the mass of pumice (g) and V the 21
volume of the pumice medium (mL). 22
The volume of the inter-particular volume Φinter (%) is given by: 23
Φinter = VR>20µm / V (SI4) 24

39
Where VR>20µm (mL) is the volume of intruded mercury in pores with radius superior to 20 µm. 1
It can be noticed that the compactness Cpumice (-) of the pumice particles, defined as the ratio of the 2
apparent volume of the particles to the total packing volume (V = volume of the medium), is given 3
by: 4
Cpumice = 1- Φinter. (SI5) 5
Furthermore, the volume of the intra-particular ϕpp is given by: 6
CVV pumicem40Rpp ��µ<= =ϕ (SI6) 7
Where VR<20µm (mL) is the volume of intruded mercury in pores with radius inferior to 20 µm. 8
The results are given in Tab. SI2. The total porosity of the pumice medium has been estimated to be 9
73.3 % and the inner porosity of the pumice to be 41.0 %. 10
11
SI2.3 Grain size distributions of Fe0 and pumice particles 12
The grain size distributions of Fe0 and pumice particles are shown in Fig. SI3. 13
The main geotechnical parameters derived by the grain size distributions are the coefficient of 14
uniformity U= d60/d10 (i.e. ratio between the diameters corresponding to 60 and 10 % finer in the 15
grain size distribution) and the mean grain size d50(i.e. the diameters corresponding to 50 % finer in 16
the grain size distribution). 17
The mean grain size (d50) is about 0.5 mm and 0.3 mm for ZVI and Pumice respectively, their 18
coefficients of uniformity (U) are, respectively 2 and 1.4 and therefore both materials are 19
characterised by a uniform grain size distribution. 20
21
SI2.4 Porosity of the columns 22
Under the hypothesis that the relative density (packing) of granular mixtures are the same in the 23
columns and in the MIP tests, the estimated porosity of the reactive zone can be given for systems 24
A through E (Tab. 1, main text) according to: 25
40
f pppper0 ���� ϕ+Φ=Φ (SI7) 1
where f pp (-) is the pumice particle volume fraction determined by VVf pppp = with Vpp the volume 2
of the pumice particles and the V the volume of the reactive zone. 3
�4
�����������5
Washburn E.W., 1921. The dynamics of capillary flow, Phys. Rev. 17, 273–283. 6
7
8

41
Table SI1: Composition and experimental duration of the studied columns. *-marked systems were 1
stopped because of excessive permeability loss. 2
3
System Composition Duration
(Fe0:pumice) (day)
A 0:100 45
B 10:90 90
C 25:75 36*
D 50:50 28*
E 75:25 22*
F 100:0 17*
4
5
42
Table SI2: Characteristics of Fe0 and pumice particles tested by MIP. 1
2
Fe0 Pumice
Specific weight ρs (g/cm3) 7.78 1.92
Apparent specific weight ρas (g/cm3) 7.78 1.14
Compactness C (-) 0.51 0.45
Inter particular porosity Φinter (%) 49.6 54.8
Intra particular porosity ϕpp (%) - 41.0
Porosity Φ0 (%) 49.6 73.3
3
4

43
Figure SI1: SEM images of the Fe0 particles (A) and of the pumice particles (B). 1
2
3
4
44
Figure SI2: Cumulative volume intruded (mL/g) and pore size distribution of the pumice particles. 1
Two types of porosity are observed: inter particular porosity Φinter (R > 20µm) and intra particular 2
porosity ϕpp (R < 20µm). 3
4
5
6
7
8

45
Figure SI3: Grain size distributions of used materials: Fe0 (a) and pumice (b). 1
2
0
20
40
60
80
100
0.010.1110P
erce
ntag
e fi
ner
Log size (mm)a)
ZVI
0
20
40
60
80
100
0.010.1110
Per
cent
age
fine
r
Log size (mm)b)
PUMICE
3
4