Embed Size (px)
Citation preview

Climate Change
ImprovingtheQualityandReliabilityofHistoricalClimateDataforEnergyApplications
PhilJonesCRU,UEA,Norwich,UK
+othersinECEM(especiallyColinHarpham)

ClimateChange S u m m a r y
« Emphasis here on Climate Variables of greatest relevance to Renewable Energy (radiation/sunshine and wind), but others (e.g. temperature, relative humidity (RH) influence Demand, precipitation influences Hydroelectric Power) are also relevant
« ERA-Interim despite being the best Reanalysis is not perfect. We can assess how good it is (when and where) by comparisons with gridded and station observational datasets. Improving on it is termed here as bias adjustment
« WP2 in ECEM also addresses Seasonal Forecasts and Climate Projections (see next two talks)
2

ClimateChange
W h e r e w e r e w e b e f o r e C 3 S w i t h r e s p e c t t o B i a s A d j u s t m e n t ?« ERA-Interim regridded from its ~0.7° by 0.7° grid to a latitude/longitude grid
at 0.5° by 0.5° spacing « Had to assume ERA-Interim was correct, or attempt simplified bias
adjustment« Simple bias adjustment would use the offset (WFDEI, Weedon et al, 2011,
2014) and apply this separately for each month (all observations in the month adjusted the same). WFDEI didn’t then include wind speed and irradiance
« In ECEM and C4E, daily and sub-daily timescale is important« More complex multivariate methods (addressing intervariable dependence)
have been tested, but until recently have not been applied to the scale of the European Domain. Another issue is whether they can be applied to 3 or more variables?
« Weedon,G.P.etal.,2011:CreationoftheWATCHForcingDataanditsusetoassessglobalandregionalreferencecropevaporationoverlandduringthetwentiethcentury,J.Hydrometeorol.,12,823–848,doi:10.1175/2011JHM1369.1.
« Weedon,G.P.etal.,2014:TheWFDEImeteorologicalforcingdataset:WATCHForcingDatamethodologyappliedtoERA-Interimreanalysisdata.WaterResourcesResearch,50,7505-7514.ISSN0043-1397doi:10.1002/2014WR015638
3

ClimateChange
4
E C E M D O M A I N
« ERA-Interim regridded from its ~0.7°by 0.7° grid to a latitude/longitude grid at 0.5° by 0.5° spacing
« ERA-Interim available every 6-hours. Some variables are from the analysis, some from the forecasts (so 3-hours)
« Many gridded climate datasets available for assessment on the 0.5°by 0.5° grid
« Gridded climate datasets produced by interpolation of station observations accounting for elevation
ECEMwillalsoaveragevariablesacross33countriesand96clusterswithinEuropefromtheE-Highway2050project
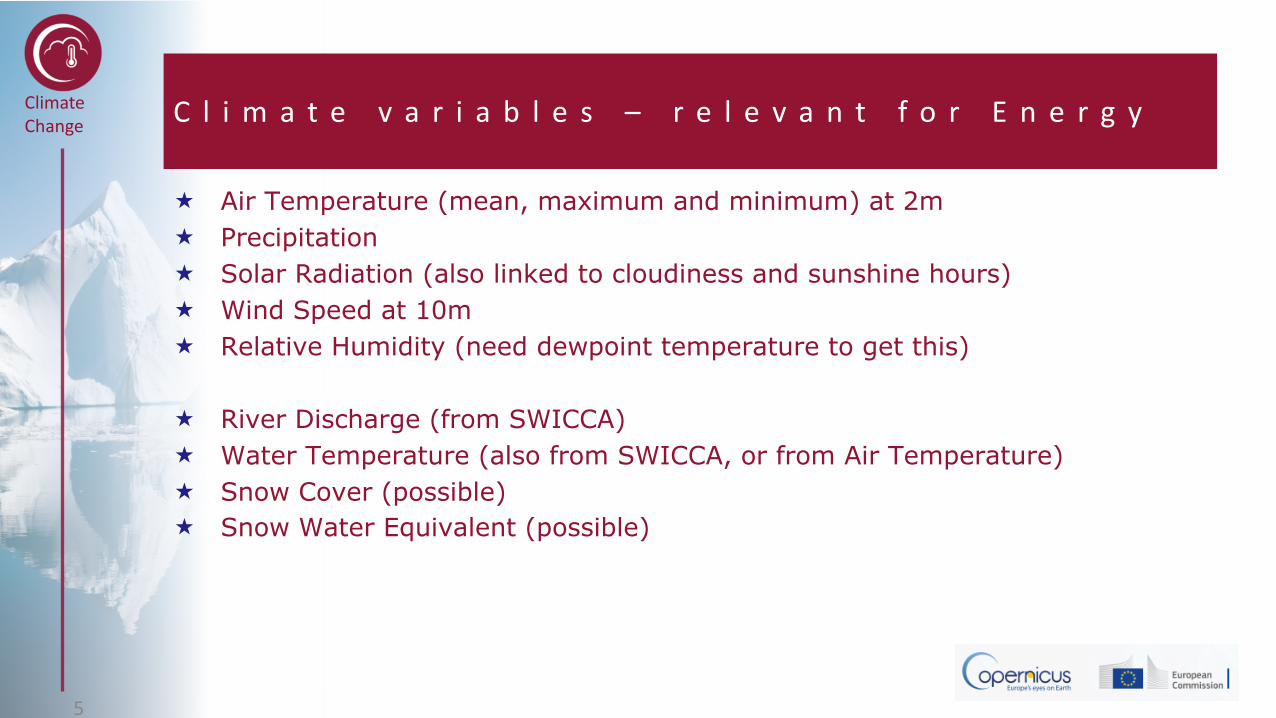
ClimateChange C l i m a t e v a r i a b l e s – r e l e v a n t f o r E n e r g y
« Air Temperature (mean, maximum and minimum) at 2m« Precipitation« Solar Radiation (also linked to cloudiness and sunshine hours)« Wind Speed at 10m« Relative Humidity (need dewpoint temperature to get this)
« River Discharge (from SWICCA)« Water Temperature (also from SWICCA, or from Air Temperature)« Snow Cover (possible)« Snow Water Equivalent (possible)
5

ClimateChange B i a s A d j u s t m e n t a n d U n c e r t a i n t y
« Principal Question is whether the uncertainty introduced by bias adjustment is worth it in terms of added value? Can be assessed by the transfer functions (to Energy Indicators) within WP3 – are these improved with the adjustments?
« How important is the inter-variable consistency in the energy context? « Multivariate adjustment is being assessed in ECEM (Dekens et al.,
2017). Issue is whether this be applied to 3 or more variables?
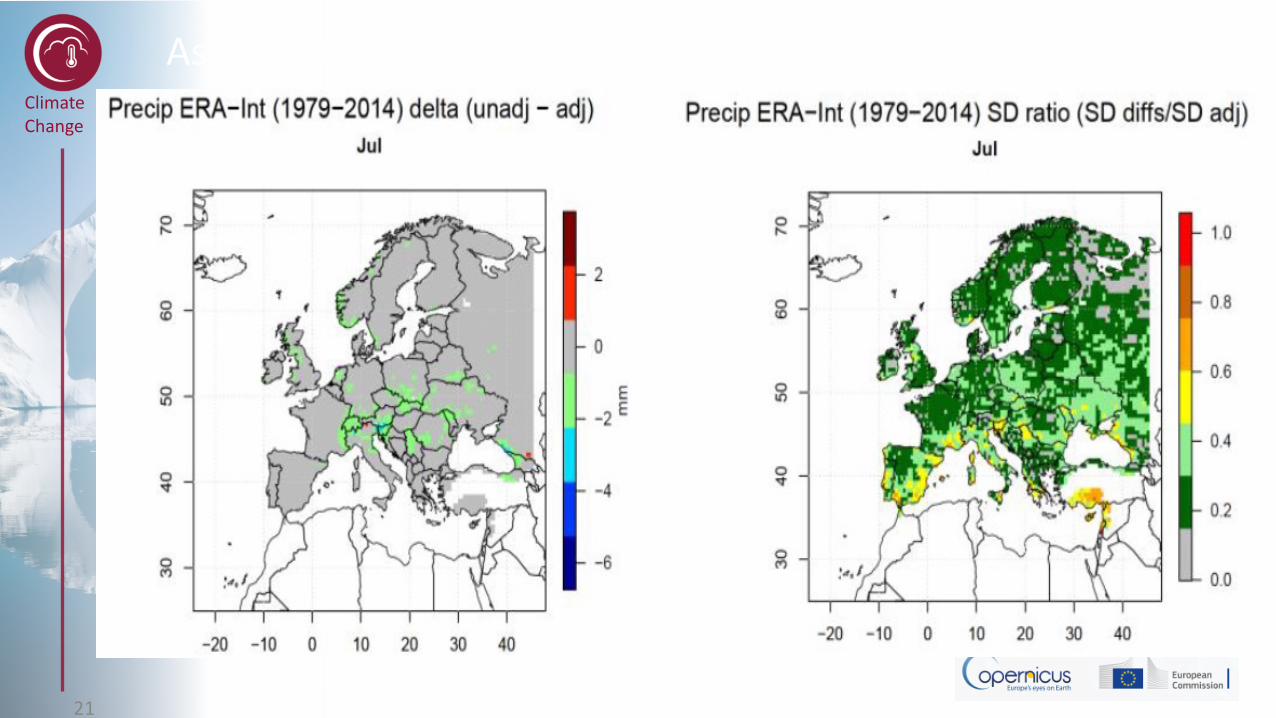
« Uncertainty assessed in ECEM as the difference between the bias-adjusted version and the original ERA-Interim, and also as the standard deviation (SD) of this difference expressed as a ratio/fraction of the full SD of the adjusted field
« Dekens L., S. Parey et al., 2017: Multivariate distribution correction of climate model outputs: a generalisation of quantile mapping approaches. (To be submitted to Environmetrics)
6

ClimateChange
B i a s A d j u s t m e n t P r o c e d u r e s u s e d i n E C E M
« Numerous approaches in the literature« Most were introduced for bias-adjusting GCMs and RCMs (i.e.
projections), where biases with observations are larger than for Reanalyses
« Some in the projection context use Reanalyses for bias adjustment« Our approach (Jones et al., 2017) is distributional in nature, and
equates the distributions between ERA-Interim and Observations, based on different distributions for different variables (following Tye et al., 2014)
« Jones, P.D., Harpham, C., Troccoli, A., Gschwind, B., Ranchin, T., Wald, L., Goodess, C.M. and Dorling, S., 2016: Using ERA-Interim Reanalysis output for creating datasets of energy-relevant climate variables. Submitted to Earth System Science Data Discussions, doi:10.5194/essd-2016-67, 2017 (http://www.earth-syst-sci-data-discuss.net/essd-2016-67/).
« Tye, M.R., Stephenson, D.B., Holland, G.J. and Katz, R.W., 2014: A Weibull approach for improving climate model projections of tropical cyclone wind-speed distributions. J. Climate 27, 6119-6133.
7

ClimateChange
8
« Wind Speed biases larger than solar irradiance« Air Temperature/Precipitation biases smaller still and mostly < 0.2
(plots in additional slides)« Biases related to amount of observational data and spatial variability

ClimateChange
9
WindSpeedDistributionExamples(onesiteof803locations)

ClimateChange
S o l a r I r r a d i a n c e a n d O t h e r V a r i a b l e s
« Solar Irradiance (other important energy variable)
« Normal Distribution for Air temperature and Dewpoint Temperature (latter to get RH)
« Gamma Distribution for Precipitation (Fits much better when a low threshold for daily precipitation is selected, 0.5-1.0mm). Adjusting ERA-Interim will set all low precipitation totals to zero.
« Dewpoint temperatures from HadISD« Air Temperature and Precipitation from E-OBS
10

ClimateChange I r r a d i a n c e
11
« Relatively few sites across Europe with direct radiation measurements
« Here 55 sites with data for 1985-2014, but some are not that complete
« 26 near complete sites from WRDC (World Radiation Data Centre) and BSRN (Baseline Surface Radiation Network)
« Work done by Lucien Wald and others at MINES, Paris

ClimateChange
12
SolarIrradianceBiasAdjustments

ClimateChange
W h e r e a r e w e n o w ?
« Bias Adjusting ERA-Interim (wind, irradiance, air temperature, dewpoint/RH and precipitation)
« Will be updated in early 2017 to provide complete series for 1979-2016 (earlier calibration period of 1979-2014 will remain)
« Approach can be adapted for ERA-5 when fully available« Bias-adjusted data available at ftp://ecem.climate.copernicus.eu
and eventually through the Climate Data Store (CDS)
« Most variables are based on surface observations and variables from the surface in ERA-Interim, but some experimentation with Level 58 winds. Winds at this level might be better for use in turbine generation formulae, but validation against observations is limited to a few towers. 100m wind will be a specific output of ERA-5. Possible to use satellite data to verify the Reanalysis
13

ClimateChange
L i m i t a t i o n s
« Uncertainty in bias adjustments is small, more so for gridded observational fields like air temperature and precipitation
« Uncertainty in bias adjustments is larger for wind speed, but part of this is due to comparing station series with gridded ERA-Interim data
« Assessing uncertainty is dependent on the quality of the observational (station and gridded) datasets used. This is important to bear in mind in regions of sparse data coverage and in regions of high elevation (where stations may be at quite different elevations, so less representative of ERA-Interim grid-box averages)
« Assessing uncertainty this way also only considers the bias-adjustment method used. Other bias-adjustment methods might have produced slightly different results, with the effect of this being referred to as ‘structural’ uncertainty
14

ClimateChange
D i s c u s s i o n P o i n t s f o r N e x t S e s s i o n« Data availability – large netcdf files« Quality of the observational data series. This is clearly an issue
with greater uncertainty in bias adjustments for wind speed than solar irradiance and the many more observations for air temperature and precipitation data
« Uncertainty issues (spatial scales, structural)« Uncertainties for some variables can be large locally, but this is
likely due to the representativeness of the observed series« Impact of ERA-5. Only possible to assess this when the simulation
is fully complete from 1979 to 2016« 100m wind will be a specific output of ERA-5. Possible to use
satellite data to verify the Reanalysis winds, as well as a few towers
15

ClimateChange
O t h e r S l i d e s
16

ClimateChange O b s e r v a t i o n a l d a t a s e t s
« E-OBS (KNMI) provides gridded fields of daily max/min air temperature and precipitation totals (on a 0.5⁰ by 0.5⁰latitude/longitude grid)
« CRU and GPCC fields for monthly temperatures and precipitation totals on the same grid as E-OBS
« Gridded data for wind speed and dewpoint temperature not available. Instead, the dataset HadISD of sub-daily stations measurements will be used
« Gridded data for solar radiation not available, but satellite data (HELIOCLIM) used and 55 station series across Europe
17

ComparisonofERA-Interim(nearest)andHadISD StationObservations(at10m)oftheshapeandscaleparametersoftheWeibulldistributionfitto6-hourlyestimates
18
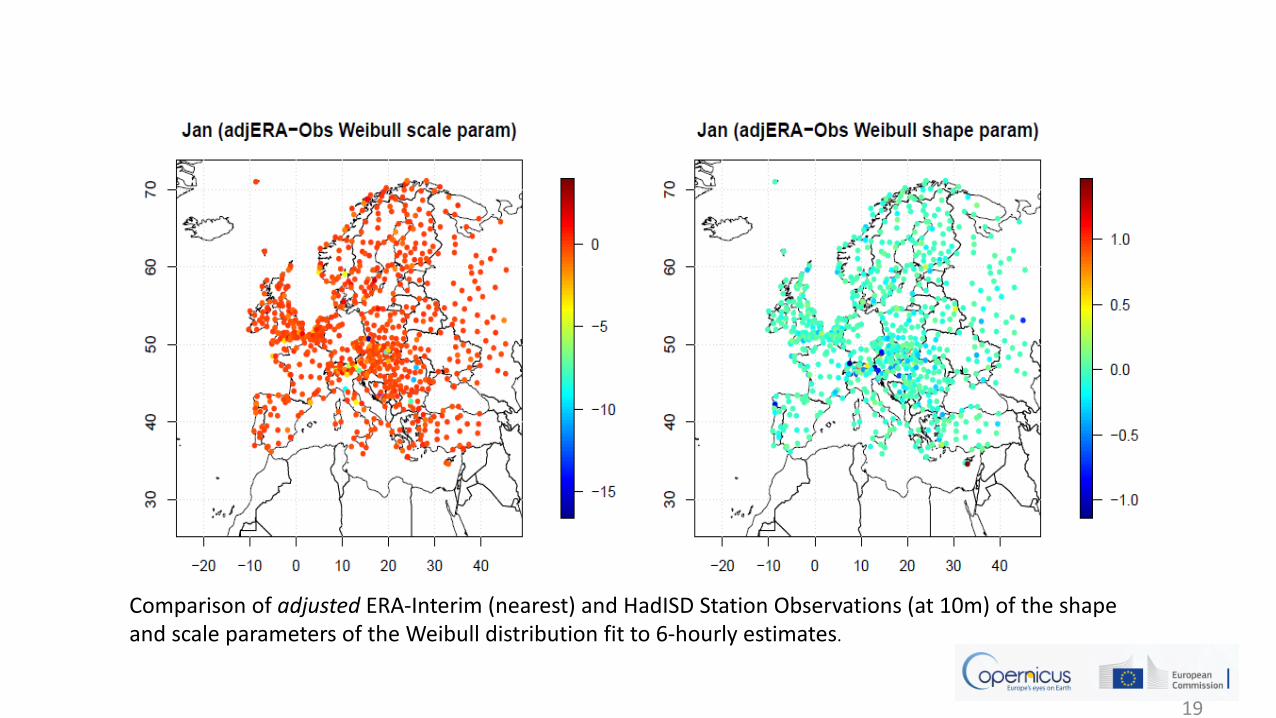
Comparisonofadjusted ERA-Interim(nearest)andHadISD StationObservations(at10m)oftheshapeandscaleparametersoftheWeibulldistributionfitto6-hourlyestimates.
19
WINDSPEED

ClimateChange
20
AssessingUncertaintyofBiasAdjustments
ClimateChange
21
AssessingUncertaintyofBiasAdjustments

22
ClimateChange R a d i a t i o n ( c o n c l u s i o n s )
23
« As a whole, slight overestimation by ERA-Interim« +2 to+17% for the Baltic area, -4 to +14% for France and -
13 to -5% for eastern Europe« Bias and large variation of errors due to errors in predicting
cloud amount« ERA-Interim is calibrated over 2005-2014 (using
Helioclim3.5) and this regression applied to the whole period from 1979
« Assessed by improvement at the stations

ClimateChange
M u l t i v a r i a t e b i a s c o r r e c t i o n
• Testswithapproachesproposedintheliterature– Ex:Vrac andFriederich,2015basedonrankcorrelation
• Conservesthetemporalevolutionofthecalibrationperiod
• Multivariateextensionofdistributioncorrections– Goodperformance,morecomputationallydemanding,moredataneededfor
correctestimationifmorethan2variables– Modestimprovementcomparedtounivariate bias-correctionwhenbothvariables
arecorrectedaccordingtoconsistentobservations
TEMPERATURE WINDSPEED
ObservationERA-InterimSeparate bias correction+ rank correction