Embed Size (px)
Citation preview

Improving the Performance of Rural Water Supply and Sanitation Sector in MaharashtraA
Compendium of Training Materials for the Capacity Building of the Faculty and Students of Engineering Colleges on
Under the Unnat Maharashtra Abhiyan (UMA)
IMPROVING THE PERFORMANCE OF RURAL WATER SUPPLY AND SANITATION SECTOR IN MAHARASHTRA

Improving the Performance of Rural Water Supply and Sanitation Sector in MaharashtraB
Project Team
A] Programme DirectorsDr M Dinesh Kumar, IRAPProf Dr Puru Kulkarni, CTARAProf Dr Om Damani, CTARA
B] UNICEF’s Mumbai RepresentativeMr Yusuf KabirMr Anand Ghodke
C] Resource PersonsDr M Dinesh Kumar, IRAPMr Nitin Bassi, IRAPMs Meera Sahasranaman, IRAPDr Harish Kumara, IRAPProf Dr Puru Kulkarni, CTARAProf Dr Om Damani, CTARADr Raj Desai, CTARAMr Abhishek Sinha, CTARAMs Vaishali Bharambe, CTARAMr Nikhil Hooda, CTARAMr Praneeth Kadambala, CTARA
D] CoordinationProf Dr Milind Sohoni, CTARA and UMAMs Oshin Dharap, CTARA and UMAMr Arijit Ganguly, IRAP Mr Sivarama Kishan, IRAPMr Yatin Diwakar, CTARA
E] Design Mr. Partha Chakraborty, Watershed Films

Improving the Performance of Rural Water Supply and Sanitation Sector in Maharashtrai
Compendium of Training Materials for the Capacity Building of the Faculty and Students of Engineering Colleges on
IMPROVING THE PERFORMANCE OF RURAL WATER SUPPLY AND SANITATION SECTOR IN MAHARASHTRAUnder the Unnat Maharashtra Abhiyan (UMA)
Prepared ByInstitute for Resource Analysis and Policy, Hyderabad&CTARA, IIT Bombay
Supported byUNICEF, Mumbai
March, 2018

ContentTitle Page
List of Figuresvi
List of Pictures vii
List of Tables viii
Foreword x
Preface xi
Introduction to the Capacity Building Initiative
Introduction to the Capacity Building Initiative 2
1 The Rationale 2
2 Project Description 5
3 Objectives of the Project 5
4 Approach 5
5 Data and Resources Utilised 6
Training Modules
Module 1 Planning Rural Water Supply from a Regional Perspective
10
1.1 Introduction 10
1.2 Current Norms for Planning Rural Water Supply Schemes in India
11
1.3 Inadequacies of the Current Norms 12
1.4 How Climatic Factors Influence Rural Household Water Needs?
13
1.5 How Socio-economic Factors Influence Rural Household Water Needs?
13
1.5.1 Impact of income on domestic water needs
13
1.5.2 Impact of occupational profile on productive water needs
14
1.5.3 Impact of water price on domestic water consumption
14
1.6 Per Capita Water Requirement for Drinking and Cooking
15
1.7 Per Capita Water for Other Human Needs 16
1.8 Water for Livestock 17
1.9 Water for Kitchen Garden 18
1.10 Summary 20
Title Page
Module 2 Choosing the Appropriate Technology for a Water Supply Scheme
22
2.1 Introduction 22
2.2 Different Types of Water Supply Technologies for Rural Areas
24
2.2.1 Hand pump based schemes 24
2.2.2 Well-based individual village schemes
26
2.2.3 Tube well based multi village schemes
26
2.2.4 Reservoir and French well based schemes for multiple villages
28
2.2.5 River lifting schemes for multiple villages
29
2.2.6 Spring based schemes in the hilly/mountainous areas
30
2.2.7 RO schemes for individual village in salinity affected areas
31
2.2.8 Combined water supply systems (cwss)
33
2.3 Factors Determining Selection of Appropriate Water Supply Technology
34
2.3.1 Physical sustainability 34
2.3.2 Economic viability 36
2.3.3 Social viability 37
2.3.4 Institutional sustainability 38
2.3.5 Ecological sustainability 39
2.4 Water Supply Systems for Peri-urban Areas 40
2.5 Conclusions 41
Module 3A: Monitoring and Evaluation of Rural Water Supply Schemes
44
3A.1 Introduction 44
3A.2 Performance Assessment Criteria 44
3A.2.1 Physical performance 45
3A.2.2 Financial & economic performance 46
ii

Title Page
3A.2.3 Institutional performance 46
3A.2.4 Management performance 46
3A.2.5 Environmental performance 46
3A.3 Performance Assessment Indicators 47
3A.3.1 Physical performance 47
3A.3.2 Financial and economic performance
47
3A.3.3 Institutional performance 47
3A.3.4 Management performance 48
3A.3.5 Environmental performance 48
3A.4 Performance Monitoring Process 48
3A.5 Case Studies 49
3A.6 Conclusion 51
Module 3B: Process for Third Party Evaluation of Rural Water Supply Schemes
52
3B.1 Introduction 52
3B.2 Activities Involved in RWS Assessment 52
3B.2.1 Data collection 53
3B.2.2 Field visit activity 59
3B.2.3 Data analysis 66
3B.2.4 Reporting structure 70
Annexure 3B.1 Technical Recommendation Letter for Sub-Surface/Groundwater Based Source Selection for Piped Water Supply Scheme
73
Annexure 3B.2 Letter Certifying Decision of Gram Panchayat for A Water Supply Scheme
75
Annexure 3B.3 Composition of Village Water and Sanitation Committee
77
Annexure 3B.4 Composition of Social Audit Committee
78
Annexure 3B.5 Technical Sanction for Piped Water Supply Scheme
79
Title Page
Annexure 3B.6 Administrative Sanction of Piped Water Supply Scheme
82
Annexure 3B.7 Template for Infrastructure Related Data Collection
83
Annexure 3B.8 Operation and Service Level Data Collection Form
88
Annexure 3B.9 Instruction Sheet for Gram Panchayat Office and Village Water and Sanitation Committee (VWSC) TDSC, IIT Bombay
89
Module 3C Success Indicators for Rural Water Supply Schemes and Case Studies
93
3C.1 Introduction of Success indicator 93
3C.2 Conceptual Framework 94
3C.2.1 Marking to components 95
3C.2.2 Planning and design phase 95
3C.2.3 Implementation phase 97
3C.2.4 Operation & Maintenance Stage 102
3C.2.5 Exit and handover phase 105
3C.3 Success Indicator Interpretation 106
3C.4 Success Indicator Scores of Audited Schemes
109
3C.5 Case Study 110
3C.5.1 Project background 110
3C.5.2 Scheme overview 112
3C.5.3 Planning and design audit 114
3C.5.4 Implementation audit 116
3C.5.5 Operation audit 120
3C.5.6 Scheme Findings 123
3C.5.7 Success Indicator 124
3C.5.8 Recommendations 125
iii

Title Page
Module 4A Designing Piped Water Supply (PWS) Schemes with Focus on Water Supply Infrastructure
127
4A.1 Introduction to Piped Water Supply (PWS) 127
4A.1.1 Single village scheme 127
4A.1.2 Multi village scheme 128
4A.2 Planning of PWS Schemes 128
4A.2.1 Service area selection 129
4A.2.2 Design period and demand norm selection
129
4A.2.3 Source selection 130
4A.2.4 Site selection 13!
4A.2.5 Pipe material selection 13!
4A.3 Design Elements 132
4A.3.1 Rising main 132
4A.3.2 Pumping machinery 134
4A.3.3 Water Treatment Plant (WTP) 135
4A.3.4 MBR/ ESR/ GSR 135
4A.3.5 Transmission and distribution network
137
4A.3.6 Accessories in the supply system 139
4A.4 Conclusion 140
Module 4B Failure Analysis of PWSS
141
4B.1 Definition and Type of Failure 141
4B.2 Occurrence and Prominence of Failure 142
4B.3 Method of Failure Analysis 142
4B.3.1 Identification of failure modes 143
4B.3.2 Identification failure path 143
4B.3.3 Identification of reasons for failure: 144
Module 4C Jal Tantra Software for Design and Optimisation of Water Distribution Networks
148
4C.1 Introduction 148
4C.2 Problem Formulation 149
4C.3 Pipe Diameter Selection 149
Title Page
4C.4 Addition of Parallel Pipes 152
4C.5 ESR Sizing and Allocation 152
4C.6 Pumps/Valves 153
4C.7 GIS Integration 153
4C.8 Jal Tantra System Description 154
4C.9 Jal Tantra System Screenshots 156
Module 5A Operation and Maintenance of the Rural Water Supply System
158
5A.1 Introduction 158
5A.2 Different Components and their Maintenance Requirements
159
5A.3 Monitoring, Surveillance and Evaluation 160
5A.4 Tariff Fixation and Financial Support 160
5A.5 Action Plan for the Operation and Maintenance of Water Supply/ Sanitation systems
161
Module 5B Water Source Protection and Source Strengthening
163
5B.1 Introduction 163
5B.2 Source Protection 163
5B.2.1 Surface water sources 163
5B.2.2 Groundwater sources 166
5B.3 Source Strengthening 167
5B.4 Conclusions 168
Module 5C Operation and Management of PWS (Overview, Assets and Leakage Detection)
170
5C.1 Current Scenario of O&M 170
5C.2 Possible Reasons for Poor O&M 170
5C.2.1 Background of the study 171
5C.3 Intervention Theme and Remedies 172
5C.4 Asset Management 173
iv

Title Page
5C.5 Leakage Management 173
5C.5.1 Factors influencing leakage 174
5C.5.2 Four basic leakage management techniques
174
5C.5.3 Active leakage control 175
5C.5.4 Location technology 176
Module 6 Institutional Environment and Institutional Struc-tures for Rural Water Supply
178
6.1 Introduction 178
6.2 Institutional Environment 179
6.3 Water Institutions 180
6.3.1 National and state water policies 180
6.3.2 Relevant legislations and regulations
180
6.3.3 Groundwater regulation act for drinking source protection
183
6.3.4 The Water (Prevention and Control of Pollution) Act
185
6.3.5 National guidelines on quality of drinking water in rural areas 189
6.4 Administrative Structures 190
6.4.1 Ministry of Drinking Water and Sanitation, Government of India
190
6.4.2 Maharashtra Water Resources Regulatory Authority (MWRRA)
191
6.4.3 Department of Water Supply and Sanitation, Government of Maharashtra
191
6.4.4 Maharashtra Jeevan Pradhikaran (MJP) 192
6.4.5 Groundwater Surveys and Development Agency (GSDA)
193
6.4.6 District (ZP) and Gram Panchayats (GP)
193
6.4.7 Water Supply and Sanitation Organization (WSSO)
193
6.5 Conclusion 194
Title Page
Module 7Environmental Sanitation and Wastewater Treatment
196
7.1 Introduction 196
7.2 Access to Water Supply and Adoption of Improved Sanitation
196
7.3 Sanitation Facilities and Source Protection of Drinking Water Sources
197
7.4 Waste Water Treatment 199
7.4.1 Conventional or centralised wastewater treatment
200
7.4.2 Decentralised systems for wastewater treatment
201
7.4.2.1 Soil based treatment methods
202
7.4.2.2 Aquatic systems 203
7.4.2.3 Wet land systems 207
7.4.2.4 Decentralized systems in Maharashtra
210
7.5 Design of Rural Sanitation Systems for Different Physical Environments
212
7.6 Design Issues in Rural Sanitation Systems 214
7.7 Maintenance of Rural Sanitation Systems 215
7.8 Conclusion 216
Annexures
Annexure 1The Unnat Maharashtra Abhiyan (UMA) Frame-work
220
A1.1 Background 220
A1.2 Unnat Maharashtra Abhiyan- A Mechanism to Reform Higher and Technical Education
222
Annexure 2List of Colleges that Participated
225
Annexure 3List of Participants
226
Annexure 4List of Resource Persons
229
v

Figure No. Title Page
Figure 2.1 Schematic lay out of distribution network of Santalpur regional water supply scheme
27
Figure 2.2 Infiltration well or French well 29
Figure 2.3 Spring based water supply 30
Figure 3A.1 Suggested phases for using ICT for monitoring performance of rural water schemes
48
Figure 3B.1 Schematic flow diagram 56
Figure : NRDWP website / 3B.2.2
Field visit activity 58
Figure 3B.3 Measuring dimensions of well 60
Figure 3B.4 Screenshot showing exporting file from GPS tool
62
Figure 3B.5 Measuring length trough elevation profile
63
Figure 3B.6 Existing distribution network of Kinhavali village
65
Figure 3C.1 Indicators for measuring the scheme success at various stages
93
Figure 3C.2 Chart showing attributes of Success indicator structure
94
Figure 3C.3 Google map image showing Vape village
112
Figure 3C.4 Schematic layout of the scheme 113
UP: Figure 3C.5
Well and empty well (Disilting in progress)
117
DOWN: Figure 3C.6
Submersible pump and pipe connected to pump and improper support structure
117
Figure 3C.7 Outside and inside view of pump house
118
Figure 3C.8 ESR at Vape 119
Figure 3C.9 Distribution network laid on ground 119
Figure 3C.10 Existing distribution network in Vape 120
Figure 3C.11 Distribution network in Avchitpada 120
Figure 3C.12 Stand posts in village 121
Figure 4A.1 Schematic layout of Tadwadi-Morewadi village scheme
127
Figure No. Title Page
Figure 4A.2 Schematic layout of Sugave multi village scheme
128
Figure 4A.3 Elements of PWS scheme with their design attributes
133
Figure 4A.4 Staging height as per minimum residual head
136
Figure 4A.5Staging height vs. Pipe diameter
136
Figure 4A.6 Branch network 137
Figure 4A.7 Loop network 137
Figure 4B.1 Picture showing over provision in the planning & design phase
141
Figure 4B.2 Common failure modes of PWSS 143
Figure 4B.3 Failure path of Kinhvali scheme 144
Figure 4B.4 Delay analysis for Mugaon scheme in raigarh district
146
Figure 4C.1 Example network 150
Figure 4C.2 Commercial pipe info 150
Figure 4C.3 Optimization results 150
Figure 4C.4 Alternate tank/ESR configurations for a sample network
153
Figure 4C.5 GIS tool in Jal Tantra 154
Figure 4C.6 EPANET file for Mokhada network 155
Figure 4C.7 General tab of Jal Tantra 155
Figure 4C.8 Node tab of Jal Tantra 156
Figure 4C.9 Pipes tab of Jal Tantra 156
Figure 4C.10 ESR tab of Jal Tantra 156
Figure 4C.11 Pump tab of Jal Tantra 157
Figure 12 Results tab of Jal Tantra 157
Figure 5C.1 Four basic leakage management techniques
175
Figure 6.1 Institutional linkages within the water institutions
178
Figure 6.2 Water Institutional Structure 179
Figure 6.3 Distribution of ground WQMS in Maharashtra
188
Figure 6.4 Distribution of surface WQMS in Maharashtra
188
List of Figures
vi

Figure No. Title Page
Figure 6.5 Organogram of Water Supply and Sanitation Department (WSSD), Government of Maharashtra
192
Figure 7.1 Area (m2) required for treatment in WSP at different temperatures
205
Figure 7.2 Map showing east Kolkata wetlands 207
Figure 7.3 Phytorid treatment technology 209
Figure 7.4 Cross-section of subsurface-flow constructed wetland
209
Figure 7.5 Free water surface system 209
Figure 7.6 Schematic diagram showing flow pattern of the DOSIWAM system
211
Figure 7.7 Schematic diagram showing process flow of the Tiger Bio Filter
212
Figure 7.8 An Imhoff tank 214
Figure A1.1 Percentage of Rural Households with Primary Source more than 500m. away (2001)
221
Figure A1.2 Percentage of Rural Households with Primary Source more than 500m. away (2011)
221
List of PicturesPicture No. Title Page
Picture 2.1 A Hand pump 25
Picture 2.2 River intake structure 30
Picture 2.3 RO plant at Pansari, Gujarat 33
Picture 7.1: A sewage treatment plant 201
Picture 7.2 Soil Bio Technology (SBT) Plant, Mumbai (Implemented by: Mumbai Municipal Corporation &IIT Mumbai)
202
Picture 7.3 A duckweed based wastewater treatment system at Mirzapur, Bangladesh (Source: UNEP) and Lemna Minor or common duckweed
206
Picture 7.4Constructed wetland in the campus of Indian Agricultural Research Institute, Delhi
208
vii

List of TablesTable No. Title Page
Table 1.1 Access to piped water across the income distribution in rural India
13
Table 1.2 Volume of water required for hydration 16
Table 1.3 Water use by rural households (lpcd) in developing countries in relation to access to water supply
17
Table 1.4Drinking water requirement for animals in different livestock production systems
18
Table 1.5 Voluntary water intake of livestock under different climatic conditions
19
Table 1.6 Household domestic and productive water needs as estimated for different climates, activity levels and diet requirements
20
Table 2.1 Features of different types of rural water supply technologies
24
Table 2.2 Cost of RO water supply in India 32
Table 2.3 Factors influencing selection of the appropriate water supply technology for rural areas
34
Table 3A.1Summary of some of the performance assessment of rural water supply schemes in India
49
Table 3B.1 Authorities providing sanction depending upon budget of scheme
54
Table 3B.2 Operation information of Sapgaon RWS Scheme
63
Table 3B.3 Flow measurement at households 66
Table 3B.4 Asset design details of Vape RWS scheme
67
Table 3B.5 Physical assets details 68
Table 3B.6 Annual expenditure and recovery of scheme
69
Table 3C.1 Details of planning & design phase 95
Table 3C.2 Per capita investment 97
Table 3C.3 Details of implementation phase 98
Table 3C.4 Index of success indicator scores 106
Table 3C.5 Four examples and its phase wise score 108
Table 3C.6 Phase wise remarks of example schemes
108
Table 3C.7 Audited scheme scores 110
Table 3C.8 Scheme details 113
Table No. Title Page
Table 3C.9 Site visit details 114
Table 3C.10 Documents assessed 114
Table 3C.11 Assets design details 115
Table 3C.12 Physical assets detail 116
Table 3C.13 Flow measurement 122
Table 3C.14 Utilization of budget 122
Table 3C.15 Annual charges 123
Table 3C.16 Final success indicator score 125
Table 4A.1 Comparison of different materials used for pipes
132
Table 4B.1 Failure analysis of all slip back habitation in Konkan region of Maharashtra
142
Table 4B.2 Data collection and failure analysis activities
142
Table 4B.3 Possible failure reason under various phases of scheme in Maharashtra
145
Table 5C.1 Comparison of actual vs planned for parameter of O&M
171
Table 5C.2 Cost of production under three scenario and revenue potential per 1000 L
171
Table 5C.3 Intervention remedies for better O&M scenario
172
Table 5C.4 IWA water balance 173
Table 6.1 Water supply legislations in Indian States
181
Table 6.2 Protocol for water quality monitoring in Maharashtra
186
Table 6.3 Community awareness about the water quality monitoring
189
Table 7.1 Indicators on sanitation facilities in rural households in Maharashtra
197
Table 7.2 Proportion (per 1000) of households with access to different type of latrine for rural Maharashtra during 2012
197
Table 7.3 Water and Sanitation Related Diseases 198
Table 7.4 Salient features of the wastewater treatment technologies
199
Table A1.1 Year-round access to drinking water per 1000 people (various rounds of NSSO in 2008 and 2012)
221
Table A1.2 Sample regional knowledge and practice (RKP) areas 223
viii

ix

Foreword
Improving the Performance of Rural Water Supply and Sanitation Sector in Maharashtrax

Preface
Dear Colleagues,
Over the last two decades, Maharashtra has made big strides in achieving access to safe water and sanitation facilities in rural areas. However, due to the state’s unique geo-hydrology which offers limited groundwater potential and the fact that most of the earlier water supply schemes were based predominately on groundwater because of the resource constraints, source failure and slippage of habitations from source- to no-source village has been quite common. In some cases, quality of water supply and sanitation infrastructure are not up to the mark.
In order to address the challenges faced by the state’s Rural Water Supply and Sanitation Sector, Water Supply and Sanitation Department (WSSD), Government of Maharashtra (GoM) has recently launched Mukhyamantri Rural Drinking Water Programme with the overall objective of providing clean and adequate drinking water to the rural population. Further, to ensure enhanced performance of the water supply schemes, the WSSD has passed orders (through the Government Resolutions) to make third party technical inspection (by involving State engineering colleges among others) of rural water supply schemes compulsory and issued guidelines on how such inspections should be carried out. These initiatives are in line with the restructured NRDWP guidelines which have made third party evaluation of the completed piped water supply schemes mandatory.
The WSSD is also trying to use the opportunity provided by the programme, titled Unnat Maharashtra Abhiyan (UMA) launched by the Higher and Technical Education (HTE) Department, GoM whose mandate is to build an independent and public knowledge infrastructure for the state of Maharashtra.
With this backdrop, a team of professionals from UNICEF, Mumbai; Institute for Resource Analysis and Policy (IRAP), Hyderabad; and, the Centre for Technology Alternatives for Rural Areas (CTARA), IIT-Bombay has prepared a training compendium (under UMA initiative) on rural water supply and sanitation. It is aimed at building the capacities of teachers and students of engineering colleges to help WSSD with the evaluation of the rural water supply schemes and also independently plan and design rural water supply schemes. A first phase of the capacity building workshop was organised for 16 Regional Engineering Colleges (REC) in the state during September 2017. Subsequently, technical evaluation of some rural water supply schemes was undertaken by the participating colleges between November 2017 and January 2018 under the guidance of the project team. This was followed by a two-day feedback workshop in January, 2018 during which the teams from the participating colleges presented their work.
This training compendium will also provide a useful reference material to the other prospective third party evaluators and various state Water Supply Departments in understanding the emerging criteria and methodologies for planning, designing and comprehensively assessing the performance of the rural water supply schemes.
The project team acknowledges the support and inputs provided by the HTE Department, GOM; the participating RECs of Maharashtra; the CEOs’ of the Zilla Parishads of the districts which were included in the surveys; and WSSD, GoM for successful completion of the capacity building programme which was organised under the UMA.
Thank you
Sincerely,
Dr M Dinesh Kumar, IRAP
Prof Puru Kulkarni, CTARA, IIT
Mr Yusuf Kabir, UNICEF Mumbai
Improving the Performance of Rural Water Supply and Sanitation Sector in Maharashtraxi

Improving the Performance of Rural Water Supply and Sanitation Sector in Maharashtraxii

Improving the Performance of Rural Water Supply and Sanitation Sector in Maharashtra1
Introduction to the Capacity Building Initiative

1. The Rationale
Access to water supply has improved remarkably in rural areas of Maharashtra during the past 15 years. While nearly 50.2 per cent of the households have some sort of access to tap water, only less than 32 per cent get treated water in taps. Moreover, only 42 % of the rural population have access to drinking water within their dwelling premises, which brings down the number of households having access to treated tap water in dwelling premises to an abysmally low figure. A little more than 18 per cent get untreated tap water. Twenty three per cent get water from bore wells and hand pumps and another 24.3 per cent depend on open wells of which 87 per cent is unpro-tected (IRAP/UNICEF, 2013). A large proportion of the rural households (58%) have to depend on sources that are not within the premises to get safe water for drinking and domestic uses. Source failure and slippage of habitations from source village to no-source village is quite common. Access to improved sanitation facilities and their use are still very poor, one reason being the lack of access to dependable source of water in the dwelling premise and construction of poor quality of toilet where chances of water contamination is high
The rural water supply systems fail or malfunction due to the following problems:
01. Poor technical (climate) and socio-economic considerations in planning for rural domestic water supply
02. Lack of use of sound physical, social, economic, institutional and environ-mental criteria in the selection of technologies for water supply: It is largely driven by considerations of decentralized management, with the result that low cost, single village schemes based on wells are preferred against those that are based on dependable sources.
03. Deficiencies in the design of village water supply infrastructure: physical setting, demography and socio-economic conditions are not taken into account
04. Mismatch between technology and institutions: Village Water Supply and Sanitation Committees are often not capable of managing complex systems in the absence of adequate human resource provisioning and financial support
05. Absence of wastewater treatment and reuse systems for treating domestic effluent
Introduction to the Capacity Building Initiative Improving the Performance of Rural Water Supply and Sanitation Sector in Maharashtra
Under the Unnat Maharashtra Abhiyan (UMA)
Improving the Performance of Rural Water Supply and Sanitation Sector in Maharashtra2

06. Lack of comprehensive criteria for monitoring and performance evaluation that integrate concerns of physical sustainability of the source, maintaining the basic per capita supply levels, equity in access to water supply, cost efficiency and management efficiency
To elaborate, the norms on per capita water supply used at the time of planning of schemes are rather outdated and not based on the real needs of the population, which is determined by the socio-economic and climatic conditions. The fact that village communities need water to take care of their productive as well as domestic needs is ignored while fixing per capita supply norms, with the result that the amount of water supplied is often too inadequate (GSDA, IRAP & UNICEF, 2013). This forces the households to look for other sources of water in the village to meet their requirements. This results in either the schemes lying neglected (GADA, IRAP and UNICEF, 2013), or reduced willingness to pay for water supply services or the households diverting water from the schemes for meeting the high priority needs (van Koppen et al., 2009).
Often the schemes are not designed with due consideration to: the sustainability of the resource being tapped (say for instance, the water supply potential of the source during summer and during drought years, and source failure in the case of wells in hard rock areas); the actual life cycle cost of water supply as compared to that of alternatives (which considers the real life of the system, the various recurring costs involved and the costs associated with accessing the water); the community’s percep-tion towards quality of water from the source and acceptance of the technology; the environmental aspects (i.e., the impact of the source on the local environment and the impact of the external environment on quality of water from the source); and institu-tional capabilities required to manage the scheme. Inability to foresee the challenges involved in managing the water supply system including ensuring source sustainability and water quality protection results in selection of inappropriate institutional model for managing the scheme. Priority is given to schemes which involve low capital invest-ment and low level of maintenance.
Often design of village water supply infrastructure suffer from several deficiencies, including improper design of the well, poor siting of the overhead tanks, wrong selec-tion of pump capacity, poor pipe design resulting in high pressure losses, and poor layout of the distribution system that does not consider the geographic distribution of population. The operation and maintenance (O & M) of the schemes is also found lacking on many fronts due to lack of adequate technical knowledge, and human and financial resource at the local level (CTARA, 2017).
The restructured National Rural Drinking Water Programme (NRDWP), approved by the Central Cabinet in November 2017, will now only fund the Piped Water Supply Schemes (PWSS) and has kept aside 25% of the total NRDWP allocation for the sustainability (functionality) component of the scheme for ensuring enhanced perfor-mance of the water supply scheme. The functionality is to be ascertained through 3rd party evaluation of the completed PWSS. Nevertheless, the criteria for assessment of performance of water supply schemes and the overall water supply sector is not comprehensive enough to assess their real contribution to achieving the larger devel-opmental goals of socio-economic advancement. The monitoring of the schemes considers only the number of hamlets being covered, the number of households having access to water supply and the types of access, and not the actual per capita water supply to individual households, the quality of the water supplied and frequency
Improving the Performance of Rural Water Supply and Sanitation Sector in Maharashtra3

and reliability of water supply that are essential for achieving public health outcomes. The latter would require continuous monitoring of the source (for various water quality parameters) and the scheme and feedback from the officials of the agency concerned for ensuring water safety and security. Given this scenario, there is a growing need to take a relook at the approaches for planning, design, operation and management and performance assessment of rural water supply schemes.
There are many international concepts and practices in the water supply sector covering such aspects as planning, design, operation and maintenance, water supply surveil-lance and performance assessment. Given the fact that the constraints faced today by the rural water supply sector are great (because of the growing competition for water from other sectors mainly agriculture), water quality standards for drinking water are stringer, and the government investments and expected public health outcomes from water supply bigger, it is necessary that we follow some of these concepts and practices in planning, design, operation & maintenance and M & E of scheme so to achieve physical, social, economic, institutional and environmental viability. Therefore, we need to build on the available manuals for planning and design of water supply schemes. This will contribute towards the larger effort of building institutional capaci-ties in rural water supply sector.
One of the key strategic interventions for reforming rural water supply sector is to have third party evaluation of water supply schemes which would help enhance the accountability of the water supply agencies towards bringing about all round improve-ment in the management drinking water supply schemes--the process of planning, design, operation and maintenance, and water safety and security measures.
The Water Supply and Sanitation Department (WSSD) is the primary agency concerned with rural water supply in Maharashtra. After initiating several reform measures, the department is now experimenting with new institutional arrangements aimed at strengthening its arms for improving the sector performance, under an initiative called Unnat Maharashtra Abhiyan (UMA). UMA is a project of the Higher and Technical Education Department, whose mandate is to build an independent and public knowl-edge infrastructure for the state of Maharashtra to bring about socio-economic and cultural development of its people, especially those in the bottom of the socio-eco-nomic strata. UMA aligns closely with Unnat Bharat Abhiyan (UBA) of the Ministry of Human Resource Development, Government of India, whose vision is to bring about "transformational change in rural development processes by leveraging knowledge institutions to help build the architecture of an Inclusive India. The rationale, objectives and structure of the UMA framework is detailed out in Annexure-I.
Within the overall framework of UMA, the Water Supply and Sanitation Department of the Government of Maharashtra (GoM) has already passed orders through the Govern-ment Resolution (GR) dated 9th July 2014, regarding technical approval, administrative approval, implementation, third party technical inspection, and maintenance repair for rural water supply schemes (RWSS) in the state. Under the same GR, third party technical inspection of RWSS has been made compulsory. Subsequently, detailed guidelines for third party technical inspection of RWSS has been prepared and passed vide the GR dated 15th June 2015. As per this latest GR, the Chief Executive Officer of Zilla Parishad (ZP) has been made responsible for third party technical test of all Rural Water Supply Schemes in the district. The Zilla Parishad has been given a mandate to seek services from the government engineering (Degree/Diploma) colleges, govern-
Improving the Performance of Rural Water Supply and Sanitation Sector in Maharashtra4

ment ITIs, the quality and monitoring team of Maharashtra Jeevan Pradhikaran (MJP), and other government organisations related to water supply for independent assess-ment of the implementation of the new RWSS in the state and also review performance of the existing schemes (GoM, 2015). The WSSD has begun to engage teachers and students of government engineering colleges to help in monitoring and evaluation of rural water supply schemes in collaboration with IIT-Mumbai. This programme would ultimately help improve the transparency and accountability in the system and result in improved sector performance.
2. Project Description
A short-term project was planned in the state of Maharashtra to build the capacities of Engineering College teachers and students in planning, design, and monitoring and evaluation of rural water supply schemes, which is aimed at strengthening the institu-tional capabilities of WSSD for enhanced performance of rural water supply schemes (as envisaged in WSSD GR dated 15th June 2015), through a structured training programme. The project was undertaken jointly by the Institute for Resource Analysis and Policy (IRAP)-Hyderabad and Centre for Technology Alternatives for Rural Areas (CTARA) of Indian Institute of Technology-Mumbai, with financial support and techni-cal collaboration from UNICEF-Mumbai. This is well aligned with UMA, an initiative of Government of Maharashtra Higher and Technical Education Department, which CTARA team is already engaged in and therefore will help achieving the goal of UMA.
3. Objectives of the Project
01. Develop a training manual on planning, design, operation, and monitoring & evalu-ation of rural water supply schemes, appropriate rural sanitation and waste water management technologies which seek to apply international concepts and practic-es in the rural water supply sector, with particular reference to objectives and criteria for planning, design and performance assessment of rural water supply schemes that ensure sustainability.
02. Undertake training of Engineering College teachers from Maharashtra in order for them to use advanced concepts and practices to plan, design, and carry out monitoring and evaluation of rural water supply and sanitation schemes, using the contents of the module so developed.
03. Facilitate the trainees to apply the learning from the training for performance assessment (evaluation) of two existing water supply schemes; and identify concrete interventions for improvement.
04. Document: a] the learnings and experience from the training (the training outputs); and, b] the actual application of the knowledge from training in the field (training outcomes).
4 Approach
A draft training manual with specific modules covering such aspects as water supply planning, selection of technology model for rural systems, design of village water supply infrastructure, O & M of water supply systems including tariff setting, monitor-
Improving the Performance of Rural Water Supply and Sanitation Sector in Maharashtra5

ing and evaluation and wastewater treatment system design was developed based on identification of the gaps in the existing water supply manuals and by employing advanced concepts and practices pertaining to objectives and criteria for planning, and management of rural water supply schemes for ensuring sustainability of the system, and optimum public health outcomes.
For this extensive review of published international literature on various aspects of water supply (planning, design, operation & maintenance and monitoring & evaluation) and various legislations existing in developed countries pertaining to drinking water supply management and water resource protection and the available design manuals in India was undertaken.
The modules so developed were used for training a group of 60 trainees (including faculty and students) identified during a three-day training programme (September 24-26, 2017) organised at RIT, Sangli (refer to Annexure 2 to 4 for details). At the end of the training programme, 15 groups were formed. Each group was asked to carry out evaluation of two water supply schemes in Maharashtra with scientific and technical inputs from the project team consisting of researchers from CTARA and IRAP.
Each group made field visits and undertook monitoring and performance evaluation of two water supply schemes. Data was collected on parameters concerning physical, financial, economic, environmental, managerial and institutional performance of the water supply systems under supervision from the project team. These data were analysed using the analytical framework provided by the project team. The outputs of the analysis were presented in the second round of the training (15-16 Jan, 2018) and feedback was provided to the trainees on the areas of improvement. The final outcomes from the exercise were used to refine the different modules of the training.
The training compendium was finalized with the rural water supply system case studies and feedback from the trainees on the performance evaluation exercise, particularly with regard to the practical issues involved in monitoring.
5 Data and Resources Utilised
01. Published international literature on various aspects of planning, design, execution and management of rural water supply schemes, water supply surveillance, and protection of drinking water sources, with particular reference to the objectives, criteria and norms used was collected, compiled and synthesized.
02. Legislations pertaining to drinking water supply management and water resource protection in developed countries.
03. Primary data collected by the trainees on the performance of rural water supply schemes covering the technical performance, social aspects of water use (especially equity), infrastructure costs, cost of operation and maintenance, the staff requirement for operation and management, water quality monitoring.
04. The various manuals, rules and guidelines available with the state government and central government (from Ministry of Drinking Water Supply and Sanitation) for planning, design and operation of rural water supply schemes.
Improving the Performance of Rural Water Supply and Sanitation Sector in Maharashtra6

05. The models developed by CTARA for analysing water supply networks, and the performance evaluation surveys undertaken by them in Maharashtra villages.
06. The various studies undertaken by UNICEF-Mumbai, in collaboration with IRAP, particularly the one on institutional and policy aspects of sustainable rural water supply in Maharashtra; and the other on designing of multiple use water systems for rural areas for reducing the vulnerability of poor communities to problems associated with lack of water for domestic and productive needs, were used.
07. Structure of the Training Compendium
The first section of the training compendium provides an introduction to this capacity building imitative undertaken by Institute for Resource Analysis and Policy, Hyderabad and CTARA, IIT Bombay with financial support from UNICEF, Mumbai.
Sections 2-8 provide detailed modules which were developed and used during the training workshops. These modules include: planning rural water supply; choosing the appropriate technology for a water supply scheme; monitoring and evaluation of rural water supply schemes; design perspectives for village water supply schemes (infra-structure focus); management of rural water supply systems; institutional environment and institutional structures for rural water supply; and environmental sanitation and wastewater treatment.
Section 10 lists out the learnings and outcomes of the rural water schemes perfor-mance assessment and monitoring exercise undertaken by the trainees. An Annexure on the UMA framework is also provided.
Considering that the third party evaluation of the completed piped water supply schemes has been made mandatory under the restructured NRDWP, this compendi-um will provide a useful reference to the prospective third party evaluators (engineer-ing colleges, others) and State Water Supply Departments in understanding the criteria and methods for comprehensive performance assessment of the schemes and also help them in suggesting or taking necessary corrective actions for improving the scheme performance.
Improving the Performance of Rural Water Supply and Sanitation Sector in Maharashtra7

Improving the Performance of Rural Water Supply and Sanitation Sector in Maharashtra8

Improving the Performance of Rural Water Supply and Sanitation Sector in Maharashtra9
Training Modules

Planning Rural Water Supply from a Regional Perspective
Module 1
1.1 Introduction
Provisioning of potable water for domestic consumption as a public service started in India way back in the 1970s. This was contemplated by the governments in lieu of the widespread public health hazards such as cholera and diarrhoeal diseases occur-ring in rural areas due to consumption of contaminated water from common sources. The focus was on ensuring that the water supplied is free from physical, chemical/biochemical and bacteriological contamination. The general norm adopted for water supply vis-à-vis the quantity of water supplied was 40 litres per capita per day and this was considered sufficient for rural communities who did not have access to common sewerage systems and toilets, to meet the high priority uses such as drinking and cooking and washing clothes. This norm was further compromised by the state water supply agencies for drought-prone regions because in their opinion it was difficult to manage water for fulfilling a high per capita supply norm. The underlying assumption in all these cases was that the unmet water needs of the rural communities, especial-ly for low value uses (cleaning utensils, personal hygiene, watering of livestock, etc) could be managed from informal sources in the villages. Given the presence of tradi-tional water sources such as open wells, ponds and tanks in the villages, this assump-tion was largely valid.
The role that interventions to improve water availability at the household level plays in improving public health against those to improve the quality of water (Esrey et al., 1985)2 had been least recognized for quite a long time.
However, changing socio-economic conditions of India’s rural landscape and the rapidly changing water ecology demanded revisiting of some of the assumptions underlying the norms relating to water supply in villages. On the socio-economic front, the water demand for domestic purpose has increased remarkably owing to rising income levels, improvement in lifestyles and changing occupational patterns. Today, very few people depend on common water bodies such as ponds and tanks for bathing and washing clothes even in regions where such sources are in good condition. Some of the water uses, which were instream in nature, have now become consumptive uses with the result that there is little scope for reuse of the water which is used for bathing and washing. With rising per capita income, the water requirement for washing clothes and personal hygiene (sanitation) had increased as communities adopt improved technologies. With increasing number of people, especially in water scarce regions opting for intensive dairy farming, the demand for water for watering animals has increased. Fetching water for livestock is as big a priority for dairy farmers as finding water for meeting other domestic purposes. The above-mentioned changes had changed the per capita water demand for domestic uses in the rural areas. Over and above these, there is growing recognition that in the hot and arid regions, the per capita water requirements for domestic uses like animal watering and bathing are even higher than that in cold and humid regions and more water needs to be supplied for domestic uses.
1 A synthesis of several field studies showed that the impact of interventions in improving water availability at the household level in terms of reduction in diarrheal diseases was 25 per cent against 16 per cent for improvement in water quality. The combined effect of interventions on both availability and quality was 37 per cent reduction in diarrheal diseases (Esreyet al., 1985).
Improving the Performance of Rural Water Supply and Sanitation Sector in Maharashtra10

Regarding water ecology, there is overall degradation of water resources in the country-side in most regions of India due to larger environmental changes (resulting from manifold increase in groundwater draft for irrigation and other uses, changing land use in the catchments and increased use of fertilizers and pesticides in irrigated agriculture) leading to groundwater depletion, reduced inflows into water bodies from their catchments and water pollution, respectively. Hence, the scope of using water from informal sources to cater to the unmet domestic demand is reducing over time, though households having own irrigation sources (such as wells and tube wells) might be able to meet a major portion of their domestic water demand from these sources. Therefore, while the per capita water demand is increasing over time, the proportion of this demand which is to be catered to through from formal sources is also increas-ing. This means that the old norms used for planning water supply schemes do not hold good in the current situation.
1.2 Current Norms for Planning Rural Water Supply Schemes in India
In 2009, Government of India (GoI) revamped the existing Accelerated Rural Water Supply Programme (ARWSP) and launched it as the National Rural Drinking Water Programme (NRDWP) with major emphasis on ensuring water availability in rural areas with respect to its portability, adequacy, affordability and equitable distribution on sustainable basis, while also adopting decentralised approach in planning, imple-mentation and Operation and Maintenance (O&M) of rural water supply schemes (GoI, 2013). NRDWP recommended following norms for providing drinking water to rural population: i] 40 litres per capita per day (lpcd) of safe drinking water for human beings (including for drinking, bathing, ablution and washing clothes and utensils); ii] 30 lpcd additional for cattle in the Desert Development Programme areas; iii] one hand-pump or stand post for every 250 persons; and, iv] water source to be made available within the habitation or within 1.6 km in the plains and within 100 m elevation in the hilly areas. Though ARWSP also had a water supply norm of 40 lpcd, major shift in NRDWP was to move from ‘habitation level’ to ‘household level’ drinking water supply coverage. The restructured NRDWP recommends a minimum of 40 lpcd to be provided in rural habitations through surface water or safe groundwater based piped water supply schemes. Thus, there are two important aspects of the restructured NRDWP: i] the states can modify the water supply norm to maintain a higher level of supply (depending on the water availability situation); and ii] the states are encouraged to select improved water supply sources for ensuring regular service delivery.
In line with the national rural drinking water supply programmes, Government of Maharashtra (GoM) through its Resolution dated 27 July 2000 established a water delivery norm of 40 lpcd for the rural areas in the state. From within this, 3 litre is to be provided for drinking purpose, 5 litre for cooking, 15 litre for bathing, 7 litre for washing utensils and house, and 10 litre for ablution. Villages or habitations with no source within 1.6 km in plain area and 100 m elevation in hilly area were selected on a priority basis to be covered under the State Rural Water Supply Programme (RWSP). Further, priority was given to the villages/habitations with large SC/ST population; those affected by quality problems (excess salinity, iron, fluoride, arsenic or other toxic elements or bacteriological contaminated sources); schools and Anganwadis; and habitations where the quantum of availability of safe water from any source is less than the adopted norm.
Improving the Performance of Rural Water Supply and Sanitation Sector in Maharashtra11

The 12th Five Year Plan and the 12th Finance Plan approach of Government of India suggested enhancement in per capita supply from 40 lpcd to 55 lpcd for rural areas. Though Govt. of Maharashtra has adopted 55 lpcd in planning of new water supply schemes based on surface water sources, groundwater based schemes are contin-ued to be planned keeping the water supply norm of 40 lpcd citing constrained ground water resources in increasing the per capita supply levels. Even in the schemes supply-ing 55 lpcd, major challenge is to identify and implement efficient models for O&M which can guarantee designed supply levels (TISS, 2015).
1.3 Inadequacies of the Current Norms
The current water supply norms are simply based on the principal of meeting basic minimum need of drinking water for the rural population (Gleick, 1996), and not based on the concept of water security for the community. The water need of the commu-nity for human and other household uses is a function of its socio-economic condi-tions, the culture, climate and the season. Some of the socio-economic factors that influence water requirements include the occupational profile of the family (whether employed or engaged in conventional farming or in livestock rearing/dairy farming or cottage industries or in wage labour and the scale of operations in the case of dairy farming and cottage industries), the average income levels. Culture heavily influences the water use practices of households. Climate (i.e., whether hot and arid or hot and humid or cold and humid) influence various households water needs such as water for drinking, water for bathing and washing and water for animals. Given the water requirements, the price of water also influences the demand for water or the amount of water for which the communities are willing to pay. Even the chemical quality of water can heavily influence the water requirements for some of the domestic needs including human and animal drinking. Historically, these factors were never considered in the planning of rural water supply schemes in India.
An action research study on developing multiple-use water system models in Maharashtra by GSDA, IRAP and UNICEF (2013) has shown that the poor rural house-holds, which are not dependent on agriculture and allied activities for their livelihood, have many productive water needs at the household level. Such households may need water for kitchen garden, homesteads, livestock keeping, or running small scale indus-tries. When water becomes scarce, these poor communities often compromise on their personal hygiene in an effort to find water for productive needs. Thus, there is a need to revise the conventional supply norm, taking into cognizance, various domestic and productive needs of the village community.
Even the Ministry of Drinking Water and Sanitation (MDWS), GoI strategic plan for the rural drinking water sector for the period 2011 to 2022 recognised the need for revising current rural water supply norms and stressed that by 2022, every person in the rural area should have access to 70 lpcd of water within their household premises or at a horizontal or vertical distance of not more than 50 metres from their household without any social barrier and financial discrimination. In fact, states were encouraged to adopt a higher per capita water supply norm of lpcd (GoI, 2013). However, apart from some pilot projects, even the 55 lpcd of water is not available at the household premises.
Improving the Performance of Rural Water Supply and Sanitation Sector in Maharashtra12

1.4 How Climatic Factors Influence Rural Household Water Needs?
Climate variability plays an important role in determining the annual renewable water availability in any region, river basin and its sub-basins. Increased precipitation or decreased evapotranspiration are likely to augment water supplies and reduce water demand by irrigated agriculture (National Academy of Sciences, 1999). High rainfall variability as experienced in semi-arid and hilly areas in India can result in reduced water availability, especially during summer months (GSDA, IRAP and UNICEF, 2013). Prolong spell of low rainfall in semi-arid areas can result in droughts. Water quality deterioration due to increased contamination levels also reduces the available supply of water for domestic uses (National Academy of Sciences, 1999).
Household water demand in areas experiencing cold climate will be lower than area with dry or humid climate. In developing countries, rural household water use (without flush toilets and any productive use) in humid climate varies from 10 to 40 lpcd and that in dry climate varies from 30 to 80 lpcd (Gleick, 1996). In dry climate, productive water needs such as for livestock and homestead will also be higher (Pallas, 1986). Even within a region, water demand during summers will be substantially higher than in monsoon or winter season (GSDA, IRAP and UNICEF, 2013). Thus planning for any new water supply scheme should take cognizance of climate variability in the region and its effect on water availability and household water demand.
Table 1.1: Access to piped water across the income distribution in rural India
(Source: Based on data presented in NSSO, 2014)
1.5 How Socio-economic Factors Influence Rural Household Water Needs?
1.5.1 Impact of income on domestic water needs
Household income certainly has an impact on domestic water needs in rural areas. It has been observed that with rise in income, rich households in rural areas tend to own more items of assets and gadgets including improved toilet and household appli-ances such as washing machines, heating rods etc. Hence, their demand for water will be higher. In order to have a reliable water supply, they also tend to go for piped water supply within their premises or develop their own sources of water such as dug well, bore/tube well or hand pump. It has been observed that with the rise in income, proportion of household having access to piped water connection (whether within the
Income quintiles (stratified byhousehold income per person)
Number of households surveyed % of households with piped water
Bottom 20th percentile 9604 12.3
20th-40th percentile 9835 14.4
40th-60th percentile 10286 16.2
60th-80th percentile 11199 18.9
Top 20th percentile 12469 20.4
Improving the Performance of Rural Water Supply and Sanitation Sector in Maharashtra13

premises or inside the dwelling) also goes up (Table 1.1). Better physical access to water in terms of distance between source and the dwelling can increase per capita domestic water consumption considerably (Howard and Bartram, 2003; WELL, 1998).
Developing own sources of water, on one hand reduce household dependence on public water supply which is irregular, on other hand it provides them with an option of accessing multiple water sources. However, household with low incomes or those below poverty lines mostly depend on off-plot public water supply sources or purchased water for meeting their water demand.
1.5.2 Impact of occupational profile on productive water needs
Poor and landless rural households in developing countries are mostly dependent on small homestead gardens and livestock raising as their major livelihood activity (GSDA, IRAP and UNICEF, 2013). Such household use water supplied for domestic uses to irrigate their homesteads which help them become food secure. Fan et al. (2013) estimated that in Wei river basin of China, vegetable gardening increased the annual income of the small farm families by approximately 30% through providing fresh vegetables and reducing the food budget. Also, vegetable gardening significant-ly affected water consumption as watering gardens accounted for almost 50% of the total domestic water consumption. Thus there can be strong negative economic impacts on poor rural households if water supply systems are not planned considering the productive water demands of rural households.
1.5.3 Impact of water price on domestic water consumption
It has been hypothesized that where water is purchased or billed (in case of piped water supply within household premises), the cost may be a limiting factor on the volumes of water used as the households may try to use it more sparingly or efficient-ly. Globally, the field studies reveal mixed findings. For instance, no significant reduc-tion was observed in quantity of water consumed by the households dependent on water purchase from the private vendors in united Sudan (Cairncross and Kinnear, 1992), whereas in East Africa, households with connections to piped water (which is billed) decreased water consumption by 50%, while those using off-plot water sources actually increased consumption by 60% and 80% respectively (Thompson et al., 2001). However, the authors noted that the increase in water consumption by the households with no or limited access to public water supply sources could be due to increase in household income allowing them to procure and use greater quantities of purchased water, whereas in the former case, the decrease in consumption could be due to increase in incidence of intermittent supplies.
Another reason can be that these households do not have alternative sources to bank on when the public water supply system is inaccessible or fails (GSDA, IRAP and UNICEF, 2013). This indicates that such households maintain their water use by paying higher amounts to private water vendors.
Studies on water usage undertaken in three urban areas in Uganda (Howard et al., 2002) showed limited evidence of a significant association between cost of water and
Improving the Performance of Rural Water Supply and Sanitation Sector in Maharashtra14

quantities of water collected. In one town, Soroti, quantities of water used from the sources were actually greater where payment was required. But the fact that these were water taps connected to compounds, improved access seems to have influenced consumption (Howard, 2002). According to Howard and Bartram (2003), here the major influence of the need to purchase water has been to depend on multiple water sources, and thus elasticity of water demand was seen primarily in source selection behaviour rather than reducing volumes due to price increase. This argument is mostly valid for well-off households. It has been observed in Maharashtra that households above poverty line were able to access 7-8 different sources of water (60% of these owned by them), whereas those below poverty line can access only 3-4 different sources of water which are mostly public and provide irregular water supply (GSDA, IRAP and UNICEF, 2013).
These evidences, however, do not suggest that water price does not influence water use behaviour. As further noted by Howard and Bartram (2003), the overall impact of the price of water on domestic water consumption, as evidenced by these studies, must have been confounded by other factors such as differential income of the house-holds, the access to water, and the quality of water supply, factors which can poten-tially impact on household water consumption. Hence water consumption in such households is better explained by economic factors, with wealth of the household being the most important factor, followed by the cost per litre of water (Thompson et al., 2001), physical access to water sources. Moreover, if the public water services are improved, rural households will be more than willing to pay for such services (World
Bank, 1993).
1.6 Per Capita Water Requirement for Drinking and Cooking
The human body requires a minimum intake of water in order to be able to sustain life and prevent dehydration. White et al. (1972) estimated that about 2.6 lpcd is lost through respiration, perspiration, urination and defecation from the body. This can be as high as 25 lpcd for the people working at high temperature under the sun. Approx-imately one-third of the lost body fluid is likely to be derived from food (Kleiner, 1999) and rest has to be fulfilled by consuming water.
For developing countries, White et al. (1972) and Gleick (1996) suggested that a minimum of 3 lpcd of water is required by adults for drinking purpose in most situa-tions. NRDWP also prescribes 3 lpcd for drinking water, irrespective of the climatic conditions (GoI, 2013).Table 2 provides the details on minimum volume of water required for hydration under different climates, activity levels and diet requirements. On average, daily water requirement for hydration comes out to be 2.6 litres per adult in temperate climate and 4.5 litres per adult in hot climate. It is expected that one-third of all this hydration fluid is derived from food and that domestic water supply need to only fulfil two-thirds of the minimum quantity identified. Additionally, it is to be ensured that the quality of supplied water meets the BIS standards to prevent any transmission of infectious diarrhoeal and other diseases.
In developing countries, most cultures have a staple foodstuff, which is usually some form of carbohydrate-rich vegetable or lentils and cereal (mainly rice). A minimum
Improving the Performance of Rural Water Supply and Sanitation Sector in Maharashtra15

Additionally, rural households have water requirement for preparing tea and other food items. However, defining minimum quantities of water for these is difficult as it depends on the nature of the food being prepared (Howard and Bartram, 2003). NRDWP suggests only 5 lpcd for cooking purpose (GoI, 2013). Nevertheless, in context of developing countries, Gleick (1996) suggested that an average of 10 lpcd will meet the household basic need for food preparation.
1.7 Per Capita Water for Other Human NeedsWater requirement for sanitation and bathing would qualify in other human needs. There is a direct link between provision of clean water, adequate sanitation services and improved health (Gleick, 1996). A substantial proportion of population in develop-ing countries lack access to clean water and sanitation facilities. As a result, every year there are several cases of water related diseases. As per one estimate, lack of access to safe drinking water and sanitation, combined with poor personal hygiene, causes massive health impacts, particularly through diarrhoeal diseases, costing lives of 2.18 million people annually three-quarters of whom are children younger than 5 years old (Pruss et al., 2002). Thus, access to water for sanitation is one of the most important components in reducing water related diseases and for improving household hygiene practices. Also, additional volumes of water will be required for maintaining food and personal hygiene through hand and food washing, bathing and laundry.
Based on the access to water supply source, per capita water used by households in developing countries for maintaining hygiene and meeting other domestic demands (excluding water requirement for productive uses) is estimated to vary from 5 lpcd to above 100 lpcd (Table 3). The no access households have a very low household water security as they have to collect water from distant sources and volumes collected barely exceed the minimum for hydration. Households travelling up to 1 km to access and collect water have basic household water security, provided that water is reason-ably continuous and quality can be assured at source and protected during subsequent handling. Households with piped water supply within their premise have effective
Table 1.2: Volume of water required for hydration
(Source: Based on data presented in Howard and Bartram, 2003)
quantity of water required for cooking staple food can be estimated using the calorie requirement in rural areas and amount of water required to prepare food to meet such requirement. Average minimum calorie requirement in India is 2400 cal/person/day in rural areas which is 600 g/person/day (both protein and carbohydrates contain 4 calories per gram). To prepare this much food, about 1.5 litres of water will be required.
Volume required (in lpcd)
Relaxed life style orTemperate climate
Tropical climates or manual Labour in high tempera-tures
Total needs duringpregnancy/ lactation
Female Adults 2.2 4.5 4.8-5.5
Male Adults 2.9 4.5 -
Children 1.0 4.50 -
Improving the Performance of Rural Water Supply and Sanitation Sector in Maharashtra16

1.8 Water for Livestock
Livestock keeping is an important activity in most of the rural households in India and other developing countries. It helps them meet their basic dairy requirements and also earn additional income through sale of dairy items such as milk and eggs. As seen in most of rural households, water supplied for domestic purpose is also used for feeding domestic animals. More the number of livestock holding per household, higher amount of water will be required in meeting livestock water demand.
Generally, any livestock will have three different types of water requirements: 1] for preparing its feed mix; 2] for drinking; and 3] service requirements, including for washing animal. The drinking water requirement of the livestock will depend on its breed, age, and weight, farming system, and climatic conditions of the region (Chapa-gain and Hoekstra, 2003). Table 4 presents drinking water requirement for animals under different farming systems. In landless livestock systems, animals are detached from the land base of feed supply and waste disposal. They depend on external supplies of feed, energy and other inputs. In grazing livestock systems, more than 90 per cent of dry matter fed to animals comes from rangelands, pastures, annual forages and purchased feeds (Sere et al., 1995). For rural households in India, both landless and grazing livestock production systems are more common.
Table 1.3: Water use by rural households (lpcd) in developing countries in relation to access to water supply
(Source: Based on Howard and Bartram, 2003)
Access to water Distance travelled and time spent measure
Likely quantities collected or used
Level of health concern
No access More than 1000m or 30 minutes of total collection time
Very low, often less than 5 lpcd
Very high as water quality and hygiene not assured and consumption needs may be at risk.
Basic access Between 100 and 1000m (5 to 30 minutes of total collection time)
Low, average is about 20 lpcd
Medium, not all requirements are met. Also, water quality is difficult to assure.
Intermediate access Piped water supply within premises
Medium, likely to be around 50 lpcd
Low as most basic hygiene and consumption needs met.
Optimal access Piped water supply within dwelling
About 100 lpcd or more, provided water supply is regular
Very low as all uses can be met and water quality is assured.
household water security as sufficient water is available to meet domestic needs and provided that water quality is assured. Households having piped water supply in their dwelling has optimal household water security with quantity, quality and continuity all likely to be adequate for meeting all hygiene and other domestic water needs (Howard and Bartram, 2003). Considering the average water requirements for drinking and cooking, average daily water requirement for maintaining hygiene in case of house-holds having intermediate access is 37.5 lpcd and for those having optimal access is 85.5 lpcd. At least an intermediate access to water supply is a necessity in areas with hot climate.
Improving the Performance of Rural Water Supply and Sanitation Sector in Maharashtra17

1.9 Water for Kitchen Garden
It is increasingly being recognised that productive uses of water have particular value for low-income households and communities and have health and well-being benefits (Thompson et al., 2001; IRAP, GSDA and UNICEF, 2013). Direct health benefits are derived from improved nutrition and food security from kitchen garden that has been watered. Indirect health benefits arise from improvements in household wealth from productive activity.
In a field research study undertaken in Maharashtra, it emerged that households having homestead or vegetable gardens use on average about 22 to 75 litres of water for irrigation depending on the size of the homestead and the climatic conditions (GSAD, IRAP and UNICEF, 2013). This water is supplied from multiple sources of domestic water supply. Therefore, it is essential that the productive water needs of the households should be identified before planning a domestic water supply system for any region.
The water requirement for kitchen garden depends on the climate of the region under consideration, the area of the plot being considered and the season during which
Table 1.4: Drinking water requirement for animals in different livestock production systems
(Source: Based on data presented in Chapagain and Hoekstra, 2003)
Livestock type Age group Drinking water requirement (litre/animal/day)
Landless system Grazing system
Dairy cattle Calves (0-1 years) 5-23 4-18
Heifers (1-3 years) 26-70 18-30
Milking cows (3-10 years) 70 40
Sheep Lamb 0.38 0.30
Adult 7.6 6.0
Goats Kid 0.38 0.30
Adult 3.8 3.5
Broiler Chicken Chick 0.02 0.02
Adult 0.18 0.18
Laying hens Chick 0.02 0.02
Laying eggs 0.30 0.30
If climatic conditions of the regions are considered, drinking water requirement of the livestock will depend on the voluntary intake of water which is the quantity of water that actually needs to be supplied to animals and corresponds to that part of the water requirement which cannot be provided by the moisture content of the forage. Table 5 presents the voluntary water requirement of the animals under different climatic conditions.
The above parameters, i.e. livestock water requirement under different farming systems and climatic conditions, need to be considered while planning a water supply system which can meet livestock water drinking water demand.
Improving the Performance of Rural Water Supply and Sanitation Sector in Maharashtra18

In both hot and humid and cold and humid, high rainfall areas (like in the north east, Kerala and Konkan region of Maharashtra), vegetable gardens are generally raised by the communities throughout the year, whereas in the hot and arid regions, they are preferred by the communities only during the rainy season and winter season, due to the fear of damage to the plants due to heat stress and water shortage increasing production risk. Cultural factors also seem to influence the decision to go for kitchen gardens or backyard vegetable cultivation. In tribal villages (of Maharashtra, Kerala, Karnataka and Odisha and the North east), kitchen gardens are a common feature.
But, a proper plan for reuse of wastewater from kitchens can help effectively reduce the water demand for kitchen gardens. In many situations, the grey water from kitchens and bathrooms is diverted to homesteads having vegetables and tree crops and separate arrangements are not made for watering then.
Table 1.5: Voluntary water intake of livestock under different climatic conditions
Animal type
Average live weight (kg)
Total Livestock Units (TLU)
Average daily dry matter intake (kg)
Daily voluntary water intake (litres/animal)
Wet, air temperature 27oC
Dry cold, air temperature from 15-21oC
Dry hot, air temperature 27oC
Buffalo 400 1.60 7 22.8 43.0 62.0
Cattle 180 0.7 5 10 19 27
Sheep 25 0.10 1 2 4 5
Goat 25 0.10 1 2 4 5
(Source: based on estimates of livestock water demand in litre per Total Livestock Unit for different types of livestock provided by Pallas, 1986)
kitchen gardening is practiced. The water requirement will be generally lowest during the winter season when reference evapo-transpiration (ETo) is lowest and highest during summer months, when the reference evapo-transpiration becomes the highest. If the reference evapo-transpiration is nearly 3mm per day during the winter season, a fully matured vegetable garden (say tomatoes, brinjal or chilly or carrot or cauliflower) raised during that season for an area of 50 sq. m will require nearly 150 litres of water per day for a family. For the same area of a plot, the water requirement can increase to 500 litres during summer months, when the average daily ET0 touches 10mm.
Improving the Performance of Rural Water Supply and Sanitation Sector in Maharashtra19

1.10 Summary
This module has discussed the water supply norm being followed in India and the State of Maharashtra and highlighted its inadequacy in meeting the domestic and productive water needs of the rural households. Based on the review of international literature, the module has also identified quantum of drinking, cooking, sanitation, bathing, washing, livestock and homestead water requirement and the influence of climatic, social and economic factors on the household water demand. Based on the estimates presented in this module, the household water demand under different climates, activity levels and diet requirements is presented in Table 6. Planning and design of rural water schemes should identify all the domestic and productive water needs of the rural households for different climatic and socio-economic settings in order to deliver water on sustainable basis.
Table 1.6: Household domestic and productive water needs as estimated for different climates, activity levels and diet requirements
Climate with intermediate access to water supply
Temperatures with intermediate access to water supply
Drinking (lpcd) 2.6 4.5
Cooking (lpcd) 10 10
Hygiene (including sanitation, bathing, washing) in lpcd
37.5 35.5
Cattle (in litres per animal per day)
19 27
Per Homestead 22 75
(for a 50sq. m plot) 150(winter) -500 (summer)
(Source: Based on authors analysis of international literature)
References � Cairncross, S., & Kinnear, J. (1992). Elasticity of demand for water in Khartoum, Sudan.
Social Science & Medicine, 34(2), 183-189.
� Chapagain, A. K., & Hoekstra, A. Y. (2003).Virtual water flows between nations in relation to trade in livestock and livestock products. Value of Water Research Report Series No. 13. Netherlands: UNESCO-IHE.
� Esrey, S. A., Feachem, R. G., & Hughes, J. M. (1985). Interventions for the control of diarrhoeal diseases among young children: improving water supplies and excreta disposal facilities. Bulletin of the World Health Organization, 63(4), 757-772.
� Fan, L., Liu, G., Wang, F., Geissen, V., &Ritsema, C. J. (2013). Factors affect-ing domestic water consumption in rural households upon access to improved water supply: Insights from the Wei River Basin, China. PloSOne, 8(8), 1-9.
� Gleick, P. H. (1996). Basic water requirements for human activi-ties: meeting basic needs. Water International, 21(2), 83-92.
� Government of India. (2013). National rural drinking water programme: movement towards ensuring people’s drinking water security in rural India, guidelines-2013. New Delhi: Ministry of Drinking Water and Sanitation, Government of India.
Improving the Performance of Rural Water Supply and Sanitation Sector in Maharashtra20

� GSDA, IRAP and UNICEF.(2013). Multiple-use water services to reduce poverty and vulnerability to climate variability and change. Hyder-abad, India: Institute for Resource Analysis and Policy.
� Howard, G. (2002). Effective approaches to water supply surveillance in urban areas of developing countries.PhD Thesis. Guildford, Surrey: Surrey University
� Howard, G., &Bartram, J.(2003).Domestic water quantity, service level and health. Geneva, Switzerland: World Health Organization.
� Howard, G., Teuton, J., Luyima, P., &Odongo, R. (2002). Water usage patterns in low-income urban communities in Uganda: implications for surveillance. International Journal of Environmental Health Research, 12(1), 63-73.
� Kleiner, S. M. (1999). Water: an essential but overlooked nutrient. Journal of the American Dietetic Association, 99(2), 200-206.
� National Academy of Sciences.(1999). Water for the future: The West Bank and Gaza Strip, Israel, and Jordan. Washington, DC: The National Academies Press.
� National Sample Survey Office.(2014). Drinking water, sanitation, hygiene and housing Condition in India. NSS 69th Round (July-Dec 2012). New Delhi: National Sample Survey Office, Ministry of Statistics and Programme Implementation, Government of India.
� Pallas P. (1986).Water for animals. Rome, Italy: Land and Water Develop-ment Division, Food and Agriculture Organization of the United Nations.
� Prüss, A., Kay, D., Fewtrell, L., & Bartram, J. (2002).Estimating the burden of disease from water, sanitation, and hygiene at a global level. Environmental Health Perspectives, 110(5), 537-542.
� Seré, C., Steinfeld, H., &Groenewold, J. (1995).World livestock produc-tion systems: current status, issues and trends. FAO Animal Production and Health Paper No. 127. Rome: Food and Agriculture Organization.
� Tata Institute of Social Sciences. (2015). Status of rural water supply in Maharash-tra: A third party evaluation commissioned by Ministry of Drinking Water and Sanitation, Government of India. Maharashtra: Tata Institute of Social Sciences.
� Thompson, J., Porras, I.T., Tumwine, J. K., Mujwahuzi, M.R., Katui-Katua, M., Johnstone, N., &Wood, L.(2001).Drawers of water II: 30 years of change in domestic water use and environmental health in East Africa. London, UK: IIED.
� WELL (Water and Environmental Health at London and Loughborough). (1998). Guidance manual on water supply and sanitation programmes. Loughborough, UK: WEDC, Loughborough University.
� White, G. F., Bradley, D. J., & White, A. U. (1972).Drawers of water. Domestic water use in East Africa. London, UK: University of Chicago Press.
� World Bank. (1993). The demand for water in rural areas: determinants and policy implications. The World Bank Research Observer, 8(1), 47-70.
Improving the Performance of Rural Water Supply and Sanitation Sector in Maharashtra21

Choosing the Appropriate Technology for a Water Supply Scheme
Module 2
2.1 Introduction
The guidelines for the National Rural Drinking Water Programme, 2013, say that a Detailed Project Report (DPR) of water supply schemes/projects is to be prepared in the Model DPR format by the State Rural Water Supply Department with the help of the State Technical Agency (STA) which also scrutinizes and vets them. For this the Rural Water Supply Department is expected to hold consultations with the local community at the Gram Panchayat level to ensure community participation in deciding the service level and also to ensure that the choice of technology/system is appro-priate and easy to operate and maintain. In preparing the DPR for new water supply schemes and augmentation of existing schemes, Ground Water Prospects maps are to be used for siting locations of production wells/ bore wells. The State Level Scheme Sanctioning Committee (SLSSC) shall ensure this while according approval to schemes.
The key issues facing the rural water sector are:
01. Deteriorating source sustainability resulting from over-extraction of groundwater in large parts due to excessive withdrawal for irrigation
02. Water quality problems including arsenic and fluoride contamination, and bacteri-ological pollution of water due to lack of sanitation which cause diarrhoea and kills hundreds of children every day
03. Poor operation and maintenance of water supply schemes including neglect of replacement and expansion resulting in rapid deterioration in the quality of water services
As on April 1, 2014,out of the 16, 96,664 rural habitations in the country 12, 49,695 (73.6%) habitations were fully covered (based on the norm of 40 lpcd), 3, 68,463 (21.17%) were partially covered and 78,506 (4.6%) were quality affected. On an average approximately 1.4 lac fully covered habitations per year have slipped back to partially covered/quality affected habitation status during the last seven years or so (MDWS, 2016) (It is another matter that the existing norms often do not correspond to what rural households desire and are willing to pay for). The ministry has identified over dependence of rural water supply schemes on ground water, indiscriminate extraction of ground water for irrigation, uncontrolled pollution of surface water, erratic pattern of rainfall, natural calamities and erratic/non-availability of power, etc. as the main reasons for slippage. Poor O& M is another main reason for the slippage. The ministry has said that slippage can be reduced significantly only when the entire rural drinking water system switches over to secured perennial surface water sources and urges states to gradually shift rural drinking water supply schemes to perennial, secured, surface
Improving the Performance of Rural Water Supply and Sanitation Sector in Maharashtra22

water sources so that the problem of slippages is brought down to a minimum, if not eliminated fully (MDWS, 2016). In view of these, the NRDWP has recently been restructured. The new guidelines clearly state that only those water supply sources which are sustainable and economically most feasible (considering the life cycle cost) should be selected. The first priority is accorded to surface water sources and the second to safe groundwater sources. For groundwater based schemes, certificate from the State Remote Sensing Application Center regarding aquifer sustainable yield and groundwater quality report from the district water quality testing laboratory will be required.
At present those habitations in which the average supply of drinking water is more than or equal to 40 lpcd are called “fully covered”. The vision of the Ministry for Drinking Water and Sanitation is that by 2022 every rural person in the country will have access to 70 litres per capita per day (lpcd) within their household premises or at a horizontal or vertical distance of not more than 50 meters from their household without barriers of social or financial discrimination and individual States can adopt higher quantity norms, such as 100 lpcd. Technical Note No.9 of WHO (2011) on the minimum water quantity needed for domestic uses gives a clear idea on how to arrive at the water needs of a community and how to manage the demands.
Therefore, the two most important factors to be considered in selecting the appropri-ate technology for a rural water supply scheme are source sustainability with respect to water quantity and quality and ease of operation and management.
The importance of integrating Operation and Maintenance (O&M) components in all development phases of water-supply and sanitation projects, including the planning, implementation, management, and monitoring phases cannot be underestimated. When the communities themselves are responsible for the management and O&M of their water-supply and sanitation systems, it is imperative that the technology adopted is simple enough so that it is within their capacity to operate and maintain (WHO & IRC, 2003).
Other factors to be considered in the selection of a water supply system are economic viability, social viability, institutional sustainability and environmental impacts. All these factors are important for the continued performance of the water supply scheme. It is also important that easy scaling up of the system should be possible as the demand for water increases due to increase in population, increase in economic activities, etc and increased expectations from the communities in the levels of service owing to economic development.
The level of service of a water supply scheme is the amount of water provided per capita and the convenience of obtaining it. The technology chosen should be such that it gives the community the highest level of service that it is willing to pay for, which will provide it with maximum benefit and has the institutional capacity to sustain. The sources of piped water supply for single or multi village schemes may be open wells, sanitary wells, bore wells, infiltration wells, infiltration galleries, rivers,reservoirs, and canals.
Improving the Performance of Rural Water Supply and Sanitation Sector in Maharashtra23

2.2.1 Hand pump based schemes
In areas that receive good rainfall and have high water table, simple lifting devices like a bucket and rope or simple hand pumps on shallow dug wells are a sustainable source of water for single households or small communities. A sanitary well is one that is properly located, well-constructed, and protected so as to avoid possible contami-nation and to ensure supply of safe water. Hand pumps are manually operated pumps and are widely used to supply water to communities or individual households (Picture 2.1). Hand pumps can be installed on boreholes or hand-dug wells. However, during summer months especially during drought years, the reliability of these cannot be assured. The advantage of hand pump based schemes over piped water schemes is that it does not require electric supply or the service of mechanics to repair pumps. There are many models of hand pumps chosen on the basis of their lift height or operating speed, which varies according to the depth and the pump type respectively. Suction pumps are used for low lift heights less than about 7 m while pressure pumps cater to higher lift heights (Arlosoroff et al., 1987).
Table 2.1: Features of different types of rural water supply technologies
Type of Technology Features
Hand Pump based scheme Installed on boreholes or hand-dug wells. No electricity needed
Well-based individual village schemes
Water from dug wells or tube wells are pumped using motorized pumps
Tube well based multi village schemes
Better technology options, reduction in cost due to economies of scale and the possibili-ties for better levels of service. Require more investment, better technical capabilities and coordination at Panchayat level
Reservoir and French well based schemes for multiple villages
These draw water from a natural or man-made aquifer within a river bed. Wells must be productive even during the dry season. It must be possible to locate pumps above maximum flood levels.
River lifting schemes for multiple villages
Variability in quantity and quality of water between seasons should be considered in the design. Highest per capita O&M cost among the different schemes considered.
Spring based schemes inhilly/mountainous areas
Generally free from chemical contamination and pathogens. Water usually flows under gravity with no need for pumping
RO schemes for individual village in salinity affected areas
Cost of setting up the RO plants, affordability for the local population and mode of disposal of the effluent water are factors that need to be considered while considering the RO scheme for individual villages
Combined Water Supply Systems (CWSS)
Depends on both surface water and ground water sources. Suitable when surface sources are not perennial and ground water sources alone are not sufficient to meet the demand.
2.2 Different Types of Water Supply Technologies for Rural Areas
Salient features of different types of water supply technologies used in rural areas are presented in Table 2.1. These technologies are also described in detail in the subse-quent sub-sections.
Improving the Performance of Rural Water Supply and Sanitation Sector in Maharashtra24

The disadvantages of hand pumps include the exertion required to pump the water and the need to maintain the pumps in good condition which will also need a supply of spare parts. Availability of spare parts is not so much an issue in India where there are many manufacturers of hand pumps. Quality of the water can affect the pump if the water is corrosive in nature. If sand and grit are pumped out along with the water, it can cause wear and tear of the pump too.
A high lift pump operates in the range of 0-45 m below the ground level. Though there are hand pumps available which can lift water 60m or more, the output of water will be less. Higher the lift higher will be the physical effort required to operate the pump. Thus hand pumps are suitable only when the water is available at a depth of about 40m or less. Hand pumps are also not suitable for very high water tables where they may need priming before water can be pumped (Baumann et al, 2005).
In general, sub-Himalayan area, north of river Ganges, northern parts of Uttar Pradesh, northern parts of Bihar, Odisha, Assam, Andhra Pradesh, coastal parts of Maharash-tra, Tripura and the eastern and western coastshave depth to water level of 2 to 10m below ground level (bgl). In West Bengal water level generally varies from 2 to 10 m bgl with deeper water levels of more than 20 m bgl in small pockets. In major parts of north-western states depth to water level generally ranges from 10-40 m bgl. Water level of more than 40 m bgl is also prevalent in the north western part of the country. In the western parts of the country deeper water level is recorded in the depth range of 20-40 mbgl and in places like some parts of Haryana, and Delhi and almost major parts of Rajasthan more than 40 m bglis recorded. In peninsular India the water level ranges from 2 to 20 m below ground level (CGWB, 2016).
Picture 2.1: A Hand pump
Improving the Performance of Rural Water Supply and Sanitation Sector in Maharashtra25

2.2.2 Well-based individual village schemes
Water from dug wells or tube wells are pumped using motorized pumps. A tube well is a water well in which a long 100–350 mm diameter stainless steel tube or pipe is bored into an underground aquifer. The depth of the wells depends on the depth of the water level in the Aquifer. If the water is of acceptable quality it may be used without treatment. Mini water supply systems which cater to habitations of less than 1000 people may consist of the source, a rising main and distributing cisterns. For popula-tions of above 1000, a water supply system with source, rising main, overhead water reservoir, and distribution system may be provided. The taps are provided at common points or individual households depending upon the service level envisaged.
2.2.3 Tube well based multi village schemes
The advantages that multi village schemes offer are better technology options, reduc-tion in cost due to economies of scale and the possibilities for better level of service. The sources being spread over a larger area, a greater level of source sustainabil-ity may be present. However, multi village schemes typically involve more invest-ment, better technical capabilities and require coordination and cooperation between larger and more diverse groups and hence may not be suitable for management at the Panchayat level.
Rock formations may be consolidated, semi-consolidated or unconsolidated. Alluvi-ums are unconsolidated formations usually occurring in alternate layers of sand and clay. The sand formations are natural conduits for water. Clay formations as also hard rock formations are impervious to water. Water can however be transmitted through weathered or fractured portions of the hard rocks. Sandstones and lime stones are semi consolidated formations.
Unconfined aquifers are formed by formations which are exposed and pervious at the top surface but impervious at the bottom at some depth while confined aquifers occur sandwiched between two impervious formations. Dug wells are suitable for hard rock regions where the top weathered and fractured formation serve as the aquifer contain-ing groundwater under shallow water table conditions. However, with increasing use by increasing populations, the dug wells soon become unsustainable. A dug cum bore well is suitable where a confined aquifer occurs within a reasonable depth below the water table aquifer which is already being tapped through a dug well. A vertical bore drilled at the bottom of the dug well can lead to water from the confined aquifer to flow under hydrostatic pressure into the existing dug well which can be pumped out for use (Hofkes, 1983).
Between 1950 and 2010, the number of tube wells drilled in India increased from 1 million to nearly 30 million (World Bank, 2016). Tube wells tap high yielding confined and unconfined aquifers where the water occurs at considerable depths. Tube well based multi village schemes are most suitable in alluvial regions which get replenished with rain water. The decision to go for a tube well based multi village scheme must be carefully planned; all over the world aquifers are getting depleted and water tables falling to alarming levels due to over exploitation. It must be ensured that there is sufficient replenishment of water and that the scheme does not become defunct within a short time.
Improving the Performance of Rural Water Supply and Sanitation Sector in Maharashtra26

Northern and central parts of north Gujarat is underlain by unconsolidated alluvial deposits and semi consolidated sediments. These sedimentary formations form the most prolific multiaquifer system comprising several confined aquifers extending from the foothills of the Aravallis in the northeast to the little Rann of Kachchh in the west. These consist of shallow aquifers ranging in depth from 7m below ground level(bgl) with an aerial extent up to Bharuch district and deep aquifers ranging in depth from 15m bgl extended up to Anand district ( Ministry of Water Resources, 2011).
The Santalpur regional water supply scheme was undertaken with support from the Dutch government. The first phase of the Water Supply Scheme was designed to provide drinking water to 72 villages in the Santalpur, Radhanpur and Kankrej talukas in the Banaskantha district with a population of 90,000 in 1993.The second phase was designed to provide water to 48 additional villages with an expected population of about 1,24,000 in the year2008. The design demand was 55 litres per capita per day (lpcd)for the maximum day, which comprises of: 30 lpcd for human consumption, 15 lpcd for cattle and a provision of 10 lpcd (22%)for leakage and wastage with an hourly peak factor of 1.2 considered for the distribution system (Haskoning, 1990).
The distribution system consisted of ground level as well as elevated reservoirs, pipelines, village level cisterns, stand posts with four or more taps and cattle troughs (Figure 2.1). The total storage capacity of the first phase programme was 22, 55,000 litres which was about one third of the design demand of 6.6 MLD that was estimated for 2008.
Ghorawada
Kalyanpura
Radhanpur
Tube well
Underground sump at Shihori
ESR at Varahi GLR at Ghorawada
References
Shihori
Banas
Rive
r
Banas River
(Source: Haskoning, 1990)
Figure 2.1: Schematic lay out of distribution network of Santalpur regional water supply scheme
Improving the Performance of Rural Water Supply and Sanitation Sector in Maharashtra27

A study conducted by SEWA in 1988 found that people were rarely getting water from the system as the valves were being kept open more than the intended four hours, illegal tapping of water and non-functioning of pani panchayats. At the same time people had become dependent on the system and given up on traditional methods of water harvesting and use. Since then women who are mainly responsible for collect-ing water for the family have got more involved in activates related to water supply in Gujarat (Ahmed, 2005).
Durku is a habitation of 1617 people from 333 households in village Durku, Kuldiha Panchayat of Block Potka, 35 km from Jamshedpur in Jharkhand. The Durku Rural Water Supply Scheme (2010-11) is a tube well and electric power pump based scheme with a budget of Rs 15.5 Lac executed under the Swajaldhara programme by the Jamshedpur drinking water and sanitation department in 2012-13. It comprises of two water tanks of about 13,000 litres capacity each, with a tap connection outside every third house. It is reported in May 2017 that the project is a success, the main reason for it continuing to function well-being that money is collected for the maintenance of the water supply system, and regular maintenance is undertaken with the accounts open to public scrutiny. According to the village mukhiya Lakhi Charan Singh, each household in the agrarian revenue village comprising two tolas (hamlets) Durku and Bondih contributes Rs. 30 every month or Re 1 per day, whichever is more conve-nient, to an eight-member village drinking water committee. The inhabitants also make sure that no water is wasted and do not use the water for bathing or washing clothes for which they go to village ponds or the Subarnarekha river. As a result piped water is available to the residents 24/7 (The Telegraph, 2017).
Multi village tube well schemes can be successful in alluvial regions with potential for recharge from rains. The alluvial plains of north India are areas where tube wells can be successfully used for domestic water supply schemes.
2.2.4 Reservoir and french well based schemes for multiple villages
French wells draw water from a natural or man-made aquifer within a riverbed (Figure 2.2). These can be dug wells or driven wells. In the case of driven wells, short small diameter slotted or perforated pipes are inserted into unconsolidated sediments using water pressure or physical force. Water from reservoirs can also be the source for water supply schemes that would supply water to villages all the year round. Water may be pumped from the well or a reservoir to be supplied to multiple villages in the area. Being a multi village scheme it would require overhead water tanks and distribu-tion systems.
The physical condition ideal for the use of reservoirs or French wells is that even during the dry season there is availability of water in the reservoir or enough base flow in the rivers so that the wells are productive. For French wells, there should be areas on the river bed that are dry for part of the year so that construction of wells can take place. The pump location should be such that they are above the maximum flood levels; suction pumps can pump water up to a height of 7m.Siting of the wells within 30m of the pump location is ideal. Availability of such a location is needed for the operation of a French well based system.
Improving the Performance of Rural Water Supply and Sanitation Sector in Maharashtra28

2.2.5 River lifting schemes for multiple villages
This involves lifting of water directly from the river for supplying water to households after primary treatment (Picture 2.2). While the quantity of water supplied through such schemes have been found to be meeting the criteria set by the government, the highest average operating and maintenance cost per household for those covered by formal water supply is for the regional schemes based on river lifting, followed by single-village schemes based on river lifting. Electricity cost is also high for the river lifting schemes.
One problem with river lifting schemes is that the flow in the river shows great fluctu-ation between seasons. While the water available during the rainy season will be high the flow during summer may not be sufficient to provide the designed quantity of water to all the households in the scheme. In fact in case of rivers that can go dry in summer, the river lifting scheme is not feasible. Variability in rainfall between years including the incidence of drought reduces the dependability of such schemes. Another problem is the difference in the quality of water between seasons; during rains the river water will carry debris and the water will be muddy requiring more treat-ment. The high operation and maintenance cost of river lift schemes is another disad-vantage. The electricity charges as a percentage of total O&M costs are highest for this scheme due to the many stages of pumping needed to take water to higher levels (Bassi et al, 2016). In rural areas which do not have uninterrupted supply of electricity, the operation of the scheme itself can be a problem.
Figure 2.2: Infiltration well or French well
(Source: www.thewatertreatments.com)
Pump
Bentonite Seal
Saturated Zone
Gravel Pack
Soil AirUnsaturated Zone
GCW Standard Circulation
Compact Stripper
Ground Water Level
Packer
Improving the Performance of Rural Water Supply and Sanitation Sector in Maharashtra29

2.2.6 Spring based schemes in the hilly/mountainous areas
In hilly or mountainous areas, water from springs can be directly supplied to consum-ers through piped mains. The spring water is generally free from chemical contamina-tion and pathogens. However the springs have to be protected at the point where it emerges from the earth’s surface.
Impermeable Strata
Water Bearing Strata
Diverted Stream
Stone Packing
Removable Cover
Over Flow
WL
Sto
rage
Ta
nk
Slo
w
San
dFi
lter
Rev
erse
R
apid
Filte
r
DistributionOutlet
Collection Box
Overflow Outlet
Wire Mesh
To Filter System
FromSource
Outlet Outlet
Foundation
Outlet
Picture 2.2: River intake structure
(Source: www.theconstuctor.org)
Figure 2.3: Spring based water supply
(Source: www.indiawaterportal.org)
Spring Water Collection Box Filter Tank
Improving the Performance of Rural Water Supply and Sanitation Sector in Maharashtra30

In spring based schemes the water usually flows under gravity with no need for pumping (Figure 2.3). Varoshi in Maharashtra is an example where the water supply scheme is based on natural springs. Water from the springs is collected in intermedi-ate surface storage systems through long-distance steel pipes and then distributed to various smaller tanks located at different locations in different hamlets of the village.
Visakha Jilla Nava Nirmana Samithi (VJNNS) is a NGO operating in the Eastern Ghats of Visakhapatnam District. Among the welfare activities undertaken by VJNNS is making potable drinking water available to remote tribal villages. Gravity springs are a reliable and only source of drinking water for many of the villages in the area. Gravity Water Flow Systems have been used to supply water to these villages at low cost (Arghyam, 2011. However, it has to be noted that this system is suitable only when the population to be served and hence the water demand is low. Many villages in Meghalaya and Uttarakhand and in the Eastern and Western Ghats depend on springs for their water needs. Springs form the basis of rural water supply in the entire Andaman & Nicobar barring a few islands (Mukherjee, 2017).
2.2.7 RO schemes for individual village in salinity affected areas
While ground water is free from pathogens, it can be affected by salinity or the presence of fluorides, nitrates and arsenic in amounts higher than permissible in drinking water, leading to health hazards. In such places reverse osmosis (RO) based schemes for individual villages can be the solution. The cost of setting up the RO plants, affordability for the local population and mode of disposal of the effluent water are factors that need to be considered while considering the RO scheme for individual villages (Table 2.2).
The government of Andhra Pradesh took a policy decision to implement “NTR Sujala Pathakam”, where in 20 litres of safe drinking water in a can will be supplied to each household for Rs.2.00 (GoAP, 2014). Rs 100 crore have been allotted for this project in the state budget for the year 2017-18. The technical experts committee constitut-ed by the government recommended the RO (Reverse Osmosis) Technology, EDF (Electrolytic Defluorination) Technology, Terafil Technology or Ultra Filtration Technol-ogy based on water quality parameters with disinfection being a part of the treatment whatever the technology chosen, and that the water supplied should meet IS- 10500-2012 specifications. However while the committee had suggested RO technology only for areas where drinking water source is brackish or has high impurities, the tenders floated were for RO plants only which is a matter of concern.
According to the cost analysis for a 1000 Litres per hour RO plant, the capital cost of the plant is Rs 3.2 Lac and the total monthly O & M cost is Rs 14,400. Assuming production of 8000 lit/ day for 30 days in a month to be sold at Rs. 2.00 per 20 Litres, the net monthly income from the plant will be Rs 9600.The number of years required to break even the capital and interest is calculated to be 5 years. However, assuming leasing of the plant by a local person and considering his efforts to undertake the project, administration costs&profit, the lease period is fixed as 10 years.
The challenges in implementing such projects is clear from the revised guidelines issued by the government for the setting up of the water treatment plants (Govern-
Improving the Performance of Rural Water Supply and Sanitation Sector in Maharashtra31

ment of Andhra Pradesh, 2016) as it came to its notice that many of these Water Plants are unable to meet the primary objective of providing safe drinking water for a variety of reasons, and that the time, energy and money meant for setting up the water treatment plants have been underutilized or mis-utilized (sic). Also, a majority of the treatment plants were using significant public resources like source water, subsidized power and government land and labelling themselves as public service providers. The government has noted that this defeats the core purpose of setting up Water Plants as a service to provide safe drinking water to the public (Govt of Andhra Pradesh, 2014).
In rural Gujarat, RO treatment plants with capacity ranging from 10 litres per hour (lph) to 6000 lph supply drinking water in several hundred villages of the state (Picture 2.3). Large sized plants with capacity more than 100 lph are owned by individuals, business enterprises or the community. Some of these plants have been donated by Non Resident Indians to their hometowns (Krishnan et al, 2010). RO plants of capac-ities 1000 lph and 800 lph were commissioned under the Tata-GE Special Drinking Water Supply and Sanitation project in the villages of Loyaj and Miyani in 2010. The community bore 10 per cent of the total cost of construction which was Rs 2 to 3 lacs for a village, and runs and maintains the plants on its own. However the villages were ready to pay this amount as it was less expensive in the long run. Residents of Miyani with no potable ground water who were spending Rs 3 to 15 for a litre of water were now able to get RO treated water for Rs 0.1 to 0.2 per litre (Tata Review, 2010).
Table 2.2: Cost of RO water supply in India
Details Output Installation cost Product Water Cost
Single step Plant to desali-nate brackish
More than 1000m or 30 minutes of total collection time
Very low, often less than 5 lpcd
Very high as water quality and hygiene not assured and consumption needs may be at risk.
Groundwater In Mocha Gujarat, 2000
1800 litres per hour catering to 2000 villagers
INR 7.8 Lacs INR 58.5 per 1000 litres
Obha Village, Gujarat NA NA INR 0.25 per litre, 62 poor families provided water free of cost
Navsari, Gujarat Caters to 30 residents NA INR 0.11 per litre
Animal powered plants NA NA
Gagillapur, Telangana, 2013, revived in 2016
NA NA INR 5 for 20 litres ( Local private sellers charged INR 7 to 12 for 20 litres)
Andhra Pradesh, NTR Sujala Pathakam project, 5 compa-nies selected through tender, 50% project cost and power cost borne by the govern-ment
1000 LPH RO plant consid-ered for cost analysis
Capital cost – INR 3.2 Lacs Monthly O&M costs – INR 14,400 (from cost analysis)
To be sold at INR 2 for 20 litres and INR 1 for schedule tribe families
Nashik, Maharashtra, 2011 NA INR 11 Lacs INR 0.4 per litre
South Gujarat (2007 data) 250 LPH INR 1.25 Lacs NA
South Gujarat (2007 data) 560 LPH INR 2,32 Lacs INR 0.28 per litre
South Gujarat (2007 data) 1000 LPH INR 5 Lacs INR 0.6 per litre
Improving the Performance of Rural Water Supply and Sanitation Sector in Maharashtra32

The Central Salt & Marine Chemicals Research Institute (CSMCRI) has installed brackish water desalination plants based on indigenously developed Thin Film Compos-ite (TFC) reverse osmosis membranes to produce 500-5000 Litre/hour potable water from feed water having salinity in the range of 2000 to 7000 ppm, in different parts of the country including Gujarat, Rajasthan and Tamil Nadu. The units also remove hardness, fluoride, pathogens, pesticides and organics from the feed water. The insti-tute has also designed a mobile RO unit the utility of which was demonstrated in Nalgonda district of Andhra Pradesh and Amreli district of Gujarat for the treatment of brackish water containing excess fluoride. Sea water desalination plants have been designed for coastal areas to make sea water potable (CSMCRI, 2017).
However the case study of the RO water plant Mission,Gagillapur, Telangana set up in 2013, brings out the potential problems that can be faced by RO plants set up in rural areas. In the case of Gagillapur, the major problem was the non-availability of source water; the plant had to depend on tankers as a source for raw water which increased the operation cost. Other problems were the high cost of electricity, non-cooperation from the community, village politics and machinery and pumps getting old requiring frequent maintenance. After revival of the plant in 2016, the loss being incurred per month was 5000 INR on an average. A new bore well source for raw water having been established, the over burden of having purchased 20 tankers at INR 750 each was expected to be covered since then (MAS, 2017).
Picture 2.3: RO plant at Pansari, Gujarat
2.2.8 Combined Water Supply Systems (CWSS)
Ground water sources like open wells and bore wells are not sustainable in most cases. At the same time, surface water sources may also not be perennial, and susceptible to natural calamities like droughts. In such cases, a combined water supply system that depends on both surface water and ground water sources is the answer. The Tamil Nadu Water Supply and Drainage Board, for example, have initiated CWSS in many districts in Tamil Nadu.
Improving the Performance of Rural Water Supply and Sanitation Sector in Maharashtra33

Most of the rural water supply schemes in the past have been based on ground water sources. However, overuse of ground water sources for agriculture has led to alarming drop in water tables across the country and supply has become unreliable. Water quality is also affected in many areas with the water being saline or having nitrates, fluorides and arsenic in quantities that are harmful to health. The ministry of drinking water and sanitation now urges states to gradually shift rural drinking water supply schemes to perennial, secured, surface water sources.
In choosing the appropriate technology for a rural water supply scheme it is also important to consider the physical sustainability, economic viability, social viabili-ty, institutional sustainability and ecological sustainability of the scheme to prevent slippage and to prevent environmental degradation (World Bank, 2005).
2.3 Factors Determining Selection of Appropriate Water Supply Technology
Physical sustainability, economic viability, social viability, institutional sustainability and ecological sustainability are the factors that influence the selection of an appropriate water supply technology for a rural area (Table 2.3).
Table 2.3: Factors influencing selection of the appropriate water supply technology for rural areas
Factors Criteria
Physical sustainability Source should be sustainable with regard to quantity and quality of water; infrastructure must be durable
Economic viability Least cost option to be considered; choice of technology should reflect the willingness to pay and affordability of the consumers with an option to upgrade
Social viability Affordable to the customer; accessibility of the water supply system with respect to distance and time
Institutional sustainability The technology chosen for a particular situation on considerations of source and service sustainability should drive the ‘institutional form’; Human resource (HR) interventions in the form of training and capacity building for strengthening the existing institutions need to be identified
Ecological sustainability Maintain minimum flows in rivers and maintain temperature and oxygen levels in water bodies that sustain aquatic life; water after use should not end up polluting the same sources that it came from
2.3.1 Physical sustainability
Physical sustainability is of paramount importance in the design of any water supply scheme. Slippage from fully covered to partially covered or quality affected habita-tions is very common in rural India (Lockwood & Smits, 2011). This not only leads to wastage of resources but also to continued spending in providing water supply to
Improving the Performance of Rural Water Supply and Sanitation Sector in Maharashtra34

those habitations that have slipped back. The World Bank (2008) has reported that in many cases households have to find supplementary sources because the government provided source is insufficient to meet their water requirements which means they have to spend additionally to meet their water requirements.
How physical sustainability influence selection of water supply
technologies
As of now about 85% of our current rural water supply schemes are based on ground-water sources. Rural water supply schemes that are based on groundwater are far more vulnerable than those based on public reservoirs, as groundwater is an open access resource and it is impractical to enforce any restrictions on withdrawal from the aquifer by other competing water users, mainly irrigators. Because of this reason, groundwater-based sources experience yield reduction and often dry up due to well interference. This phenomenon is more rampant in hard rock areas and less frequent in alluvial areas due to poor specific yield of the aquifer in the case of the former. On the other hand, it is possible to restrict the withdrawal of water from public reservoirs through proper surveillance and law enforcement.
Water supply systems can be threatened by deteriorating quality of water in the source being tapped. This can happen from an increase in fluoride or arsenic content of the water, which can be the result of geo-genic processes, or from an increase in salinity and nitrate levels in groundwater possibly due to anthropogenic factors. In the case of coastal aquifers, excessive pumping of water results in intrusion of seawater into freshwater aquifers increasing the salinity levels and rendering them unfit for human consumption. Similarly, water supply schemes that are based on rivers and streams in semi-arid and arid regions are likely to experience problems due to the high inter-an-nual and inter-seasonal variability in rainfall and temperature. During dry years, there could be drastic reduction in flow (discharge) in the streams. Unless the schemes are designed for flows of very high dependability, such flow reductions can threaten the sustainability of the scheme.
Where ground water and surface water sources are available, a combined system using water from both sources may be adopted to avoid overdependence on one source and to ensure water supply during extreme climatic events.
Physical sustainability indicators
01. The yield of the source should not drop considerably over time that it takes large amount of time for filling the overhead tanks.
02. The source should be dependable vis-à-vis its ability to supply water to meet the current and future requirements.
03. The quality of water from the source should not be susceptible to decline over time.
04. The engineering infrastructure created for supplying water from the source should be durable and less liable for damage due to corrosion, breakage, etc.
Improving the Performance of Rural Water Supply and Sanitation Sector in Maharashtra35

2.3.2 Economic viability
In general, supply driven programmes, where a government institution decides on the requirements and design of a rural water supply system, incur higher institutional costs with the result that the cost of providing the service is higher than in demand driven programmes. However the regional or multi village schemes which are usually undertaken with this approach score well in terms of the proportion of household water requirement met from the scheme, regularity of supply, and maintenance of adequate supply in summer. The demand based programmes on the other hand are based on the level of service desired by the community and their willingness to pay and have a lower total cost of water supply than supply-driven schemes. In the case of water quality affected habitations where safe surface water bodies are at a distance, the project cost is reasonably high. A large number of water supply projects in the country, many of them in water quality affected areas, are halfway in commissioning because of paucity of funds (MDWS, 2016).
How economic viability influence selection of water supply
technologies
When it comes to planning water supply schemes, the general tendency among water supply agencies is to go for technology options that involve least initial cost, and not the ones which cost less in terms of investment/capita per year or investment per unit volume of water supplied. The point is that different types of systems have different life spans. The annual operation and maintenance costs also vary from system to system and poor maintenance of the system can shorten the life of the system. A piped water supply scheme which involves water withdrawal from a reservoir, lifting and transport would involve huge costs for energy and maintenance of the infrastruc-ture. But if proper maintenance of the infrastructure is done, the system can have a long life as the reservoir will last long (50 years or more).
A spring based water supply system which runs on gravity will not require much maintenance. Energy cost will be high for a tube well based system which taps water from great depth. In the same type of aquifer (say alluvial aquifer), the energy cost will increase in proportion to the depth to water table.
When the life cycle cost of the system is considered, the cost of production and supply of water from a bore well drilled in a hard rock area is likely to be much higher than of a tube well drilled in an alluvial area (even with same initial water table condi-tions), as the former can become dysfunctional due to drawdown in water levels and yield reductions much faster than the latter. The tube wells drilled in alluvial areas of the Gangetic alluvium last for 20-25 years with proper and regular maintenance. Whereas the bore wells drilled in hard rock areas have a much shorter life of 4-5 years or even less.
A water supply system which caters to scattered population (like in western Rajas-than) is likely to cost much higher in term of cost per Kl of water supplied than one which caters to concentrated population as the former would require greater length of the distribution system per unit population served, and the energy requirement for pressuring the pipes would be greater as the length of the distribution system increas-es owing to high pressure losses.
Improving the Performance of Rural Water Supply and Sanitation Sector in Maharashtra36

Economic viability criteria
01. The water supply system built should provide the least cost option for the existing situation, based on ‘life cycle cost’.
02. If one has to make a choice between two different types of systems both able to meet the requirements and fulfilling the physical sustainability considerations, then choice has to be made for the one which cost less per m3 of water.
03. The choice of technology should reflect the willingness to pay and affordability of the consumers. In this case it has to be mentioned that sometimes the willing-ness to pay for a service is less because the service does not rise up to their expectations. The 40 lpcd norm is very low considering the need of rural house-holds for water for maintaining livestock and other economic activities. The quality of water provided, where it is provided and the frequency and duration of water supply also influence the willingness to pay.
04. It should be possible to scale up the services with increasing affordability and willingness to pay on the part of the consumers
2.3.3 Social viability
The vision of the Ministry of Drinking Water and Sanitation is to provide every rural person in the country access to 70 lpcd within their household premises or at a horizon-tal or vertical distance of not more than 50 meters from the household irrespective of their social position or financial situation. In 2014, about 73% rural habitations in the country were fully covered (on the basis of 40 lpcd norm), 21.17% were partially covered and 4.6% were quality affected. There is considerable slippage in service mainly due to the dependency on ground water for water supply as a result of which progress in increasing rural water supply coverage appears to be very slow.
How social viability influence selection of water supply technologies
More than the ability of a water supply system to maintain the requisite supply level for meeting the community needs, how it is being supplied also matters to increase the social acceptability of a rural water supply system. The village households generally show the willingness to travel some distance to collect water from PWS sources such as stand-posts, hand pumps and wells. But as economic conditions of the rural house-holds improve, the opportunity cost of the time spent in collecting water increas-es with the result that the economically better off households would like to secure water supplies within their dwelling or in the premises. Also, the economically better off families would demand water of good quality especially one which is free from salts, while the overall awareness about the problems associated with consuming water of poor quality has increased in villages. Hence, the water supply technolo-gy chosen for economically prosperous villages should be such that it is possible to supply good quality water from the sources to the individual dwellings for the commu-nities to accept the system. This essentially means that technologies such as hand pumps will become obsolete. Even when high end technologies like RO systems are installed, such systems should be capable of supplying water to the individual house-holds through pipe networks and the households will be willing to pay a high price for the services provided.
Improving the Performance of Rural Water Supply and Sanitation Sector in Maharashtra37

At the same time provision of water in good quality and sufficient quantity to those living in rural/remote/hard areas and whose economic conditions are compelling is also the responsibility of the government. In such cases low cost technologies which do not compromise on water quality should be the choice. In economically poor neigh-bourhoods, where communities migrate in search of employment to neighbouring towns and cities, it is quite unlikely that expensive water supply systems are preferred as the willingness to pay for water will be less. In such situations, expensive systems shall be used only for meeting the high priority water needs such as drinking and cooking. The water supply agency will have to go for cheaper water supply options for meeting the domestic water needs other than drinking and cooking.
Social viability criteria
01. Affordability of water: Economic condition of the consumers is good enough to enable them to buy enough water for meeting their needs. Since in most situa-tions, the water supply agency or the local government which runs the scheme, does not charge for the water based on volumetric consumption, it means that they are able to pay the fixed monthly water tariff decided by the agency.
02. Availability of time for collecting water: If the time required to be spent for fetching water becomes considerably high that the opportunity cost of collecting water from the source becomes higher than the benefits that can be accrued from the use of that water from the public source, the households will lose interest in depending on the water source and would eventually start depending on alterna-tives which might even be more expensive on the consideration of time saving.
03. Accessibility/remoteness of the settlement: The settlements are within the accessible limits of the water supply sources
2.3.4 Institutional sustainability
A robust institutional set up is necessary for a good water supply system to function effectively. Especially in the case of supply driven schemes where the involvement of the consumer in the management of the water supply system is negligible, failure of the water supply system or slippage in services has as much to do with institutional failure as with problems with source sustainability, financial problems, etc. In the case of decentralized management of water supply systems, the institutions at the Pancha-yat level must be capable of managing the day to day operations and maintenance effectively (Hutchings et al., 2016).
How institutional sustainability considerations influence water supply technology selection
Different types of water supply technologies require different levels of skills to manage, depending on the level of sophistication of the technology used. The institutions that are created to manage the system should match with the technology. It is generally believed that well based individual village schemes are easy to manage, and as a result the Gram Panchayats (GPs) show willingness to manage such schemes. At the same time, GPs do not show much interest in managing reservoir based regional water
Improving the Performance of Rural Water Supply and Sanitation Sector in Maharashtra38

supply schemes given the technical complexity. They prefer simple individual village schemes based on wells. This can be at the cost of sustainability of the source.
Instead of the institutions deciding on the type of technology, the technology chosen for a particular situation on considerations of source and service sustainability should drive the ‘institutional form’. Only such an approach can ensure institutional sustain-ability. Nevertheless, once a technology is identified, the next step should be to examine whether institutions of adequate capability exist to manage it or not and if they do whether they have any local presence. In case the existing institutions are not capable of managing the chosen technology, human resource (HR) inter-ventions in the form of training and capacity building for strengthening the existing institutions need to be identified.
2.3.5 Ecological sustainability
Use of water by humans for various uses impacts the environment in different ways. Water is needed not only by humans but also by plants and animals for their survival. It also provides other eco system functions like erosion, climate control, maintaining biodiversity and the like. The waste water that is discharged into surface and ground water also pollutes them adversely affecting the eco system functions of water. Ecological sustainability is an important but oft ignored factor in deciding on an appro-priate water supply technology.
How environmental considerations influence decisions on water supply technologies
Meeting environmental safe guards means that production of water from the proposed water supply sources does not pose any threat to the surrounding environment. Large scale withdrawal of groundwater from a single (well field) source can often pose threats to the environment. Such threats can be through excessive drop in ground-water levels, creation of cones of depression resulting from water withdrawal from well fields, saline intrusion into or quality deterioration of groundwater and drying up of springs in hilly and mountainous areas. The wastewater with high level of contam-inants from desalination plants also pollutes the soil or groundwater.
There can be serious environmental issues associated with large-scale withdrawal of sub-soil water (base flow) from river beds through French wells, resulting in drying up of river beds during lean season and destruction of soil biota and riverine ecosystem.
Criteria that ensure ecological sustainability
For maintaining ecological balance, it is necessary to maintain minimum flows in rivers and maintain temperature and oxygen levels in water bodies that sustain aquatic life. It is also necessary that the water after use does not end up polluting the same sources that it came from. In case of reverse osmosis plants the waste water discharged may alter the chemical composition of the water bodies into which it is discharged. The waste water may also change the temperature of the water bodies which can be detri-mental to aquatic life. The following factors may be monitored to ensure ecological sustainability.
Improving the Performance of Rural Water Supply and Sanitation Sector in Maharashtra39

Dissolved oxygen in the source water bodies likes rivers and lakes
01. Total Dissolved Solids in the rivers and lakes
02. Salinity of water bodies into which waste water from RO plants is discharged
03. Temperature of water bodies into which waste water is thus discharged
04. Water level in the rivers or lakes during summer months
05. Changes in depth of water table in the area surrounding intake structures
06. Changes in salinity in ground water in the area surrounding intake structures
2.4 Water Supply Systems for Peri-Urban Areas
The term peri urban refers to the urban fringe outside the formal city-limits. It describes the interface between rural and urban activities, and embodies a transition from rural to urban norms, legislation and institutional settings, in which social structures; commercial activities and the built environment are in a state of flux (Stockholm environment Institute, 2014). They often fall in a grey area with respect to legal, administrative, regulatory and policy matters where neither rural nor urban policies will be effective and just in addressing the issues and problems peculiar to such a fluid environment. Census towns in India which are not statutorily notified and administered as towns but have population with urban characteristics also fall in the peri-urban landscape. As per the 2011 Census, India has about 3894 census towns, with almost 279 in the State of Maharashtra (at fourth place nationally).
Peri urban areas are characterized by rapid population growth, a mixture of planned and un-planned settlements and inadequate service infrastructure. The population is also heterogeneous and land prices often beyond the reach of the poorer sections of the society. This unplanned rapid growth leads to environmental and health problems. The issues faced by peri urban areas are similar to those faced by urban areas though with lower intensity. But the infrastructure, institutions and administrative efficiency available in urban areas are absent in peri urban areas. The infrastructure is of inferior quality; the institutions that are to manage water supply systems have lower (techni-cal, managerial and financial) capabilities and administration is less efficient.
Providing water supply to such a rapidly changing environment poses many difficulties. The population density is higher than in rural areas but more dispersed than in cities and towns. The rate of growth of population is also higher so that the water supply scheme provided must be such that it does not become inadequate in a short time. The houses in these areas are often built in a haphazard manner and laying pipelines to all the households may prove to be a challenge. The quantum of water required also increases fast as economic activities in the peri urban areas increase rapidly. There is an increasing tendency to site educational institutions and factories in peri urban areas as land availability is better than in the cities; this not only increases the demand for water in peri urban areas, but also changes the nature of service requirements. The availability of uninterrupted power supply is another factor that needs consideration.
Improving the Performance of Rural Water Supply and Sanitation Sector in Maharashtra40

These factors have to be considered when designing a water supply system for peri urban areas. The scalability and flexibility must also be higher for a system designed for peri urban areas for the reasons mentioned above.
The term peri urban refers to the urban fringe outside the formal city-limits. It describes the interface between rural and urban activities, and embodies a transition from rural to urban norms, legislation and institutional settings, in which social structures; commer-cial activities and the built environment are in a state of flux (Stockholm environment Institute, 2014). They often fall in a grey area with respect to legal, administrative, regulatory and policy matters where neither rural nor urban policies will be effective and just in addressing the issues and problems peculiar to such a fluid environment. Census towns in India which are not statutorily notified and administered as towns but have population with urban characteristics also fall in the peri-urban landscape. As per the 2011 Census, India has about 3894 census towns, with almost 279 in the State of Maharashtra(at fourth place nationally).
Peri urban areas are characterized by rapid population growth, a mixture of planned and un-planned settlements and inadequate service infrastructure. The population is also heterogeneous and land prices often beyond the reach of the poorer sections of the society. This unplanned rapid growth leads to environmental and health problems. The issues faced by peri urban areas are similar to those faced by urban areas though with lower intensity. But the infrastructure, institutions and administrative efficiency available in urban areas are absent in peri urban areas. The infrastructure is of inferior quality; the institutions that are to manage water supply systems have lower (techni-cal, managerial and financial) capabilities and administration is less efficient.
Providing water supply to such a rapidly changing environment poses many difficulties. The population density is higher than in rural areas but more dispersed than in cities and towns. The rate of growth of population is also higher so that the water supply scheme provided must be such that it does not become inadequate in a short time. The houses in these areas are often built in a haphazard manner and laying pipelines to all the households may prove to be a challenge. The quantum of water required also increases fast as economic activities in the peri urban areas increase rapidly. There is an increasing tendency to site educational institutions and factories in peri urban areas as land availability is better than in the cities; this not only increases the demand for water in peri urban areas, but also changes the nature of service requirements. The availability of uninterrupted power supply is another factor that needs consideration.
These factors have to be considered when designing a water supply system for peri urban areas. The scalability and flexibility must also be higher for a system designed for peri urban areas for the reasons mentioned above.
2.5 Conclusions
The decision on which water supply system to be chosen for a given area involves a whole range of considerations, from physical sustainability to economic viability to social acceptability to ecological sustainability and institutional sustainability. It is extremely difficult to give different weightages to these five different criteria as all are equally important. That being the case, it is quite likely that two different systems score the same value when all the five parameters are considered for decision making.
Improving the Performance of Rural Water Supply and Sanitation Sector in Maharashtra41

Under such situations, based on experience and expertise decisions will have to be arrived at on the type of system to be chosen. It is generally found that systems that are sound from the point of view of physical sustainability scope high on economic viability due to extended life. Good economic viability would also ensure institution-al sustainability, which in turn can ensure regular operation and maintenance of the systems. This can ultimately result in improved physical sustainability of the system. Therefore, systems that do not guarantee sound physical sustainability but appears to be viable on other criteria shall be given least preference.
References � Arlosoroff, S., Tschannerl, G., Grey, D., Journey, W., Kary,
A., Langenegger, O., & Roche, R. (1987).
� Community water supply: the hand pump option. Washington: The World Bank.
� Arghyam.(2011). Gravity water flow systems in Eastern Ghats, India. Bangalore: Arghyam.
� Bassi, N.,& Kabir,Y. (2016).Sustainability versuslocal management: compar-ative performance of rural water supply schemes. In: M. Dinesh Kumar, A. J. James and Yusuf Kabir (Eds), Rural water systems for multiple uses and livelihood security. Amsterdam: Elsevier, pp. 87-115.
� Baumann, E.,&Erph, K. (2005).Technology options in rural water supply. St Gallen: Rural Water Supply Network.
� Bisoee, A. (2017).24x7 water for this honest village- At Darku, all 300 households pay, and transparency ensures regular supply. The Telegraph dt May 21, 2017, https://www.telegraphindia.com/1170521/jsp/front page/story_152722.jsp (Accessed on 23 August 2017).
� Brikké, F.,&Bredero, M. (2003).Linking technology choice with operation and mainte-nance in the context of community water supply- A reference document for planners and project staff. Geneva: World Health Organization and IRC Water and Sanitation Centre.
� Dasgupta, A. (2010). Salt of the matter. Tata Review, September 2010, pp 76-77.
� Ministry of Drinking Water and Sanitation.(2013).Operation and mainte-nance manual for rural water supplies. New Delhi: Government of India.
� Ministry of Drinking Water and Sanitation.(2016). Evaluation of rural drinking water programmes. Committee on Estimates (2016-17). New Delhi: Lok Sabha Secretariat.
� Central Ground Water Board.(2011).Ground water brochure, Banaskantha District, Gujarat. Technical Report Series. Ahmedabad: Government of India.
� Central Ground Water Board.(2014).Dynamic ground water resources of India (As on 31st March 2011).New Delhi: Government of India.
� Central Ground Water Board. (2016).Ground water level scenario in India (January-2016). New Delhi: Government of India.
� Department of Drinking Water and Sanitation.(2013). Rural drinking water, strategic plan – 2011- 2022.New Delhi: Depart-ment of Drinking Water and Sanitation, Government of India.
� Govt. of Andhra Pradesh.(2014). Panchayat Raj & Rural Development (RWS.II).Depart-ment G.O. Rt. No. 740 Dated: 25.06.2014. Hyderabad: Government of Andhra Pradesh.
� Govt. of Andhra Pradesh (2016).Panchayat Raj & Rural Development (RWS.II).Depart-ment G.O.MS.No. 18 Dated: 08-03-2016. Hyderabad: Government of Andhra Pradesh.
Improving the Performance of Rural Water Supply and Sanitation Sector in Maharashtra42

� Govt. of Andhra Pradesh.(2014).NTR Sujala Pathakam (Presentation), http://rwss.ap.nic.in/pred/downloads/NTR/NTR%20Sujala%20Pathakam%20-%20CM%20Presentation%20-%20Final-21.7.14.pdf (Accessed 23 August, 2017).
� Haskoning Royal Dutch Consulting Engineers and Architects. (1990).Santal-pur regional water supply scheme, Gujarat, India, operation & maintenance, Volume I-evaluation existing operation & maintenance. Nijmegen: Haskoning.
� Hofkes, E.H. (1983).Small community water supplies: technology of small water supply systems in developing countries. The Hague: Internation-al Reference Centre for Community Water Supply and Sanitation.
� Hutchings, P., Franceys, R., Mekala, S., Smits, S., & James, A.J. (2016).Revisiting the history, concepts and typologies of community manage-ment for rural drinking water supply in India. International Journal of Water Resources Development,DOI: 10.1080/07900627.2016.1145576, http://dx.doi.org/10.1080/07900627.2016.1145576 (Accessed 20 August 2017).
� Krishnan. S., Indu, R., Bhatt, S., Pathak, F., Thakkar, A., and Vadgama, U. (2007).Reverse osmosis plants for rural water treatment in Gujarat. Indiawa-terportal.org, http://www.indiawaterportal.org/articles/reverse-osmo-sis-plants-rural-water-treatent-gujarat(Accessed 24 August 2017).
� Lockwood, H.,& Smits, S. (2011). Supporting rural water supply: moving towards a service delivery approach. Warwickshire: Practical Action Publishing.
� MAS.(2017).Case study: RO water plant mission, Gagillapur. http://apmas.org/gagi/A%20Case%20Study%20on%20RO%20Water%20Plant-Mission%20Gagillapur.pdf(Accessed 25 Aug, 2017).
� McConville, J.,&Wittgren, H.B. (eds.). (). Peri-Urban sanitation and water service provision challenges and opportunities for develop-ing countries. Stockholm: Stockholm Environment Institute.
� Misra, S. (2008).Review of effectiveness of Rural Supply Schemes in India. New Delhi: World Bank.
� Ministry of Drinking Water and Sanitation. (2013).Uniform drinking water quality monitoring protocol. New Delhi: Government of India.
� Ministry of Drinking Water and Sanitation. (2013).Rural water supply and sanita-tion project for low income states (RWSSP – LIS), Assam, Bihar, Jharkhand and Uttar Pradesh: social management framework. New Delhi: Government of India.
� Ministry of Drinking Water and Sanitation.(2016).Evaluation of rural drinking water programme. Committee on estimates (2016-17), 16th report presented to Lok Sabha on 11.08.2016.
� Ministry of Drinking Water and Sanitation.(2017).Stakehold-ers’ consultation workshop03.01.2017.New Delhi: National Rural Drinking Water Program, Government of India.
� Mukherjee, A. (2017).Rejuvenation of Springs in India. Farid-abad: Central Ground Water Board.
� Reed, B.J. (2011).Minimum water quantity needed for domestic uses. Technical Note No. 9 WHO/SEARO Technical Notes for Emergencies. New Delhi: World Health Organization.
� Sara, J.,& Katz, T. (2005).Making rural water supply sustain-able: report on the impact of project rules. UNDP -World Bank Water and Sanitation Program. Washington DC: World Bank.
Improving the Performance of Rural Water Supply and Sanitation Sector in Maharashtra43

Monitoring and Evaluation of Rural Water Supply Schemes
Module 3A:
3A.1 Introduction
Monitoring and evaluation (M & E) are two important components to ensure perfor-mance of rural water supply schemes and for also fixing any concerns that can affect sustainable and reliability of water supply. These concerns can be physical, financial, economic, institutional, managerial and environmental in nature. Ministry of Drinking Water and Sanitation (MDWS), Government of India (GoI) has a mandate to take up monitoring and evaluation studies of water supply schemes on a regular basis through reputed organizations and institutions. Hundred per cent assistance is available from the MDWS to state governments for administering such studies. States should ensure that the M&E reports are made available to the MDWS for them to initiate a follow up action to improve the quality of programme implementation. The restructured NRDWP has also made it mandatory for states to undertake third party evaluation of the completed piped water supply schemes by setting aside 25% of the total funds under NRDWP (sustainability component) for a scheme to ensure proper functioning.
Water Supply and Sanitation Department (WSSD), Government of Maharashtra (GoM) has already passed orders through Government Resolution (GR) dated 9th July 2014, regarding technical approval, administrative approval, implementation, third party technical inspection, and maintenance repair for rural water supply schemes (RWSS) in the state. Under the same GR, third party technical inspection of RWSS has been made compulsory. Subsequently, detailed guidelines for third party technical inspec-tion of RWSS has been prepared and passed via GR dated 15th June 2015. As per the this latest GR, The Chief Executive Officer of Zilla Parishad (ZP) has been made responsible for third party technical test of all RWSS in the district. ZP has been given a mandate to sought services from the government engineering (Degree/Diploma) colleges, government IIT institutes, quality and monitoring team of Maharashtra Jeevan Pradhikaran (MJP), and other government organisations related to water supply for independent assessment of the implementation of the new RWSS in the State and also review performance of the existing schemes (GoM, 2015).
The guidelines for third party technical assessment of RWSS in Maharashtra also call for identification of indicators which can help in measuring progress of implementa-tion of RWSS and also review progress of existing schemes (GoM, 2015). Some of the criteria and indicators which can be used to assess the performance of RWSS are discussed below.
3A.2 Performance Assessment Criteria
As per the NRDWP guidelines, the criteria of sustainability for drinking water schemes include: source sustainability; system sustainability; financial sustainability; and, social and environmental sustainability. However, indicators under each of these criteria appear inadequate when it comes to assessing the performance of the water supply
Improving the Performance of Rural Water Supply and Sanitation Sector in Maharashtra44

schemes. Ideally, the performance assessment criteria can be divided into five major sub groups. They are discussed below in separate sections
3A.2.1 Physical performance
It is suggestive of how smoothly the system runs and how efficient the scheme is in terms of supplying water to the communities in the designated area so that the village households can collect water with least effort and are able to meet their requirements in terms of quantity and quality. For good physical performance, it is important that there is adequate pressure at different points in the water distribution network, the discharge is adequate for people to collect water, and the leakage in the system is minimum. For obtaining good physical performance, the right selection of the source (stream or reservoir, or well or lake) is crucial to ensure sufficient quantities of water throughout the year. It is also important to select the right size of the pump set and diameter of the rising main and distribution pipes to maintain adequate pressure across the distribution system3.
3A.2.2 Financial & economic performance
In the financial terms, it assesses whether the community served by the scheme pays for the services (water cess) on time and the same covers the O&M costs of the scheme. Financial performance can be improved by raising the water cess within a range wherein the demand for water does not reduce with increase in water charges. However, several times, rural water supply schemes perform badly in financial terms due to low recover rates, with households failing to pay the water charges on time or unwilling to pay water charges in the absence of effective management institutions. In certain cases, the water charges are too low to provide any significant revenue for the local institution managing it. For improved financial performance, effective institutions for management of drinking water is necessary as it can ensure most efficient charge for water, and timely recovery of water charges from the water users. But for raising people’s willingness to pay for water, it is important to raise the physical performance of the system. But good upkeep of the system will be possible only if the financial working of the scheme is good, and for which water charges need to be kept at suffi-ciently high and recovery rates need to be considerably high.
Economic performance involves assessment of the average life cycle cost of the system (Rs./m3 of water) against the cost of meeting the same level of service (in terms of quantity, quality and reliability of water supplied and the size of the population served) using an alternative. Such a methodology of economic evaluation is adopted because water is treated as a social good when used for domestic water supply. Ensuring good economic performance warrants that all alternatives are explored before the given option is preferred for water supply and that the chosen option has the least cost per unit volume of water supplied, when the entire life of the system is considered.
Often two alternatives are not comparable because of the reason that the degree of physical access to water supply differs or the quality of water differs between options. In the former case, the opportunity cost of fetching water from the source (in the case of options which does not offer water near the dwelling premise) should be added to the direct cost. In the latter case, the marginal cost of treating the water
3Reduced pipe diameter leads to increase in velocity of water and increase in pressure loss, with the result that water may not reach the tail of the system.
Improving the Performance of Rural Water Supply and Sanitation Sector in Maharashtra45

to the required standard (in the case of option which does not offer water of suffi-cient quality) should be added to the direct cost of the alternative. In many situations, groundwater based schemes do not offer water of adequate quality for drinking water supply due to chemical contamination of the water and the cost of production and supply of water from such schemes may not be comparable with schemes based on water from surface reservoirs (which is generally free from chemical contamination), if the water is not subjected to treatment for removal of minerals present in ground-water4.
Maintaining good technical performance of the scheme through regular maintenance can help ensure good economic performance, by increasing the life of the system and thereby minimizing repair works. But several of the initial decisions relating to planning and design of the scheme (type of source, the size of the scheme, location of the source, etc.) can help optimize the system costs, stretch the life of the system and reduce the cost per KL of water produced and supplied by the scheme. For instance, wrong siting of the reservoir can increase the cost per m3 of water stored. It can also increase the cost of the water distribution system. Over-designed pipelines can increase the cost per metre length of the pipes, though it can help reduce the pressure losses thereby reducing the cost of energy for pumping a unit volume of water
3A.2.3 Institutional performance
It is indicative of degree of equity in distribution of water in the village/population served and the ability of the agency (GP, ZP, GSDA or MJP in case of Maharashtra) and the water management committee to resolve conflicts over water supply and distribution.
3A.2.4 Management performance
It assess whether the scheme is able to minimize the cost of operation and mainte-nance, while being able to cater to the needs of the population covered. And also whether the scheme runs smoothly and efficiently in the sense that the time required for repair in the case of system break down is minimum. Management performance can also be called management efficiency.
In the case of urban water supply, utilities are generally evaluated for their manage-ment performance or efficiency in relation to the number of staff employed per 1,000 connections or 1,000 people served by the scheme. Lower the number, higher the management efficiency (ADB, 2007; Kumar, 2014). However, such evaluation might be difficult in the case of rural water supply schemes, especially when there is signifi-cant contribution of the local (village) water supply and sanitation committee members in the operation and maintenance of the schemes, which is voluntary in nature.
3A.2.5 Environmental performance
This indicates whether the scheme operation leads to any measurable degradation of the water resources and surrounding environment (mainly through water pollution). One such situation is when excessive drawdown in groundwater level due to pumping
4In many areas, where alternative sources are not available locally, the water supply departments of some state governments were found to have relaxed the norms for chemical quality of water for drinking water supply and gone for groundwater based sources which have high levels of salinity exceeding the permissible limits.
Improving the Performance of Rural Water Supply and Sanitation Sector in Maharashtra46

from a coastal aquifer leads to seawater intrusion and deterioration in the quality of coastal freshwater aquifer. Another situation is one in which the disposal of wastewa-ter (having very high salinity) from a large desalination plant causes degradation of the soil due to excessive salt concentration in the top soil, rendering it unfit for cultivation of crops. A third situation is one in which excessive withdrawal of water from a river through reservoir or direct lifting causes environmental degradation of the river, due to lack of sufficient flows to sustain the ecology of the river.
3A.3 Performance Assessment Indicators
3A.3.1 Physical performance
Indicators for assessing physical performance include: 1] No. of water supply connec-tions against the total number of households; 2] frequency of water supply; 3] average duration of water supply; 4] average per capita water supply against the design supply levels; 5] quality of water supplied; 6] number of leakages detected in the distribution system; 7] average distance covered by the HHs to fetch water or the proportion of HHs which get water inside the dwelling or in the dwelling premises; and 8] number of times the system break-down during a year.
3A.3.2 Financial and economic performance
The financial performance of the scheme is considered to be better if the greater proportion of the connected households pay for the water supply services. For assess-ing financial performance, following indicators can be used: 1] amount of water charge collected against the demand raised by the Panchayat (as per the water charges fixed) and against the total annual operation and maintenance cost; and, 2] amount of water cess dues.
Economic performance can be measured using: 1] average annual operating cost against the estimated annual O & M; 2] average cost per m3 of water, based on the actual volume of water supplied and the annualized (fixed + variable) cost, against alternative sources that can provide same level of service; and 3] number of household connections having metered water supply and where pricing is based on consumption against the total number of connections
3A.3.3 Institutional performance
Institutional performance can be judged considering the following: 1] number of village households who have access to water supply, against the design coverage; 2] differ-ences in per capita supply between the HH which get lowest supply and those which get the highest level of supply; 3] number of public taps and hand pumps built per 500 people; 4] number of complaints attended daily as a ratio of total number of complaints received; 5] number of BPL households having access to water supply as a fraction; and 6] number of conflicts/disputes resolved by the water supply committee against the total number of conflict/dispute situations arisen.
Improving the Performance of Rural Water Supply and Sanitation Sector in Maharashtra47

3A.3.4 Management performance
For assessing management performance: 1] time taken for system repairs in the case of break-down; 2] average annual expenditure for O & M per water connection; 3] number of water supply tankers per 100 households; and 4] frequency of water quality testing, are the important indicators. Greater the time taken for repair and mainte-nance, poorer is the management performance. Higher the cost incurred for operation and maintenance, lower is the management performance. Higher the frequency of water quality testing, better the management performance. If the scheme is managed efficiently, the dependence on water tankers will be minimum.
3A.3.5 Environmental performance
Environmental performance is manly measured in terms of: 1] extent of deterioration of quality of water from the source since the date of commissioning of the project, in the case of groundwater based schemes; 2] degree of over-exploitation of local groundwater in the rural area in which the scheme falls; 3] extent of degradation of the ecology of the rivers from which water is drawn in the case of surface schemes; and 3] quality of the receiving waters or soils in the habitation or village (in the case of desalination systems). In sum, the indicators used for assessing environmental perfor-mance depend on the type of scheme.
3A.4 Performance Monitoring Process
As evident from the description of various indicators for performance assessment, to get some understanding of the level of performance of a scheme, there is a minimum amount of time required. For instance, new schemes generally do not require much maintenance and repair works, but with the ageing of the scheme, the degree of repair works keeps increasing. Though for well-maintained schemes, the amount of break-down and therefore repair work required would be less.
An integrated monitoring and information system could also be established for effec-tive monitoring of rural water supply schemes. For instance, Niger has adopted such monitoring system with the help of World Bank’s water and sanitation programme. The system has two important components: an interactive database using mobile technology for data collection and a portal for publishing and exchange of the informa-tion. It supports the Ministry of Water and Sanitation (MHA) of Niger and communes to plan their investments, manage the overall performance of the sector, and better target under performance and unserved populations.
Figure 3A.1: Suggested phases for using ICT for monitoring performance of rural water schemes
(Source: Maiga et al., 2015)
PHASE 1: PHASE 2: PHASE 3:
Assessment of the existing conditions and thedesign of the framework for the new database
Design of the new data base with the link to its interfacesused for upcates and transmission to an internet portal
Training and the extension of thetool to other users
Improving the Performance of Rural Water Supply and Sanitation Sector in Maharashtra48

The ICT enabled performance monitoring system can be set-up in three interactive phases (Figure 3.1): 1] an assessment of the existing performance system and human capacity; 2] creation of the new integrated data base with facility to migrate existing data and establishment of its internal portal to serve as a system for exchange and circulation of data and information with various indicators; and 3] training and the extension of the tools to other users (World Bank, 2015).
A Decision support tool (DST), developed by Institute for Resource Analysis and Policy (IRAP) in association with Groundwater Surveys and Development Agency and UNICEF (2015), for predicting the quantum of utilizable groundwater resources and drinking water scarcity situation in a region, based on real time monitoring of the daily rainfall and pre-post monsoon ground water levels can also be useful for assessing the source sustainability part of the rural water supply schemes. And hence will support in performance assessment.
The process of development of the DST has been validated for a block, viz., Jiwati of Chandrapur district of Maharashtra and is based on a series of mathematical models (relationships) established between: the rainfall characteristics (amount of annual rainfall, number of rainy days, and onset of monsoon): rainfall and other hydrological processes and outcomes (runoff, monsoon recharge, total infiltration and utilizable groundwater recharge in the aquifer); and annual rainfall and condition of groundwater in terms of summer water levels, socio-economic outcomes such as cropping inten-sity and irrigation intensity and drought occurrence in terms of villages affected by water scarcity.
3A.5 Case Studies
Performance assessment of rural water supply schemes in India has been done by some agencies and researchers. However, most of these assessments are limited in scope and objectives and often includes only limited number of performance assess-ment criteria. Synopsis of some of the studies is presented in Table 3.1.
Table 3A.1: Summary of some of the performance assessment of rural water supply schemes in India
Author/Agency and year
Performance Assess-ment Criteria/Indica-tors considered
States covered Findings
World Bank, 2008
Reliability and adequacy of water supply; afford-ability; environmental sustainability; and finan-cial sustainability
Andhra Pradesh, Karnataka, Kerala, Maharashtra, Odisha, Punjab, Tamil Nadu, Uttar Pradesh, Uttarakhand, West Bengal
� Actual services provided by piped water supply schemes fall short of design.
� Water supplied is inadequate, and does not fully meet the water requirements of the households, particularly in summer.
� Due to inadequate water supply, rural households typically have to depend on multiple water sources.
Author/Agency and year
Performance Assess-ment Criteria/Indica-tors considered
States covered Findings
Improving the Performance of Rural Water Supply and Sanitation Sector in Maharashtra49

IIM, 2013 Technical and service delivery; institutional aspects; economic and financial aspects; and social and environmental aspects
Jharkhand � Water supply schemes are not able to provide water on sustainable basis.
� Water supplied is of poor quality and it is supplied without any quality check.
� VWSC is unable to properly operate and maintain the system.
CIMP, 2013
Technical and service delivery; institutional aspects; economic and financial aspects; and social and environmental aspects
Bihar � Inadequate supply of piped water in rural households.
� Existing piped water schemes function at sub-optimal levels due to various reasons such as lack of availabil-ity of electricity, civil and mechani-cal faults, poor monitoring etc.
World Bank 1999
Institutional performance; financial viability and sustainability; and water source protection
Pan India � The existing institutional arrangements are widely accepted as inadequate to address the needs of user communities.
� The current financial arrangements, where the govern-ment finances all capital and recurrent costs and recoups little of these expenditures from water charges, has proven detrimental to the quality of the infrastructure and the services delivered.
Gill and Nema, 2016
Service provisions; service operations;ser-vice reliability; and finan-cial sustainability
Himachal Pradesh � The efficiencies of rural water supply utilities are very low in all the four components of performance.
� The gravity type utilities have better efficiency than that of lift type.
� There is a huge scope for O&M cost reductions.
� The utilities are suffering from slip-back in coverage i.e., they have low sustainability, mainly due planning failure.
Misra, 2016
Governance practices; management perfor-mance; institutional performance; techno-in-stitutional characteristic; and institutional and policy framework
Maharashtra � Only half the rural households in Maharashtra have access to tap water.
� Chemical quality of water supplied through groundwa-ter is also an issue.
� The management performance of single village schemes which are based on surface water is better than that of their groundwater and sub-surface water.
� The degree of decentralization and community partic-ipation in management of the scheme is much better for the single village schemes based on groundwater which were designed and built by the Zilla Parishad and the Gram Panchayat.
� The regional schemes based on surface water sources have lowest number of contractual staff per 1000 connected households.
Improving the Performance of Rural Water Supply and Sanitation Sector in Maharashtra50

3A.6 Conclusion
This note provides detailed criteria and indicators for assessing the performance of rural water supply schemes and takes the corrective actions there on. However, to pass final judgement on the performance of any scheme, reference of best perform-ing schemes in similar physical and socio-economic and institutional environment is required. The reason is that the physical environment (hydrology, geohydrology, climate), socio-economic conditions and institutional factors together influence the range of performance variables (physical, financial, economic, institutional, manage-rial and ecological). Further, it also emphasise on the ICT enabled monitoring system which can be developed and adopted to monitor performance of all water supply schemes.
References � CIMP.(2013). Assessment of rural drinking water supply services for the rural water supply
and sanitation program in Bihar. Patna, India: Chandragupt Institute of Management Patna.
� Gill, D., &Nema, A. K.(2016).Benchmarking of Indian rural drinking water supply utilities. Water Utility Journal, 13(1), 29-45.
� GoM.(2015). Guidelines for third party technical inspection of rural water supply schemes. Mumbai: Water Supply and Sanitation Department, Government of Maharashtra.
� IIM.(2013).Assessing the status and performance of rural drinking water supply sector and programs in Jharkhand. Ranchi, India: Indian Institute of Management.
� IRAP, GSDA and UNICEF. (2015). Using technology to ensure ground water safety and security in a tribal block of Chandrapur, Maharashtra. Hyderabad, India: Institute for Resource Analysis and Policy.
� Misra, S. (2016).Uttarakhand RWSS project (India): a trend setter of the decentralization program in the rural water supply and sanitation sector. Paper presented at the 7th RWSN Forum “Water for Everyone”, Abidjan, Côte d’Ivoire.
� UNICEF, IRAP and GoM. (2013). Promoting sustainable drinking water supply and sanita-tion in rural Maharashtra: institutional and policy regimes. Hyderabad, India: Institute for Resource Analysis and Policy.
� World Bank.(1999). Rural Water Supply and Sanitation. Washington, DC: World Bank.
� World Bank.(2008). Review of effectiveness of rural water supply schemes in India. Washington, DC: World Bank.
� Maiga, T. A., Ndaw, M. F., &Bhatia, D. T. (2015).Strengthening water supply and sanitation planning and monitoring systems in Niger. Water and Sanitation Programme Technical Paper. Washington, DC: World Bank.
Improving the Performance of Rural Water Supply and Sanitation Sector in Maharashtra51

3B.1 Introduction
This sub-module outlines the process followed by Technology and Development Solutions Cell (TDSC), CTARA IIT Bombay for Third Party Technical Evaluation of Rural Water Supply Schemes, as stipulated by the WSSD, Government of Maharashtra under the Unnat Maharashtra Abhiyan (UMA) and has also been made mandatory under the restructured NRDWP guidelines.
3B.2 Activities Involved in RWS Assessment
Assessment of rural water supply schemes by a third party, are mandated under the Government of Maharashtra Resolution No: Gra. Pa. Dho.- 1114 / Case No.61 / Pa.Pu.-07, Dt. 15 June 2015. Activities involved in the inspection can be classified into four main activity categories as follows:
01. Data collection
i. Detailed project report
ii. Secondary data
02. Field visit
03. Data analysis
04. Reporting
Module 3B:
Process for Third Party Evaluationof Rural Water Supply Schemes
Improving the Performance of Rural Water Supply and Sanitation Sector in Maharashtra52

3B.2.1 Data collection
Once the official procedure (proposal submission, agreement signing and release of work order) between ZP and third-party assessment agency is completed, the next task is to collect data pertaining to the schemes to be assessed. Some data are collected from the district or taluka Rural Water Supply Department; and some from secondary sources such as MIS of NRDWP and census.
Detailed Project Report (DPR)
DPR is the most important documented prepared during the planning phase, helps the third-party assessment agency to get an overview of the scheme and to check official procedure followed. There are many documents included in DPR, which can be classified following categories:
� Planning documents
� Design and financial statements
� Detailed estimates
� Structural design and sustainability documents
� Legal documents
� Other documents
Details and significance of each document discussed below:
Planning documents
A. Demand letter – This document should state that Gram Sabha held on a speci-fied date and more than 40% of voting population in the village was present and majority agreed for a new water supply scheme to be implemented in the village. This Gram Sabha resolution signed by villagers is also part of the DPR. The resolu-tion should be signed by the Deputy Engineer of the Taluka RWS department and Block Development Officer (BDO) as shown in Annexure 3B.1.
B. General report – It gives general idea about the village, such as location, rainfall, population, existing water supply and drainage facilities, necessity and outline of proposed water supply scheme.
C. Source assurance document – In case of ground water based sources, GSDA should suggest location and dimensions of the source. As shown in annexure 3B.2, GSDA suggested the well location for Vape RWS scheme which was about 150 m on the eastern side of the village; the dimensions of the well are 10 m in depth and 6 m in diameter and dimensions of one feeder bore well was also suggested in the document. Surface source assurance should be provided by related authority such as minor irrigation department, local municipalities (in case of tapping from their lines), etc.
Improving the Performance of Rural Water Supply and Sanitation Sector in Maharashtra53

D. Land acquisition document/ NOC – If for construction of any assets in the field, land owned by a private agency or any government department such as forest department, railway, etc. is to be used, then NOC for acquiring the land should be taken prior to implementation of the scheme. It can reduce the delay in scheme implementation due to future litigations.
E. Technical/ Administrative sanction – RWS schemes get technical sanction first and then should get administrative sanction. Depending upon the cost of the scheme, different authorities give technical and administrative sanctions. These approvers are shown in Table 3B.1. As the estimated cost of the scheme was below Rs.50,00,000, the technical sanction accorded by the Executive engineer of rural water supply department and administrative sanction by the Gram Sevak are required. It should be also signed by VWSC president these details are marked in annexure.
F. Village Water and Sanitation Committee (VWSC) and Social Audit Committee (SAC) – VWSC should contain at least 12 members and at least 50% should be females. VWSC is to be involved in water supply scheme from planning to entire life of scheme. SAC should have at least one third female members. They should have requisite educational qualifications. Financial audit of executed work is main function of this committee. There are 6 female members out of 11 in VWSC and 2 female members out of 5 in SAC these are marked in Annexure 3B.3 and 3B.4.
G. Photo copy of bank passbook of VWSC – VWSC has to open account in any nationalized or co-operative bank, prior to start of scheme execution. Bank account should be in joint name of VWSC president and secretary.
Table 3B.1: Authorities providing sanction depending upon budget of scheme
Sr no
Scheme Budget Administrative approval Technical approval
1. Independent rural water supply scheme
or
Single village scheme (SVS)
Up to 50 Lakh Gram Sabha Executive Engineer
2. 50 Lakh to 2 Crores District Water Management Committee
Executive Engineer
3. From 2 Crores to 7.5 Crores District Water Management Committee
Superintendent Engineer
4. All above 7.5 Crores Water Supply and Sanitation Department
Chief Engineer
5. Regional Rural water supply scheme (RR PWS)
Up to 2 Crores District Water Management Committee
Executive Engineer
6. From 2 Crores to 7.5 Crores District Water Management Committee
Superintendent Engineer
7. All above 7.5 Crores Water Supply and Sanitation Department
Chief Engineer
Improving the Performance of Rural Water Supply and Sanitation Sector in Maharashtra54

Design and financial statements
A. Design statements – There are 7-8 statements; number is not fixed. First two statements are about population projections and demand estimation. This is followed by a few design statements, concerning ESR capacity, trench gallery, economical diameter of rising main, pumping machinery calculation, distribution network design, etc. All design variables and final dimensions or capacities of the assets so designed are obtained from these documents.
B. Financial statements – there are 4 financial statements in the DPR: annual mainte-nance and repair charges statement which in practice estimates annual operation charges, annual repair estimate, financial forecast, and recapitulation sheet.
� Annual maintenance and repair charges consist of establishment charges, electricity charges and expenditure incurred for purchase of chemicals annually for scheme.
� Annual repairs statement consists of depreciations, maintenance and repair costs of all assets. The cost of depreciation, maintenance and repair cost for each asset are fixed in percentage terms; summation of these gives total annual repair charges.
� Financial forecasting – Total revenue collected from the scheme should be greater than total financial burden on the scheme. Revenue is collected from households in the form of water tariff; the tariff depends on total population benefited by the scheme and total financial burden. Total burden on scheme is summation of annual M&R charges and annual repair charges.
� Recapitulation sheet – This statement gives idea about total budget of scheme. To prepare a cost estimate for each asset, the supervision charges, contingen-cies, estimation and survey charges are added in this sheet.
Detailed cost estimates
Abstract sheet and measurement sheet of each asset according to design document is part of detailed estimate. Item-wise cost break up is given in the cost estimates. Rate of all civil, mechanical and electrical activities are taken from District Schedule Rate (DSR) issued by Maharashtra Jeevan Pradhikaran (MJP) for each region.
Schematic diagram
This provides overall picture of scheme; all assets are shown in it along with covered habitations. This flow diagram shows from where and how the water flows (as shown Figure 3B.1).
Survey maps
Survey map should consist of village/ habitation locations for the whole geographical coverage of the scheme with road layout and a few important locations (e.g., School, Temple, etc.). The locations and elevations of all key assets such as source, ESR, all nodes in distribution network should be noted and the distribution pipe network layout with their dimensions should be furnished. Survey map helps us understand the correct layout of pipes.
Improving the Performance of Rural Water Supply and Sanitation Sector in Maharashtra55

Structural design
Structural design of assets such as ESR, well, pump house is required to make them structurally sound. The structural design of assets should be carried out depending upon site condition and loading and should be verified.
Sustainability documents
a) Yield test report – Yield test is carried to ensure source sustainability for designed life of the scheme in the case of underground sources. Though this is the most important test, it is rarely carried out. GSDA is responsible for carrying out yield test on request by the Rural Water Supply and Sanitation Department.
b) Material test report – Material test reports such as compressive strength of concrete, tensile strength of steel, quality of pipes, etc. are to be carried out during implementation to ensure good quality of materials used. All tests should be carried out from government engineering/polytechnic collages or from govern-ment laboratories and their reports should be present with DPR.
Figure 3B.1: Schematic flow diagram
Pump House
Old ESRParshuram Nagarand Village area Sherepada
ROAD
BHATSA
RIVER
Jackwell
Bazar Area Shelarpada
Dalvipada
Govind Nagar
Trimbak Nagar
Pump
Valve
Rising Main
Distribution Line
Legend
New ESR
Improving the Performance of Rural Water Supply and Sanitation Sector in Maharashtra56

Legal documents
a) Tender notice and documents – Implementing agency (mostly VWSC) floats tender notice for their scheme in local newspapers. The work order is awarded to selected contractor by the implementing agency.
b) Work order – Work order is issued by implementing agency to the contractor. It specifies budget and timeline of scheme implementation. The sample work order shown in Shows this work order was given by Gram Panchayat to contractor with time duration and cost mentioned on it.
c) Agreement – A legal agreement between implementing agency and the contrac-tor is executed. Terms and conditions of the contract, duration of work execution, penalties in case of delays, etc. are mentioned in this agreement.
Other documents
a) Measurement book – Measurement book is not a part of DPR, but to verify finan-cial status of a scheme MB for the work executed should be available prior to third-party inspection.
b) Completion report – Once the trial period for operation and maintenance is over, prior to the handing over of the scheme to the Gram Panchayat a completion report should be submitted by contractor to implementing agency according to NRDWP guidelines.
Improving the Performance of Rural Water Supply and Sanitation Sector in Maharashtra57

Secondary data
Main sources of secondary data are census data and NRDWP websites (Figure 3B.2).
C. Census data – Population of previous decades is obtained from census. Census libraries have data from 1951 onwards which are helpful to project future popula-tion and help cross verify given data in DPR.
D. NRDWP site – This site gives details of water supply sources available in habita-tions and their current status (functional, non-functional, and ongoing). This site also comments on quality of water. This site gives details at habitation level for every habitat in the village.
Figure : NRDWP website / 3B.2.2 Field visit activity
Improving the Performance of Rural Water Supply and Sanitation Sector in Maharashtra58

3B.2.2 Field visit activity
Pre-field visit activity
Prior to the field visit, some spade work is done in the office such as study of DPR and noting down key points. To check compliance of assets dimension/ capacities with DPR, all items in DPR should be noted down in the template prepared for the purpose. TDSC has prepared different templates:
E. Infrastructure template – This captures dimensions/ capacity of all assets and their current status.
F. Operation and maintenance template – This has information about supply and pumping hours, zones, etc. actually carried out in ground.
G. Service level – this captures information about average LPCD, distribution, coverage, etc.
H. GP information – Actual number of household connections, tariff structure, recovery, etc.
I. These templates are attached in Annexure 3B.1.
Field visit
Field visit is the actual verification of implementation of the scheme and the most crucial step in assessment. Different activities carried out in field are divided into following sections:
J. Physical assets verification
K. Operational activities
L. Service level verification
M. People’s Feedback
The details of each of these activities are given in subsequent subsections.
Physical asset verification
Physical assets to be verified are the source, rising main, pumping machinery, pump house, ESRs, and distribution network. TDSC proposes to verify physical assets based on on-site inspection alone and does not propose to carry out any structural testing.
I. Key point assets – Source, ESR
II. Key line assets – Pipe lines
Improving the Performance of Rural Water Supply and Sanitation Sector in Maharashtra59

I. Source
Verify dimension and sustainability:
� In case of wells, depth and diameter are measured with measuring tape as shown in Figure 3B.3. Water column available is also measured.
� In the absence of yield test report/ source sustainability document, source sustain-ability is verified by asking villagers or rough guess is given by auditor if water column is measured during summer months.
Figure 3B.3: Measuring dimensions of well
Pump house and electric connection:
� Visual verification of construction status and dimensions of pump house against specifications in DPR.
� Properly placed panel board inside pump house as suggested in estimate (electric meter, starter voltmeter and ammeter)
� Verify type of electric supply (3 phase/1 phase) provided and if it is sufficient.
Pumping machinery:
� Verify technical specifications such as capacity and type of pump. Verification can be done as follows
� In field, we can read the name plate of the pump on which the capacity, type and total head are mentioned. This should be placed inside pump house as a good practice but is not followed in general.
Improving the Performance of Rural Water Supply and Sanitation Sector in Maharashtra60

� Pumping machinery specification can be verified through purchase register, in which all purchase bills with its specification are maintained in record.
� If above options are not available, then we can confirm by asking from key informants such as engineer, VWSC members, Gram Sevak, operator, etc.
� One of the best ways to verify pumping machinery capacity is to verify from electricity bill in case of operational schemes. On electricity bill, sanctioned load for meter is given from which we can verify capacity of pump.
� Verification of proper support structure at top and bottom of pumping machinery; in many cases only top support is provided. In case of absence of bottom support, pump can be displaced leading to its damage.
� If stand by pump is established in field and whether it is operational.
� Whether non-return valve is placed at correct location and is functional; if it is not provided or non-functional then it can damage the pump.
Storage reservoirs (ESR/ MBR/ GSR/ Sump):
� Generally, the capacity of storage reservoir is mentioned in DPR but dimensions are not. Hence, to get capacity in field dimensions of tank are measured. Staging height of ESR should also be verified.
� Visual verification of the construction status and structural defects is carried out.
� It is necessary to observe whether inlet, outlet and overflow pipes are provided; and whether overflow pipe is properly connected to outlet pipe and wash-out valve is provided for cleaning.
Rising main/ Distribution main:
� Measurement of the pipe network length is not carried out; we should trace the path of rising main and distribution network using Google Earth (as detailed below). If the physical path along the pipeline is easily accessible, following tasks can be done:
� We may excavate and check the diameter of the pipe at some key locations since most of the entire pipe would be underground.
� We can verify position and number of valves placed in the pipe line, especially in the distribution main. Valve position should also be marked in the distribution network.
� During length verification, any visible leakages shall also be noted.
II. Length verification using Google Earth
� GPS essential tool, preinstalled on android mobile with a good GPS sensor is used to mark position of important points on Google Earth.
Improving the Performance of Rural Water Supply and Sanitation Sector in Maharashtra61

� Go to GPS essential tool, click on tool and then click on all streams.
� Next step is click on ‘+’ in all streams, new window opens, add name of scheme here
� Then click on ‘+’ and by using way point, add location of asset/point name it and subsequently add other points. Tracking can be enabled to mark the path along which we walk, which approximates the pipeline.
� After returning from the field, extract file in *.kml format from GPS essential tool, to open it into Google Earth. to extract file in kml format go to all streams in GPS essential tool, select saved file and click on export option (shown in Figure 3B.4), in the upper corner of window there are three dots click on it, there is export option. Export this file to your mail address and then download.
� Open the file in Google Earth, all points marked in field will be visible on Google Earth, go to add path option and join the path between two points. Provide name to this path. The tracked path is also visible, but it need cleaning for any detours and double trips made.
� To measure length, click on properties - measurement, you can measure length. Another way to measure length is right click on path and then click on Show eleva-tion profile which shows total length of path as shown in Figure 3B.5.
Figure 3B.4: Screenshot showing exporting file from GPS tool
Improving the Performance of Rural Water Supply and Sanitation Sector in Maharashtra62

Operational activities
Operations carried out in scheme are very important part in case of functional scheme. Operation schedule is not part of planning, so there is no consistency in operation. So in most of the cases depending upon requirement, pump operator carries out operations
Data to be collected in field regarding operation phase:
� Having sufficient number of operators provided with adequate salary is very important for proper functioning of scheme.
� Information regarding actual pumping hours and supply hours should be collected from operator of the scheme.
� Valves present in distribution network and the point of time and duration they are operated in an area helps to understand number of zones in the scheme.
� General operation data of Sapgaon RWS scheme is shown in Table 3B.2, it shows there are total 6 zones, total 18 hours of pumping and 9.5 hours of supply.
Figure 3B.5: Measuring length trough elevation profile
Table 3B.2: Operation information of Sapgaon RWS Scheme
General Operation Information
Operation Old ESR New ESR
Total Pumping Hours to ESR in on day 7 hours 11 hours
Hours required to fill tank 2 hours 3.5 hours
Number of Zones 2 5
Supply hours to each Zone Zone 1 - 1 hr. Zone 1 - 2.5 hr.
Zone 2 - 1.5 hr. Zone 2 - 1.5 hr.
Zone 3 - 2.0 hr.
Zone 4 - 1.0 hr.
Improving the Performance of Rural Water Supply and Sanitation Sector in Maharashtra63

Service level verification
It is part of operation phase. Service level delivery is ultimate goal of water supply scheme. Parameters verified during service level are as follow.
Coverage:
� Coverage means all areas of village/ habitation considered in planning are covered by distribution network. In case of water supply through stand posts, population served by each stand post should be more or less equal.
� It can be verified by comparing the actual distribution network laid on ground against planned network. In many cases distribution network is not laid as per plan. Hence the coverage can be studied by physically verifying the distribu-tion network.
� Only actual functional distribution lines are considered while non-functional lines are not part of coverage.
� For example, in the case of Kinhavali RWS scheme shown in Figure 3B.6, the distribution system of the old scheme was used in the new scheme and few new distribution lines were suggested in DPR. Blue lines show newly laid and functional line and black dotted lines are existing pipelines in the distribution network. But not all new lines were laid (shown in red color) and those which were laid line (shown in green color) are not functional. These all results poor coverage of scheme in village.
Quality:
� Quality of water is an important aspect, in many schemes only TCl is added as disinfectant, no other treatments are provided.
� Visually we verify if water is clean or muddy. In the case of surface sources, reduction in turbidity is required so that people accept the water.
� If water is visually not good and has odour, then easy water quality test should be conducted (Jaldhara kit) and accordingly treatment is suggested.
� After completion of source work, detailed water test should be carried out and that report should be part of DPR.
� People’s perception should be taken into account, weather they used the water for drinking purpose or not, and whether there are any issues with the quality of water such as salinity, contamination, etc.
Accessibility:
� All households in the village have more or less equal access to the source in terms of distance.
� In case of household connections, people with poor liability should be provided with adequate number of stand posts.
Improving the Performance of Rural Water Supply and Sanitation Sector in Maharashtra64

Quantity:
� Quantity can be defined in terms of actual amount of water supplied in LPCD
� This can be estimated in following way
� First measure initial water depth in storage reservoir then pump water for 10 minutes and then measures final water depth.
� Calculate in the change in storage in the reservoir in 10 minutes.
� Storage change in the reservoir = (final water depth – initial water depth) X area of storage reservoir
� Calculated volume of water supplied per minute (Q)Actual LPCD supplied = Q*Total pumping hours X 60 / Current population
Equity:
� Equity in water distribution can be expressed in terms of the extent of varia-tion in the average amount of water obtained amongst households. Lower the variation, higher the equity in water distribution
� To measure equity, flow rates at sample households can be measured. Two to three houses from each zone should be selected as sample households, mostly houses at tail end of zone.
� Flow rates are measured by using a known volume of utensils, time taken to fill utensil is measured.
� Flow rate= Volume/ of collection
� Amount of water collected = Flow rate *Supply hours
� Flows were measured at a few households in Borsheti RWS schemes in two zones. Table 3B.3 shows difference in water quantity and Borsheti kh zone get less water as compare to Borsheti Kh.
Figure 3B.6: Existing distribution network of Kinhavali village
Shivaji Nagar
ESR
Bhanu ali
Gurunath Nagar Bazar Area
Ambedkar Nagar
Bramhanali
Main Road
Legend
Existing linesNewly laid linesNot laid linesNewly laid but not functional Lines Valves
Improving the Performance of Rural Water Supply and Sanitation Sector in Maharashtra65

Community’s feedback
The overall socio-economic feasibility of the scheme will have to be assessed. This will include an informal assessment of the ability to pay and the overall financial health of the local body. It will require interactions with village residents, elected members and other stake-holders.
3B.2.3 Data analysis
Analysis of data is intermediate and important step between data collection and report writing. Analysis is done phase wise.
Verification of plan and design
In order to ensure proper coverage, and smooth operation and sustainability of the scheme, sound planning of the scheme is essential. The required planning documents are checked in the assessment of DPR. Although some of these documents are proce-dural documents (e.g., Gram Sabha resolution, VWSC, etc.), they have a great impact on running and sustainability of the scheme.
� All required planning documents (mentioned in a section above) are checked.
� In planning analysis, we verify whether some habitations are excluded from the scheme or some areas are not considered in planning, and if so whether such areas are covered by some other schemes. We can do this using secondary data (NRDWP).
� Norm adherence of VWSC, SAC and people presence in Gram Sabha, etc. are followed.
� Site selection for assets is correct.
� All correct and precise maps are present in DPR.
Table 3B.3: Flow measurement at households
Sr. No. Location Name Utensil size(Liters)
Time(Seconds)
Flow (lps) Water in 60Min (Liy)
1 Borsheti BK Punclik Wekhande 4 18 0.22 800
2 Borsheti BK Gurunath Jadhav 10 28 0.35 1285
3 Borsheti BK Santaram Wekhande 10 26 0.38 1385
4 Borsheti BK Sitaram Inchatc 20 34 0.50 2117
5 Borsheti BK Kaluram Jadhav 10 21 0.32 1161
6 Borsheti BK Ramdev Bhagre 5 27 0.18 666
7 Borsheti BK Ramesh Bhagre 3 18 0.16 600
8 Borsheti BK Nilesh Bhagre 3 14 0.21 771
Improving the Performance of Rural Water Supply and Sanitation Sector in Maharashtra66

Hydraulic design of various assets is given in the DPR; the RWS scheme design is verified to see whether the design variables for different assets are correct or not (Table 3B.4).
� Adherence to norms pertaining to different design parameters such as per capita demand, residual water pressure, maximum head loss, etc. is checked first.
� Source: Documents related to source sustainability, such as availability of the yield test report from GSDA (for groundwater water source), and water quality reports are verified.
� Population verification: Method of population projection, forecasting year and figures of estimated population are verified.
� Demand verification: Average LPCD considered as per norm and 15-20% water losses considered in demand calculation.
� Rising Main and distribution network: Using Jal Tantra software we check the choice of pipe diameters of the distribution network and match it with the existing design.
� EPANET software can be used to verify the design parameters such as pressure and flow rates in the pipe as per the delivery schedule to ensure that the quality-of-service requirement is met.
� Pumping Machinery: Pump specification is checked against the desired flow rate.
� Storage Tanks: Capacity of the MBR/ ESR/ GSR is checked against the design population, and peak factor norms.
Design Component Dimensions From DPR From Design Verification
Remarks
Population forecasting Year 2030 1650 1643 Average of incremental increase and geometric method
Demand MLD 0.0759 0.076
Raw water Pumping Machin-ery
BHP 3Hp 5Hp Actual Length of rising main is more than planned length, so capacity and head increased
Total Head 38m 46m
Pump flow rate 2.9 2.76 lps
Raw Rising Main Diameter 65mm 65mm Length of rising main 510m
Storage Tank Volume 38000 liters 38000 liters
Distribution Main Diameter Range and respective length
80mm - 36m
65mm - 30m
50mm - 931m
80mm - 30m
65mm - 202m
50mm - 729m
Design verification is done through JalTantra
Table 3B.4: Asset design details of Vape RWS scheme
Improving the Performance of Rural Water Supply and Sanitation Sector in Maharashtra67

Implementation analysis
� Design adherence in executed work as per planning in DPR is to be verified. In Table 3B.5, DPR dimensions and field dimension and remarks are shown this table gives an idea about the deviations encountered in the case of Vape scheme.
� Effect of deviation of assets on scheme such as change in distribution network shown in figure 13, some area not getting water, etc. is checked.
� Physical progress in execution of the scheme against time line, to comment on delays.
� Whether overall status of asset is good or poor and its utility purpose.Table 3B.5: Physical assets details
Asset Name Dimensions From DPR/ Structural Design
From Field Visit Remarks
Source
(Well)
Diameter 6m 7.7m Okey
Depth 10m 8.6m
Water Column - Silt removal sas going on
Pumping Machinery BHP 3 Hp 7.5 Hp Higher Capacity Pumps are Placed
Pump Type Submersible Submersible
Standby 1 1
Pump flow rate -
Pump House Dimensions 2.5 m*2.5 m*3.0 m
2.5 m*2.3 m* 3.0 m
Material Burnt Brick Masonry
Burnt Brick Masonry
Rising Main Length 210 m 556 m Length Measured using Google Earth
Diameter 65 mm 65 mm
Meterial GI medium class GI Medium class
Storage Tank (ESR) Length x width - 3.3m*3.3m
Depth + Free Board
- 3.4m + 0.5m
Valume 38,000 liters 37,026 liters
Staging Height 12 m 12 m
Distribution Network Diameter (mm) - Length (m)
80mm - 36m
65mm - 30m
50mm - 931m
80mm - 00m
65mm - 75m
50mm - 590m
Length Measured using Google Earth
Material GI Medium Class GI Medium Class
Improving the Performance of Rural Water Supply and Sanitation Sector in Maharashtra68

Service level analysis
� Coverage – Verification on coverage whether fully covered, partially covered or no coverage from collected data.
� Quality – Water quality status should be decided from water quality related documents in DPR and data collected from field.
� Equity in water supply – Average amount of water obtained by households, differ-ence in flow rates and amount of water in different areas, and possible reasons for these differences.
� Quantity – If two or more ESRs are part of a single scheme then calculate average lpcd supplied from each ESR and comment on it.
Table 3B.6: Annual expenditure and recovery of scheme
Sr. No. Heads From DPR (Rs) Calculated (Rs)
i Annual M&R Charges 104773 60955
ii Annual repairs 168197 168197
1 Total annual burden 272970 229152
i Taxable Houses 330 0
ii Revenue from general cess 83160 0
iii Revenue from household connections 189860 0
2 Total Revenue 273020 0
Operational analysis
� Though currently there is no operational schedule in planning, some assump-tions are made concerning pumping hours in rising main and pump design, supply hours in distribution network design, per capita demand for demand estimation. We verify these components in actual operation such as actual hours of pumping, tank filling time, supply hours to habitations, zoning as per plan, etc.
� Actual expenditure and revenue from water tariff are estimated to examine the financial sustainability of scheme.
� Actual water tariff and actual number of household connections give idea about total recovery potential from scheme (as shown in Table 3B.6)
Improving the Performance of Rural Water Supply and Sanitation Sector in Maharashtra69

3B.2.4 Reporting structure
Reports are final outcomes of assessments; these are finally submitted to CEO, Zilla Parishad. Our report structure gives phase-wise and overall idea of scheme. Report is divided into sections and these are as following.
Introduction
As in any standard report, this is the first section of the TDSC third-party assessment report for Rural Water Supply Schemes. This outlines the basics of the audit and the scheme. The sub-sections are as follows:
Project background
Project background is elaborated in this section, background about empanelment of institute as a third-party auditor, reference of GR, etc. are mentioned in this section.
Objective of technical audit
All objectives of technical audit should be mention here, as defined in the proposal and agreement based on the GR.
Assessment methodology
Main assessment steps should be mentioned here, a methodology comprising data collection, field visit activities and data analysis. A detailed methodology should be part of the proposal document, and is not needed here.
Scheme overview
General location details of scheme, scheme sanction data, capacity of scheme, etc. are elaborated in this section.
Scheme description
Information about previous schemes in the village and current sanctioned scheme is given in this section. How the current scheme is to be in field as per planning and designing of scheme, with schematic flow diagram, is described in this section.
Site visit details
Site visit dates, its purpose, findings and details of different persons we met during visit should be there in site visit details.
Evaluation of scheme planning
Data collected from DPR and field related to planning and design phase and its analysis is described in this section.
Improving the Performance of Rural Water Supply and Sanitation Sector in Maharashtra70

List of documents from DPR
In order to check official procedure for demanding the scheme, utility of material, and source sustainability, different documents to be verified from DPR such as demand letter, material and water quality testing reports, etc. are listed here. Comment on presence/ absence and deviation from norms in these documents are given here.
Planning verification
In order to have proper coverage, sustainability and operation, the first step in designing any scheme is the planning. All findings pertaining to schemes planning are mentioned in this section.
Design verification
Hydraulic design of various assets is given in the DPR; through design verification it is verified whether the given design details of various assets are correct or not. If the given design is incorrect, then correct design documents should be attached to report as annexures.
Evaluation of scheme execution
Physical asset verification
Deviation from design during implementation is mentioned in this section. A tabular representation of physical attributes of the assets as obtained from the DPR and from the filed visit is shown; this gives clarity of deviation in implemented work from planned.
Asset summary
In above section, only dimensions/ parameters details are given, details about construction status, defects and any stakeholders, comments regarding those assets are given in this section. Detail description of each asset with photographs is given in this section
Operation Evaluation
Data collected on operation and financial status of the scheme gathered from the DPR and field visit is presented in this section.
Operation of scheme
Data related to scheme operation such as operating hours of scheme, supply hours, total demand, etc. collected from the field and its analysis are presented in this section.
Serviceability of scheme
Serviceability parameters are not mentioned in DPR, analysis of data collected from field regarding coverage, quality, and equity in water distribution should be presented in this section.
Improving the Performance of Rural Water Supply and Sanitation Sector in Maharashtra71

Financial status of scheme
Cost of each asset from DPR and MB records is collected, so as to comment on the financial status. Comment on financial sustainability of scheme is made by analyzing actual operation related data.
Findings
Finding is an important section of report; all major concerns of above sections are synthesized in this section. These findings are categories in subsections as per prefer-ence - either phase wise or any other way. TDSC categorizes findings in three subcat-egories, viz., documents and design, assets and operations.
Success indicators
Phase-wise scores and final score of Success indictors is mentioned in this section along with score interpretation. The details and interpretation of success indicator is also given
Recommendations
Certain recommendations, based on the findings from field inspection and what seems feasible in the remaining implementation cycle are suggested in this section to improve efficiency of scheme. Any major flaws which risk the sustainability of the scheme are also mentioned here.
Bibliography � Rural Water Supply Department Zilla Parishad.(2013-14).Annual action plan.
� Technology & Development Solution Cell, CTARA IIT Bombay.(2016-17).Reports of third party technical evaluation of rural water supply schemes in Palghar district, Maharashtra. Mumbai: CTARA IIT Bombay.
� Technology & Development Solution Cell, CTARA IIT Bombay.(2016-17).Reports of third party technical evaluation of rural water supply schemes in Thane district, Maharashtra. Mumbai: CTARA IIT Bombay.
� Water Supply and Sanitation Department.(2000). Implementation of revised guidelines for rural water supply programme in the state. Govern-ment Resolution No: Gra.Pa.Dho.- 1099 / Case No.328 / Pa.Pu.-07, Dt. 27 July 2000. Mumbai: WSSD, Government of Maharashtra.
� Water Supply and Sanitation Department.(2015). Guidelines for the third party technical inspection for rural water supply schemes. Govern-ment Resolution No: Gra.Pa.Dho.- 1114/ Case No.61 / Pa.Pu.-07, Dt. 15 June 2015. Mumbai: WSSD, Government of Maharashtra.
Improving the Performance of Rural Water Supply and Sanitation Sector in Maharashtra72

The document describes the location of a well and its technical specifications to be incorporated in order to use the well as a source for the Vape piped water supply scheme in Thane district. As per the technical information collected through ground water survey in Vape village, it is recommended that the source well should be located in the private land owned by Mr. Maruti Katsekar, at a distance of 150 m East of the Vape Gaothan. Dimensions of the new well are specified as 6 m in diameter and 10 m in depth.
Remarks mentioned in documents are:
01. A feeder bore of diameter 115 mm and depth 15 m should be constructed on well location, prior to excavation of well.
02. After excavation, yield of well should be tested.
03. Source strengthening work should be carried out in catchment area through channelizing run-off in to well.
04. Controlled blasting would be needed for building this well.
The document issued and signed by Assistant Geologist (of Groundwater Survey and Development Authority, GSDA) of Rural Water Supply Department.
Annexure 3B.1
Technical Recommendation Letter for Sub-Surface Groundwater Based Source Selection for Piped Water Supply Scheme
Improving the Performance of Rural Water Supply and Sanitation Sector in Maharashtra73

Improving the Performance of Rural Water Supply and Sanitation Sector in Maharashtra74

This is a letter documenting the process followed for the decision to demand/request for a piped water supply scheme in Dudhani village, Taluka Bhiwandi, District Thane.
Details of the letter are as follows,
01. A Gram Sabha was held on 26th July 2013 where more than 40% villagers were present.
02. Per capita water availability from different sources in the village is below the per capita government norm.
03. After consideration of different options Gramsabha decided to formally request for the proposed scheme.
This document is submitted to Zilla Parishad for inclusion of scheme for this village in budget of the annual action plan.
The letter is signed by the Deputy Engineer (in this case, Bhiwandi) of Rural Water Supply Department, Block Development Officer.
Annexure 3B.2
Letter Certifying Decision of Gram Panchayat for a Water Supply Scheme
Improving the Performance of Rural Water Supply and Sanitation Sector in Maharashtra75

Improving the Performance of Rural Water Supply and Sanitation Sector in Maharashtra76

This document lists the names and designations of members of the Village Water and Sanitation Committee (VWSC) of Vape village. This committee has 6 women members (highlighted in the figure), out of a total of 11 members. NRDWP guideline suggests at least 50% women representation on the VWSC.
Annexure 3B.3
Composition of Village Water and Sanitation Committee
Improving the Performance of Rural Water Supply and Sanitation Sector in Maharashtra77

This document lists names, designations and qualification of Social Audit Committee (SAC) members. This committee has 2 women members (highlighted) out of total 5 members. (NRDWP guidelines suggest that at least 1/3rd women representation on the SAC).
Annexure 3B.4
Composition of Social Audit Committee
Improving the Performance of Rural Water Supply and Sanitation Sector in Maharashtra78

This document details the technical sanction of the piped water supply scheme of Vape village (Taluka Bhiwandi). The letter is addressed to the President /Chairperson of the VWSC and is signed by the Executive Engineer of the Rural Water Supply Depart-ment, Thane. Details of the technical sanction are as follows:
01. All terms and conditions for piped water supply scheme were fulfilled according to terms mentioned in government circular Kra.GraPaPu-1005/PrKa 74(2)PaPu issued on 2nd May 2005 by Maharashtra government and the proposed scheme is provided with technical sanction.
02. Technical sanction is provided for estimate and plans of Rs 40,98,049.
03. Scheme implementation should be as per terms and conditions mentioned in government resolutions dated on 17th March 2010 and 30th August 2010.
04. Administrative sanction should be obtained from Gram Panchayat and VWSC, after technical sanction as per mentioned in government resolutions dated on 2nd
May 2005.
05. Proposal is provided technical sanction based on the document Kra./Tha JiP/PaPuVi/Pi.Bi.-3/Bi.Aa./106 dated on 13th November 2013.
06. Sanctioned piped water supply scheme should be completed within 24 months (including rainy season) from the date of first installment paid to VWSC.
07. VWSC should note that the village should be open defecation free prior to demand-ing second installment.
08. Third party should carry out testing of pipes, before implementing the scheme.
09. Water quality should be tested from district laboratory before civil work of well is carried out.
10. Budget should be distributed against work evaluated by sub division.
11. Administrative sanction and first installment of proposal should be raised within 10 days from date of technical sanction.
12. E-tendering for assets of scheme should be as per guidelines given in Govern-ment Resolution (GR) dated on 17th March 2010.
Since estimate of the scheme was less than Rs. 2 crores, the proposal was evaluated for technical sanction by the Executive Engineer (RWS). For estimates more than Rs. 2 crores the proposal will either be evaluated by Superintending Engineer of the region or Chief Engineer of Water Supply and Sanitation Department (based on estimates).
Annexure 3B.5
Technical Sanction for Piped Water Supply Scheme
Improving the Performance of Rural Water Supply and Sanitation Sector in Maharashtra79

Improving the Performance of Rural Water Supply and Sanitation Sector in Maharashtra80

Improving the Performance of Rural Water Supply and Sanitation Sector in Maharashtra81

Annexure 3B.6
Administrative Sanction of Piped Water Supply Scheme
This letter is from the VWSC and the Gram Panchayat providing administrative clear-ance to the scheme. This order is signed by the President, VWSC and Gram Panchayat representatives (Gramsevak and Sarpanch). In this sample order, only Gramsevak’s signature is present.
Improving the Performance of Rural Water Supply and Sanitation Sector in Maharashtra82

Scheme details
Visit Details
Verification of scheme assets Trench gallery
Scheme Name
Taluka and District
Sanction Year Phase of audit
Source
Habitations covered
Scheme capacity
Technical approval date Administrative approval date
Work Order date Time limit
Total Budget estimate Budget spent
Implementation agency (GP/Zila Parishad/MJP/VWSC)
Date of Visit
Auditor name
Junior Engineer
Scheme Contractor
Data From DPR From Field visit Remarks
Length
Diameter/ width
Pipe material
Construction Compo-nent
Status Condition Remarks
Excavation
Structure
Annexure 3B.7
Template for Infrastructure Related Data Collection
Improving the Performance of Rural Water Supply and Sanitation Sector in Maharashtra83

Well
Raw Pumping machinery
Raw Water Rising Main
Data From DPR From Field visit Remarks
Well location/Distance from MBR
Dimensions(Diameter, Height)
Water column
Data From DPR From Field visit Remarks
BHP
Pump type
Stand by
Rate of Pumping
Head
Data From DPR From Field visit Remarks
Start point
End point
Length
Diameter
Material
Pressure rating
Construction Component Status Condition Remarks
Pump erection
Support Structure
Valve + key water structure Pressure gauge)
Construction Component Status Condition Remarks
Excavation
Pipe laying
Valve + jointing
Construction Component Status Condition Remarks
Excavation
Structure
Plaster
Improving the Performance of Rural Water Supply and Sanitation Sector in Maharashtra84

WTP
Pure Water Rising Main
Data From DPR From Field visit Remarks
Location
Capacity
Type
Data From DPR From Field visit Remarks
Start point WTP
End point ESR
Length 30 m
Diameter 125 mm
Material GI medium class
Pressure rating NA
Construction Component Status Condition Remarks
Excavation
Pipe laying
Valve + jointing
Construction Component Status Condition Remarks
Foundation
Tanks
Pumping + other mechanical arrange-ment
Improving the Performance of Rural Water Supply and Sanitation Sector in Maharashtra85

ESR
Data From DPR From Field visit Remarks
Type of tank
Location
Capacity
Staging height
FSL, BSL, GL
Material
Construction Component Status Condition Remarks
Foundation
Column
Bottom slab
Top slab
Water connection
Construction Component Status Condition Remarks
Pump erection
Support Structure
Valve + key water structure (Pressure gauge)
Pure water Pumping machinery
Data From DPR From Field visit Remarks
BHP
Pump type
Rate of Pumping
Head
Improving the Performance of Rural Water Supply and Sanitation Sector in Maharashtra86

Distribution System
Data From DPR From Field visit Remarks
Length
Diameter Range
Material
Pressure rating
Minimum terminal head
No. of stand posts
Habitation covered
Construction Component Status Condition Remarks
Excavation
Pipe laying
Valve + jointing
MSEB Connection
Data From DPR From Field visit Remarks
Distance from existing MSEB electric pole
Separate Transformer
Construction Component Status Condition Remarks
Transformer
Addition line laying
Electricity connection
Improving the Performance of Rural Water Supply and Sanitation Sector in Maharashtra87

General operation information
Flow measurement at ESR
Flow rate measurement at household (From each zone at least one household)
Total Pumping hours to ESR in one day
Hours required to fill tank
Number of zones
Supply hours to each zone Zone 1
Zone 2
Zone 3
Annexure 3B.8
Operation and Service Level Data Collection Form
Location of ESR Dimensions (m)
* Initial water level in tank at (m)
Final water level in tank (m)
Time (minutes)
Flow rate at inlet (lpm)
Sr. no Location/Zone Consumer name
Utensil size (liters)
Time (seconds)
Flow (lps) Total Water (lit)
1
2
3
4
5
6
*Water level in the tank is measured from top of the tankFlow rate = (initial level – final level)* area of tank*1000/TimeThis activity will helpful when continuous pumping and supply carry out
Improving the Performance of Rural Water Supply and Sanitation Sector in Maharashtra88

Instructions:
� On the day of third party inspection following persons should be available: Water supply engineer, Sarpanch, VWSC members, social audit committee members, Gramsevak, Jalsurakshak, Gram Panchayat clerk and operator of the scheme.
Documents expected from Rural Water Supply Department, Zilla Parishad
No. Documents Remarks
1 Network maps / summary file / key maps
2 Structural Design of civil structures ( Pump + WTP + ESR)
3 Structural design of WTP
4 Instalment report of all instalments (Pratham haptadeyak/Dusra haptadeyak )
5 Completion Report / measurement book (MB)
6 Electricity bills
Ensure that these documents are complete and ready on visit day.
For water supply schemes in operation
� Ensure that all ESRs/MBRs are filled and water supply is available in all habitations.
� Ensure that pump is started and tested during your visit.
For 60-70% Completed schemes
� Ensure that at least rising main and pump is functional.
Annexure 3B.9
Instruction Sheet for Gram Panchayat Office and Village Water and Sanitation Committee (VWSC)
TDSC, IIT Bombay
Improving the Performance of Rural Water Supply and Sanitation Sector in Maharashtra89

Current VWSC committee composition
Sr. No. Name Designation Habitation Caste
1
2
3
4
5678
9101112
Habitation data
Sr No Habitation Covered/not covered
Population Household Names of the streets which are not covered
1
2
3
4
5
Name Other details
President VWSC 2
Secretary VWSC 2
President VWSC 3
Secretary VWSC 3
Q1. Has VWSC changed since tendering of scheme, yes /No How many times?
Q2. Intermediate VWSC‘s details:
Q3. Has Gram Panchayat adopted any automation in operation (Yes/No) Give information
Q4. Has Gram Panchayat appointed operator officially (Yes/No)
Q5. What amount individual has to pay to get household connection?
Q6. Is Ferule/Plastic saddle has been used in household connection?
(Please fill this form and return it to auditor on same day)
Improving the Performance of Rural Water Supply and Sanitation Sector in Maharashtra90

Total number of Tap
Number of commercial Tap
Number of household tap
Number of stand post
Tariff for commercial Tap
Tariff for household Tap
Total revenue from Water
Last year Revenue(2015-2016)
Last year financial collection(2015-2016)
Current year Revenue(Till last month)
Current year financial collection (Till last month)
Electricity bill for current year(2-3 month bill)
Establishment charge(Salaries of operators )
Chemical cost of last year (TCL+ Alum)
Operating establishment cost(2015-2016)
Maintenance cost(2015-2016)
Total operating and maintenance cost(2015-2016)
Electricity Bill for last 2-3 Month
ALL MB record
Handover document
Yield test report + dewatering statement
Other operating & maintenance cost document
Latest payment status
Financial information of Scheme
Provide photo copies of following documents
Signature:
Gramsevak Name:
Date:
Improving the Performance of Rural Water Supply and Sanitation Sector in Maharashtra91

Purchase register of VWSC
Agreement between Contractor and VWSC
Tender document
Material test report
Show following documents on the date of audit
Above documents received
Signature:
Auditor Name:
Date:
Abovedocuments were shown
Signature:
Gramsevak Name:
Date:
Improving the Performance of Rural Water Supply and Sanitation Sector in Maharashtra92

3C.1 Introduction of Success Indicator
In the context of government programmes or schemes, success indicators are the crucial indicators which define whether a scheme and programme is successful or likely to succeed. As per Government Resolution No: Gra. Pa. Dho.- 1114 / Case No.61 / Pa.Pu.-07, Dt. 15 June 2015 success indicator should be of two types: a) fund based success indicator which are related to flow of fund, verification of work against fund spend, financial sustainability of scheme, etc. and b) other success indicators. We have made an attempt to develop the second type of success indicator which measures overall impact of a scheme along with financial performance.
The methodology proposed for developing the success indicator captures progress in implementation and impact of the scheme in question. It assigns a score depending on the scheme progress, i.e., for ongoing schemes and also for completed schemes. Scores are computed for each phase
Success Indicators for Rural Water Supply Schemes and Case Studies
Module3C
Measuring the Sustainability of the Scheme (Success Indicator Score) 100
Planning & design phase (28.5%)
Implementation phase (28.5%)
Operation & maintenance phase (28.5%)
Exit & handover phase (14.5%)
Documentation (20%)
Documentation (20%)
Documentation (30%)
Documentation (10%)
Planning (40%)
Design adherence (65%)
Institutional arrange-ment (10%)
Institutional provision (15%)
Design (40%)
Timely implementa-tion (10%)
Technical collabration (15%)
Financial sutainability (15%)
Best practices followed (5%)
Action for sustainability (45%)
Operation (20%)
Service level (40%)
Figure 3C.1: Indicators for measuring the scheme success at various stages
Improving the Performance of Rural Water Supply and Sanitation Sector in Maharashtra93

3C.2 Conceptual Framework
Success indicator final score is weighted average score of four phases of scheme. The value for each phase was computed as the product of weightage given to each component and the average score obtained for that component (shown in Figure 3C.1).
The decisions are structured into a hierarchy starting from an overall scheme sustain-ability to various phases of scheme execution, O & M and exit to work components within those phases. The objective is represented at the top level of the hierarchy, i.e. measuring the sustainability of the scheme, using a success indicator score. The marks are assigned to sub components and parameters which influence the success of the key work components.
Every rural water supply scheme has four phases:
A. Planning & design
B. Implementation
C. Operation and maintenance
D. Exit and handover
Success indicator framework is developed on the basis of these four phases which are as follows:
� Each phase is divided into work components; they are further divided into sub-components and sub-components into various parameters. This struc-ture is explained with example in Figure 3C.2. All these are elaborated in the next section.
Implementation � Phase
� Component
� Parameter
� Sub-Component (Physical/Nonphysical)
Designadherence
Rising main
Diameter
Figure 3C.2: Chart showing attributes of Success indicator structure
� Components, sub-components and parameters were decided based on previous experience. Documentation is theme of each phase as we found it’s important and weak in all phases.
Improving the Performance of Rural Water Supply and Sanitation Sector in Maharashtra94

� Weightages and marks for components and sub-components respectively were decided based on their importance in the execution of the schemes. These were determined with the help of practitioners in the drinking water sector and refined during their application.
� Realizing the importance of the component in each phase of the scheme, the score obtained for the component is given a weightage to calculate the total score for each phase. Now, to arrive at the overall score against the maximum marks of 100, the score obtained for each phase is multiplied by the weightage fixed for each component.
� First three phases are equally important compared to Exit & handover phase, so first three phases have equal weightage (28.5%) and exit & handover phase has less weightage (14.5%).
� Final success indicator score is arithmetic mean of all phases
3C.2.1 Marking to components
A. Marks are given to each parameter under a sub-component on Yes/No basis, which is converted into binary score, i.e., 1 or 0; equal weightage is given to each parameter under each sub-component.
� If parameter is present/ correct, then 1 else 0
� If parameter is not needed/ applicable, then it is kept blank and mark of compo-nent is divided amongst remaining parameters.
B. There are a few parameters in the success indicator sheet to which Y/N basis is not applicable; these parameters vary over a wide range. These parameters are given values on a 0-5 scale based on the performance.
3C.2.2 Planning and design phase
Planning and design is first phase of scheme execution. This phase is divided into three main work areas, i.e., documentation, planning and design (Table 3C.1).
Table 3C.1: Details of planning & design phase
Component Sub-Component Parameters
Documentation Planning general details Demand letter, GSDA letter, land acquisition letter, ODF document, etc.
Institutional arrangement VWSC, SAC
General design details Population forecasting, demand capacity of storage reservoir, economical design of rising main, etc.
Structural design ESR, WTP, well
Maps Key, survey, distribution network
Estimates Budget estimate, technical and administrative sanction
Planning Institutional norm adherence Composition of VWSC and SAC
Site selection For assets like source, ESR, WTP
Action for sustainability Source
Improving the Performance of Rural Water Supply and Sanitation Sector in Maharashtra95

Documentation
Documentation theme is divided in several components. These are as follows:
A. Planning general details – This consists of several documents required prior to planning, which should be submitted by the Gram Panchayat, such as demand letter, Gram Sabha resolution, existing water sources document, open defecation free document. We only check whether they are present or not.
B. Institution arrangement – Village water and sanitation committee and Social audit committee document; present/ absent.
C. General design details – design document for all required/ sanctioned assets such as trench gallery, rising main, water hammer, pumping machineries, storage reservoirs, distribution system, population forecasting and demand, WTP compo-nent, etc.
Planning
A. Institutional norm adherence - verify adherence
� Demand letter – Gram Sabha held for demanding new water scheme was attended by at least 40% voting population of village.
� Village Water and Sanitation Committee (VWSC) – It should contain at least 12 members and 50% should be females.
� SAC – This committee should consist of villagers with formal education and one third members should be female.
B. Site selection – Comments on site selection are made after field visit, such as any sustainable source in vicinity other than existing sanctioned source, any high altitude place is available in village other than existing one, and so staging height can be reduced.
C. Action for sustainability – In Gram Sabha, people take pledge that they are willing to pay operation and maintenance charges. Also, any action for sustainability taken or not such as construction of bandhara, trench gallery for surface based sources and rain water harvesting structure for ground water based source.
Design
A. Norm adherence –adherence to technical norms for fixing different design param-eters specified by various technical departments is to be examined. The norms concerning different parameters are as follow:
Component Sub-Component Parameters
Design Norm adherence Minimum pipe diameter, residual head, etc.
Key component design Storage reservoir, pumping machinery, etc.
Control measurement and safety Valves, pressure gauge, lightning protection of tank, voltage fluctuation of motor
Improving the Performance of Rural Water Supply and Sanitation Sector in Maharashtra96

� Per capita demand – =<40 lpcd
� Non-revenue water – 15-20% of demand
� Minimum diameter of rising main pipe - >= 65 mm
� Residual pressure head >= 5 m
� Maximum head-loss m/km < 10 m/km
� Staging height < 20 m
� Per capita investment – specified in following Table 3C.2.
B. Key component design – verifying design of every asset for technically correct-ness through verification procedure.
C. Control measurement and safety devices Valves, pressure gauge, lightning protec-tion of tank, voltage fluctuation of motor, if provision is given for these devices in detailed estimate, then input mark in sheet is 1, if not it is 0.
Table3C.2: Per capita investment
Area Per capita investment restriction according to GR dated on 18th May, 1996
Revised per capita investment rates
40 liters per capita per day (30% increase in rate specified in GR dated on 18 May 1996)
55 liters per capita per day (Rate of year 1996 * 1.5)
70 liters per capita per day (10% increase in rate of 55 LPCD)
For all regions of State except Konkan region
1. Hilly area 2120 2756 3180 3498
2. Piped water supply scheme having static lift greater than 30 m
1790 2327 2685 2953
3. Piped water supply scheme having static lift up to 30 m
1390 1807 2085 2293
Konkan region
1) Hilly area 2330 3029 3495 3844
2) Piped water supply scheme having static lift greater than 30 m
1970 2561 2955 3250
3) Piped water supply scheme having static lift up to 30 m
1530 1989 2295 2524
(Source: Government resolution by Water supply and sanitation department dated on 9th October 2013)
3C.2.3 Implementation phase
The work planned and implemented in field is marked in this phase. Planning and design adherence is important during implementation for the success of the scheme (Table 3C.3).
Improving the Performance of Rural Water Supply and Sanitation Sector in Maharashtra97

Documentation
It is verified whether all documents mentioned in Table 3C.3 are present in DPR or with officials (engineer, contractor, VWSC); if present a score of 1 is given, if not the score given is zero.
A. Legal documents – All legal document such as tender notice floated by executing agency (VWSC/ ZP/ MJP), work order given by executing agency with time line of execution, and agreement between executing agency and contractor are part of DPR.
B. Implementation schedule – It should be prepared by contractor before work execu-tion begins in field.
C. Purchase register – details of all purchases should be noted down in one register along with the original purchase bill. This book should be maintained by VWSC.
D. Measurement book (MB) records - This is not a part of DPR, but to verify financial status of a scheme, the MB of the already executed work should be available prior to third-party inspection. This record should be maintained by the Engineer in-charge of the scheme. 0-5 subjective score is given to this component, marks are given based on total % of MB record available of total works executed till the date of field visit
� 100% - 5
� 80-99% - 4
� 60 – 79%- 3
� 40 – 59% - 2
� 20 – 39% - 1
� <20% - 0
E. Water availability document – Yield test, which is carried out after excavation of source, in case of underground sources and documentation related to reservation in case of surface sources.
Table 3C.3: Details of implementation phase
Component Sub-Component Parameters
Documentation Legal documents Tender notice, agreement, work order
Implementation schedule
Purchase register
MB records
Water availability document Yield test/ reservoir reservation
Material test reports
Design adherence All key assets (well, rising main, ESR, etc.)
Diameter, depth, volume, etc.
Timely implementation Phase wise All phases (1-3)
Best practices followed Pipe laying along road, clearance from sewer lines
Improving the Performance of Rural Water Supply and Sanitation Sector in Maharashtra98

F. Material test reports – material test reports of different materials such as compres-sive strength of concrete, tensile strength of steel, quality of pipes, etc. are part of DPR and are carried out to ensure that the quality of materials is good. All tests should be carried out at government engineering/ polytechnic colleges or at government laboratories.
Design adherence
Adherence to design norms for each physical asset is essential. Parameters of each component to be verified are as follows:
I. Trench gallery – parameters to be verified for this asset are
A. RCC slotted – in-field RCC slotted pipe is placed as per specified in estimate
B. Length – Approximate length is provided in field as specified in DPR, on field we cannot verify as trench gallery is below water surface. Verify it from MB records.
C. Diameter – Diameter also cannot be verified, check from MB records.
D. Depth – Depth also cannot be verified, but can ensure it is not exposed above water, if exposed then a score of 0 is given.
II. Well – almost in all rural water supply scheme wells are the primary source of water. These schemes are based on surface water (jack well) or ground water (tube well)
A. Diameter – diameter of well should be as specified in DPR, ± 5% is accepted.
B. Depth – It should be as specified in DPR. ± 20% variation accepted, if enough water column is available.
C. Sustainability - Source sustainability is verified by asking villagers or from information provided by auditor regarding water column as measured during summer months.
D. Plastering – if work on source is complete scores are given based on whether plastering is done or not as observed on field. If work is in progress then input field for this parameter is kept blank.
III. Rising main –
A. Length – It should be as specified in DPR; it is not physically measured but verified through Google Earth by marking some points in field ± 20% variation is accepted.
B. Diameter and material – These parameters should be as specified in estimate. Pressure rating should be also as per specification.
Improving the Performance of Rural Water Supply and Sanitation Sector in Maharashtra99

C. Air valves – Number and position of air valves should be as specified in estimate, generally this is verified only through numbers as position are not marked on rising main profile. Most often, the path of rising main is not acces-sible, and then number of valves should be verified from MB records.
D. Pressure gauge – Availability of pressure gauge on rising main in pump house should be checked.
E. Leakages – If any visible leakages are observed on rising main path the score should be zero
IV. Pump house
A. Dimensions – Dimensions of pump house as per specified in estimate, ± 10% error is accepted.
B. Plastering & coloring – Plastering and coloring work of pump house is carried out or not is observed in field, if work of component is complete.
C. Paneling - Panel board must be properly placed inside pump house as suggest-ed in estimate (electric meter, starter voltmeter and ammeter).
V. Pumping machinery
A. Capacity of pump – This can be verified through purchase register or by asking key informant or through name plate placed in pump house. It should be as specified in DPR.
B. Type – Pump type (submersible, centrifugal, etc.) should be as specified in DPR.
C. Stand by – Stand by pump is provided as per specification and its functionality should be checked.
D. Rate of pumping – Rate of pumping in field should be as specified in design details at specified head; measure rate of pumping at ESR head and verify it is equal to design flow rate.
E. Support structure – observe if proper support structure at top and bottom of pumping machinery is provided.
VI. Storage reservoir
A. Capacity (Volume) – In design documents, dimensions of storage reservoir are not mentioned, only total required volume is calculated. Calculate the capacity by measuring the tank dimensions; it should be approximately equal to the volume specified in DPR.
B. Inlet, outlet and overflow pipes – Inlet, outlet and overflow pipes diameter should be as specified in estimate. Overflow pipe should be properly connect-ed to outlet pipe to avoid overflow of tank.
Improving the Performance of Rural Water Supply and Sanitation Sector in Maharashtra100

C. Wash out valves – it should be provided on outlet as specified in estimate.
D. Stair case – Whether properly fixed and accessible steel stair case or spiral RCC stair case as specified in estimates is placed should be verified in field.
E. Staging height – Staging height of ESR/ MBR should be as per design document
VII. Distribution network –
A. Diameter and material – These parameters should be as per specified in estimate. Pressure rating should be also as per specification.
B. Length – It should be as per DPR. It is not physically measured, but verified through Google Earth by marking some points in field ± 20% variation is acceptable.
C. Valves – Number and specification of valves as observed on field are as per i estimate.
D. Location of pipes below ground. – It is verified that pipes are not placed on ground surface, they should be below ground but generally depth is not verified.
E. Leakages – If any visible leakages are observed in the distribution network a score of 0 is given.
VIII. Water treatment plant (WTP)/ Treatment facility –
A. Present – Whether WTP or any other treatment facility is provided, especially in case of surface water, is checked.
B. Components – Whether basic components of WTP such as aeration unit, filters, settling chamber and sump are provided as per design specification.
IX. Maharashtra State Electricity Board (MSEB) connection – A legal electric connection for scheme is taken or not should be verified, ask for an electricity bill in case of a functional scheme.
Timely implementation
Approximate verification of whether timely implementation of the various phases of the scheme was carried out is done. Mainly total budget of scheme is distributed in 4 installments; first three installments each of 30% of total budget are paid during execution of scheme and remaining 10%, after the one-year operational trial period. As the scheduled time period for executing a scheme is two years, each phase should be completed within 8 months approximately. Time period for implementation of first phase can be calculated as difference in date of payment first installment and second installment and so on.
Improving the Performance of Rural Water Supply and Sanitation Sector in Maharashtra101

A. If first phase takes time more than a year, then put 0 in input mark column in success indicator sheet.
B. If the completion time for second and third phase is more than two years, then put 0 in input mark column in success indicator sheet.
Best practices followed
Pipe laying along the road and clearance from drainage is checked for the distribution network. Scores in both cases are provided on 0-5 scale. Total % length of distribution network along the road and clearance from drainage lines is estimated in the field and marks are given on the following basis:
A. 100% - 5
B. 80-99% - 4
C. 60 – 79%- 3
D. 40 – 59% - 2
E. 20 – 39% - 1
F. <20% - 0
3C.2.4 Operation & maintenance stage
This is one of the important phases of the scheme; even if scheme planning, designing and implementation of scheme are good, bad operations result in failure of scheme. There are five themes considered in this phase, which are as follows:
Documentation
A. Schedule – Different operating schedule such as pump operating schedule, valve operating schedule and supply schedule to habitation as mentioned in DPR are verified.
B. Operation register – Daily updated operation register is maintained by operator of scheme is checked.
C. Operation manual – Whether any operation manual (by NRDWP, MJP) is provided to Gram Panchayat or not is verified.
Institutional provision
I. Operation
� Appointment of operator – provision of operator by VWSC for adequate opera-tion of scheme is verified.
Improving the Performance of Rural Water Supply and Sanitation Sector in Maharashtra102

� Adequate salary to operator – Whether salary paid to appointed operator is as per operation and maintenances sheet available in DPR is verified. This infor-mation is collected through a form which is given to Gram Sevak for filling by audit team.
� Timely payment of electricity bill – Using connection ID and BU (breaking unit) of region pending amount and frequency of bill payment is verified on website. (https://wss.mahadiscom.in)
II. Maintenance
A. Frequency of repairing/ replacing assets – if any asset gets damaged, time required for repairing or replacing assets marks are given on 0-5 scale.
Frequency of repairing/ changing Marks
Action taken within 1-2 days 5
Action taken within 8 days 4
Action taken within 15 days 3
Action taken within month 2
Action taken after a month 1
No action taken 0
B. Frequency of cleaning assets – Whether periodic cleaning of assets is carried out such as annual desilting of well, quarterly cleaning of ESR, cleaning of pump and motor has to be verified.
Financial sustainability
A. Balance recovery and expenditure – actual expenditure on scheme is calculated and depending upon existing tariff charges, difference between expenditure and actual recovery is calculated. If expenditure on scheme is less than or equal to actual recovery a score of 5 is given. Else give a score from 0 to 4 depending on the % recovery.
B. Tariff recovery – Actual tariff recovered on the scheme is obtained from the gram panchayat and scores are given on a scale of 0 to 5 based on the quantum of recovery.
Operation
Deviation from design:
A. Pumping hours – actual pumping hours should not be greater than pumping hours considered in pumping machinery design. If less than or equal to designed pumping hours, then a score of 1 is given
Improving the Performance of Rural Water Supply and Sanitation Sector in Maharashtra103

B. Tank filling time – depending on flow rate and volume of tank, calculate time needed to fill the tank; actual filling time of tank should be almost equal to the calculated time.
C. Supply duration – Total supply hours should be as per design
D. Bypass – If any asset from scheme is bypassed during operation of scheme, then the score input is zero.
Service level
A. Coverage – Actual coverage is verified against planned coverage. Marks are given on 0-5 scale depending upon % coverage
Coverage in % Marks
100 5
80-99 4
60 – 79 3
40 – 59 2
20 – 39 1
<20 0
B. Average LPCD supplied – Average LPCD water supplied to beneficiaries equal to or greater than 40 lpcd then put 1 otherwise 0.
C. Continuity of water supply – Whether water is supplied every day in all areas and timing of supply for every area is constant is verified.
D. Quality of water – Parameters of quality are verified through people’s perception and auditor’s observation
� Visually– Water observed at households should be visually clean, if it muddy the score given should be 0
� Taste – taste should be acceptable to people.
� Testing of water sample – Is monthly water sample testing carried out or not is verified in field by asking VWSC.
� Addition of disinfectant – Is any disinfectant added in water should be asked to operator.
E. Equity in water supply – Whether all households on average get approximately equal amount of water with equal flow rate can be verified by measuring flow rates at some sample households.
Improving the Performance of Rural Water Supply and Sanitation Sector in Maharashtra104

3C.2.5 Exit and handover phase
Exit & handover phase is last phase of scheme; after liability period of one year of contractor, the scheme is handed over to Gram Panchayat. There are four themes considered in this phase:
Documentation
Documents transfer to VWSC – Scheme maintenance after exit and handover is to be taken by VWSC so all documents should be transferred to them such as DPR, copy of MB record, etc. Handbook or manual regarding operation of scheme should be handed over to VWSC.
Institutional arrangement
Whether training of operator by any technical institute is carried out or not has to be verified which is necessary for efficient functioning of scheme.
Technical collaboration
Generally, technical collaboration is not considered in planning. However as VWSC or Gram Panchayat has no technical capacity, support in designing tertiary network is needed.
Action for sustainability
Local action for sustainability – Check whether villagers/ VWSC/ Gram Panchayat have taken any initiative to make scheme more sustainable and efficient. These actions are bulk meter installation/ metering system in scheme, any automations in scheme to reduce human efforts and any action for source conservation.
Improving the Performance of Rural Water Supply and Sanitation Sector in Maharashtra105

Score Category
Remarks
Planning & design Implementation Operation & maintenance
Exit & handover
Elements considered
Planning and design documents & approval present in DPR, planning criteria, site selection, habitation coverage, norm adherence, key asset design, control & safety provisions and sustainability measures
All documents avail-able, design adher-ence of assets, timely implementation and general good practic-es
Planned operation schedule, operation and maintenance provision, financial sustainability, opera-tion adherence to design and good serviceability
Document transfer to VWSC, training to operator, technical collaboration to extent house hold connections, action for sustainability of scheme
Above 85Excellent
Most elements are properScheme may have minor problem in documentation and/or planning and design
In adherence to planning & design phase remarks, most elements have been implemented properly; Minor documenta-tion problem and/or non-critical deviation from asset design
and implementation phases correctly executed, most elements are proper;Scheme may have no planned operation schedule
Planning & design, imple-mentation and O&M phases correctly executed, most elements of this phase are proper;Scheme may have some non-trivial problem in one of the above elements
Table 3C.4: Index of success indicator scores
3C.3 Success Indicator Interpretation
As part of assessment process of piped water supply scheme, a Success Indica-tor scoring matrix was developed for assessing sustainability of Rural Water Supply Schemes (Table 3C.4). This document helps in interpretation of the scores obtained by specific schemes.
Each scheme is evaluated for four phases i.e. (i) Planning & design, (ii) Implementa-tion, (iii) Operation & maintenance, and (iv) Exit& handover. The scores are divided into 4 categories as:
� Excellent – Status of scheme is very good, will succeed with no improvement or a few non – trivial improvements
� Good – Over all status of scheme accepted as proficient, will work well with certain improvements
� Satisfactory - Likely to work acceptable, can succeed with major improvement
� Poor - Likely to fail unless major changes are undertaken
Improving the Performance of Rural Water Supply and Sanitation Sector in Maharashtra106

Score Category
Remarks
Planning & design Implementation Operation & maintenance
Exit & handover
71 – 85Good
2 or 3 of the above elements are not proper;Some documentation problem and/or incorrect design in any 1-2 assets and/or no norm adherence
1 or 2 of the above elements have not been implemented properly or partly implemented well;Documentation problem and/or no design adherence regarding any one important asset or few parameters of 2-3 assets in implemen-tation
1 or 2 of the above elements are not proper; No planned opera-tion schedule and/or slightly affected serviceability and/or partly deviation in operations from design
1 or 2 of the above elements are not proper;No technical collaboration and/or all documents not handed over
55 – 70Satisfac-tory
3 or 4 of the above elements are not proper; Important documentation problem and/or incorrect site selection and/ or no norm adherence and/or incorrect design of few assets
2 or 3 of above have not been implement-ed properly;Non-sustainable source and/or No design adherence of a few important assets such as distribution network, rising main, good practices not followed completely and/or no timely implementation of one phase
2 or 3 of above elements are not proper; In addition to unscheduled opera-tion low serviceability and/or financial unsus-tainability
2 or 3 of the above elements are not proper;No technical collaboration and/or all documents not handed over and/or no training to operator
Below 55Poor
Most of the above elements are not properPoor documentation, incor-rect site selections, incorrect design of important assets, no norm adherence, poor service/ habitation coverage
Most of the above elements have not been implemented correctlyPoor or no documen-tation and poor design adherence, delay in implementation, good practices not followed
Most of the above elements are not properUnscheduled opera-tions, poor service-ability, unsustainable financial status, no design adherence of operation
Most of the above elements are not properAll documents not handed over, no technical collab-oration, no local action for sustainability of scheme
Higher score indicates RWS scheme more likely to be sustainable. This perception is built from the few schemes assessed by us; as more schemes are assessed, scheme categorization based on sustainability indicators scoring will improve.
� If scheme is doing well in one phase that does not mean scheme will succeed, success of scheme is based on reasonable performance in every phase.
� For ongoing schemes, the score obtained is based on the work done in the past and cannot be a basis for prediction of the future performance of the scheme, since implementation and operation stages of schemes are crucial.
Improving the Performance of Rural Water Supply and Sanitation Sector in Maharashtra107

� Many factors are not exclusive to a single phase of the scheme; they are linked to other phases also. Hence if these factors are not incorporated properly, it not only affects a particular phase but also other phases.
� Based on our assessment, though planning and design stage of scheme is good, deviation from design during implementation and poor operation practices may result in decline in its performance, which is reflected in the low score for the success indicator.
� Score categories with detailed remarks are explained with three examples and phase wise score of these examples are given in Table 3C.5 and Table 3C.6 below.
Table 3C.5: Four examples and its phase wise score
Scheme name Planning &Design
Implementa-tion
O & M Exit & handover
Final score
S 1 89 87 80 80 84
S 2 73 66 57 55 63
S 3 52 48 35 NA 45
S 4 78 33 NA NA 56
Table 3C.6: Phase wise remarks of example schemes
Score Category
Remarks
Planning & design Implementation Operation & maintenance
Exit & handover
Above 85Excellent
(S 1-89) - Few maps and structural design documents not present, no provision of safety measures to ESR
(S 1- 87) - Implementation schedule, purchase register and yield test report not present, no design adherence of distribution network parameter
71 – 85Good
(S 2- 73) - Maps and struc-tural design documents not present, incorrect design of rising main and ESR(S 4 - 78) - Maps and structural design documents not present, no norm adherence of VWSC
(S 1- 80) - No planned schedule, inequality in supply
(S 1- 80) – Opera-tion manual and hand book no transferred to VWSC
Improving the Performance of Rural Water Supply and Sanitation Sector in Maharashtra108

Score Category
Remarks
Planning & design Implementation Operation & maintenance
Exit & handover
71 – 85Good
1 or 2 of the above elements have not been implemented properly or partly implemented well;Documentation problem and/or no design adherence regard-ing any one important asset or few parameters of 2-3 assets in implementation
1 or 2 of the above elements are not proper; No planned opera-tion schedule and/or slightly affected serviceability and/or partly deviation in operations from design
1 or 2 of the above elements are not proper;No technical collaboration and/or all documents not handed over
55 – 70Satisfac-tory
(S 2 - 66) - Implementation schedule, purchase register and yield test report not present, no design adherence of few parameters of rising main, ESR, pumping machinery, distribution network
(S 2- 57) - No planned schedule, unequal distribution, no tariff structure and no household connection provision
(S 2- 55) - Opera-tion manual and hand book no transferred to VWSC, no techni-cal collaboration, no training to operator
Below 55Poor
(S 3- 52) - Maps and structural design documents not present, incorrect design of pumping machinery, no design of jack well and trench gallery, no control measures and safety provision
(S 3 - 48) - Implementation schedule, purchase register and yield test report not present, no design adherence of many parameters of trench gallery, jack well, ESR, pumping machinery, distribution network, no timely implementation of phase III(S - 33) - Implementation schedule, purchase register, MB records and material test report not present, unsustainable source, no timely implementa-tion
(S 3 - 35) - No opera-tion schedules, no provision of operator, financially unsustain-able scheme, poor serviceability - no daily supply, no treat-ment, inequality in supply
3C.4 Success Indicator Scores of Audited Schemes
Success indicator score of a few schemes in Maharashtra state are given in Table 3C.7. As no scheme was in ‘exit and hand over’ phase, the ‘scoring’ procedure is not applicable for this phase. A few schemes are ongoing, and therefore they are audited up to implementation phase. From the table, it we can conclude that no scheme was excellent in any phase; a few schemes were good at planning and design phase; no scheme was good at implementation and operation and maintenance phases. Mostly in all schemes planning and design was carried out in a better way than the execution, and operation and maintenance was poorer than execution.
Improving the Performance of Rural Water Supply and Sanitation Sector in Maharashtra109

3C.5 Case Study
3C.5.1 Project background
Thane Zilla Parishad empanelled Technology and Development Cell (TDSC), CTARA as a third-party evaluator for technical inspection of the selected Rural Water Supply Schemes (RWSS) in the district. The overall aim of this assignment is to improve sustainability, efficiency and equitability of these schemes. As per the Government Resolution No: Gra. Pa. Dho.- 1114 / Case No.61 / Pa.Pu.-07, Dt. 15 June 2015, the technical inspection of the RWSS is to be undertaken during two phases: First evalu-ation after 30% work completion and second after 70% completion of the scheme. Thane Zilla Parishad has shortlisted 23 ongoing schemes under National Rural Drinking Water Program (NRDWP) for third-party inspection. TDSC is evaluating these schemes through design verification, physical asset verification, and performance and adher-ence of scheme to design as per the approved Detailed Project Report (DPR). This sub-module discusses the findings of the technical inspection undertaken for the Vape (Dudhani) Rural Water Supply Scheme which is a completed scheme.
Objectives of technical audit
The objectives of the technical audit are as follows:
� Assessment of the scheme Detailed Project Report (DPR) to know design details of assets proposed in the scheme and to check whether supporting documents are prepared.
� To check if design verification of key assets of the scheme given in DPR is appro-priate.
Table 3C.7: Audited scheme scores
Schemes Planning & designing
Implementation Operation and maintenance
Exit & handover Overall Score
I 64 58 55 NA 59
II 69 56 52 NA 58
III 69 43 50 NA 52
IV 57 55 45 NA 50
V 71 43 27 NA 44
VI 69 64 NA NA 67
VII 77 56 NA NA 66
VIII 74 51 NA NA 63
IX 71 47 NA NA 59
X 73 40 NA NA 54
Improving the Performance of Rural Water Supply and Sanitation Sector in Maharashtra110

� Physical verification of assets to know whether the scheme has been implement-ed according to design mentioned in the DPR.
� Checking the scheme performance to assess its sustainability
� Summarize findings and propose recommendations.
Inspection methodology
The scheme was evaluated by following a detailed methodology comprising data collection, necessary field visits and data analysis. The activities include:
� Assessment of supporting documents and study of design of assets
� Verification of Distribution network design with the help of Jal Tantra software
� Excavation for assets verification at specification level
� Ensuring source sustainability and quality of material by checking the yield test report and material test report respectively
� Tracing of rising main and distribution network for getting actual paths and lengths
� Measurement of pump flow rate in order to know the duration for filling of ESR
� Collection of household connections data and zone wise distribution of habitation by interviewing the Gram panchayat officials and operator
� Measuring actual flow rates across the distribution network
� Ensuring whether the scheme has covered all households and checking amount of water received by household having individual connection.
� Providing success indicator score for scheme depending upon progress of scheme, developed by TDSC. Interpretation of scheme numbered from 0-100 is provided in annexure.
Improving the Performance of Rural Water Supply and Sanitation Sector in Maharashtra111

Figure 3C.3: Google map image showing Vape village
3C.5.2 Scheme overview
Vape is a village in Dudhani Gram panchayat located in Bhiwandi Taluka of Thane District (Figure 3C.3). It is situated at a distance of 45 km from the district headquarter. Average rainfall in this area is 2663 mm. The selected scheme for the technical inspec-tion was sanctioned in 2013-2014. The scheme is designed for 15 years to serve an estimated population of 1650 people. Details of the scheme from the detailed project report (DPR) are mentioned in table 3C.8.
Improving the Performance of Rural Water Supply and Sanitation Sector in Maharashtra112

Table 3C.8: Scheme details
Scheme Name Vape (Dudhani) rural water supply scheme
Taluka/District Bhiwandi, Thane
Sanction Year 2013 – 2014
Source Well
Villages and Habitations covered Vape and Avchitpada
Scheme capacity 0.076 MLD
Technical approval date 13/11/2013 Administrative approval date
23/12/2013
Work Order date 28/02/2014 Time limit 12 months
Total Budget estimate Rs. 37,20,097 Budget spent
Implementation agency (GP/ ZillaParishad/ MJP/ VWSC) VWSC
Scheme description
Prior to the new scheme, Vape village was served by Shelarpada mini piped water supply scheme. This scheme was functional from 1990. However, due to rising village population and deterioration of scheme conveyance infrastructure, it was not able to meet water demand of the village households.
As per the details provided in the DPR, the source of the scheme is to be a newly excavated well which will be around 200 m away from the village. Prior to excavation of this well, one feeder bore was also supposed to be excavated. A pump house of dimension 2.5 m*2.3 m*3.0 m and a proper fixed control panel board was also to be set up near the well. From well, water is to be pumped to ESR at a distance of 210 m in the village, by using a 3 Hp submersible pump. 65 mm diameter G.I pipe medium class is to be used as rising main. Water is to be supplied to village by gravity from ESR (Figure 3C.4).
LegendsRising MainDistribution LinesPumpValve
New Well
65 mm GI Pipe 560 m
Distribution Network
Vape
ESR
Pump House
Architpada
Figure 3C.4: Schematic layout of the scheme
Improving the Performance of Rural Water Supply and Sanitation Sector in Maharashtra113

Site visit details
Physical verification of all the assets of the scheme is done by site visit. Activities carried out and purpose of site visits are mentioned in table 3C.9.
Table 3C.9: Site visit details
Table 3C.10: Documents assessed
Sr. No. Visit Dates Purpose Activities
1 20/06/2017 Assessment visit Assets verification, discussion with VWSC, gramsevak and villagers
Document Present in DPR (YES/ NO)
Remarks
Demand letter YES OK
GSDA permission/ authorization letter/ report YES Suggested new well around 200 m from Village
Yield Test NO
Material test report YES Ultimate stress in steel bar, compressive strength of concrete, GI pipe test and all test results are okay
Water quality test YES Potable (tested by District Health Laboratory, Thane)
Land acquisition document
VWSC/ SAC
Budget Estimate YES Detailed estimates of all assets present
Distribution system Summary/ software program I/O
YES BRANCH Version 3
Key plan YES
Survey map NO
3C.5.3 Planning and design audit
Completion of a new scheme passes through various phases which include: planning, design, implementation and its operation. The mistakes and inconsistencies in follow-ing norms during any of these phases may lead to scheme failure. Thus, each phase is important and needs to be verified. This module covers all the verifications and checks for various phases of the scheme as mentioned in the DPR.
List of documents in DPR
In order to check official procedure for demanding the scheme, utility of material and source sustainability, the documents verified are listed in Table 3C.10.
Planning verification
In order to have proper coverage, sustainability and operation, the first step in scheme implementation is the planning. As mentioned above, the necessary planning documents are checked during the assessment of the DPR. Although some of these
Improving the Performance of Rural Water Supply and Sanitation Sector in Maharashtra114

documents are procedural documents (e.g., Gram Sabha resolution, VWSC, etc.), they have a great impact on monitoring and sustainability of the scheme. Following are the findings from the planning document assessment.
� Both Vape and Avchitpada habitation were covered in planning, but as there is no proper survey map, the planned distribution network against actual laid distribu-tion network could not be verified.
� Length of rising main considered in design and estimate is 210 m, whereas actual length measured in audit and length recorded in MB is 510 m. It implies that either proper survey was not undertaken or location of well or ESR is changed.
� For a feeder bore which is near to well, a separate pump house was proposed in planning. However, pump house of the scheme could have been used for feeder bore panel.
Design verification
The first step of technical audit is to undertake a design verification of different assets of the scheme. Hydraulic designs of various assets as mentioned in the DPR were verified to ascertain whether the given design details of various assets are correct or not.
Table 3C.11: Assets design details
Design compo-nent
Dimensions From DPR From design verification
Remarks
Population forecasting
Year 2030 1650 1643 Average of incremental increase and geometric method
Demand MLD 0.0759 0.076
Raw water Pumping machinery
BHP 3 Hp 5 Hp Actual length of rising main is more than planned length, so capacity and head increasedTotal Head 38 m 46 m
Pump flow rate 2.9 lps 2.76 lps
Raw Rising main Diameter 65 mm 65 mm Length of rising main 510 m
Storage tank Volume 38000 litre 38000 litre
Distribution main
Diameter Range and respective length
80 mm – 36 m 65 mm – 30 m 50 mm – 931 m
80 mm – 30 m 65 mm – 202 m 50 mm – 729 m
Design verification is done through Jal Tantra
Design verification was done by using actual data, on the length of rising main provided in MB records. It was found that though the diameter of rising main was same, the length was changed. As a result, pump capacity was also changed (Table 3C.11).
Improving the Performance of Rural Water Supply and Sanitation Sector in Maharashtra115

Table 3C.12: Physical assets detail
Asset name Dimensions From DPR/ Structural design
From Field visit Remarks
Source (Well) Diameter 6 m 7.7 m Okay
Depth 10 m 8.6 m
Water column - Silt removal was going on
Pumping machinery
BHP 3 Hp 7.5 Hp Higher capacity pumps are placed
Pump type Submersible Submersible
Standby 1 1
Pump flow rate -
Pump house Dimensions 2.5 m*2.5 m*3.0 m 2.5 m*2.3 m*3.0 m
Material Burnt brick masonry
Burnt brick masonry
Rising main Length 210 m 556 m Length measured using Google EarthDiameter 65 mm 65 mm
Material GI medium class GI medium class
Storage tank (ESR) Length x width - 3.3m*3.3m
Depth + Free board - 3.4m+0.5 m
Volume 38,000 liters 37,026 liters
Staging height 12 m 12 m
Distribution network Diameter (mm) – Length (m)
80 mm – 36 m 65 mm – 30 m 50 mm – 931 m
80 mm – 00 m 65 mm – 75 m 50 mm – 590 m
Length measured using Google Earth
Material GI medium class GI medium class
50 mm – 590 m Length measured using Google Earth
3C.5.4 Implementation audit
Physical asset verification is done as per the following steps:
Physical assets verification
Physical verification of assets includes checking performance and adherence of scheme to the design as per the DPR. Physical assets to be verified include: source, rising main, pumping machinery, pump house, ESRs, and distribution network. The physical assets were verified through on-site inspections, details are provided in Table 3C.12.
Improving the Performance of Rural Water Supply and Sanitation Sector in Maharashtra116

Assets summary
Source:
A well is constructed on the outskirts about 500 m from the village on a private land as suggested by the GSDA. Diameter of well and depth is less than planned, but differ-ence is negligible. One feeder bore of 150 mm diameter is excavated near the source well. According the estimates, this bore well is around 60 m deep. . Due to fracture in strata, water doesn’t pump to surface. During the time of the field visit, the source well was being desilted and hence it did not have any water (Figure 3C.5).
Source is unsustainable, it dries during summer. Scheme was non-functional for 2 months prior to the visit. Water is supplied through an alternate source during this period. This source is a borewell in Shelarpada, which is around 1 Km from the village. Rising main of old scheme is used to supply water.
UP: Figure 3C.5: Well and empty well (Disilting in progress)
DOWN: Figure 3C.6: Submersible pump and pipe connected to pump and improper support structure
Improving the Performance of Rural Water Supply and Sanitation Sector in Maharashtra117

Figure 3C.7: Outside and inside view of pump house
Rising main:
GI medium class 65 mm diameter pipes are laid in field. In design, 210 m length of rising main is considered where as in MB record it is measured as 510 m and through Google Earth verification during audit, it comes around 556 m. Air valve was not placed.
ESR:
ESR with a capacity of 37,020 liters was constructed, whereas required capacity is 38,000 liters. It has a square water storage tank whose dimensions are provided in Table 5. . Staging height of tank is 12 m. Overflow pipe which should be connected to outlet is not provided. Two inlets and outlet are provided to tank (Figure 3C.8).
Pumping machinery:
A 7.5 hp submersible pump is placed inside the well, whereas required pump capacity is 5 hp only. As per estimates, only 3 hp pump was to be installed. Assembly of pump was correct but support structure provided at top of well is not proper (Figure 3C.6). Pressure gauge was not installed.
Pump house:
A pump house having dimension 2.5 m*2.3 m*3.0 m was constructed near well. Control panel is not placed properly inside the switch room (Figure 3C.7).
Improving the Performance of Rural Water Supply and Sanitation Sector in Maharashtra118

Figure 3C.8: ESR at Vape
Figure 3C.9: Distribution network laid on ground
Improving the Performance of Rural Water Supply and Sanitation Sector in Maharashtra119

Distribution main:
There are total of 8 stand posts and no individual household connection. Length of distribution network in field is less than designed length. Pipes of 80 mm diameter, the starting diameter of network as per DPR, were not laid, instead 65 mm pipes were used. Length of the designed network does not matched with the length measured in MB records. At some places, distribution lines are laid on ground as shown in Figure 3C.9. There are approximately 50 houses in Vape village which were served by 7 stand posts (Figure 3C.10) whereas in Avchitpada which has around 15-16 houses, only one stand post is present (Figure 3C.11). It indicates towards unequal distribution of water in the village.
LEFT: Figure 3C.10: Existing distribution network in Vape
RIGHT: Figure 3C.11: Distribution network in Avchitpada
3C.5.5 Operation auditData collected on operation and financial status of the scheme is presented in the following sub-sections:
Operations of the scheme
� The scheme serves village Vape and Avchitpada. The overall water demand from these two villages is 0.076 MLD.
� There are total of 8 stand posts, 7 in Vape and 1 in Avchitpada (Figure 3C.12). According to the operator, time required to fill the ESR is about 2 hours and it is filled only once daily.
� Water is supplied to villages between 9:00 am and 10:30 am every day. Entire Vape village gets water at the same time; no zoning is done but Avchitpada only gets water if the taps of all the stand posts in Vape are closed.
� According to the operator, TCL is added into the source well. However, no treat-ment of water in the alternate source is undertaken.
Improving the Performance of Rural Water Supply and Sanitation Sector in Maharashtra120

Figure 3C.12: Standposts in village
Serviceability of scheme
� Coverage – Distribution network is laid in both padas Vape and Avchitpad, but Avchitpada has line only up to the entrance of pada as shown in figure 3C.11 above. Asa result, taking individual household connection in future will be difficult.
� There is only one stand post in Avachitpada for around 15-16 households. 4 taps are installed on one stand post, out of which one is not functional (refer Figure 3C.12).
� Quality – Quality of water from alternate source is good, and villagers use it for drinking.
� Quantity - Few houses in Vape have private sources, and thus are not depen-dent upon the scheme. Presently, 37,000 litres of water is supplied through the scheme daily, which is about 45 lpcd of water.
� Equity – In Vape, villagers get adequate water roughly in equal quantity, whereas in Avchitpada, people receive less water. According to people in Avchitpada village, they do not get water regularly, quantity is very less and hours of supply are also less.
� As the scheme was not functional during the visit, flow measurement activity at ESR was not carried out. Still, as scheme gets water from alternate source, flow rate was measured at the stand posts as they receive water from the ESR.
From table 3C.13, equity with respect to water distribution cannot be inferred as the flow is measured at the stand post. However, it is clear that stand post in Avchitpada gets less amount of water.
Improving the Performance of Rural Water Supply and Sanitation Sector in Maharashtra121

Financial status of scheme
Total budgetary allocation for each asset mentioned in the DPR and actual amount spent on each asset (as recorded in MB) is mentioned in table 3C.14.
Table 3C.13: Flow measurement
Sr.No. Location Name Size of utensil (liters)
Time (seconds) Flow (lps) Water avail-able in 90 min (lit)
1 Vape Standpost 1 10 38 0.26 1421
2 Vape Standpost 2 7 33 0.21 1125
3 Vape Standpost 4 10 50 0.2 1080
4 Vape Standpost 7 7 29 0.24 1303
5 Avchitpada Standpost 8 5 30 0.17 900
Table 3C.14: Utilization of budget
Sr. No.
Asset Total Budget of an Asset (Rs.)
Actual amount spent (Rs) from MB
Remark
1 Well 6,71,223 6,21,962
2 Feeder bore well 2,17,181 16,740 Pumping machinery, rising main and switch room is proposed for feeder bore
3 Pump house 93,637 1,02,978
4 Pumping machinery + MSEB charges
3,32,869 1,90,607 MSEB charges considered in DPR are Rs 2,00,000, actual paid Rs 80,000
5 Rising main 3,03,188 3,18,132 More length
6 Tanks (ESR) 10,49,744 8,49,643 No detailing
7 Distribution system 8,35,661 4,05,628 Less length
8 Disinfection arrangements
00 00 No provision
9 Trial run 2,13,717 00
Total 37,59,678 25,05,692
The scheme was completed and became operational in November 2016. As per the MB records, only about 67% of the total budget is actually spent against the estimat-ed budget. . Only amount which was spent on the trial run of the scheme is yet to be added. As presented in Table 3C.14, in case of few assets, there was found to be significant difference between the planned budget and the actual amount spent. This is mainly due to either the non-implementation of some of the works or changes in pipe or other structures dimensions.
Financial sustainability of scheme is an important aspect of its performance. Table 3C.15 summarizes the expenditure on O&M of the scheme and the cost recovered from its operation.
Improving the Performance of Rural Water Supply and Sanitation Sector in Maharashtra122

Actual hours of pumping and pump capacity are considered while estimating annual M&R charges as electricity charges is the most important expenditure. Number of taxable houses and revenue details are collected from the Gram panchayat. Tariff charges are yet to be decided by the VWSC.
3C.5.6 Scheme findings
Assessment of the documents
� Excess saving statement which compares details of work considered in estimate and actual work carried out in field was found in the documents. As many works were not carried out in field like installation of feeder bore pumping machinery and rising main switch house, the actual expenditure on implementation of the scheme was only Rs. 25,05,691 against Rs 37,59,678 sanctioned for it. .
� As no survey map is available, verification of distribution network on field against plan is difficult.
� Financial estimates provided in DPR (i.e., STATEMENT NO. 8) are not correct. Future population is taken into account to calculate per 1000 liters cost of water. Instead, present population should have been considered Calculations provided in the sheet are also incorrect.
Assets
Source:
� Source is unsustainable, it gets dry during summer. Scheme was nonfunction-al from 2 months prior to visit.
� Feeder bore is nonfunctional due to fracture in strata. As a result it is unable to pump water onto the surface.
� Water was supplied through alternate source during this period. Borewell in Shelarpada was used which is around 1 Km from the village. However, rising main of the old scheme is used for water distribution.
Table 3C.15: Annual charges
Sr. No. Heads From DPR (Rs) Calculated (Rs)
i Annual M&R charges 104773 60955
ii Annual repairs 168197 168197
1 Total annual burden 272970 229152
i Taxable houses 174 0
ii Revenue from general cess 83160 0
iii Revenue from household connections 59400 0
2 Total revenue 142560 0
Improving the Performance of Rural Water Supply and Sanitation Sector in Maharashtra123

Pumping machinery:
� 7.5 hp submersible pumps were placed inside well, whereas required pump capacity is 5 hp and according to estimate 3 hp pump had to place
Rising main:
� Discrepancy in length of rising main measurement was found. In design, 210 m length of rising main is considered whereas in MB records, it is measured as 510 m and through Google Earth verification it is around 556 m. Air valve was not placed.
� Through design verification 65 mm dia pipe is sufficient, but 3 hp pumping machinery is not sufficient 5 hp pump is required.
Distribution network
� Discrepancy in length of distribution network was found. Length of designed network does not match with the length measured in the MB records. However, length measured on ground and MB records is nearly equal.
� First pipe of distribution network should be of 80 mm in diameter, but in on ground verification it was found to be 65 mm.
� At some places, distribution lines are laid on ground.
Operation
Entire Vape village gets water at the same time. However, Avchitpada which is away from the ESR, only gets water if taps of all the stand posts in Vape are closed. Gate valves should be placed on all the branches. Water should be first supplied to Vape and then after closing all the valves in the village, valves on the Avachitpada line should be opened to supply adequate amount of water.
Service level
� Avchitpada has distribution line only up to the entrance of pada. To increase water supply coverage, few distribution lines should be laid so that house-holds can take individual water connection with ease.
� According to Gramsevak and VWSC members, household connections will be provided once scheme is handed over to Gram Panchayat. But for better performance of the scheme, connections should be provided during the trial period itself.
� No tariff structure is decided by VWSC till now and no household connections are provided. And, hence no cost recovery has started.
� Presently operation cost is paid by Gram Panchayat.
3C.5.7 Success indicator
Success indicator score for this scheme is 64 (Table 3C.16), and it falls under the ‘Satisfactory’ category. This should be treated as a dynamic score and is expected to change with the further progress on the scheme. The score of planning and design and implementation phases are majorly affected by non-sustainable source, improper
Improving the Performance of Rural Water Supply and Sanitation Sector in Maharashtra124

survey leading to wrong design and implementation and no design adherence of distribution network in implementation. Scheme score was poor in operation as tariff structure was not decided, and due to unequal distribution of water. This success indicator score reflects that the scheme is likely to do well if certain improvements are undertaken in the completed works and remaining implementation is done properly. The major concerns are highlighted in the next sub-section along with the recommen-dations for improving the scheme sustainability.
Table 3C.16: Final success indicator score
Sr. No. Phases Marks obtained
1 Planning & Design 71
2 Implementation 61
3 Operation and Maintenance 57
4 Exit and Handover NA
Final Score 64
3C.5.8 Recommendations
Scheme specific
� Improve coverage in Avchitpada so that household connections can be easily taken in future.
� Provide household connections as soon as possible, and to assess proper functioning of the scheme, household connections should be provided during the trial period itself.
� Gate valves should be placed on all branches for equal distribution of water. First supply water to Vape, then close all valves and open valve of Avachitpada line.
� Tariff structure is yet to be decided by the VWSC. To make scheme financially sustainable, decide appropriate tariff structure and start recovery.
� Operation of scheme should be explicitly mentioned in DPR so performance of scheme can be improved.
General
� For correct financial forecast, present population should be taken into account instead of projected population.
� Yield test is to be carried out necessarily in order to ensure the source sustain-ability
� DPR should have a survey map. The availability of survey map will ensure greater understanding and readability of the correct layout of the pipes.
� Structural design of assets such as well, pump house and ESR should be provided in the DPR.
� Preparation of implementation schedule prior to actual implementation , maintaining purchase register and timely recording of MB are some important tasks which needs to be undertaken properly.
Improving the Performance of Rural Water Supply and Sanitation Sector in Maharashtra125

Bibliography � Mahavitran Maharashtra state electricity distribution. https://wss.mahadiscom.in
� Water Supply and Sanitation Department.(2000). Implementation of revised guidelines for rural water supply programme in the state. Govern-ment Resolution No: Gra.Pa.Dho.- 1099 / Case No.328 / Pa.Pu.-07, Dt. 27 July 2000. Mumbai: WSSD, Government of Maharashtra.
� Water Supply and Sanitation Department.(2013). Revision of per capita cost norms for rural water supply schemes. Government Resolution No: Gra.Pa.Dho.- 1208 / Case No.52 / Pa.Pu.-07, Dt. 9 October 2015. Mumbai: WSSD, Government of Maharashtra.
� Water Supply and Sanitation Department.(2015). Guidelines for the third party technical inspection for rural water supply schemes. Govern-ment Resolution No: Gra.Pa.Dho.- 1114/ Case No.61 / Pa.Pu.-07, Dt. 15 June 2015. Mumbai: WSSD, Government of Maharashtra.
Improving the Performance of Rural Water Supply and Sanitation Sector in Maharashtra126

Designing Piped Water Supply (PWS) Schemes with Focus on Water Supply Infrastructure
Module 4A
4A.1 Introduction to Piped Water Supply (PWS)
About 90 % of India’s rural population had reasonable access to different water sources by 2010 but only 31 % of rural households had access to piped water (World Bank, 2014) through PWS schemes. The 12th five-year plan proposed to increase the coverage of piped water supply to rural households instead of continuing with the traditional hand pump based supply (NRDWP, 2010). Piped water supply schemes are classified into two types: single village schemes and multi village schemes.
4A.1.1 Single village scheme
A single village scheme or independent rural water supply scheme covers habitations within a single Gram Panchayat (GP). Based on the budget of the project, the rights of implementation will be with the Village Water and Sanitation Committee (VWSC) or Zilla Parishad (ZP). It may sometimes cover more than one habitation. Figure 4A.1 shows the schematic layout of a single village scheme in the Tadwadi-Morewadi region.
Rising Main Pipe
Source WellSubmersible Pump
Pump House
Control Valve
Storage Tank with Taps
Figure 4A.1:Schematic layout of Tadwadi-Morewadi village scheme
(Source: CTARA, 2012)
Improving the Performance of Rural Water Supply and Sanitation Sector in Maharashtra127

4A.1.2 Multi village scheme
Rural water supply schemes that cover more than one village/GP are called multi village schemes. These are becoming popular as they have the potential to capture economies of scale and to facilitate higher levels of service, and they appear to offer a feasible and long-term solution to the acute water scarcity faced by many regions in India. Figure 4A.2 shows the schematic layout of the sugave multi village scheme.
Gudvanwadi
GudvanwadiSump
Gudvan
Kalyachiwadi
Antrad-t-need
Antrad-t-varedi
Borivali
Anjap
WTP
MBR Borivali ESR
Ramachiwadi
JackwellNot to scale; Not all valve positions are shown
Naldhe ESR
Naldhe
Naldhe Wadi
Lobhyachi Wadi
Saraiwadi
Pinglewadi
Sugave
Dharachiwadi
• Source: Surface water
• Beneficiaries : Multiple GPs
• WTP, MBR, ESRs
• Typically implemented by MJP
Figure 4A.2: Schematic layout of Sugave multi village scheme
(Source: CTARA, 2011)
4A.2 Planning of PWS schemes
Planning is a prerequisite of design and one of the crucial steps involved in the PWS system. It is a recurring loop. General steps involved in it are:
� Service area selection (Village, Habitation, Part of habitation)
� Selection of design life and Design LPCD (Litres Per Capita per Day)
� Demand calculation (Based on LPCD)
� Source selection
� Site selection
� Pipe material selection
Improving the Performance of Rural Water Supply and Sanitation Sector in Maharashtra128

4A.2.1 Service area selection
It is the first step in planning a PWS scheme. In this section we will highlight the procedure followed by Rural Water Supply Department (RWSD) for service area selec-tion. The norms for selection of and the priority for coverage of village/habitations are followed as per Water Supply and Sanitation Department – Government Resolution (WSSD GR) dated 27th July, 2000, which states that villages or habitations with no source within 1.6 km in areas located in the plains and 100 m elevation in hilly areas should be selected on a priority basis to be covered under the State Rural Water Supply Programme (RWSP). Further, priority was given to the villages/habitations with large Scheduled Caste/Scheduled Tribe (SC/ST) population; those affected by quality problems (excess salinity, iron, fluoride, arsenic or other toxic elements or bacterio-logical contaminated sources); schools and Anganwadis; and habitations where the quantum of availability of safe water from any source is less than the adopted norm. Demand based approach is followed here. As per GR dated 29th November, 2005, to select from competing demand for limited resources, Rural Water Supply Depart-ment(RWSD)gives a score to the villages based on parameters like presence of any existing scheme and quantity of water supplied by it, progress made on making the village open defecation free (ODF), SC/ST population, status of monetary recovery, etc. This score can be found in the Detailed Project Report (DPR) of the scheme.
4A.2.2 Design period and demand norm selection
Currently RWSS are designed for a period of 15 years with a water delivery norm of 40 litre per capita per day (lpcd) for domestic purpose as per GR dated 27th July, 2000. According to 2013-14 annual report of Ministry of Drinking Water and Sanitation (MDWS), this norm is enhanced from 40 lpcd to 55 lpcd.
Daily Demand = (Forecasted Domestic Population * Domestic Demand Norm) + (Floating population * Floating Demand Norm) + (Institutional Demand)
Generally, floating population is 20% of the forecasted population, actual is considered where possible. Water demand for floating population is taken as 15-20 lpcd. Norms for institutional demand in rural areas are not defined but are discussed in the CPHEEO manual for urban areas. In practice, total institutional demand is taken as 5% of daily demand or it is taken as per the designer’s discretion.
Daily demand is based on two factors: a) LPCD norm b) Forecasted population. Losses of 15-20% are added to this daily demand and total daily demand is computed and usually expressed in MLD units.
Total Daily Demand = (1+loss fraction) × Daily Demand
LPCD Norm
Though Govt. of Maharashtra has adopted domestic demand of 55 lpcd in planning of new water supply schemes based on surface water sources, groundwater based schemes continue to be planned keeping the water supply norm of 40 lpcd, citing constrained ground water resources in increasing the per capita service levels.
Improving the Performance of Rural Water Supply and Sanitation Sector in Maharashtra129

Population forecast
Based on the latest known census population P, three methods are usually followed for forecasting population Pn during the design period:
Arithmetic increase method:
This method is based on the assumption that population increases at a constant rate. Pn = P + n.xWhere, x = average of decadal growth in population n = number of decades from the latest known decade population
Geometric increase method
This method is also known as uniform increase method. Pn = P (1 + Rg)n
Where, Rg = Rate of growth of population per decade n = number of decades from the latest known decade population
Incremental increase method
In this method growth rate is assumed to be constantly increasing or decreasing, depending upon whether the average of the incremental increase in the past data is positive or negative. Pn = P + nx + n (n + 1) y / 2
Where x = average decadal growth in population y = average of population incremental increase in decade
Population for the required year is calculated by taking the average value from above three methods.
4A.2.3 Source selection
Source selection is the most important aspect of design. Source failure is the major reason for the failure of any scheme. General considerations in source selection are:
A. Yield: Source should be able to meet the computed daily demand and should be sustainable throughout the life of the scheme.
B. Quality: Based on the quality of water from source when compared with the norms, Water Treatment Plant (WTP) requirement is to be decided. Mostly WTP is required for Surface water sources.
C. Distance from habitations: For a far-off source, long pipelines need to be laid which leads to high capital cost, also high pressure loss and water loss through leakage which lead to high operational costs.
D. Elevation difference between source and target: In case target is at a much higher elevation than source, pumping cost may become prohibitive.
Improving the Performance of Rural Water Supply and Sanitation Sector in Maharashtra130

Source selection and evaluation based on quantity and quality must be done by the Groundwater Survey and Development Agency (GSDA). But monitoring and supervi-sion role still lies with RWSD.
Ground water source
Ground water source/subsurface water sources are open wells, bore wells, springs, and infiltration galleries. The following steps are to be taken care of while designing a ground water source:
A. The specific capacity should be known before selecting a well as the source.
B. Well depth is to be recommended by GSDA; hence its approval is a must for selection of site.
C. Yield test of well is a must for site approval.
Surface water source
Lakes, rivers, manmade reservoirs, etc. are surface water sources. Due to competing uses for the surface water resources,it is important to understand the existing usage of the source. Intake structures like trench galleries are constructed to extract water from the river and transferred to a jackwell by gravity.
4A.2.4 Site selection
Availability of land and its features are to be studied before selecting a site for various components of the scheme. Community participation is one of the key factors during site selection. Multiple factors are involved in site selection. For example: Elevated Storage Reservoir/Ground Storage Reservoir (ESR/GSR) locations, choice of suitable elevated area for ESR for proper gravity flow of water, road network for proper design-ing of distribution network, etc. Ownership of the land should be checked before selecting a site for WTP, pump house etc.
4A.2.5 Pipe material selection
Pipe material selection is a key factor while designing a piped water supply system. Poor quality may lead to failure of the project. There are various types of pipes available like metallic and non-metallic pipes. Based on cost as well as environmental and site conditions, a particular pipe is selected at a particular location of the supply system. In this section only PVC, HDPE and GI pipes are discussed as they are the materials mostly in use. PVC is most commonly used due to its low cost, ease of installation with simple joints and universal availability. GI is the best option when pipes are to be installed above the ground. HDPE is also a good choice as it prevents water leakage but its installation is costly. Table 4A.1 shows the comparison between HDPE, PVC, GI pipes.
Improving the Performance of Rural Water Supply and Sanitation Sector in Maharashtra131

Table 4A.1: Comparison of different materials used for pipes
(Source: Arnalich, 2010)
PVC HDPE GI
Non-corrosive Non-corrosive Corrosive
Inert Inert Not inert
Low cost Low cost Costly
Degrades in sunlight Linings may get affected Sustains in sunlight
Easily installed Costly electro fusion Easily welded
4A.3 Design Elements
There are various elements in a PWS scheme: rising main, pumping machinery, water treatment plant (WTP), transmission network, Mass Balancing Reservoir (MBR)/ Elevated Storage Reservoir(ESR)/ Ground Storage Reservoir(GSR), distribution network and valves. Figure 4A.3 shows various components of a multi village scheme. The importance and the design method for each element are described below.
4A.3.1 Rising main
The pipe that runs from the primary source to the MBR is called rising main. Economic diameter of rising main should be chosen for pumping water from source to tank. The diameter of pipe can be reduced by increasing velocity of flow through the pipe. But this will lead to higher frictional losses, increased duration of pumping which ultimate-ly increases cost of pumping. Hence, we choose such a diameter, which together with the pumping cost minimizes annual expenses. The design procedure followed by RWSD is based on minimum overall cost of pumping that the rising main would provide, the procedure is illustrated in this section and it is found in the Detailed Project Report(DPR)of each scheme.
Usually these diameters range from 65mm, 80mm and 100mmand so on. and rates are taken from District Scheduled Rates (DSR) applicable in the region.
Overall cost of pumping=Pump cost+Capitalised M&E charges+Pipe cost
Input parameters in design are:
A. Design Period
B. Demand at present, intermediate and ultimate stage
C. Hours of pumping (usually 8 or 12)
D. Length and static head of rising main
E. Capital cost of pump per KW
F. Energy charges per KWH
Improving the Performance of Rural Water Supply and Sanitation Sector in Maharashtra132

G. Efficiency of pump set (usually 70%)
H. Interest rate
I. Inflation rate
J. Commercial Pipe details: Material, Class, roughness coefficient and cost of each of the available pipe type
Calculations of components are done in two stages: 1st stage and 2nd stage, as the demand changes from present stage to ultimate stage i.e. after 15yrs. This variation is taken into consideration in the design.
A. Discharge at start of period
B. Discharge at the end of period
C. Average discharge
D. Average pumping hours during the period
E. Energy (in KW) required at combined efficiency of pumping set
F. Average annual charges for electrical energy in rupees
Figure 4A.3: Elements of PWS scheme with their design attributes
(Source: CTARA, 2011)
Gudvanwadi
GudvanwadiSump
Gudvan
Kalyachiwadi
Antrad-t-need
Antrad-t-varedi
Borivali
Anjap
WTP
MBR Borivali ESR
Ramachiwadi
JackwellNot to scale; Not all valve positions are shown
Naldhe ESR
Naldhe
Naldhe Wadi
Lobhyachi Wadi
Saraiwadi
Pinglewadi
Sugave
Dharachiwadi
• Source: Surface water
• Beneficiaries : Multiple GPs
• WTP, MBR, ESRs
• Typically implemented by MJP
Transmission (Primary) Network-Pipe-dia type, length, layoutRising Main-Pipe dia, Type, length, layout
Valves-Type, number Demand and service level
Distribution (secondary)Network- Pipe dia, type, length, layout
Tanks- Number, location, mapping to demand, height, capacity
Pump Capacity
Source- Type size
Improving the Performance of Rural Water Supply and Sanitation Sector in Maharashtra133
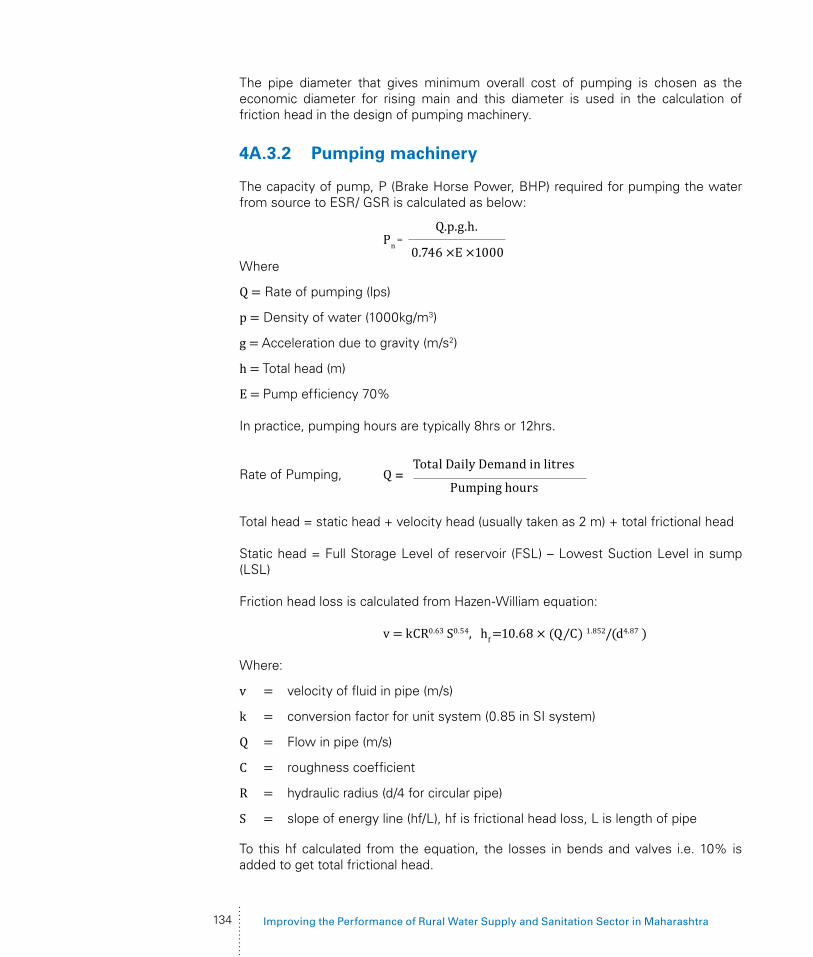
The pipe diameter that gives minimum overall cost of pumping is chosen as the economic diameter for rising main and this diameter is used in the calculation of friction head in the design of pumping machinery.
4A.3.2 Pumping machinery
The capacity of pump, P (Brake Horse Power, BHP) required for pumping the water from source to ESR/ GSR is calculated as below:
Where
Q = Rate of pumping (lps)
p = Density of water (1000kg/m3)
g = Acceleration due to gravity (m/s2)
h = Total head (m)
E = Pump efficiency 70%
In practice, pumping hours are typically 8hrs or 12hrs.
Total head = static head + velocity head (usually taken as 2 m) + total frictional head
Static head = Full Storage Level of reservoir (FSL) – Lowest Suction Level in sump (LSL)
Friction head loss is calculated from Hazen-William equation: v = kCR0.63 S0.54, hf =10.68 × (Q⁄C) 1.852/(d4.87 )
Where:
v = velocity of fluid in pipe (m/s)
k = conversion factor for unit system (0.85 in SI system)
Q = Flow in pipe (m/s)
C = roughness coefficient
R = hydraulic radius (d/4 for circular pipe)
S = slope of energy line (hf/L), hf is frictional head loss, L is length of pipe
To this hf calculated from the equation, the losses in bends and valves i.e. 10% is added to get total frictional head.
Pn =
Q.p.g.h.
0.746 ×E ×1000
Rate of Pumping, Q =Total Daily Demand in litres
Pumping hours
Improving the Performance of Rural Water Supply and Sanitation Sector in Maharashtra134

4A.3.3 Water Treatment Plant (WTP)
The quality of water depends on the type of the source from which it is extracted. In RWSS, WTPs are rarely placed. The main treatment performed in RWSS is disinfec-tion using Chlorine. It is added in the ESR/ GSR. The total chlorine (TCL) dose required for disinfection is 4kg/ML. Based on the yearly demand of water (in ML), TCL require-ment is calculated.
E.g.: Total daily demand = 0.06MLD
Yearly requirement = 0.06 x 365 = 21.9ML
TCL (@ 4kg/ML) required in a year = 21.9 x 4 = 87.6kg
4A.3.4 MBR/ ESR/ GSR
Water networks consist of intermediate tanks also known as MBRs/ESRs/GSRs that act as buffers between incoming flow from the primary source and the outgoing flow to the demand nodes. Rising main feeds water from primary source to WTP from where it goes to MBR, and then MBR feeds it to ESR/GSR through transmission main. ESR supplies the water to the demand nodes through distribution network. The balancing or storage reservoir is provided for following reasons:
� To satisfy hourly variations arising due to fluctuations between demand and supply through constant rate of supply.
� To maintain adequate pressure throughout the distribution network with its gravity flow from high elevation.
� To provide supply even during electricity outage and repairing of pipe between source and reservoir without interruption as it isolates transmission and distribution mains.
ESR- storage capacity
The ideal method of calculating storage capacity of MBR/ ESR/ GSR is with the help of hydrographs of inflow and outflow by mass curve method. It is a plot of accumulated supply (or demand) versus time. First, hourly demand for all 24 hours from the day of maximum requirement is determined. Cumulative demand is plotted against time, which is known as mass curve of demand. Similarly, cumulative supply against time is plotted; as ESR provides constant supply, this line is a straight line. The storage required is the sum of maximum ordinates between demand and supply lines.
“But the general practice followed by RWSD is to set the capacity of ESRs/ GSRs based on half (50%) of the computed total daily demand as it is an intermittent system that runs for mostly 12 hrs.
Capacity of MBR can be limited to just 25-30% of total daily demand if it is a continu-ous supply. In practice, it is designed as a fraction of the total capacities of the ESRs it needs to feed.”
Capacity of ESR⁄GSR = Total daily demand * Pumping hours
Hours in a day
Improving the Performance of Rural Water Supply and Sanitation Sector in Maharashtra135

For example, Total daily demand computed for a Charoti village scheme is 450000 litre, of which demand of East zone is 150000 litre and that of west zone is 300000 litre. The scheme is provided with MBR in East zone that distributes water in East zone and also feeds water to ESR in west zone. Here capacity of ESR in west zone is worked out first, Capacity = 300000*12/24 = 150000 litre. Now MBR capacity = 150000/2 + 1/4th of ESR capacity in west zone = 75000 + 37500 = 112500 litre.
ESR - staging height
The minimum staging height of ESR depends on elevations of supply/demand points, minimum residual head requirements, and head loss. Accordingly, we can also go for GSR if staging height is not required. Layout of a network with ESR is shown in Figure 4A.4 for understanding the criteria of staging height.
Min ResidualHead + 5m
88m
90m
95m
X?
Here, X is source head i.e. sum of source elevation and staging height
Tadwadi ESR
Lowest Investment
Staging Height (m)
5000
4500
4000
3500
3000
2500
2000
1500
1000
0
0 5 10 15 20 25
Total Cost
EST Cost
Pipe Cost
500
Figure 4A.5: Staging height vs. Pipe diameter
In the above figure, if X is source head, then its staging height should be such that it should provide a minimum residual head of 5m at the end nodes. In case of GSR, the source head will be the source elevation itself.
There is an inverse relationship between staging height and pipe diameter; as staging height increases, required pipe diameter decreases i.e. it can afford to have more head loss (frictional head loss is inversely proportional to diameter of the pipe), reducing the pipe cost. At the same time ESR cost will increase with increase in staging height, offering a trade-off. Staging height should be chosen such that the total cost of ESR and pipes is minimized. Figure 4A.5 shows these relations for an ESR in Tadwadi region.
Figure 4A.4: Staging height as per minimum residual head
Improving the Performance of Rural Water Supply and Sanitation Sector in Maharashtra136

f5
f4
f3
f2
f1
BA
C
f3 + f4 + f5
Branches
Demand At A = f1 + f2 + f3 + f4 + f5
LEFT: Figure 4A.6: Branch network
4A.3.5 Transmission and distribution network
The network from MBR to ESR/GSR is called primary or transmission network. The pipe running between these reservoirs is called transmission main or gravity main. The network from the ESR/GSR to the demand nodes is called secondary network i.e. the distribution network. The pipe networks for these rural schemes are typically gravity fed, since reliable electricity supply is not available in these areas. Out of the two systems of supply, i.e. continuous and intermittent, in rural areas intermittent system is in practice where water is supplied at peak hours, or in case of shortage of water the whole area is divided into zones and water is supplied to different zones at different times. The layout consists of mains, submains, branches or laterals, and service connections. These are generally laid along the roads, above or below ground level, with some clearance from drainage systems. There are mainly two patterns of distribution network: branched network and looped network. Branched (acyclic) networks are common in rural areas since the redundancy provided by looped (cyclic) networks is an unaffordable luxury.
Branch network
In a branch network there is exactly one path from the water source to the demand point. From one main pipe, several submains bifurcate and branches separate out from these submains. Finally, household connections i.e. the tertiary network can be laid from these end nodes. The system is simple to design and it is cheap but free circulation of water is prevented due to many dead ends. Figure 4A.6shows the layout of a branch network.
Loop network
Here a loop is introduced in the branches eliminating dead ends and water can reach different locations through more than one route. The design is difficult and costlier. In cases of emergency water can be diverted to other areas by closing the cutoff valve. Figure 4A.7 shows the layout of a loop network.
One of the most important aspects in the design of these systems is the choice of pipe diameters from a discrete set of commercially available pipe diameters. In general, each link (connection between two nodes) can consist of several pipe segments of differing diameters. Larger the pipe diameters, better the service (pressure), but higher is the capital cost. The branched piped water network cost optimization problem is the selection of pipe diameters that minimize the system cost while providing the requi-
f5
f4
f3
f2
f1
BA
C
f3 + f4 + f5
Branches
Introductin a loopDemand At A = f1 + f2 + f3 + f4 + f5
RIGHT: Figure 4A.7: Loop network
Improving the Performance of Rural Water Supply and Sanitation Sector in Maharashtra137

site service (pressure at demand points). As per CPHEEO manual, minimum residual pressure at end nodes (ferrule points) is 7m for single storage. But the practice adopted in schemes in rural areas is to design for a minimum residual pressure of 5m or 3m.
In the problem discussed in the previous section, software like BRANCH/Water GEMS as used by RWSD for the design of distribution network do not provide an optimal solution. They also do not consider other network components like tanks, pumps and valves. Hence, to overcome the limitations of these softwares, we built our own open source and free system Jal Tantra.
In the design of a transmission network, source will be the MBR and demand node is the ESR/GSR. Similarly, in the design of a distribution network, source will be the ESR and demand nodes are the end nodes of the secondary network. The detailed proce-dure regarding the design is discussed in the next chapter using Jal Tantra software. The basic input parameters required for the design are:
� Survey maps showing nodes with elevations and demands
� Source elevation and source node (GSR/ ESR)
� Commercial pipes details with material type, class and their costs
� Number of supply hours, Peak Factor =
� Minimum residual head at each node
� Minimum and maximum head loss per kilometer of pipe length
Water hammer
Structural design should be carried out to ensure three main forces are taken into consideration:
� Internal pressure mainly for water hammer to be resisted by the materials strong in tension.
� Pressure due to external loads like backfills to be resisted by materials in compres-sion.
� Longitudinal stress due to bends and points of change in cross section to be resisted by anchoring pipes in massive blocks of concrete or stone masonry.
The internal pressure due to water hammer is additive to the hydrostatic pressure in the pipe and depends on elastic properties of liquid and pipe and on the magni-tude and rigidity of change in velocity. Maximum water hammer pressure Hmax which occurs by nearly instantaneous or rapid closure of valve at critical time Tc
Hmax = C * Vo / g, C = 1433 / ( √ (1+ (E_(w*) D)/(E*T))
24 Hours
No. of Hours water is supplied
Improving the Performance of Rural Water Supply and Sanitation Sector in Maharashtra138

Where
C = Velocity of pressure wave travel (m/s)
Vo = Velocity in pipeline before sudden closure (m/s)
Ew = Bulk modulus of water (kg/m2)
D = Diameter of pipe (m2)
E = Elastic modulus of water (kg/m2)
T = Thickness of pipe (m)
g = Acceleration due to gravity (m/s2)
4A.3.6 Accessories in the supply system
Pipes of different external diameters, or different materials, or accessories like valves are joined to pipes through a compression system (Arnalich, 2010).
Pressure Release Valve: It is also known as relief valve or cut off valve. When pressure in the pipeline exceeds certain permissible pressure due to water hammer, the valve blows off and pressure is released instantaneously. Hence, it avoids bursting of pipes.
Location: On pumping mains.
Air valve: It consists of a chamber with a float. In case of no air in the pipe, the float seals the exit hole and when there is air the float drops, opening the hole and allowing it to escape. Sometimes, it may also shut off suddenly, causing water hammer.
Location: All peak points on the pipeline, in case of long pipeline stretches it is provided at an interval of 400 to 500m.
Check Valve: It is also known as non-return valve or reflux valve. It is used to limit flow in one direction. It prevents backward flow in rising main or at the mouth of borehole once the pumping stops.
Location: Just after the pump sets on delivery side
Gate Valve: It is also known as sluice valve. It consists of a disc perpendicular to the flow, that is raised or lowered. As it does not shut off suddenly, water hammer problem is avoided.
Location: On long mains at an interval of one per km, at the intersection of pipeline in the distribution system (IWWA, 2007).
Improving the Performance of Rural Water Supply and Sanitation Sector in Maharashtra139

4A.4 Conclusion
Design of PWS is non- trivial. It requires optimization of each design attribute of a component without compromising the quality of service. Since there are various components in a PWS, meticulous planning and design is necessary for proper imple-mentation and will ensure sustainable performance. In this chapter, we discussed the functions of various components of a PWS system and their ideal design procedures. Also, based on the experience of Technology Development Solutions Cell (TDSC) of CTARA on the practices of RWS in Maharashtra, the design methodology followed by RWSD is discussed to get a clear idea of the same. The reader of this chapter can also refer to other case study reports and reference material available at CTARA, IIT Bombay website (https://www.iitb.ac.in/ctara/en/uma_rws_audit_training).
Bibliography � Arnalich, S. (2010).Gravity flow water supply – conception, design and
sizing for cooperation projects. ISBN: 978-84-614-3277-6.
� Belsare, H. & Mishra, V. (2012).Tadwadi-Morewadi piped drinking water scheme – a failure analysis. Mumbai, India: Centre for Technol-ogy Alternatives for Rural Areas. (https://www.iitb.ac.in/ctara/en/system/files/Svs%20failure%20analysis%20Tadwadi_0.pdf)
� Central Public Health and Environmental Engineering Organisation.(1999). Manual on water supply and treatment. New Delhi: Ministry of Urban Development. (http://www.mdws.gov.in/sites/default/files/Manual_on_Water_Supply_and_Treatment_CPHEEO_MoUD_1999.pdf)
� IES Master. (2011). IES Master material on environmental engineering. (https://civilenggforall.com/gate-material-ies-master-environmental-engi-neering-1-water-supply-engineering-study-material-for-gate-psu-ies-govt-ex-ams-free-download-pdf-www-civilenggforall-com/)
� IWWA.(2007). Technical data book. Pune, India: Indian Water Works Association.
� Ministry of Drinking Water and Sanitation.(2013). Annual report 2013-14.New Delhi: Government of India.(http://www.mdws.gov.in/sites/default/files/Drinking_Water_Annual_Report_2013_14_English.pdf)
� Prasad, P. (2011). Sugave water scheme – multi village drinking water scheme analysis. Mumbai, India: Technology Development and Solutions Cell. (https://www.iitb.ac.in/ctara/en/system/files/Sugave%20Water%20Scheme%20MVS_0.pdf)
� Water Supply and Sanitation Department.(2000). Implementation of revised guide-lines for rural water supply programme in the state. GR No.GPP-1099/CR 328/WS.07.Mumbai: WSSD, Government of Maharashtra.(https://www.maharashtra.gov.in/Site/Upload/Government%20Resolutions/English/20080625145948001.pdf)
� Water Supply and Sanitation Department.(2005). Rural water supply programme. Gra.Pa.Dho.- 1005/Case No.156/Pa.Pu.-07, Dt. 29 November 2005. Mumbai: Government of Maharashtra.(https://www.maharashtra.gov.in/Site/Upload/Government%20Resolutions/English/20070905135753001.pdf)
Improving the Performance of Rural Water Supply and Sanitation Sector in Maharashtra140

Failure Analysis of PWSS
Module 4B
4B.1 Definition and Type of Failure
In literature, performance assessment of the piped water supply (PWS) scheme is defined in terms of various parameters which include physical sustainability, economic viability, social viability, institutional sustainability and ecological sustainability. Various criteria indicators within these parameters cover the preconditions for the success and sustainability of the water supply scheme. Specific to the water service delivery which is one of the important indicators under the physical sustainability of the scheme, PWS scheme failure is defined as: “An inability to serve planned service area with planned service level for full design life”
Failures can be classified in different ways such as related to time of failure and nature of the problem. Since PWSS go through different phases in its design life, ‘time of failure’ can also be categorized phase wise. Phase wise failures with some examples are listed below:
A. Planning & design failure: Overprovision, exclusion of habitations. Figure 4B.1 clearly show overprovision through coverage by stand post as well as hand pump
B. Implementation failure: Reduction in staging height
C. Operation & Management failure: unequal service delivery
D. Exit & handover failure: No transfer of project documents
Figure 4B.1: Picture showing over provision in the planning & design phase
Improving the Performance of Rural Water Supply and Sanitation Sector in Maharashtra141

Failure can also be classified as per the nature of the problem. Some of these are listed with examples below:
A. Physical failures: Source failure, Asset failure, No operation during monsoon
B. Economic and financial failures: Poor recovery
C. Institutional & management failures: Ineffective VWSC, No maintenance
D. Environmental failures: Seasonal drying of source
4B.2 Occurrence and Prominence of Failure
Piped water supply scheme failures are fairly common in Maharashtra due to various reasons including the regions’ geo-hydrology. As a result, there is a high instance of ‘slip back’ villages or habitations in the State (NRDWP data base, 2013-2014). Slip back villages or habitations are those which have gone from fully covered status (in terms of meeting the per capita water supply norm) to non-covered status due to scheme failure.
Analysis of data from 677 slip back habitations in Konkan division of Maharashtra reveals that only 201(29.5 %) habitations have ‘slip back’ for right reason i.e. improper functioning of the old scheme. In remaining 60.5% of the habitations, schemes were not able to perform satisfactorily (due to various reasons) even when they are yet to complete the design life. Drying of source (in 32% of the habitation) and less supply at delivery point (in 32.3% of the habitations) were found to be the two main factors for the scheme failure in this region. Summary of the findings are presented in Table 4B.1.
Table 4B.1: Failure analysis of all slip back habitation in Konkan region of Maharashtra
Sr. No. Slip back reason for habita-tion
Failure type No of habitations Percentage
1 Shortage of electricity Planning 13 1.9%
2 Drying of sources Planning 217 32%
3 Quality problem reported Planning / O&M 5 0.7%
4 Less supply at delivery point O & M 219 32.3%
5 Poor O& M O&M 22 3.25%
6 Old scheme is outdated Success 201 29.5%
Total 677 100%
Information and data collection Failure analysisStake holder interaction: Interview, Group discussion with key informantsData collection from fieldDocument collection from stakeholder
Social analysisFinancial and economic analysisPhysical analysis
4B.3 Method of Failure Analysis
Method employed for undertaking the scheme failure analysis involved two broader set of activities which are listed in Table 4B.2.
Table 4B.2: Data collection and failure analysis activities
Improving the Performance of Rural Water Supply and Sanitation Sector in Maharashtra142

Following steps were followed to perform the failure analysis of the piped water supply scheme:
4B.3.1 Identification of failure modes
All failed water supply schemes go through bad decision making at some phase of its design life which compromise its physical or financial sustainability in long run. Bad decision at any phase put constraint on scheme ability to serve the designed supply area properly and thereby forcing the scheme to enter into failure mode. Most common failure modes with bad decisions and its implications are shown in Figure 4B.2.Figure 4B.2: Common
failure modes of PWSS
4B.3.2 Identification Failure Path
Every failed scheme will have a defined path in which bad decision making has led to failure. Failure path for Kinhavli water supply scheme (Thane district) is marked in red in Figure 4B.3.
Planning and Design
Over Provision
CoverageReduction Bad M&E
Incorrect / PoorImplementation
InsufficientCoverage
Implementation
Incorrect Design
InsufficientSource
Bad FinancialForecast
Procedural Lap /Institutional Failure
Delay
Scheme not WorkingFailure
Poor Asset Quality
Opt Out HH Low O&M Fund
Low Tariff
Poor Operations
Low House HoldConnections
Operation & Maintenance
Poor ServiceLevel
Improving the Performance of Rural Water Supply and Sanitation Sector in Maharashtra143

4B.3.3 Identification of reasons for failure:
Even if the failure path has been identified, it is important to identify reasons of failure. Based on the analysis, the failure of the scheme may be attributed to a combination of reasons. There are three important tools which can help in identification of these reasons and they are:
a) Technical analysis or phase wise analysis tool
b) Delay analysis tool
c) Stakeholder analysis tool
Technical analysis or phase wise analysis tool
Technical analysis tool focuses largely on identifying decision variables which might have been wrong. Depending on importance and time of occurrence of bad decision variable its effect can be analyzed. Based on the field experience, all major possible failure reasons for three phases are listed in Table 4B.3.
Figure 4B.3: Failure path of Kinhvali scheme
Planning and Design
Over Provision
CoverageReduction Bad M&E
Incorrect / PoorImplementation
InsufficientCoverage
Implementation
Incorrect Design
InsufficientSource
Bad FinancialForecast
Procedural Lap /Institutional Failure
Delay
Scheme not WorkingFailure
Poor Asset Quality
Opt Out HH Low O&M Fund
Low Tariff
Poor Operations
Low House HoldConnections
Operation & Maintenance
Poor ServiceLevel
Improving the Performance of Rural Water Supply and Sanitation Sector in Maharashtra144

Table 4B.3: Possible failure reason under various phases of scheme in Maharashtra
Planning & design phase reasons
Implementation phase reasons Operation & Maintenance phase reasons
1. Wrong planning 1.1. Over provision 1.2. Exclusion of any habitation/
streets
1. Wrong implementation 1.1. Insufficient depth of source well 1.2. Improper laying of distribution
network 1.3. Change in diameter of
distribution main in Khodala scheme
1.4. Insufficient staging height of ESR
1. Human resources failure 1.1. No training to operator – lack of
technical skill 1.2. Lack of man power
2. Unsustainable source 2.1. No verification of sustainability
(Yield test) 2.2. No alternate source/ for PWS 2.3. Source conflicts
2. Bad quality of civil and mechanical work
2. Financial 2.1. High O&M charges 2.2. Low tariff charges 2.3. Low recovery
3. Nonfunctional institutional setup 3.1. Lack of communication
between stakeholders of scheme
3.2. Ineffective VWSC 3.3. Lack of technical capabilities in
VWSC 3.3.1.No guidance or training to
VWSC
3. Delay due to Land disputes and Lack of fund at ZP
3. Social issues 3.1. Difference in service level 3.2. Low acceptance of scheme 3.3. No willingness to pay tariff
charges
4. Wrong financial forecast 4.1. Tariff charges are calculated for
ultimate population
4. Faulty order of execution 4.1. Laying distribution network
prior to construction of ESR
4.2. ESR construction remain incomplete throughout scheme period
4.3. Laying rising main without source yield verification
4. Irregular electricity supply
5. Wrong design/ad hoc design of any assets 5.1. Wrong design of distribution
network as in Sugave scheme 5.2. Improper staging height of ESR
as in Mhdas scheme
5. No functional PWS in monsoon
6. No provision of control and safety measurement 6.1. Air valves, NRV, pressure
gauge
6. Quality issues 6.1. Not using for drinking/ cooking 6.2. Health issues because water
quality is bad after first monsoon as experienced in Konkan
Improving the Performance of Rural Water Supply and Sanitation Sector in Maharashtra145

Stakeholder analysis tool
All major Stakeholders must be identified and interacted with. Generally, stakeholders associated with any PWSS are:
a) The villagers: The primary stakeholders and beneficiaries of this scheme are villagers of covered villages
b) The village representatives: Village water and sanitation committee, Gram Panchayat
c) Government technical department: Rural water supply department, Maharashtra Jeevan Pradhikaran (MJP)
d) Contractor: Construction company/person responsible for construction of infra-structure
e) Local NGO
Based on the interaction, one can easily gather scheme data and find out whether each stakeholder has fulfilled their responsibility. Responsibility of failure can be attributed to institution/situations with the help of stakeholder analysis tool s. Conflict within a stakeholder group and between stakeholders can also be identified using this tool.
Delay analysis tool
Since all schemes have prescribed timeline (for completion of various steps) to be followed as mandated by the program guideline and various government resolutions, any significant delay can be estimated by plotting actual timeline against ideal timeline for major milestones. Reasons for avoidable delays can be identified by stakeholder and technical analysis. Results from ‘delayed analysis’ for Mugaon scheme in Raigarh district is presented in Figure 4B.4.
Figure 4B.4:Delay analysis for Mugaon scheme in raigarh district
Need for WaterSupply Scheme
Site visits to finalizeasset location
Appointmet ofContractor and
Releasing Moneyfor Construction
Completion ofConstruction Work
Handling Over the Scheme to Gram
Panchayat
Source Examinationby GSDA
Allocation of money for WSSAccording to budget
Fromation of VWSSC
Proposal for NewWSS to RWS Delay
DelayDelay
Delay
Delay
Sactioning of WSSby RWS
Improving the Performance of Rural Water Supply and Sanitation Sector in Maharashtra146

References � Belsare, H. & Mishra, V. (2012).Tadwadi-Morewadi piped drinking
water scheme – a failure analysis. Mumbai, India: Centre for Technol-ogy Alternatives for Rural Areas. (https://www.iitb.ac.in/ctara/en/system/files/Svs%20failure%20analysis%20Tadwadi_0.pdf)
� Prasad, P. (2011). Sugave water scheme – multi village drinking water scheme analysis. Mumbai, India: Technology Development and Solutions Cell. (https://www.iitb.ac.in/ctara/en/system/files/Sugave%20Water%20Scheme%20MVS_0.pdf)
� Rural Water Supply Department Zilla Parishad.(2013-14).Annual action plan.
� Technology and Development Solution Cell, CTARA, IITB. (2014). Report of the third party technical evaluation of rural water supply schemes in Palghar District, Maharashtra. Mumbai: CTARA, IITB.
� Technology and Development Solution Cell, CTARA, IITB.(2016-17). Report of the third party technical evaluation of rural water supply schemes in Thane district, Maharashtra.Mumbai: CTARA, IITB.
� Water Supply and Sanitation Department.(2000). Implementation of revised guidelines for rural water supply programme in the state. Govern-ment Resolution No: Gra.Pa.Dho.- 1099 / Case No.328 / Pa.Pu.-07, Dt. 27 July 2000. Mumbai: WSSD, Government of Maharashtra.
� Water Supply and Sanitation Department.(2013). Revision of per capita cost norms for rural water supply schemes. Government Resolution No: Gra.Pa.Dho.- 1208 / Case No.52 / Pa.Pu.-07, Dt. 9 October 2015. Mumbai: WSSD, Government of Maharashtra.
� Water Supply and Sanitation Department.(2015). Guidelines for the third party technical inspection for rural water supply schemes. Govern-ment Resolution No: Gra.Pa.Dho.- 1114/ Case No.61 / Pa.Pu.-07, Dt. 15 June 2015. Mumbai: WSSD, Government of Maharashtra.
Improving the Performance of Rural Water Supply and Sanitation Sector in Maharashtra147

Jal Tantra Software for Design and Optimisation of Water Distribution Networks
Module 4C
4C.1 Introduction
Multi village piped water schemes are projects designed to provide water to a number of villages from a common source of water. They consist of several components requiring many choices to be made regarding their sizing and service. These choices impact the cost of the scheme which is the major factor in deciding whether a scheme is implemented or not. Thus, a scheme design must not only attempt to provide a quality of service that is adequate but also do so while minimizing costs.
Piped water network cost optimization has been studied for more than 30 years now. Several constrained optimization techniques from Linear Programming to Genetic Algorithms to newer meta-heuristics like Tabu Search and Shuffled Frog Leaping Algorithm have been employed to solve various variations of the cost optimization problem.
The pipe networks for these rural schemes are typically gravity fed, since reliable electricity supply is not a given. Acyclic (branched) networks are common since the redundancy provided by cyclic (looped) networks is an unaffordable luxury.
One of the most important aspects in the design of these systems is the choice of pipe diameters from a discrete set of commercially available pipe diameters. In general, each link (connection between two nodes) can consist of several pipe segments of differing diameters. Larger the pipe diameters, better the service (pressure), but higher is the capital cost. The best solution to the branched piped water network cost optimization problem is the selection of pipe diameters that minimize the system cost while providing the requisite service (pressure at demand points).
BRANCH is an optimization tool by the World Bank that attempts to minimize pipe cost for branched pipe networks with a single water source. Though it has limited capabilities in terms of number of pipes (at most 125), and does not guarantee optimal solution, it is used extensively in India for the design of multi village schemes.
Given that BRANCH solves the problem non-optimally and that we want to broaden the scope of the optimization from just the choice of pipe diameters, we build our own system Jal Tantra. The aim is that it will be an all-purpose tool that will aid government agencies in the design of multi village piped water schemes.
As part of extending Jal Tantra beyond BRANCH, we have introduced other network components into the model. Water networks also consist of intermediate tanks also known as ESRs (Elevated Storage Reservoirs) that act as buffers between incoming flow from the primary source and the outgoing flow to the demand nodes. The network from the primary source to the tanks is called the primary network, and the network from the tanks to the demand nodes is called the secondary network. During
Improving the Performance of Rural Water Supply and Sanitation Sector in Maharashtra148

the design stage, the primary and secondary networks are optimized separately with the tanks acting as demand nodes for the primary network. Typically, the choice of tank locations, their elevations, and the set of demand nodes to be served by different tanks is manually made in an ad-hoc fashion before any optimization is done. It is desir-able therefore to include this tank configuration choice in the cost optimization process itself. Therefore, our model is extended to an Integer Linear Program (ILP) model that integrates the same to the standard pipe diameter selection problem. Other compo-nents like valves and pumps are also incorporated into the network model. The inclu-sion of pumps in particular is significant since it means that apart from the capital cost, operational cost will also have to be considered. This opens up interesting choices with regard to the importance of capital vs operational cost in the optimization model.
4C.2 Problem Formulation
NOTE: Variables marked {} are optional
(i) Input
� Source node: head
� Node: elevation, {water demand}, {min pressure requirement}
� Link: start/end node, length, {roughness}, {diameter}, {parallel allowed}
� Commercial pipe diameter: cost per unit length
(ii) Output
� Length and diameter of pipe segments for each link
� ESR: cost of construction for different capacities, ESR size with respect to daily demand, {maximum ESR height}
� Pump: pump efficiency, capital cost per kW, energy cost per kWh, design lifetime, {discount and inflation rate}
(iii) Objective
� Minimize total pipe cost [+ ESR cost] [+ Pump Capital cost] [+ Pump Energy cost]
(iv) Constraints
� Pressure at each node must exceed min. pressure specified
� Water demand must be met at each node
� Pipe diameters can only take values from provided commercial pipe diameters
4C.3 Pipe Diameter Selection
The typical rural piped water network consists of a source MBR (mass balancing reservoir), demand nodes, and pipes connecting them. An example network is shown in Figure 4C.1. It consists of 4 nodes and 3 links. Node 1 is the source for the network providing a constant head of water, and nodes 2, 3 and 4 are the demand points.
Improving the Performance of Rural Water Supply and Sanitation Sector in Maharashtra149

Figure 4C.1: Example network
Figure 4C.2: Commercial pipe info
Nodes in the network have water demands and minimum pressure requirements that must be maintained. The design process involves selecting the diameters for the pipes that must be used to supply these nodes. Lower the diameter, lower is the cost of the pipes. But lower diameters cause higher friction losses in the pipes which may lead to insufficient pressures at the demand nodes. The choice of diameter is to be made from a discrete set of commercial pipe diameters that are available. For this example network, a minimum pressure requirement of 5m and the following set of commercial pipe diameters are assumed (Figure 4C.2):
The optimization goal is to minimize pipe cost under the constraint of minimum pressure requirements at the demand nodes. For this network, optimization provides the following result (Figure 4C.3):
Figure 4C.3: Optimization results
1000m Elevation : 80mDemand : 2 Ips
Elevation : 50mDemand : 3 IpsElevation : 70m
Demand : 5 Ips
Source Head : 100m
700m500m
3
1
2
4
Commercial Pipe Info:
Diameter (mm) Unit Cost (Rs.)
100
400
900
50
100
150
Head : 15.42
Head : 5mHead : 5m
500m
141m + 859m
579m + 121m
Diamete (mm) Length (m)
579
1480
141
Cost (Rs.)
57.9k
592.1k
126.9k
776.9kTotal Cost
50
100
150
4
1
3
2
7
Improving the Performance of Rural Water Supply and Sanitation Sector in Maharashtra150

Note that two of the links consist of two separate pipe diameters. No matter how many commercial pipe diameters are available, the optimal case is guaranteed to have at most two adjacent pipe diameters for a single link in the network. This makes the process of optimization difficult to do manually even for very small networks and almost impossible for any practical sized network. In order to do this optimization in Jal Tantra we have built a Linear Programming (LP) model. For more complex compo-nents such as tanks, pumps and valves, this model is further extended to an Integer Linear Programming (ILP) model. The objective function and the constraints consid-ered for the LP model are briefly described below:
(i) The Objective Function
� O(.): The total pipe cost which is a function of the pipe diameters chosen for
each link
� NL: The number of links in the network
� NP: The number of commercially available pipe diameters
� Dij: Pipe diameter for the link i
� Cij: Cost of link i, a function of the pipe diameter Dij
� lij: Length of pipe diameter j for link i
(ii) Pipe Constraint
(iii) Node Constraint
� Pn : The min. pressure that must be maintained at node n
� HR : The head supplied by reference node
� En : The elevation of node n
� Sn: Set of pipes that connect node n to the reference node R
� HL'ij : Head loss in link i. We use the Hazen-Williams formula for head loss which is given by:
O(.)= ∑∑ Cij (Dij)Iij NL
i=1 j=1
NP
O(.)= ∑ Iij = Li
Pn ≤ HR
� En � ∑∑ HL' ij Iij
HL'ij =
NL
NP
10.68*
j=1
j=1
flowi 1.852
roughnessj
diameterj4.87
i∈sn
Improving the Performance of Rural Water Supply and Sanitation Sector in Maharashtra151

4C.4 Addition of Parallel Pipes
As part of the previous model, a user could provide diameters for existing pipes in the network. Therefore, some links in the model could have fixed diameters. It is possible for this network configuration, that all constraints cannot be met, especially if the fixed diameters provided are very small. This situation is commonly experienced while designing real life networks when the design is to expand existing infrastructure. The previous infrastructure is frequently of not sufficient capacity since it was designed for a smaller population.
It is therefore desirable to allow pipes to be placed in parallel to existing pipes to augment capacity if and when required. To capture this requirement, we introduce binary variables pij and pi for each link i and commercial pipe diameter j. pij represents the choice of diameter for the parallel pipe for link i. No parallel pipe being chosen is represented by the variable pi. Note that since we are introducing binary variables our program now once again reverts to an Integer Linear Program. But in this particular case the performance is not affected significantly since these variables are introduced only in the case of links with existing pipes, and then too only if user permits the addition of parallel pipes to those links. These are typically going to be a very small number as compared to the total links in the network.
4C.5 ESR Sizing and Allocation
The ESR/Tank configuration problem is to determine the ESR locations, heights, capac-ities, and the downstream demand nodes that each ESR will service. The purpose of using ESRs is to divide the network into a primary network and secondary networks. Primary network distributes the water from the source to the ESRs. Each ESR then distributes water to the demand nodes it is responsible for. This division of responsi-bility helps in providing a more equitable distribution of water in the entire network. Typically, this choice of ESR configuration is made in an ad-hoc manner, relying on the intuition and experience of the designer. This choice is integrated in our capital cost optimization formulation and the same is implemented in Jal Tantra.
ESR allocation in a network can be done in several ways. The choice can be an ESR for each demand node or a single ESR for the entire network or any other configuration in between these two extremes. This allocation then determines the ESR capacity. The following figure 4C.4 depicts the two extreme configurations as well as the “optimal” one for a sample network with 6 demand nodes. Note how the choice affects the primary/secondary networks.
Improving the Performance of Rural Water Supply and Sanitation Sector in Maharashtra152

Figure 4C.4: Alternate tank/ESR configurations for a sample network
4C.6 Pumps/Valves
So far, we have only looked at networks that have solely relied on gravity for the transmission of water. But in most real-life scenarios it is often the case that part of the distribution network is at a higher elevation than the source. It might be possible to increase the source head by constructing the MBR at a height but then this might put a heavy load on the capital cost of the scheme. To ensure that the high elevation locations receive water, one might be forced to employ pipes of large diameters that are very expensive.
On the flip side there might be networks where the source is at a very high eleva-tion and therefore there is excessive pressure in the entire network despite using the smallest pipe diameters. The problem with excess pressure is that it might lead to bursting of pipes and as such higher resilience pipes may need to be employed which again increases the capital cost.
To address the problems of too less or too much head, network components like pumps and valves can be employed. Pumps help provide additional head to the network. Up to now we have only considered the capital cost of the scheme. But with pumps an important component of its cost, if not the most, is its operational cost. The energy required to run the pump is a continuous cost that the scheme must bear. So with the introduction of pumps, we must now consider the operational cost in addition to the capital cost of the scheme.
4C.7 GIS Integration
To describe the network, we need to provide elevation data for nodes as well as the lengths of the links connecting them. These values are measured using physical surveys at location to ensure accuracy before doing the final design. But for earlier prototype designs to gauge feasibility of the design GIS data is used. This data is looked up and then entered manually. This can be a very tedious process, especially for
Tank Allocation
Single Tank
TankNo TankSource
PrimarySecondary
Tank at each demand node Optimal
8
93
107
6
2
4
111
8
93
107
6
2
4
111
93
107
6
2
4
111
8
Improving the Performance of Rural Water Supply and Sanitation Sector in Maharashtra153

Figure 4C.5: GIS tool in Jal Tantra
link distances since the link must typically be manually drawn along the road network.
As part of our web system we have integrated google map based GIS which allows the user to add nodes on the map. Links between the nodes can be simply added using the google directions service without having to manually enter the entire path. The tool also allows us to view the elevation profile of the paths generated. This is then used to add dummy nodes along the path at points of high elevation. Information like elevations and distances can then be extracted directly into the node/pipe information screens. A sample network created using the GIS tool is shown in figure 4C.5 below.
4C.8 Jal Tantra System Description
The first version of Jal Tantra was developed as a java desktop application. Although java is ubiquitous, we still faced installation and usage issues during demonstration of Jal Tantra to government agencies. Therefore we decided to develop a web version of the system. A web application allows Jal Tantra to be demoed or used on any system. For the optimization we use the linear solver library CBC. Google OR tools were used as the Java interface to the CBC library. The system is available at http://www.cse.iitb.ac.in/jaltantra . The system can also be downloaded and run on a local server. Descrip-tion of the system in general and the download link for the local server version is avail-able at http://www.cse.iitb.ac.in/~nikhilh/jaltantra . The local server version requires JAVA 8.
Data input to the software can be entered manually or via importing files in various formats.
� BRANCH Files: .bra file format used by BRANCH. Users of BRANCH software can easily test Jal Tantra using their existing files.
Improving the Performance of Rural Water Supply and Sanitation Sector in Maharashtra154

� XML Files: .xml file format. Standard xml format to allow easy input from future 3rd party sources.
� Excel Files: .xls file format. Suited for users having data already present in Excel files.
The output of the optimization can be saved as an Excel File. The output network can also be saved as an EPANET file to be used in further modelling or verification. Another option that is included is the ability to export the network as an EPANET file. This is useful since EPANET is the de-facto software used for running water networks simulations. Previously it was a tedious process to transfer the output of Jal Tantra or BRANCH and create the EPANET network manually. Figure 4C.6 shows the EPANET file generated for the Mokhada network. The dagre javascript library was used to generate the coordinates for the EPANET file.
LEFT: Figure 4C.6: EPANET file for Mokhada network
RIGHT: Figure 4C.7: General tab of Jal Tantra
Improving the Performance of Rural Water Supply and Sanitation Sector in Maharashtra155

Figure 4C.9: Pipes tab of Jal Tantra
Figure 4C.10: ESR tab of Jal Tantra
Figure 4C.8: Node tab of Jal Tantra
4C.9 Jal Tantra System Screenshots
Various screenshots of the Jal tantra optimisation software are provided from Figure 4C.7 to Figure 4C.12.
Improving the Performance of Rural Water Supply and Sanitation Sector in Maharashtra156

Figure 4C.11: Pump tab of Jal Tantra
Figure 12: Results tab of Jal Tantra
Improving the Performance of Rural Water Supply and Sanitation Sector in Maharashtra157

Operation and Maintenance of the Rural Water Supply System
Module 5A
5A.1 Introduction
“Operation refers to timely and daily operation of the components of a Water Supply System effectively by various technical personnel, as a routine function.” “Mainte-nance is defined as the act of keeping the structures, plants, machinery and equip-ment and other facilities in an optimum working order”. Maintenance includes preven-tive /routine maintenance and also breakdown maintenance. However, replacements, correction of defects etc. are not considered part of preventive maintenance. The expenditure for rural water supply is met by the Ministry of Drinking Water and Sanita-tion under the National Rural Drinking Water Programme NRDWP as well as by State Governments and loans from National/International financial institutions.
Water safety plans to ensure good quality water, Standard Operating Procedures including who will do what and when, and to identify associated annual expenses and Revenues Service Improvement plans to set out future investments to ensure improved, sustainable service delivery, are needed for the efficient and effective operation of a rural supply system.
The O&M strategy for a good rural water supply system should include the following:
� Individual scheme wise plans for all units and all pieces of equipment
� Capacity building for O & M personnel
� Ensuring the availability of spares and tools
� Water auditing and leakage control through metering, improved O & M practices and creation of awareness
� Efficiency in energy use
� Sound financial management including control of expenditure and full cost recovery of O&M cost through user charges (As per NRDWP guidelines, 15% of NRDWP funds can be used by the state/ Union Territories on O&M of rural drinking water supply schemes).
� Systematic maintenance of records and reports with a reporting system for problems regarding equipment
Improving the Performance of Rural Water Supply and Sanitation Sector in Maharashtra158

5A.2 Different Components and their Maintenance Requirements
The components of a rural water supply system are source/ intake works, raw water storages, transmission system, filtration unit, pumping machinery, disinfection unit, balancing reservoir, distribution system, water testing laboratories /storage facilities & operators’ quarters and clear water storage/reservoir. The common water sources for rural water supply are:
� Surface sources which include rivers, canals, streams, reservoirs, lakes and tanks
� Sub surface sources including infiltration wells, infiltration galleries and local springs &
� Ground water sources which are open wells, sanitary wells and bore wells
The intake structures used for withdrawing water from surface sources and related structures must be inspected, operated and tested periodically at regular intervals and the racks/screens inspected, maintained and cleaned regularly. The intake facilities including gates and valves are to be serviced and lubricated periodically.
In the case of a dug/sanitary well the main O&M activities include de silting the well periodically as required and dewatering and cleaning the bottom of the well annually. The well wall, supports for pulleys, rope and pulleys and related structures must be maintained in good condition.
The maintenance of hand pumps can be divided into minor and major repairs. Repairs that do not require moving the hand pump from the assembly are treated as minor while those repairs that require disassembling of the hand pump are treated as major repair and require trained personnel at the Panchayat level or need to be outsourced. Regular and annual preventive maintenance of the hand pump assembly need to be carried out.
For mechanised tube wells and dug wells, preventive maintenance is needed to avert failure of wells due to corrosion of screens, mechanical failure and encrusta-tion with chemicals in water. Salt encrustation or scaling is a problem encountered in areas where underground water has high levels of pH or hardness, and the scale consists of calcium or magnesium carbonate or calcium sulphate. The likelihood of scaling of pipes can be detected by the presence of high pH and the chloride-car-bonate ratio in water samples. Monitoring of silting should be undertaken and proper pumping conditions maintained to prevent failure. Annual maintenance should include removal of the pump and rising main from the well and inspection of mechanical and electrical components.
Infiltration wells need to be protected from illegal sand mining while infiltration galleries must be protected from contamination by locating the collector wells upstream of and at safe distances from sources of contamination. Annual sanitary inspection of infiltration galleries with particular attention to the catchment areas and periodic testing of water quality are required. Care should be taken to maintain the design pumping rate and not leave the gallery unused for long periods of time. Mainte-nance of galleries involves back washing and chemical treatment.
Improving the Performance of Rural Water Supply and Sanitation Sector in Maharashtra159

O&M activities for the transmission system include maintaining lined and unlined canals transferring raw water, in proper order, as well as maintenance of pipe systems used in water transfer. This includes the operation and maintenance including for preventive maintenance of the pipelines and valves and maintaining proper records of the same including O&M schedules.
Operation and Maintenance of filtration plants including the coagulation and flocculation units is also necessary. In addition to annual maintenance, re-sanding will be required once in 2 or 3 years. Sludge from the water treatment process has to be disposed-off according to pollution control norms. Special treatment plants for algal control and removal of iron, arsenic, fluoride and salts as well as disinfection systems require O&M procedures typical of those plants. For high level of salinity (generally above 1000 pm), RO plants are the preferred treatment systems. For fluoride also, RO systems can be used, though defluorination plants can also be employed. For arsenic, arsenic removal filters are available.
In addition to the above, reservoirs and service reservoirs that store the water used in water supply need proper maintenance. As for the distribution system, in addition to maintaining the pipes and fittings of the water supply system, routine operations in water supply that ensure continuity, reliability, and quantity of water supplied have to be taken care of. The procedures to be followed in case of emergencies, water shortage or breakdown also have to be laid down. Problems with household connec-tions like leakage, theft and contamination of supply through house connections have to be prevented.
5A.3 Monitoring, Surveillance and Evaluation
Monitoring of water quality involves laboratory and field testing of water samples collected from various points in the water supply system including the source, water purification plants, service reservoirs and distribution systems, and at the consum-er’s end. A field water testing kit can be used for testing some critical water quality parameters in the field to provide first-hand information on the quality of water; labora-tory tests give a more detailed and accurate picture about water quality. Understand-ing sampling procedures, testing procedures and reporting methods are important in water quality monitoring. Surveillance is an investigative activity undertaken by a separate agency, to identify and evaluate factors posing a health risk to drinking water.
Surveillance requires a systematic programme of surveys that combine water analysis and sanitary inspection of institutional and community aspects, and reporting system. While inspection identifies potential hazards, analysis indicates actual quality of water and intensity of contamination. The surveillance agency should communicate to the water supply agency pinpointing the risk areas and giving advice for remedial action. Evaluation of a community water supply system requires consideration of a number of factors including quality, quantity, coverage, continuity of water supply and never the least, its production cost.
5A.4 Tariff Fixation and Financial Support
Tariff fixation is to be done by the water agency / PRIs taking into account the O&M costs, depreciation, cost of debt services including doubtful charges and asset
Improving the Performance of Rural Water Supply and Sanitation Sector in Maharashtra160

replacement fund. However, in situations where cost of production and supply of water is prohibitively high and the affordability of the communities being served is poor, subsidies might be necessary to keep the demand for water adequately high so as to generate positive developmental outcomes of improved water supply. Since affordability can also vary across families, it night be desirable to have targeted subsi-dies for the poor.
The tariff should be revised periodically in accordance with the changing variable costs. The method of levying water charges, whether metered or non- metered, must also be decided upon. A Life Cycle Cost approach is recommended as the best financial support system to build, sustain, repair and renew a water system through the whole of its cycle of use. This cost includes not only the cost of constructing the system but also what it costs to maintain it in the short and long term, to replace, extend and enhance it, as well as the indirect support cost of the enabling environment, viz. capacity building, planning and monitoring at both District and state level, not just for a few years, but for the project design period or more.
5A.5 Action Plan for the Operation and Maintenance of Water Supply/ Sanitation systems
The Ministry of Drinking Water and Sanitation has suggested the following action plan for operation and maintenance of water supply/sanitation systems:
A. The states should introduce standard operating procedures for O&M of hand pumps and piped water supply schemes and should identify and assign key functions to the appropriate mechanism for O & M through GPs/VWSCs or person such as the hand pump caretaker or operator or civil societies/trusted NGO.
B. Timely transfer of funds from State plan and the Finance Commission for O&M activities is necessary to enable GPs to operate and maintain schemes without service breaks. Wherever it is not yet adopted NRDWP (O&M) and other funds necessary for drinking water supply to GPs should be transferred electronically to GP accounts.
C. For hand pumps, the GP or VWSC needs to be provided access to spare parts and trained mechanics by the DWSMs for regular preventative maintenance of all hand pumps in the GP.
D. For piped water supply systems with community stand posts and/or household connections, the DWSM/BRC and VWSC need to make sure that the local opera-tors receive training to gain the technical and financial skills to do the job.
E. Block or District Panchayats and Joint Scheme Level Committees consisting of heads of VWSCs/GPs benefited by the scheme are responsible for overseeing multi-village schemes.
F. In multi-village schemes or large water grids, bulk supply should be managed/ operated by PHEDs/Boards or private operators with tariffs set by the State government/PRIs/water resources regulator.
Improving the Performance of Rural Water Supply and Sanitation Sector in Maharashtra161
G. Customer consultation and grievance redressal mechanisms should be established such as provision of a toll-free number, call centres and mobile SMSs for lodging complaints, linking GPs and engineers electronically with Block and District IMIS systems, citizen report cards and community score cards.
H. Initially all bulk water supply and retail water supply to commercial, industrial estab-lishments and private institutions should be metered for volumetric consumption. The advantage of such targeting is that maximum revenue can be generated with minimum cost (of installing meters and transaction cost of taking meter readings). Gradually all household connections should be covered under metering.
I. Water audits, energy audits and measurement of Unaccounted for Water (UFW) and Non-Revenue Water (NRW) should be introduced & institutionalized for bulk water supplies and water distribution.
Improving the Performance of Rural Water Supply and Sanitation Sector in Maharashtra162

Water Source Protection and Source Strengthening
Module 5B
5B.1 Introduction
Source protection refers to all measures to ensure that the source is capable of supply-ing water of adequate quantity and quality on a sustainable basis on long term basis. In the case of domestic water supply sources, source protection becomes extremely important as the supplied water is also used for direct human consumption, and direct exposure to water contaminated by deadly pathogens (bacteria and virus) can even cost in terms of public health hazards and exposure to water contaminated by hazard-ous chemicals can cost in terms of loss of human lives. Source protection becomes important also because drinking water is essential for basic human survival and gets highest priority in water allocation decisions. It is important that water sources earmarked for domestic water supply is protected from illegal diversion for uses such as irrigation and industrial water supply.
Source strengthening refers to engineering measures to improve the yield of the water supply sources. This issue is primarily relevant in the context of groundwater based schemes. In the Indian context, this topic has received great attention in the recent years, because of the widespread problem of failure of drinking water supply wells due to yield reduction or due to lowering of groundwater levels in the well field occur-ring because of excessive withdrawal of water from the same aquifer for irrigation and other uses. In this module, we will discuss about the measures that are available for source protection and source strengthening. We will draw upon international experi-ence in the relevant fields for highlighting the available options.
5B.2 Source Protection
5B.2.1 Surface water sources
In the case of surface water sources, source protection involves: 1] all physical, institu-tional and legal measures to check or control a] direct pollution of water body through disposal of industrial effluents, municipal wastewater, agricultural runoff containing fertilizer and pesticide residues, and solid waste, b] Illegal tapping of water from the source, and c] construction of water harvesting structures and increased cultivation in the catchment causing inflow reduction and pollution of runoff water; and, 2] water-shed management activities in the catchments of the reservoirs, which act as sources of drinking water supply, to check sediment transport and improve the physical and chemical quality of water.
It has been widely reported that haphazard construction of water harvesting struc-tures in the upper catchments of many lakes and tanks in the recent past had resulted in reduced inflows into these water bodies, adversely affecting domestic water supply based on these sources.
Improving the Performance of Rural Water Supply and Sanitation Sector in Maharashtra163

The payment for ecosystem services is an incentive based approach, widely used in some developed countries such as the United States, England and Canada (Kolinjivadi et al., 2014; Smith et al., 2014) and also in some developing countries such as Indone-sia (Fauzi and Anna, 2013; Fripp, 2014), Vietnam (To et al., 2012) and Nepal (Khanal and Paudel, 2012) to improvement the performance of watersheds, which usually involve compensating the farmers in the agricultural watersheds who modify their cropping systems and input uses to reduce the pollution load in the runoff that become raw water for drinking water sources downstream, which is done often at the cost of their own incomes.
There are generally two approaches used for payments, one based on inputs and the other based on outputs. The various types of schemes for payment for ecosys-tem services include: 1] public payment schemes for private land owners to maintain or enhance ecosystem services (they are country-specific, where governments have established focused programs and this form of payment is the most common; and 2] formal markets with open trading between buyers and sellers, under either:
I. A regulatory cap or floor on the level of ecosystem services to be provided. Regula-tory ecosystem service markets are established through legislation that creates demand for a particular ecosystem service by setting a ‘cap’ on the damage to, or investment focused on, an ecosystem service.
II. Or voluntarily self-organized private deals in which individual beneficiaries of ecosystem services contract directly with providers of those services. Voluntary markets also exist and primarily serve companies or organizations seeking to reduce their carbon footprints to enhance their brands, anticipate emerging regula-tion, or in response to stakeholder or shareholder pressure, or other motivations.
III. Or tax incentives: Tax incentives are a form of indirect government compensa-tion for landowners protecting ecosystem services. In exchange for committing resources to stewarding ecosystem services, individuals receive tax breaks from the government.
IV. Certification programmes: Certification programmes designed to reward produc-ers who protect ecosystem services have been developed for a variety of products, including wood, paper, coffee and food, among others.
But as noted by Kolinjivadi et al (2014), payments for ecosystem services (PES) can help achieve the goal of integrated and adaptive water resource management only if: (a) ‘payments’ are socially negotiated rather than designed according to oversimplified efficiency claims for watershed services and (b) the ‘payments’ are well placed to overcome the individual, social and physical constraints associated with watershed goods and services so that capabilities to do so can be enhanced.
Successful cases of Payment for Ecosystem Services
Lombok: A successful PES watershed project
In 2004, WWF Indonesia initiated a PES scheme for watershed protection in the Rinjani Protected Area, Lombok, Indonesia. The Rinjani landscape covers 125,000 ha
(Source: Department for Environment Food & Rural Affairs. (2013) Payments for Ecosystem Services: A Best Practice Guide, Annex-Case Studies, URS, West Country Rivers Trust, Pundamilia Limited)
Improving the Performance of Rural Water Supply and Sanitation Sector in Maharashtra164

of semi-evergreen and tropical rainforest. It is divided into production forest, reserved area and national park, with four districts: Lombok Barat, Lombok Utara, Lombok Timur and Lombok Tengah. A WWF study in 2004 calculated that the economic value of the ecosystem services from this landscape may be has high as IDR 5.178 trillion (USD 575.3 million). The PES scheme was adopted as part of local government policy and a sustainable financing model was set up. This offers incentives for upstream communities to implement good forest management in the Mount Rinjani ecosystem (Fripp, 2014).
The payment mechanism the local water company involved in this watershed project charges each user an additional fee of between IDR 1000 to more than 2000, with the fee set by user type (e.g. business, individual household, etc.). The income raised is given to an independent body with multi-stakeholder representation, which then oversees the disbursement of funds (approximately IDR 400 million to 500 million per month) to community projects in upstream areas. This body selects projects for funding based on proposals by communities. It is important to note that the company pays for community projects and does not make individual payments to farmers. This payment is not performance based, so communities will not receive payments for projects depending on a particular activity or change in activity (e.g. reduce sediment by X% or receive income of $Y) (Source: Fripp, 2014).
Wessex Water’s catchment management programme, South West England
Developed by Wessex Water, a water service company, this project invests in catch-ment management and works with farm businesses to reduce pollution and improve water quality. One of the key challenges was developing a way of working between a private company and multiple farm businesses, a role which extends beyond the traditional behaviour of a private company.
Wessex Water adopted the role of both buyer and intermediary, also using its internal expertise as principal knowledge provider. For example, the Wessex Water catchment team provides data demonstrating the relationship between groundwater contamina-tion and land management to pinpoint where problems exist, enabling the company to engage with land managers to discuss potential improvements.
(Source: CoLUPSIA interview with WWF & ForCES: Indonesia Country Brief)
Payment for Ecosystem Services (PES) Schemes for Conserving Sardu Watershed NepalThe study of implementation approach of PES in Sardu Watershed considered as a drinking water supply, recreational services and support services at the watershed level. The study estimated the value of ecosystem services to be more than NRs. 60 million a year. However, the economic value of the recreational and regulat-ing services needs to be estimated to give a significant boost to the concept and idea of implementing the PES scheme. The project has considered that poor local communities are at the centre in management and benefit sharing. The result showed that about 47 % of the total population living in the downstream are willing to contribute their physical labour (Shramdan), while 42% have agreed to allocate monetary contribution to the conservation fund for the sustainable management of watershed. To initiate raising financial sources and advance the PES scheme, a conservation fund was set up, in which IUCN contributed NRs 1,000,000 in the form of seed money (Khanal & Paudel, 2012).
Improving the Performance of Rural Water Supply and Sanitation Sector in Maharashtra165

Over the past seven years, strong relationships have been developed between Wessex Water and farmers in target catchments across the area by sharing best practice advice, investing expertise, aiding access to grant schemes and leveraging capital grants. Engagement is based on trust and mutual benefit, and payments are administered between the farmers and water company advisers. A positive relation-ship between buyers and sellers is therefore imperative (Source: Smith et al., 2013).
Sources: Montgomeryshire Wildlife Trust (2010), ‘Living Landscapes’ (online) avail-able here. Reports on the Wessex Water web pages (online) available here. Personal communications from Ruther Barden at Wessex Water and Dr Liz Lewis-Reddy at the Montgomeryshire Wildlife Trust.
5B.2.2 Groundwater sources
In the case of groundwater based schemes, it involves measures to: a] regulate contamination of aquifers from pollutants through disposal of industrial effluents and organic waste; and b] reduce well development that cause over-exploitation of aquifers and resultant well failures or groundwater contamination, leading to failure of drinking water wells. The Dutch Nitrate Directive for controlling disposal of organic waste from dairy farms on agricultural land in the Netherlands through regulatory measures is one example of the former. The Maharashtra groundwater regulation Act (for protection of drinking water sources) is an example of the latter. The Drinking Water Source Assess-ment and Protection Program (DWSAP) administered by the California Department of Public Health is a comprehensive measure for protection of drinking water sources based on groundwater.
The assessment involves:
01. Location of the drinking water source;
02. Delineation of source area and protection zones for both surface water and ground water sources5 ;
03. Identification of possible contaminating activities (PCAs) that are considered potential origins of contamination within each drinking water source area and its protection zones (such as activities associated with both microbiological and chemical contaminants that could have adverse effects upon human health);
04. Determination of the PCAs to which the drinking water source is most vulnerable considering the characteristics of the source and site, the risk ranking of PCAs identified in the inventory, and the proximity of the PCAs to the source; and
05. Assessments for new drinking water sources by public water systems.
The protection involves:
01. Descriptions of state actions to support local entities in developing local protec-tion programs including technical assistance, financial assistance, training and demonstration projects; and
5The surface water source areas are defined by the boundaries of the watershed; zones, if delineated, are closer to the drinking water supply. The ground water source areas and protection zones are delineated based on readily available hydrogeologic information on ground water flow, recharge and discharge, and other information deemed appropriate by the state (Source: California Dept. of Health Services, 1999).
Improving the Performance of Rural Water Supply and Sanitation Sector in Maharashtra166

02. Identification of management approaches that can be used to protect the water supply from contaminants associated with PCAs. These approaches may include, as appropriate, implementation of regulatory and non-regulatory control measures and public education (Source: California Dept. of Health Services, 1999).
For cost effectiveness of protection of groundwater based sources, it is important to focus on the recharge areas of aquifers as they are very vulnerable to land based pollution.
5B.3 Source Strengthening
Source strengthening involves physical (engineering) measures. As mentioned in the introduction, this measure is relevant when the source is groundwater and it is resorted to when the aquifer shows signs of over-exploitation resulting in decline of well yields or deterioration of groundwater quality. Source strengthening can be in the form of:
i] artificial recharge of the over-exploited aquifers using aquifer storage and recovery (ASR); ii] deepening of existing sources; and
iii] adding new wells to the existing well field.
The commonly used method for source strengthening in India is artificial recharge using water available from local catchments, unlike the commonly adopted method of importing water from a distant source during the lean season when demand for water is at its peak. However, this approach has several limitations. One of them is that when surplus runoff is available locally for recharging, the aquifer is often replen-ished fully, leaving no extra space for accommodating the incoming flows. This is the peculiar situation encountered in many hard rock formations which have very low specific yield.
Israel treats municipal wastewater from several small cities (DAN area) using geologi-cal process (Soil Aquifer Treatment) and uses it for augmenting groundwater recharge, and the same recharged water is pumped back for supplying for irrigation6. Precau-tion is made to ensure that chemical dispersion of the percolating water with native groundwater does not take place and that the quality of native groundwater is protect-ed. Such a measure helps reduce the pressure on fresh groundwater for meeting low value uses such as irrigation.
In California, snow melt from Colorado river during the summer season is used for recharging aquifers in eastern parts using large spreading basins. These recharge areas are well protected. In California, which is known world over for groundwater intensive use for agriculture and aquifer over-exploitation, the artificial recharge programmes started in the 1890s.
Such measures are likely to be infeasible in most regions of India in lieu of the fact that the average operational holdings are very small (when compared to countries like the United State) and the farmers will not have sufficient land that can be used for recharge to spare. Another constraint is the lack of availability of natural flows in streams and rivers during peak summer season when aquifers run dry.
6Detailed description of Soil Aquifer Treatment is available in module 7 of this compendium.
Improving the Performance of Rural Water Supply and Sanitation Sector in Maharashtra167

Yet artificial recharge as a concept has received a lot of attention from government policy makers and development practitioners water-scarce regions of India where failure of water supply schemes is common. In Gujarat state of western India, the Water Supply and Sanitation Management Organization (WASMO) undertakes source strengthening projects (percolation tanks, check dams) to augment the recharge to the shallow aquifer which is tapped for drinking water supply. However, there are no hard evidence to the effect that such measures dependent on local water harvesting were effective.
In the Netherlands, storm water runoff and water from roof catchments is used for recharging aquifers to prevent the intrusion of seawater into freshwater aquifers occur-ring due to excessive pumping of the water from the aquifers for various uses includ-ing municipal water supplies and industrial use.
All these measures require proper scientific studies to ascertain the geohydrological properties of the aquifer in terms of the amount of water they can hold (specific yield and storage coefficient of the aquifer being recharged) and time for diffusion (hydraulic diffusivity); the infiltration capacity of the soil for water to percolate; and the maximum intensity of the storm water runoff that is likely to occur in an area; and the difference in the chemical quality of the rainwater/runoff water and the chemical quality of the native groundwater, if chances of mixing of both the waters are high.
In the Indian situation, direct use of storm water for recharging shallow aquifers might turn out to be quite risky from public health point of view, as storm water in urban areas generally contain a lot of carbon, heavy metals (lead) and lubricants. Treating this water for removing the hazardous contaminants might work out to be prohibitively expensive.
There are several cases, replenishment of drinking water sources had happened by default due to import of water from water surplus regions for irrigation. The best illus-trative case is the Sardar Sarovar project. When water from the project was introduced for gravity irrigation in some of the water-scarce regions of Gujarat (viz., North Gujarat, Central Gujarat and South Gujarat), it has led to augmented recharge of groundwa-ter due to irrigation return flows from the canal command areas and seepage from canals. In addition to improving the sustainability of drinking water wells through yield improvement, it has also resulted in reduction in salinity of groundwater being pumped by these schemes (Jagadeesan and Kumar, 2015).
5B.4 Conclusions
Continuous monitoring (of both surface water quality, groundwater levels and ground-water chemistry, recharge areas) that supply water to the drinking water sources and developments (landfill sites, mining areas, industrial clusters, effluent disposal sites, potentially contaminating activities, etc.) in the areas surrounding these sources is key to achieve source protection. This would require trained staff, equipment and financial resources. In the case of groundwater, however, monitoring alone will not be suffi-cient to ensure sustainability of the drinking water sources. Since the legal rights to groundwater are not well defined, with the land owners being permitted to access as much water as he/she deems fit from the aquifer underlying his/her piece of land, sustainability of public water supply schemes in semi-arid and arid naturally water-
Improving the Performance of Rural Water Supply and Sanitation Sector in Maharashtra168

scarce regions will always be a question mark as the water demand for irrigation is far greater than the amount of water that aquifers in such regions can supply from the annual replenishment from precipitation. Such problems are unlikely to occur in humid or sub-humid water rich regions (like in eastern India), as the demand for water in agriculture is much less than the total amount of renewable water resources available from surface runoff and groundwater recharge. Measures for source strengthening also require continuous monitoring to ensure that native groundwater is not contami-nated by the treated sewage or storm water runoff used for artificial recharge.
Engineering interventions for strengthening of groundwater based drinking water sources should follow proper scientific assessment of the aquifer for its geo-hydrolog-ical properties and study of the chemical quality of water used for recharging.
References � California Department of Health Services (1999). Drinking water source assess-
ment and protection program. California, US: Division of Drinking Water and Environmental Management, California Dept. of Health Services.
� Department for Environment, Food and Rural Affairs (2013). Payments for Ecosystem Services: A Best Practice Guide, Annex-Case Studies, URS, West Country Rivers Trust, Pundamilia Limited.
� Fauzi, A., &Anna, S. (2013). The complexity of the institution of payment for environmental services: A case study of two Indone-sian PES schemes. Ecosystem Services, 6(2013), 54-63.
� Fripp, Emily (2014)Payments for Ecosystem Services (PES), A practical guide to assess-ing the feasibility of PES projects, Centre for International Forestry Research (CIFOR).
� Khanal, R., Paudel, D. (2012) Payment for Ecosystem Services (PES) Schemes for Conserving Sardu Watershed Nepal: Existing Practices and Future Prospects, Techni-cal Working Paper, International Union for Conservation of Nature(IUCN), Nepal.
� Jagadeesan, S., & Kumar, M. D. (2015). The Sardar Sarovar project: assess-ing economic and social impacts. New Delhi: SAGE Publications India.
� Kolinjivadi, V., Adamowski, J., &Kosoy, N. (2014).Recasting payments for ecosystem services (PES) in water resource management: A novel insti-tutional approach. Ecosystem Services, 10(2014), 144-154.
� Smith, S., Rowcroft, P., Everard, M., Couldrick, L., Reed, M., Rogers, H., Quick, T., Eves, C. and White, C. (2013). Payments for Ecosys-tem Services: A Best Practice Guide. Defra, London.
� To, P. X., Dressler, W. H., Mahanty, S., Pham, T. T., &Zingerli, C. (2012).The prospects for payment for ecosystem services (pes) in Vietnam: a look at three payment schemes. Human Ecology,40(2), 237-249.
Improving the Performance of Rural Water Supply and Sanitation Sector in Maharashtra169

Operation and Management of PWS (Overview, Assets and Leakage Detection)
Module 5C
5C.1 Current Scenario of O&M
O&M strategy for PWS scheme is focused more on institutional suitability than physical sustainability. Decentralized management is promoted in almost all cases and Panchayat Raj Institutions (PRIs) are supposed to take care of O&M. But PRIs often fails to live up to its assigned role due to:
A. Lack of technical capacity and low financial ability
B. Capacity building mechanism of PRI is not effective through Block Resource Center
C. O&M of PWS schemes also face Institutional neglect which is evident from obser-vations listed below
D. Operation is not explicitly delineated in DPR because operation is not completely thought through in planning & design phase
E. Low skill person is employed as valve man for O&M and no training is provisioned
F. No operation schedule is prepared at operation & maintenance phase
G. Although no zoning is provisioned in design in most cases, distribution is divided into various zones on ad hoc basis.
H. No maintenance strategy: Annual Maintenance Contract(AMC) is not done
Principle reason for 2 &3 is lack of adequate fund for necessary O&M.
5C.2 Possible Reasons for Poor O&M
Our experience of piped water supply scheme points to a contradiction where all rural schemes are financially sustainable in planning phase but most rural schemes are found not financially sustainable in operational phase. In order to understand this, 5 schemes in Konkan region were audited with greater emphasis on O&M.
Detailed analysis was carried out based on evaluation of 5 completed schemes (Sapgaon, Borsheti, Kinhavali, Gegaon, Khodala) by TDSC, IITB. We found that 4 out these 5 completed schemes in Palghar and thane district are financially unsustain-able. Detailed analysis for actual vs planned value for different parameters of O&M is compared and presented in Table 5C.1. Significant deviations are observed in planned and actual value specially in extent of metering and household connection. It can be
Improving the Performance of Rural Water Supply and Sanitation Sector in Maharashtra170

Table 5C.1: Comparison of actual vs planned for parameter of O&M
Sr No Parameter of O & M calcu-lation
Planning Benchmark
Actual values Conclusion
1 Current supply / design capacity 79% 86%, 145%, 41%, 44% 105% Mostly higher
2 Household connection adoption 80% 53%, 31%, 26%, 50%, 87% Low
3 Current Tariff / planned tariff 100% 48%, 250%, 133%, 0%, 147% Mix
4 Water meter provision 100% 0%, 0%, 0%, 0%, 0% No Metering
5 Operating LPCD 40 LPCD 251, 121, 81, 59, 81 Higher LPCD
6 Cost recovery potential 100% 35%, 50%, 34%, 0%, 196% Low recovery potential
These schemes were also studied from unit economics point of view and costs of production per 1000litres (Rs/1000L) were compared with their respective potential recovery per 1000 litres.
5C.2.1 Background of the study
a) Assumptions
� These schemes are not representative sample for all PWS schemes in Maharashtra.
� Scenario 1: Schemes are operational but no maintenance activities are being carried out. (Absence of any real maintenance cost).
� Scenario 2: Scenario 1+ hypothetical maintenance is carried out as per planned.
b) Observations
� 4 of 5 VWSC have officially appointed one valve man.
� 5 of 5 Schemes does not annual maintenance contract with any agency.
� All schemes are in operation under scenario 1.
� In case of Gegaon scheme, VWSC has not established tariff structure.
Table 5C.2: Cost of production under three scenario and revenue potential per 1000 L
Sr No Scheme name Units (Rs/1000 litres)
Planned scenario Scenario 1 (Operation + No maintenance)
Scenario 2 (Operation Planned mainte-nance)
Revenue poten-tial
1 Sapgaon 9.22 3.2 6.0 1.6
2 Borsheti 4.48 2.1 6.0 8.1
3 Kinhvali 9.27 5.8 12.8 6.4
4 Gegaon 2.01 4.5 18.4 0.0
5 Khodala 3.36 5 14.4 8.1
stated from this analysis that poor socio economic consideration in planning is princi-ple reason for poor O&M.
Improving the Performance of Rural Water Supply and Sanitation Sector in Maharashtra171

Following can be concluded from Table 5C.2:
A. These schemes are operational under scenario 1, where there is considerable deviation form planned scenario and maintenance are neglected.
B. These schemes are not financial sustainable in long run as revenue potential is lower than ideal scenario (scenario 2 which includes maintenance).
C. If these schemes continue to be operational under scenario 1, It will be detrimen-tal to infrastructure in absence of maintenance.
5C.3 Intervention Theme and Remedies
It has been established over previous sections that O&M is not good hence it needs intervention along various themes and phases of scheme. Intervention remedies for better O&M scenario is presented in Table 5C.3.
Table 5C.3: Intervention remedies for better O&M scenario
Planning & Design
� Provision of essential valve for zoning
� Provision for monitoring and preventive device
� Operation schedule in DPR
� Delineation of operation at present phase
� Coping strategy of operation at each year
� Lack of clarity in operation schedule
Implementation � 100% design adherence
� Sufficient provision of valves
� Sufficient monitoring and preventive device for operation
IEC (Information Education and communication) � Designing predictable schedule of supply and communicating to consumers
� Use of local language in communication
Human Resource Development � Regular training of operator and maintenance team
Operation � Operation plan in adherence to original operation plan
� If required, alternative operation schedule designed by engineers must ensure Prevention of water hammer is essential: Min velocity, Max velocity criteria must be satisfied
� Supply should be based on Bulk meter reading
� Consider leakage for operation design
Physical system management is also important theme of O&M which have been discussed next over two sections of asset management and leakage management.
Improving the Performance of Rural Water Supply and Sanitation Sector in Maharashtra172

5C.4 Asset Management
Detailed guideline for asset management is provided in Operation and maintenance manual for rural water supplies by Ministry of drinking water and sanitation, govern-ment of India. For every asset this O&M Manual lists daily activity, weekly activity, monthly activity and annual activity for maintenance. We would like to add few best practices for O&M from the field.
A. Use of essential equipment for measurement
� Pressure gauge for pressure monitoring
� Ammeter for current monitoring
� Voltmeter for voltage monitoring
B. Air vent pipe at tank top (One air vent pipe for every 20 m2 of roof area)
C. Water level indicator at tank
5C.5 Leakage Management
Leakage management constitutes important part of operation & maintenance activi-ties. Detection and repair of small leaks in a distribution system are critical functions of system operation and maintenance, yet they are often neglected. Non-revenue water NRW is commonly expressed as a percentage of the total water volume input into a system. Table 5C.4 list all component of water balance as defined by IWA. Ultimate objective of leakage management is to reduce extent of NRW by controlling real losses (physical losses).
Table 5C.4: IWA water balance
System Input Valume (Corrected for known errors)
Authorized Consumption
Billed authorized Consumption
Billed Metered Consumption (including water exported) Revenue WaterBilled Unmetered Consumption
Water Losses
Unbilled Authorized Consumption
Unbilled Metered Consumption
Non-Revenue Water (NRW)
Unbilled Unmetered Consumption
Apparent Losses
Unauthorized consumption
costumer Metering Inaccuracies
systematic Data Handling Errors
Real LossesLeakage on Transmission and Distribution Mains
Leakage on Service Connections up to point of Customer Metering
(Source: IWA, 2007)
Improving the Performance of Rural Water Supply and Sanitation Sector in Maharashtra173

5C.5.1 Factors influencing leakage
Leakage in any piped system depends of several factors which have influence on amount, frequency and special occurrence of leakages. These are:
A. Infrastructure condition
B. Service connections - number, Ownership and location of customer meters
C. Length of mains
D. Actual number of new leaks on pipeline
E. Average run-times of reported and unreported leaks
Types of leak
All the leaks have been classified into 3 categories by IWA.
A. Reported leaks and breaks: typically, high flow rates, short run-time notified to the water utility by customers etc.
B. Unreported leaks and breaks: typically, moderate flow rates, long run-time located by active leakage control.
C. Background leakage (mostly at joints and fittings):flow rates too small but run continuously.
Amount of leakage
There are three major steps for leakage management: Awareness, Location, repair. Time taken during these three step influenced amount of leakage through that particu-lar leakage. Since flow rate as well as time required to fix leakage both are determinant of amount of leakage and leakage with higher flow rate usually have low awareness time, it is not necessary that big leakage did not leads to large water loss. Leak volume can be formulated in equation as:
Leak volume through leak = (Awareness + Location + Repair time) * Flow rate
5C.5.2 Four basic leakage management techniques
Leakage management techniques have been classified into four categories:
A. Pressure management
B. Speed and quality of repair
C. Pipe material management
D. Active leakage control
Improving the Performance of Rural Water Supply and Sanitation Sector in Maharashtra174

Figure 5C.1: Four basic leakage management techniques
(Source: IWA,2007)
Pressure management can be done by effectively monitoring and regulating operation. Second, third and fourth techniques are management exercise focused on mainte-nance.
Overall objective of all four techniques is to reduce total real loss to unrecoverable annual real loss and recover potentially recoverable annual real loss. Figure 5C.1 shows four basic leakage management techniques and its role in water loss recovery. Apart from active leakage control rest are easy to understand.
5C.5.3 Active leakage control
In order to control volume of loss active leakage control can only be achieved by following methods:
a) Decrease in awareness time
� Establishment of customer reporting system
� Decrease response time of maintenance team
b) Decrease in location time
� Leakage localization
� Leak detection
c) Decrease in run time
� Speedy recovery of leaky pipes
Speed andQuality of Repairs
Active Leakage Control
PressureManagement
Potentially
Recoverable Annual
Valume of Real Losses
UnrecoverableAnnual Real Loss
(UARL)
Pipe Material isManagement
Improving the Performance of Rural Water Supply and Sanitation Sector in Maharashtra175

5C.5.4 Location technology
Since speed recovery and repair hinges on location detection of leak, role of location technology become important in active leakage control, which can also be divided into leakage localization and leak detection. Location technology also depends on opera-tion of system. If continuous water supply system is working, then values of night flow (where demand is low or nill) can easily give us idea about leak location. But in case of intermittent system it is far more cumbersome although intermittent systems are more prone to leakages.
Leakage localization
Leakage localization is identifying pipe segment of leakage. It can be regular or one-time activity depending upon needs and priorities. It can easily be done by following steps:
� Step 1: Install bulk meter at strategic location
� Step 2: Water audit at different section of pipelines
� Step 3: Leakage quantification on different segment which leads to leak localiza-tion
Leak detection
Even if leakage is localized we need exact location of leak in order to fix it. There are many technologies which range from simple sounding machine to advance acoustic logger that are available for this purpose. Procedure of leak detection is also depen-dent on technology selection.
Improving the Performance of Rural Water Supply and Sanitation Sector in Maharashtra176

Bibliography � Belsare, H. & Mishra, V. (2012). Tadwadi-Morewadi piped drinking water scheme – a
failure analysis. Mumbai, India: Centre for Technology Alternatives for Rural Areas. https://www.iitb.ac.in/ctara/en/system/files/Svs%20failure%20analysis%20Tadwadi_0.pdf
� International Water Association. (2007). Leak location & repair guidance notes. UK: IWA.
� Prasad, P. (2011). Sugave water scheme – multi village drinking water scheme analysis. Mumbai, India: Technology Development and Solutions Cell.https://www.iitb.ac.in/ctara/en/system/files/Sugave%20Water%20Scheme%20MVS_0.pdf
� Rural Water Supply Department Zilla Parishad.(2013-14). Annual action plan.
� Technology and Development Solution Cell. (2014). Aghai piped drinking water scheme: a failure analysis. Mumbai: CTARA, IIT-Bombay.
� Technology and Development Solution Cell.(2016-17). Reports of third party technical evaluation of rural water supply schemes in Palghar district, Maharashtra. Mumbai: CTARA, IIT-Bombay.
� Technology and Development Solution Cell.(2016-17).Reports of third party technical evaluation of rural water supply schemes in Thane district, Maharashtra. Mumbai: CTARA, IIT-Bombay.
� Water Supply and Sanitation Department.(2000). Implementation of revised guidelines for rural water supply programme in the state. Govern-ment Resolution No: Gra.Pa.Dho.- 1099 / Case No.328 / Pa.Pu.-07, Dt. 27 July 2000. Mumbai: WSSD, Government of Maharashtra.
� Water Supply and Sanitation Department.(2013). Revision of per capita cost norms for rural water supply schemes. Government Resolution No: Gra.Pa.Dho.- 1208 / Case No.52 / Pa.Pu.-07, Dt. 9 October 2015. Mumbai: WSSD, Government of Maharashtra.
� Water Supply and Sanitation Department.(2015). Guidelines for the third party technical inspection for rural water supply schemes. Govern-ment Resolution No: Gra.Pa.Dho.- 1114 / Case No.61 / Pa.Pu.-07, Dt. 15 June 2015. Mumbai: WSSD, Government of Maharashtra.
Improving the Performance of Rural Water Supply and Sanitation Sector in Maharashtra177

Institutional Environment and Institutional Structures for Rural Water Supply
Module 6
6.1 Introduction
Institutional environment and structures are two sub-components of water institu-tions for managing and governing water resources. Saleth and Dinar (2004) in their exemplary work on ‘institutional economics of water’ described water institutional environment (governance framework) as one which is determined by the history, constitution, economic, social and political systems, and water resource endowment of the country, whereas the institutional structure (governance structure) for water is determined by water-related law, policies and organizations (Figure 6.1). As Figure 6.1 suggests, the institutional environment and the water institutions together determine the performance of water sector. The water institutional structure is decomposed into water law, water policy, and water organization or administration and each of these institutional components are decomposed further to highlight a few of the most important aspects (see Figure 6.2).
Political System
Legal System
Population
Economic Development
Resources / Environment
Water Sector Performance
Water Administration
Water Institutions
Water PolicyWater Law
Figure 6.1: Institutional linkages within the water institutions
(Source: Saleth and Dinar, 2004)
Improving the Performance of Rural Water Supply and Sanitation Sector in Maharashtra178

6.2 Institutional Environment
Water has always been an important subject in political and legal discourse of India and one of the main drivers of its economy. The Indian Constitution grants full control over water to the States. As per Entry no. 17 in List II, Seventh Schedule, Article 246 of the Indian Constitution, development aspects related to water supplies, irrigation and canals, drainage and embankments, water storage and water power are with states. However, the states’ rights are subject to any law enforced by Parliament regarding the regulation and development of inter-state rivers and river valleys (Entry 56, List I, Seventh Schedule, Article 246 of the Indian Constitution).
As per the Indian Constitution Seventy-Third Amendment Act (1992), at the state level, Panchayati Raj Institutions (PRIs) have been legally empowered to prepare plans for drinking water, health and sanitation following a decentralised approach. The present National Rural Drinking Water Programme (NRDWP) also adopts a decentralized approach through involving PRIs and community organisations in planning, develop-ment, operation and maintenance of village water supply schemes (GoI, 2013).
Figure 6.2: Water Institutional Structure
(Source: Saleth and Dinar, 2004)
• Inter-source links
• Inter-resource links
• Water rights
• Conflict resolution
• Accountability
• Scope for private
• Participation
Water Law
• Use priority
• Project selection
• Cost recovery
• Water Transfers
• Turn-over/devolution
• Privatization
• Technology policy
Water Policy
• Government layers
• Structure of water
administration
• Finance/staff patterns
• Pricing/fee collection
• Regulation / accountability
• Information capability
• Technical capacity
Water Organization
Improving the Performance of Rural Water Supply and Sanitation Sector in Maharashtra179

With reference to legal status of water bodies, rivers and most of the surface water bodies are public assets and are under the executive control of State government. Groundwater is usually privately owned under the Indian Easements Act of 1882. However, the National Water Policy 2012 stresses that the groundwater needs to be managed as a community resource held by the state under public trust doctrine to achieve food security, livelihood, and equitable and sustainable development for all.
Only a few States in India have implemented specific sets of control mechanisms to regulate groundwater use. Institutional framework including laws and regulations to control groundwater overexploitation are important as most of the rural water supply schemes in India are based on groundwater sources.
In terms of investments, government of India and States are spending close to US$ 2 billion per annum to provide adequate water and sanitation facilities to rural house-holds (Source: The World Bank). However, this expenditure does not necessarily trans-late into reliable, sustainable and affordable water and sanitation services. Continuing 'quality and quantity' problems along with poor operations and maintenance (O&M) standards and cost recovery are major challenges for achieving full coverage. As a result, nearly 30-40% of the schemes periodically slip back to ‘partially covered’ or ‘not covered’ status.
6.3 Water Institutions
6.3.1 National and state water policies
Till now, India has three water policies, first in 1987, second in 2002 and the third and latest one in 2012. The 2012 water policy clearly mentions that the Centre, the States and the local bodies (Panchayati Raj Institutions and Urban Local Bodies) must ensure access to a minimum quantity of potable water for essential health and hygiene to all its citizens, available within easy reach of the household (GoI, 2012). Thus, it recog-nises a clear link between access to clean water and its health and hygiene benefits.
In India, 14 states have drafted and/or adopted the water policy. These states include: Andhra Pradesh, Assam, Goa, Gujarat, Himachal Pradesh, Karnataka, Kerala, Maharash-tra, Meghalaya, Madhya Pradesh, Odisha, Punjab, Rajasthan, and Uttar Pradesh. The state of Maharashtra adopted its water policy in 2003. As per the water policy, first priority in allocation of state water resources is given for domestic uses including for drinking, cooking, hygiene and sanitation needs and livestock. Further, it lays focus on using surface water sources, such as reservoirs, to supply domestic water in rural areas especially where there is no alternate and adequate source of drinking water. For water quality, policy advocates use of ‘Polluter’s Pay Principal’ and advocates penalty for non-compliance. It also advocates that water quality maintenance shall be made an integral part of the river basin management plans (GoM, 2003).
6.3.2 Relevant legislations and regulations
In addition to water policies, most of the states govern water supply for domestic uses in rural areas through their panchayat acts. Some states such as Chhattisgarh, Himachal Pradesh, Kerala, Madhya Pradesh, Mizoram, and Uttar Pradesh have acts
Improving the Performance of Rural Water Supply and Sanitation Sector in Maharashtra180

Table 6.1: Water supply legislations in Indian States
State Legislation Summary of Key Features
Andaman and Nicobar
The Andaman and Nicobar Islands (Panchayats) Regulation, 1994
In the sphere of sanitation and health, there is a provision for mainte-nance of drinking water supply.
Arunachal Pradesh
The Arunachal Pradesh Panchayat Raj Act, 1997
Schedule 1, section VIII mentions the following duties of the Panchayati raj department with respect to the drinking water: constrzuction, repairs and maintenance of drinking water wells, tanks and ponds; prevention and control of water pollution; and maintenance of rural water supply scheme.
Chhattis-garh
The Chhattisgarh Peya Jal ParirakshanAdhiniyam, 1986
The Act provide for preservation of water in the water sources and for regulation of digging of tube-wells in order to maintain the water supply to the public for domestic purposes and for matters ancillary thereto.
Goa The Goa Panchayat Raj Act, 1994
Section 79 provides the provisions for adequate water supply. It empowers Panchayats to develop, operate and maintain local water sources (also regulate water use) such as tanks, wells, local streams in order to supply potable and sufficient quantities of water for public and private purposes in rural areas.
Gujarat Gujarat Water Supply and Sewerage Board Act, 1978
Provides for the establishment of a water supply and sewerage board for the rapid development and proper regulation of water supply and sewerage services in the state of Gujarat.
Haryana Haryana Panchayati Raj Act, 1994
Gram Panchayat has to take up the responsibility for the: construction, repairs and maintenance of drinking water wells, tanks and ponds; prevention and control of water pollution; maintenance of rural water supply schemes
Himachal Pradesh
The Himachal Pradesh Panchayati Raj Act, 1994
Provides for water supply and sanitation.
Himachal Pradesh Water Supply Act, 1968
Provides for the development, control and management of the water supply works in rural and urban areas of Himachal Pradesh.
Jharkhand The Jharkhand Panchayat Raj Act, 2001
In chapter VII on functions of panchayats, there is a provision for drinking water facilities.
specifically for regulating water supply for domestic and sanitation use in rural areas. Table 6.1 provides list of all such acts in various states.
Improving the Performance of Rural Water Supply and Sanitation Sector in Maharashtra181

Karnataka The Karnataka Ground Water (Regulation for Protection of Sources of Drinking Water) Act, 1999
Chapter II provides the provision for the protection measures for public sources of drinking water.
The Karnataka Panchayat Raj Act, 1993
Powers and duties in regard to sources of water supply are included chapter IV, section 82.
Kerala The Kerala Panchayat Raj Act, 1994
Water supply and sanitation provisions are provided under the Act.
The Kerala Water Supply and Sewerage Act, 1986
Provides for the establishment of an autonomous authority for the devel-opment and regulation of water supply and waste water collection and disposal in the State of Kerala and for matters connected there with.
Madhya Pradesh
Madhya Pradesh Peya Jal ParirakshanAdhiniyam, 1986
Specifies preservation of water in the water sources and for regulation of digging of tube wells in order to maintain the water supply to the public for domestic purposes and for matters ancillary thereto.
Maharash-tra
The Maharashtra Ground-water (Regulation for Drinking Water Purposes) Act, 2013
Regulates the exploitation of groundwater for the protection of public drinking water sources and to provide for matters connected therewith and incidental thereto.
The Maharashtra ZillaPa-rishads and Panchayat Samitis Act, 1961
The Act has provisions on water supply and sanitation by the ZillaParish-ads.
Mizoram The Mizoram water supplies (control) Act, 2004
Provide for and regulate water supply to the house, land, building or premises belonging to any persons, government, central or state or any organisation in the State of Mizoram and for other matters connected therewith.
Odisha Orissa Water Supply and Sewerage Board Act, 1991
The Act has provision for the establishment of a Water Supply and Sewerage Board for development and proper regulation of water supply and sewerage services in the State of Orissa and for matters incidental thereto or connected therewith.
Punjab The Punjab Panchayati Raj Act, 1994
The Act has provisions for water supply and sanitation services by the Panchayats
Rajasthan The Rajasthan Panchayati Raj Act, 1994
Provisions for water supply and sanitation are included.
Improving the Performance of Rural Water Supply and Sanitation Sector in Maharashtra182

(Source: Authors own analysis using Acts of various States) 6.3.3 Groundwater regulation act for drinking source
protection
Only a few states, such as Karnataka and Maharashtra, have Acts to regulate ground-water use for drinking source protection.
Maharashtra passed its Groundwater (Regulation for Drinking Water Purposes) Act, in 1993. The Act prohibited the construction of wells within a radius of 500m from a public drinking water source, if both are in the area of the same watershed. Further, the Act empowered the appropriate authority (district collector in this case) to restrict or prohibit extraction of water (for any purpose other than for drinking) from any well in a identified ‘water scarce’ area (as advised by the state technical groundwater agency which is Groundwater Surveys and Development Agency) during the scarcity period, if such well is within a distance of one kilometer of the public drinking water source (GoM, 1993). However, the Act was not preventive in nature, but only corrective (Phansalkar and Kher, 2006). For instance, the provisions of the Act were only enforceable either in watersheds declared as ‘overexploited’ or if a specific locality was notified as scarcity
Tamil Nadu The Tamil Nadu Pancha-yats Act, 1994
Schedule IV covers provisions for drinking water, health and sanitation, water management and watershed development.
The Tamil Nadu Water Supply and Drainage Board, Act, 1970
This Act provides for the establishment of Water Supply and Drainage Board; and the regulation and development of drinking water and drainage in the State of Tamil Nadu except the Madras Metropolitan Area.
Tripura Tripura Panchayats Act, 1993
There are provisions for the establishment, repairs and maintenance of rural water supply schemes; prevention and control of water pollution; and implementation of the rural sanitation schemes
Uttar Pradesh
Uttar Pradesh Water Supply and Sewerage Act, 1975
In this Act, the provisions for water supply are included in chapter VII.
U. P. KshettraSamitis and ZillaParishadsAdhiniyam, 1961
In this Act, there are provisions for water supply and sanitation.
The U.P. Panchayat Raj Act, 1947
Chapter IV details the powers, duties, functions and administration of gram panchayat. There are provisions for drinking water in which construction, repair and maintenance of public wells, tanks and ponds for supply of water for drinking, washing, bathing purposes and regulation of sources of water supply for drinking purposes are included.
West Bengal
West Bengal Panchayati Raj Act, 1973
Chapter III under section 19 mentions the obligatory duties of Gram Panchayat. There is a provision for the supply of drinking water and the cleansing and disinfecting the sources of supply and storage of water.
Improving the Performance of Rural Water Supply and Sanitation Sector in Maharashtra183

affected in a particular year. There were no provisions for registration of wells or for making applications mandatory for sinking new wells. It does not even provide for compulsory licensing of drilling companies or agencies.
Subsequently, GoM has passed the Maharashtra Groundwater (Management and Development) Act 2009, which replaced the earlier groundwater Act of 1993. This new Act is more holistic and aims at “facilitating and ensuring sustainable equitable and adequate supply of groundwater of prescribed quality, for various category of users, through supply and demand management measures, protecting public drinking water sources and establishing the State Groundwater and District Level Authority to manage and to regulate, with community participation, the exploitation of groundwater within the State of Maharashtra”. As per the section 3(1) of the Act, the Maharashtra Water Resources Regulatory Authority (established under section 3 of the Maharash-tra Water Resources Regulatory Authority Act, 2005) shall be the State Groundwa-ter Authority. Groundwater Surveys and Development Agency (GSDA) has also been provided with more footholds under the Act.
In contrast to the Groundwater Act of 1993 which empowered the District Collector (in consultation with technical officer) to notify the area as ‘over-exploited’ or ‘water scarce’ (and that too in an ad hoc manner), the new groundwater Act empowers the State groundwater authority to notify an area but only on the basis of: recommenda-tions from the GSDA; views of various institutions working in the groundwater field; and views of the users of the groundwater of the area. The decision to notify an area has to be based on scientific studies on groundwater balance and quality; and ground-water estimation. The Act calls for establishment of a Watershed Water Resources Committee (WWRC) to promote and regulate the development and management of groundwater in the notified area. The Act envisaged several restrictions such as, ban on the construction of wells; prohibition on groundwater pumping from the existing deep-wells (more than sixty metre deep); stipulation on deep-wells users to follow the groundwater use plan and crop plan. All these measures are now in operation in notified areas. Unlike the earlier Act which was silent on groundwater quality, the new Act put emphasis on the protection and preservation of groundwater quality of all the existing drinking water sources in the State.
Further, in both notified and un-notified areas, registration of all the well owners is made mandatory (section 7 of the Act); and drilling of deep wells for agriculture and industrial use is prohibited (section 8.1 of the Act). Additionally, section 12 of the Act made it compulsory for the registration of drilling rig owners and operators in the State. The Act also empowered the State authority to identify the potential areas for recharge (for artificial groundwater recharge schemes), in consultation with the GSDA and the Central Ground Water Board (CGWB). The Groundwater Act, 2009 also empowers the District Authority (officer not below the rank of Tahsildar) to enforce the decisions of WWRC. Whenever necessary, The District Authority or any officer duly authorized by it, after giving prior notice to the owner or occupier of any land, may initiate an inquiry or implement or enforce any decisions in connection with the protection of a public drinking water source or with the maintenance of a public water supply system. The District Authority can seize any equipment or device utilised for illegal sinking or construction and can demolish the executed work either fully or partly. Further, the District Authority can also direct any groundwater user who does not comply with the provisions of this Act and rules framed thereunder to close down the extraction of groundwater, and can temporary disconnect its power supply and seal any hydraulic
Improving the Performance of Rural Water Supply and Sanitation Sector in Maharashtra184

work which is found to be illegal. Though, the Maharashtra Groundwater (Manage-ment and Development) Act 2009 is a major improvement over the earlier Act, its’ effectiveness in arresting groundwater exploitation can only be judged once it is imple-mented across the State.
6.3.4 The water (Prevention and Control of Pollution) act
The Water (Prevention and Control of Pollution) Act was adopted in 1974 to provide for the prevention, abatement and control of water pollution and maintaining or restoring the wholesomeness of water. For this purpose, the Act suggested to constitute pollu-tion control boards both at the Central and State level and specified their constitution, powers and functions. The Act also empowered the boards to prohibit use of any stream or well for disposal of polluting matters and to punish the offenders (GoI, 1974).
However, the implementation of this Act is weak as many rivers and other smaller water bodies in India have been heavily polluted. Both the Central and State Water Pollution Control Boards have been unable to control water pollution. One of the reasons for non-performance is that the same agency is regulating as well monitoring water pollution, resulting in under reporting of the pollution loads in surface water as well as groundwater (Kumar, 2010).
In Maharashtra, Pollution Control Board was established in 1970 under the provi-sions of Maharashtra Prevention of Water Pollution Act, 1969. The Water (Prevention and Control of Pollution) Act which was passed by the central government in 1974 was adopted by the state government in 1981 and accordingly various powers and functions of Maharashtra Pollution Control Board (MPCB) were reframed. Some of the important functions of MPCB are:
1] Plan comprehensive program for the prevention, control or abatement of pollution and secure executions.
2] Collect and disseminate information relating to pollution and the prevention, control or abatement.
3] Inspect sewage or trade effluent treatment and disposal facilities, and to review plans, specification or any other data relating to the treatment plants and disposal systems in connection with the consent granted.
4] Support and encourage developments in the fields of pollution control, waste recycle reuse, eco-friendly practices etc.
5] To educate and guide the entrepreneurs in improving environment by suggesting appropriate pollution control technologies and techniques.
6] Creation of public awareness about the clean and healthy environment and attend-ing the public complaints regarding pollution.
In 2001, Ministry of Environment and Forest (MoEF), GoI constituted a Water Quality Assessment Authority (WQAA) which passed an order ‘Uniform Protocol on Water Quality Monitoring’ in 2005. This was to ensure uniformity in the procedure for water
Improving the Performance of Rural Water Supply and Sanitation Sector in Maharashtra185

quality monitoring mechanism by all water quality monitoring agencies, departments, Pollution Control Boards and any other agencies. The order laid down protocols on: frequencies and parameters for analysis of water samples; sample collection; sample preservation and its transportation; keeping sample records; analytical techniques, records and their validation; data processing, reporting and dissemination; and quality assurance and accreditation of laboratories (GoI, 2005).
As per these orders, MPCB has prepared monitoring protocols for surface water (rivers, lakes, ponds, creeks and drains) and groundwater bodies (tube wells, hand pumps and dug wells) in the state (presented in Table 6.2).Presently, MPCB regularly monitors the water quality across 250 Water Quality Monitoring Stations (WQMS) for both surface (155 on rivers, 34 on sea/creeks, 10 on drains, and 1 on dam) and ground water (24 borewells, 24 dugwells, 1 hand pump and 1 tubewell) (GoM, 2017). Out of the total WQMS, 196 (166 surface water and 30 groundwater) are covered under the National Water Quality Monitoring Programme (NWMP) projects namely Global Environment Monitoring System (GEMS) and Monitoring of Indian National Aquatic Resources (MINARS), and 54 (34 surface water and 20 ground water) are covered under the State Water Quality Monitoring Programme (SWMP). Surface water samples are monitored every month and the ground water samples are monitored every six months. Overall, these monitoring programs analyse the water samples for 9 core parameters and 19 general parameters (GoM and TERI, 2014). Distribution of various WQMS in the state is presented in Figure 6.3 and Figure 6.4.
Table 6.2: Protocol for water quality monitoring in Maharashtra
Sr. No. Parameters to be measured Frequency Monitoring Location
A Surface Water Bodies
A1 Field observations
Weather, Approximate depth of main stream/depth of water table, Colour and intensity, Odour, Visible effluent discharge, Human activities around station, Station detail
Monthly/Quarterly (Jan, Apr, July and Oct)
All locations
A2 Core parameters
Temperature, pH, Conductivity, DO, BOD, Nitrate-N, Ammonia-N, Total coliform, Faecal coliform
Monthly/Quarterly (Jan, Apr, July and Oct)
All locations
A3 Bio monitoring
Saprobity Index, Diversity Index, P/R Ratio Three times in a year (Oct, Jan, and Apr)
Selected locations
A4 General parameters
COD, TKN, TDS, Total Fixed Solids, TSS, Turbidity, Hardness, Fluoride, Boron, Chloride, Sulphate, Total Alkalinity, P-Alkalinity, Phosphate, Sodium, Potassium, Calcium, Magnesium
Once a year (Apr) All locations
A5 Trace metals
Arsenic, Nickel, Copper, Mercury, Chromium, Cadmium, Zinc, Lead, Iron
Once a year (Apr) Selected locations
(Source: MPCB)
Improving the Performance of Rural Water Supply and Sanitation Sector in Maharashtra186

A6 Pesticides
Alpha BHC, Beta BHC, Gama BHC (Lindane), OP DDT, PP DDT, Alpha Endosulphan, Beta Endosulphan, Dieldrin, Carboryl (Carba-mate), 2.4D, Aldrin, Malathian, Methyl Parathian, Anilophos, Chloropyriphos
Once a year (Apr) Selected locations
B Groundwater Bodies
B1 Field observations
Weather, Approximate depth of water table, Colour and intensity, Odour, Visible effluent discharge, Human activities around station, Station detail
Twice a year (Apr and Oct)
All locations
B2 Core parameters
Temperature, pH, Conductivity, BOD, Nitrate-N, Total coliform, Faecal coliform
Twice a year (Apr and Oct)
All locations
B3 General parameters
COD, TKN, TDS, Total Fixed Solids, TSS, Turbidity, Total Hardness, Fluoride, Boron, Chloride, Sulphate, Total Alkalinity, P-Alkalinity, Phosphate, Sodium, Potassium, Calcium, Magnesium, SAR, % Na
Once a year (Apr) All locations
B4 Trace metals
Arsenic, Nickel, Copper, Mercury, Chromium, Cadmium, Zinc, Lead, Iron
Once a year (Apr) Selected locations
B5 Pesticides
Alpha BHC, Beta BHC, Gama BHC (Lindane), OP DDT, PP DDT, Alpha Endosulphan, Beta Endosulphan, Dieldrin, Carboryl (Carba-mate), 2.4D, Aldrin, Malathian, Methyl Parathian, Anilophos, Chloropyriphos
Once a year (Apr) Selected locations
Under the NRDWP, about 140 laboratories at the sub-divisional level, 63 laboratories at the district level and one state level laboratory has been set up for drinking water quality monitoring in the State of Maharashtra.
Additionally, Government of Maharashtra has introduced its own Mukhyamantri Rural Drinking Water Programme (MRDWP), vide Government Resolution dated 7th May 2016, with the overall objective of improving the state rural drinking water sector through provision of clean and adequate drinking water to the rural population. Apart from implementing the new piped water supply schemes, the MRDWP will also focus on revival and better O&M of the existing regional water supply schemes. Under the programme, one of the indicators selected to assess the performance of piped scheme is supply of water with no impurities. Thus, the MRDWP also has a strong focus on water quality. It will be implemented for duration of four years, from 2016-17 to 2019-20, at the cost of about INR 2531 Crore (Source: WSSO, Maharashtra).
Nevertheless, community awareness about the water quality monitoring seems to be low. A third party evaluation on the status of rural water supply in Maharashtra (TISS, 2015) revealed that though most of the Gram Panchayat (GP) members believe
Improving the Performance of Rural Water Supply and Sanitation Sector in Maharashtra187

Figure 6.3: Distribution of ground WQMS in Maharashtra
(Source: MPCB)
Figure 6.4: Distribution of surface WQMS in Maharashtra
(Source: MPCB)
Improving the Performance of Rural Water Supply and Sanitation Sector in Maharashtra188

that their water source is free of any contaminants, only a smaller proportion of them confirmed that they are aware of regular test being conducted for the water quality (Table 6.3). It appears that the water quality test results are not shared with the GP members and hence most of them are unaware of the actual quality of the water being supplied.
Table 6.3: Community awareness about the water quality monitoring
Division GP members reporting good quality of source water (% to total surveyed)
GP members aware of the regular water quality testing of the supply source (% to total surveyed
On Bacteriological Parameters
On Chemical Param-eters
Bacteriological Tests
Chemical Tests
Amaravati 100.0 100.0 62.5 50.0
Aurangabad 87.5 100.0 50.0 37.5
Konkan 100.0 100.0 100.0 100.0
Nagpur 100.0 87.5 37.5 25.0
Nashik 100.0 87.5 37.5 50.0
Pune 100.0 100.0 75.0 75.0
State overall 97.9 95.8 60.4 56.3
(Source: TISS, 2015)6.3.5 National guidelines on quality of drinking water in
rural areas
The major purpose of guidelines on drinking water quality is protection of public health. Internationally, the first drinking water quality guidelines were published in 1983-84 by World Health Organization (WHO). The last edition of the guidelines which was more comprehensive than the previous ones was published in 2008 (WHO, 2008).
In India, Bureau of Indian Standards (BIS) formulated IS: 10500 in 1990 for ensuring quality of drinking water. This BIS IS: 10500 was further revised in 2012. Ideally, this standard should be adhered for all water supplies for drinking purpose in India.
NRDWP allocates about 20% of its annual funds for addressing water quality problems which will enable rural communities to have access to safe and potable drinking water. 50% of the allocated funds is provided by the Central government and the remain-ing 50% by the state government. Additionally, 3% of the NRDWP annual funds are allocated for Water Quality Monitoring and Surveillance (WQM&S) in rural habitations and for setting up or upgrading water quality testing laboratories at the State, district, and sub-district level (GoI, 2013). Entire amount is contributed by the Central govern-ment.
The major guidelines for WQM&S are as follows (GoI, 2013):
01. The approach, strategy and mode of implementation of the WQM&S programme should be as per the implementation manual (November, 2004) on National Rural Water Quality Monitoring & Surveillance Programme (now merged with NRDWP).
Improving the Performance of Rural Water Supply and Sanitation Sector in Maharashtra189

02. All drinking water sources should be tested at least twice a year for bacteriological contamination and once a year for chemical contamination.
03. Water testing laboratories can be established or existing ones upgraded at the state, district and sub-district level with a provision of testing few selected chemical parameters (need based) and biological parameters. Water quality testing facilities at the Primary Health Centres which were established under the National Rural Health Mission (NRHM) and operational labs of colleges and schools can be also be used for the programme.
04. The existing Field Testing Kits (FTKs) may continue to be used for primary detec-tion of chemical and biological contamination of all the drinking water sources in the villages. FTKs can also be refilled or replaced with the allocated fund.
05. Information, Education and Communication (IEC) and Human Resources Develop-ment (HRD) for WQM&S should be taken up as part of the Water and Sanitation Support Organisation (WSSO) activities.
06. The services of five Gram Panchayat (GP) level persons who have been trained under the National Rural Drinking Water Quality Monitoring & Surveillance programme will continue to be utilized for the NRDWP surveillance programme. These persons include: Accredited Social Health Activist (ASHA), Anganwadi workers, school teachers, GP members, and social workers.
07. Monitoring is to be done by entering the test results of all the sources tested by the designated labs on the Integrated Management Information System (IMIS) of Ministry of Drinking Water and Sanitation (MDWS), GoI.
08. The habitation and household data must be collected by two village level members: Village Water and Sanitation Committee (VWSC) member selected in the Gram Sabha; and ASHA of NRHM.
09. For implementing the programme, a WQM&S protocol prepared by the MDWS should be referred.
Under the restructured NRDWP, a new sub-programme National Water Quality Sub-Mission (NWQSM) has been started in Feb 2017. The major objective of NWQSM is to provide clean drinking water in 28,000 Arsenic and Fluoride affected habitations in the country. About INR 12,500 crores Central share will be made available for NWQSM over the period of 4 years (up to March 2021).
6.4 Administrative Structures
6.4.1 Ministry of Drinking Water and Sanitation, Government of India
Erstwhile Department of Drinking Water and Sanitation under the Ministry of Rural Development was transformed into a fully-fledged Ministry of Drinking Water and Sanitation (MDWS) in 2011. The MDWS is headed by the Cabinet Minister and is the
Improving the Performance of Rural Water Supply and Sanitation Sector in Maharashtra190

central level nodal agency for formulating national level policies, preparation of guide-lines, planning, funding and programme coordination pertaining to rural water supply and sanitation. As per the mandate provided to the MDWS, they have to ensure that any water planning in rural areas has to be in-line with the overall national perspective of water planning and coordination assigned to the Ministry of Water Resources, River Development and River Rejuvenation (GoI, 2015).
Two programmes of national importance presently being governed and implemented by the MDWS include: National Rural Drinking Water Programme (NRDWP) for provid-ing drinking water security in rural areas; and Swachh Bharat Mission (Gramin) for improving the levels of cleanliness in villages through solid and liquid waste manage-ment activities and making them Open Defecation Free (ODF), clean and sanitised.
6.4.2 Maharashtra Water Resources Regulatory Authority (MWRRA)
MWRRA is established by GoM under the Maharashtra Water Resources Regulato-ry Authority Act, 2005. MWRRA is a crucial institution responsible for determining entitlements, allocation, distribution and management of the state's water resourc-es at the river sub-basin/basin level. It is also empowered to establish a water tariff system, and to fix the criteria for water charges across different sub-sectors (irrigation, industries and domestic uses) at the river sub-basin/basin level. It has to ensure that the water charges are decided on the principle of full cost recovery. Further, while executing its various functions, the MWRRA has to guarantee that the water distri-bution will be undertaken in equitable manner and any further development of water resources in the basin will be properly scrutinised for its economic, hydrological and environmental viability.
6.4.3 Department of Water Supply and Sanitation, Government of Maharashtra
Water Supply and Sanitation Department (WSSD), GoM is the State nodal agency for formulating, implementing, operating and maintaining regional water supply schemes in both rural and urban areas of Maharashtra. The GSDA, the Maharashtra Jeevan Pradhikaran (MJP) and the rural water supply division of Zilla Parishad (ZP) are the three line agencies supporting the WSSD through the Water Supply and Sanitation Organization (WSSO) Directorate. The complete organogram of WSSD is provided in Figure 6.5.
Improving the Performance of Rural Water Supply and Sanitation Sector in Maharashtra191

Minister, Water Supply and Sanitation Department (WSSD), Government of Maharashtra
Maharashtra Jeevan Pradhikaran (MJP)
State Minister, WSSD, Government of Maharashtra
Additional Chief Secretary, WSSD
Deputy Secretary (4)
Director (WSSO)
Zilla Parishad (34)
Rural Water Supply (RWS) Division
RWS Sub Division
Chief Engineer Office
Superintending Engineer Office
Executive Engineer Office
Groundwater Surveys & Development Agency (GSDA)
Deputy Director Office
Senior Geologist Office
VWSC
Sub-Division Office
Village Water and Sanitation Committee (VWSC)
Figure 6.5: Organogram of Water Supply and Sanitation Department (WSSD), Government of Maharashtra
(Source: WSSD, Govt. of Maharashtra)
6.4.4 Maharashtra Jeevan Pradhikaran (MJP)
The MJP mainly consists of engineers and implements the piped water supply schemes. The MJP with central office in Mumbai and Navi Mumbai has field offices spread across the entire State. Overall, there are five Zonal offices, 16 circle offices, 44 work/project divisions and 151 sub-divisions.
The Member Secretary, who is the Chief Executive Officer of the MJP, has the status of Secretary to Government. There is also a Member Secretary (Technical), to exercise technical control over field works, and to whom the Superintending Engineers for coordination, central planning, designing and monitoring report. There are also other subordinate officers and staff. Till 2013, the overall staff strength of MJP was 7186, with 1575 (21.9 per cent) technical, 2947 (41 per cent) non-technical and 2664 (37.1 per cent) contract based positions. The primary responsibility of MJP is planning, design, investigation, detailed engineering and execution of water supply and sewerage schemes in the State. Additionally, MJP arrange finances for these schemes. On the successful completion of these projects, MJP hands them over to the respective local bodies. To settle the administrative expenses, MJP receives a fixed amount on total project costs which has been currently fixed by GoM at 17.5 per cent of the value of projects.
Improving the Performance of Rural Water Supply and Sanitation Sector in Maharashtra192
6.4.5 Groundwater Surveys and Development Agency (GSDA)
The GSDA is a technical agency (mostly geologists), and entrusted with the respon-sibility of overall development and management of ground water. Its Directorate is located in Pune, which is assisted by six regional and 33 district level offices.
As per the Maharashtra Government Resolution of 30th June 2003, there are a total of 1365 sanctioned posts in GSDA, including 892 technical and 473 non-technical posts. In addition, there are 869 posts which had been transferred to Zilla Parishad (ZP) but are under the administrative control of GSDA. GSDA also has a separate engineer-ing and geophysical wing with expertise in groundwater development, management, protection and artificial recharge techniques. For last 40 years, GSDA is engaged in the exploration, development and augmentation of groundwater resources in the State through various schemes. This mainly includes, drilling of bore wells/tube wells under Rural Water Supply Programme, rendering technical guidance under minor irrigation programme by locating suitable dug well sites, strengthening of groundwater sources by water conservation measures, artificial recharge projects, specific studies related to the periodic status of groundwater availability, and protecting the existing groundwater resources through technical assistance under Groundwater Act.
6.4.6 District (ZP) and Gram Panchayats (GP)
As per the changes brought about by the Government Resolution (GR) of June 2003, some of the functions and functionaries of the GSDA and MJP were transferred to Zilla Parishads (ZP). The Water Supply Department of Zilla Parishads mainly compris-es these transferred functionaries and is responsible for implementing water supply and sanitation reform programmes. A Reform Support and Project Management Unit (RSPMU) was also set up in order to facilitate the RWSS reforms process. The RSPMU operates at the State and the district level.
Gram Panchayats (GP) is responsible for demanding new drinking water supply schemes from the ZP. Gram Sabha, electoral college of GP, is empowered to decide on the kind of scheme, the implementing body, as well as about the technical service provider. VWSC, a sub-committee of the GP, also have funds directly allotted to them and they maintain accounts separately (from the general accounts of the GP). They plan, implement, operate and maintain the village water supply scheme autonomously.
6.4.7 Water Supply and Sanitation Organization (WSSO)
In order to implement State level rural water supply programme and national rural water supply programme in the State of Maharashtra successfully as per guide-lines of the Central Government and to implement and monitor rural water supply programmes in general, the Government has decided to establish State level WSSO. The main objective of this organization is planning, implementation and monitoring of rural water supply and sanitation projects and programmes sponsored by Central and State Government and also financed by external agencies.
Improving the Performance of Rural Water Supply and Sanitation Sector in Maharashtra193

The main responsibilities of this organization are to prepare annual action plan; provid-ing technical and administrative assistance to local organizations in planning and imple-mentation of schemes; developing Information, Communication and Education (IEC) and also developing Management Information System (MIS) for monitoring of rural water supply and sanitation programmes. The WSSO will be responsible for imple-menting the policy guidelines of rural water supply and sanitation Programmes and State Water Supply Mission. It will act as Directorate for water supply and sanitation department, in all respects. The organization was formed only in 2009 and is still evolving.
6.5 Conclusion
Both at the National and at the state level (in Maharashtra), multiple institutions exist for managing rural water supply in terms of quantity and quality. These institutions are supported by the many regulations, policies and organizations with proper and elabo-rate administrative structures and norms. However, effectiveness of various regula-tions and institutional performance will be as good as the implementation strategy being followed by the State of Maharashtra. In this regard, it is important to point out that GSDA is conspicuous by the absence of any institutional arm at the local level for enforcing groundwater regulation for protection of drinking water sources, which reduce institutional effectiveness. Though Maharashtra has pioneered in setting up a water resources regulatory authority, with inter-sectoral water allocation as one of its primary mandates, it has achieved too little in terms of defining criteria for and operationalizing bulk water allocation across different sectors in different river basins. Though water supply and sanitation committees are promoted at the village level for decentralized management of water supply schemes, studies show that they work only in the case of single village schemes and are largely ineffective in situations where complex systems are built for rural water supply catering to several villages. So the institutions are not aligned to meet the policy objective of ensuring safe and sustainable water supply for domestic uses.
Improving the Performance of Rural Water Supply and Sanitation Sector in Maharashtra194

References � GoI. (1974). The Water (Prevention and Control of Pollu-
tion) Act, 1974. Delhi: Government of India.
� GoI.(2005). Ministry of Environment and Forests notification 2005. New Delhi: Ministry of Environment and Forests, Government of India.
� GoI.(2012). National Water Policy (2012). New Delhi: Ministry of Water Resources, Government of India.
� GoI. (2013). National rural drinking water programme: movement towards ensuring people’s drinking water security in rural India, guidelines-2013. New Delhi: Ministry of Drinking Water and Sanitation, Government of India.
� GoI.(2015). Evaluation of rural drinking water programmes: Committee on estimates (2014-2015). Second report presented to the sixteenth Lok Sabha. New Delhi: Ministry of Drinking Water and Sanitation, Government of India.
� GoM and TERI. (2014). Compilation of water quality data recorded by MPCB 2011–12. Mumbai, India: Maharashtra Pollution Control Board.
� GoM.(2003). Maharashtra state water policy, 2003. Mumbai: Government of Maharashtra.
� GoM.(2017). E- bulletin of water quality, National Water Monitoring Programme (NWMP): Water quality index summary of 250 stations in Maharashtra. Mumbai: Maharashtra Pollution Control Board, Government of Maharashtra.
� Kumar, M. D. (2010). Managing water in river basins: Hydrology, econom-ics, and institutions. New Delhi: Oxford University Press.
� Phansalkar, S., &Kher, V. (2006). A decade of Maharashtra ground-water legislation: Analysis of the implementation process. Law, Environment and Development Journal, 2(1), 69-83.
� Saleth, R. M., & Dinar, A. (2004).The institutional economics of water: A cross-country analysis of institutions and performance. USA: World Bank and Edward Elgar Publishing.
� Tata Institute of Social Sciences. (2015). Status of rural water supply in Maharash-tra: A third party evaluation commissioned by Ministry of Drinking Water and Sanitation, Government of India. Maharashtra: Tata Institute of Social Sciences.
� UNICEF & IRAP. (2013). Promoting sustainable drinking water supply and sanitation in rural Maharashtra: Institutional and policy regimes. Hyderabad, India: Institute for Resource Analysis and Policy.
� WHO. (2008). Guidelines for drinking-water quality: Third edition, incor-porating the first and second addenda. Volume 1: Recommenda-tions. Geneva, Switzerland: World Health Organization.
Improving the Performance of Rural Water Supply and Sanitation Sector in Maharashtra195

Environmental Sanitation and Wastewater Treatment
Module 7
7.1 Introduction
Safely managed sanitation and safe wastewater treatment and reuse are fundamental to protecting public health. Wastewater treatment is a prerequisite for water recla-mation and reuse. Proper treatment and disinfection of wastewater is also a public health necessity Treatment and distribution of recycled water involves great expendi-ture of resources, which in many developing countries is either lacking or is devoted to more urgent national priorities. In rural areas, waste is a severe threat to public health and cleanliness. Despite the waste generated being pre-dominantly organic, incorrect disposal can lead to serious problems including the growth of water related diseases such as diarrhoea, malaria, dengue, cholera and typhoid.7 It is estimated that people in rural India are generating 0.3 to 0.4 million metric ton of organic/recyclable solid waste per day and that 88% of the total disease burden is due to a lack of clean water, sanitation and improper solid waste management.
7.2 Access to Water Supply and Adoption of Improved Sanitation
Sanitation has direct links with water supply. A precondition for having a functional toilet in a dwelling premise is that there is adequate amount of water available for flushing, etc., after some of the basic needs such as drinking & cooking, bathing and washing are met. In fact in humid, high rainfall areas use of sanitary toilets may also be a necessity as the heavy rainfall would otherwise lead to contamination of water resources and spread of diseases.
The Swachhta Status Report 2016 provides the percentage of households with suffi-cient water throughout the year for all household activities, the percentage of house-holds having access to water for use in toilets and the percentage of households with sanitary toilets for the states in India (Table 7.1 and 7.2).
There is strong correlation between the availability of water for use in toilets and the use of sanitary toilets. In Maharashtra, the percentage of rural population getting piped water supply was 50.2 according to Census 2011. The percentage of rural households with sufficient water throughout the year in 2012 for all household activities was 72.9 while the percentage of rural households having access to water for use in toilets was only 50.2 in Maharashtra. The percentage of rural households with sanitary toilets was 52.6.Merely providing toilets in rural areas will not lead to better sanitation. It should be ensured that enough water is available for use in the toilets and for hand washing so that the toilets can be used. In the absence of water it has been reported that toilets in rural areas are being used to house goats or to store grain, firewood or bicycles!
7Many water borne diseases like Typhoid, Cholera and other diarrheal diseases are caused by microscopic parasites in water which enter drinking water when improperly disposed faeces come in contact with drinking water sources. Water related insect vector diseases like Dengue and Malaria are spread by mosquitoes which breed in or near stagnant water. The mosquitoes suck the parasites along with blood when they bite an infected person and transmit the disease to an uninfected persons when they bite them
Improving the Performance of Rural Water Supply and Sanitation Sector in Maharashtra196

Table 7.2: Proportion (per 1000) of households with access to different type of latrine for rural Maharashtra during 2012
Piped Sewer System 42
Septic Tank 353
Pit Latrine 34
Ventilated Improved Pit Latrine 4
Pit Latrine with Slab 8
Pit Latrine without Slab(Open Pit) 2
Composting Toilet 2
Elsewhere 4
Having access but not using the toilet 12
Others 0
(Source: National Sample Survey, 69th Round, 2014)
7.3 Sanitation Facilities and Source Protection of Drinking Water Sources
The Swachhta Status Report, 2016 provides data on disposal of household waste water but not waste from toilets. The report says that in Census 2011, information was collected on the system of disposal of waste water which included kitchen waste water, bath and wash water but not the wastes from latrines. Also in Maharashtra, 42.8% of the rural population practised open defecation in 2015. Only 44.3% of the population had access to an ‘improved source’ of latrine in 2012. An improved source of latrine includes sources such as flush/pour-flush, piped sewer system, septic tank, pit latrine, ventilated improved pit latrine, pit latrine with slab and composting toilet (Swachhta Status Report, 2015). This poses a health hazard especially in high rainfall areas through the spread of diseases via the faecal-oral route due to faecal contamina-
Percentage of households without latrine facility during 2012 54.0
Percentage of households having access to improved source of latrine during 2012 44.3
Percentage of households without latrine as per Census 2011 55.8
Percentage of households with improved latrine as per Census 2011 34.8
Percentage of households who lived in a dwelling unit with no drainage arrangement for household waste water during 2012
50.4
Percentage of households without drainage arrangement as per Census 2011 52.2
Percentage of households who got sufficient water throughout the year for all household activities during 2012
72.9
Percentage of villages having community toilets during 2015 30.0
Percentage of community toilets in use during 2015 79.6
Percentage of households having access to water for use in toilets during 2015 50.2
Percentage of households having access to water for use in toilets out of the households having toilets 95.3
Table 7.1: Indicators on sanitation facilities in rural households in Maharashtra
(Source: Swachhta Status Report, 2016)
Improving the Performance of Rural Water Supply and Sanitation Sector in Maharashtra197

tion of water supplies. This is especially true if the drinking water is not disinfected as is the case with many rural water supply systems. To prevent contamination of surface and ground water sources, provision of good sanitation and waste water treatment facilities is essential. In the case of rural areas, on site sanitation systems (OSS) are more prevalent. So there is need for proper faecal sludge management. Lack of clean water for drinking, using unclean water for washing and cooking food, inadequate sanitation and poor personal hygiene due to lack of water are the reasons for water related diseases. Table 7.3 lists the different categories of water and sanitation related diseases. Diarrheal diseases, Hepatitis A, Scabies, Leprosy, Malaria, Dengue, Filaria-sis as well as other skin and worm infections are found in India.
Table 7.3: Water and Sanitation Related Diseases
Water borne diseases Caused by drinking contaminated water or consuming food prepared with contaminat-ed water
Cholera, typhoid, diarrheal diseases includ-ing Giardiasis and Cryptosporidiosis. Hepati-tis A
Water-washed diseases Caused by poor personal hygiene resulting from inadequate water availability
Shigella which causes dysentery, Scabies, Trachoma, Yaws, Leprosy, Conjunctivitis, skin infections and ulcers
Water-based diseases Transmitted by aquatic organisms, such as worms; enter the body during bathing, etc.
Schistosomiasis, Guinea worm disease
Water-related insect vector diseases
Spread by carrier insects including mosqui-toes and black flies that breed in or near stagnant water.
Malaria, Filariasis, Dengue, Yellow fever, River blindness.
Diseases directly related to improper sanitation
Contracted by contact with contaminated soil polluted by human faeces
Hook worm infection
Source: www.koshland-science-museum.org Thus good quality water is required not only for drinking but also for other domestic
purposes. To maintain water quality it is necessary to protect the water sources; sanitary toilets with sufficient water for use in the toilets and proper disposal of the waste and waste water from households are necessary from the viewpoint of health, hygiene and also aesthetics.
Sanitation Safety Planning (SSP) is key tool for sanitation systems in WHO guidelines for Safe Use of Wastewater, Excreta and Grey water. This manual focuses on safe use of human waste. It assists users to:
01. Systematically identify and manage health risk along the sanitation chain;
02. Guide investment based on actual risks, to promote health benefits and minimize adverse health impacts;
03. Provide assurance to authorities and the public on the safety of sanitation-related products and services.
The Nirmal Bharat Abhiyan(NBA) Guidelines define solid and liquid waste by referring to specific management options including ‘compost pits, vermi-composting, common and individual biogas plants, low cost drainage, soakage channels/ pits, reuse of waste water and systems for collection, segregation and disposal of household garbage etc. Projects should be approved by State Scheme Sanctioning Committee (SSSC)’. This definition focuses more on what can be done with solid or liquid waste rather than what it actually is.
Improving the Performance of Rural Water Supply and Sanitation Sector in Maharashtra198

7.4 Waste Water TreatmentThe waste water from various household activities can be classified into:
� Grey water : Wastewater generated from bathing, kitchen and other household activities excluding waste from toilets
� Combined wastewater: It can be either a mix of grey water and effluent from septic tank treating black water or effluent from septic tank treating black and grey water.
� Sewage: Combined grey and black water generated from household in the absence or presence of septic tank.
� Black water: Wastewater generated from toilets
Various wastewater treatment technologies, their salient features and extent in India is presented in Table 7.4. Some of these important technologies are discussed in detail in the following sub-sections.
Table 7.4: Salient features of the wastewater treatment technologies
Technology Natural of Built
Aerobic/Anaero-bic/Mixed
Expected effluent Quality
Area Require-ment (sq. m/ person)
Power Require-ment (kWh/ person/year)
Preva-lence in India
Water Stabilisation Pond System
Natural Mixed Medium to High
2-3 Nil All over India
Duckweed Pond System
Natural Aerobic Medium to High
2.5-6 Nil Mostly in State of Punjab
Constructed Wetland Natural Aerobic Medium 1.5-2.5 Nil Limited experience of implementa-tion in India
Up-flow Anaerobic Sludge Blanket
Built Anaerobic Low 0.1-0.2 Only for pumping Mostly in urban areas
Anaerobic Baffled System
Built Anaerobic Low 0.2-0.4 Nil All over India
Package Aeration System
Built Mixed High 0.1-0.15 20-30 All over India
Extended Aeration System
Built Aerobic High 0.1-0.2 15-25 All over India
Sequencing Batch Reactor System
Built Aerobic Very High 0.05-0.1 10-20 All over India
Soil Bio Technology Natural Aerobic Very High 0.021 40-50kWH/MLD (mainly to distrib-ute wastewater across reactor bed)
All over India
Source: Ministry of Drinking Water and Sanitation, Government of India
Improving the Performance of Rural Water Supply and Sanitation Sector in Maharashtra199

7.4.1 Conventional or centralised wastewater treatment
Centralised treatment of waste water is normally used for urban areas where water supply is normally adequate to generate sufficient waste water for its flow in the sewer system. The Sewage Treatment Plants (STPs) are based on different technolo-gies to treat waste water (Picture 7.1). However, only a few sewage treatment plants in India are functioning satisfactorily. Many STPs in urban areas are non-functional due to various problems associated with the centralised treatment system. Due to lack of required operational and maintenance facilities untreated and semi -treated waste water flows into river causing sever health and environmental problems.
Centralised waste water treatment entails high operation and maintenance costs. Experienced technical personnel are required to implement and operate the system. Due to high electrical energy requirement, the system does not work where electricity is not available on a continuous basis.
‘Conventional’ wastewater treatment separates solids from liquids by physical process-es and then purifies the liquid using biological and chemical processes. The process is divided in three phases (mechanical, biological and chemical), which are referred to as primary, secondary and tertiary treatment.
The purpose of primary treatment is to separate solids from liquids as much as possible, producing a homogeneous liquid that can be treated biologically, and a sludge that can be disposed or treated separately. Primary treatment removes large objects and reduces oils, grease, sand, grit and coarse solids. This is usually done using large sedimentation tanks and rotating screens to remove floating and larger materials.
Secondary treatment is intended to degrade organic compounds that consume oxygen when degraded and therefore increase the BOD and COD of the water. To do this, most treatment plants in developed countries use a process known as activated sludge process in which the liquid is heavily oxygenated and substrate is provided so that naturally occurring bacteria and protozoans consume the biodegradable soluble organic compounds. These microorganisms also bind less soluble fractions into floc particles that tend to settle to the bottom of the tanks. Eventually the microorganisms also flocculate and settle so that the supernatant liquid can be discharged.
Tertiary treatment is the final stage to raise the effluent quality to the standard required before discharged. This phase usually includes different types of filtration, nutrient removal and chemical disinfection treatments.
STPs are also used for decentralized waste water treatment in urban areas for small townships, apartment complexes and even individual apartment blocks.
Improving the Performance of Rural Water Supply and Sanitation Sector in Maharashtra200

Picture 7.1: A sewage treatment plant
(Source: http://www.mottmacamericas.com/article/1309/water-sector-public-private-partnerships)
7.4.2 Decentralised systems for wastewater treatment
The houses in rural areas are not built in a planned manner and are not close to one another like in urban areas. Houses may be in the middle of large farms so that they are isolated. Hence in rural areas decentralised waste water treatment systems are more suitable. The advantages of decentralised waste water treatment systems are low operational and maintenance costs, nil or very low energy consumption is depending upon the technology chosen, easy operation by semi-skilled persons and economic returns depending upon the technology used. There is safe reuse of treated effluent as well as of sludge. A decentralised system is suitable for all the site conditions including an undulating topography where conventional sewage treatment cannot be implemented.
The performance of the various treatment systems depend on the influent charac-teristics and temperature. The performance can be defined by the approximate BOD removal rates, as follows:25 to 50% removal rates for Septic and Imhoff tanks; 70 to 90% removal for anaerobic filters and baffled septic tanks; and 70 to 95% removal for constructed wetland and pond systems (Kumar, 2014).
Improving the Performance of Rural Water Supply and Sanitation Sector in Maharashtra201

Decentralised systems for wastewater treatment can be divided in three broad catego-ries:
01. Soil-based systems, which include subsurface infiltration, rapid infiltration/soil aquifer treatment, overland flow, and slow rate systems
02. Aquatic systems, which include waste stabilization ponds and floating aquatic plant systems
03. Wetland systems, which include free water surface and subsurface flow systems
7.4.2.1 Soil based treatment methods
Soil based treatment methods rely on the structural complexity and enormous biodi-versity naturally occurring in healthy soil ecosystems, in order to degrade organic matter and recover nutrients from wastewaters (Picture 7.2). Slow rate systems purify the applied wastewater through physical, chemical, and biological mechanisms that occur concurrently in the soil-water atmosphere environment. These mechanisms include filtration, transformation, degradation, predation, natural die-off, soil absorp-tion, chemical precipitation, de-nitrification, volatilization, and plant uptake.
If urine and faeces are stored separately after excretion, both of these fractions can be easily treated and utilized. The urine fraction can be safely used as a fertilizer as long as it is totally free of faeces. The faeces fraction must be composted and dehydrated in order to kill the pathogens and then it can be safely used as a rich soil amendment.
Picture 7.2: Soil Bio Technology (SBT) Plant, Mumbai (Implemented by: Mumbai Municipal Corporation &IIT Mumbai)
Improving the Performance of Rural Water Supply and Sanitation Sector in Maharashtra202

Soak pit for the treatment of grey water
A soak pit is the simplest method for treatment and use for grey water and is best suited for soil with good absorptive properties. A soak pit should be between 1.5 and 4 m deep and should not be less than 2 m above the groundwater table. The soak pit is filled with coarse material; these help bacteria in waste water to grow and degrade the organic matter present in waste water. Bacteria stick to the rough surface of media thereby minimising the chance of their movement along with water into soil causing ground water pollution. The soak pit may also be lined with a porous material and left unfilled.
The advantages of the soak pit are that it is a simple method with low operation and maintenance costs and that it helps reduce vector borne diseases by reducing the chances for mosquitoes to breed. The disadvantages are: in case of high volume of waste water released there is chance of overflow of soakage; and it is not suitable for clay or black soil with less porosity.
7.4.2.2 Aquatic systems
Aquatic systems can be effectively used for the treatment of primary treated sewage. In rural areas, waste water contains only organic wastes that can be treated easily with the help of natural microbes present in waste water. Due to the absence of toxic and heavy metals in such waste water, treated waste water as well as sludge can be effectively used for agricultural purposes. Where present, the negative synergistic effects of high contents of heavy elements and other toxic compounds on land use are unpredictable and cannot be monitored or regulated
Decentralised Waste Water Treatment System (DEWATS)
The basic principle of DEWATS is proper settling of settleable solids of influent through different chambers in series and increase bacterial activity through proper bacterial growth media in different chambers for the growth and consequently, bacterial degra-dation of dissolved solids in effluent. Such treated effluent has much less Biochemical Oxygen Demand (BOD) suitable for use for agriculture and horticulture purposes.
Stabilisation pond system for waste water treatment
Waste stabilisation ponds are suitable for tropical and subtropical regions with high temperatures and intensity of sunlight. The three components of the waste stabili-sation pond are 1) anaerobic ponds for the removal of BOD up to 60%, 2) facultative pond for the further removal of BOD with the help of algae and c) removal of patho-gens and faecal coliforms using algae.
Waste stabilization ponds (WSPs) are a low-cost, low-energy, low-maintenance and above all, a sustainable method of wastewater treatment. Waste stabilization ponds (WSP) are shallow man-made basins into which wastewater flows and from which after a retention time of few days, a well-treated effluent is discharged. WSP systems comprise of a series of ponds – anaerobic, facultative and maturation ponds in series. All these ponds have different functions.
Improving the Performance of Rural Water Supply and Sanitation Sector in Maharashtra203

WSPs are simple to construct and maintain. Earthwork is the main aspect of work. It consists of construction of different ponds of desired depth and capacity with proper lined or protected embankments, inlet and outlet chambers and interconnecting pipes. Identifying blockage of pipes, scum removal and repair of embankments whenever required are the only routine management aspects of the system (Kumar, 2014)
Anaerobic ponds:
Anaerobic ponds are commonly 2-5 m deep and receive a high organic loading; there-fore they contain negligible dissolved oxygen and algae. Their primary function is removal of BOD. Anaerobic ponds work extremely well in warm climates. A properly designed pond will achieve around 70 per cent reduction of BOD at temperatures of 25 degrees Celsius and above. For wastewater with a BOD of up to 300 mg/l, hydraulic retention time of 1 day is sufficient at temperatures greater than 20 degrees Celsius. If the volumetric BOD loading is less than 30 g/m3d, then anaerobic ponds may not be used. BOD is removed by sedimentation of the settleable solids and their anaerobic digestion in the resulting sludge layer. Heavy metals are also precipitated and many toxicants are also degraded to non- toxic forms. Floating materials, such as scum, oils etc. are also retained in these anaerobic ponds(Kayambo et al, 2004).
Facultative ponds:
While in an anaerobic pond organic matter is normally converted into ammonia and methane through anaerobic digestion, in secondary facultative ponds, further oxida-tion of the organic matter by aerobic bacteria is usually dominant. Primary facultative ponds combine the functions of the anaerobic and secondary facultative ponds. In the secondary facultative pond and the upper layers of primary facultative ponds, sewage BOD is converted into “Algal BOD”.
Maturation ponds:
A series of maturation ponds (1-1.5m deep) receives the effluent from a facultative pond, and the size and number of maturation ponds is governed mainly by the required bacteriological quality of the final effluent. Maturation ponds usually show less vertical biological and physico-chemical stratification and are well oxygenated throughout the day. Their algal population is thus much more diverse than that of facultative ponds. The primary function of maturation ponds is the removal of excreted pathogens, and this is extremely efficient in a properly designed series of ponds. Maturation ponds achieve only a small removal of BOD, but their contribution to nutrient (nitrogen and phosphorus) removal can be significant. Faecal bacteria are mainly removed in faculta-tive and especially maturation ponds. There is some removal in anaerobic ponds also, principally by sedimentation of solids-associated bacteria. The principal mechanism for faecal bacteria removal in these ponds and also in the facultative ponds, are high temperature, high pH values and high light intensity. Faecal bacteria and other patho-gens die off due to higher temperatures, high pH or radiation from the sun leading to solar disinfection. The removal of pathogens and faecal coliforms is ruled by algal activity in synergy with photo-oxidation.
Improving the Performance of Rural Water Supply and Sanitation Sector in Maharashtra204

4
3.5
3
25
2
1.5
1
0.5
0 0 5 10 15 20 25 30
Temperature (0C)
AP = Aeration pond; FP =Facultative pond; MP=Maturation pond
AP + FP
AP + FP + MP
Figure 7.1: Area (m2) required for treatment in WSP at different temperatures
(Source: Kumar, 2014)
In terms of removal efficiencies, an AP+FP system may remove around 80% of both BOD5 and TSS, and an AP+FP+MP system may increase this to around 90% for both parameters. A system including maturation ponds will produce an effluent safe for restricted irrigation.
The land area requirements of an anaerobic and facultative pond system vary from 1.8 to 0.5 m2 per person for temperatures from 12 to 27ºC, respectively. Inclusion of maturation ponds increases the area requirement to 2.8 to 0.7 m2 per person for the same temperature range. When land cost is reasonably low and the ponds serve small communities, and the temperature high, WSP systems are highly competitive in comparison to other treatment alternatives (Figure 7.1).
Waste water treatment through Duckweed
Duckweed based waste water treatment technology is a completely indigenous and biological method having direct economic returns in terms of pisciculture and employ-ment avenue in rural areas with least recurring expenditure on operation and mainte-nance of the system (Picture 7.3). Duckweed is a small plant that belongs to the botanical family Lamnaceae that consists of four genera namely Spirodela, Lemna, Wolffia and Wolfiella; first 3 genera are commonly found in India (presently they are classified as the subfamily Lemnoideae within the Araceae). It is cosmopolitan and found everywhere in organic nutrients rich stagnant water. It has a very high growth rate; at optimum nutrient environment it doubles within 2-3 days. It tolerates a wide range of temperature - between 100-460C, depending upon the genera.
Applying aquatic plants in shallow ponds will lead to secondary and tertiary treat-ment. The aquatic macrophytes assimilate nutrients into a high quality biomass with economic value rather than releasing the nitrogen into the atmosphere as is the case with expensive nitrification/denitrification. Duckweed has a protein productivity of 7 ton/ha which is about 10 times as that produced by soybean. However the drawbacks
Improving the Performance of Rural Water Supply and Sanitation Sector in Maharashtra205

of duckweed as a potential feed are that it is highly efficient in absorbing heavy metals, has high moisture content which makes handling, transporting and drying more expen-sive and a high percentage of calcium oxalate (Oron, 1994).
Though a UASB-Duckweed system can produce useful products namely duckweed, fish and methane gas, the returns are not significant considering the capital and operat-ing costs involved (Gijzen, 2001).
Picture 7.3: A duckweed based wastewater treatment system at Mirzapur, Bangladesh (Source: UNEP) and Lemna Minor or common duckweed
Root zone treatment system
The Root Zone Treatment System (RZTS) has been used widely for treatment of waste water through nutrient removal in many countries. In spite of its better adaptability in tropical regions, its use to treat waste water has not been exploited on large scale in India. Root zone Treatment Systems (RZTS) use natural processes to effectively treat domestic effluents. They are not only eco-friendly but also have low operational costs, producing high water quality (up to bathing water standards), suitable for re-use and reliable in both the short and long term. It has been established that a horizontal filter bed area of about 2 m2 /PE (person equivalent) is sufficient for the complete second-ary and tertiary treatment of wastewater including the removal of pathogenic germs.
RZTS are sealed filter beds, consisting of a sand / gravel / soil system, planted with vegetation which can grow in wetlands. After removal of coarse and floating material, the wastewater passes through the filter bed where biodegradation of the wastewater takes place, making the final effluent odourless and reusable for different purposes. The treatment processes through Root Zone system are based essentially on the activity of microorganisms present in the soil. The oxygen for microbial mineralisation of organic substances is supplied through the roots of the plants, and atmospheric diffusion. The Rhizosphere is the area around a plant root that is inhabited by a unique population of microorganisms influenced by the chemicals released from plant roots. Due to the inherent complexity and diversity of plant root systems the rhizosphere consists of a gradient in chemical, biological and physical properties which change both radially and longitudinally along the root. The roots of the plants intensify the process of biodegradation also by creating an environment in the Rhizosphere, which enhances the efficiency of microorganisms and reduces the tendency of clogging of the pores of the bed material, caused by an increase of biomass. RZTS contains
Improving the Performance of Rural Water Supply and Sanitation Sector in Maharashtra206

Figure 7.2: Map showing east Kolkata wetlands
aerobic, anoxic and anaerobic zones. This, together with the effects of the rhizosphere causes the presence of a large number of different strains of microorganisms and consequently a large variety of biochemical pathways are formed. This explains the high efficacy of biodegradation of substances that are difficult to treat. The filtration by percolation through the bed material is the reason for the very efficient reduction of pathogens, depending on the size of grain of the bed materials and thickness of filter, thus making the treated effluent suitable for reuse.
7.4.2.3 Wet land systems
The multi functional wetland ecosystem to the east of Kolkata is spread over 12,500 hectares and includes along with the wetlands, 254 sewage-fed fisheries, agricultural and solid waste farms and some built up areas (Figure 7.2). The city of Kolkata gets a large volume of sewage treated at no expense through this wetland system and gets in addition a substantial daily supply of highly edible freshwater fish. This resource recovery system developed by the local people over many is the largest and the only one of its kind in the world. In August 2002, 12,500 hectares of the East Kolkata Wetland area was included in the ‘Ramsar List’ making it a ‘Wetland of International Importance’ (KEIP, 2017).
Constructed wetlands can be used effectively for the treatment of grey water, effluent from septic tanks and tertiary treatment of effluents from conventional sewage treat-ment plants (Picture 7.2). The Phytorid Wastewater Treatment Technology from CSIR and NEERI uses a constructed wetland exclusively designed for the treatment of municipal, urban, agricultural and industrial wastewater (NEERI, 2017) (Figure 7.3).
Improving the Performance of Rural Water Supply and Sanitation Sector in Maharashtra207

Constructed wetland systems can either be a Subsurface Flow System or a Free Water Surface System; both use aquatic vegetation to absorb the nutrients (Figure 7.4 and 7.5). The subsurface system has a basin with a barrier to prevent seepage and consists of porous media of suitable depth to support the vegetation. The free water surface wetland typically has soil to support the roots of the emergent vegetation and water flows in the channel horizontally at a relatively shallow depth with the water surface exposed to the atmosphere(Farooqi et al, 2008).
Picture 7.4: Constructed wetland in the campus of Indian Agricultural Research Institute, Delhi
Improving the Performance of Rural Water Supply and Sanitation Sector in Maharashtra208

Figure 7.3: Phytorid treatment technology
(Source: NEERI 2006)
Figure 7.4: Cross-section of subsurface-flow constructed wetland
(Source: California Agriculture)
Figure 7.5: Free water surface system
(Source: http://www.tankonyvtar.hu)
Improving the Performance of Rural Water Supply and Sanitation Sector in Maharashtra209

7.4.2.4 Decentralized systems in Maharashtra
Two decentralized systems developed and used in Maharashtra are outlined below.
DOSIWAM (Decentralised On Site Integrated Waste Management) System
This system which was developed by (Late) Dr. S. V. Mapuskar has been categorised as a ‘promising best practice’ by UN HABITAT. In the DOSIWAM system, all waste is treated hygienically in eco-friendly non-polluting way by bio-digestive processes and end products are returned to the soil in an ecologically sustainable manner, simultane-ously recovering some energy. Many projects based on this system were established at various places in the state of Maharashtra and outside.
Under this system, night soil is collected without mixing it with sullage. It is anaerobi-cally digested adequately, so that the effluent becomes safe and biogas from diges-tion can be used as fuel. It is ensured that there is no overflow of wastewater leading to pollution. Biogas plant effluent and sullage are recycled in kitchen gardens. Garbage is utilised to produce manure for kitchen gardens. Only low cost technologies which are appropriate to the given situation are used.
The flow pattern in the DOSIWAM system is presented in Figure 7.6 and also is mentioned below:
� All the latrines are connected to biogas plant
� Effluent from biogas plant is combined with all the grey water from various places
� This water is taken to stabilization tank via intercepting tank
� Stabilized water is stored in water storage tank and used for irrigation
� Solid waste is segregated.
� Wet waste is vermi-composted and returned to soil as manure. Dry waste goes for recycling
Improving the Performance of Rural Water Supply and Sanitation Sector in Maharashtra210

Tiger bio filter
The Tiger Bio Filter technology is based onvermi-filtration and uses a filtration arrange-ment consisting of bio media to trap and treat impurities in wastewater. The filtration medium is arranged in stacked manner with bio media on top which serves as active habitat for bacteria and earth worms specifically bred for the purpose. The bottom layers provide structural support and free drainage for clear water. The trapped impuri-ties (mainly organic matter) are then consumed by the bacteria and earth worms as an energy source for metabolism and reproduction resulting in reduction in organic matter (measured as Bio-chemical Oxygen Demand).
� The system is designed with sufficient surface area and worm quantity. The worms consume the organic matter load within 24 hours, making the bed available for the next day loading. As the process involves transfer of natural oxygen, there is no need for artificial supply of air through blowers, resulting in less consumption of energy and other consumables. Thus, the system is cost effective and environ-ment friendly. Tertiary treatment in the form of Pressure Sand Filter and Activated Carbon Filter can be used as an option for polishing the effluent (Figure 7.7).
� The advantages of using the Tiger Bio Filter are as follow. First: it requires small land area as compared to other technologies. Second: it is environment friendly as no odor and harmful by-products (sludge) are generated. Third: the O&M cost is low.
Figure 7.6: Schematic diagram showing flow pattern of the DOSIWAM system Human
ExcretaBiogas Plant
Intercepting Tank
Cattle Shed
Biodegradable
Non Biodegradable
Recycling/Land Fill
Biogas Plant
Vermicompost Pit/ Biogas Pt.
Stabilisation Tank
Storage tankWaste Water
Animal Excreta
SolidsPlantation
Cooking GasLatrine
Improving the Performance of Rural Water Supply and Sanitation Sector in Maharashtra211

Bio Media Filter
Effluent as per CPCB Norms
(Optional Tertiary Treatment)
Filter(PSF and ACF)
Reuse
Sewage SumpScreenChamber
Filter Feed
Tank
Chlorine Contact
Tank
Figure 7.7: Schematic diagram showing process flow of the Tiger Bio Filter
(Source: PriMove Infrastructure Development Consultants Pvt. Ltd., Pune)
7.5 Design of Rural Sanitation Systems for Different Physical Environments
The Swachh Bharat Mission (Gramin) encourages cost effective and appropriate technologies for ecologically safe and sustainable sanitation, sustainable sanitation being defined as safe disposal or use of human excreta. The guidelines of the MDWS clearly state that a duly completed household sanitary latrine shall comprise of a toilet unit including a sub-structure which is sanitary (that safely confines human faeces and eliminates the need for handling by humans before it is fully decomposed), a super structure, with water facilities and a hand-wash unit (MDWS, 2016). Affordabil-ity, protection of drinking water sources from contamination and avoiding design and construction of sanitation facilities beyond requirements are the main factors that are considered in rural sanitation system design.
Open defecation is highly prevalent in rural areas in India even among people who can afford to build toilets. The link between sanitation and health is unknown to many rural people which is one of the reasons for the low adoption. Affordability is another factor. Hence there is a need to design affordable sanitation facilities and at the same time to create awareness about the link between sanitation and health.
Centralised sewage treatment systems are seldom used in rural areas. Given the dispersed and unplanned development in rural areas and the technical expertise required to operate them, it is not practical to provide centralized sewage treatment systems in rural areas. Also, capital costs as well and operation and maintenance costs are low for decentralized systems. However, combined sanitation systems can be undertaken for small communities or for a few households.
Continued and proper use of a toilet depends upon the availability of water, proper technical functioning as well as ease of operation and maintenance without recurring expenditure. In India ablution with water is most prevalent and water borne toilets find easy acceptance. According to MDWS, even in water scarce areas dry toilets or composting toilets are not preferred.
Improving the Performance of Rural Water Supply and Sanitation Sector in Maharashtra212

In areas where the water table is deep, the Twin Pit Water Seal Toilet can be used without fear of water pollution. This consists of the two pits used alternately, a pan, water seal / trap, squatting platform, junction chamber and a superstructure. Gases produced in the pit, mainly Carbon dioxide and Methane are diffused in the soil through honey comb structures. The system thus helps in reducing air pollution from such Green House Gases. Where households do not have enough space for individual leach pits or septic tanks, combined leach pit/ soak pit or other substructure can be constructed with required volume as the size for a combined pit is always less than for an individual one. In areas where the water table is shallow or where there is water logging, the pit must be raised and the space around the pits must be filled with earth and compacted. In areas where the soil is not porous as it black cotton soils appro-priate design with vertical filling of coarse material around the pits must be provided. Safe distance of the leach pits from drinking water sources must be maintained. In coastal areas, flood prone regions and rocky areas pit latrines are not suitable (MDWS, 2016).
Ecosan toilets are based on the philosophy of dealing with recovery of plant nutri-ents from human wastes for agricultural purposes and moving away from a linear to a circular /close-loop flow of such nutrients. Dry toilets, Urine-Diverting Dry Toilets (UDDT) and biogas from human waste toilets are examples. Ecosan toilets are suitable for high water table as well as rocky areas. However when water is used for ablution, the dry toilets are not feasible. Toilet linked biogas plants are suitable for hard rock areas. The biogas can be used for cooking or lighting. This type of sanitation system is not yet popular in the country.
Septic tanks are the most favoured type of on site sanitation system in India. Septic tanks are watertight, multi-chambered receptacles that receive black and/or grey water and separate the liquid from the solid waste, which it stores and partially digests. A septic tank is a combined sedimentation and digestion tank. The settleable solids in the sewage settle down to the bottom in one or two days accompanied by anaerobic digestion of settled solids (sludge) and liquid, resulting in reasonable reduction in the volume of sludge, reduction in biodegradable organic matter and release of gases like carbon dioxide, methane and hydrogen sulphide. The effluent although clarified to a large extent, will still contain appreciable amount of dissolved and suspended putresci-ble organic solids and pathogens, as the efficiency is only 30-50 % for BOD and 60-70 % for TSS removal. Septic tanks need to be de-sludged for their effective functioning.
An anaerobic baffled reactor (ABR) is an improved septic tank, which, after a primary settling chamber, uses a series of baffles to force wastewater to flow under and over the baffles as it passes from the inlet to the outlet and is suitable for individual house-holds, a group of households or at the community level. The Anaerobic Filter technolo-gy commonly known as BORDA Model of DEWATS (Decentralized Wastewater Treat-ment Solutions) in India provides suitable media for growth and retention of microbes in the chambers,which results in higher degradation of organic matter and thus greater lowering of BOD in the final effluent. The prefabricated Package Type Anaerobic Filter System can be installed easily in a short time and the BOD and SS removal is 50-70%. The Settling –Contact Aeration System is another system developed in India though the need for electricity and trained manpower for installation limit the adaptation of the technology.
Improving the Performance of Rural Water Supply and Sanitation Sector in Maharashtra213

Septic tanks are suitable for different physical environments, however the treatment efficiency is less and the septage and sludge need to be properly disposed. In India most towns and rural areas lack the facilities to treat and dispose the sludge from the septic tanks (MDWS, 2016).
Figure 7.8: An Imhoff tank
Septage has high values of total solids, suspended solids, Biochemical Oxygen Demand, Chemical Oxygen Demand, Nitrogen, Phosphorus and pathogens and almost no presence of heavy metals and toxic. Septage can be completely recycled and reused for agriculture purposes after proper treatment. It can be seen as an oppor-tunity for resource recovery rather than a problem for disposal especially in rural areas where agricultural activities are very prevalent.
7.6 Design Issues in Rural Sanitation Systems
The design of toilets for a rural area must be done keeping in mind the geographical, social and economic conditions. Type of soil, amount of rainfall, depth of water table, susceptibility to floods, temperature and availability of water for use in the toilet are factors that the design of the sanitation system depend on. It also depends on what the people want and are willing to pay for.
Design of a sanitation system that works over a long period of time is a challenge in water scarce regions. When water is very scarce a dry toilet or composting toilet is very suitable. However, in India water is used for ablutions after visiting the toilet. As such a dry toilet is neither acceptable nor a suitable design option. There is a big focus on the construction of toilets in rural India with the launch of the Swachh Bharat Mission. However mere construction of the toilet structure without ensuring that there is enough water for use in the toilet will not improve the situation in the villages; it will be a waste of resources. Even in places where enough water is available
Cleanout
Sludge OutletPipe
Gas Vents
Flow Tank/SettlingCompartment
Sludge DigestionCompartment
Scum
Scum
Direction of Flow
OutletBaffle
IntelBaffle
Scum
Improving the Performance of Rural Water Supply and Sanitation Sector in Maharashtra214

for drinking and other household uses, there is not enough water for use in toilets for flushing and cleaning.
Most rural sanitation systems do not take into consideration the treatment and manage-ment of septage. Mechanised removal of the septage and safe disposal must be given priority. In fact in rural areas it can be completely reused in agriculture. However it is usually dumped in open fields or ends up in water bodies. Enough funds are also not allotted at the panchayat level for the safe management of septage.
It is also found that local masons or users change the design parameters, affecting the performance of the system. For example it has been found that instead of provid-ing two pits for the pit latrine to be used alternately, people build a single bigger pit without understanding the principle behind constructing two pits. Also it is seen that a vent pipe is provided for the pits which is not necessary and which also produces bad odour. The gases are to diffuse into the surrounding soil keeping the area odour free.
The toilets should be at least 10m away from any drinking water source. Lack of awareness or lack of space around a house may cause toilets or soak pits to be located near drinking water sources which can lead to the spread of diseases. If ground water supplies are drawn from deep and confined aquifers, on site sanitation does not cause ground water pollution (Kumar, 2014).
Not having enough funds is an issue which prevents many people in rural areas from building toilets. If lack of space is a concern, community toilets or common toilets catering to a few households may be considered.
Whatever the type of toilet that is designed, it should be undertaken with help from technically qualified or trained personnel. A faulty design will be expensive to correct. If people give up using the facility, the money spent will be completely wasted too. Standard designs can be made for a region or village based on the geographical partic-ulars of the area under consideration.
7.7 Maintenance of Rural Sanitation Systems
Maintenance of a rural sanitation system is as difficult and important as designing and constructing it. Often toilets that are built with much fanfare are abandoned for many reasons like lack of water or improper use leading to blockage or foul odour.
If the design of the sanitation system has been done properly with attention to local conditions, proper maintenance of the system can be achieved by the following.
Users must be made aware of how to use the system properly. Some of the informa-tion that users should possess include:
01. In case of double pit latrines, only one pit is to be used at a time and pouring too much of water into the pit is to be avoided. De sludging of the pit is to be done after two years. Chemicals and detergents must not be poured in the toilet as well as lighted cigarettes. Waste material like cloth, sanitary napkins and the like are not to be dumped in the toilet.
02. Ensure that there is enough water for use in the toilet.
Improving the Performance of Rural Water Supply and Sanitation Sector in Maharashtra215

03. Make sure that the soak pits/leach pits are not clogged. If clogged clean the pit so that the function is restored.
04. Ensure that de-sludging of septic tanks is done at regular intervals.
05. Ensure proper treatment of the septage and reuse it in agriculture.
06. If a sewage waste treatment plant is part of the system employ technically knowl-edgeable personnel for its smooth operation.
07. Allocation of funds for the operation of the system by the local government is to be ensured and officials appointed to oversee the system accountable for its proper functioning.
7.8 Conclusion
Supply of good quality water in adequate quantities, safe sanitation practices, health and economic prosperity are inter-related. Water is needed not only for drinking and cooking but also to maintain hygiene and for flushing and cleaning in toilets. Use of poor quality water for washing and bathing too can lead to diseases like infections of the skin. The ministry of drinking water and sanitation aims at providing rural areas with 70 litres of water per capita per day by 2022. At present habitations getting 40 litres per capita per day are considered fully covered. However, providing rural areas with 40 lpcd without slippage and maintaining water quality is itself proving to be a daunting task.
Proper waste water treatment and reuse is important for preventing the spread of water related diseases as well as to protect water sources from pollution. Unlike in urban areas the waste water generated in rural areas is relatively free from inorganic components. As such the reuse after treatment of waste water as well as the solid residue for agriculture is possible. This will also ensure the return of minerals back to the soil.
Presently the percentage of people in rural India practising open defecation is high. The Swachh Bharat Mission is giving a big thrust to sustainable sanitation in rural areas. However mere construction of toilets will not bring good results. Scientific design of rural sanitation systems by technically qualified personnel taking into consid-eration local geological, hydrological, social and economic conditions is necessary. Continued use of the toilets in a proper way and proper handling and reuse of waste water and septage with timely de-sludging of pits/septic tanks are needed for a sanita-tion system to be a success. It is also necessary to create awareness among the rural people on the interrelationship between hygiene and health and what each person should do to maintain the system well. Above all the local government should ensure that enough funds are allocated and officials appointed for the successful operation and maintenance of the sanitation system.
Improving the Performance of Rural Water Supply and Sanitation Sector in Maharashtra216

References � CSIR-National Environmental Engineering Research Institute, http://www.neeri.res.
in/content/phytorid-wastewater-treatment-technology (Accessed on Sept 4, 2017).
� Farooqi, I. H., Basheer, F., &Chaudhari, R. J. (2008).Constructed wetland system (CWS) for wastewater treatment. In Sengupta, M.,&Dalwani, R. (Eds.),Pro-ceedings of Taal 2007: The 12th World Lake Conference, pp. 1004-1009.
� Global Health and Education Foundation. (2017). “Safe Water is Essen-tial” (Website), https://www.koshland-science-museum.org/water/html/en/Treatment/Water-Related-Diseases.html (Accessed on Sept 4, 2017)
� Kayambo, S., Mbwette,T. S. A., Katima, J.H.Y., Ladegaard, N., & Jorgensen, S. E. (2004). Waste stabilization pond and constructed wetlands: design manual. United Nations Environment Programme for Africa.
� Kolkata Environmental Improvement Project, http://www.keiip.in/bl333/wetlands.php (Accessed Sept 4, 2017).
� Kumar, M. D. (2014). Thirsty Cities: How Indian Cities Can Meet Their Water Needs? New Delhi: Oxford University Press.
� MDWS.(2014).Guidelines on solid and liquid waste management (SLWM) in rural areas (16 July 2014).IND (Cluster-TA0003) Advanced Project Prepared-ness for Poverty Reduction -Technical Assistance for Supporting Clean Villages for Millennium Development Goals. New Delhi: Government of India.
� MDWS.(2016).Handbook on technological options for on-site sanita-tion in rural areas. New Delhi: Government of India.
� Ministry of Statistics and Programme Implementation.(2016).Swachhta Status Report, 2016.New Delhi: Government of India.
� National Sample Survey Office.(2014).Drinking water, sanitation, hygiene and housing condition in India. National Sample Survey, 69th Round. New Delhi: Government of India.
� Oron, G. (1994). Duckweed culture for wastewater renovation and biomass production. Agricultural Water Management, 26(1994), 27-40.
� WHO. (2016).Sanitation safety planning manual for safe use and disposal of waste water, greywater and excreta. Geneva: World Health Organisation.
Improving the Performance of Rural Water Supply and Sanitation Sector in Maharashtra217

Improving the Performance of Rural Water Supply and Sanitation Sector in Maharashtra218

Improving the Performance of Rural Water Supply and Sanitation Sector in Maharashtra219
Annexures

The UnnatMaharashtra Abhiyan (UMA) Framework
Annexure 1
A1.1 Background
Engineering graduates in India are often faced with a dilemma of finding a suitable job matching their specialization. Their concern is important as India produces nearly 1.5 million engineering graduates every year who look for jobs. To put this in context, USA which is one of the largest economies in the world produces only half of this number.
The present government is bringing in plenty of educational reforms in order to make learning more pragmatic for the students and also that can make them employable. Additionally, the government has initiated many ambitious programmes, such as ‘Make in India’ and ‘Skill India’, with the overall objectives of providing a major push in manufacturing sector and enabling young students and youth to take up industry-rel-evant trainings which can help them in securing a better livelihood. For such initia-tives to succeed, India’s engineering outputs as well as the workforce and research required to support such production levels need to undergo a major change. For enhancing outputs, many state governments are already providing financial incentives and tax subsidies to industries for setting up their base within the State’s geographical area. Also, for enhancing the skills of the work force, the Indian government is direct-ing premier educational institutions to focus on R&D activities that can be utilized by industries.
Nevertheless, there is a marked development deficit in the delivery of basic ameni-ties and engineering services, particularly in rural India. Services such as good roads, electricity and water supply are not easily accessible to people living in far-fetched rural India. As per the findings of the NSSO Survey on ‘Drinking water, Sanitation, Hygiene and Housing Condition’ (July 2012-December 2012):
� Only 46.1 percent of households in rural India and 76.8 percent of households in urban India have provision of drinking water within their premises.
� 62.3 percent of households in rural India and 16.7 percent of households in urban India did not have any bathroom facility.
� 49.9 percent of households in rural areas and 12.5 percent of households in urban areas did not have any drainage system.
Situation in Maharashtra, which is one of the most industrialized States in India, is not very different from rest of the country.
Using NSSO data on access to drinking water as an example, it is observed that access to drinking water is quite low than the national figure in rural areas of the State. Further, year round access to drinking water for rural households is significant lower in comparison to urban households in the State (Table A1.1).
Improving the Performance of Rural Water Supply and Sanitation Sector in Maharashtra220

Table A1.1: Year-round access to drinking water per 1000 people (various rounds of NSSO in 2008 and 2012)
Rural Urban
India (2008) 862 911
India (2012) 858 896
Maharashtra (2012) 745 931
Further with regard to the distance travelled to fetch water from the primary water source, the proportion of rural households which have to travel a distance of more than 500m has increased between the two census years (2001 and 2011) in the State (Figure A1.1 and A1.2). These findings point to the high water stress being faced by the rural community and the stark inequalities in access to drinking water across the state.
Figure A1.1: Percentage of Rural Households with Primary Source more than 500m. away (2001)
Figure A1.2: Percentage of Rural Households with Primary Source more than 500m. away (2011)
Improving the Performance of Rural Water Supply and Sanitation Sector in Maharashtra221

Apart from the natural factors (climate variability) and physical factors (geo-hydrology etc.) that are causing problem of water scarcity in the State of Maharashtra, lack of technical manpower, and the use of obsolete engineering practices in planning and design of the water supply schemes has accentuated the problem.
India finds itself in a major conundrum as on one side there is paucity of jobs for qualified youth, while on other big industries and the development sector are facing a difficult task of getting skilled technical experts. The inability of our higher education system to address present knowledge, research and development needs is responsi-ble for sub-optimal employment outcomes and poor development indices.
As per the National Employability Report 2016 published by Aspiring Minds, employ-ability assessment and certification firms, out of 150,000 engineering students from 650+ engineering colleges across the country, more than 80% were not employable (Aspiring Minds, 2016). This calls for some immediate course correction.
A1.2 Unnat Maharashtra Abhiyan- A Mechanism to Reform Higher and Technical Education
The development needs of the society and the technical requirements of small and medium enterprises need to be addressed on an immediate basis. Irrigation and drinking water provision, urban and rural amenities, public transport, tribal issues, and environmental safeguards are some of the serious challenges confronting us that need to be addressed on a war footing. But who is going to solve these issues? And how are they going to be solved? What kind of organizational and logistical support will be required for it? Unnat Maharashtra Abhiyan has tried to address these concerns.
Across the world, leading engineering and technical universities have always been at the forefront of solving societal challenges, functioning as independent public knowl-edge repositories and providing research based solutions. From this perspective, CTARA, IIT-B in consultation with Government of Maharashtra (GoM) has conceptual-ized the Unnat Maharashtra Abhiyan (UMA) for engineering colleges. The mandate of UMA is to build an independent and public knowledge infrastructure for the state of Maharashtra which will bring socio-economic and cultural development for its people, especially those in the bottom 80% of the socio-economic strata. It is currently being rolled out in 31 engineering colleges across the state through a set of enabling Govern-ment Resolutions (GRs).
The objectives of UMA include:
� To seek some alignment of curricula and research with regional development needs and train students for a future role as development professionals and researchers
� To re-emphasize field-work and case-studies as an important pedagogical tool within research and academia
� To provide a formal mechanism for local bodies (such as Zilla Parishads, Gram Panchayats, etc.) and the public at large to access institutes of higher education for their knowledge needs
Improving the Performance of Rural Water Supply and Sanitation Sector in Maharashtra222

� To promote a scientific temper in society and to evolve a collective, inclusive and sustainable vision of development
The programme enables students, assisted by faculty members, to undertake inter-dis-ciplinary stake-holder driven research on practical problems as a part of their curricula. It gives exposure and insight to students on governance and development problems and openness about solutions, measurements and outcomes.
A three tier structure has been formed to coordinate the efforts of UMA in the state-
� An Advisory Committee with a chairman and officials from concerned depart-ments as members to steer and guide the UMA campaign,
� A Project Coordination Unit (PCU) at DTE (Directorate of Technical Education) to work as a link between the Advisory Committee, participating institutes, and government system,
� An inter-disciplinary T&DC (Technology and Development Cell) at each participat-ing institute to implement UMA activities. IIT-B runs a T&DC which is called TDSC (Technology and Development Solutions Cell). Other UMA colleges have also set up similar cells.
UMA intends to build capabilities of engineering colleges to work on development problems in the state and become a regional knowledge repository. For this, colleges need to design a curriculum and research practice for their students which align with the society’s broader research needs. This implies:
A. Familiarity of students with basic developmental areas and the ability to operate in the same. This means inclusion of relevant areas in suitable departmental curricula. Each department should identify 2-3 regional knowledge and practice (RKP) sectors (i.e., sectors of regional interest and in the development area) of their choice to develop as potential research and teaching areas. Sample regional knowledge and practice (RKP) areas for some disciplines are given in the table A1.2 below.
B. Support for inter-disciplinary studies and recognition of practice and case-study as an important pedagogical and research device. This will require allowing inter-disci-plinary theses and projects and the recognition of case-studies, analyses, designs, assessments, and evaluations as a valid part of B. Tech/M. Tech programmes. It also calls for the inclusion of the study of practices and their development as valid research topic.
Department Regional Knowledge and Practice Areas
Civil and Environmental Engineering
Low-cost housing, Drinking Water, Watersheds, Irrigation, Sanitation and Solid-Waste
Mechanical Engineering Chulhas and Cooking energy, Pumps and Irrigation energy, Small engineering enterprises, Solar thermal systems and their deployment
Chemical Engineering Small food processing industries, Local manufacture of oils and soaps, Equipment for small enterprises, Pollution control and standards at regional level
Table A1.2: Sample regional knowledge and practice (RKP) areas
Improving the Performance of Rural Water Supply and Sanitation Sector in Maharashtra223

References � Aspiring Minds.(2016). National employability report. Retrieved from http://www.
aspiringminds.com/sites/default/files/National%20Employability%20Report%20-%20Engineers%20Annual%20Report%202016.pdf
� National Sample Survey Office.(2012). Housing condition curvey, NSS 65th round, July 2008 -June 2009. New Delhi: Ministry of Statistics and Programme Implementation, Government of India. Retrieved from file:///C:/Users/Admin/Downloads/ddi-documenta-tion-english-85.pdf
� National Sample Survey Office. (2014). Drinking water, sanitation, hygiene and housing condition in India, NSS 69th round, July 2012-December 2012. New Delhi: Ministry of Statistics and Programme Implementation, Government of India. Retrieved from http://mospi.nic.in/sites/default/files/publication_reports/nss_rep_556_14aug14.pdf
� Office of the Registrar General and Census Commissioner.(2001). Households by main source of drinking water and location, Census 2001.New Delhi: Ministry of Home Affairs,
� Government of India. Retrieved from http://www.censusindia.gov.in/
� Office of the Registrar General and Census Commissioner.(2011). Households by main source of drinking water and location, Census 2011.New Delhi: Ministry of Home Affairs,
� Government of India. Retrieved from http://www.censusindia.gov.in/
Electrical Engineering Rural grids, Energy audits for villages and towns, Pumps and Motors, Household appliances and their manufacture, Renewable energy systems for households and small enterprises
Computer Science and IT Public transport, Logistics of PDS, GIS and E-governance at the Zilla Parishad, logistics of local railway network and bus stations
Chemistry Regional water quality, materials and dyes used in local industry
History Updating district gazette. Documentation of the history of public assets and institutions. Creation and documentation of people's narratives and of role models.
Economics Analysis of city budgets. Assisting in the preparation and validation of the district economic survey.
Sociology Supporting GPs in access to development services, monitoring PDS, documenting customs and practices. Documenting linkages with environment, e.g., chulhas and wells.
Improving the Performance of Rural Water Supply and Sanitation Sector in Maharashtra224

List of Colleges that Participated
Annexure 2
Sr. No. Colleges Name Name of the Contact person
1 Amrutvahini College of Engg., Sangamner Prof. Chetan S. Kadly, Prof. Sangale Jivan Balasaheb
2 Bharati Vidyapeeth University, Pune Prof Padmasinh D. Patil, Prof. Milind R Gidde
3 D.Y. Patil College of Engg.& Tech., Kolhapur Prof. Vijay B. Awati
4 Gharda Institute of Technology, Khed Mr. R. Hujare
5 Govt. Engg. College, Aurangabad Dr R.M. Damgir,
6 Karmveer Bhaurao Patil College of Engineering, Satra Dr Anand Tapse
7 Kolhapur Institute of technology, Kolhapur Mr Bharat Ingavale,Ms S.S. Varur
8 Maharashtra Institute of Technology , Aurangabad Dr Ajay Dahake, Mr Sandeep S. Nalwade
9 Prof. Ram Meghe Institute of Technology and Reasearch, Amravati Prof R.Y. Kale
10 Padmabhooshan Vasantraodada Patil Institute of Technology, Budhgaon
Prof Nikhil S. Mane
11 Rajarambapu Institute of Technology, Ramnagar Prof. S.S. Kumbhar, Prof Y.M. Patil
12 SSVPS's Bapusaheb Shivajirao Deore College of Engineering, Dhule Prof. Bhumare Tushar
13 Shri Guru Gobind Singhji Institute of Engineering and Technology, Nanded
Prof. NH Kulkarni
14 SVERI's College of Engineering, Pandharpur Dr. N.V. Khadake, Prof. V.S. Kshirsagar
15 Tatyasaheb Kore Institute of Engineering & Technology, Warananagar Dr. D.M. Patil, Prof. Bhosule S. Vishwas
16 Walchand Institute of Technology , Solapur Prof. Hiremath S.S.Prof. Amruta Gulmire
Improving the Performance of Rural Water Supply and Sanitation Sector in Maharashtra225

List of ParticipantsAnnexure 3
Improving the Performance of Rural Water Supply and Sanitation Sector in Maharashtra226
S.No. Name of the Participant College Faculty/student
Email Id
1 Prof. Chetan S. Kadly Amrutvahini College of Engg., Sangamner
Faculty [email protected]
2 Prof. Sangale Jivan Balasaheb
Amrutvahini College of Engg., Sangamner
Faculty [email protected]
3 Padmasinh D. Patil Bharati Vidyapeeth University, Pune Faculty
4 Milind R Gidde Bharati Vidyapeeth University, Pune Faculty [email protected]
5 Vivel V. Deokare Bharati Vidyapeeth University, Pune Student [email protected]
6 Digvijay M. Patil Bharati Vidyapeeth University, Pune Student [email protected]
7 Prof. Vijay B. Awati D.Y. Patil College of Engg.& Tech., Kolhapur
Faculty [email protected]
8 Mr. R Hujare Gharda Institute of Technology, Khed Faculty [email protected]
9 Karunesh D Thakur Gharda Institute of Technology, Khed Student [email protected]
10 Nikhil A. Nimunkar Gharda Institute of Technology, Khed Student [email protected]
11 Vaibhav D. Kamble Gharda Institute of Technology, Khed Faculty [email protected]
12 Dr. R. M. Damgir Govt. Engg. College, Aurangabad Faculty [email protected]
13 Mr. Vaibhav R. Ramekar Govt. Engg. College, Aurangabad Student [email protected]
14 Bandgar Yogesh Rajendra Govt. Engg. College, Aurangabad Faculty [email protected]
15 Prof. Harshada Kadam Govt. Engg. College, Aurangabad Student [email protected]
16 Dhakne Poonam U. Govt. Engg. College, Aurangabad Student [email protected]
17 Dr. Anand Tapse K.B.P College of Engg., Satara Faculty [email protected]
18 Mr. Shitalkumar B. Desai K.B.P College of Engg., Satara Faculty [email protected]
19 Mane Pranavkumar N. K.B.P College of Engg., Satara Student [email protected]
20 Patil Ashish Hambirrao K.B.P College of Engg., Satara Student [email protected]
21 Mr. Bhargav B. Mane KIT, Kolhapur Student
22 Mr. Raj P. Makondkar KIT, Kolhapur Student
23 Ms. S.S. Varur KIT, Kolhapur Faculty [email protected]
24 Mr. Bharat Ingavale KIT, Kolhapur Faculty [email protected]

Improving the Performance of Rural Water Supply and Sanitation Sector in Maharashtra227
S.No. Name of the Participant College Faculty/student
Email Id
25 Ms. Pooja Prashant Apradh KIT, Kolhapur [email protected]
26 Ms. Arti KIT, Kolhapur [email protected]
27 Gadhwe Nikhil Girish MIT, Aurangabad Student [email protected]
28 Pise Krushna Yadarao MIT, Aurangabad Student [email protected]
29 Mr. Sandeep Satish Nalwade MIT, Aurangabad Faculty [email protected]
30 Dr. Ajay Dahake MIT, Aurangabad Faculty [email protected]
31 Prof. R. Y. Kale PRMITR, Amravati Faculty [email protected]
32 Amar S. Deshmukh PRMITR, Amravati Faculty [email protected]
33 Ankush G Kalawade PRMITR, Amravati Student
34 Prof. Mahadeo Kerhade PRMITR, Amravati Student
35 Nikhil S. Mane PVPIT, Budhgaon Faculty [email protected]
36 Harshad U. Gondil PVPIT, Budhgaon Student [email protected]
37 Harshal M. Kale PVPIT, Budhgaon Student [email protected]
38 Prof. N.R Phadtare PVPIT, Budhgaon Faculty [email protected]
39 Nishikant Raju Deshmukh RIT, Ramnagar Student [email protected]
40 Kulkarni Soha Atul RIT, Ramnagar Student [email protected]
41 Patil Y.M. RIT, Ramnagar Faculty [email protected]
42 Prof. S. S. Kumbhar RIT, Ramnagar Faculty [email protected]
43 Prof. Bhumare Tushar SSVPS B.S.D. COE, Dhule Faculty [email protected]
44 Vasule Milind Prakash SSVPS B.S.D. COE, Dhule Student [email protected]
45 Rajput Dhananjay Arvind SSVPS B.S.D. COE, Dhule Student [email protected]
46 Mr. Hemanth A Kumar SSVPS B.S.D. COE, Dhule Faculty [email protected]
47 Ishwar Suryawanshi SGGS, Nanded Student [email protected]
48 N.H. Kulkarni SGGS, Nanded Faculty [email protected]
49 Dr. N.V. Khadake SVERI's COE, Pandharpur Faculty [email protected]
50 Prof. V. S. Kshirsagar SVERI's COE, Pandharpur Faculty [email protected]
51 Rutwik A. Kanade SVERI's COE, Pandharpur Student
52 Anil Arjun Puri SVERI's COE, Pandharpur Student [email protected]
53 Patil Rushikesh Shivgonda T.K.I.E.T, Warananagar Student [email protected]
54 Patil Rakesh Raghunath T.K.I.E.T, Warananagar Student [email protected]

Improving the Performance of Rural Water Supply and Sanitation Sector in Maharashtra228
S.No. Name of the Participant College Faculty/student
Email Id
55 Prof. Bhosule Sachin Vishwas
T.K.I.E.T, Warananagar Faculty [email protected]
56 Dr. D.M. Patil T.K.I.E.T, Warananagar Faculty [email protected]
57 Prof. Hiremath S.S WIT, Solapur Faculty [email protected]
58 Prof. Amruta Gulmire WIT, Solapur Faculty [email protected]
59 Chavan Amol WIT, Solapur Student
60 Jadhav Akhay WIT, Solapur Student

List of Resource PersonsAnnexure 4
Improving the Performance of Rural Water Supply and Sanitation Sector in Maharashtra229
Sr No
Name of the Resource Person
Organization Designation Email Id
1 Dr M. Dinesh Kumar IRAP, Hyderabad Executive Director [email protected]
2 Mr Nitin Bassi IRAP, Hyderabad Sr. Researcher [email protected]
3 Mr K Sivarama Kishan IRAP, Hyderabad Research Officer [email protected]
4 Mr Arijit Ganguly IRAP, Hyderabad Research Officer [email protected]
5 Mr Anand Ghodke UNICEF, Mumbai WASH Officer [email protected]
6 Prof Puru Kulkarni CTARA Faculty [email protected]
7 Prof Om Damani CTARA Faculty [email protected]
8 Mr Raj Desai CTARA Project cordinator [email protected]
9 Mrs Oshin Dharap CTARA Project cordinator [email protected]
10 Mr Abhishek Sinha CTARA Project enginneer [email protected]
11 Ms Vaishali Bharambe CTARA Project enginneer [email protected]
12 Mr Nikhil Hooda CTARA Project enginneer [email protected]
13 Mr Praneeth Kadambala CTARA Project enginneer [email protected]

Improving the Performance of Rural Water Supply and Sanitation Sector in Maharashtra230

Improving the Performance of Rural Water Supply and Sanitation Sector in Maharashtra231

232