Embed Size (px)
Citation preview

IMPROVING THE MANAGEMENT OF
INFORMATION TECHNOLOGY PROJECTS: A PRELIMINARY ANALYSIS OF
THE CALIFORNIA PROJECT MANAGEMENT METHODOLOGY
A Thesis
Presented to the faculty of the Department of Public Policy and Administration
California State University, Sacramento
Submitted in partial satisfaction of
the requirements for the degree of
MASTER OF PUBLIC POLICY AND ADMINISTRATION
by
Dandy John Wong
SPRING
2013

ii
© 2013
Dandy John Wong
ALL RIGHTS RESERVED

iii
IMPROVING THE MANAGEMENT OF
INFORMATION TECHNOLOGY PROJECTS: A PRELIMINARY ANALYSIS OF
THE CALIFORNIA PROJECT MANAGEMENT METHODOLOGY
A Thesis
by
Dandy John Wong
Approved by:
__________________________________, Committee Chair
Su Jin Gatlin Jez, Ph.D.
__________________________________, Second Reader
Mary K. Kirlin, D.P.A.
____________________________
Date
iv
Student: Dandy John Wong
I certify that this student has met the requirements for format contained in the University format
manual, and that this thesis is suitable for shelving in the Library and credit is to be awarded for
the thesis.
__________________________, Department Chair ___________________
Robert W. Wassmer, Ph.D. Date
Department of Public Policy and Administration

v
Abstract
of
IMPROVING THE MANAGEMENT OF
INFORMATION TECHNOLOGY PROJECTS: A PRELIMINARY ANALYSIS OF
THE CALIFORNIA PROJECT MANAGEMENT METHODOLOGY
by
Dandy John Wong
The California Technology Agency (CaTA) has adopted the California Project
Management Methodology (CA-PMM) as a tool to help information technology (IT)
project managers deliver successful IT projects. The California state agencies developing
these IT projects are attempting to capitalize on technological innovation to enhance the
delivery of services to Californians. Despite the widespread use of this project
management tool throughout the state, the impact of the CA-PMM on IT projects was
unknown. This thesis studies the impact of the CA-PMM by comparing the outcomes of
IT projects started before the implementation of CA-PMM to projects started after its
implementation.
Using publicly available data from the CaTA IT Project Tracking website, I tested
whether statistically significant differences existed between IT projects that started before
and those that began after the implementation of CA-PMM. My study answered three
questions based on data about IT project costs, milestone completion, and project
completion.

vi
The results from my research support that the CA-PMM is having a positive
impact on IT project outcomes. Projects begun since the implementation of CA-PMM
are less likely to revise their budgets than projects begun before the implementation of
CA-PMM. In addition, there were fewer delays in project milestone completion since the
implementation of CA-PMM. Even overall project completion delays seem to be on the
downward trend. However, these results should be considered with caution, as they are
not causal; there may be other explanations for the difference in project outcomes since
the implementation of CA-PMM. The results from this preliminary study underscore the
need for future research to determine the impact that the CA-PMM is having on IT
project outcomes throughout the state.
_______________________, Committee Chair
Su Jin Gatlin Jez, Ph.D.
_______________________
Date

vii
ACKNOWLEDGEMENTS
I am a true believer that success is not just a reflection of the individual, but of the
community of people that have contributed to that individual’s success. I have been fortunate to
encounter so many individuals that have inspired, helped, shaped, and supported me toward a
successful path in life, let alone completing my Master’s thesis.
First and foremost, I would like to thank my best friend and beautiful wife, Colleen, for
your patience and unconditional support as we close this chapter in our lives and begin another
with our growing family. The miles driven and time away from each other have only
strengthened our bond. I will forever be grateful for your perspective and input during my pursuit
of this degree.
I would like to thank Helen Hill and Raymond Tompkins for inspiring me to succeed in
life. It was my karma to meet the both of you when and where I did. You really showed me that
I had options in life; all I needed to do was seize the opportunity. Without the two of you, I do
not think any of this is possible.
I must thank Nancy Kaplan-Biegel who really helped shape my academic career. I came
to your class very rough around the edges and my writing skills may have been even more
unrefined. I cannot express my sincere gratitude for all the time spent in office hours and your
willingness to teach me how to write.
I would also like to thank the exceptional and dedicated staff at Sacramento State that has
shaped my approach to public policy and administration. From Mary Kirlin’s “go figure it out”
to David Booher’s collaborative approach and techniques, I am truly using all of the tools and
skills that I have learned in the Public Policy and Administration program. Suzi, you are a
lifesaver.

viii
I especially would like to thank Su Jin Gatlin Jez, Mary Kirlin, and Ted Lascher for your
guidance to help me complete my thesis. I truly appreciate your guidance as my thesis topic went
through all of the permutations and complications before I was able to complete a product that I
am very proud of now.
To my friends, I am lucky to have such great friends in my life who keep me humbled. I
am done now; see you again soon!
Last but absolutely not least, to my family, I am thankful to have you in my life, as you
provide me with insight and perspective for my career in public service. Although I may have
few conversations with my immigrant family, they are an incredible inspiration to me as they are
a true embodiment of family and community. The lifetime of sacrifice that my immigrant parents
have made for my siblings and me is simply inadequate to convey with words.

ix
TABLE OF CONTENTS
Page
Acknowledgements ................................................................................................................ vii
List of Tables ........................................................................................................................... xi
List of Figures ........................................................................................................................ xii
Chapter
1. CALIFORNIA’S TECHNOLOGY GAP............................................................................ 1
Research Question ....................................................................................................... 2
History of the California Technology Agency ............................................................ 3
Impetus for the California Project Management Methodology ................................... 4
Organization of this Thesis .......................................................................................... 7
2. WHAT WE KNOW ABOUT PROJECT MANAGEMENT.............................................. 8
Project Management Body of Knowledge ................................................................... 9
Definition of Project Management ............................................................................. 11
The Value of PMBOK ............................................................................................... 14
Project Management Theory vs. Reality .................................................................... 15
Developments in the Project Management Discipline ............................................... 18
Beyond PMBOK ........................................................................................................ 21
Conclusion ................................................................................................................. 24
3. METHODOLOGY ........................................................................................................... 25
California Project Management Methodology ........................................................... 26
Data Used for Analysis .............................................................................................. 27
Research Question ..................................................................................................... 30

x
Definition of Terms ................................................................................................... 31
Data Analysis ............................................................................................................. 36
Limitations ................................................................................................................. 39
Summary .................................................................................................................... 40
4. RESULTS ......................................................................................................................... 41
Summary .................................................................................................................... 47
5. CONCLUSION ................................................................................................................. 50
Purpose of this Study - Revisited ............................................................................... 50
Analysis of CA-PMM ................................................................................................ 51
Implications for the California Technology Agency ................................................. 54
Policy Recommendations .......................................................................................... 55
Limitations ................................................................................................................. 56
Future Research ......................................................................................................... 57
Appendix A: Detailed Project Information – Timelines ........................................................ 59
Appendix B: Detailed Project Information – Costs ................................................................ 70
Appendix C: Detailed Project Information – Milestone Completion ..................................... 84
References ............................................................................................................................... 95

xi
LIST OF TABLES
Tables Page
1. Table 2.1: Identified Gaps in Contemporary Project Management Methodology ...... 17
2. Table 2.2: Software Project Failure Factors................................................................. 18
3. Table 3.1: Trigger Events for Special Project Reports ................................................ 28
4. Table 3.2: Project-Reporting Table – Project Timeline Dates………… .................... 36
5. Table 3.3: Project-Reporting Table – Project Costs…. ............................................... 36
6. Table 3.4: Project-Reporting Table – Project Milestone Dates……… ...................... 37
7. Table 3.5: Pre vs. Post CA-PMM ............................................................................... 38
8. Table 4.1: Summary of Pre vs. Post CA-PMM IT Projects………… ......................... 41
9. Table 4.2: t-test Results for Pre vs. Post CA-PMM IT Project Costs .......................... 44
10. Table 4.3: t-test Results for Pre vs. Post CA-PMM IT Project Milestones ................. 45
11. Table 4.4: t-test Results for Pre vs. Post CA-PMM IT Project Completion ................ 46
12. Table 4.5: Summary of Pre vs. Post CA-PMM IT Project Milestones ........................ 48
13. Table 4.6: Summary of Pre vs. Post CA-PMM IT Project Completion ....................... 49
14. Table 5.1: Pre vs. Post CA-PMM IT Project Budget Changes .................................... 52
15. Table 5.2: Pre vs. Post CA-PMM IT Project Milestones ............................................. 53
16. Table 5.3: Pre vs. Post CA-PMM IT Project Completion ........................................... 54

xii
LIST OF FIGURES
Figures Page
1. Figure 2.1: PMBOK Knowledge Areas……… ........................................................... 10
2. Figure 2.2: PMI Project Management Life Cycle…….… ........................................... 12
3. Figure 2.3: California Project Management Methodology (CA-PMM)… .................. 13
4. Figure 2.4: Simple Network Communication System…… ......................................... 20
5. Figure 2.5: Soft Skills of Project Management ............................................................ 24
6. Figure 3.1: California Project Management Methodology (CA-PMM)……… .......... 26
7. Figure 4.1: Pre vs. Post CA-PMM IT Project Costs .................................................... 43

1
Chapter 1
CALIFORNIA’S TECHNOLOGY GAP
California is home to many of the world’s leading technology companies that
have shaped the way global businesses operate. Companies like Apple, Oracle, and
Salesforce.com have changed the landscape of information technology (IT)
infrastructure, enabling the private industry to benefit from sophisticated IT infrastructure
and software analytics to improve services for its customers. Despite a geographic
advantage, California’s state agencies have been slow to utilize improved IT
infrastructure to enhance the delivery of services to Californians. Some critics suggest
that California’s governance system itself is outdated and only able to utilize new
technology once it has become obsolete (Gunnison, 1997). For better or worse,
California’s democratic system moves systematically to guarantee that checks and
balances prevent unfettered and wasteful spending (McCormick, 1997). Due to recent
changes in legislation, the California Technology Agency’s (CaTA) responsibility is to
oversee statewide IT infrastructure and invest tax dollars wisely to create public value.
The Program Management Office (PMO) of the CaTA has the difficult task of
overseeing the successful completion of large IT projects undertaken by state agencies.
California state agencies are historically paper intensive institutions that have been slow
to adopt IT infrastructure that can bring more effective and efficient services to
Californians. The PMO is currently monitoring 53 large IT projects that aim to help state

2
agencies improve services at an estimated cost of $4.96 billion1 (California Technology
Agency, 2012). The trend toward investment in IT infrastructure to improve business
practices will continue to grow for all state agencies. However, it is imperative that the
PMO be able to oversee and ensure the successful completion of these IT projects.
The PMO has adopted the California Project Management Methodology (CA-
PMM) as a tool to help carry out its mission to provide primary support for program and
project planning, investment analysis, and project management (California Technology
Agency, 2011). The CA-PMM is essentially a “tool of the trade” for project managers at
California state agencies.
Research Question
This thesis explores whether the CA-PMM is the best tool to fulfill the PMO’s
mission to ensure successful delivery of IT projects that will benefit the state. In this
thesis, I analyze whether the CA-PMM toolkit is helping project managers deliver IT
project success.
In particular, I examined the ability of CA-PMM to accurately estimate project cost
and deliver on key milestones.
A. How effective is the CA-PMM in helping IT project managers estimate IT project
costs?
B. How effective is the CA-PMM in helping IT project managers deliver on
estimated milestone completion dates?
1 The California Technology website indicates $4.96 billion. Results from this study indicate that the
adjusted IT project budget amount is $5.39 billion. In addition, this study began prior to the completion or
suspension of certain IT projects, and thus the number of current projects may not be current.

3
C. How effective is the CA-PMM in helping IT project managers deliver IT projects
within the estimated project timelines?
I gathered data from the CaTA IT Project Tracking website on February 17, 2013 to
answer this question at
http://www.cio.ca.gov/Government/IT_Policy/IT_Projects/index.html.
History of the California Technology Agency
In 1995, legislation established the Department of Information Technology
(DOIT) to make strategic decisions on statewide IT infrastructure. Although the DOIT’s
mission was to oversee the state’s information technology future, internal and external
problems made it impossible for DOIT to oversee the state’s IT policies and initiatives
(Peterson, 2002). As a result, state lawmakers saw little value in the DOIT, and soon
after, the department dissipated (California Technology Agency, 2011).
On July 1, 2002, provisional statues that empowered the DOIT expired, and the IT
oversight roles diffused to other state control agencies. The position of the State Chief
Information Officer (CIO) advised the Governor on statewide IT policy. The Department
of Finance (DOF) began to make decisions on statewide IT policy, project initiation,
project oversight, and security (California Technology Agency, 2011). Meanwhile, the
Department of General Services (DGS) governed IT procurement policy and
implementation (California Technology Agency, 2011). The disbandment of the DOIT
also brought forth a more collaborative approach to statewide IT policy. Leaders of
statewide IT policy created collaborative governance bodies to help make informed IT
policy decisions.

4
In 2006, the Legislature passed new legislation that introduced more changes to
the state’s IT future. SB 834 (2006) codified the Office of the State Chief Information
Officer (OCIO) and made the position of State CIO a cabinet-level appointment, subject
to Senate confirmation. The Senate appropriated funds for the OCIO to carry out the
Governor’s directive. Although SB 834 empowered the State CIO to advise the
Governor on the strategic management of statewide information technology, the control
of information technology policies and procedures remained disparate, with the DOF and
the DGS still in charge of their respective duties after the dissolution of the DOIT.
In 2010, the Legislature acted again to improve the information technology future
of California. Former Governor Arnold Schwarzenegger signed AB 2408 in recognition
of the need to consolidate statewide information technology governance (California
Technology Agency, 2011). AB 2408 (2010) consolidated the disparate functions
previously performed by the DOF and the DGS by reestablishing a centralized state
agency—now called the California Technology Agency—that is responsible for
overseeing statewide IT policy and all state IT projects. The bill also renamed the
position of State CIO as the Secretary of California Technology (California Technology
Agency, 2011). An important element of this reorganization was the necessity to re-
establish statewide oversight of information technology projects commenced by state
agencies.
Impetus for the California Project Management Methodology
A big factor in the development of the CA-PMM was the Legislature’s frustration
with mismanaged information technology projects (Senate Committee on Governmental

5
Organization, 2010). Not only did the dissolution of the DOIT decentralize control of the
state’s IT policies, it also had a negative impact on IT project oversight and management.
Numerous legislators grew frustrated with the department leaders who could not provide
answers about IT projects undertaken by their department, status reports on progress, or
the amount of money currently spent on IT projects (Sterngold, 2005). Although the
DOF and the DGS had specific IT duties, they were not a centralized agency that could
coordinate efforts to set IT policy and standards.
The Administrative Office of the Courts (AOC) foray into a large IT project
further compelled the need for a statewide IT project tracking and reporting standard. At
the time, the California Case Management System (CCMS) was one of the largest
information technology projects undertaken by any state agency. The initial scope of
CCMS was to link criminal and civil case information across 58 county courts that used
200 different systems (California State Auditor, 2011). However, the scope of the project
grew, incorporating more features and involving more stakeholders (ibid). The Bureau of
State Audits report (2011) specifically mentioned that the problem with CCMS was poor
project management. The Legislature’s discontent with the lack of statewide standards
was clearly apparent in early AB 2408 (2010) subcommittee meetings. In Joint
Legislative Budget Committee proceedings, legislators specifically cited the need for the
OCIO to brief the committee on the progress of CCMS because of the lack of general
project oversight (Senate Committee on Governmental Organization, 2010). It has been
ten years and $500 million dollars since work began on CCMS. As of today, work on

6
CCMS has stopped. Meanwhile, the state still does not have a statewide case
management system (The Sacramento Bee, 2012).
Other large-scale, high profile IT projects has garnered the attention of state
lawmakers and the public. The State Controller’s Office (SCO) has recently halted work
on the estimated $370 million 21st Century Project that was designed to streamline the
state’s payroll and human resources functions with a new system called My CalPAYS
(The Sacramento Bee, 2013), (California State Controller's Office, 2012). Additionally,
the Department of Finance is responsible for the success of the state’s new $616 million
Financial Information System for California (FI$Cal) project that seeks to improve the
way state agencies perform budgeting, accounting, procurement, and cash management
functions (State of California, 2011). Recently, the Secretary of State’s Office has
received heightened attention over its own IT based project—California Business
Connect—which will change its current paper-based business incorporation filing system
(Ortiz, 2013).
The adoption of the CA-PMM was a direct reaction to years of lax oversight of
statewide IT projects (Senate Committee on Governmental Organization, 2010). AB
2408 (2010) empowered the CaTA to develop a standardized methodology and approach
to IT project management. Recent research has linked the use of PMBOK to IT project
success and completion in private and public organizations (Abu Ali, 2010), (Chen,
2009). However, there is a lack of understanding about whether the CA-PMM is the
most suitable tool project managers can employ to ensure the success of IT projects in
California. This thesis attempts to answer that question by determining whether the CA-
7
PMM is helping project managers deliver IT projects success. If the CA-PMM is not
delivering the desired results, how can we improve the CA-PMM to ensure IT project
success?
Organization of this Thesis
This first chapter presents the issue facing our state and provides historical
background for the California Project Management Methodology (CA-PMM). In
Chapter 2, I review the project management literature to understand the profession and
provide a foundation for my research. In Chapter 3, I explain my research methods,
define the information used in my analysis, and identify the data used for this thesis. I
provide the findings of my study in Chapter 4. Finally, in Chapter 5, I discuss
implications of the findings and provide recommendations on how to improve the
California Project Management Methodology (CA-PMM) to ensure the successful
completion of information technology projects undertaken by state agencies.

8
Chapter 2
WHAT WE KNOW ABOUT PROJECT MANAGEMENT
The California Project Management Methodology (CA-PMM)—also known as
the Statewide Information Management Manual (SIMM) § 17—is a customized toolkit
that borrows project management knowledge, skills, tools and techniques from the
Project Management Institute’s (PMI) Project Management Body of Knowledge
(PMBOK) (California Technology Agency, 2011). The CA-PMM identifies specific
tasks and activities that a project manager must know and perform to aid in the
completion of IT projects, such as performing cost estimation, project scoping,
complexity analysis, identifying project benefits, and preparing a Work Breakdown
Structure (WBS)—also referred to as the “hard skills” of project management. “The goal
[of the CA-PMM] is to prevent Project Managers and their teams from reinventing the
wheel and to assist them in becoming successful and effective in implementing IT
projects” (California Technology Agency, 2011, p. 11). There is little academic research
available on the CA-PMM. However, numerous scholars have conducted studies on
PMBOK and the other project management principles that provide insight for this study.
I reviewed the recent project management literature that is beginning to reshape
the field of project management. First, I present the principles of the PMBOK to provide
a foundational understanding of the project management discipline. Second, I define the
term “project management” for the purpose of this thesis. Third, I discuss how the
application of the project management principles deviates from the theory. Fourth, I
discuss some of the recent developments in the field of project management. Finally, I

9
examine the arguments about the necessity to re-evaluate the lexicon of project
management.
Project Management Body of Knowledge
The American Defense industry and NASA initially documented the PMBOK
principles during the 1960s-1970s (Peng, 2007). The Project Management Institute
(PMI) was one of several international organizations that spearheaded the growth of
project management as a professional discipline. In 1987, PMI published the first edition
of A Guide to the Project Management Body of Knowledge (Project Management
Institute, 2008) and will release a 5th
edition in 2013.
The PMI’s Project Management Body of Knowledge (PMBOK) is an inclusive
term that describes the sum of knowledge within the profession (Project Management
Institute, 2008) and has become one of the preeminent standards of project management.
PMBOK has nine knowledge areas that comprise the practices and processes of project
management (ibid).

10
Figure 2.1: PMBOK Knowledge Areas
PROJECT MANAGEMENT
4. Project Integration Management
4.1 Project Plan Development4.2 Project Plan Execution4.3 Integrated Change Control
5. Project Scope Management5.1 Initiation5.2 Scope Planning5.3 Scope Definition5.4 Scope Verification5.5 Scope Change Control
6. Project Time Management6.1 Activity Definition6.2 Activity Sequencing6.3 Activity Duration Estimating6.4 Schedule Development6.5 Schedule Control
7. Project Cost Management7.1 Resource Planning7.2 Cost Estimating7.3 Cost Budgeting7.4 Cost Control
8. Project Quality Management8.1 Quality Planning8.2 Quality Assurance8.3 Quality Control
9. Project Human Resource Management
9.1 Organizational Planning9.2 Staff Acquisition9.3 Team Development
10. Project Communications Management
10.1 Communications Planning10.2 Information Distribution10.3 Performance Reporting10.4 Administrative Closure
11. Project Risk Management11.1 Risk Management Planning11.2 Risk Identification11.3 Qualitative Risk Analysis11.4 Quantitative Risk Analysis11.5 Risk Response Planning11.6 Risk Monitoring and Control
12. Project Procurement Management
12.1 Procurement Planning12.2 Solicitation Planning12.3 Solicitation12.4 Source Selection12.5 Contract Administration12.6 Contract Closeout
The PMI continues to expand the knowledge base of project management and
advance the academic credibility of the discipline. PMI offers the Project Management
Professional (PMP) training that qualifies applicants to become certified project
managers (Project Management Insitute, 2013). These PMP professionals presumably
will have the requisite education, skill, and competency to lead and direct projects to
ensure completion. Recent research in Arab countries suggests that more companies
demand certified PMPs to oversee IT projects because of their training and certification
requirements (Abu Ali, 2010). Abu Ali (2010) suggests that PMPs have the critical
training and certification required to ensure the completion of IT projects. In addition,

11
Abu Ali suggests that the demand for certified PMPs will increase because the project
managers will have the requisite knowledge to help avoid project failures (ibid).
Definition of Project Management
PMI Definition
The term “project management” is often times used to describe an organizational
approach to the management of ongoing operations (Project Management Institute,
2008). The PMBOK principles are applicable to an abundant number of fields and
disciplines such as IT and construction projects (Project Management Institute, 1997).
For this thesis, I reviewed the project management literature to provide a context for the
analysis of the CA-PMM.
Project management is a methodology and framework of activities that project
managers perform to complete a project. “Project management is the application of
knowledge, skills, tools and techniques to project activities in order to meet or exceed
stakeholder needs and expectations from a project” (Project Management Institute, 2008,
p. 6). The Project Management Institute has identified a project life cycle to
conceptualize the process of a project. Each of these cycles contains process components
outlined in Figure 2.1: PMBOK Knowledge Areas. For instance, the Planning Life Cycle
contains Scope Planning and Scope Definition.

12
Figure 2.2: PMI Project Management Life Cycle
CA-PMM Definition
The CA-PMM defines project management as the application of knowledge,
skills, and techniques that receive inputs and generate outputs to complete an IT project
(California Technology Agency, 2011). The CA-PMM draws upon the principles from
the PMBOK standard, with deliverables and phases customized to meet the needs of
California. The CA-PMM identifies five stages of an IT project, referred to as Life
Cycles: Concept, Initiating, Planning, Executing, and Closing (California Technology
Agency, 2011). Each of these Life Cycles contains tasks and deliverables designed to
help California IT project managers deliver a successful project.
Initiating Planning Executing Monitoring
and Controlling
Closing

13
Figure 2.3: California Project Management Methodology (CA-PMM)
1. Project Concept Statement2. Size Estimate (ROM)
3. Project Chartera. Backgroundb. Objectivec. Proposed Solutiond. Preliminary Scope Statemente. Impact Assessmentf. Deadlineg. Size Estimateh. Complexity Assessmenti. High Level Project Orgj. Project Prioritiesk. Assumptionsl. Constraintsm. Procurement Assumptionsn. Known Riskso. Runaway/Triggersp. Shutdown Conditionsq. Stakeholder Analysis4. Issue Log
5. Project Management Plan:a. Scope Management Planb. Configuration/Change Controlc. Human Resources Pland. Communication Plane. Risk Management Planf. Cost Management Plang. Quality Management Planh. Schedule Management Plani. Procurement Planj. Contract Management Plan6. Organizational Change Management Plan7. Transition to Maintenance and Operations Plan
14. Formal Product Acceptance15. Operations Metrics16. Transition to Maintenance and Operations17. Contract(s) Closure18. Administrative Closure19. Closing Checklist20. Post Implementation Evaluation Report21. Lessons Learned
8. Deliverable Acceptance Criteria9. Status Reporta. Team Member to PMb. PM to Sponsorc. Executive Status Reportd. Metrics: Vital Signs, CPI, PSI, Earned Value, Dashboard10. Project Management Plan Updates11. Benefit Validation12. Customer Acceptance13. Product Implementation
Concept Initiating Planning Executing Closing
Concept Statement Project Charter Project Management PlanDeliverables &
Performance DataContract/Admin Closure
California Project Management Methodology (CA-PMM)
The project manager must perform certain tasks within each stage of the CA-
PMM project life cycle in order to produce tangible outputs that help the project succeed.
The stages of the Project Life Cycle are more indeterminate than they appear from the
illustration above, as the completion of tasks within each stage may overlap. Each stage
has specific tasks that help the project manager produce these outputs such as developing
project scope and concept, reporting matrices, risk assessments, complexity analysis,
status reports, and project closeout documentation. The CA-PMM is essentially a “How-
To Success Guide” for IT project managers.

14
The Value of PMBOK
Many industry researchers and professionals consider PMBOK as the preeminent
worldwide standard for project management (Ghosh, 2012). A recent survey concluded
that the PMBOK standards used together as a toolset, rather than as an individual set of
information, are more effective and useful for project managers to deliver a successful
project (Besner, 2012). Besner points out that the project managers and organizations
have the power to determine what type of project management principles to utilize for
projects, but that the series of tasks within the PMBOK principles are more useful than
performing one task without the others (ibid). Ghosh (2012) compared other project
management methodologies to PMBOK and found that all of the standards have
overlapping methods, with PMBOK emphasizing the value of repeatable processes to
help project managers complete common project tasks.
An analysis of the high profile Internal Revenue Service (IRS) Tax Systems
Modernization (TSM) project suggests that better project management would have been
beneficial (Bozeman, 2002). In one instance, Bozeman identified how an IRS project
manager—who worked on smaller IT projects—lacked sufficient project management
skills, which contributed to the implementation problems (ibid). Bozeman (2002)
concluded that the lack of qualified project managers within the IRS led to a culture of IT
project failure. The Tax Systems Modernization project was extremely complicated
because it simultaneously introduced technical, organizational, and cultural change in an
organization that was ill-equipped to handle any one change individually (ibid). In many
respects, the IRS example mimics the IT projects that the SCO and DOF have already

15
started that will change how the entire state performs human resource (My CalPAYS)
and financial (FI$Cal) functions.
Further evidence suggests that the PMBOK principles have benefits that go
beyond single IT projects. My CalPAYS and FI$Cal are the type of organization-wide IT
systems that define the term Enterprise Resource Planning (ERP) systems. An Enterprise
Resource Planning system integrates many facets of an organization, such as planning,
sales, and marketing that become part of the business process and support the
organization’s strategic direction (Chen, 2009). The results from a survey of state Chief
Information Officers (CIO) suggest that establishment of a project management career
path enhances the continuous improvement of IT project success (National Association of
State Chief Information Officers, 2005). Chen (2009) concludes that the incorporation of
PMI principles into Enterprise Resource Planning can have beneficial effects because of
the similar skill sets required to ensure the success of both.
Project Management Theory vs. Reality
The theory of project management often times does not replicate the reality during
the application of project management principles. In an ideal world, each IT project
manager will perform project management activities in a chronological order: defining
the scope of project, estimating the amount of time required, estimating costs, ensuring
quality of tasks performed, identifying human resources, establishing communication
plans, identifying risks, and procuring goods and services (McDowell, 2001). In reality,
IT projects lack enough planning time or sufficient resources to ensure completion
(McDowell, 2001).

16
McDowell (2001) introduces the Just-in-time Project Management (JITPM)
approach to successful “on-the-fly” IT project management. McDowell analyzes two
similar large-scale IT projects initiated in a New England hospital. McDowell (2001)
concluded that the failed IT project was due to reasons other than project management
failure. For the successful IT project, McDowell concluded that the project had enough
PMBOK principles engrained into the project that allowed it to succeed, despite the
improper sequencing of the completion of those tasks (ibid).
Bryde (2003) contends that even if some organizations recognize the value of
project management principles, the application of those principles are not consistent
across organizations. The author suggests that organizations value the project
management principles differently and thus, the application of those principles vary
across organizations (Bryde, 2003). As a result, Bryde argues that theory of project
management will always lag behind the practical application because of the differing
levels of application of those project management principles. Researchers suggest that
regardless of an organization’s commitment to using PMBOK, other reasons can derail
project success (Furumo, 2006).
Despite the application of project management principles, projects led by
qualified project managers can still experience problems with implementation (Furumo,
2006). Furumo (2006) surveyed 128 respondents—all of whom were PMI members—
and found that both public and private organizations experienced similar cost overruns
and further that public organizations tend to complete the projects later than private
organizations. In addition, Furumo reports that 46% of respondents felt that one of the

17
project management tasks—develop an initial project management flowchart—simply
did not offer value for project managers to utilize during the project life cycle. The
Furumo finding further supports the notion that project management theory differs from
the real-world application.
Other researchers have suggested that the PMBOK principles alone are not
enough (Al-Khouri (2012); Sarantis (2009); Peng, 2007). Sarantis compared three
contemporary project management theories—Project in Controlled Environments
(PRINCE), Project Management Institute (PMI), and Goal Directed Project Management
(GDPM) (Sarantis, 2009). Although each theory brings value to the project management
field, Sarantis (2009) identified several gaps in all three theories that fail to address the
implementation issues as applied to government IT projects.
Table 2.1: Identified Gaps in Contemporary Project Management Methodology
Identified Gaps in Contemporary Project Management Methodology
1. Inability in capturing the Goal-Driven Nature of e-Government Projects refers
to the lack of mutually understandable goals of the IT project.
2. Inadequacy in capturing the Multidimensional Nature of Projects refers to
inability to realize that there are other issues that can impact the IT project,
namely business and organization processes and reorganization.
3. Dearth of Knowledge Transfer refers to the methodologies inability to gain
from lessons learned.
4. Poor modeling of e-Government Stakeholders refers to the lack of
considering all stakeholder points of view.
Sarantis, 2009.
These gaps in contemporary project management principles suggest that government IT
projects managers need to embrace a more encompassing project management approach
that can adequately address the deficiencies in the current practice.

18
Developments in the Project Management Discipline
A New Approach to Project Management
Project management researchers have concluded that there is a need to integrate
other project management methodologies to establish a uniform approach to avoid project
failures (Peng, 2007). Peng (2007) compared four international standards of project
management—PMBOK, USA-International Competence Baseline (USA-ICB), American
Society of the Advancement of Project Management (APMBOK), and P2M—and
concluded that all four have valid approaches and techniques that may aid in the
completion of projects. However, the author further contends that it is difficult to
understand, study, and apply these principles in a uniform way to ensure project success
(Peng, 2007).
Other researchers have tried to isolate the source of problems within project
management in order to build a knowledge base to move forward. Cerpa and Verner
(2009) surveyed a group of international project managers and practitioners to understand
why software projects failed. Seventy out of the 235 completed surveys were “failed
software projects.”
Table 2.2: Software Project Failure Factors
Software Project Failure Factors Overall
Percentage of
Projects
Delivery date impacted the development process 92.9
Project was underestimated 81.4
Risks were not re-assessed controlled, or managed through the
projects
75.7
Staff were not rewarded for working long hours 74.3
Delivery decision made without adequate requirements
information
72.9

19
Software Project Failure Factors Overall
Percentage of
Projects
Staff had an unpleasant experience working on the project 72.9
Customers/Users not involved in making schedule estimates 71.4
Risk not incorporated into the project plan 70.0
Change control not monitored, nor dealt with effectively 70.0
Customer/Users had unrealistic expectations 68.6
Process did not have reviews at the end of each phase 67.1
Development Methodology was inappropriate for the project 65.7
Aggressive schedule affected team motivation 65.7
Scope changed during the project 64.3
Schedule had a negative effect on team member’s life 62.9
Project had inadequate staff to meet the schedule 61.4
Staff added late to meet an aggressive schedule 61.4
Customers/Users did not make adequate time available for
requirements gathering
60.0
Cerpa. 2009.
The author concludes that there are a multitude of reasons why a project fails—such as
underestimated project scope or risk assessment—but there are other “people” factors
that can impact project success—i.e. the schedule having a negative effect on a team
member’s life or not being rewarded for working long hours (Cerpa, 2009). Often times,
public project managers have little control of the project delivery date (Furumo, 2006).
Furumo (2006) noted that any future analysis on IT project cost and completion rates
should distinguish between public and private because of the heightened scrutiny and
more external regulatory oversight of public projects.
A recent study concluded that the current IT project management framework is
incomplete. Al-Khouri (2012) asserted that there is currently no overarching framework
of project management that can guide government led IT projects to success. The author
further contends that IT project failure rates remain at 60 to 70 percent because the

20
project management methodologies focus too much on the technical aspects of project
management, not the organizational management and people issues (Al-Khouri, 2012).
Al-Khouri contends that new approaches to address the problem with the “management”
and “people” aspects of the project management discipline are necessary (ibid).
Other research has identified another element that may add value to the project
management discipline. Kisielnicki (2011) identifies that a network communication
structure can help aid in the success of IT projects. Figure 2.2 illustrates the concept of
Kisielnicki’s simple network communication framework.
Figure 2.4: Simple Network Communication System
Kisielnicki, 2011
While the CA-PMM approach implores project members to communicate with one
another, the communication structure has a more hierarchical structure that relies heavily
on the Project Manager to assign reporting relationships and be the ultimate information
gatekeeper (California Technology Agency, 2011). Kisielnicki (2011) further asserts that
a network communication structure is more conducive to IT project success because it

21
fosters better: 1) progress monitoring, 2) cooperation and knowledge transfer, and 3)
problem solving among its team members because they are more invested in the project.
The new developments in the field of project management suggest that the
inclusion of additional elements may strengthen the CA-PMM. Past research suggests
that a revised approach to communication (Kisielnicki, 2011) and the incorporation of
more “people” and “management” skills (Al-Khouri, 2012) may add public value to the
existing CA-PMM standard.
New Success Criteria in Project Management
Atkinson (1999) proposes an entirely fresh approach to project management
success criteria. The author suggests that the three evaluation principles of the “Iron
Triangle” are flawed—cost, time, and quality (Atkinson, 1999). The task of estimating
cost and time are at best guesses (ibid). In addition, Atkinson (1999) reduces the ability
to produce a quality IT project as a mere phenomenon. Atkinson is challenging the
project management industry to measure successes based on criterion that is harder to
quantify—such as benefits to stakeholders and organizations.
Beyond PMBOK
The academic research on the field of project management continues to evolve.
Some new approaches challenge the status quo of evaluating IT project success. Other
ideas aim to contribute to the wealth of the current project management knowledge. This
thesis draws upon past research to chart out a new path to evaluate the CA-PMM.

22
Redefining IT Project Success
Recent research aims to re-evaluate the criteria to determine the success of IT projects
(Karlsen, 2005). Karlsen (2005) proposes the adoption of four new criteria to measure
success other than simply cost, time, and quality:
1. The IT system works as expected and solves the problem
2. The IT system has high reliability
3. The solution contributes to improved efficiency and competitive power
4. The IT system contributes to realization of strategic, tactical and operational goals
Unlike other researchers, Karlsen (2005) acknowledges that the Iron Triangle—cost,
time, and quality—does have its legitimacy as a measurement criterion, but that it should
not be the only criteria. Karlsen suggests that we should measure project management
success holistically to include the process of the IT project, user’s views of the project
results, and the overall effectiveness in helping the organization achieve its goals
(Karlsen, 2005).
Karlsen’s research proposes a new way to define successful IT projects.
However, this approach does not necessarily help IT project managers deliver a
successful IT project. Even though Karlsen’s new method of evaluation has some merit,
the adoption of new measurement criteria does not seem likely, given the highly
scrutinized nature of publicly funded IT projects in California (California State Auditor,
2011); (Senate Committee on Governmental Organization, 2010); Furumo, 2006).

23
Emergence of Soft Skills in Project Management
The addition of “soft skills” into the CA-PMM lexicon may be able to have more
traction. Gillard (2009) concludes that it is becoming more evident that hard skills of
project management are not enough to make projects successful. In addition to technical
expertise, project managers need to have the solid interpersonal communication and
leadership skills in order to make projects successful (Gillard, 2009).
Sukhoo (2005) identifies soft skills that may contribute to the project management
lexicon. The author concludes that the combination of technical and soft skills should be
part of the project management skill set to use during the project life cycle (Sukhoo,
2005). Each “soft skill” is important to project managers during different stages of IT
project life cycles. It is imperative for a project manager to blend the hard and soft skills
together and to know when and how to use each skill to ensure IT project success (ibid).
Sukhoo further concludes that the addition of these types of “soft skills” may help
improve the success rates of IT projects.

24
Figure 2.5: Soft Skills of Project Management
Sukhoo, 2005.
Conclusion
The review of the existing literature about IT project management suggests that
there may be some room for improvement. The analysis of the current project
management literature is appropriate, given that the existing California Project
Management Methodology (CA-PMM) borrows principles from the Project Management
Institute’s (PMI) Project Management Body of Knowledge (PMBOK). I have identified
the history of project management, the rationale for project management, and introduced
some new ideas within the profession. Cerpa and Verner’s (2009) and Furumo’s (2006)
research suggested that IT projects can still have problems with implementation, and that
those problems may only increase if it is undertaken by a public entity. Suhkoo’s (2005)
analysis introduced the “soft skills” that I will use to evaluate the best course of action to
improve the existing lexicon of the project management principles.
Communication Skills
Team building
Time Management
Organizational Effectiveness
Trustworthiness
Stress Management
Leadership
Conflict Management
Flexibility & Creativity
Change Mangement

25
Chapter 3
METHODOLGY
My thesis evaluated the impact that the California Project Management
Methodology (CA-PMM)—also known as the Statewide Information Management
Manual (SIMM) § 17—toolkit is having on information technology (IT) projects
throughout the state. In answering this question, I evaluated the utility of the CA-PMM
by looking at two traditional IT project success standards: cost and time. I retrieved data
from the CaTA IT Project Tracking website on February 17, 2013 at
http://www.cio.ca.gov/Government/IT_Policy/IT_Projects/index.html to evaluate the
CA-PMM standard.
I analyze both cost and time because these two sets of information are
foundational indicators of IT project success. Although there is a movement within the
project management literature to re-examine the definition of IT project success, cost and
time are the success markers that are universally measurable at this time. This
investigation of cost and time provides a basis for my study of this introductory research
performed on the CA-PMM standard. Alternatively, this initial research on the CA-PMM
may provide insight to future research to improve the CA-PMM standard.
I gathered data from the three types of reports available: 1) Feasibility Study
Report, 2) Special Project Report, and 3) Project Status Report. The respective reports
provide key information such as IT project start and finish times, project costs and
amounts spent, and milestone completion dates. I recorded the information into a
project-reporting chart to assess the CA-PMM standard. The remainder of this chapter

26
identifies the contents of the California Project Management Methodology, explains the
data used for this analysis, defines the research question, provides the definition of terms,
describes the data analysis, and limitations.
California Project Management Methodology
The CA-PMM toolkit is essentially a series of tasks and deliverables that project
managers must perform and produce during each phase of an IT project lifecycle:
concept, initiating, planning, executing, and closing (see Figure 3.1 below). It is the
responsibility of the project manager to know and be able to perform these tasks and
produce deliverables to ensure the completion of IT projects.
Figure 3.1: California Project Management Methodology (CA-PMM)
1. Project Concept Statement2. Size Estimate (ROM)
3. Project Chartera. Backgroundb. Objectivec. Proposed Solutiond. Preliminary Scope Statemente. Impact Assessmentf. Deadlineg. Size Estimateh. Complexity Assessmenti. High Level Project Orgj. Project Prioritiesk. Assumptionsl. Constraintsm. Procurement Assumptionsn. Known Riskso. Runaway/Triggersp. Shutdown Conditionsq. Stakeholder Analysis4. Issue Log
5. Project Management Plan:a. Scope Management Planb. Configuration/Change Controlc. Human Resources Pland. Communication Plane. Risk Management Planf. Cost Management Plang. Quality Management Planh. Schedule Management Plani. Procurement Planj. Contract Management Plan6. Organizational Change Management Plan7. Transition to Maintenance and Operations Plan
14. Formal Product Acceptance15. Operations Metrics16. Transition to Maintenance and Operations17. Contract(s) Closure18. Administrative Closure19. Closing Checklist20. Post Implementation Evaluation Report21. Lessons Learned
8. Deliverable Acceptance Criteria9. Status Reporta. Team Member to PMb. PM to Sponsorc. Executive Status Reportd. Metrics: Vital Signs, CPI, PSI, Earned Value, Dashboard10. Project Management Plan Updates11. Benefit Validation12. Customer Acceptance13. Product Implementation
Concept Initiating Planning Executing Closing
Concept Statement Project Charter Project Management PlanDeliverables &
Performance DataContract/Admin Closure
California Project Management Methodology (CA-PMM)

27
Data Used for Analysis
The data used for this analysis are publicly available on the California
Technology Agency (CaTA) website at:
http://www.cio.ca.gov/Government/IT_Policy/IT_Projects/index.html. I gathered all of
the available data from reports to the CaTA for this analysis. The CaTA reporting
requirements are defined in Government Code § 11546(5), the SIMM §§ 05-90, and the
State Administrative Manual (SAM) §§ 4819, 4920-4945. CaTA’s role is to oversee and
ensure the successful completion of IT projects that aim to bring public value to
Californians.
I retrieved data from three types of reports that are publicly available: 1)
Feasibility Study Report, 2) Special Project Report, and 3) Project Status Report. All of
the reports provide critical information regarding the IT project time and budget
estimates. The next three sections discuss the type of reports and data available.
Feasibility Study Report (FSR)
The FSR (SIMM § 20) is a report that allows the CaTA to determine the necessity
of implementing an IT solution to help solve a business problem. The State
Administrative Manual (SAM) §§ 4920 through 4942 determines the requirement to
submit an FSR to the CaTA.2 The FSR is an initial reporting document that provides the
California Technology Agency with enough information on a proposed IT project to
determine whether the project should be approved, weighing its costs against its public
2 The California Technology Agency does not require an FSR for all IT projects. Each department has a
delegated authority to engage in IT projects that does not require CaTA oversight, contingent that the costs
do not exceed the delegated authority. See the California Technology Agency information technology
delegated cost threshold for more information: http://www.cio.ca.gov/Contact_Us/staff_assignments.html.

28
value. In addition to providing the control agency with a rationale for the proposed IT
solution, the FSR also provides key information needed for the analysis: 1) project
estimated start and finish dates, 2) project milestone delivery dates, and 3) project cost
estimates.
Special Project Report (SPR)
The SPR (SIMM § 30) is the formal report that is submitted to the CaTA to
document changes to IT projects that have already received FSR approval. As specified
in SAM § 4819.36, seven events will require an agency to submit a SPR for an IT project
already under development:
Table 3.1: Trigger Events for Special Project Reports
Trigger Events that require Special Project Report submission to CaTA
1. The total information technology project costs deviate or are anticipated to
deviate by ten percent (higher or lower) or more, or by more than a
specifically designated amount as determined by the Technology Agency,
from the last approved estimated information technology project budget (to
be measured against the combined total of each fiscal year's One-time
Project Costs plus Continuing Project Costs);
2. The last approved overall project development schedule falls behind or is
anticipated to fall behind by ten percent or more;
3. The total program benefits deviate or are anticipated to deviate by ten
percent (higher or lower) or more from the last approved estimated total
program benefits (to be measured against the combined total of each fiscal
year's Cost Savings and Cost Avoidances);
4. A major change occurs in project requirements or methodology;
5. Any conditions occur that require reporting to the Technology Agency as
previously imposed by the Technology Agency; or
6. A significant change in state policy draws into question the assumptions
underlying the project; or

29
Trigger Events that require Special Project Report submission to CaTA
7. A project not previously subject to reporting now meets one of the following
reporting criteria:
a budget action is required to fund all or part of the IT expenditure;
the total development cost is above the cost threshold established by
the Technology Agency;
the new system development or acquisition is specifically required by
legislative mandate or is subject to specific legislative review, as
specified in Budget Act control language or other legislation; or
any conditions occur that require reporting to the Technology
Agency, as previously imposed by the Technology Agency.
SIMM § 30. 2011. p. 1-2.
I used the information gathered from any applicable SPRs to evaluate the
effectiveness of the CA-PMM principles. Similar to the FSR, the SPR provided
important information needed to assess the effectiveness of the CA-PMM to: 1) project
and deliver on adjusted start and finish dates, 2) project and deliver on adjusted milestone
dates, and 3) project and deliver an IT project within the adjusted costs.
Project Status Report (PSR)
The PSR (SIMM § 17D. 2) is a reporting tool that the California Technology
Agency (CaTA) requires to ensure a standardized method of status updates on IT
projects. The PSR provides the project manager with a toolkit to ensure that deliverables
are on schedule and enhance the short and long-term vision for the entire IT project. The
PSR provides important information needed to: 1) track the IT project progress, 2) track
costs of the project, and 3) track milestone accomplishments to assess the effectiveness of
the CA-PMM standard.

30
Research Question
My inquiry answered whether the CA-PMM toolkit is helping project managers
deliver IT project success by examining the ability to accurately estimate project cost and
deliver on key milestones.
A. How effective is the CA-PMM in helping IT project managers estimate IT project
costs?
The first success criterion measured the ability for the CA-PMM to estimate
project costs. This question determined the CA-PMM’s ability to approximate the
entirety of costs associated with IT projects. The critical piece of the CA-PMM is to ask:
What level of public value does this policy provide for Californians? Are the cost
estimates an accurate reflection of the true costs of implementing an IT project or does
the methodology fall short of its intended goal? The answer to these questions lies in the
comparison between IT projects started Pre versus Post CA-PMM.
B. How effective is the CA-PMM in helping IT project managers deliver on
estimated milestone completion dates?
The second success criteria examined the ability of the CA-PMM to help project
managers deliver on estimated milestone completion dates. Projects of any sort, whether
IT or non-IT related, may experience delays due to a variety of reasons. The analysis of
this question helped determine whether the CA-PMM is a reasonable estimation tool or a
methodology that should be re-evaluated. The focus of this inquiry is to ensure that
project managers have a useful tool to deliver a completed IT project. Similar to question

31
A about cost, the answer to this question B lies in the comparison between IT projects
started Pre versus Post CA-PMM.
C. How effective is the CA-PMM in helping IT project managers deliver IT projects
within the estimated project timelines?
Another aspect of the second success criteria is the ability of the CA-PMM to help IT
project managers deliver IT projects within the estimated project timelines. The analysis
of this question helped determine whether the CA-PMM is an effective tool that will help
project managers deliver an IT project or if the methodology should be re-evaluated. The
focus of this question regarding the completion of an IT project is broader than the
milestones within a project. This question is more of a question of whether the CA-PMM
is helpful toward completing an entire IT project. The answer to this question lies in the
comparison between IT projects started Pre versus Post CA-PMM.
Definition of Terms
Estimated Project Start Date
I retrieved the estimated project start dates from the Feasibility Study Report
(FSR) and Special Project Report (SPR) (if applicable). The project start date identifies
when the IT project began. This date is important because it identifies whether the
project belongs in the Pre CA-PMM or Post CA-PMM category. This information is a
key identifier of IT projects pre versus post the implementation of the California Project
Management Methodology (CA-PMM).

32
Revised Project Start Date
I retrieved the revised project start dates from the Feasibility Study Report (FSR)
and Special Project Report (SPR) (if applicable). The revised project start date is a
record of whether the IT project experienced start delays in the project. Procurement,
funding, and resource issues can delay project start dates. The exact causes of the revised
project start dates are interesting; however, they are not part of the scope of this thesis.
This analysis is concerned with the occurrence of a revised project start date to compare
IT projects pre versus post the implementation of the CA-PMM.
Number of Revised Start Dates
The number of revised project start dates is an indicator of the effect the CA-
PMM on IT projects. This date is important because it provides a comparison of IT
projects pre versus post CA-PMM implementation.
Estimated Project End Date
I retrieved the estimated project end dates from the Feasibility Study Report
(FSR) and Special Project Report (SPR) (if applicable). The estimated project end date is
a critical date for the entire project. This date determines the estimating ability of the
project manager and the effectiveness of the CA-PMM toolkit to estimate the amount of
time required for the IT project. This information is another key identifier of IT projects
pre versus post the implementation of the CA-PMM.
Revised Project End Date
I retrieved the revised project end dates from the Feasibility Study Report (FSR)
and Special Project Report (SPR) (if applicable). The revised project end date is a record

33
of whether the IT project experienced delays in the project. Procurement, funding, and
resource issues can delay project end dates. Similar to the revised project start dates, the
exact causes of the revised project end dates are interesting; however, they are not part of
the scope of this thesis. This analysis is concerned with the occurrence of revised project
end dates to compare IT projects pre versus post the implementation of the CA-PMM.
Number of Revised End Dates
The number of revised project end dates is an indicator of the effect that the CA-
PMM has on IT projects. These end dates are important because they provide a
comparison of IT projects pre versus post CA-PMM implementation.
Original Project Budget (One-time & Ongoing)
I retrieved the original project budget from the Feasibility Study Report (FSR)
and Special Project Report (SPR) (if applicable). The original project budget is a critical
element for the IT project. The project manager calculates the amount during the concept
phase of the IT project. The CA-PMM provides guidelines to project managers for size
estimating and scope definition that determines the project budget. The original project
budget may offer the public the most useful information to determine the effectiveness of
the CA-PMM. This forecasted budget figure may also provide insight into the project
manager’s ability to manage and the spending on IT projects.
Difference of Revised Budget
The difference of revised budget for IT projects is the dollar amount that the CA-
PMM was unable to estimate. Similar to the estimated project start and end dates; the
difference in budget amount may be due to a multitude of factors: procurement problems,

34
scope expansion and contraction, and funding and resource issues that increase costs.
Despite this intriguing topic, the scope of this thesis is merely to document the
occurrence of such figures—not to analyze the root causes.
Projects with Revised Budget Amounts
I retrieved the revised project budget amounts from the Special Project Report
(SPR) and Project Status Report (PSR). The revised project budget is another key
indicator in evaluating the effectiveness of the CA-PMM standard introduced by the
California Technology Agency. A revised budget figure can indicate that the CA-PMM
standard may need some modification or that it is ineffective altogether. There is real
public value in terms of estimating costs because of the state of California’s current
budget conditions. It would help Californians know what to expect in terms of IT
investment.
Cumulative Total Amount Spent on Project to Date
The cumulative total amount spent on project to date is a figure available on the
Project Status Report (PSR). This amount total helps the California Technology Agency
and the project manager track project spending.
Reported Project Completion Percentage
The project completion percentage is a figure reported in the Project Status Report
(PSR). This number serves as a quick reference for the California Technology Agency
and the project manager to keep apprised of the progress of the project.

35
Number of Completed Milestones Reported
I retrieved the number of completed milestones from the Project Status Report
(PSR). The California Technology Agency wanted to provide IT project managers with a
standardized method of reporting milestone deliverables. The milestones are initially set
up in the Feasibility Study Report (FSR) or Special Project Report (SPR) and then
reported in the PSR. These completed milestones are the primary indicators that an IT
project is healthy and on track to be completed on time.
Number of Days Past Due for Completed Milestones
The number of days past due for completed milestones is a number derived from
the Project Status Report (PSR). I calculated the amount of days between the original
project milestone target date and the project milestone completed date. This calculation
provides the variance between estimated and actual days needed to complete milestones.
Average Delay of Milestone Completion (Days)
The average length of altered milestone dates from the original is a key indicator
of the progress of the IT project. The average length of altered milestone dates will be a
key indicator used to determine the effectiveness of the CA-PMM standard to forecast
successful IT project delivery.
Number of Delayed Milestones Reported
The number of delayed milestones reported is a number derived from the Project
Status Report (PSR). The number of delayed milestones provides an indication of the
health of a project, providing meaningful information about the effectiveness of the CA-
PMM standard.

36
Data Analysis
I answered the questions regarding cost and time using a project-reporting table
that I created to record the information available in the Feasibility Study Report (FSR),
Special Project Report (SPR), and Project Status Report (PSR). I grouped the
information from the reports into three categories: 1) project timeline dates, 2) project
costs, and 3) project milestones dates.
Table 3.2: Project-Reporting Table – Project Timeline Dates
Estimate
d Project
Start
Date
Revised
Project
Start
Date
Number
of
Revised
Start
Dates
Estimate
d Project
End Date
Revised
Project
End Date
Number
of
Revised
End
Dates
Project
FSR
Project
SPR
Project
PSR
Table 3.3: Project-Reporting Table – Project Costs
Original Project
Budget (One-time &
Ongoing)
Projects with Revised Budget Amount
Original & Revised Project
Budget Total Amount
Difference of Revised Project Budget
Cumulative Total of Amount Spent on
Projects To Date
Project FSR
Project SPR
Project PSR

37
Table 3.4: Project-Reporting Table – Project Milestone Dates
Reported Project
Completion Percentage
Number of Completed Milestones Reported
Number of Days Past Due for
Completed Milestone
Average Delay of
Milestone Completion
(Days)
Number of Delayed
Milestones Reported
Project FSR
Project SPR
Project PSR
I divided the projects into two groups: 1) projects started prior to implementation
of the CA-PMM, and 2) projects started after the implementation of the CA-PMM in
order to compare and analyze the effectiveness of the CA-PMM standard. All of the data
gathered was available in quantitative format. I entered all of the information onto the
separate data sheets to keep the data organized. I used basic formulas in Microsoft Excel
to calculate the total date revisions, dollar amounts, and milestone dates. I entered
formulas on summary sheets that drew information from the raw data sheets to maintain
data integrity.
Comparison of Pre vs. Post CA-PMM
The primary focus of this study is to evaluate the utility of the CA-PMM by
analyzing its impact on success of statewide IT projects. I used the information recorded
in the raw data sheets and the project summary sheet to analyze the CA-PMM standard.
Table 3.5 lists the variables used to evaluate the benefit of the CA-PMM standard.
I used a t-test analysis to determine whether there is a statistical significance
between the pre versus post CA-PMM data. The t-test determines whether the difference
between two sets of information is due to chance. This t-test produces a numerical p-

38
value that measures the statistical significance. A calculated p-value threshold of less
than 0.05 indicates that there is a statistical significance between two sets of information.
In other words, if a t-test produces a p-value of less than 0.05, then there is a 95% chance
that the differences between the pre and post CA-PMM data are accurate and not due to
coincidence.
Table 3.5: Pre vs. Post CA-PMM
Projects Started Pre CA-PMM
Projects Started Post CA-PMM
Number of Projects
Number of Revised Project Start Dates
Number of Revised Project End Dates
Original Project Budget (One-time & Ongoing)
Original & Revised Project Budget Total Amount
Difference of Original & Revised Project Budget Amount
Number of Projects that Revised Budget Amount
Number of Projects that Increased Scope
Number of Projects that Decreased Scope
Cumulative Total of Amount Spent on Projects To Date
Average Reported Project Completion Percentage To Date
Number of Reported Completed Milestones
Number of Days Past Due for Completed Milestone
Average Delay of Milestone Completion (Days)

39
Projects Started Pre CA-PMM
Projects Started Post CA-PMM
Number of Delayed Milestones Reported
Limitations
A constraint on this analysis is that the adoption of the CA-PMM standard is very
recent. Even the lowest complexity level IT project can have an estimated project life
cycle of two years. Furthermore, it is very common for IT related projects to experience
delays or changes during the execution phase.
Another limitation of this study is that it relies on a subset of project status
information. The Project Status Report (PSR) information is only available post
December 2011 on the California Technology Agency (CaTA) website. It is currently
unknown whether other reporting periods exist for the IT projects overseen by the CaTA,
especially for projects pre CA-PMM.
Information Technology projects are unique and often difficult to compare. First,
it is very difficult to compare the difficulty levels between all of the projects. A complex
IT project may be more difficult for a particular agency to implement because of the lack
of resources and funding. In other instances, the complexity of the IT project may be the
cause of the implementation problems rather than resource or funding issues. Second,
state agencies have different resources working for them. For instance, it may be difficult
for the Attorney General’s Office to find adequately qualified IT professionals to lead a
project, presumably because a large percentage of the staff is comprised of attorneys and
other legal professionals.

40
Summary
I provided an overview of the research methodology used for my analysis of the
California Project Management Methodology (CA-PMM). I described the data used for
analysis, definition of terms, and the data analysis. In the following chapter, I discuss the
findings from my research. In the final chapter, I consider the implications of my
findings for the future of IT project management in California.

41
Chapter 4
RESULTS
In this chapter, I present the results of the IT project report chart. I examine the
effectiveness of the CA-PMM in estimating IT project costs, the standards’ ability to help
IT project managers deliver on estimated milestone completion dates, and the standards’
ability to help IT project managers deliver projects within the estimated timelines.
All three questions provide insight into my inquiry about the effectiveness of the
CA-PMM toolkit. Is the CA-PMM standard helping project managers deliver IT project
success by examining the ability to accurately estimate project cost, deliver on key
milestones, and successfully complete projects within estimated timeframes?
Table 4.1: Summary of Pre vs. Post CA-PMM IT Projects
Projects Started Pre CA-PMM
Projects Started Post CA-PMM
Total
Number of Projects 23 30 53
Number of Projects with Revised Start Dates
11 3 14
Number of Projects with Revised End Dates
17 5 22
Original Estimated Project Budget Totals
$ 1,690,982,262 $ 1,448,325,282 $ 3,139,307,544
Average of Original Estimated Project Budget
$ 73,520,968 $ 48,277,509 $ 59,232,218
Revised Estimated Project Budget Totals
$ 3,540,934,281 $ 1,856,940,218 $ 5,397,874,499
Average of Revised Estimated Project Budget
$ 153,953,664 $ 61,898,007 $ 101,846,689
Additional Estimated Project Costs Totals
$ 1,849,952,019 $ 408,614,936 $ 2,258,566,955

42
Projects Started Pre CA-PMM
Projects Started Post CA-PMM
Total
Average of Additional Estimated Project Costs
$ 88,097,763 $ 34,051,245 $ 68,444,483
Number of Projects that Revised Budget Amount
21 12 33
Percentage of Projects that Revised Budget Amount
91% 40% 62%
Number of Projects that Increased Budget Amount
16 4 20
Percent of Projects that Increased Budget Amount
70% 13% 38%
Number of Projects that Decreased Budget Amount
5 8 13
Percent of Projects that Decreased Budget Amount
22% 27% 25%
Cumulative Total of Amount Spent on Projects To Date
$ 1,288,749,562 $ 156,826,346 $ 1,445,575,907
Average Reported Project Completion Percentage To Date
60% 53% 57%
Number of Reported Completed Milestones
119 99 218
Number of Days Past Due for Completed Milestone
12,886 2,409 15,295
Average Delay of Milestone Completion (Days)
108.29 24.33 59.17
Range for Average Delay of Milestone Completion (Days)
746 – -31 166 – -88
Number of Delayed Milestones Reported
120 51 171

43
Question A: How effective is the CA-PMM in helping IT project managers estimate IT
project costs?
The results show a marked difference in the budgets of IT projects before and
after the implementation of the CA-PMM standard. Figure 4.1 illustrates the differences
in original and revised budget amounts for the IT projects started before and after CA-
PMM.
Figure 4.1: Pre vs. Post CA-PMM IT Project Costs
The average original budget of pre CA-PMM IT projects was $73,520,968 and the
average revised budget amount was $153,953,664. This equals a 109% increase in the
average budget costs for IT projects that began before the implementation of CA-PMM.
$73,520,968
$48,277,509
$153,953,664
$61,898,007
Projects Started Pre CA-PMM Projects Started Post CA-PMM
Pre vs. Post CA-PMM IT Project Costs
Average Original Budget Amount Average Revised Budget Amount
109%
28%

44
The average original budget of post CA-PMM projects was $48,277,509 and an
average revised budget amount was $61,898,007. This equals a 28% increase in the
average budget costs for IT projects that began after the implementation of CA-PMM.
Table 4.2: t-test Results for Pre vs. Post CA-PMM IT Project Costs
Projects Started Pre CA-PMM
Projects Started Post CA-PMM
p-value
Percentage Change in Budget
109% 28% 0.20
Percentage of Projects that Revised Budget Amount
91% 40% <0.01
I performed a t-test to determine whether the difference in project budgets
between pre and post CA-PMM IT projects was statistically significant. The p-value of
0.20 indicates that the percentage change in budget is not statistically significant,
meaning that the dollar difference between pre versus post CA-PMM projects are likely
due to chance. This result suggests that the CA-PMM did not have a direct impact on the
amount of the budget change between projects that started before its implementation
versus the projects that started post implementation.
I also performed a t-test to determine whether the CA-PMM had any effect on
budget changes for IT projects. Ninety-one percent of projects that started before CA-
PMM needed to revise its budget. Meanwhile, 40% of projects that began after CA-
PMM revised their project budgets. The p-value of <0.01 indicates that the percentage of
projects that revised budget amounts are statistically significant. In other words, the
results suggest that the CA-PMM is having an impact on the number of projects that need
to revise the estimated project budget amounts.

45
Question B: How effective is the CA-PMM in helping IT project managers deliver on
estimated milestone completion dates?
The results show a change in the reported project milestone completion dates
since the implementation of the CA-PMM standard. Table 4.3 summarizes the number of
completed milestones and the number of days these milestones were past due for IT
projects started before and after CA-PMM.
Table 4.3: t-test Results for Pre vs. Post CA-PMM IT Project Milestones
Projects Started Pre
CA-PMM
Projects Started Post
CA-PMM Total p-value
Number of Reported Completed Milestones
119 99 218
Number of Days Past Due for Completed Milestone
12,886 2,409 15,295
Average Delay of Milestone Completion (Days)
108 24 59 0.02
Range for Average Delay of Milestone Completion (Days)
746 – -31 166 – -88
I performed the t-test to determine whether there was a significant difference in
milestone completion before and after CA-PMM. The average delay of completed
milestones for the pre CA-PMM IT projects was 108.29 days, with a range of 31 days
early to 746 days late. Meanwhile, the average delay of completed milestones for the
post CA-PMM IT projects was 24.33 days, with a range of 88 days early to 166 days late.
The p-value of 0.02 indicates that the average delay of milestone completion is
statistically significant, meaning that the variances between the pre and post CA-PMM

46
project milestone completion delays are likely not due to chance. This result suggests
that the CA-PMM is having a positive impact on the timely completion of milestones.
Question C: How effective is the CA-PMM in helping IT project managers deliver IT
projects within the original estimated project timeline?
The previous question focused on the completion of intermediary milestones.
However, it is essential to understand the impact of CA-PMM on the ultimate completion
of projects. The results of this last question are less conclusive than the previous two. In
order to answer whether the CA-PMM is helping IT project managers deliver completed
projects within the estimated timeframe, a dataset of completed IT projects would be
required. The California Technology Agency website does not publish information on
completed projects—only information on current IT projects overseen by the agency.
Nonetheless, I am able to create a proxy for completion by performing an analysis
on the projects with revised start dates. A revised start date can delay the estimated
project timeline, thus affecting the ability to complete an IT project within the original
estimated timelines.
Table 4.4: t-test for Pre vs. Post CA-PMM IT Project Completion
Projects Started Pre CA-PMM
Projects Started Post CA-PMM
p-value
Number of Projects 23 30
Projects with Revised Start Dates
11 3 0.01
Percent of Projects with Revised Start Dates
48% 10%
I performed a t-test to determine whether there were significant differences in the
start date revisions for projects before and after CA-PMM implementation. Forty-eight

47
percent of projects that began prior to the implementation of CA-PMM revised the
project start dates. Of the post CA-PMM projects, 10% revised the project start dates.
The p-value of 0.01 indicates that the number of projects with revised start dates are
statistically significant, meaning that the differences in delayed start dates between the
pre and post CA-PMM projects are likely not due to chance.
Summary
Difference of Estimated and Revised Project Costs
The results from the pre versus post CA-PMM comparison show a large amount
of divergence in the estimated original and revised project costs. On average, the pre
CA-PMM IT projects are more expensive to start. Furthermore, pre CA-PMM IT
projects will have higher additional costs that were not included in the original budget.
Conversely, the post CA-PMM IT projects have a lower average estimated original and
revised budget cost. I find that while the increase in budgets are not statistically
significantly different before and after CA-PMM (p-value 0.20), the likelihood of a
budget revision is statistically significantly less after the implementation of CA-PMM (p-
value <0.01). These results suggest that the CA-PMM is having an impact on estimated
IT projects costs and unexpected additional project costs.
Of course, there may be other explanations for this result in addition to the
implementation of CA-PMM. One possible explanation is that CaTA reorganized and
received the resources to manage this regulatory program. Another could be that
equipment has become cheaper as the industry develops newer and improved
technologies. Optimistically, it could also be that the state and IT project managers have

48
simply gotten better at this. It is difficult to prove that the state has collectively improved
implementing IT projects, but the theory does have merit. We have seen the initial
estimated costs decline as well as the unexpected costs. In the end, the CA-PMM is
requiring IT project managers to develop estimated project costs that are having a
positive outcome on the final costs of IT projects.
Overall Milestone Completion
The results from the pre versus post CA-PMM comparison show a statistically
significant difference (p-value 0.02) in the average delay of milestone completion. The
pre CA-PMM IT projects were more likely to have longer delays to complete project
milestones, averaging delays of over three months. Meanwhile, post CA-PMM IT
projects are averaging delays of less than one month to complete milestones. The results
suggest that the CA-PMM is helping IT project managers meet project milestone dates.
This is important because the completion of estimated project milestones will move the
project forward to meet estimated project completion targets.
Table 4.5: Summary of Pre vs. Post CA-PMM IT Project Milestones
Projects Started Pre CA-PMM
Projects Started Post CA-PMM
Average Total
Average Delay of Milestone Completion (Days)
108.29 24.33 59.17
Overall Project Completion
Table 4.7 provides a summary of the pre and post CA-PMM IT project
completion results. Nearly half of all pre CA-PMM IT projects experienced delays
before the project began. Meanwhile, 10% of all post CA-PMM IT projects have

49
experienced start delays that can have impacts on the completion of the projects. I find
this difference to be statistically significant (p-value 0.01). The results suggest that the
CA-PMM is helping IT project managers start projects on time. This is important
because a delayed start of an IT project will delay its completion date; thus, projects will
unsuccessfully meet the estimated completion dates.
Table 4.6: Summary of Pre vs. Post CA-PMM IT Project Completion
Projects Started Pre CA-PMM
Projects Started Post CA-PMM
Percent of Projects with Revised Start Dates
48% 10%
The evidence from my analysis suggests that the implementation of CA-PMM is
having a positive impact on IT projects throughout the state. The average initial
estimated project costs are lower than before. Even the additional costs for unavoidable
events or project delays are lower than they were prior to CA-PMM implementation. The
average delay of IT project milestones has improved at a dramatic rate since CA-PMM.
Finally, IT projects have suffered from fewer kick-off delays, which will help the project
remain on schedule.

50
Chapter 5
CONCLUSION
In this final chapter, I revisit the purpose of my thesis, analyze and draw
conclusions about the effectiveness of the CA-PMM, discuss policy and political
implications, and make recommendations. Lastly, I examine the limitations of my study
and provide suggestions for future research.
Purpose of this Study – Revisited
California is home to many of the world’s leading technology companies that
have shaped the way global businesses operate. However, California’s state agencies
have been slow to utilize improved IT infrastructure to enhance the delivery of services to
Californians. Some critics suggest that California’s governance system is incapable of
adopting new technologies because it is outdated (Gunnison, 1997). Others suggest that
the way California adopts new technologies prevents unfettered and wasteful spending,
especially on incredibly expensive technology endeavors (McCormick, 1997).
Regardless of the rhetoric, more California state agencies are adopting improved IT
infrastructure to deliver services to Californians (Ortiz, 2013), thus driving the need for a
reliable IT project management standard.
The Program Management Office (PMO) of the California Technology Agency
(CaTA) has the difficult task of ensuring the successful completion of large IT
infrastructure projects undertaken by state agencies. California state agencies are
historically paper intensive institutions that have been slow to adopt improved IT
infrastructure that can bring more effective and efficient services to Californians. The

51
trend toward investment in IT infrastructure to improve business practices will continue
to grow for all state agencies. However, it is imperative that the CA-PMM policy
provide project managers with a useful tool to ensure the successful completion of these
IT projects.
The PMO of the CaTA has adopted the California Project Management
Methodology (CA-PMM) to help carry out its mission to provide primary support for
program and project planning, investment analysis, and project management (California
Technology Agency, 2011). Although the CA-PMM is the “tool of the trade” for project
managers at California state agencies, it was unclear whether the CA-PMM is an
effective standard. My thesis set out to evaluate whether the CA-PMM standard is an
effective tool to help project managers deliver successful IT projects.
Analysis of CA-PMM
Is the CA-PMM an effective tool that can help project managers deliver
successful IT projects? There has been minimal research conducted to evaluate the CA-
PMM standard until now. As the research literature suggests, project management is not
a perfect science that follows a rigid formula that will ensure the delivery of an IT project
within the estimated cost and timeframe. Factors that the project manager has little
control over may cause delays on perfectly managed and simple IT projects. However,
an assessment of the CA-PMM as a statewide policy is valid to determine its
effectiveness and usefulness.
This analysis is assessing the CA-PMM standard as a whole. Based on this
methodology, a high-level assessment of the CA-PMM is valid and can provide better

52
information to state leaders and decision-makers about IT project costs and timeframes.
If the goal is to bring California’s governance infrastructure into the 21st Century, then
this assessment of the CA-PMM can provide valuable information to state leaders and
decision makers.
Difference of Estimated and Revised Project Costs
The cost difference between the pre and post CA-PMM IT projects is one of many
ways to measure the effectiveness of the CA-PMM. The results indicate that the CA-
PMM is having a positive impact on estimating project costs. Forty percent of the
projects post CA-PMM had to increase estimated costs to complete the project, as
compared to 91% of projects started before CA-PMM.
Table 5.1: Pre vs. Post CA-PMM IT Project Budget Changes
Projects Started Pre CA-PMM
Projects Started Post CA-PMM
Percent of Projects that Revised Budget Amount
91% 40%
The impact translates into less unexpected costs for agency leaders and project
managers, and allows project managers to provide agency leaders with better cost
estimates for budgeting purposes. As a result, there will be more predictability in budget
forecasting to incorporate these IT projects into the overall agency strategic plans.
Furthermore, the impact of less unforeseen costs may reduce the public’s frustrations and
accusations of wasteful spending over multi-million dollar IT investments (The
Sacramento Bee, 2013).

53
We have learned from the literature that any IT project can experience problems
and delays. However, if the CA-PMM can lessen the occurrences of large unexpected
costs, it can provide political capital for agency and state leaders to transition California’s
old governance infrastructure into a modern one.
On-time Milestone Completion Rate
The pre versus post CA-PMM IT projects show a stark contrast in the average
delay of milestone completion. Based on the results, it appears that the CA-PMM is
having a positive impact on milestone completion rates. The post CA-PMM IT projects
showed a lower average delay for milestone completion at 24 days compared to 108 days
for pre CA-PMM projects. This result implies that IT project managers will be more
successful at meeting project milestones if they follow the CA-PMM standard.
Table 5.2: Pre vs. Post CA-PMM IT Project Milestones
Projects Started Pre CA-PMM
Projects Started Post CA-PMM
Average Delay of Milestone Completion (Days)
108 24
The larger significance of this outcome is that state department leaders are better
able to rely on the estimates provided by IT project managers. The existence of more
accurate project milestones will improve oversight accountability and allow department
leaders to assign resources appropriately. The best-case scenario is that IT project
managers are better able to estimate milestone completion dates so that the delays in task
completion do not cause severe delays in the project.

54
Project Completion Projections
Table 5.3 provides further input into this analysis. Projects must start and finish
on time in order for the completion of projects to meet the estimated completion
schedules. Since I only have access to information on IT projects that are ongoing, I am
only able to analyze start date revisions. The results of this analysis show that the CA-
PMM is having a positive impact on reducing start date revisions. Since the
implementation of the CA-PMM, 10% of IT projects have experienced delayed start
dates. In contrast, 48% of pre CA-PMM IT projects have experienced delayed start
dates.
Table 5.3: Pre vs. Post CA-PMM IT Project Completion
Projects Started Pre CA-PMM
Projects Started Post CA-PMM
Grand Total
Number of Projects 23 30 53
Number of Revised Project Start Dates
11 3 14
Percent of Projects with Revised Start Dates
48% 10% 26%
Number of Revised Project End Dates
47 5 52
Percent of Projects with Revised End Dates
74% 17% 42%
Implications for the California Technology Agency
My thesis analyzed the impact that the CA-PMM is having on IT projects
throughout the state. The ultimate goal of the project management standard is to provide
project managers with a toolset to deliver successful IT projects. As a result, California

55
taxpayers will benefit from an improved government infrastructure and wisely invested
tax dollars.
This thesis provides a “progress report” of sorts for the overall effectiveness of
the CA-PMM standard. The available information on the California Technology Agency
website does not present individual project data in a manner that can provide project-
level analysis of its impact, but the aggregate statistics published do allow researchers to
compare outcomes and milestones for projects before and after the implementation of
CA-PMM.
The results from this study support the conclusion that the CA-PMM standard is
having a positive effect on IT project cost and completion. There have been recent high
profile IT project failures that have raised the ire of state legislators and the public (The
Sacramento Bee, 2013, Senate Committee on Governmental Organization, 2010).
However, my results suggest that legislators and the public do not have enough accurate
information to base their assessments of IT projects overseen by the California
Technology Agency.
Policy Recommendations
This study on the California Project Management Methodology (CA-PMM) found
evidence that suggests the new standard is helping to improve outcomes of IT projects
throughout California. The results showed notable improvements after the
implementation of the CA-PMM. While the results are positive, they must be considered
with caution because they are not causal.

56
The results from this study support the continued use of CA-PMM and should be
the impetus for future research on the impact that the CA-PMM is having on IT project
outcomes throughout the state. The CA-PMM may in fact be the primary reason that
such a vast difference occurred between the pre and post CA-PMM, resulting in millions
of dollars and hours of time saved for California taxpayers. Nevertheless, given the
preliminary nature of this thesis, further research on CA-PMM is necessary before a
definitive conclusion is reached on its causal effect on IT projects throughout the state
and its continued use and possible expansion.
Limitations
The biggest limitation of this research is that it is not causal. In other words,
though I compare projects before and after the implementation of CA-PMM, differences
in the project outcomes may not necessarily be due to CA-PMM. Other changes may
have caused the differences in project outcomes, or the differences may be due to random
variation. By using t-tests to analyze changes from before and after CA-PMM
implementation, I am able to estimate how likely the two sets of data are due to chance.
However, this analysis does not aim to isolate a causal factor that has caused the
improvement in IT project management outcomes after the implementation of CA-PMM.
This thesis looks at the CA-PMM from a program effectiveness standpoint. It
does not examine the specific nuances or the project tasks that are in the CA-PMM. For
instance, I was not able to gain a deeper understanding of how project managers utilize
the Work Breakdown Structure (WBS) or the effectiveness of the cost-estimating tool
that are part of the CA-PMM toolkit.

57
In addition, project manager skill-sets and capabilities are not universal traits.
This is perhaps the most difficult variable to measure based on the data available.
Although the California Technology Agency requires project managers to have a certain
level of project manager qualifications, it does not regulate the quality of their
qualifications. Technical knowledge and acumen are not equal and thus, some projects
may benefit from better project managers or team members. Nonetheless, this variable is
difficult to measure and may be a separate study that focuses on failed projects on an
individual basis.
Future Research
My study has started the conversation about the value of the CA-PMM.
However, this thesis is limited to an overall analysis of the standard. Future research may
provide more insight on the effectiveness of the curriculum within the CA-PMM
standard, i.e. the effectiveness of the Work Breakdown Structure, the Complexity
Analysis rating, etc. by surveying project managers regarding its usefulness.
A case study may provide insight on how best to implement complicated, multi-
departmental IT project implementations. This study would be a case-by-case
comparison of two or three highly complex and difficult IT projects that can provide
valuable insight for future endeavors.
There are other avenues of research to explore. One possible topic of research
would see if the CA-PMM needed to include other types of skills that IT project
managers should know, such as the “soft skills” as referenced by Sukhoo that can
improve the outcomes of IT projects (Sukhoo, 2005). The over-arching theme is to

58
improve the CA-PMM standard so that IT project managers can continue to deliver
successful IT projects, perhaps improving the overall success rate of project milestones
and completion times.

59
Appendix A: Detailed Project Information – Timelines
Project No.
Department Name
Name of Project Project Started Pre or
Post CA-PMM
Estimated Project
Start Date
Revised Project
Start Date
Number of
Revised Start Dates
Estimated Project
End Date
Revised Project End
Date
Number of
Revised End
Dates
01 California Highway
Patrol
Computer Aided Dispatch (CAD) Replacement Installation
Pre 7/22/2005 5/11/2006 1 8/29/2008 Apr. 2013 8
02 California Highway
Patrol
Automated License Plate Recognition
(ALPR)
Post 7/1/2010 6/30/2012
03 CA Costal Commission
Coastal Data Management
System (CDMS)
Post 10/1/2011 2/1/2013
04 California Department
of Corrections
& Rehabilitatio
n
Strategic Offender
Management System (SOMS)
Pre Jul. 2007 Mar. 2013

60
Project No.
Department Name
Name of Project Project Started Pre or
Post CA-PMM
Estimated Project
Start Date
Revised Project
Start Date
Number of
Revised Start Dates
Estimated Project
End Date
Revised Project End
Date
Number of
Revised End
Dates
05 Department of Consumer
Affairs, Boards and
Bureaus
California Vehicle Inspection
System (Cal-VIS)
Post 11/2/2009 11/24/2009 1 9/25/2013 3/3/2014 1
06 Department of Consumer
Affairs, Boards and
Bureaus
BreEZe Post Dec. 2009 Jun. 2014
07 Department of Consumer
Affairs, Boards and
Bureaus
Computer Based Testing (CBT)
Post n/a n/a
08 Department of
Corporations
Department of Corporations
Quality Network (DOCQNET)
Pre Jan. 2010 Sep. 2009 1 Jun. 2012 Jul. 2014 1

61
Project No.
Department Name
Name of Project Project Started Pre or
Post CA-PMM
Estimated Project
Start Date
Revised Project
Start Date
Number of
Revised Start Dates
Estimated Project
End Date
Revised Project End
Date
Number of
Revised End
Dates
09 Department of Education
California Longitudinal
Pupil Achievement Data System (CALPADS)
Pre 7/1/2005 7/1/2005 1 8/8/2008 12/21/2012 2
10 Department of Education
Standardized Account Code
Structure (SACS) System
Replacement
Post 3/18/2011 3/31/2015
11 Department of Finance
Financial Information System for
California (FI$Cal)
Pre Jul. 2005 Aug. 2005 1 Aug. 2012 TBD 3
12 Department of Fish & Wildlife
Automated License Data
System (ALDS)
Pre Aug. 2000 Nov. 2002 8/20/2012 3

62
Project No.
Department Name
Name of Project Project Started Pre or
Post CA-PMM
Estimated Project
Start Date
Revised Project
Start Date
Number of
Revised Start Dates
Estimated Project
End Date
Revised Project End
Date
Number of
Revised End
Dates
13 Department of Health
Care Services
California Medicaid
Management Information System (CA-
MMIS)
Post n/a n/a
14 Department of Health
Care Services
Health Insurance Portability and Accountability Act (HIPPA) II
Post 6/15/2001 6/30/2014
15 Department of Health
Care Services
Codes and Standards
Automated System (CASAS) Re-Engineering
Post 7/1/2012 2/26/2015
16 Department of Industrial
Relations
Senate Bill 863 Implementation
Project (SBIP)
Post 11/5/2012 1/14/2014
17 Department of Insurance
Paperless Workflow
Pre 7/1/2008 9/28/2009 1 6/30/2011 6/30/2013 1

63
Project No.
Department Name
Name of Project Project Started Pre or
Post CA-PMM
Estimated Project
Start Date
Revised Project
Start Date
Number of
Revised Start Dates
Estimated Project
End Date
Revised Project End
Date
Number of
Revised End
Dates
18 Department of Motor Vehicles
Information Technology
Modernization (ITM)
Pre 7/3/2006 5/24/2013
19 Department of Motor Vehicles
Integrated Automated Knowledge
Testing Expansion
(IAKTE)
Post 7/2/2012 3/11/2015
20 Department of Motor Vehicles
Web-Enabled Customer Flow Management &
Appointment Systems
(WCFMAS)
Post 7/2/2012 3/24/2016
21 Department of Parks & Recreation
Public Safety Technology
Modernization (PSTM)
Pre Jul. 2007 Mar. 2007 1 Jun. 2010 Sep. 2013 1

64
Project No.
Department Name
Name of Project Project Started Pre or
Post CA-PMM
Estimated Project
Start Date
Revised Project
Start Date
Number of
Revised Start Dates
Estimated Project
End Date
Revised Project End
Date
Number of
Revised End
Dates
22 Department of Public Health
California Healthcare Event & Reporting Tool
(CalHEART)
Post 7/1/2010 9/30/2011 3/7/2013 1
23 Department of Public Health
Business System Upgrade Project
(BSUP)
Pre Jul. 2010 Dec. 2011
24 Department of Public Health
California Immunization Registry (CAIR)
Post Dec. 2012 Nov. 2015
25 Department of Social Services
County Expense Claim Reporting
Information System (CECRIS)
Post 2/14/2012 5/12/2017
26 Department of State
Hospitals
Personal Duress Alarm System
(PDAS)
Post TBD 8/1/2011 1 6/30/2015 12/1/2012 1
27 Department of State
Hospitals
Active Directory Restructuring
(AD)
Post 9/4/2013 8/31/2014

65
Project No.
Department Name
Name of Project Project Started Pre or
Post CA-PMM
Estimated Project
Start Date
Revised Project
Start Date
Number of
Revised Start Dates
Estimated Project
End Date
Revised Project End
Date
Number of
Revised End
Dates
28 Department of State
Hospitals
Automated Staff Scheduling and
Information Support Tool
(ASSIST)
Post 9/2/2013 8/29/2014
29 Department of Toxic
Substances Control
Toxics Information
Clearinghouse
Post Jul. 2010 Aug. 2011
30 Department of
Transportation
Project Resourcing &
Schedule Management
(PRSM)
Pre 7/1/2000 12/27/2002
5/24/2013 4
31 Department of
Transportation
Construction Management
System
Pre 7/1/2006 3/1/2010 9/30/2013 3
32 Department of
Transportation
Roadway Design Software
Pre Jul. 2008 7/1/2008 1 Jun. 2014 Apr. 2016 1

66
Project No.
Department Name
Name of Project Project Started Pre or
Post CA-PMM
Estimated Project
Start Date
Revised Project
Start Date
Number of
Revised Start Dates
Estimated Project
End Date
Revised Project End
Date
Number of
Revised End
Dates
33 Department of
Transportation
Electronic Permitting
System (ePermits)
Post 5/1/2011 6/1/2013
34 Department of Veterans
Affairs
Enterprise Wide Veterans Home
Information System (EW-
VHIS)
Pre 12/11/2006
1/11/2007 1 12/31/2010
4/28/2014 3
35 Department of Veterans
Affairs
CalVet Connect Post 11/19/2012
6/30/2015
36 Employment Development Department
Unemployment Insurance
Modernization (UI-MOD)
Pre FY 2003/2004
Oct. 2003 1 FY 2008/200
9
Aug. 2013 3
37 Employment Development Department
Workforce System Network
(WSN)
Pre 3/2/2009 11/1/2010

67
Project No.
Department Name
Name of Project Project Started Pre or
Post CA-PMM
Estimated Project
Start Date
Revised Project
Start Date
Number of
Revised Start Dates
Estimated Project
End Date
Revised Project End
Date
Number of
Revised End
Dates
38 Employment Development Department
Alternate Base Period
Post Nov. 2009 May 2009 1 Jun. 2011 Jun. 2012 1
39 Environmental Protection
Agency
Unified Program Electronic Reporting
Post 7/1/2009 10/1/2012
40 Franchise Tax Board
Enterprise Data to Revenue (EDR)
Pre 1/12/2009 1/10/2009 1 1/12/2015 12/31/2016 1
41 Health & Human Services Agency
Case Management,
Information and Payrolling System
(CMIPS II)
Pre 4/1/1999 1/1/2016 7/1/2015 2
42 Health & Human Services Agency
Leader Replacement System (LRS)
Pre Jul. 2005 Jun. 2007 Jul. 2009 2
43 Health & Human Services Agency
Child Welfare Services New
System (CWS-NS)
Post Jul. 2013 Sep. 2017

68
Project No.
Department Name
Name of Project Project Started Pre or
Post CA-PMM
Estimated Project
Start Date
Revised Project
Start Date
Number of
Revised Start Dates
Estimated Project
End Date
Revised Project End
Date
Number of
Revised End
Dates
44 Office of Emergency
Services
Response Information
Management System (RIMS) Replacement
Pre Jun. 2010 May 2011
45 Peace Officer Standards &
Training Commission
Test System Replacement
Post 1/1/2012 7/31/2015
46 Public Utilities
Commission
Rail Safety and Security
Information Management
System
Pre 10/1/2008 3/31/2011
47 Secretary of State
VoteCal Statewide Voter
Registration System
Pre 8/3/2006 12/31/2009
6/30/2016 4
48 Secretary of State
California Business Connect
Post 7/1/2011 6/30/2017

69
Project No.
Department Name
Name of Project Project Started Pre or
Post CA-PMM
Estimated Project
Start Date
Revised Project
Start Date
Number of
Revised Start Dates
Estimated Project
End Date
Revised Project End
Date
Number of
Revised End
Dates
49 State Board of
Equalization
Centralized Revenue
Opportunity System (CROS)
Post 9/1/2010 7/30/2017 6/30/2017 1
50 State Controller's
Office
21st Century Project
Pre 7/1/2003 May 2004 1 6/30/2008 Dec. 2013 5
51 State Personnel
Board
Examination and Certification
Online System (ECOS)
Post Aug. 2011 Dec. 2014
52 Statewide Health
Planning & Development
Responsive Electronic
Application for California's Healthcare (CalREACH)
Post Sep. 2011 Aug. 2013
53 Student Aid Commission
Dream Act Post 11/1/2011 6/30/2013

70
Appendix B: Detailed Project Information – Costs
Project No.
Department Name
Name of Project
Project Started Pre or Post CA-
PMM
Original Project Budget
(One-time & Ongoing)
Projects with Revised Budget Amount
Original & Revised Project
Budget Total Amount
Difference of Revised Project Budget
Cumulative Total of
Amount Spent on Projects To
Date
01
California Highway
Patrol
Computer Aided
Dispatch (CAD)
Replacement Installation
Pre $ 25,887,025 $ 37,412,553 $ 37,412,553 $ 11,525,528 $ 27,707,861
02
California Highway
Patrol
Automated License Plate Recognition
(ALPR)
Post $ 3,053,360 $ 2,052,578 $ 2,052,578 $ (1,000,782) $ 2,052,578
03 CA Costal
Commission
Coastal Data Management
System (CDMS)
Post $ 1,844,566 $ 1,844,566 $ 556,305

71
Project No.
Department Name
Name of Project
Project Started Pre or Post CA-
PMM
Original Project Budget
(One-time & Ongoing)
Projects with Revised Budget Amount
Original & Revised Project
Budget Total Amount
Difference of Revised Project Budget
Cumulative Total of
Amount Spent on Projects To
Date
04
California Department
of Corrections
& Rehabilitati
on
Strategic Offender
Management System (SOMS)
Pre $ 416,278,518 $ 447,930,116 $ 447,930,116 $ 31,651,598 $ 220,174,685
05
Department of
Consumer Affairs,
Boards and Bureaus
California Vehicle
Inspection System (Cal-
VIS)
Post $ 17,715,366 $ 5,187,490 $ 5,187,490 $ (12,527,876) $ 1,668,711
06
Department of
Consumer Affairs,
Boards and Bureaus
BreEZe Post $ 27,540,364 $ 45,771,735 $ 45,771,735 $ 18,231,371 $ 10,735,742

72
Project No.
Department Name
Name of Project
Project Started Pre or Post CA-
PMM
Original Project Budget
(One-time & Ongoing)
Projects with Revised Budget Amount
Original & Revised Project
Budget Total Amount
Difference of Revised Project Budget
Cumulative Total of
Amount Spent on Projects To
Date
07
Department of
Consumer Affairs,
Boards and Bureaus
Computer Based
Testing (CBT) Post $ 3,720,132 $ 3,720,132 $ 348,534
08
Department of
Corporations
Department of
Corporations Quality
Network (DOCQNET)
Pre $ 9,554,718 $ 10,287,945 $ 10,287,945 $ 733,227 $ 423,204
09 Department of Education
California Longitudinal
Pupil Achievement Data System (CALPADS)
Pre $ 14,410,524 $ 30,103,669 $ 30,103,669 $ 15,693,145

73
Project No.
Department Name
Name of Project
Project Started Pre or Post CA-
PMM
Original Project Budget
(One-time & Ongoing)
Projects with Revised Budget Amount
Original & Revised Project
Budget Total Amount
Difference of Revised Project Budget
Cumulative Total of
Amount Spent on Projects To
Date
10 Department of Education
Standardized Account
Code Structure
(SACS) System
Replacement
Post $ 5,943,205 $ 1,612,320 $ 1,612,320 $ (4,330,885) $ 819,517
11 Department of Finance
Financial Information System for California (FI$Cal)
Pre $ 137,917,331 $ 616,805,643 $ 616,805,643 $ 478,888,312 $ 95,369,923
12
Department of Fish & Wildlife
Automated License Data
System (ALDS)
Pre $ 25,834,603 $ 25,834,603 $ 25,834,603 $ 17,062,436
13
Department of Health
Care Services
California Medicaid
Management Information System (CA-
MMIS)
Post $ 458,591,055 $ 458,591,055 $ 98,137,544

74
Project No.
Department Name
Name of Project
Project Started Pre or Post CA-
PMM
Original Project Budget
(One-time & Ongoing)
Projects with Revised Budget Amount
Original & Revised Project
Budget Total Amount
Difference of Revised Project Budget
Cumulative Total of
Amount Spent on Projects To
Date
14
Department of Health
Care Services
Health Insurance Portability
and Accountability Act (HIPPA)
II
Post $ 80,304,848 $ 30,777,467 $ 30,777,467 $ (49,527,381) $ 9,770,239
15
Department of Health
Care Services
Codes and Standards
Automated System
(CASAS) Re-Engineering
Post $ 5,979,875 $ 5,979,875
16
Department of Industrial
Relations
Senate Bill 863
Implementation Project
(SBIP)
Post $ 14,147,946 $ 14,147,946 $ 1,202,779
17 Department of Insurance
Paperless Workflow
Pre $ 10,785,565 $ 10,535,561 $ 10,535,561 $ (250,004) $ 10,653,099

75
Project No.
Department Name
Name of Project
Project Started Pre or Post CA-
PMM
Original Project Budget
(One-time & Ongoing)
Projects with Revised Budget Amount
Original & Revised Project
Budget Total Amount
Difference of Revised Project Budget
Cumulative Total of
Amount Spent on Projects To
Date
18
Department of Motor Vehicles
Information Technology
Modernization (ITM)
Pre $ 242,157,699 $ 208,103,286 $ 208,103,286 $ (34,054,413) $ 134,442,468
19
Department of Motor Vehicles
Integrated Automated Knowledge
Testing Expansion
(IAKTE)
Post $ 9,768,595 $ 9,768,595 $ 32,283
20
Department of Motor Vehicles
Web-Enabled Customer
Flow Management
& Appointment
Systems (WCFMAS)
Post $ 15,726,965 $ 15,726,965 $ 15,726,965 $ 80,388
21
Department of Parks & Recreation
Public Safety Technology
Modernization (PSTM)
Pre $ 10,942,885 $ 12,543,379 $ 12,543,379 $ 1,600,494 $ 4,293,918

76
Project No.
Department Name
Name of Project
Project Started Pre or Post CA-
PMM
Original Project Budget
(One-time & Ongoing)
Projects with Revised Budget Amount
Original & Revised Project
Budget Total Amount
Difference of Revised Project Budget
Cumulative Total of
Amount Spent on Projects To
Date
22
Department of Public Health
California Healthcare
Event & Reporting
Tool (CalHEART)
Post $ 1,545,075 $ 1,882,767 $ 1,882,767 $ 337,692 $ 967,954
23
Department of Public Health
Business System
Upgrade Project (BSUP)
Pre $ 2,814,193 $ 3,308,891 $ 3,308,891 $ 494,698 $ 36,000
24
Department of Public Health
California Immunizatio
n Registry (CAIR)
Post $ 6,996,699 $ 6,996,699
25
Department of Social Services
County Expense
Claim Reporting
Information System
(CECRIS)
Post $ 7,641,706 $ 3,955,368 $ 3,955,368 $ (3,686,338) $ 95,882

77
Project No.
Department Name
Name of Project
Project Started Pre or Post CA-
PMM
Original Project Budget
(One-time & Ongoing)
Projects with Revised Budget Amount
Original & Revised Project
Budget Total Amount
Difference of Revised Project Budget
Cumulative Total of
Amount Spent on Projects To
Date
26
Department of State
Hospitals
Personal Duress Alarm
System (PDAS)
Post $ 47,888,223 $ 4,668,976 $ 4,668,976 $ (43,219,247) $ 3,204,683
27
Department of State
Hospitals
Active Directory
Restructuring (AD)
Post $ 2,260,205 $ 2,260,205
28
Department of State
Hospitals
Automated Staff
Scheduling and
Information Support Tool
(ASSIST)
Post $ 8,903,016 $ 8,903,016
29
Department of Toxic
Substances Control
Toxics Information Clearinghous
e
Post $ 1,350,173 $ 1,837,240 $ 1,837,240 $ 487,067 $ 610,628

78
Project No.
Department Name
Name of Project
Project Started Pre or Post CA-
PMM
Original Project Budget
(One-time & Ongoing)
Projects with Revised Budget Amount
Original & Revised Project
Budget Total Amount
Difference of Revised Project Budget
Cumulative Total of
Amount Spent on Projects To
Date
30
Department of
Transportation
Project Resourcing &
Schedule Management
(PRSM)
Pre $ 11,572,294 $ 36,377,496 $ 36,377,496 $ 24,805,202 $ 24,913,045
31
Department of
Transportation
Construction Management
System Pre $ 23,611,843 $ 27,122,428 $ 27,111,428 $ 3,510,585 $ 14,681,180
32
Department of
Transportation
Roadway Design
Software Pre $ 22,914,170 $ 9,873,000 $ 9,783,000 $ (13,041,170) $ 2,685,511
33
Department of
Transportation
Electronic Permitting
System (ePermits)
Post $ 2,718,135 $ 2,718,135 $ 164,467

79
Project No.
Department Name
Name of Project
Project Started Pre or Post CA-
PMM
Original Project Budget
(One-time & Ongoing)
Projects with Revised Budget Amount
Original & Revised Project
Budget Total Amount
Difference of Revised Project Budget
Cumulative Total of
Amount Spent on Projects To
Date
34
Department of Veterans
Affairs
Enterprise Wide
Veterans Home
Information System (EW-
VHIS)
Pre $ 33,982,315 $ 36,744,638 $ 36,744,638 $ 2,762,323 $ 18,326,188
35
Department of Veterans
Affairs
CalVet Connect
Post $ 1,269,291 $ 1,269,291
36
Employment
Development
Department
Unemployment Insurance Modernization (UI-MOD)
Pre $ 57,788,131 $ 185,224,579 $ 185,224,579 $ 127,436,448 $ 127,700,937
37
Employment
Development
Department
Workforce System
Network (WSN)
Pre $ 13,153,063 $ 13,153,063 $ 5,230,950

80
Project No.
Department Name
Name of Project
Project Started Pre or Post CA-
PMM
Original Project Budget
(One-time & Ongoing)
Projects with Revised Budget Amount
Original & Revised Project
Budget Total Amount
Difference of Revised Project Budget
Cumulative Total of
Amount Spent on Projects To
Date
38
Employment
Development
Department
Alternate Base Period
Post $ 8,353,457 $ 522,000,000 $ 522,000,000 $ 513,646,543 $ 16,158,148
39
Environmental
Protection Agency
Unified Program
Electronic Reporting
Post $ 5,869,475 $ 5,869,475 $ 2,965,525
40 Franchise Tax Board
Enterprise Data to
Revenue (EDR)
Pre $ 317,058,810 $ 522,000,000 $ 522,000,000 $ 204,941,190 $ 101,752,994
41
Health & Human Services Agency
Case Management, Information
and Payrolling
System (CMIPS II)
Pre $ 126,550,997 $ 393,204,090 $ 393,204,090 $ 266,653,093 $ 200,613,481

81
Project No.
Department Name
Name of Project
Project Started Pre or Post CA-
PMM
Original Project Budget
(One-time & Ongoing)
Projects with Revised Budget Amount
Original & Revised Project
Budget Total Amount
Difference of Revised Project Budget
Cumulative Total of
Amount Spent on Projects To
Date
42
Health & Human Services Agency
Leader Replacement System (LRS)
Pre $ 5,855,040 $ 489,432,232 $ 489,432,232 $ 483,577,192 $ 6,697,902
43
Health & Human Services Agency
Child Welfare Services New
System (CWS-NS)
Post $ 392,740,024 $ 392,740,024
44
Office of Emergency
Services
Response Information
Management System (RIMS)
Replacement
Pre $ 2,234,355 $ 2,234,355 $ 1,894,639
45
Peace Officer
Standards & Training
Commission
Test System Replacement
Post $ 5,460,685 $ 5,460,685

82
Project No.
Department Name
Name of Project
Project Started Pre or Post CA-
PMM
Original Project Budget
(One-time & Ongoing)
Projects with Revised Budget Amount
Original & Revised Project
Budget Total Amount
Difference of Revised Project Budget
Cumulative Total of
Amount Spent on Projects To
Date
46
Public Utilities
Commission
Rail Safety and Security Information
Management System
Pre $ 4,274,733 $ 4,214,437 $ 4,214,437 $ (60,296) $ 2,384,610
47 Secretary of
State
VoteCal Statewide
Voter Registration
System
Pre $ 69,178,975 $ 45,188,638 $ 45,188,638 $ (23,990,337) $ 13,279,642
48 Secretary of
State
California Business Connect
Post $ 23,729,033 $ 23,729,033 $ 1,111,276
49
State Board of
Equalization
Centralized Revenue
Opportunity System (CROS)
Post $ 279,212,495 $ 269,417,267 $ 269,417,267 $ (9,795,228) $ 4,880,973
50
State Controller's
Office
21st Century Project
Pre $ 132,059,078 $ 373,400,679 $ 373,400,679 $ 241,341,601 $ 258,424,890

83
Project No.
Department Name
Name of Project
Project Started Pre or Post CA-
PMM
Original Project Budget
(One-time & Ongoing)
Projects with Revised Budget Amount
Original & Revised Project
Budget Total Amount
Difference of Revised Project Budget
Cumulative Total of
Amount Spent on Projects To
Date
51
State Personnel
Board
Examination and
Certification Online System (ECOS)
Post $ 4,705,157 $ 4,705,157 $ 961,304
52
Statewide Health
Planning & Developme
nt
Responsive Electronic
Application for
California's Healthcare (CalREACH)
Post $ 1,456,306 $ 1,456,306 $ 300,886
53 Student Aid Commission
Dream Act Post $ 1,889,850 $ 1,889,850

84
Appendix C: Detailed Project Information – Milestone Completion
Project No.
Department Name
Name of Project Project Started Pre or Post CA-
PMM
Reported Project
Completion Percentage
Number of Completed Milestones Reported
Number of Days Past Due for
Completed Milestone
Average Delay of
Milestone Completion
(Days)
Number of Delayed
Milestones Reported
01
California Highway
Patrol
Computer Aided Dispatch (CAD) Replacement Installation
Pre 87.00% 7 606 86.57 1
02
California Highway
Patrol
Automated License Plate Recognition
(ALPR)
Post 90.00% 5 200 40.00
03 CA Costal
Commission
Coastal Data Management
System (CDMS) Post 20.00% 2 29 14.50 1
04
California Department
of Corrections &
Rehabilitation
Strategic Offender
Management System (SOMS)
Pre 100.00% 6 649 108.17 2

85
Project No.
Department Name
Name of Project Project Started Pre or Post CA-
PMM
Reported Project
Completion Percentage
Number of Completed Milestones Reported
Number of Days Past Due for
Completed Milestone
Average Delay of
Milestone Completion
(Days)
Number of Delayed
Milestones Reported
05
Department of Consumer
Affairs, Boards and Bureaus
California Vehicle Inspection
System (Cal-VIS) Post 50.00% 8 -707 -88.38 6
06
Department of Consumer
Affairs, Boards and Bureaus
BreEZe Post 83.00% 12 693 57.75 9
07
Department of Consumer
Affairs, Boards and Bureaus
Computer Based Testing (CBT)
Post 92.00% 2 332 166.00 7
08
Department of
Corporations
Department of Corporations
Quality Network (DOCQNET)
Pre 46.00% 3 197 65.67
09 Department of Education
California Longitudinal Pupil
Achievement Data System (CALPADS)
Pre 95.00% 8 1181 147.63 3

86
Project No.
Department Name
Name of Project Project Started Pre or Post CA-
PMM
Reported Project
Completion Percentage
Number of Completed Milestones Reported
Number of Days Past Due for
Completed Milestone
Average Delay of
Milestone Completion
(Days)
Number of Delayed
Milestones Reported
10 Department of Education
Standardized Account Code
Structure (SACS) System
Replacement
Post 82.00% 2 -161 -80.50
11 Department of Finance
Financial Information System for
California (FI$Cal)
Pre 6.00% 2 84 42.00
12
Department of Fish & Wildlife
Automated License Data
System (ALDS) Pre 77.00% 21 1327 63.19
13
Department of Health Care
Services
California Medicaid
Management Information System (CA-
MMIS)
Post 6.00%
14
Department of Health Care
Services
Health Insurance Portability and
Accountability Act (HIPPA) II
Post 81.00% 1 8 8.00

87
Project No.
Department Name
Name of Project Project Started Pre or Post CA-
PMM
Reported Project
Completion Percentage
Number of Completed Milestones Reported
Number of Days Past Due for
Completed Milestone
Average Delay of
Milestone Completion
(Days)
Number of Delayed
Milestones Reported
15
Department of Health Care
Services
Codes and Standards
Automated System (CASAS) Re-Engineering
Post
16
Department of Industrial
Relations
Senate Bill 863 Implementation
Project (SBIP) Post 32.00% 2 3 1.50
17 Department of Insurance
Paperless Workflow
Pre 99.00% 7 552 78.86
18
Department of Motor Vehicles
Information Technology
Modernization (ITM)
Pre 73.00% 1 -31 -31.00 3
19
Department of Motor Vehicles
Integrated Automated Knowledge
Testing Expansion (IAKTE)
Post 18.00% 2
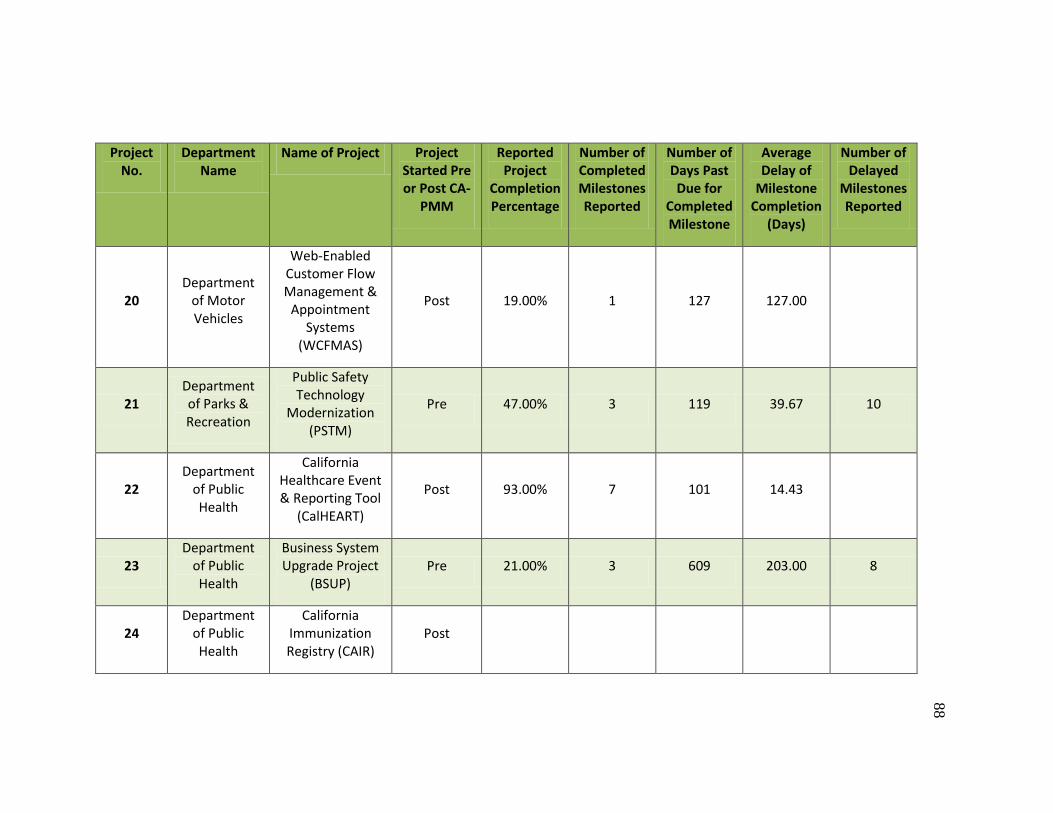
88
Project No.
Department Name
Name of Project Project Started Pre or Post CA-
PMM
Reported Project
Completion Percentage
Number of Completed Milestones Reported
Number of Days Past Due for
Completed Milestone
Average Delay of
Milestone Completion
(Days)
Number of Delayed
Milestones Reported
20
Department of Motor Vehicles
Web-Enabled Customer Flow Management &
Appointment Systems
(WCFMAS)
Post 19.00% 1 127 127.00
21
Department of Parks & Recreation
Public Safety Technology
Modernization (PSTM)
Pre 47.00% 3 119 39.67 10
22
Department of Public Health
California Healthcare Event & Reporting Tool
(CalHEART)
Post 93.00% 7 101 14.43
23
Department of Public Health
Business System Upgrade Project
(BSUP) Pre 21.00% 3 609 203.00 8
24
Department of Public Health
California Immunization Registry (CAIR)
Post

89
Project No.
Department Name
Name of Project Project Started Pre or Post CA-
PMM
Reported Project
Completion Percentage
Number of Completed Milestones Reported
Number of Days Past Due for
Completed Milestone
Average Delay of
Milestone Completion
(Days)
Number of Delayed
Milestones Reported
25
Department of Social Services
County Expense Claim Reporting
Information System (CECRIS)
Post 5.00% 5
26
Department of State
Hospitals
Personal Duress Alarm System
(PDAS) Post 80.00% 7 109 15.57
27
Department of State
Hospitals
Active Directory Restructuring
(AD) Post
28
Department of State
Hospitals
Automated Staff Scheduling and
Information Support Tool
(ASSIST)
Post
29
Department of Toxic
Substances Control
Toxics Information
Clearinghouse Post 99.90% 11 430 39.09

90
Project No.
Department Name
Name of Project Project Started Pre or Post CA-
PMM
Reported Project
Completion Percentage
Number of Completed Milestones Reported
Number of Days Past Due for
Completed Milestone
Average Delay of
Milestone Completion
(Days)
Number of Delayed
Milestones Reported
30
Department of
Transportation
Project Resourcing &
Schedule Management
(PRSM)
Pre 68.00% 6 87 14.50 9
31
Department of
Transportation
Construction Management
System Pre 67.00% 8 1094 136.75 1
32
Department of
Transportation
Roadway Design Software
Pre 67.00% 9 573 63.67 16
33
Department of
Transportation
Electronic Permitting
System (ePermits) Post 25.00% 5 387 77.40 8
34
Department of Veterans
Affairs
Enterprise Wide Veterans Home
Information System (EW-VHIS)
Pre 93.00% 12 2089 174.08 4

91
Project No.
Department Name
Name of Project Project Started Pre or Post CA-
PMM
Reported Project
Completion Percentage
Number of Completed Milestones Reported
Number of Days Past Due for
Completed Milestone
Average Delay of
Milestone Completion
(Days)
Number of Delayed
Milestones Reported
35
Department of Veterans
Affairs CalVet Connect Post
36
Employment Development Department
Unemployment Insurance
Modernization (UI-MOD)
Pre 90.00% 25 -16 -0.64 22
37
Employment Development Department
Workforce System Network
(WSN) Pre 72.00% 9 2256 250.67 11
38
Employment Development Department
Alternate Base Period
Post 94.00% 6 123 20.50 6
39
Environmental Protection
Agency
Unified Program Electronic Reporting
Post 63.67% 4 433 108.25 4
40 Franchise Tax
Board Enterprise Data
to Revenue (EDR) Pre 35.00% 1

92
Project No.
Department Name
Name of Project Project Started Pre or Post CA-
PMM
Reported Project
Completion Percentage
Number of Completed Milestones Reported
Number of Days Past Due for
Completed Milestone
Average Delay of
Milestone Completion
(Days)
Number of Delayed
Milestones Reported
41
Health & Human Services Agency
Case Management,
Information and Payrolling System
(CMIPS II)
Pre 41.00%
42
Health & Human Services Agency
Leader Replacement System (LRS)
Pre 0.00% 3 444 148.00 0
43
Health & Human Services Agency
Child Welfare Services New
System (CWS-NS) Post
44
Office of Emergency
Services
Response Information
Management System (RIMS) Replacement
Pre 33.00% 2 1492 746.00 3
45
Peace Officer Standards &
Training Commission
Test System Replacement
Post 20.00% 8 122 15.25

93
Project No.
Department Name
Name of Project Project Started Pre or Post CA-
PMM
Reported Project
Completion Percentage
Number of Completed Milestones Reported
Number of Days Past Due for
Completed Milestone
Average Delay of
Milestone Completion
(Days)
Number of Delayed
Milestones Reported
46 Public Utilities Commission
Rail Safety and Security
Information Management
System
Pre 90.00% 4 349 87.25
47 Secretary of
State
VoteCal Statewide Voter
Registration System
Pre 5.00% 2
48 Secretary of
State California
Business Connect Post 0.00% 1 55 55.00
49 State Board of Equalization
Centralized Revenue
Opportunity System (CROS)
Post 83.00% 2 87 43.50 1
50
State Controller's
Office
21st Century Project
Pre 63.00% 32

94
Project No.
Department Name
Name of Project Project Started Pre or Post CA-
PMM
Reported Project
Completion Percentage
Number of Completed Milestones Reported
Number of Days Past Due for
Completed Milestone
Average Delay of
Milestone Completion
(Days)
Number of Delayed
Milestones Reported
51
State Personnel
Board
Examination and Certification
Online System (ECOS)
Post 26.00% 3 30 10.00 1
52
Statewide Health
Planning & Development
Responsive Electronic
Application for California's Healthcare (CalREACH)
Post 55.00% 10 8 0.80
53 Student Aid Commission
Dream Act Post

95
References
Abu Ali, A. &. (2010). PMP Growth in the IT Field. European Journal of Scientific
Research, 42(4), 661-666.
Al-Khouri, A. M. (2012, June 14). Projects Management in Reality: Lessons from
Government Projects. Business and Management Review, 2(4), 1-14.
Atkinson, R. (1999). Project management: cost, time and quality, two best guesses and a
phenomenon, its time to accept other success criteria. International Journal of
Project Management, 17(6), 337-342.
Besner, C. &. (2012, October). An Empiricial Identification of Project Management
Toolsets and a Comparison Among Project Types. Project Management Journal,
43(5), 24-46.
Bozeman, B. (2002). Government Management of Information Mega-Technology:
Lessons from the Internal Revenue Service's Tax Systems Modernization.
Arlington, VA: The PricewaterhouseCoopers Endowment for The Business of
Government.
Bryde, D. J. (2003). Project management concepts, methods and application.
International Journal of Operations & Production Management, 775-793.
California State Auditor. (2011). Administrative Office of the Courts: The Statewide Case
Management Project Faces Significant Challenges Due to Poor Project
Management. Sacramento.
California State Controller's Office. (2012). Retrieved December 31, 2012, from
http://www.sco.ca.gov/21century.html

96
California Technology Agency. (2011, March). California Project Management
Methodology (CA-PMM). Retrieved from
http://www.cio.ca.gov/Government/IT_Policy/pdf/SIMM_17A_CA-
PMM_Reference_Manual_Final_07182011.pdf
California Technology Agency. (2011, March). California Project Management
Methodology Reference Manual.
California Technology Agency. (2011). History of the California Technology Agency.
Retrieved from http://www.cio.ca.gov/About/history.html
California Technology Agency. (2011). Technology Agency Offices. Retrieved January 2,
2013, from http://www.cio.ca.gov/About/offices.html
California Technology Agency. (2012, December 2). California Technology Agency.
Retrieved from
http://www.cio.ca.gov/Government/IT_Policy/IT_Projects/index.html
Cerpa, N. a. (2009, December). Why Did Your Project Fail? Communications of the
ACM, 52(12), 130-134.
Chen, C. C. (2009, February). Managing ERP Implementation Failure: A Project
Management Perspective. IEEE Transactions on Engineering Management,
56(1), 157-170.
Furumo, K. (2006). Do Project Management Tools and Outcomes Differ in Organizations
of Varying Size and Sector? Interdisciplinary Journal of Information, Knowledge
and Management, 1, 23-36.

97
Ghosh, S. F. (2012, January). Enhance PMBOK by Comparing it with P2M, ICB,
PRINCE2, APM and Scrum Project Management Standards. PM World Today,
14(1).
Gillard, S. (2009). Soft Skills and Technical Expertise of Effective Project Managers.
Issues in Informing Science and Information Technology, 6, 723-729.
Gunnison, R. B. (1997, May 11). Computers and Apparatchiks Don't Mix / Action in
Sacramento doesn't quite flow at the speed of technology. By the time they've
signed the contract on the software, it may be obsolete. San Francisco, CA.
Retrieved from http://www.sfgate.com/default/article/CALIFORNIA-INSIDER-
Computers-and-Apparatchiks-2841536.php
Karlsen, J. T. (2005). What Characterizes Successful IT Projects. International Journal of
Information Technology & Decision Making, 4(4), 525-540.
McCormick, E. (1997, September 2). Wilson's tech czar clamps down. San Francisco,
CA. Retrieved from http://www.sfgate.com/default/article/Wilson-s-tech-czar-
clamps-down-3102940.php#page-1
McDowell, S. W. (2001). Just-in-time project management. IIE Solutions, 30-33.
National Association of State Chief Information Officers. (2005). Discipline Succeeds:
Findings from the NASCIO State IT Project Management Assessment. NASCIO.
Ortiz, J. (2013, March 13). California Assembly moves to speed processing of business
filings. The Sacramento Bee. Sacramento, CA. Retrieved from
http://www.sacbee.com/2013/03/12/5257382/california-assembly-moves-to-
speed.html

98
Peng, G. J. (2007, September). Development and Comparative Analysis of the Project
Management Bodies of Knowledge. Management Science and Engineering, 1(1),
106-111.
Peterson, S. (2002, June 28). California's DOIT Closes Up Shop. Sacramento, CA.
Retrieved from http://www.govtech.com/e-government/Californias-DOIT-Closes-
Up-Shop.html
Project Management Insitute. (2013). Project Management Professional (PMP).
Retrieved January 1, 2013, from http://www.pmi.org/en/Certification/Project-
Management-Professional-PMP.aspx
Project Management Institute. (1997). Principles of Project Management. Newtown
Square.
Project Management Institute. (2008). A Guide to the Project Management Body of
Knowledge 4th Edition. Newtown Square.
Sarantis, D. (2009, August). A Critical Assessment of Project Management Methods with
Respect to Electronic Government Implementation Challenges. Systemic Practice
& Action Research, 23(4), 301-321.
Senate Committee on Governmental Organization. (2010). Bill Analysis 2408.
Sacramento.
State of California. (2011). Retrieved December 31, 2012, from
http://www.fiscal.ca.gov/about-vision/

99
Sterngold, J. (2005, April 29). Lawmakers cut prisons budget plan / Program failures,
waste lead Senate panel to reject $100 millsion of $6.5 billion request.
Sacramento, CA. Retrieved from
http://www.sfgate.com/bayarea/article/SACRAMENTO-Lawmakers-cut-prisons-
budget-plan-2638475.php
Sukhoo, A. (2005). Accommodating Soft Skills in Software Project Management. Issues
in Informing Science and Information Technology, 2, 691-703.
The Sacramento Bee. (2012, March 27). California Judicial Council halts court case
management system. Sacramento, CA. Retrieved from
http://blogs.sacbee.com/capitolalertlatest/2012/03/california-udicial-council-halts-
controversial-court-case-management-system.html
The Sacramento Bee. (2013, February 8). 'Frightening' failures prompt state to ax $90
million software deal. Sacramento, CA. Retrieved from
http://blogs.sacbee.com/the_state_worker/2013/02/frightening-failures-prompt-
state-to-ax-90-million-software-deal.html