Embed Size (px)
Citation preview

UNIVERSITY OF TWENTE
Improving the lead times at the receiving
department Benchmark Electronics Almelo
Derk Gorter
19/2/2015
Supervisors Benchmark: Ronald Rikmanspoel John Nijland
Supervisors University of Twente: Peter Schuur Henk Kroon

i

ii
Preface In the context of my bachelor thesis I have performed a research about improving lead times at the
receiving department for Benchmark Electronics Almelo. When I look back on my time in Almelo, I can
say that I have worked in a stimulating environment and have learned a lot in a short time. I want to
thank everyone that has helped me during my research. Especially Ronald Rikmanspoel and John Nijland
who supervised the research. They have always made a lot of time to answer questions and talk about
different perspectives on the problems. I also want to thank Erik Eilering with whom I worked on the IT
aspects of the research, he invested a lot of time to help me with my work. Finally I hope that the
insights and recommendations are of value to Benchmark.

iii
Management summary Benchmark Almelo has some problems at the receiving department. Items that come in at the dock are
not always put to stock within the norm of 24 hours that is set for the department. Even if the items are
processed according to the norm there is no information available about the performance of the
department. This results in a hard to control process and the purchasing department using inaccurate
data to measure the performance of their suppliers. The main question this research answers is:
'How should Benchmark Electronics design the incoming goods process in order
to reduce lead times and prevent problems at a later point in the supply chain?'
To answer this question the current procedures at the department have been mapped and the problems
that need to be solved have been pointed out. Three different options that could possibly solve the
problems were compared using the analytic hierarchic process and a sensitivity analysis has been
performed to make sure the analysis was strong enough to accept the outcome.
Part of the research is Express Receiving. This is a relatively new procedure for registering items in the
ERP system (putting items to stock). This method is currently not used in Almelo because operators and
supervisors feel it does not improve the receiving operation. A sub goal of the research is to provide
recommendations about the use of Express Receiving. This was achieved by comparing the different
procedures and gathering information from Benchmark Brasov.
Analytic Hierarchic Process
Table 1 shows the scores of the alternative solutions on the criteria that were used for comparison. The
alternative options that were compared are:
a sticker that changes color when it expires, this can indicate which parcels should be processed
first
FIFO lanes, two different areas to place parcels in. One area for parcels that arrived yesterday or
earlier and one for parcels that arrive on the present day. The yesterday area must always be
empty before processing parcels in the today area.
Scanning the tracking number on the outside of the parcel, which is called waybill, to be able to
compare data from when a parcel arrives to when a parcel is processed. With this data we are
able to show which parcels should be processed first.

iv
The criteria that were used to compare the alternative options are: (i)how much extra work is needed
(ii)to what extent are the changes in the process self-evident and understandable, (iii)costs, (iv)How
visible are parcels that have priority and (v)to what extent is the option able to measure performance of
the department.
Results:
The table shows that Waybill scanning while entering component data in the ERP system is the best fit
for Benchmark mainly because of the
strong need for a performance indicator.
The research shows that Express
Receiving should not be used and it is
preferable to use one single procedure to
process all items. This procedure also
incorporates scanning the waybill.
With the new data we can compose the
OnTime Waybill report. An example of the
report can be seen in figure 1. The ‘Hurry
up with waybill’ table can be used to
identify parcels that need to be processed
first. This will make sure the parcels are
processed within 24 hours. The bar chart
and the percentages on the right are good
performance indicators which
management can use.
Amount of extra work
Self-evident
Costs Visibility Ability to measure
performance
weights 0.09 0.04 0.31 0.12 0.44 Score Color changing sticker 0.09 0.43 0.05 0.23 0.39 0.238 FIFO lanes 0.65 0.43 0.47 0.67 0.05 0.326 Waybill scanning 0.26 0.14 0.47 0.09 0.57 0.436
Table 1 – outcome of the AHP analysis
Figure 1 – OnTime Waybill report

v
Because the solution is already implemented, the report also provides a roadmap to improve the
OnTime Waybill report. A short version of the roadmap is presented below in table 2.
Action Responsible department
Eliminating missing waybills At this stage not all order lines are visible in the report. The purchasing department must make sure all suppliers provide a waybill.
Purchasing
Filter unexpected receipts Unexpected receipts are orders that sometimes stay in the receiving area for a long time. This is not the responsibility of the receiving department and this data should not influence the KPI
Business Intelligence
Integrating supplier delivery dates The on time delivery KPI at the purchasing department can be improved by integrating supplier delivery dates into the OnTime Waybill report.
Business Intelligence
Barcoded waybill on packing slip The waybill should be provided on the packing slip (a document that contains information about the contents of a parcel). This will make the work at the receiving department easier.
Purchasing
Making trend information available Adding historical information to the report can improve its value. Business Intelligence
Table 2 – Short version of the roadmap for improving the OnTime Waybill report

vi

vii
Table of Contents Chapter 1 - Introduction ............................................................................................................................... 1
1.1 Introduction to Benchmark Electronics .............................................................................................. 1
1.2 Background of the research ............................................................................................................... 1
1.3 Summary ............................................................................................................................................. 2
Chapter 2 - Defining the research ................................................................................................................. 3
2.1 Research goal ...................................................................................................................................... 3
2.2 Boundaries of the research ................................................................................................................ 3
2.3 Research method ................................................................................................................................ 3
2.4 Research question and sub questions ................................................................................................ 4
2.5 Summary ............................................................................................................................................. 7
Chapter 3 - Theoretical framework ............................................................................................................... 8
3.1 Warehousing ....................................................................................................................................... 8
3.2 Cross Docking ...................................................................................................................................... 9
3.3 Relevant developments in Warehousing.......................................................................................... 10
3.4 Summary ........................................................................................................................................... 11
Chapter 4 - Current Situation ...................................................................................................................... 12
4.1 Procedures ........................................................................................................................................ 12
4.2 BridgeLogix ....................................................................................................................................... 18
4.3 What KPIs are currently in place? ..................................................................................................... 21
4.4 Summary ........................................................................................................................................... 22
Chapter 5 - Express Receiving ..................................................................................................................... 23
5.1 The background of Express Receiving .............................................................................................. 23
5.2 Express Receiving procedures .......................................................................................................... 23
5.3 Express Receiving in Brasov .............................................................................................................. 27
5.4 Summary ........................................................................................................................................... 28
Chapter 6 - Problems at the incoming goods department ......................................................................... 29
6.1 performance of the incoming goods department ............................................................................ 29
6.2 Problems ........................................................................................................................................... 30
6.3 Express Receiving .............................................................................................................................. 31

viii
6.4 Summary ........................................................................................................................................... 32
Chapter 7 – Additional literature ................................................................................................................ 34
7.1 AHP ................................................................................................................................................... 34
7.2 Performance indicators in logistics ................................................................................................... 35
Chapter 8 – Solutions .................................................................................................................................. 37
8.1 Expectations and wishes ................................................................................................................... 37
8.2 Performance indicators needed ....................................................................................................... 37
8.3 Possible solutions ............................................................................................................................. 38
8.4 Finding the best solution .................................................................................................................. 39
8.6 Summary ........................................................................................................................................... 42
Chapter 9 – Consequences and utilization of the solution ......................................................................... 43
9.1 Changes that need to be made ........................................................................................................ 43
9.2 OnTime Waybill report, how does it work?...................................................................................... 44
9.3 Using the OnTime Waybill report ..................................................................................................... 45
9.4 Roadmap for improving the OnTime Waybill report ........................................................................ 46
9.5 Summary ........................................................................................................................................... 47
Chapter 10 - Conclusions and recommendations ....................................................................................... 48
10.1 Conclusions ..................................................................................................................................... 48
10.2 Recommendations .......................................................................................................................... 48
References .................................................................................................................................................. 49
Appendix I – Supplier requirements ........................................................................................................... 50
Appendix II – OnTime Waybill report, how does it work? .......................................................................... 55

ix


1
Chapter 1 - Introduction In this chapter we give an introduction to Benchmark Almelo at which the research is done and explain
the grounds for the research.
1.1 Introduction to Benchmark Electronics Benchmark Electronics was founded in 1979 in Texas. Until 1988 the company operated under the name
Electronics. From then on the name was changed to Benchmark Electronics. Originally Benchmark only
produced complex medical equipment for intermedics. The company started growing into its current
stature by acquisition of other companies. In just two years Lockheed Martin Commercial Electronics
and AVEX Electronics were acquired. Today Benchmark Electronics has eighteen plants in North
America, Mexico, Europe and Asia. The company is a global contract electronics manufacturer, which
means they deliver parts to original equipment manufacturers all over the world. The company offers a
wide range of services to their customers, these include product development engineering, new product
introduction, test development, volume manufacturing, automated assembly and test, logistics
management and direct order fulfillment. Benchmark Electronics strives to be the solution provider of
choice for high technology original equipment manufacturers, anticipating their needs and rapidly
delivering comprehensive value-creation solutions during the entire product life cycle. Currently
Benchmark Electronics employs about 12000 people.
The plant in Almelo originally was a subsidiary of Phillips, specialized in designing and manufacturing
test and measurement equipment. Currently the plant is expanding very fast, in the next two months it
is expected that 60 new employees and a new production line are installed.
1.2 Background of the research
Benchmark is using an enterprise resource planning system to manage its operations. In order to utilize
the ERP system to its full potential it is extremely important that the data stored in the system is an
exact representation of the actual situation at the plant. When the data and the actual situation do not
correspond, huge disruptions in production can occur. This has a big impact on the company because
promised delivery dates might not be met and future revenue is at risk. An important factor in the
supply chain is the incoming goods department. This department makes sure that the goods that arrive
at the plant match the specifications the buyer agreed on with the supplier, that the items are made
available in the ERP system and the correct labels are applied in order for the items to be stored in the
correct location.

2
The lead time for goods to be made available in the ERP system after they have been loaded off the
truck is one day. This lead time is often exceeded causing problems for the production department.
In the current situation trucks deliver goods to the plant multiple times a day. When goods are
delivered, the goods are docked using a scanner. After all the goods have been docked they are placed
nearby a workstation in order to be received into the ERP system. The employee often chooses to
receive big goods first to make some room for next shipments. The goods are now ready to be received,
this is done using a pc with software that communicates with the ERP system. The content of the boxes
is verified and if it checks out the items are made available in the ERP system. The software Benchmark
is currently using has been replaced with new software called Express Receiving that should decrease
receiving time drastically. This new software is not used because it increases receiving time instead of
decreasing it.
Some of the suppliers currently deliver their goods in a container with a bundle of documents that need
to be sorted prior to receiving, in some cases this can take hours of valuable time.
The purchasing department has to check the incoming goods department when the ERP system tells
them a supplier has not met the promised delivery date. Most times this happens the goods are
delivered on time but the goods are still waiting to be received.
In the desired situation all goods are received no later than 24 hours after the goods have been docked.
There is a clear system that shows in which order goods should be received. Benchmark is standardizing
processes at all sites to make sure all Benchmark sites are working in the same way. The Express
Receiving software should be used in Almelo so that the methods for receiving goods are the same at all
Benchmark sites. To effectively manage the operations at incoming goods, good performance indicators
need to be measured and reviewed.
1.3 Summary
In this chapter we have defined why the research is important for Benchmark Electronics. The time it
takes to put ordered items in the ERP system after they have been delivered is often longer than it
should be. It is important to investigate this problem, because a good predictable process at the entry
level of the factory is essential to the performance of the factory, and in the end customer satisfaction.

3
Chapter 2 - Defining the research
In this chapter we define the research by setting boundaries and describing the methods that we use to
perform the research. We also formulate the research questions that need to be answered to reach the
research goal.
2.1 Research goal
The main goal of the research is to provide Benchmark Electronics with tools and recommendations to
make sure goods are received in a timely manner in order to prevent problems in the supply chain. And
to provide measurable performance indicators to be able to respond quickly if future problems at the
incoming goods department arise.
2.2 Boundaries of the research
To make sure the research can be fully done in a timeframe of ten weeks clear boundaries have to be
set. We have determined that this research should consist of the following elements:
Detailed description of the current situation
Explanation to what extent Express Receiving is not working at Benchmark Almelo
Recommendations regarding the use of Express Receiving
Key performance indicators to measure performance of incoming goods department
Solutions to reduce lead times at incoming goods department
2.3 Research method
In this section the ways to achieve the desired deliverables of the research are explained.
Detailed description of the current situation
To deliver a detailed description of the current situation I will carry out the day to day tasks of an
employee working at the incoming goods department. By observing and asking the right questions I will
get a good understanding of all the aspects to be considered when assessing the problems at a later
point.

4
Explanation to what extent Express Receiving is not working at Benchmark Almelo
To get a good understanding of why Express Receiving is currently not working in Almelo, we will have
to take a look at the internal procedures and get information from another Benchmark site about their
procedures. I will observe employees doing Express Receiving, and review the documentation that is
available about Express Receiving. I will compare the methods used with the methods for receiving
directly in BaaN (ERP software used at Benchmark) as well as using the BridgeLogix software, which will
be explained in section 4.2. After looking for problems internally I will contact another Benchmark site
located in Brasov to obtain information on the Express Receiving process there. After gathering this
information I will explain why Express Receiving is not working as it should in Almelo
Recommendations regarding the use of Express Receiving
When it is clear why Express Receiving is not working, we will determine whether or not Benchmark
Almelo should use Express Receiving. Working with Express Receiving is highly preferable from a
corporate point of view. If the outcome is that Benchmark Almelo should not use Express Receiving we
have to justify that Express Receiving is not fit for Benchmark Almelo.
Key performance indicators to measure performance of incoming goods department
To provide performance indicators to measure the performance at the incoming goods department, we
have to find out what indicators are most important and realistic to measure. By exploring the data that
is already available in the form of dumps the ERP system makes to excel, we can identify what the
current possibilities are. If additional data is desired we will try to find ways to collect the data.
Solutions to reduce lead times at incoming goods
We will find options to reduce the lead time at the incoming goods department by reviewing literature
and applying the solutions to the situation at Benchmark Almelo.
2.4 Research question and sub questions
Main question
'How should Benchmark Electronics design the incoming goods process in order
to reduce lead times and prevent problems at a later point in the supply chain?'

5
Sub questions
To effectively answer the main question of the research, the problem is divided into different sections
and sub questions.
1. Questions regarding the current situation
1.1. What are the current procedures at the incoming goods department?
To be able to answer the main question we first have to know how the process is currently
arranged.
1.2. How does BridgeLogix work?
BridgeLogix is software that communicates with the ERP system. This software makes it easier
to receive products that are ordered. It is an important factor at the incoming goods
department because employees at the incoming goods department spend a lot of time receiving
items with BridgeLogix.
1.3. What performance indicators are currently in place?
Answering this question will tell us how management is currently assessing the performance of
the incoming goods department.
2. Questions regarding Express Receiving
2.1. What is the background of Express Receiving?
Express Receiving is a new way of receiving goods, it should be faster and more efficient.
Currently it is not used at Benchmark Almelo. To get a better understanding of Express
Receiving we need to have more insight on the background of Express Receiving.
2.2. How does Express Receiving work?
In order to compare Express Receiving with the current procedures to receive an order we will
give a detailed view of the procedures that are carried out to receive an order with Express
Receiving.
2.3. What is different at other Benchmark Electronics sites?
Express Receiving is used at all other Benchmark Electronics sites. Information on the receiving
process at other Benchmark sites will give us a better understanding what the problems at
Benchmark Almelo are.
6
3. Questions regarding problems at the incoming goods department
3.1. What is the performance of the incoming goods department?
Here we will explain how the incoming goods department is currently performing according to
the indicators and the norms that are set.
3.2. What problems that influence the lead time that can be identified?
By comparing the actual situation to the ideal situation we can determine what the problems
are that need to be addressed.
3.3. Why does Express Receiving not work at Benchmark Almelo?
By comparing Express Receiving documents and procedures in Brasov to the situation in Almelo
we will explain why Express Receiving does not work in Almelo.
4. Questions regarding possible solutions
4.1. What are the expectations and constraints on the possible solutions?
To prevent us from coming up with solutions that are not suitable for Benchmark we need to
define what Benchmark’s requirements are and by what factors the solutions are bounded.
4.2. What performance indicators should be measured?
Here we will identify what indicators also need to be measured to adequately assess the
performance of the incoming goods department.
4.3. What options are available to lower lead times at the incoming goods department?
Here we will present the possibilities for Benchmark to lower the lead times at the incoming
goods department.
4.4. Which option is the best fit for the needs of Benchmark Electronics?
By means of multi criteria analysis we will determine which option is the best fitting option to
reduce lead times at the incoming goods department.
5. Questions regarding implementation
5.1. What are the consequences for the tasks and responsibilities of employees
Here we describe how the day to day activities are affected by implementing the chosen
solution

7
2.5 Summary
In this chapter we have formulated the base of the research that we are doing. The main question we
want to answer is: 'How should Benchmark Electronics design the incoming goods process in order to
reduce lead times and prevent problems at a later point in the supply chain?’. We will achieve this by
giving a detailed description of the current processes, identifying the ideal situation, explaining what
problems cause the discrepancy between current and ideal situation, generating possible solutions to
the problems, choosing the best fitting solution and eventually describing what will change if the chosen
solution would be implemented.

8
Chapter 3 - Theoretical framework
In this chapter we provide information about warehousing general. The four different categories of
warehousing operations are explained, and insight in the contribution to total costs per operation is
given. Cross docking is explained, because it has some similarities to the receiving operations that we
will be looking at. Also two important developments in company data sharing are introduced, which are
important for understanding Express Receiving.
3.1 Warehousing
In a typical warehouse, operations can be divided into receiving, storing, picking and shipping. Let us
give a brief explanation of these operations.
Receiving
This operation consists of assigning trucks to one of the docks, unloading the trucks and entering
information about the received goods. At some warehouses the received goods also need to be
inspected to make sure there is no damage, the quantity is right and the correct documents are shipped
with the goods by the supplier. According to Warehouse and Distribution science [1] this operation
accounts for about 10% of the total warehousing costs.
Storing
After the receiving of goods is finished, the goods have to be stored. The most important aspects of this
operation are:
Having accurate information about the available space in the warehouse like the location, size
and maximum weight that can be stored at the location.
Determining locations for goods in order to reduce picking costs. Fast moving goods should be
stored at an easy to pick location because the distance that the operator needs to travel is
shorter. When items need to be picked often the location will make a great impact on total costs
of picking that item
Registering data about the assigned location of a certain item.
About 15% of the total warehousing costs are coming from storing
Picking
Picking is the most labor intensive process of the warehouse operations. The main reason for the labor
intensity is that a lot of traveling is unavoidable and time critical. When an order is placed the

9
0
10
20
30
40
50
60
Receiving Storing Picking Shipping
Percentage of total costs per operation
warehouse management system provides a list of locations and quantities that have to be picked. The
operator then proceeds to visit all locations on his list and retrieve the correct amounts of the items on
the list. Most items are stored in easy to ship packages, which contain a certain amount of single pieces
of the item. As one can imagine, picking packages costs a lot less time than picking single items. When
single items are picked, the items have to be repackaged to make them suitable for transport. When the
picking is completed, the warehouse management system needs to be updated. Picking accounts for
about 55% of the total warehousing costs.
Shipping
In a typical warehouse the shipping department
makes sure that all shipping documentation is
provided with the products and that the products
are ready to be shipped. An important decision
that is made at the shipping department is
whether or not to stage finished product in order
to ship a full pallet or truck. In some cases the
shipping department sends an update to the
customer about the shipment. Shipping accounts
for about 20% of the total warehousing costs.
3.2 Cross Docking Cross docking is eliminating stock in a warehouse. Received goods are taken to the shipping area
immediately after they arrive and are shipped to retailers. The biggest benefits of cross docking are
reducing costs of keeping stock and reducing costs of transportation. Transportation costs are reduced
because the cross docking philosophy also includes only using fully loaded trucks. There are two forms
of cross docking “pure” and “minimal time in warehouse”. At a pure cross docking warehouse all
labeling and repackaging activities are completed before arrival at the dock and there are no inventory
records of the product in the warehouse. The minimal time in warehouse form of cross docking, are
warehouses where inventory is held for a maximum of 24 hours. To reduce costs, these warehouses can
move toward a pure form of cross docking. In figure 3 we see when it would be beneficial to pursue the
pure form of cross docking.
Figure 2 – devision of costs in warehousing (Bartholdi, J. J., & Hackman, S. T. (2008))

10
Figure 3 – Plane to identify if cross docking should be used (Apte and Viswanathan 2000)
The receiving area at Benchmark Almelo is quite similar to a cross docking operation, because they strive
to hold inventory for less than 24 hours and ship items to different internal locations. In figure 3 we can
see that cross docking is preferred when unit stock out costs are low and the product demand rate is
stable and constant. The receiving area at Benchmark Almelo does not meet these two conditions
because a stock out would cause the production to be interrupted (high costs) and the amount of
products handled by the receiving department fluctuates (unstable product demand rate). This means
cross docking is not preferred and we will not apply this concept in the research.
3.3 Relevant developments in Warehousing
Electronic Data Interchange
Electronic Data Interchange means that no human intervention is needed before business applications
can process data from outside sources. This can be data from another department within the company
or data from another company. The key component in EDI is the standardization of data formats.
Companies that do not use EDI often have to manually reenter data received from other companies. It
often comes in the wrong format and their applications cannot process the data. When two companies
in a supply chain commit to EDI they can do business without any human intervention.
Advance Shipping Notice
Like EDI the advance shipping notice is a form of data sharing between business partners in a supply
chain. In this case the supplier sends an update about his outgoing shipment to the customer. The

11
advance shipping notice can be of great value because the company that is waiting for the shipment has
the possibility of correcting possible errors before the goods arrive at the dock. An example of a
common error that can cause problems at the receiving department is when a supplier decides that half
of the order is shipped today and the other half tomorrow. With the advance shipping notice the
receiving company can split this order in advance and make sure it does not cause problems at the
receiving department.
3.4 Summary Warehousing operations can be categorized into; receiving, storing, picking and shipping respectively
these operations contribute to 10, 15 55 and 20 percent of the total warehousing costs. Picking is the
most labor intensive operation which explains the high percentage of total costs. Because the receiving
operations are somewhat like cross docking we looked into the concept and found that it is not usable
at the receiving department because stock out costs are high and the demand rate is unstable.
Relatively new developments in warehousing are forms of data sharing to improve the effectiveness of
supply chain partnerships. Electronic data interchange and the advance shipping notice are forms of
data sharing.

12
Chapter 4 - Current Situation In this chapter we describe how the receiving department is currently designed with a floor plan. Some
numbers about deliveries to Benchmark are presented and discussed. We describe how the operators at
the department perform their jobs and how the software that is used works. In the last part of the
chapter the methods for determining how the receiving department is performing are explained.
4.1 Procedures
Floor plan
The area where the receiving of shipments takes place can be divided into two sections namely
inspection and receiving. Inspection happens in a closed off room with desks and equipment needed for
inspection which we will not further discuss because it is outside of the scope of the research. The right
side of the area is where the receiving takes place.
Figure 4 – Floor plan receiving area Benchmark Almelo

13
Deliveries
The great majority of delivered goods are scanned when they arrive at the dock. These are the goods
that are shipped with one of the big shipping companies like UPS. When goods are shipped like this they
have a tracking number called “waybill”. This number is registered in the ERP system. The data is
represented below and is extracted from 10/2013 through 9/2014.
Figure 5 - Total deliveries per time frame during a year Figure 6 – Total deliveries per day during a year
0
2000
4000
6000
cumulative of parcels delivered per time frame in a year
01000200030004000
cumulative of parcels delivered on a day during a year
Purple Inspection
Green Workstations for receiving, these consist of a pc with receiving software, a barcode scanner and other small office equipment
Light blue Waste bins for cardboard and plastic
Grey Space used to temporarily store goods that are waiting to be received. The space for large goods has markers that can indicate which goods need to be inspected and which goods are waiting to be received
Blue Carts where goods that have been received into the ERP system can be stored. There are two because some items go to the storage system at the production hall and some go to the normal warehouse
Light Red Items for inspection
red Unexpected deliveries are temporarily stored here
orange Forklift used to unload trucks
White Cabinet where documents are stored Table 3 – explanation of floorplan items

14
Figure 7 – Total parcels delivered per month
This data is not a representation of workload per time frame, day or month. The real workload at the
receiving department is the number of order lines they have to register in the ERP system. Since there
can be multiple order lines in one parcel this is only a representation of when trucks arrive and how
many parcels they deliver.
0
500
1000
1500
2000
Parcels delivered per month

15
Flowchart receiving
Start
1. Unload truck
2. Sign for receipt
parcels
4. Dock received
parcel
3. Should the
parcels be docked?
5. Does the parcel
contain a hot part?
4b. Advance
shipping note
4c. Waybill
4a. Hot
flagged
waybills
Yes
6. Hold parcel
back to process
directly after
docking
7. Put parcel on
receiving pallet
No
No
Yes
8. Are all received parcels put
away in the receiving area?
No
Yes
9. Are there parcels
containing hot parts?
10. Put hot part
parcel on
workstation
11. Put parcel
from pallet (FIFO)
on workstation
NoYes
12. Receive
contents of parcel
13. Put
components on
correct storage
cart
12a. BaaN13a. Unexpected
13b. PCBA
13c. Warehouse
13d. Inspection
14. Is the
receiving area
empty?
End
Yes
No
Figure 8 – Flowchart receiving

16
Step Description type
1 Truck arrives and is unloaded process 2 Sign for receipt manual operation 3 Should the goods be docked? decision 4 Docking, Scan waybills of all delivered containers manual operation 4a Hot flagged parts information 4b Advance shipping note information 4c Waybill document 5 Does parcel contain a hot part? decision 6 Hold back for fast processing manual operation 7 Put parcel on receiving pallet manual operation 8 Are all received parcels put away? decision 9 Check for hot part parcels decision 10 Put hot part parcel on workstation manual operation 11 Put parcel on workstation manual operation 12 Receive contents of parcel using BridgeLogix process 12a BaaN data 13 Put received contents on correct storage cart manual operation 13a Unexpected storage 13b PCBA storage 13c Warehouse storage 13d Inspection storage 14 Check if all parcels are processed decision Table 4 – Steps of the receiving flowchart
Detailed description receiving
Multiple times a day trucks arrive at the dock, standard carriers are UPS and FedEx. Sometimes different
carriers are used by a supplier, because they are able to choose their own carrier. The large shipments
are unloaded by forklift, these can be large containers or a pallet filled with small parcels. A shipment of
a few parcels is brought into the dock directly. After all goods have been delivered at the dock one of
the employees has to check for damage and sign for the receipt. The supplier gets a notification that the
goods have been delivered at this moment. When the goods are in the dock they need to be docked.
This means notifying the ERP system that that the parcels have arrived at the dock. Only parcels that
have a tracking number which is also called waybill can be docked. Currently only parcels delivered by
UPS, FEDEX, TNT and PostNL are docked even though some other deliveries do have a waybill.
Shipments that do not have a waybill generally are shipments carried out by the supplier. This means
that the supplier has its own truck and does not need to hire a shipping company like UPS. If the parcels
have to be docked, the waybills are scanned and the ERP system receives a message that the parcel is at
the dock.

17
While docking the parcels the scanner can indicate three situations that apply to the parcel:
The parcel is designated to be received in the normal way. In this case BridgeLogix should be
used to receive the contents of the parcel.
The parcel is designated to be Express Received.
The parcel contains a hot part and needs to be processed as soon as possible because
production is waiting for this part
While docking, the hot part containing parcels are kept aside in order to be processed first and the rest
of the parcels are put away on the receiving pallet. If all parcels that have arrived are docked, their
contents can be registered in BaaN. Hot parts are processed first, and then the rest of the parcels are
processed. Operators at the receiving area strive to process all the parcels on a FIFO basis, but when
parcels are docked they are sometimes put on top of parcels that are waiting to be received for a longer
time. Operators prefer to process large parcels first in order to clear space fast. After the contents of
the parcels have been registered in BaaN, they can end up at three different locations. These are carts
that are moved to their final destination at the end of the day. One of the carts is for components that
are later stored in Kardex, a vertical lift system, at the printed circuit board assembly hall. Components
stored here are delivered on SMD reels, SMD is short for surface mounted device. Other components
are placed on a cart that will go to the normal warehouse, where the parts are stored on shelves. The
third cart is for components that need to go through entry inspection. New parts or parts that have
never been ordered before always go through entry inspection. Because of the many product
development activities, a lot of new parts are handled by the operators at the receiving department. In
other cases components are inspected if an engineer flags a component for inspection or as part of a
random check. There still is one exception where components can also be stored, this is the location
unexpected. When there is a problem with registering the components in BaaN the components go to
this location. These problems can be that the quantity does not match, a wrong part number is
delivered, the packing slip is incorrect, the order has not been correctly confirmed or the order has been
partially delivered without notice. If one of these problems occurs, the component is placed at the
unexpected location and the responsible buyer is notified through a BaaN report. When the buyer has
resolved the issue the components are either registered in BaaN and put to stock or they are sent back
to the supplier.

18
4.2 BridgeLogix
Let us now explain BridgeLogix. BridgeLogix is software that communicates with BaaN. Before this
software was obtained by Benchmark, components had to be registered directly in BaaN (figure 9). The
data entry is in both cases the same, but with BridgeLogix (figure 10) the operator does not have to go
through different windows and find the fields where the data must be entered.
In the current situation BridgeLogix is used as a web application as we can see in figure 10. When
BridgeLogix was first introduced, the scanner that is represented in the web application was actually
used. This has caused a lot of problems because sometimes barcodes were missing or unreadable and
manually entering of codes was very hard and frustrating. The solution was to develop a web application
for BridgeLogix so it can be used on a computer with a keyboard and a barcode scanner.
Figure 9 – BaaN receiving interface Figure 10 – Bridgelogix interface

19
Flowchart Start
1. Open parcel
2. Sort documents
and corresponding
components
3. Enter packing
slip number
4. Enter PO
7a. Open
lines for PO
2b. Packing slip
2a. Certificates
7. Choose correct
line
8. Verify count
9. Enter received
batch lot quantity
18. Does the shipments
contain different batch
lots?
12. Wrie down
MRC number on
packing slip
10. Is the ps
also a
certificate?
11. Make a copy
of the packing slipYes
No
13. Enter lot
quantity
14. Enter batch lo
number, if not
available enter ps
number
15. Enter date
code
8a. Manufacturer
Label on component
16. Print Label
5. Does the PO
contain open
lines?
Yes
6. Put on
unexpected
receipts cart
No
19. Is there a coc
for the
component?
Yes20. Print extra
label
21. Apply label to
document
17. Aply label to
components
22. Store packing
slip
No
End
NO Yes
Figure 11 – Flowchart receiving with BridgeLogix interface

20
Step Description type
1 Open parcel manual operation 2 Sort documents and corresponding components manual operation 2a Certificates document 2b Packing slip document 3 Enter packing slip number data entry 4 Enter Purchase Order number data entry 5 Check for open lines automated process 6 Put component on unexpected location manual operation 7 If there are more lines, choose the correct one decision 7a Open lines for PO data 8 Verify count manual operation 8a Manufacturer label label 9 Enter received batch lot quantity data entry 10 Check if the packing slip is also a certificate decision 11 Make a copy of the packing slip manual operation 12 Write down MRC number on packing slip manual operation 13 Enter lot quantity data entry 14 Enter batch lot number or packing slip number data entry 15 Enter date code data entry 16 Print label automated process 17 Apply label to components manual operation 18 Are there more batch lots to be processed? decision 19 Is there a certificate belonging to the component? decision 20 Print extra label automated process 21 Apply label to document manual operation 22 Store packing slip and documents manual operation Table 5 – Steps corresponding to the receiving with BridgeLogix flowchart
Receiving in BridgeLogix
The first step is to open the parcel and put the contents on the workspace. Orders can arrive one per
parcel or with multiple order lines inside. When there is more than one order line inside, the operator
has to find the document for the corresponding component. This process is highly variable because it
depends on how well the contents are packed and how many order lines are in the parcel. The time to
sort documents increases drastically when there are more order lines because the chance of finding the
right documents and components decreases. If all documents and components are sorted the operator
can start registering the components in BaaN. The first thing to scan or key in, depending on what the
operator prefers, is the packing slip number and the order number. After pressing ‘enter’ the application
will present a screen with all open lines for that order number. Open lines are order lines which are
expected by the ERP system, only these lines can be processed by the operators. If there are no open
lines the component and documents go to the unexpected receipts cart and wait for the buyer to

21
resolve the situation. When nothing is wrong with the order number the operator has to choose the
correct line for the component he is registering. This is checked on matching part number and quantity.
In the case there is only one line open for the purchase order, the screen where the correct line has to
be chosen is skipped automatically. At this point the components have to be counted to verify if the
count matches the amount ordered. Some components are weighed using a scale, but most are counted
by hand. If the component is sealed to prevent electro static discharge damage, the components will not
be counted. In this case the quantity on the manufacturer label will be used to verify the count. The
next step is for the operator to check if the components are produced in different batches, if this is the
case the order will be registered in BaaN per batch. To do this the batch quantity is entered as the total
received quantity and when the batch is processed, the other batches will be booked under the same
order line as if it were partial deliveries. Before the operator can go to the next screen the application
displays the MRC number, which is an internal traceability number that is unique for every entry in
BaaN. This number has to be written down on the packing slip. If for some reason the packing slip is
needed at a later point, it is possible to trace it with this number. When writing down this number the
operator has to make sure that the packing slip is not also some sort of certificate that has to be saved.
If this is the case, a copy has to be made of the packing slip for use as a certificate. After writing the MRC
number down, the batch lot quantity, batch lot number and date code have to be entered. The purpose
of this last data entry step is that it is required that all components of a finished product can be traced
back to their origin. This makes it possible to trace all products that contain a part produced in a certain
batch. If this part is causing defective products, all products containing the same component can be
replaced. The last part of the process is labeling the components correctly. Every box/package of
components gets a label with the partial quantity and one label for the total quantity is printed. If there
is a certificate present a label has to be applied to it also. When the components are labeled for
inspection one label for the total amount and one for the certificate is enough because the components
will receive a new label after they have been inspected. The final step is storing the documents in the
right place.
4.3 What KPIs are currently in place?
At this moment there are no specific indicators that are used to be able to quickly see how the incoming
goods department is performing. The most common way for supervisors to see whether the department
is performing good, is to go to the receiving area and see how many containers are left for the next day.
When all goods have been received and put away to storage the department has done a good job. If

22
there are containers left at the end of the day it is a sign that performance might be under the norm, but
it can also mean that a shipment came in just before 4 PM when the shifts end and there simply was no
time to process the shipment. Another indicator of performance currently used is the on time delivery
statistics for suppliers at the purchasing department. When the purchasing department receives a
notification that one of their suppliers has delivered an order too late, they will investigate this
shipment. If they find out through tracing the shipment that the supplier was on time but the time it
took to register the order in the ERP system has caused the hit, it means bad performance at the
receiving department. The purchasing department is currently using a margin of two days before an on
time delivery hit can occur. Assuming the supplier delivers on time, the receiving department must
process deliveries within 48 hours before getting an indication of bad performance.
4.4 Summary The operators at the receiving department perform two kinds of operations, these are docking and
receiving. The first operation is docking, this is the unloading of the truck and scanning the parcels to
register in the ERP system which parcels have arrived. These parcels are then put on a pallet and
received one by one. This receiving operation is registering the items that are inside the parcels in the
ERP system using BridgeLogix software. Currently there are no explicit performance indicators to
measure the performance of the department. Gut feelings and estimates based on performance
indicators from the purchasing department are used to measure performance.

23
Chapter 5 - Express Receiving
In this chapter we explain what Express Receiving is, why it was introduced and how it works. With a
flowchart we describe the procedures step by step. We also compare the Express Receiving procedures
in Almelo to the procedures in Brasov.
5.1 The background of Express Receiving
Express Receiving was introduced by corporate headquarters as the first part of
their warehouse reengineering project. This project is called the Slipstream
project and it was introduced in 2010. The goal of the project is to achieve a
threefold reduction in time it takes to receive an order into the ERP system. In
the Express Receiving documentation the new way of receiving orders is said to
take three to four minutes instead of the old receiving which takes about twelve
minutes. Express Receiving is dependent on the possibility for suppliers to
cooperate in data sharing. In this case the most important factor is the advance
shipping notice. This notice is sent to Benchmark at the moment the supplier
ships an order. With the information in the advance shipping note, buyers can
correct errors that cause problems with receiving before the order arrives at the
dock. After implementation at Benchmark Almelo, eventually the project was
stopped and all receipts again received with BridgeLogix. The reason the project
was stopped is that operators and supervisors felt the new way of receiving was
taking a lot more time than receiving in BridgeLogix. This is backed by tests
supervisors have done where the outcome was that receiving with Express
Receiving takes more than twice as long as receiving with BridgeLogix.
Another reason for corporate headquarters to introduce Express Receiving was
that, when entering lots of data using a keyboard mistakes are easily made. With Express Receiving all
data is barcode scanned, and there is no room for human error. In figure 12 we see the scanner used for
Express Receiving
5.2 Express Receiving procedures
At the time Express Receiving was used, the parcels that were designated to be express received were
separated from the parcels that would be normally received. When the parcels are docked the scanner
can indicate that a parcel is eligible to be Express Received, as was described in chapter 4. At this point
Figure 12 – Express Receiving scanner

24
the parcels are separated. The rest of the process before the actual receiving into Baan takes place is the
same as we described earlier.
The volume of parcels that can be Express Received is roughly twenty percent of the total volume that is
processed at the incoming goods department. The reason for this low percentage is that suppliers need
to do extra work for Benchmark at their shipping departments, not all suppliers are cooperating on this
matter. The main reason for this is that the supplier ships low volume to Benchmark and therefore does
not want to put effort in changing their shipping procedure for a very small customer.

25
Flowchart Express Receiving Start
2. Open parcel
3. Sort documents
and corresponding
components
4. Choose correct
PO
5. Scan
manufacturer part
number
4a.
Advance
shipping
note
3b. Packing slip
3a. Certificate of
compiliance
9. Verify count
10. Enter lot
quantity
16. Does the shipment
contain different batch
lots?
14. Write down
MRC number on
packing slip
18. Is the ps
also a
certificate?
19. Make a copy
of the packing slip
Yes
11. Enter batch lot
number, if not
available enter ps
number
12. Enter date
code
5a. Manufacturer
Label on component/
packing slip
13. Print Label
6. Does the part
number match?
Yes
7. Put away for
receiving in
BridgeLogix
No
17. Is there a coc
for the
component?
Yes20. Print extra
label
21. Apply label to
document
15. Aply label to
components
22. Store packing
slip
No
End
Yes
NO Yes
1. Scan Waybill
8. Does the scanner
indicate counting is
required?
Yes
No
No
Figure 13 – Flowchart Express Receiving
26
Step Description type
1 Scan Waybill manual operation 2 Open Parcel manual operation 3 Sort documents manual operation 3a Certificate document 3b Packing slip document 4 Choose Po from list decision 4a Advance shipping note data 5 Scan Manufacturer part number manual operation 5a Manufacturer label on packing slip/component document 6 Does the part number match? automated process 7 Put away for receiving in BridgeLogix manual operation 8 Does the scanner indicate that counting is required? decision 9 Verify count manual operation 10 Enter lot quantity data entry
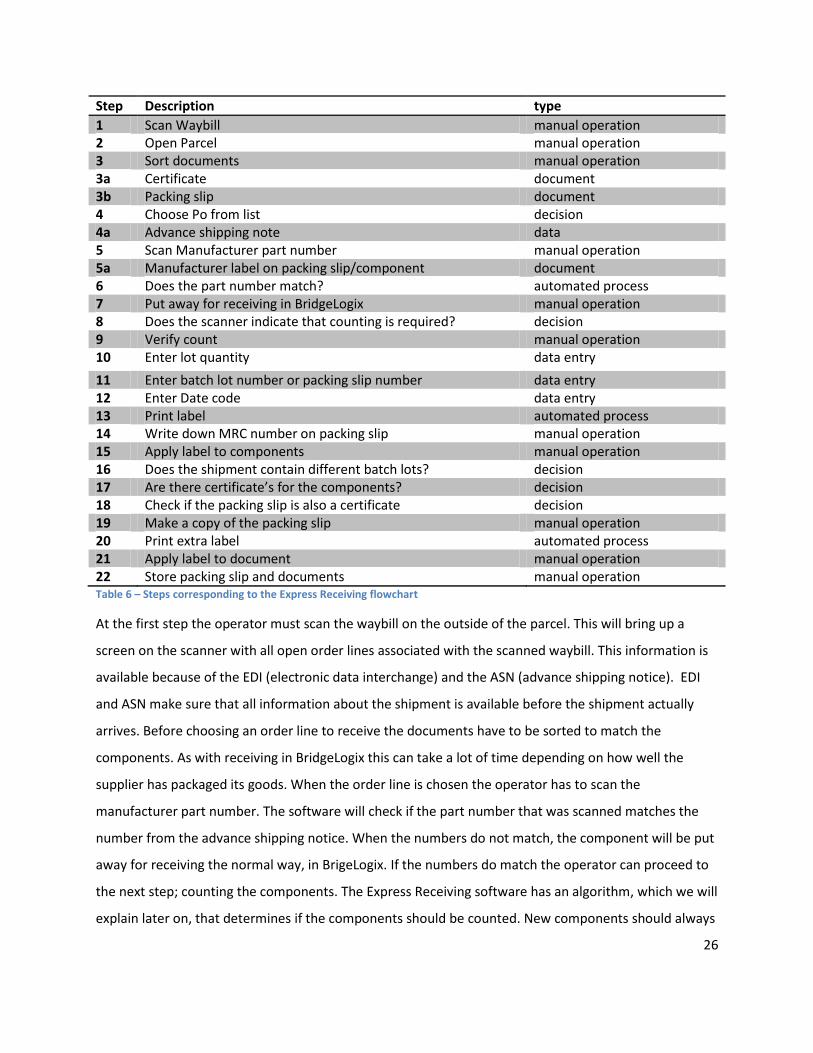
11 Enter batch lot number or packing slip number data entry 12 Enter Date code data entry 13 Print label automated process 14 Write down MRC number on packing slip manual operation 15 Apply label to components manual operation 16 Does the shipment contain different batch lots? decision 17 Are there certificate’s for the components? decision 18 Check if the packing slip is also a certificate decision 19 Make a copy of the packing slip manual operation 20 Print extra label automated process 21 Apply label to document manual operation 22 Store packing slip and documents manual operation Table 6 – Steps corresponding to the Express Receiving flowchart
At the first step the operator must scan the waybill on the outside of the parcel. This will bring up a
screen on the scanner with all open order lines associated with the scanned waybill. This information is
available because of the EDI (electronic data interchange) and the ASN (advance shipping notice). EDI
and ASN make sure that all information about the shipment is available before the shipment actually
arrives. Before choosing an order line to receive the documents have to be sorted to match the
components. As with receiving in BridgeLogix this can take a lot of time depending on how well the
supplier has packaged its goods. When the order line is chosen the operator has to scan the
manufacturer part number. The software will check if the part number that was scanned matches the
number from the advance shipping notice. When the numbers do not match, the component will be put
away for receiving the normal way, in BrigeLogix. If the numbers do match the operator can proceed to
the next step; counting the components. The Express Receiving software has an algorithm, which we will
explain later on, that determines if the components should be counted. New components should always

27
be counted, but for known components an occasional check is enough. The algorithm works as follows:
Each known component has a certain threshold, if this threshold is exceeded the component must be
counted. When a component is always delivered in the correct amount, the threshold will become
greater and the chance that this component has to be counted becomes smaller. To get a better
understanding of how such an algorithm works, imagine that a component has got 100 points. Every
time the same component is handled by the operator we subtract 10 points. When the component does
not have any points left, a thorough physical counting is required. If the component is shipped in the
correct amount, the next time the same component will start with a higher amount of points. This will
result in less counting of products from reliable suppliers.
The scanner will indicate if counting of the components is required and the operator will act accordingly.
In the case that there are more batch lots, the lot quantity will be entered now. The next steps until the
label is printed will be for the batch lot with the previously entered quantity, after that the next batch
lot quantity will be processed until the total received amount is processed. If there is one batch lot, then
the total amount will be entered.
per batch lot:
Enter batch lot number and date code.
Print label and apply to corresponding components.
When the label(s) are printed, we can see the MRC number that is used for internal traceability and it is
written down on the packing slip. In the case that the packing slip is also a certificate, a copy has to be
made which will be used as the certificate. If there is a certificate present an extra label will be printed
to put on the certificate. The last step before the components are put away is storing the packing slip.
5.3 Express Receiving in Brasov
An attempt at internal benchmarking has been made, but sadly it was difficult to obtain good
information about the receiving process at Brasov. The information I did obtain is from mail contact with
a receiving department supervisor at Brasov. At the Benchmark site in Brasov, Express Receiving is still
being used, unlike in Almelo where they have decided not to use Express Receiving because they feel it
does more harm than good to the process. In Brasov the receiving area has two different places to put
parcels after they come off the truck and are docked. One place for Express Receiving and another one
for normal receiving. The procedures for both receiving in BridgeLogix and receiving with Express
Receiving are the same at Almelo and Brasov. The main reason for not using Express Receiving in Almelo

28
was, that it takes a lot more time. In the table on the next page we see a comparison of the average
time it takes to receive an order line with the different methods at both sites:
The difference in Express Receiving time that we see in the table is possibly influenced a lot by
experience. In Brasov the procedures are being used for almost four years now and the operators can
easily switch between normal receiving and Express Receiving.
5.4 Summary The most important factors for introducing Express Receiving are reducing the time it takes to put an
order line in the ERP system and eliminating human errors. The physical procedures and the data entry
in BaaN that are carried out with Express Receiving are explained and insight in the Express Receiving
procedures at the Benchmark site in Brasov is provided.
Almelo Brasov
Express Receiving About 5 or 7 minutes About 1 or 2 minutes
BridgeLogix 1.5 minutes About 1 or 2 minutes
Table 7 – Receiving times at Almelo and Brasov

29
Chapter 6 - Problems at the incoming goods department
In chapter six we fist describe how the receiving department is currently performing in order to discuss
the problems that we found. We also compare the procedures of Express Receiving to the procedures of
receiving with BridgeLogix.
6.1 performance of the incoming goods department
Because there are no specific performance indicators we will describe the performance, using the
indicators described in chapter four. First we will look at the on time delivery statistic from the
purchasing department. The figure below is obtained from an excel file which contains data about all
ordered lines.
Figure 14 – On time delivery performance of suppliers (KPI at the purchasing dept.)
As described before there is a difference in the moment goods are docked and the moment that order
lines inside the parcels are received and booked in BaaN. OTDC stands for ‘on time delivery confirmed’.
For the scores in percentages, the date of booking in BaaN is compared with the date the supplier
confirmed to deliver the order. In the past year 85.1% of all order lines were registered in BaaN within
48 hours of the date the supplier committed to. In November this was 89.2%, the reason that these
fields are red is because the goal at the purchasing department is to achieve a score of 95%. We can see
here that during the past year almost 15% of all order lines were late. A small part of these OTD hits are
caused by bad performance at the receiving department, in these cases parcels have waited more than
48 hours before they were processed. In the past month the performance of the suppliers and probably
also the receiving department was better than the average during the past year. During the first weeks
of my time at benchmark, I have been at the receiving department on different occasions and observed
the procedures and also how much was left at the end of the day which also is used to see how the
department is performing. Most of the days there were only a few parcels left that were waiting to be
received. According to this observation the performance of the department seems to be good, but

30
because we do not know how much time these parcels are waiting in the receiving area, this
observation does not have much meaning.
We know with certainty, by tracking the shipment, that sometimes even when the supplier meets his
OTD promise, the buyer gets an OTD hit. This means that the receiving department needed more than
48 hours to process the order. The actual norm for the department is to process all orders within 24
hours after they have arrived at the dock. We can safely assume that the number of parcels waiting
more than 24 hours is greater than parcels waiting more than 48 hours before being processed. About
the performance of the receiving department we can say that the norm of receiving within 24 hours is
not always met and the department is not performing optimal.
6.2 Problems
FIFO
One of the problems is that the parcels are not always processed on a first in first out base. This seems
to be a small problem, but in reality it can cause big problems. When it becomes busier at the
department it also becomes more important to process the parcels that are waiting the longest first. On
a busy day trucks will bring in shipments throughout the day. When the batches of parcels are not
separated and processed first in first out, a possible scenario is that a parcel that is delivered at the
beginning of the day when the receiving area is empty stays on the bottom of the pile the entire day and
even the next or more days if the workload does not become smaller. This can have great impact
because eventually if an order stays at the dock long enough one of the production lines has to be
stopped because it is missing parts to complete the production run.
Unnecessary work due to poor supplier performance
One of the most variable procedures is sorting documents and looking for the right codes to enter.
Because there are a lot of different suppliers there is also a lot of difference in packaging and packing
slips. Although Benchmark has a document with supplier requirements which the supplier should sign, a
lot of suppliers do not meet the requirements. This problem ranges from a missing barcode till a box
with lots of order lines and unsorted documents. The first causes a few extra seconds in process time
because the operator cannot scan the barcode but has to type it manually. The last can cause hours of
extra time added to the process and cause disruptions for other goods that are waiting to be received.

31
No KPI in place
At the moment it is not easy to tell how the receiving department is performing. In paragraph 4.3 we
described how the performance is currently measured. The problem behind the absence of this
performance indicator is that there is no link between the data about delivered order lines and
processed order lines. This data is only available for EDI suppliers, in this case we know which order lines
were in which parcel. To be able to assess the performance, we also need docking data from non EDI
suppliers.
On Time Delivery measurement purchasing department
In the past, buyers have had a lot of problems with supplier performance. It often happened that buyers
had to call their suppliers to demand an explanation for the bad on time delivery. After the phone calls
or meetings with suppliers, the buyers often got factual evidence of good performance from the
supplier. This was of course not good for the buyers’ reputation and they wanted to know what was
happening. They found out that the problem was that the ordered items waited too long at the dock. In
their data they could only see the moment that the items were booked in BaaN, not the moment the
items came off the truck. To make sure these incorrect OTD hits are prevented, the department has
chosen a margin of 48 hours before an order becomes a hit. Even with this margin that is currently in
place buyers often assume that a hit is caused by bad performance at the receiving department instead
of confronting the supplier, this causes a lot of friction and frustration between the departments.
6.3 Express Receiving
Expectations
When Express Receiving was first introduced the expectations were too high. The supervisors and
employees at the receiving department in Almelo were told that a parcel containing multiple order lines
could be processed at once. This would drastically cut the process time. When we take a look at the
documentation of Express Receiving we find that there is no possibility for processing multiple order
lines at once. Corporate and Brasov both confirmed that this possibility does not exist. There must have
been a miscommunication at the implementation phase that has led to these high expectations which
have caused a lot of frustration.
Process Time
The documentation about the Express Receiving procedures emphasizes that parcels eligible for Express
Receiving take the fast path to stock and the normal receipts take the slower path. When we compare

32
the flowcharts of BridgeLogix receiving and Express Receiving (figure 11 & 13), we see that the
flowcharts look almost the same and consist of the same amount of elements. These elements are all on
the same scale of time intensity, this means that even if Express Receiving is faster, it cannot be
absolutely much faster. To prove this assumption we have tried both receiving methods with the same
amount of order lines. With BridgeLogix it took 28 minutes to process 6 order lines and with Express
Receiving it took 32 minutes to process the same amount of order lines. To make sure experience of the
operators with BridgeLogix could not influence the results, the test was carried out by a person that was
inexperienced with both receiving methods. If we also take the information from Brasov into account,
where both Express Receiving and BridgeLogix take about one or two minutes, we can conclude that
Express Receiving is not faster than receiving with BridgeLogix.
Elimination of human errors
With BridgeLogix receiving, a keyboard is used to enter data and the part number on the screen has to
be compared with the part number on the label. This leaves some room for error which Express
Receiving eliminates. In paragraph 5.2 we described the ASL verification. This is the automated checking
of the part number by scanning the number on the label and letting the software check if the number
matches the number in the ERP system.
The problem with the elimination of human errors by means of Express Receiving is that these errors are
almost nonexistent in Almelo. In the past four years production has only had problems that could have
been prevented by Express Receiving three times. Wrong parts can only be mounted on a circuit board
when they have the exact same dimension, otherwise the machine would not accept the parts because
they do not fit. Using Express Receiving would eliminate only twenty percent of the possible human
errors because twenty percent of the volume received is eligible for Express Receiving.
6.4 Summary The main problems that need to be addressed are that parcels are not always processed on a first in first
out base, that supplier documentation is not always according to Benchmark standards, that the
performance of the receiving department currently cannot be measured and that the purchasing
department uses wrong data to measure supplier performance. Apart from the problems with the
current procedures we also compared the procedures of Express Receiving and BridgeLogix. We can
conclude from this comparison that the expectations of Express Receiving were too high. These

33
expectations have caused a lot of frustration. The procedures for Express Receiving are not faster and
the human errors that it prevents are almost nonexistent.

34
Chapter 7 – Additional literature In this chapter we review literature which helps us choose the best solution in chapter eight and we look
at an extensive framework of performance indicators.
7.1 AHP
In the next chapter we will discuss options that solve the problems that we described in the previous
chapter. In order to choose the best solution we will compare the options using the Analytic Hierarchic
Process. In this section we will describe the process of finding the best solution with the AHP.
To start with the AHP we first need to identify, based on which criteria the options should be evaluated.
When we have established the criteria the next step is to find the hierarchy of the problem. There are
three levels; the goal, the criteria and the options. In figure 15 we see a visual representation of the
hierarchy.
Figure 15 – AHP hierarchy
The next step is finding out the weights of the criteria by comparing every possible combination of a pair
of criteria. We achieve this by asking, which of the two criteria is more important witch respect to the
goal and putting the answers in a matrix. The answers to the questions can range from one until nine,
which is represented in the table below.
Absolute value Meaning
1 The two criteria are of equal importance
3 The criterion is moderately more important than the other
5 The criterion is strongly more important than the other
7 The criterion has Very strong importance with respect to the other

35
9 The criterion is absolutely much more important than the other
2,4,6,8 Values used when compromise between two is needed
Fractals When the opposite is true, 1/3 is used when the criterion is less important
Table 8 – Possible answers to pairwise comparison questions
When all comparisons are made we can calculate the eigenvector of the matrix which gives us the
weights of the criteria. Now we need to find the scores of each option on each criterion. These scores
are obtained in the same way as we obtained the weights of the criteria. This will result in a comparison
matrix for every criterion we want to use for our selection of the best option. In these matrices we
compare the options in pairs witch respect to the criterion. The eigenvectors of these matrices are the
scores per option on the criteria. After all these comparisons and calculations we can come up with the
following table.
Criterion A
(0.35)
Criterion B
(0.15)
Criterion C
(0.05)
Criterion D
(0.25)
Criterion E
(0.20)
Score
Option I X X X X X 0.42
Option II X X X X X 0.33
Option III X X X X X 0.25
Table 9 – Example of AHP outcome
In this example we would go with option one, because it has the highest weighted score on the criteria.
We can also see here that criterion A was found the most important of all criteria.
One of the advantages of the AHP is that we can perform a consistency check to determine whether the
scores are or are not usable. We are able to do this test because when we are comparing the pairs, we
make more comparisons than needed. The outcome of this test will tell us how consistent the scores
are. When the consistency is low we can choose to improve it or to start over with the AHP.
7.2 Performance indicators in logistics
The work of Krauth, Moonen, Popova & Schut (2005) provides a framework of performance indicators
based on an extensive literature review. They have divided the performance indicators into the
different points of view on a logistical process. For the management point of view the indicators are
further categorized into effectiveness, efficiency, satisfaction and IT and innovation. These indicators
provide management with information on the performance of the company. They are used to make

36
adequate decisions and improve the overall performance of the company.
Table 10 - framework of performance indicators formulated by Krauth, Moonen, Popova & Schut (2005)

37
Chapter 8 – Solutions
To provide a fitting solution for Benchmark Almelo, first we describe the expectations and wishes, and
define the performance indicators that should be used. The different options are then described and
evaluated using the analytic hierarchic process.
8.1 Expectations and wishes
When we try to find different solutions to the problems, we have to take the expectations en wishes
from Benchmark into account. These expectations and whishes are listed below.
Make sure all orders are processed within 24 hours
In the current situation not all receipts are processed within the norm of 24 hours. The solution
must provide Benchmark with tools to make sure the norm is met.
KPI receiving
The research must provide Benchmark with a way to adequately measure performance of the
receiving department. This can also help prevent the discussion between the purchasing
department and the receiving department.
Visibility
It is desired that the parcels that are in the dock for more than 24 hours are easily identified.
This will make it easy to see which parcels should have high priority
8.2 Performance indicators needed
In the framework developed by Krauth et al (2005) that was introduced in the previous chapter we find
two interesting performance indicators that can help us. From the effectiveness category the on-time
delivery performance indicator is needed and from the efficiency category the percentage of order/lines
received with the correct shipping documents is a useful performance indicator
Percentage of orders/lines received with correct shipping documents
One of the problems is that finding the information that is needed to register an order line in the ERP
system can cost a lot of time. In order to have a better idea of how often there are problems with the
shipping documents, the percentage of correct shipped documentation should be measured. The
requirements for documentation are in document BE-43002 and AN-46003 (appendix I), when a
received order does not meet these requirements a registration should be made.

38
On-time delivery performance
The receiving department has to process the contents of the parcels they receive within 24 hours of
arrival at the dock. We want to know how much of the items are delivered to the storage department
within 24 hours. The percentage of order lines that are delivered on time should be measured. This will
give a good representation of the performance of the receiving department.
8.3 Possible solutions
In order to find ways to solve the problems at the receiving department we have been searching in
literature, talking with stakeholders and also looking for ideas on the internet. Before we discuss the
alternatives that we compare with the AHP, we give a short overview off the alternatives that did not
make the initial selection.
One of the options that are left out is making spaces for every day of the week to place parcels that have
come in. This results in five spaces to place parcels in and processing parcels form the area farthest away
from the today area first. This option was left out of the AHP because of the space it would take up at
the receiving department. Also parcels being booked into the ERP system more than three days after
being received at the dock are rare, so two of the five spaces would almost always be empty.
Another option that did not make the first selection was putting stickers on the parcels with a different
color for every day. These stickers would be placed on the parcels on the moment they arrive at the
dock. This option was not taken into account because it is too similar to the color changing sticker
option, discussed further on in this section, which is preferable.
Color changing sticker
The color changing sticker or badge is used for a lot of different
applications. For example, they can be used to give visitors
temporary access to a building or as a temporary parking permit.
These stickers have to be activated by applying two components
of the sticker together. The composition of the chemicals inside
the sticker determine the time it takes for the sticker to change
color or for a certain pattern to become visible. The stickers are
widely available on the internet and are easy to use.
The solution would be to use stickers that expire after 24 hours. If these are applied to the parcels on
the moment they arrive at the dock, they will expire 24 hours later. This will make it easy for operators
Figure 16 – Example of a color changing sticker

39
to see which parcels have high priority. The stickers need to be placed in such a way that they are always
visible. This solution will make sure that parcels that exceed the norm of 24 hours are easily identified
and then quickly processed in order to minimize the extent to which the norm is exceeded.
As a performance indicator the number of parcels with an unexpired sticker can be measured, these can
be presented as a percentage of the total processed parcels. This shows how much of the parcels are
processed on time.
FIFO lanes
The area where the docked parcels are waiting to be processed can be divided into two sections. One
section for parcels that came in yesterday or before yesterday and a section for parcels delivered on the
present day. At the end of each day the last thing the operators should do is move any parcel that is left
to receive and is in the “today” area to the “yesterday” area. With this system parcels that are in the
yesterday area have priority over parcels that are in the today area, only when a shipment contains a
hot part the priority is higher than the yesterday area. As a performance indicator for this solution, the
number of parcels processed from the yesterday area can be measured. This will give information on the
percentage of parcels that are processed on the day that they have arrived.
Waybill scanning in BridgeLogix
By scanning the tracking number that is on the parcel, called the waybill, while registering an order in
the ERP system, data becomes available that can be compared with the data from the waybills that are
scanned when the parcels arrive at the dock. The software that is currently used by the operators at the
receiving department is BridgeLogix, it already has the option of entering the waybill number that is
associated with an order line. When we compare this data we can show which waybills have not yet
been registered in the ERP system, and how long they are waiting to be processed. The operators can
then start their day by identifying which parcels from the previous day should be processed first.
This solution also has the capability of reporting how much time there was between the moment of
docking and the moment of entering in BaaN, for every order line. We can use this data to establish
performance indicators.
8.4 Finding the best solution
Now that we have three possible solutions we want to find a good fitting solution for Benchmark. In the
previous chapter we explained the analytic hierarchic process which we will use to find a good solution.

40
Before we start with the process we need to establish what the criteria will be on which we base our
analysis. The following criteria were obtained with advice of the senior supply chain analyst.
Criteria
Amount of extra work added to the process (less is better)
Self-evident, to what extent are the changes that need to be made understandable (more is
better)
Costs (less is better)
Visibility (higher is better)
ability to measure performance (more is better)
The criteria have been discussed in open interviews with the employees involved with the problems,
these were operators, supervisors and a senior supply chain analyst. This has provided sufficient
information to generate the weights of the criteria. By performing pairwise comparisons of the criteria
we find the weight of each criterion and a consistency index. These are shown in table 11.
When the consistency index approaches zero the consistency of the scores in the AHP comparison
matrix is better. A score of 16.97 is in the range of reasonably consistent. Scores ranging from 10 until 33
are in this range. Because we are satisfied with the level of consistency we will continue the analysis.
The next step is to perform the same sort of comparisons for the alternatives with respect to the
criteria. In this case we need five matrices to find the scores for each alternative on the criteria. When
we sum the weighted scores on the criteria, we find the scores for each alternative shown in table 12.
Criterion Weight
Amount of extra work 0.09
Self-evident 0.04
Costs 0.31
Visibility 0.12
Ability to measure performance 0.44
Consistency Index 16.97
Table 11 – Weights of the criteria and consistency index

41
Amount of extra work
Self-evident
Costs Visibility Ability to measure
performance
weights 0.09 0.04 0.31 0.12 0.44 Score Color changing sticker 0.09 0.43 0.05 0.23 0.39 0.238 FIFO lanes 0.65 0.43 0.47 0.67 0.05 0.326 Waybill scanning 0.26 0.14 0.47 0.09 0.57 0.436
Table 12 – AHP outcome
According to the results of the analysis in table 12 Waybill scanning in BridgeLogix is the best fitting
solution for Benchmark.
Sensitivity analysis
To find out how vulnerable the AHP is to minor misjudgments in the pairwise comparisons we perform a
sensitivity analysis. We will do this for the weights of the criteria as well as the scores of the alternatives
on the criteria. What we want to know is how much a weight or score can deviate from the initial value
before the outcome of the AHP is changed. When we change the weights of the criteria, we have to
make sure the sum of the weights is still one. This means that the weights of other criteria will become
lower when we increase the weight of a criterion.
initial weight
low high best scoring alternative
Amount of extra work 0.09 N/A 0.27 FIFO lanes
self-evident 0.04 N/A 0.36 FIFO lanes
costs 0.31 0.02 N/A FIFO lanes
visibility 0.12 N/A 0.29 FIFO lanes
ability to measure performance
0.44 0.27 N/A FIFO lanes
Table 13 – Sensitivity in criteria weigts
In table 13 we can see that the weights have to be changed significantly before the result of the AHP will
be different. We can also see that the FIFO lanes option would have been the best alternative if one of
the criteria was given the wrong weight. Because we can justify that the ability to measure performance
is the most important aspect and it is unlikely that the other criteria should be higher rated at the cost of
the most important criteria the AHP is strong enough.
Now we will check the sensitivity in scores on the criteria. This is performed in the same way as the
sensitivity of the weights form table 13. The only two criteria that are relevant for analyzing are costs

42
and ability to measure performance. The reason for this is that changing the scores on these criteria
result in a different outcome of the AHP. When we change scores on the other criteria the outcome of
the AHP will stay the same.
Costs Initial score
low high Best scoring alternative
Color changing sticker 0.05 N/A 0.5 Color Changing sticker
FIFO lanes 0.47 N/A N/A N/A
Waybill scanning 0.47 N/A N/A N/A Table 14 – sensitivity in criterion costs
Regarding the costs criterion, the outcome of the AHP would only be different when the color changing
sticker scores 0.5 or higher. We can be absolutely sure that the other two alternatives will cost less,
therefore the possibility that the color changing sticker will score higher on this criterion than the other
two alternatives does not exist.
Ability to measure performance
Initial score
low high Best scoring alternative
Color changing sticker 0.39 N/A 0.63 Color changing sticker
FIFO lanes 0.05 N/A 0.5 FIFO lanes
Waybill scanning 0.57 0.29 N/A Color changing sticker
Table 15 – sensitivity in criterion ability to measure performance
In table 15 we can see that the criterion ability to measure performance is not very sensitive to minor
misjudgments because the scores would have to deviate a lot from the initial scores before another
alternative would get the highest score on the AHP.
8.6 Summary In this chapter three possible options that contribute to solving the problems at the receiving
department are compared using the analytic hierarchic process. The options were compared on five
criteria; Amount of extra work, to what extent is the option Self-evident for operators, costs, visibility
and ability to measure performance. The highest scoring alternative is waybill scanning in BridgeLogix.
The sensitivity analysis points out that the results are strong enough for further use.

43
Chapter 9 – Consequences and utilization of the solution In this chapter we will describe what changes need to be made in order to implement the solution
provided by the previous chapter and how Express Receiving should be approached. The reporting tool
and its applications will be explained and a roadmap to improve the reporting tool will be provided.
9.1 Changes that need to be made
Express Receiving
Before explaining what changes need to be made at the receiving department, we want to make clear
that Express Receiving should not be used. Along with the issues described in paragraph 6.3 which made
clear that Express Receiving is not faster and is not necessary to eliminate human errors, we also feel
that one single procedure to enter orders in the ERP system is much better than two different ways to
achieve the same. Express receiving also adds unnecessary complexity to the receiving operation
because the procedures are very similar, but slightly different. This means mistakes can easily be made.
Another reason for not using Express Receiving is the scanner and the software. The scanner for Express
Receiving has very small buttons which are very hard to use when manual input is needed. This can
happen when a barcode is unable to be scanned. The software on the scanner is not working flawlessly,
while doing different tests and using Express Receiving the scanner needed to reboot multiple times
without any reason. BridgeLogix does not have these problems.
Only when all orders can be Express Received and the software works flawlessly, the use of Express
Receiving should be reconsidered.
BridgeLogix
The procedures as described in paragraph 4.2 do not need to be changed rigorously. The most
important thing is to hold on to the parcel along with the items that are inside. The waybill is always on
the outside of the parcel therefore the parcel should not be thrown away immediately after opening it.
The waybill should be scanned when the BridgeLogix software indicates that it can be entered, this
happens after entering the order number, or choosing the order line when there are more lines to be
received. The ERP system will now contain data from the moment a parcel arrived at the dock and the
moment the content form that parcel is processed and put to stock. The ERP system ‘BaaN’ currently
makes a data dump of the waybills that are scanned every week. This data dump of the waybills that are
scanned at dock and to stock must be made after every working day. These excel files can then be used

44
to compare the data and make a report with on time delivery performance and make a list of parcels
that should be processed first because they are close to overriding the norm of 24 hours.
9.2 OnTime Waybill report, how does it work? When goods arrive at the dock they are scanned to register that they have arrived. Let us recall that the
barcode that the operators at the receiving department scan is referred to as “waybill”. This procedure
is called docking. When all parcels are scanned the information is stored in BaaN. Every night the
docking data is dumped from corporate servers into an excel file “Waybill scan at dock last 13
months.xls”. This file contains the date and time on which a waybill has arrived at the dock. Inside the
parcels are the order lines that need to be booked into the ERP system. This booking procedure is
carried out with the BridgeLogix software. During this procedure the waybill will be scanned again and
stored in BaaN along with the order line information. This data is also dumped into an excel file called
“Waybill scan to stock last 13 months.xls”.
These two excel files contain data
about the moments when the waybill
arrived at the dock and when the
waybill was booked into BaaN. If we
compare these times, we find the time
that an order line has been waiting in
the dock before being processed.
late waybills
The order lines that were registered in
BaaN within 24 hours are the lines in
the table that are not marked yellow or
orange. For every day these lines are
counted and they are represented as
the blue bars in the bar chart above.
Order lines that have waited longer
than 24 hours are either marked yellow
or orange. Yellow lines have waited
between 24 and 48 hours and orange Figure 17 – OnTime Waybill report

45
lines have waited more than 48 hours. Yellow and orange lines are also counted per day these are both
represented in the orange bars in the bar chart above the tables.
Hurry up
The table hurry up with waybill consists of waybills that are in the excel file with Docking information,
but are missing in the excel file with to stock information. This means that they have arrived at the dock
but have not yet been registered into BaaN. Only the urgent waybills are in this table, these are waybills
that have four or less hours until they become late. During the day these waybills will be different,
because waybills that are too late will not be represented and other waybills may become urgent. The
data is dumped only once a day, right before the operators start their shifts. This means that the report
will not update right away when an operator has processed an urgent waybill.
9.3 Using the OnTime Waybill report
The reporting tool has different applications which will be discussed in this section.
Reducing lead times
Operators at the receiving department want to make sure all orders are processed within 24 hours. The
“Hurry up with waybill” table will help them identify parcels that should be processed first. When the
operators start their day, they must check the table and take a few minutes to identify parcels that are
in the table. In the example from figure 17 there are two waybills that need to be processed within 58
minutes. When these two parcels are processed first they are within the norm of 24 hours. The report
works with data that is dumped overnight so the hurry up table will only be up to date in the morning
when the operators start their shifts.
Performance indicator
The bar chart in the report provides information about the day to day performance of the receiving
department. It visually represents the amount of order lines processed within 24 hours and the amount
of order lines processed later than 24 hours after being docked. The report should be printed weekly
and put up on the performance score board of the warehouse department. This should be discussed
weekly with the operators.
On time delivery discussion with purchasing department
The report can be used to eliminate speculation in the discussion about whether an on time delivery hit
regarding a supplier is due to poor performance of the receiving department or due to poor

46
performance of the supplier. The report provides accurate information about when an order arrived at
the dock and how long it has taken before that order was put to stock.
9.4 Roadmap for improving the OnTime Waybill report The report as described in the previous paragraphs is functional, but there still are some improvements
that need to be made. This section provides a roadmap with actions that need to be taken to improve
the OnTime Waybill report, ranked in order of importance.
Action Responsible department
Eliminating missing waybills At this stage not all order lines are visible in the report. The problem is that some suppliers deliver their shipments without tracking numbers on the parcels. Therefore the parcels cannot be scanned on the moment they arrive at the dock. The purchasing department must make sure these suppliers (ES ELEKTRO and DUTRON) deliver their shipments with waybills. This will make sure all order lines are represented in the report.
Purchasing
Filter unexpected receipts
The primary use of this report is to provide insight in the performance of the
receiving department. Items that have been staged unexpected for some
time, and then booked into BaaN after a lot of days, are not bad performance
of the receiving department and should not be taken into account when
calculating the performance of the receiving department. In the current
version of the report this does happen as we can see in the example of the
report (figure 17). These occasions need to be filtered out of the performance
calculation and transformed into a performance indicator for the purchasing
department. The goal should be to minimize the time that items stay on the
unexpected location.
An option to achieve this could be to make a barcode that can be scanned
with all items that are booked after coming from the unexpected location.
Another option would be adding numbers to end of the barcode that the
report can recognize and filter. The difficulty here is that the barcode that is
scanned as a waybill when booking the unexpected item, still needs to be
compared to the waybill associated with docking.
Business Intelligence
Integrating supplier delivery dates The report provides the exact moment that a parcel and the order line(s) it
contains arrive at the dock. This data should be used to measure the on time
delivery performance of the suppliers. Currently the purchasing department
measures the OTD performance based on data from booking the order lines in
BaaN. This leaves a lot of room for error as it is sometimes very busy at the
receiving department, which means order lines are in some cases booked a lot
later than they have arrived at the dock. The spreadsheet that is used for
measuring OTD performance accounts for these errors by only marking order
Business Intelligence

47
lines that are more than two days late as an OTD hit. When the confirmed
delivery dates in BaaN are linked to the docking data from the report, the
purchasing department will have accurate information about the on time
delivery performance of their suppliers.
Barcoded waybill on packing slip To make the scanning of waybills in BridgeLogix easier for the operators, the
purchasing department must arrange with the suppliers that they provide the
waybill with a barcode on the packing slip. In the supplier requirements
documentation from benchmark (appendix I) a tracking number is already
required on the packing slip but few suppliers provide it. The purchasing
department must add “barcoded waybill” to the supplier requirements. And
make sure all suppliers comply.
Purchasing
Making trend information available The percentages that are shown in the report can be used to plot a trend line.
This information can be helpful with predicting when it will be hard to process
al order lines on time. Buyers could also try to avoid ordering non-essential
items to come in when the receiving department cannot handle the workload.
These items could be requested a week earlier or later.
Business Intelligence
Table 16 – Roadmap to improve the OnTime Waybill report
9.5 Summary In order to implement the solution presented in the previous chapter, Benchmark should not engage
further in Express Receiving and only use BridgeLogix software to register orders in the ERP system.
While registering these orders the operators need to scan the waybill that is present on the outside of
the parcel. This extra procedure provides the data needed to measure the performance of the receiving
department and also improve the amount of parcels that are processed within the norm of 24 hours. For
the purchasing department accurate information about when an order arrived at the dock is also
available. This data should be used to measure on time delivery performance of their suppliers. The
roadmap to improve the report explains how that can be accomplished and what other improvements
need to be made to the report.

48
Chapter 10 - Conclusions and recommendations
10.1 Conclusions The goal of this research was to provide Benchmark with tools to improve the lead times at the receiving
department and ways to measure the performance of the department. According to this research the
best way to achieve both goals is to make more information available about the moment an order is
registered in the ERP system. This is achieved by scanning the waybill in BridgeLogix, this same waybill is
also scanned on the moment the order arrives at the dock. This provides Benchmark with a performance
indicator and a tool to lower the lead time at the receiving department. Operators at the receiving
department should start their shifts with the identification of parcels that should be processed first, this
will make sure that the norm of processing parcels within 24 hours will be met. In the rest of their
activities they should try to work according to the FIFO principle as accurate as possible. The use of the
tool prevents parcels from getting lost on the bottom of the pile.
Express Receiving which was introduced in 2010 was presented as a revolution in receiving and with
very high expectations. It would be much faster, easier to perform and human errors would be
eliminated. In the research we show that Express Receiving does not live up to these expectations and
that it causes more frustration than benefits. The receiving department is better off working with only
one procedure to register items in the ERP system, because they do not have to switch methods which
makes operators faster and more experienced with the procedure.
10.2 Recommendations It is recommended that the OnTime Waybill report is improved by taking the actions described in the
roadmap from paragraph 9.4. When these actions have been completed Benchmark achieves improved
on-time delivery measurement at the purchasing department and is able to see trends in the workload
at the receiving department, this will help with planning the need for extra operators at the receiving
department.
In section 8.2 useful performance indicators are described. The internal on time delivery performance
indicator is provided in the solution, but the other performance indicator ‘percentage of order/lines
received with correct shipping documents’ is not. Further research is needed to make this indicator
measurable and useable as a performance indicator of the purchasing department. The goal of this
recommendation is that the variety in which suppliers deliver goods should be reduced to a minimum.

49
References
[1] Bartholdi, J. J., & Hackman, S. T. (2008). Warehouse & Distribution Science: Release 0.89.
Supply Chain and Logistics Institute.
[2] Apte, U. M., & Viswanathan, S. (2000). Effective cross docking for improving distribution
efficiencies. International Journal of Logistics, 3(3), 291-302.
[3] Saaty, T. L. (1990). How to make a decision: the analytic hierarchy process.European journal
of operational research, 48(1), 9-26.
[4] Krauth, E., Moonen, H., Popova, V., & Schut, M. C. (2005, May). Performance Measurement
and Control in Logistics Service Providing. In ICEIS (2) (pp. 239-247).
[5] Triantaphyllou, E., & Sánchez, A. (1997). A Sensitivity Analysis Approach for Some
Deterministic Multi‐Criteria Decision‐Making Methods*. Decision Sciences, 28(1), 151-194.
Color changing sticker
http://www.labelvalue.com/more-for-the-office/name-badge-labels-and-clips/dymo-30367-self-
expiring-stickers-p-381.html

50
Appendix I – Supplier requirements
AN-46003

51

52
BE-43002

53

54

55
Appendix II – OnTime Waybill report, how does it work?
This explanation of the OnTime Waybill report was provided to Benchmark at the last day of my
internship, it is almost similar to the information provided in chapter 9.
SharePoint/reporting/On Time to Stock
Gathering the data
When goods arrive at the dock they are scanned to register that they have arrived. The barcode that the
operators at the receiving department scan is referred to as “waybill”. This procedure is called docking.
When all parcels are scanned the information is stored in BaaN. Every night the docking data is dumped
from corporate servers into an excel file “Waybill scan at dock last 13 months.xls”. This file contains the
date and time on which a waybill has arrived at the dock. Inside the parcels are the order lines that need
to be booked into the ERP system. This booking procedure is carried out with the BridgeLogix software.
During this procedure the waybill will be scanned again and stored in BaaN along with the order line
information. This data is also dumped into an excel file called “Waybill scan to stock last 13 months.xls”.
These two excel files contain data
about the moments when the waybill
arrived at the dock and when the
waybill was booked into BaaN. If we
compare these times, we find the time
that an order line has been waiting in
the dock before being processed.
late waybills
The order lines that were registered in
BaaN within 24 hours are the lines in
the table that are not marked yellow or
orange. For every day these lines are
counted and they are represented as
the blue bars in the chart. Order lines
that have waited longer than 24 hours
are either marked yellow or orange.
Figure 18 – OnTime Waybill report

56
Yellow lines have waited between 24 and 48 hours and orange lines have waited more than 48 hours.
Yellow and orange lines are also counted per day these are both represented in the orange bars in the
bar chart above the tables.
Hurry up
The table hurry up with waybill consists of waybills that are in the excel file with Docking information,
but are missing in the excel file with to stock information. This means that they have arrived at the dock
but have not yet been registered into BaaN. Only the urgent waybills are in this table, these are waybills
that have four or less hours until they become late. During the day these waybills will be different,
because waybills that are too late will not be represented and other waybills may become urgent. The
data is dumped only once a day, right before the operators start their shifts. This means that the report
will not update right away when an operator has processed an urgent waybill.
Applications of the report
The report should be put on the BAM board once a week preferably on Monday because that is
the first moment the data of an entire week is available.
Every morning the hurry up waybill table should be used to identify parcels that need to be
processed first. The operators at the receiving department must reserve a few minutes at the
beginning of their shift to find these parcels. If they cannot find a waybill from the table or the
table is empty, they should still try to achieve as much FIFO as possible.
The purchasing department can check the report to see when an order arrived at the dock
Further actions to improve the report
Missing waybills
At this stage not all order lines are visible in the report. The
problem is that some suppliers deliver their shipments without
tracking numbers on the parcels. Therefore the parcels cannot
be scanned on the moment they arrive at the dock. The
purchasing department must make sure these suppliers (ES
ELEKTRO and DUTRON) deliver their shipments with waybills.
Most ideal for the operators at the receiving department would
be a barcoded waybill on the packing slip from every supplier.
Figure 19 - packing slip

57
In the figure on the right there is a waybill provided on a packing slip from December, this shows that it
is possible for suppliers to provide the waybill on the packing slip. In this example the waybill is not
barcoded but that should also be possible.
OTD purchasing department
The report provides the exact moment that a parcel and the order line(s) it contains arrive at the dock.
This data should be used to measure the on time delivery performance of the suppliers. Currently the
purchasing department measures the OTD performance based on data from booking the order lines in
BaaN. This leaves a lot of room for error as it is sometimes very busy at the receiving department, which
means order lines are in some cases booked a lot later than they have arrived at the dock. The
spreadsheet that is used for measuring OTD performance accounts for these errors by only marking
order lines that are more than two days late as an OTD hit. When the confirmed delivery dates in BaaN
are linked to the docking data from the report, the purchasing department will have accurate
information about the on time delivery performance of their suppliers.
Unexpected
The primary use of this report is to provide insight in the performance of the receiving department.
Items that have been staged unexpected for some time, and then booked into BaaN after a lot of days,
are not bad performance of the receiving department and should not be taken into account when
calculating the performance of the receiving department. In the current version of the report this does
happen as we can see in the example of the report (figure 18). These occasions need to be filtered out of
the performance calculation and transformed into a performance indicator for the purchasing
department. The goal should be to minimize the time that items stay on the unexpected location.
An option to achieve this could be to make a barcode that can be scanned with all items that are booked
after coming from the unexpected location. Another option would be adding numbers to end of the
barcode that the report can recognize and filter. The difficulty here is that the barcode that is scanned as
a waybill when booking the unexpected item, still needs to be compared to the waybill associated with
docking.
Trend
The percentages that are shown in the report can be used to plot a trend line. This information can be
helpful with predicting when it will be hard to process al order lines on time. Buyers could also try to

58
avoid ordering non-essential items to come in when the receiving department cannot handle the
workload. These items could be requested a week earlier or later.
Risks
The risk of this report is losing time when searching for waybills that are already processed. When the
occasions on which this can happen are kept in mind, time will not be lost.
When the hurry up with waybill table is used during the day, the waybills in the table might
already have been processed. The report is not updated real time so it is only accurate on the
beginning of the day.
It can happen that the waybill is not scanned when the order line is being registered in BaaN,
the barcode might be missing or unreadable. This can cause waybills to be presented in the
hurry up table when they have already been processed.