Embed Size (px)
Citation preview

Draft version June 30, 1999 Faculty OfSpatial Sciences
PO Box 8009700 AV GroningenThe NetherlandsTel + 31 50 363 38 85Fax + 31 50 363 39 01
E-mail: Error! Bookmark not defined.
Improving the behavioural location theory;
Preliminary results of a written questionnaire about strategicdecision-making on firm relocations
byCees-Jan Pen
University of Groningen
2
European RSA congress
Regional Cohesion and Competitiveness in21st Century Europe
Dublin, 23-27 August 1999
1 Introduction
A behavioural perspectiveLocation choices of manufacturing and office firms are a well-known research area withineconomic geography. It is generally accepted that these location choices are most clearlyobservable during a firm migration process. Ebels (1997, page 14) defines firm migrationas “a process of adjustment, whereby one location is substituted for another in order tobetter satisfy the needs and desires of each intended migrant”. In this paper and the relateddissertation, we are interested in the so-called integral migrations, which means that thewhole establishment moves from one location to another location.
In general within economic geography, neo-classical, behavioural, and institutionallocation theories are used to explain firm migration. In an earlier paper, Pen andPellenbarg (1999) argue that we should use a behavioural perspective when studyingdecision-making processes and the influence of decision-makers regarding locationchoices1. The publications of authors such as Townroe (1971), Pred (1967, 1969), Keeble(1977), North (1974), Cooper (1975), and Stafford (1969) in the seventies play afundamental role within the development of behavioural economic geography. We connectwith the English (for example Keeble, Townroe, Cooper) and related West European (forexample Pred, Pellenbarg, Bade, Soderman) behavioural economic geography for threereasons.(1) The used deductive approach, opposite to the inductive American approach, fits wellinto the Dutch geographical research tradition (see also Lambooy et. al., 1997) and theaims of my dissertation.(2) The comparable geographical scale in Western Europe is different from the scale in theUnited States.(3) American behavioural economic geographers are more spatial analysts, who focus onquantitative research concerning firm dynamics and have little attention for decision-making processes.
Defining the behavioural location theoryHayter (1997, page 137) points out that “the behavioural location theory assumes thatlocation choice is part of a strategic or long-term investment decision, which is complex,uncertain, inherently subjective, and conducted by individuals or groups of decision
1 The publication ‘Behavioral theory of the firm’ of Cyert and March (1961) was the most pioneeringwork within the behavioural school.

3
makers, who do not have the capabilities of the ‘Homo economicus’”. Key elements ofthis theory are its emphasis on internal and external decision-makers and the analysis ofthe decision-making process concerning the relocation of individual firms.
This paper focuses on constructing a questionnaire to analyse this decision-makingprocess. We elaborate on the conclusion of Hayter (1997), who stresses that the questionof location choice in practice is an integrated part of an investment decision makingprocess, which also involves choices in many other respects, including plant size andtechnology, employment, financing, management, marketing and distribution, engineering,and construction. This complex process can be simplified by distinguishing certaindecision-making phases. The problem, however, is the question how many phases astrategic decision consists of (see section 4).
The main problem of the behavioural location theory is that the firm is regarded asa so-called ‘black box’. Dicken and Lloyd (1990, page 268) describe the ‘black box’ as “acomponent of a system, whose structure we know nothing about. Its behaviour is inferredfrom its input and output characteristics alone… we were following a long-establishedconvention in economic geography: that the geographer’s interest stops at the factorygate”. It is curious that one of the leading behavioural economic geographers Townroe(1971, pages 6-7) stresses that “the principal impetus for change in the demand for spacewill come internally from the enterprise under consideration…the principal impetus tomovement comes from the need to expand output”. Besides, De Pater and Van derWusten (1996) argue that most behavioural geographical studies are descriptive and havean inventory character. For example hundreds of inquiries were executed regardingmotives, which are underlying location decisions2. Within economic geography, Katonaand Morgan (1952) were the first to analyse location factors in a representative andmethodological consistent manner. They recommend that location factors can best betraced with the help of the so-called sample survey method and by interviewingentrepreneurs. My PhD research, therefore, consists of these two empirical methods.
This paper only focuses on explaining the questions in the questionnaire related tothe survey method. The problem, however, is that these survey studies so far have a smallcontribution to theoretical improvements of the behavioural location theory. Hayter (1997,page 159) concludes that that “little direct assessment of satisficing theory in studies ofindustrial location choice were made, although comments are offered from time to time”.Finally, Stafford already in 1969 points out that “the key to understanding industriallocations is to understand and analyse the decision-making process and itsconsequences….At present very little is known about the location decision,notwithstanding the lists of the major location factors….they only asked: why here?” Weargue that preceding lead to one conclusion: we should develop questions about firmmigration, which clarifies the decision-making process and open the ‘black box’.
2 The first publication concerning the questioning of firm migration motives was the classical work ‘Whyindustry moves south’ by McLaughlin and Robock (1949). They also stress the importance of personalfactors when studying firm migration, but argue that its is sometimes said that many plants areirrationally located according to the whims of company executives or their wives. None of the new plantsincluded in this study in 1949 can be that simply explained.

4
Revitalisation of the behavioural location theory in the ninetiesIn 1991, Townroe published an article about ‘the rationality of industrial locationdecision’. This article heralds the period of the so-called revitalisation of behaviouralgeography in the 1990s. Besides opening the firm as a ‘black box’, one of the mainchallenges within economic geography in the future will be the integration of thedemography of firm approach and behavioural economic geography. Until now thedemography of firms focuses on explaining and modelling deviating growth figuresbetween regions with the help of concepts such as innovation, clustering, and learningprocesses3.
Van Dijk, Pellenbarg and Van Steen (1998) argue that relating the five firmdemographic (birth, growth, decline, death, and migration) components with locationdecisions and decision-making will also improve the behavioural location theory. Thisprevents conclusions such as: “previous research on plant closures has little to say on theclosure decision itself….we know very little about the number of factors considered ineach decision or their relative importance within a specific decision…we also know littleabout the influence of the level at which the decision is taken (Kirkham and Watts, 1998,page 1565).
Finally, Townroe (1971) enumerates four future research areas, which should beanalysed in behavioural research.(1) The decision-making process regarding location choice. Soderman (1975) adds thatfurther study must be made of the variables and factors affecting behaviour in locationchoice situations.(2) Identifying the goals and means of concerned actors and the relation between personaland firm goals.(3) Analysing the financial problems of firms during and after the migration.(4) Unravelling the duration of location choice processes and the relationship with theeconomic conjuncture.
We argue that these four areas are still relevant nowadays. Keeble (1977) ends his studywith an interesting remark for the questionnaire by stressing that it seems likely that futurework in this particular field will be useful only where either new techniques are used ornew questions posed. The central formulation of a problem in this paper, therefore, is toconstruct a questionnaire, which analyses the two key elements of the behavioural locationtheory ‘the role of internal and external decision-makers and the course of the decisionmaking process’. This questionnaire will be described in section four.
The underlying dimension of studying decision-making, concerning locationchoices focuses on improving the planning of industrial locations. Some of the presentedstudies in the next section such as Buck Consultants (1997), Ministry of Economic Affairs(1998), and Van Steen (1998) are examples of this underlying/practical dimension of the
3 The so-called structural embededness hypothesis is typical for this approach. Romo and Schwartz (1995)define this as regional economies comprise an intricate web of routinized transactions, most of which donot operate through markets. These relationships ultimately congeal into long-term dependencies thatconstrain the migration behavior of plants that could benefit from cost-structures in other regions of thecountry or the world.
5
behavioural approach. Section two describes the results of some typical inventory locationstudies in the Netherlands. Besides, this section gives us an impression of the context offirm migration, and the content and methodology of firm migration studies in theNetherlands. Section three presents theoretical ideas to improve the behavioural locationtheory. These ideas are integrated in the questionnaire, which will be described in sectionfour. Section five present the preliminary results of the questionnaire and finally the mainconclusions will be drawn in section six.
2 Facts and figures of firm migration
IntroductionSince the nineteen sixties many studies have been executed about the amount, direction,and underlying motives of firm migration in the Netherlands (Molle, 1979; Pellenbarg,1985; Lambooy et. al., 1997; Schutjens et. al. 1998). One of the first migration studies inthe Netherlands analysed 106 firms, which left Amsterdam in 1970.It was found that 60% of the establishments migrated, because there was no space forthem to expand their area; 14% conceded that traffic congestion was another weightymotive (Molle, 1979)4. The difference between this first migration study and the Dutchmigration studies in the nineties is the larger research population nowadays and the moreextensive figures about the amount, direction, and migration motives in the Netherlands.Lambooy et. al. (1997) significantly define the Dutch economic geographical research aspragmatic, applied science, interest in concrete problems, and quantitative analyses.
This section presents important recently published typical behavioural firmmigration studies in the Netherlands. Compared to the location studies in the UnitedKingdom, we conclude that the only development of the behavioural location theory is themore extensive research population. The presented migration studies in the Netherlandsare identical of the great days of English behavioural economic geography in the seventies.
The amount of firm migrationThe so-called panel of firms of the Faculty of Spatial Sciences of the University ofGroningen is an important data source for location choices (see section five). Each yearthe faculty sends a questionnaire about firm behaviour and firm dynamics to some 3.000Dutch firms5. In 1997, the questionnaire focuses, in line with the publications of Townroe(1976) and Keeble (1977) in the United Kingdom, on firm migration and the demand forbusiness areas in the Netherlands. Van Steen (1998) concludes that 900 of the 1338 activefirms in the panel of 1994 moved one or more times during their life cycle.
4 In Germany Spanger and Treuner (1975) executed a regression analysis on the number of migrationseffected in the whole of Germany during each year of the period 1950-1971. They found a significantrelation with the business cycle for new branch-establishments.5 Two third of these firms are so-called active firms and one third are so-called sleeping participants. Theresponse rate of the active firms is 60% to 70%, which means that circa 900-1050 firms return theinquiry. The remaining passive firms have a response rate of circa 25%, which results in circa 150-250returned inquiries. Finally, 1.000 new firms notified to participate, which results in circa 200 to 250returned inquiries. Preceding leads to a total of circa 1.300 to 1.400 useful inquires each panel-round.

6
Another important data source is the so-called ‘Mutation balances’ of the jointDutch Chambers of Commerce. This project delivers since 1985, national data about firmformation, firm migration, and firm closure. On the basis of these data a series ofpublications has been written to document and analyse the firm migration process in thepast ten years. Table 1 presents the yearly migration factor and the amount of migratedDutch firms in the business panel and in the Mutation Balance of the Chambers ofCommerce.
Table 1. The annual migration factor
Results firm panel Results Mutation balancesYear N % migrated % migrated in Mutation Balance Total amount1981 1,131 2,61982 1,152 2,81983 1,168 2,11984 1,197 2,81985 1,220 2,51986 1,244 2,3 5,0 27,0851987 1,266 2,6 6,1 36,0361988 1,286 3,4 6,4 39,1381989 1,309 3,4 6,7 43,0081990 1,345 4,81991 1,362 3,7 7,5 48,0001992 1,368 3,9 7,6 56,0001993 1,380 3,3 7,4 58,0001994 1,385 2,31995 1,336 3,7 7,9 67,700Average 3,1 6,8
Source, Van Steen, 1998, page 27 and Pen and Pellenbarg, 1998, page 8.
Table 1 illustrates that the migration rate in the firm panel varies between 2,1% (1983) and4,8% (1990). The figures of the Chamber of Commerce are twice as high as the businesspanel. It should, however, be noted that the panel has an under-representation of verysmall firms. This confirms the criticism in the Netherlands about the reliability of theChamber of Commerce data. Some people stress that between 30% to 60% of theregistered migrations by the Chamber of Commerce are real migrations. Despite all thecriticism, Pellenbarg (1998) argues that the migration data of the Chambers of Commerceoffer a faithful reflection of spatial trends in the location dynamism of the Dutch trade and

7
industry. One of the main conclusions is that migrated firms are small (average of threeemployees), young, innovative, and fast growing. Pellenbarg (1998) adds that the mobilityof firms is greater than is often assumed. In terms of numbers of firms it is not much lessimportant than the much more debated issue of new firm formation. In the Netherlands,the three components of ‘business demography’ actually account to annual totals of80,000 new firms, 68,000 firm moves, and 42,000 firm closures (Ministry of EconomicAffairs, 1998).
The direction of firm migrationSant (1975) was according to Townroe (1978) the first who visualised the industrialmovement in the United Kingdom. A few years later Keeble (1977, page 137) visualisedthe sub-regional manufacturing movement within the United Kingdom on a different way.In the Netherlands, Pellenbarg and Kemper (1986, 1988, 1991, 1993, and 1995)periodically publish on the basis of the Mutation Balances in Economic Statistical Reportsabout the amount and direction of firm migration in the Netherlands. Table 1 alreadydescribes the amount of firm migration, but what is the direction of these migrated firms.Generally, firm migrations are short distance moves within the region, but long distancemoves lead to a change of the spatial economic landscape.Keeble (1977) adds that migration trends are likely to be a more sensitive indicator ofsignificant shifts in area location advantage within a country. Figure 1 presents on a similarmanner as the British studies in the seventies for the period 1994-1995 the so-calledaverage inter-provincial firm migration in the Netherlands within industry, wholesale trade,and business services. The figure describes that the prevailing trend in the non-local moves(10-20% of all firm migrations) is more and more a south and eastward shift of firms outof the Randstad. The arrows in figure 1 represent the amount of migrated firms, whichmoved over a relatively long distance.
Figure 1. Inter provincial firm migration in the period 1994-1995.

8
Source: Kemper and Pellenbarg, 1997, page. 509.
Firm migration motivesThe next question is off course why these firms move. We distinguish between push andpull factors. Push factors are reasons why a firm wants to leave the present location.Pull factors are attractive elements of a new location, which causes a firm to move to thisnew location.
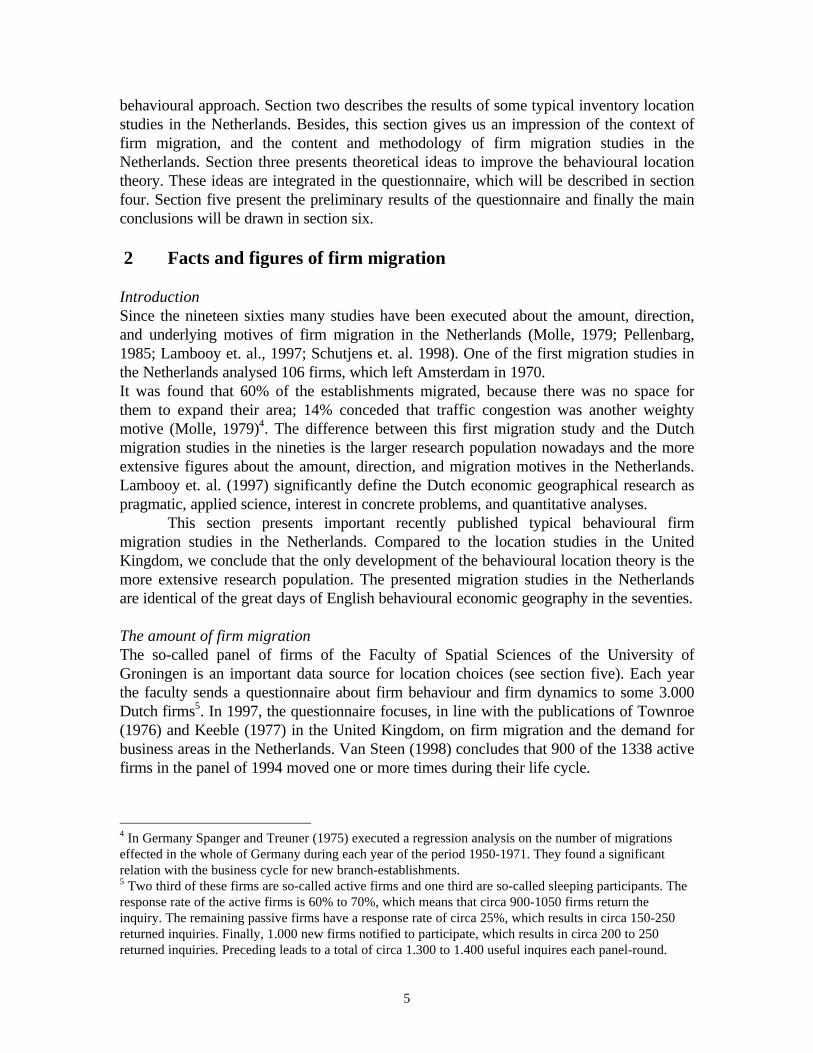
As we said earlier, hundreds of firm migration studies were executed in WesternEurope. This section focuses only on the Dutch situation. To illustrate that the Dutchmethodology is identical to studies in the United Kingdom, we first present an example ofa list of migration motives presented by Townroe (1978). Townroe interviewed 531recently moved firms in the United Kingdom in the period 1973-1974 and simply askedrepresentatives of firms: why did you move? Table 2 describes these migration motives.The figures in the table present the percentages per factors of all questioned firms.
9
Table 2. What caused you to consider a new plant in a new location?
Majorreason
Minorreason
Outstandingsinglereason
To permit an expansion of output 83 8 20Inadequate existing premises or site 50 11 8Unsatisfactory labour supply at existing location 40 11 15Inducements and facilities made available by official bodies 27 14 2Opportunity to purchase or rent premises or site at the new location 20 8 3Too far from established or potential markets 19 1 9Refusal/expected refusal of Industrial Development Certificate (IDC) 12 4 5Town planning difficulties 11 3 4Lease or former premises fell in, or good offer received 5 2 3Desire to be in more attractive surroundings 4 8 1Too far from supplies, actual or prospective, of materials or services 3 2 1More profitable to operate where, no other postulated reason beingmajor
1 - 1
No one outstanding reason - - 28*
* The last reason was asked to 392 firms, having been added after some interviews had taken place.
Source: Townroe, 1978, page 34.
In the study of Van Steen (1994) the response of 795 Dutch firms could be used to tracethe most important migration motives. Table 3 presents the percentage of the quoted tenmost important motives.
Table 3. Most important push and pull motives (N=795)
Push % Pull %No possibility of expansion 77,0 Possibility of expansion 61,1Premise not representative 31,6 Representative premise 50,4Parking possibilities 29,4 Parking possibilities 46,7Transport of goods 25,7 Accessibility by car 45,0Accessibility by car 17,4 Transport of goods 36,0Location of consumers and clients 10,4 Too large premise 29,3Location of suppliers 4,8 Location of consumers and clients 19,2Quality of living environment 4,3 Accessibility of public transport 16,0Expropriation, fire, selling of premise 3,6 Location of suppliers 9,2Fusion/reorganisation 3,4 Quality living environment 7,3
Source: Van Steen, 1998, pages 42-43.In 1997, the Ministry of Economic Affairs ordered the consultant bureau B&A to analysethe most important location factors for four economic sectors. We include this study,because of its subdivision in sectors and the results of the inquiry shows the similarity withthe firm migration motive studies. Table 4 outlines the main results.

10
Table 4. Important location factors per sector on a regional and local level
Industry Commerce Traffic and transport Services1 Accessibility by road Accessibility by road Accessibility by road Parking2 Loading and unloading Loading and unloading Parking Accessibility by road3 Parking Parking Loading and unloading Personnel4 Personnel Premise Telecommunication Premise5 Premise Telecommunication Personnel Telecommunication6 Telecommunication Personnel Premise Representative
environment7 Rent/ground price Rent/ground price Rent/ ground price Accessibility public
transport8 Space for expansion Representative
environmentRepresentativeenvironment
Rent/ground price
9 Representativeenvironment
Space for expansion Telecommunication Landscape quality
10 Accessibility publictransport
Accessibility publictransport
Space for expansion Space for expansion
Source: Ministry of Economic Affairs, 1998, page 86.
Practical relevance of firm migration studiesSection one stresses that the practical reason of studying firm migration and underlyingmotives focuses on planning industrial locations. The publications of Keeble (1977),Townroe (1978), and Buck Consultants International (1998) confirm this practical reason.Dutch firms are for example especially interested in business areas located near highwaysand not too far from urban areas. Besides, firms regard parking of great value. A fewweeks ago the municipality of Amsterdam for example stresses that many firms arelooking for a suburban location due to the strict parking regulations in the inner city areas.Most centrally located firms in Dutch cities have no space for expansion on the existinglocation. The Dutch Study Centre (Nederlands Studie Centrum) not for nothing inNovember 1999 organises a congress titled “Movement of business activities from theurban area; advantage for the city and the firm”. The Dutch central government usespreceding information and trends to develop two spatial planning concepts: the completecity and corridors. The built and urbanised areas around cities are regarded as completecities and the development axes between the major cities are regarded as corridors. Themain goals of developing these concepts focuses on preventing for example ribbondevelopments along highways, counteracting the sub-urbanisation of firms and householdsfrom the central city, and reduce the contrast town-countryside.
3. Improving the behavioural location theory
IntroductionIn the first section, we describe that the used theoretical approach regards the location offirms as a decision-making process. This complex process can be simplified bydistinguishing between one to seven decision phases, but except from Louw (1996), in

11
theory little is known about the location decision process itself and the amount of decisionphases. Besides, advocates of the firm demography approach such as Van Wissen (1996)and Van Dijk, Pellenbarg, and Van Steen (1998) argue that the location decision processshould be more related to the five demographic components.
Section two illustrates that in practice firm migration research in the nineties ismore or less similar to the English location choice studies in the seventies. Most of thesestudies enumerate lists of geographical location factors, which regard the firm as a ‘blackbox’ and are mainly based on the question: why did you move or why did you choose thissite? We open this ‘black box’ by on the one hand dividing the location factors inorganisational, premise, and environmental factors. This connects with the remark ofTownroe (1971, page 5) that “by looking at locational choice…the internal and externalenvironment of a company at a point in time becomes important as a source of pressure onthe decision taken”. On the other hand we compare the location factors resulting inrelocations with location factors resulting in other location strategies (see nextsubsection).
We present a train of thought, which can be used to improve the behaviourallocation theory and stimulate the revitalisation of behavioural economic geography bycombining the criticism of what we know in theory and in practice. Section 3 thereforepresents a well-grounded motivation of the questions described in the questionnaire.
Attempts to improve the behavioural location theoryTownroe (1991) initiates the renewed interest in the behavioural location theory6. In theNetherlands, Louw (1996) is the first advocate for a revitalisation of this location theory.His dissertation focuses on incorporating the role of the premise in the location decisionprocess. Louw interviewed 40 recently moved office organisations personally. The mostimportant migration motives of Louw’s interviews are not surprisingly lack of space forexpansion, business organisational reasons, and the integration of settlements andpremises. We argue that the coupling of location factors (inclusive the premise) with thethree decision phases orientation, selection, and negotiation is the most innovative aspectof this dissertation7. Louw concludes that the use of the difference in three decision phasesis a useful tool to unravel the location choice process and the importance of businessinternal and external factors. Table 5 presents the main results of this coupling.
Table 5. Relative importance of location factors in three decision phases
Location factors Orientation Selection Negotiation TotalPremise 15,3 12,3 7,1 11,9Functional 19,4 18,4 7,1 16,1Technical 3,1 4,2 2,0 3,4
6 This paper argues the case for widening the perspectives used in the analysis of industrial locationdecisions to consider both procedural rationality and expressive rationality alongside the standardinstrumental view.7 These three phases are identical to the famous business management article of Mintzberg, et. al (1976)about the structure of unstructured decision making processes in Administrative Science Quarterly.

12
Financial 12,2 14,2 52,5 22,5Site/business area 43,9 36,0 12,1 32,3Remaining 6,1 14,6 19,2 13,8Total 100 100 100 100
Source: Louw, 1996, page 154.
The main conclusion of table 5 is that financial and spatial location factors determine morethan 55% of the outcome of the location decision. This paper elaborates on Louw’sapproach, but questions the existence of three decision phases and the usefulness of thedifference in the six presented groups of location factors. We argue that the followingstatement of Townroe (1971, page 6) is still relevant and useful for our topics in thequestionnaire: “the importance of the stages in the decision process have been discussedby other investigators.… But previous surveys have not looked closely at such questionsas the position in the company of the individual who undertook the search, how thecriteria for the final choice were established, who was consulted both within and outsidethe company, how long the search process took and then how long it was beforeproduction started in the new plant, what steps were taken for financial evaluation, etc.”.Besides, we argue that relating the five business-demographic components with locationdecisions and decision-making would also improve the behavioural location theory.
The goal of my dissertation not for nothing focuses on identifying the underlyingbusiness internal and external factors, which are being put forward in migration decisions.For example, the most important migration motive lack of space for expansion is theconsequence of other causal factors such as new product technology, marketdevelopments, workplace regulations and flexibility, and environmental policy. Anotherimportant migration motive insufficient accessibility during an in-depth interview in onefirm proved to be a consequence of changed transport methods and demands, the buildingof a housing area, the changed production system, and the demands of commutingemployees.
Preceding section implies that the questionnaire focuses on.(1) Analysing the six location strategies: relocation, junction, division, expansion on site,taking-over, and disposal.(2) Comparing the location factors related to the organisation, premise, and environmentfor all location strategies.(3) Unravelling the (re)location decision process.(4) Relating location strategies to the business life cycle.
Henceforth this paper, we will, in connection with the sending the new ‘business panelquestionnaire’ in June/July 1999, focus on presenting the preliminary results of thequestionnaire, which was send to mainly relocated firms in June 1999. We assume thatalmost every firm has made location strategies the last decade. This implies that thequestions can be send to all firms.4 The questionnaire

13
The research population of the questionnaireThe panel population in 1999 (total 3,116 firms) consists of three parts8.(1) The active firm population of 1,969 firms will be contacted in July 1999. These firmsare titled as active, because they contribute to at least one of the two most recentdistributed questionnaires.(2) The passive firm population of 189 firms contacted in June 1999. These firms are titledpassive, because they did not contribute to the two most recent distributed questionnaires.(3) The new firm population of 958 ‘registered’ relocated firms contacted in June 1999.These firms are collected with a rather pragmatic and cheap method9. First, we searchedthe names and addresses (with the help of Post Office service on the Internet (Error!Bookmark not defined.)) of the 517 electronically available newspaper article-archivescollected on the Internet about relocated firms. These newspaper articles were used forour paper at the ERSA Congress in Vienna august 1998 (for details see Pen andPellenbarg, 1999). The other 436 firms are collected by sending on the one hand, e-mailsto the larger municipalities in the Netherlands with a known Internet address. On the otherhand, we send faxes to 16 representatives of larger municipalities we met personally atDutch congresses concerning industrial location planning the past two years. In this e-mailor fax we simply asked these municipalities to send names and addresses of relocatedfirms. Most of the contacted municipalities appeared to be rather reserved in sendingnames and addresses of relocated firms. Besides, some of the municipalities did notregister relocations or referred to other organisations such as the province, the localChamber of Commerce or the local business club. We, therefore, received in most of thecases only between 5 to 10 firm names. All in all, this resulted in 436 names of relocatedfirms.
The response rateTable 6 describes the ‘response rate’ of the send 958 questionnaires to the new addresses.A wrong address means that (1) the address or the name of the firm is wrong, unknown orincomplete; (2) the firm has left; (3) the firm died or (4) the firm does not belong to themanufacturing or tertiary sector. The column co-operation simply means that therepresentative answered the questions and not that the firm has relocated.
Table 6. Response of the send 958 questionnaires (by 30-06-1999)
Wrong address No co-operation Co-operation No response (yet)Amount 25 8 52 873
Source: Own calculation.
8 These firms belong to the manufacturing sector and the tertiary sector.9 We could also have bought 1,000 addresses of firm migrations from the Chamber of Commerce, butrecent studies of Buck Consultants International (1997) and INBO Advisors (1999) after a labourintensive check up showed that more than 50% of these migrations appeared to be wrong.

14
No co-operation includes four firms who refused to co-operate without motivation. Thesefirms send the blank questionnaire in the return envelope. Besides, two other firms send anofficial letter to motivate their refusal. One ‘firm’ appeared to be a governmentalorganisation and one firm demanded 50 guilders to co-operate. Table 7 presents the’response rate’ of the send 189 ‘passive’ business panel firms in June 1999. The listedcolumns have the same meaning as the columns in table 6 and the firm who was notwilling to co-operate also send an official letter.
Table 7. Response of the send 189 questionnaires (by 29-06-1999)
Wrong address No co-operation Co-operation No response (yet)Amount 10 1 5 173
Source: Own calculation.
The questionnaireThe questionnaire consists of three parts: (1) Introducing questions, (2) underlying aspectsof relocation decisions, (3) phases of the decision-making process and additional questionsabout this process. Its main aim is to take stock of the real underlying location factors andthe most common amount of decision phases. Before presenting the main results, we haveto stress that due to the relatively low amount of received questionnaires no statisticalcalculations will be executed. This means that this paper will have a descriptive character.We only present some preliminary results to illustrate our train of thought and outlinepossible statistical calculations of our questionnaire in future.
(1) Introducing questions.The respondent should indicate if the firm since 1-01-1995 was involved in one of the sixlisted location strategies in table 8. This date is used, because we assume that respondentshave forgotten or misinterpret important details of the location strategy after more thanfour and a half years due to memory and information problems. In cases where the firmwas involved in more than one location strategy, the most recent strategy will be used forthe same reason. Finally, the column ‘none’ contains firms, which did not execute alocation strategy after 1-01-1995. The location strategies of the 57 co-operating firms arelisted in table 8.
Table 8. Location strategies of the responding firms (by 30-06-1999)
Relocation Junction Division Expansionon site
Taking-over Disposal None Total
Amount 30 2 2 5 1 1 16 57
Source: Own calculation.
In two cases, relocation was related to expansion on site and relocation was combinedwith disposal by one firm. One firm had to expand, because of the junction strategy.
The next part relates to the typical behavioural question of the involved businessinternal and business external decision-maker during the relocation decision.
15
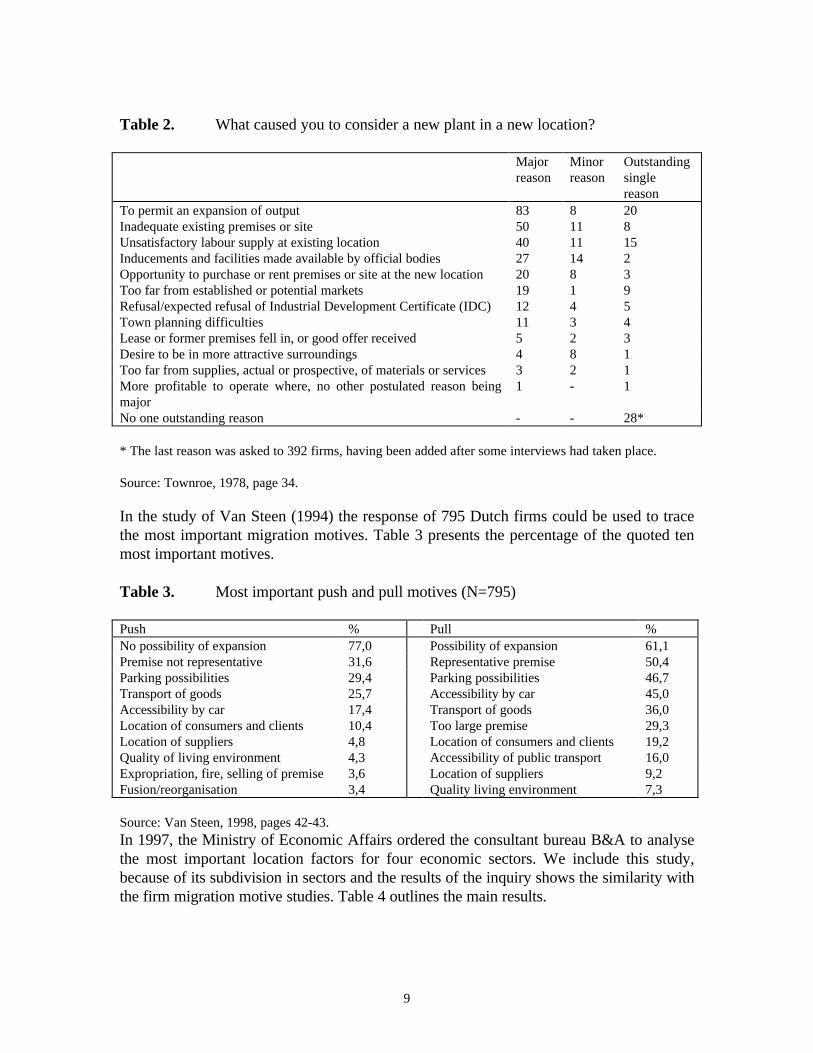
Due to the limitations of using a written questionnaire, we could only ask firmrepresentatives to indicate if the director personally, the board or the head-office executedthe decision to relocate. If we compare the quantity of decision-makers with the size of thefirm, we can estimate that a positive relation exists between the size of the firm and theamount of people involved in the relocation decision. We assume that precedingrelationship connects with the existence of a special commission or taskforce, which co-ordinates the relocation process. Besides, a special commission indicates that therelocation process is often complex and important. Finally, we test the assumption thatsmaller firms have less need for such special commissions.
Furthermore, the assistance of an external advisor shows that firms needknowledge and expertise from outside. Therefore, this question also confirms thecomplexity of the decision. Besides, we try to find out if a negative relation exists betweenthe size of the firm and hiring an external advisor. We assume that larger firms have moreknowledge and expertise and need less external assistance. On the contrary, one could alsoassume that a larger firm posses more financial means to hire an external advisor. Finally,it is noteworthy that all respondents answered the question: who decided to relocate. Onthe contrary, some respondents due to business economic secrecy and unaquaintance didnot answer the involvement of a special commission and especially the involvement of anexternal advisor. This is shown by a question mark in table 9.
Table 9. Involved actors in the relocation strategy (N = 30)
Who decided to relocate? Specialcommission
External advice
Directorpersonally
Board Director/ board
Share-holders
Head-office
Yes No ? Yes No ? Total
Relocate 18 10 1 1 10 18 2 8 12 10 30< 20 11 6 1 4 12 2 5 8 5 1820-50 5 1 6 1 4 1 650-200 2 3 1 6 2 4 6< 200
Source: Own calculation.
Table 9 indicates that the director personally is often responsible for relocations (60%) andespecially for the relocation decision in smaller firms (< 50 employees). The board of thefirm is not surprisingly more involved in the relocation decision of larger firms (> 50employees). This contrast with the findings of Townroe (1971, page 43), who describedthat “75% of the relocation were executed by the director”. It is noteworthy that allrespondents answered the question: who decided to relocate. On the contrary, two firmsfilled in a question mark for the occurrence of a special commission. According to us tenfirms did not answer due to mainly (business economic) secrecy the question of hiring anexternal advisor.
The table clearly shows that smaller firms (< 50) do not have a special commission toco-ordinate the relocation, but larger firms (> 50) noteworthy often install such acommission. Furthermore, there is no evidence that the firm size is connected with hiring

16
such an advisor. We argue that the answer of not hiring an external advisor by twelvefirms is striking.In practice due to the assumed complexity and lacking experience of firms with therelocation process, firms should always hire an external advisor. Preceding result may beexplained by the assumption that firms regard for example an architect, a remover, or aconstruction industry not as an external advisor.
(2) Underlying aspects of location decisions.On the basis of an extensive review of especially geographical (e.g. Ministry of EconomicAffairs, 1998; Pellenbarg, 1985; Van Steen, 1998; Louw, 1996, and Ebels, 1997), but alsobusiness management (e.g. Hickson et. al., 1986 and Pool, 1990) and economic literature(e.g. Brickley, 1997), we construct a list of underlying internal and external locationfactors influencing (re)location decisions. These location factors are divided into threegroups: (1) premise, (2) organisation, and (3) environment. The tables 10, 11, and 12 atfirst sight are except from the amount of location factors identical to the earlier presentedtables in section two. But, we argue that dividing the location factors into three groupsincluding strategic business economic processes slightly opens the ‘black box’ of therelocated firm. In the future, if all questionnaires will be sent and a minimum of 400returned we estimate (by using statistical techniques appropriate for a (grouped) ordinalscale) the relation between certain factors. Besides, the differences between the locationfactors of the six location strategies will be analysed and possibly clarify what makes arelocation or other location decision so particular.
For each table the respondents should indicate the importance of each factor on afour point ordinal scale: (-) unimportant (= 0), (+) slightly important (= 1), (++) important(= 2), and (+++) very important (= 3). Due to the limitations of using an ordinal scale,only the median for each location factor in the tables 10, 11, and 12 can be estimated.Furthermore, we assume that the mind of the representative of the firm thinks on acontinuous scale instead of a discrete scale. Wonnaccott en Wonnaccott (1990, page 32)define the median as “the middle observation or 50th percentile.... If the array consists of alarge number of observations grouped into cells, then the median can be approximated bycovering the appropriate distance across the median cell”. For example, suppose that 30%of the observations were accumulated to the left of the median cell. To get the median, wemust therefore pick up another 20% of the observations. Since the median cell includes32% of the observations, we move 20/32 of the way through it, starting at the boundaryand remember the cell width. The cell boundaries of the values in table 10, 11, and 12 arerespectively –0.5 - 0.5 (-), 0.5 – 1.5 (+), 1.5 – 2.5 (++), and 2.5 – 3.5 (+++). For examplethe calculation of the median of the relocation factor radiation in table 10 is as follows: 1.5(cell boundary column ‘+’) + 3.5/8*1 (cell width) = 1.9.
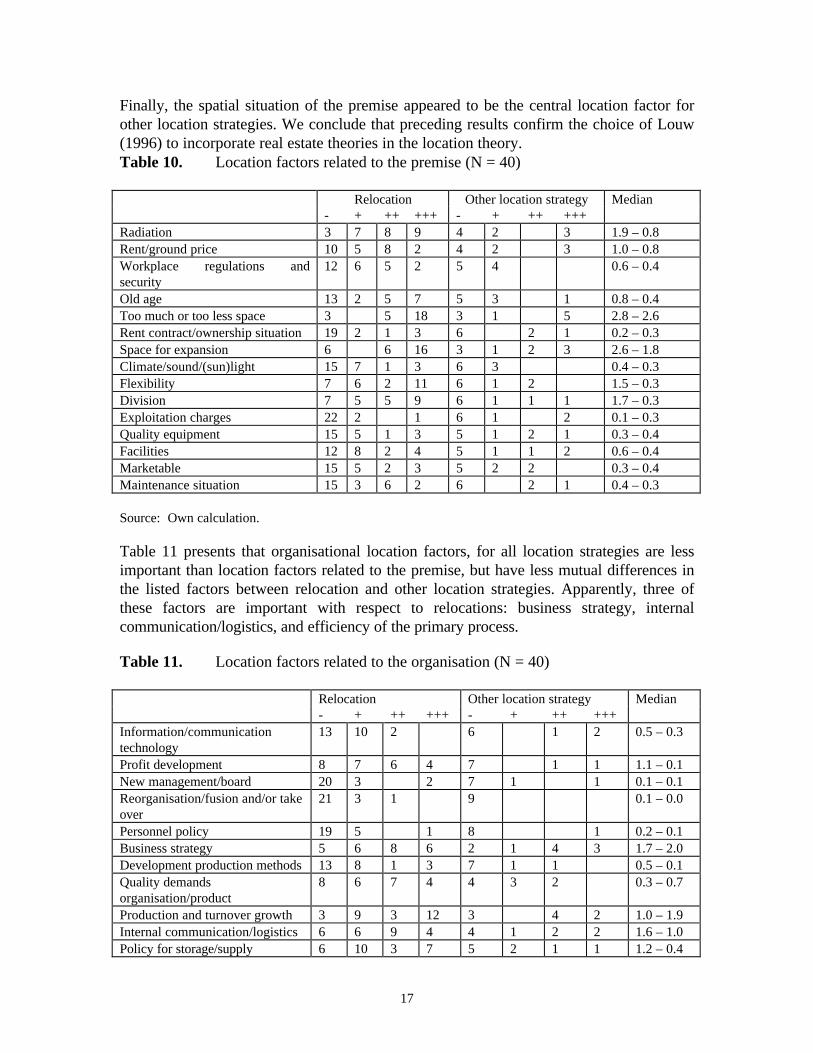
Table 10 shows that location factors related to the premise are more important forrelocations than other location strategies. Especially, the radiation, the space, the flexibilityand the division of the premise determine the decision to relocate with respect to thepremise. The relative unimportance of financial and calculating aspects such asrent/ground price, rent contract/ownership, exploitation charges, and marketability of thepremise is noteworthy, because of for example the conviction that financial grants andpolicies of governments can attract firms by lowering the price of these financial factors.
17
Finally, the spatial situation of the premise appeared to be the central location factor forother location strategies. We conclude that preceding results confirm the choice of Louw(1996) to incorporate real estate theories in the location theory.Table 10. Location factors related to the premise (N = 40)
Relocation Other location strategy Median- + ++ +++ - + ++ +++
Radiation 3 7 8 9 4 2 3 1.9 – 0.8Rent/ground price 10 5 8 2 4 2 3 1.0 – 0.8Workplace regulations andsecurity
12 6 5 2 5 4 0.6 – 0.4
Old age 13 2 5 7 5 3 1 0.8 – 0.4Too much or too less space 3 5 18 3 1 5 2.8 – 2.6Rent contract/ownership situation 19 2 1 3 6 2 1 0.2 – 0.3Space for expansion 6 6 16 3 1 2 3 2.6 – 1.8Climate/sound/(sun)light 15 7 1 3 6 3 0.4 – 0.3Flexibility 7 6 2 11 6 1 2 1.5 – 0.3Division 7 5 5 9 6 1 1 1 1.7 – 0.3Exploitation charges 22 2 1 6 1 2 0.1 – 0.3Quality equipment 15 5 1 3 5 1 2 1 0.3 – 0.4Facilities 12 8 2 4 5 1 1 2 0.6 – 0.4Marketable 15 5 2 3 5 2 2 0.3 – 0.4Maintenance situation 15 3 6 2 6 2 1 0.4 – 0.3
Source: Own calculation.
Table 11 presents that organisational location factors, for all location strategies are lessimportant than location factors related to the premise, but have less mutual differences inthe listed factors between relocation and other location strategies. Apparently, three ofthese factors are important with respect to relocations: business strategy, internalcommunication/logistics, and efficiency of the primary process.
Table 11. Location factors related to the organisation (N = 40)
Relocation Other location strategy Median- + ++ +++ - + ++ +++
Information/communicationtechnology
13 10 2 6 1 2 0.5 – 0.3
Profit development 8 7 6 4 7 1 1 1.1 – 0.1New management/board 20 3 2 7 1 1 0.1 – 0.1Reorganisation/fusion and/or takeover
21 3 1 9 0.1 – 0.0
Personnel policy 19 5 1 8 1 0.2 – 0.1Business strategy 5 6 8 6 2 1 4 3 1.7 – 2.0Development production methods 13 8 1 3 7 1 1 0.5 – 0.1Quality demandsorganisation/product
8 6 7 4 4 3 2 0.3 – 0.7
Production and turnover growth 3 9 3 12 3 4 2 1.0 – 1.9Internal communication/logistics 6 6 9 4 4 1 2 2 1.6 – 1.0Policy for storage/supply 6 10 3 7 5 2 1 1 1.2 – 0.4

18
Saving total business costs 11 4 6 5 6 1 1 1 1.0 – 0.3Subjective/personal goals 12 7 5 1 8 1 0.6 – 0.1Efficiency primary process 5 5 10 5 4 4 1 1.8 – 2.6Working and productionflexibility
8 11 2 4 4 2 1 2 0.9 – 0.8
Source: Own calculation.Related to relocation, the same counts for the other location strategies, except thatinternal communications/logistics is replaced by production and turnover growth andefficiency of the primary process is even more important. Furthermore, strategicorganisational changes such as a new board, reorganisations or take-overs are of minorimportance for all location strategies. Finally, partly due to the used questionnaire, thetypical behavioural factor ‘subjective and personal goals’ appeared to be relativelyunimportant. Finally, recent Dutch newspaper articles and directors of six relocated firmsstress the importance of personnel (policy), but so far table 11 (and also the regionallabour market in table 12) show no signs of this trend.
Table 12. Location factors related to the environment (N = 40)
Relocation Other location strategy Median- + ++ +++ - + ++ +++
Facilities loading/unloading 5 7 7 9 6 1 2 1.8 – 0.3Parking facilities 5 7 4 12 5 2 1 1 2.0 – 0.4Proximity inner city/provisions 16 5 2 2 7 1 1 0.3 – 0.1Commuting distance 16 4 2 3 7 1 1 0.3 – 0.1Criminality/security 18 4 2 1 7 1 1 0.2 – 0.1Accessibility 5 4 7 10 5 5 2.1 – 0.5Representative environment 3 8 7 9 4 1 2 2 1.9 – 1.0Environmental policy/-limitations
13 5 5 3 5 2 1 1 0.5 – 0.4
Inconvenience of/on environment 12 7 1 6 6 1 2 0.6 – 0.3Municipal development plan 17 5 2 3 8 1 1 0.3 – 0.1Distance to suppliers/clients 19 4 1 1 9 1 0.2 – 0.1Proximity transport terminal 21 3 1 9 0.1 – 0.0Regional labour market 18 6 1 8 1 0.2 – 0.1Quality housing and livingenvironment
17 3 5 7 2 0.2 – 0.1
International contacts 17 6 1 9 0.2 – 0.0Market interest location/premise 14 4 3 4 8 1 0.4 – 0.1
Source: Own calculation.
Table 12 describes that environmental location factors for relocations and especially forthe other location strategies are not so important as the assumed importance in thepresented studies in section two. Not surprisingly for the Netherlands, infrastructurefactors related to (un)loading, parking, and accessibility are most important. Furthermore,in the Dutch practice of planning industrial locations, concepts such as green and durablebusiness areas, business area management, and park management gain more interest. Thepopularity of such concepts result from the listed importance of a representative

19
environment. The result that only a representative environment may be important for otherlocation strategies, implies that government investments in the spatial economic structureshould always focus on maintenance and management of a representative environment anddeveloping the earlier mentioned concepts. The relative low score on the factors proximityto the inner city and the commuting distance illustrates the contrast between the Dutchfirm demands and the Dutch mobility policy (e.g. the so-called ABC-policy and VINEX-policy) of concentrating working as well as living conditions near urban areas. Finally, theassumed impact of international contacts due to the often cited impact of the globalisationprocess appeared to be rather unimportant.(3) Phases of the decision-making process and additional questions about this process.Louw (1996), following the ideas of Mintzberg et. al. (1976) argues that the locationdecision process consists of three phases and on the other hand Edwards (1983)subdivides seven location decision phases. Besides, for example Hayter (1997)distinguishes five phases and Townroe (1971) uses four phases. Therefore, we trace howmany phases the questioned relocated firms identify. First, we present a sequential list anda short description of all seven theoretically used decision-making phases.a) Identification: chances, problems and crises are the motives.b) Diagnosis: identification and formulation of the problems and starting the relocationprocess.c) Search: collecting information and evaluating reactions of concerned actors.d) Development: developing solutions and alternatives. This will lead to the planning ofcertain solution directions.e) Evaluation: comparing alternatives and solutions.f) Strategy: determining the strategy on the basis of earlier phases.g) Implementation: making the definite decision and starting the actual relocation.
The main problem of propounding such a difficult question in a written questionnaire isthat respondents are inclined to quickly confirm the seven decision phases. This impliesthat if we would use another sequence, respondents will confirm this sequence. Despitethese drawbacks, we combine the seven phases with the average duration per phase. Thiscombination will clarify the weight of each phase. Besides, we are interested in thedeviations with respect to the sequence and the amount of phases. Furthermore, by addingthe average duration (in months) of each decision phase, we argue that this will be anindication of the importance and complexity of the identified phase, no matter the earliermentioned criticism in this paragraph. The amount of phases corresponds with theappeared different types of phases. This means that for example the sequence F-A-C-F-Gcorresponds with four phases and the duration of phase F is just an addition of both twoF’s. The last row of table 13 indicates that for example phase G occurs in 22 of the 24relocations. Due to the complexity of the question, six of the 30 respondents were not ableto give a useful answer
Table 13. Average duration of phases decision making process of relocations(N = 24)
Phases A B C D E F G Duration

20
7 10.4+? 2.6 22.0 3.8 2.8 3.0 6.0 49,3+?6 2.5 7.0 9.0 7.3 4.5 9.0 6.5 45.85 5.0 2.3 4.8 1.0 3.0 1.3 4.8 22.24 4.8 4.0 2.8 1.0 2.0 2.2 16.83 5.3 3.0 3.0 1.0 2.3 14,72 0.01 0.0Total 17 20 17 18 14 18 22
Source: Own calculation.
Table 13 shows that a positive relation exists between the amount of phases and theduration of the relocation decision-making process. It is evident that there are no firms,which identified one or two decision-making phases. Besides, it is noteworthy that theduration of the decision-making process especially consumes a long time period if theprocess is divided in six or seven phases. The diagnosis and implementation phase occursmost of the time during a relocation process and the evaluation phase not surprisingly inleast of all the cases. Generally, the duration of the search phase took the largest timeperiod of the total decision-making process. This connects with the findings of Townroe(1971, page 59) who described that “the search phase of 34% of the relocated firmsexceeded twelve months”. Finally, the presented alphabetical sequence ABCDEFG is onlyconfirmed by 5 of the 24 relocated firms. We, therefore, conclude that the presentedsequence only has a limited impact on the results.
The most difficult task for the respondents focuses on indicating which of the fivegroups location factors are important during each of the identified phases. We construct asimilar challenging table as Louw (1996, page 154), with the exception of five groups oflocation factors instead of three groups of location factors. These five groups are logicallythe three groups of the tables 9, 10, and 11 and also personal considerations andgovernment policy and rules (see Townroe, 1971, chapter 7). Personal considerations areadded because of the assumed behavioural subjectivity of decision-makers, although weacknowledge that a written questionnaire is not the most suitable instrument to test thisassumption. Finally, Pen and Pellenbarg (1999) conclude that government policy and rulesare important with respect to firm migration in the Netherlands. We, therefore, askourselves how this factor relates to the other groups and at which phase this factor isimportant. Related to the core tasks of the government, table 12 should indicate that thisfactor is most important in the search and implementation phase.
The respondents have to indicate for each identified phase if the listed groups offive location factors are not important (= 0), important (= 1) or very important (= 2). Theresults are presented in table 14. The figures in table 14 represent the average value of allscores per cell. This means that the first cell is an average of all the premise scores firmrepresentatives identified if they selected phase A. Due to the complexity of this topic,only 16 relocated firms answered this question. Besides, the reader should acknowledgethat some of the 16 firms only valued location factors, which were important/relevant. Theresults in table 14, therefore, show an upward tendency.
21
Table 14. The importance of groups of location factors during decision-makingphases (N = 16)
A B C D E F GPremise 1.3 1.0 1.3 1.2 1.3 1.5 1.7Organisation 1.0 1.1 0.6 1.3 1.3 1.3 1.4Environment 0.8 0.8 1.4 1.2 1.3 1.3 1.4Personal 0.8 0.8 0.7 1.0 1.1 1.0 1.1Government 0.4 0.2 0.8 0.5 0.9 0.8 0.7
Source: Own calculation.
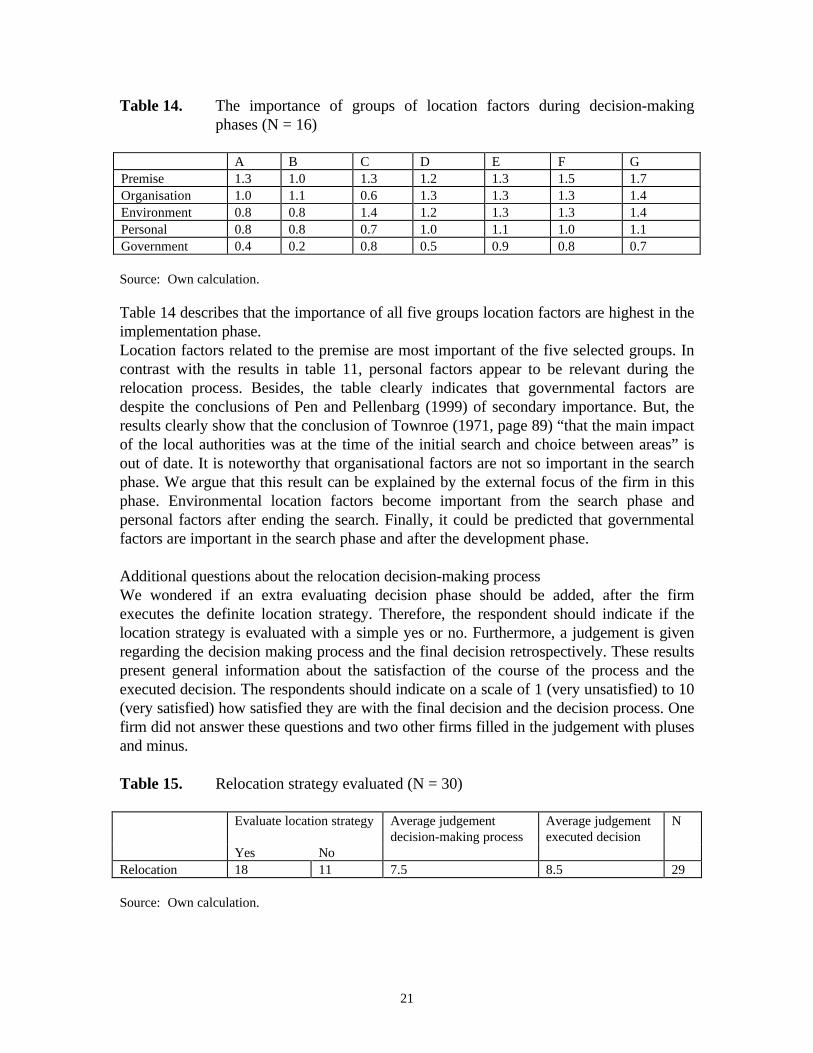
Table 14 describes that the importance of all five groups location factors are highest in theimplementation phase.Location factors related to the premise are most important of the five selected groups. Incontrast with the results in table 11, personal factors appear to be relevant during therelocation process. Besides, the table clearly indicates that governmental factors aredespite the conclusions of Pen and Pellenbarg (1999) of secondary importance. But, theresults clearly show that the conclusion of Townroe (1971, page 89) “that the main impactof the local authorities was at the time of the initial search and choice between areas” isout of date. It is noteworthy that organisational factors are not so important in the searchphase. We argue that this result can be explained by the external focus of the firm in thisphase. Environmental location factors become important from the search phase andpersonal factors after ending the search. Finally, it could be predicted that governmentalfactors are important in the search phase and after the development phase.
Additional questions about the relocation decision-making processWe wondered if an extra evaluating decision phase should be added, after the firmexecutes the definite location strategy. Therefore, the respondent should indicate if thelocation strategy is evaluated with a simple yes or no. Furthermore, a judgement is givenregarding the decision making process and the final decision retrospectively. These resultspresent general information about the satisfaction of the course of the process and theexecuted decision. The respondents should indicate on a scale of 1 (very unsatisfied) to 10(very satisfied) how satisfied they are with the final decision and the decision process. Onefirm did not answer these questions and two other firms filled in the judgement with plusesand minus.
Table 15. Relocation strategy evaluated (N = 30)
Evaluate location strategy Average judgementdecision-making process
Average judgementexecuted decision
N
Yes NoRelocation 18 11 7.5 8.5 29
Source: Own calculation.

22
More than 60% of the relocated firms evaluated their location strategy. This resultcontrasts with the notion that relocations are too complex and strategic to be evaluated.We, therefore, cautiously recommend that a phase H ‘ex post evaluation’ should be addedto the presented seven theoretical decision-making phases on page 17. Besides, it isexceptional that the 27 firms who filled in their judgement are so positive about therelocation (process). The actual economic growth in the Netherlands and the confidence inthe Dutch economy may influence this result. Table 15 also shows that firms regard thedecision to relocate as a ‘wise’ decision, but they are not wholly satisfied with thedecision-making process.
Furthermore, we examine if a relationship exists between the average duration ofthe decision making process and the appearance of an additional evaluative stage. Theduration of the process is also related to the judgement about the process and the executeddecision. We predicted that there is a negative relation between the duration and thejudgement of the process and the final decision.
Table 16. Relation between the evaluated relocation strategy and its duration (N=24)
Duration relocation strategy< 1 year 1-2 years 2-3 years < 3 years Total
Evaluation 2 7 1 5 15No evaluation 3 5 1 9Average judgement decision-makingprocess
8 7 7 6.8
Average judgement executed decision 8.6 8.2 9.0 8.9Total 5 12 1 6 24
Source: Own calculation.
Table 16 presents three interesting results:1. The duration of most of the relocations is longer than one year;2. If the duration of the relocation process exceeds two years, there is a sharp increase of
the need to evaluate this strategy;3. Apparently, a small negative relation exists between the duration of the process and
the judgement of the decision-making process.
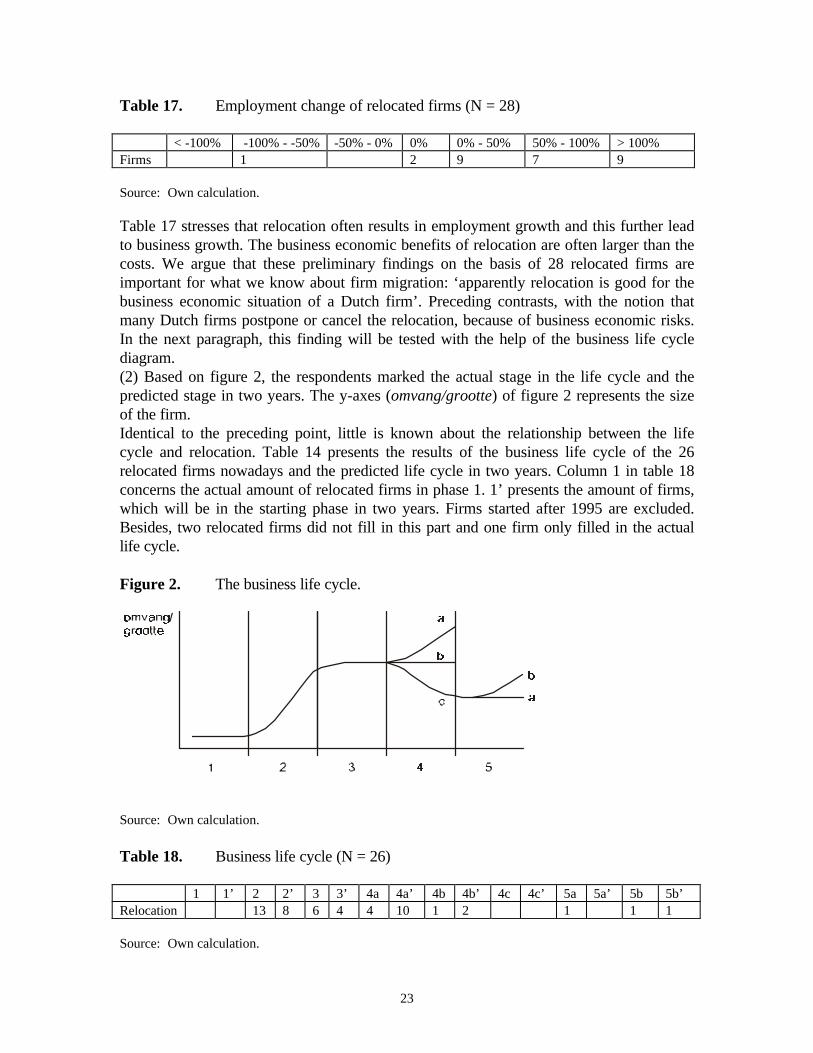
Section one describes the importance of integrating the demography of firm approach andbehavioural economic geography. One of the main results of this integration is thegenerally accepted conclusion that relocating firms are small and fast growing firms. Weexamine the growth of firms on the basis of two commonly used indicators: (1) thedevelopment of the amount of employees (table 17); (2) the actual life cycle of the firmand the life cycle of the firm in two years (table 18).(1) We have little information about the relationship between the development ofemployees and relocation. Table 17 examines this relationship by describing the differencein the amount of employees in 1995 and 1999 of the relocated firm. Firms started after1995 are not included.
23
Table 17. Employment change of relocated firms (N = 28)
< -100% -100% - -50% -50% - 0% 0% 0% - 50% 50% - 100% > 100%Firms 1 2 9 7 9
Source: Own calculation.
Table 17 stresses that relocation often results in employment growth and this further leadto business growth. The business economic benefits of relocation are often larger than thecosts. We argue that these preliminary findings on the basis of 28 relocated firms areimportant for what we know about firm migration: ‘apparently relocation is good for thebusiness economic situation of a Dutch firm’. Preceding contrasts, with the notion thatmany Dutch firms postpone or cancel the relocation, because of business economic risks.In the next paragraph, this finding will be tested with the help of the business life cyclediagram.(2) Based on figure 2, the respondents marked the actual stage in the life cycle and thepredicted stage in two years. The y-axes (omvang/grootte) of figure 2 represents the sizeof the firm.Identical to the preceding point, little is known about the relationship between the lifecycle and relocation. Table 14 presents the results of the business life cycle of the 26relocated firms nowadays and the predicted life cycle in two years. Column 1 in table 18concerns the actual amount of relocated firms in phase 1. 1’ presents the amount of firms,which will be in the starting phase in two years. Firms started after 1995 are excluded.Besides, two relocated firms did not fill in this part and one firm only filled in the actuallife cycle.
Figure 2. The business life cycle.
Source: Own calculation.
Table 18. Business life cycle (N = 26)
1 1’ 2 2’ 3 3’ 4a 4a’ 4b 4b’ 4c 4c’ 5a 5a’ 5b 5b’Relocation 13 8 6 4 4 10 1 2 1 1 1
Source: Own calculation.

24
Table 18 illustrates that 17 of the 26 relocated firms are in a growth phase and 7 of the 26relocated firms have a stable situation. 18 of the 25 relocated firms predict that in twoyears the firms will be in a growth phase and 6 of the 25 relocated firms will be in a stablesituation. We conclude on the one hand that relocated firms are often growing firms andon the other hand that relocation has a positive impact on the business economic situationof a firm. This partly explains why a positive relation exists between economic growth andthe amount of firm migration.
5. Conclusions
My dissertation and this related paper focus on clarifying the strategic decision-makingprocess on relocations. The first section of the paper describes that the so-calledbehavioural location theory inspired by the ideas of Cyert and March (1961) and Simon(1956) and later Pred (1967; 1969) and Townroe (1971), connects with our research aims.It is generally accepted that the decision-making process can best be analysed bydistinguishing certain phases. One of the problems however is the absent agreement on themost common amount of decision phases.Another main problem of our used theoretical perspective is the statement that the firm ismainly regarded as a ‘black box’, where our interest stops at the factory gate. Precedingresults in the main aims of our questionnaire: (1) analysing the decision-making process,(2) slightly opening the ‘black box’. Furthermore, the end of section one describes that weshould also try to combine and relate the firm demographic events with location decisionsand relocations in particular.
Section two shows that the practical dimension of this type of behavioural researchfocuses on improving the planning of industrial locations. Dutch firms are for exampleespecially interested in business areas located near highways and not too far from urbanareas. The Dutch central government used this information to develop two new spatialpolicy concepts: the complete city and corridors. Besides, it is shown that the mobility offirms in terms of numbers of firms is much less important than the much more debatedissue of new firm formation. The underlying reasons of these firm movements are oftendivided in push and pull factors. Since the fifties hundreds of migration studies wereexecuted and they often stressed the importance of two location factors: lack of space forexpansion and accessibility.
Before describing the questioned topics, we first motivate why these topics areincluded in the questionnaire. Especially the ideas of Townroe (1971) and Louw (1996)inspired us to divide the location factors in internal, premise and external determinants.Furthermore, the dissertation of Louw (1996) underlines the usefulness of dividing arelocation decision in phases and relate this with the preceding three groups ofdeterminants. This last theoretical section also stresses that we distinguish six locationstrategies for two reasons: (1) analyse the difference between relocation and other locationstrategies, (2) enlarge the response of our research population of 3,116 questionnaires.
The results in this paper relate to 1,147 questionnaires, which were send 21 June 1999.By June 30, this resulted in 30 received questionnaires about relocations and 11 receivedquestionnaires about other location strategies. In this conclusion, we only describe the
25
most important preliminary results for the three parts of the questionnaire: (1)introduction, (2) underlying aspects of location decisions, (3) phases of the decisionmaking process and additional questions.(1) The director personally is involved in 60% of the relocation decisions, and this appears
especially the case for relocations of smaller firms. The board is more involved inmigration of larger firms and furthermore these firms often install a special commissionto co-ordinate the process.
(2) Tables 10, 11, and 12 show that location factors related to the premise are moreimportant for relocations than for other location strategies. Furthermore, these premisefactors are with respect to the other two group location factors also the mostimportant group of migration motives. Finally, the main migration determinants of allthree groups are: radiation, space, flexibility, and the division of the premise (I),business strategy, internal communication/logistics, and efficiency of the primaryprocess (II), (un)loading facilities, parking, accessibility and a representativeenvironment (III).
(3) All firms identified a minimum of three decision phases and besides that it was evidentthat the duration of the decision-making process is positively related to the amount ofdecision phases. The duration of the search phase appeared to consume the largest part of the process.Furthermore, the conclusion that personal factors despite using a written questionnairealmost have the same importance as the other three groups of location factorsconfirms our used behavioural perspective.
Table 15 illustrates that we should add an evaluative phase after the execution ofthe relocation. The same table also shows a noteworthy high judgement about the finaldecision and the decision-making process. Besides, it was shown that the duration ofrelocation exceeded one year and a slight negative relation exists between the durationof the process and the judgement. Finally, the tables 17 and 18 evidently show thatrelocated firms are often growing firms and relocation has a positive impact on thebusiness economic situation of a firm.
References
Brickley, J A, C W Smith, J L Zimmerman, 1997, Managerial Economics and OrganizationalArchitecture, Chicago (Irwin).
Buck Consultants International (BCI), 1997, Locatievoorkeuren recent verhuisde bedrijven, Nijmegen(BCI).
Cooper, M J M, 1975, The industrial location decision making process, Birmingham (Centre for urbanand regional studies University of Birmingham).
Cyert, R M, J G March, 1961, A behavioral theory of the firm, New Jersey (Prentice-Hall inc.).
Dicken, P, P E Lloyd, 1990, Location in space; theoretical perspectives in economic geography, NewYork (Harper Collins publishing).
26
Dijk, J van, P H Pellenbarg, P J M van Steen, 1998, Determinants of firm migration in theNetherlands;
an exercise in the demography of firms approach, Paper presented at the 45th North AmericanMeetings of the RSA, 11-14 November, Santa Fé, New Mexico, USA.
Ebels, H J, 1997, Oudere stadsdelen en de ruimtelijke effecten van bedrijfsverplaatsingen,Amsterdam
(Universiteit van Amsterdam (AME)).
Edwards, L, 1983, Towards a process model of office-location decision making. In: Environment &Planning A, 15, pages 1327-1342.
Hayter, R, 1997, The dynamics of industrial location; the factory, the firm and the productionsystem, Cichester (John Wiley & Sons).
Hickson, D J, et.al., 1986, Top decisions; strategic decision making in organizations, Oxford (BasilBlackwell).
Katona, G, J N Morgan, 1952, The quantitative study of factors determining business decisions. In:Quarterly journal of economics, 66, pages 67-90.
Keeble, D, 1977, Industrial location and planning in the United Kingdom, London (Methuen).
Kemper, J, P H Pellenbarg, 1997, De Randstad als hogedrukpan. In: Economisch Statistische Berichten,82, pages 508-512.
Kirkham, J D, H D Watts, 1998, Multi-locational manufacturing organizations and plant closures inurban
areas. In: Urban Studies, 35, pages 1559-1575.
Lambooy, J G, E Wever, O A L C Atzema, 1997, Ruimtelijke Economische Dynamiek, Bussum(Coutinho).
Louw, E ,1996, Kantoorgebouw en vestigingsplaats; Een geografisch onderzoek naar de rol vanhuisvesting bij locatiebeslissingen van kantoorhoudende organisaties, Delft (DelftseUniversitaire Pers).
Ministry of Economic Affairs, 1998, Ruimte voor economische dynamiek, Den Haag (Ministry ofEconomic Affairs).
Mintzberg, H, D Raisinghani, A Theoret, 1976, The structure of unstructured decisions processes.In: Administrative Science quarterly, 21, pages 246-275.
Molle, W T M, 1977, Industrial mobility – A review of empirical studies and an analysis of the migrationof industry from the city of Amsterdam. In: Regional Studies, 11, pages 323-335.
North, D J, 1974, The process of locational change in different manufacturing organizations. In: Spatialperspectives on industrial organisation and decision-making (ed. F E I Hamilton), London(John Wiley & Sons).
Pater, B de, H van der Wusten, 1996, Het geografisch huis; de opbouw van een wetenschap, Bussum(Coutinho).
Pellenbarg, P H, 1985, Bedrijfsrelokatie en ruimtelijke kognitie, Groningen (Geografisch Instituut).
27
Pellenbarg, P H, 1998, A system to identify local industrial development potentials. In: EuropeanPlanning Studies, 6, pages 141-165.
Pen, C J, P H Pellenbarg, 1998, Firm migrations, theory and practice; an analysis of empirical studiesconcerning the impact of government policies, Paper presented at the Conference at theUniversity of Lodz, about industrial restructuring on 26 to 27 March 1999 in Lodz.
Pool, J, 1990, Sturing van strategische besluitvorming; mogelijkheden en grenzen, Amsterdam (VUUitgeverij).
Pred, A, 1969; 1971 Behavior and location Part I and II, Lund (University of Lund).
Romo, F P, M Schwartz, 1995, The structural embededdness of business decisions; the migration ofmanufacturing plants in New York State, 1960-1985. In: American Sociological Review, 60,pages 874-907.
Schutjens, V A J M, R van Kempen, B Wiendels, 1998, Werk-geïnduceerde migratie over langeafstand: een vooronderzoek, Utrecht (Urban research Center University of Utrecht).
Soderman, S, 1975, Industrial location planning, Stockholm (Almqvist & Wicksell International).
Spanger, U, P Treuner, 1976, Standortwahl der Industriebetriebe in Nordrhein-Westfalen 1955-1971,Dordmund (Institut fuer Landes- und Stadtentwicklungsforschung des Landes Nordrhein-Westfalen.
Stafford, H A, 1969, An industrial location decision model. In: Proceedings of American Geographers,1
pages 141-145.
Steen, P J M van, 1998, Bedrijvenlandschap 2000+; Bedrijfsverplaatsingen en de vraag naarbedrijfslocaties in Nederland, Groningen (Faculteit der Ruimtelijke Wetenschappen).
Townroe, P M, 1971, Industrial location decisions; a study in management behaviour, Birmingham(Centre for urban and regional studies University of Birmingham).
Townroe, P M, 1978, Industrial movement; experience in the US and the UK, Kettering (DavidGreen).
Townroe, P M, 1991, Rationality of the industrial location decision. In: Urban Studies, 28,pages 383-392.
Wissen, L van, 1996, Ontwikkeling van bedrijven onderwerp van demografische studie. In: DEMOS, 8,pages 69-72.
Wonnaccott, T H, R J Wonnaccott, 1990, Introductory statistics, Toronto (John Wiley & Sons).


![Behavioural Game Theory: Thinking, Learning and Teachingauthors.library.caltech.edu/22240/2/Ch08Pg_119-179[1].pdf · 120 Behavioural Game Theory: Thinking/Learning/Teaching this way,](https://img.dokumen.tips/doc/110x75/5f07ea227e708231d41f648b/behavioural-game-theory-thinking-learning-and-1pdf-120-behavioural-game-theory.jpg)