Embed Size (px)
Citation preview

Improving the Arbuthnott Formula A consultation document on refining the resource allocation formula for NHSScotland
NHSScotland Resource Allocation Committee


CONTENTS Page
1. Introduction 2
2. Background 4
3. The NHSScotland Resource Allocation Committee 5
4. Overview of current resource allocation methods 7
5. Overview of research programme 13
6. Reviewing the population basis 17
7. Reviewing the age-sex cost weights 22
8.
Reviewing the adjustment for healthcare needs due to morbidity and life circumstances 29
9.
Reviewing the adjustment for excess costs of supplying healthcare services 38
10. Other resource allocation issues 47
11. Feedback 52
References and Links
Annex 1 Committee Membership
Annex 2 NRAC Core Criteria
Annex 3 Care Programmes and diagnostic groups
Annex 4 NHS Budgets and method of distribution
Annex 5 Glossary of acronyms
Annex 6 Consultation Questions
Annex 7 Respondent Information Form
1

1. Introduction 1. In 2005-06, the NHS budget in Scotland stood at £8.8 billion. It is crucial that these resources are distributed fairly across Scotland to help NHS Boards meet the challenges they face. That means taking account of many factors that influence need in particular areas. 2. A large proportion of this money was allocated using a method commonly known as the Arbuthnott Formula. It is named after Professor Sir John Arbuthnott, the then principal and vice-chancellor of Strathclyde University, who led a review of resource allocation in NHSScotland from 1997-2000. 3. The Arbuthnott Formula is a population-based formula that gives extra weight to certain factors such as the number of older people in particular areas, levels of deprivation and additional costs of providing services in rural and remote areas. It is designed to provide greater resources to areas of greater need. Since 2000, it has been used to distribute funding to NHS Boards for Hospital and Community Health Services and GP prescribing, which together account for around 70% of the total budget. 4. Following the introduction of the Formula, some additional work was carried out to take forward areas that had not been covered by the original review. In 2005, the NHSScotland Resource Allocation Committee (NRAC) was established to recommend how it could be refined further to improve the way resources are distributed across the health service. 5. This report explains the work of the committee to date and sets out draft options and recommendations for change. It is being issued for consultation to gather as many views as possible on the current proposals before final recommendations are made to Ministers in the summer of 2007. A fully functioning formula has not been produced at this stage and therefore it is not possible in this report to demonstrate the impact that these recommendations could have on Boards’ overall shares. Instead, each of the components has been reviewed separately and NRAC is looking for feedback now on the separate components before these are fitted together into a full formula after the consultation. 6. Resource allocation is a complex and highly technical business. NRAC has deliberately tried to make this report as straightforward as possible to ensure that the issues under consideration can be clearly understood. However a series of technical reports has been published in conjunction with this report, and these include the detailed research findings on which the recommendations are based. 7. The way resources are distributed in NHSScotland affects everyone, wherever they live and whatever their particular level of need. NRAC would like to hear views on this report from as many people as possible to help
2

inform its work and ensure that the final recommendations are as robust as they can be. 8. A feedback form has been included at the back of this report to allow views to be returned on the options and recommendations described here. Please return your responses by Friday 29th September 2006. Details on how to feedback your views are given in Chapter 11. In addition, three regional workshops have been arranged during the consultation period targeted at NHS Boards. For further details please see (www.nrac.scot.nhs.uk/consultation.htm).
3

2. Background 9. In public services, it has long been recognised that an objective and transparent system is needed when limited resources are shared out among service providers. The aim is to ensure equity among those receiving funds and provide a logical framework for decision making. 10. The SHARE (Scottish Health Authorities Revenue Equalisation) formula, introduced in 1977, was the first concerted attempt in the Scottish health service to distribute resources based on estimations of relative need. Twenty years after SHARE was first implemented, a rigorous review began to develop a more sophisticated and sensitive approach to resource allocation in Scotland. The National Review of Resource Allocation for the NHS in Scotland (NRRA), chaired by Professor Sir John Arbuthnott, published a consultation document Fair Shares for All in 1999 that set out proposals for a new formula. A final report was published in 2000 following consideration of the consultation responses and further work to improve the proposals. 11. The Formula that was adopted gave greater weight in allocating resources to the influence of deprivation and remoteness than had previously been the case. It was immediately accepted by Ministers and used for the first time in 2001-02. 12. The new Formula was kept under review by a Standing Committee for Resource Allocation (SCRA) that was set up shortly after implementation. It addressed a range of outstanding issues and was disbanded in 2003. 13. A continuing commitment to monitoring the Formula to ensure it remains up to date and in tune with the aims of the Scottish Executive led to the establishment of the NRAC in 2005, chaired by Dr. Karen Facey, a health policy consultant and non executive director of Forth Valley NHS Board. Committee members were selected by the public appointments system, and have been supported by officials from the Scottish Executive Health Department (see Annex 1).
4

3. NHSScotland Resource Allocation Committee 3.1 Aims and Objectives 14. The aims and objectives of the committee are to:
• improve and refine the Arbuthnott Formula for resource allocation for NHSScotland;
• keep under review the information available to support existing elements of the Formula and consider the inclusion of new data (e.g. ethnicity);
• advise on possible formulaic approaches to the parts of health expenditure not currently covered by the Formula (e.g. primary care dental, pharmaceutical and ophthalmic services); and
• consider adjustments to the Formula in the light of the pilot exercises for unmet need.
15. NRAC is committed to ensuring openness and transparency in all its work. That includes consulting with the NHS and explaining the rationale behind its recommendations in a language that is easily accessible. 16. One of the first tasks of the Committee was to agree a set of core criteria on which to base judgements about different options for change. The criteria that were chosen are a slightly modified version of those used by the earlier Arbuthnott Review (See Annex 2). 3.2 Work programme 17. The committee identified the need to gather knowledge and information on a wide range of relevant issues. These have included:
• how the current Formula has been implemented and how it has been perceived since its introduction;
• how the Formula fits into the wider picture of what the Scottish Executive allocates funds for and how that is achieved;
• what progress had been made with outstanding resource allocation issues, such as primary care funding and unmet need;
• how current and future policies for NHSScotland could have an impact on resource allocation;
• how other relevant resource allocation formulae operate, for example within the other countries of the U.K. and for other public sector services.
18. The first priority for the Committee was gathering information. A series of visits was made to NHS Boards in the summer and autumn of 2005. These were attended by NRAC members and Board representatives. They were designed to give an overview of the Committee’s plans and to find out the Boards’ views about current resource allocation and how it might be improved. Thirteen NHS Boards accepted the offer of a visit and 11 were visited (NHS Argyll and Clyde, NHS Ayrshire and Arran, NHS Borders, NHS
5

Forth Valley, NHS Grampian, NHS Greater Glasgow, NHS Highland, NHS Lanarkshire, NHS Lothian, NHS Orkney and NHS Shetland.) NHS Tayside raised issues that were outside the NRAC remit and received a response in writing. NHS Western Isles requested a meeting late in the year but, unfortunately, a suitable date could not be arranged. 19. A note recording the issues raised, the criteria for a successful resource allocation formula and any follow up actions was agreed with each Board. Boards were also asked to provide any written factual evidence in support of the views they had raised.
20. The Committee also made contact with a number of researchers and healthcare professionals working on relevant issues such as deprivation, remote healthcare delivery, service delivery and health economics. Many have attended NRAC meetings to discuss their work and a summary appears on the NRAC website. 21. These discussions helped the Committee to map out a programme of research to examine specific issues and produce proposals for consultation. This programme of research is explained in chapter 5 and in more detail in subsequent chapters. 22. The options and recommendations contained in this report are the outcome of this research programme in which each component of the Formula has been reviewed and reported separately. The recommendations are not necessarily the Committee’s settled view on these issues at the moment but are being issued to generate feedback on the separate components that would make up a new formula before they are fitted together. The feedback will influence the final recommendations that NRAC will make for a new formula. 23. As part of its commitment to openness, the Committee set up its own website www.nrac.scot.nhs.uk. This gives information on the Committee members and structure, its plans, the results of the research programme and other relevant issues.
6

4. Overview of Current Resource Allocation Methods 4.1 Funding NHS Scotland 24. In 2005-06, of the total budget of £8.8 billion, the Scottish Executive Health Department provided £7.55 billion to Scotland’s geographical NHS Boards to pay for running hospital, community and primary care services in their areas as well as improving the health of the population. In addition, £760 million was allocated to Special Health Boards, such as NHS Quality Improvement Scotland and NHS Health Scotland, and £500 million went on other funding (Table 1). Table 1 Breakdown of NHSScotland budgets for 2005-61
Health Budgets £ 000
Resource Revenue General Allocation
6,014.4 Unified Budget
Primary Medical Services2 649.8
Pharmaceutical Services 125.4
General Dental Services 253.6
Primary Care Services3
General Ophthalmic Services
50.8
Capital Investment 457.5
Special Health Boards 759.2
Other Funding 503.2
Total 8,813.9
1 Scottish Executive Draft Budget 2006-7 and Scotland’s Budget Documents 2006-07: Budget (Scotland)(No.3) Bill Supporting Document. 2 Formerly known as General Medical Services (GMS). 3 Formerly known as Family Health Services (FHS).
25. The resource revenue general allocation includes the cost of providing hospital and community health services (HCHS) and general practice prescribing (GP Prescribing). These funds are currently allocated on the basis of the Arbuthnott Formula. At the end of the financial year Boards report their expenditure on HCHS within a number of care programmes:
• cost of acute hospital care • care of the elderly • mental illness
7

• learning disabilities • maternity • community services.
26. GP Prescribing includes the cost of drugs prescribed within general practice and dispensed at community pharmacies and by dispensing doctors.
27. Figure 1 shows that almost half of the expenditure within the general allocation is spent on acute hospital services, with prescribing accounting for around 17% of total expenditure.
Figure 1. Summary of care programmes expenditure 2004-5
Acute47.9%
Care of the Elderly4.4%
Learning Disabilities4.7%
Mental Illness10.5%
Maternity3.4%
Community12.4%
GP Prescribing16.8%
Notes to Figure Source: Scottish Health Service Cost Book 2004-5, the latest published figures. Care programmes names as they were named in the Arbuthnott Review. NRAC will review these at a later stage. 28. Primary Medical Services cover the new contract for General Medical Services (GMS), and other services provided or negotiated by NHS Boards under the Primary Medical Services (Scotland) Act 2004. There are separate allocation mechanisms for these funds, including the Scottish Allocation Formula which is used to remunerate practices for essential and additional services. This formula is not being reviewed by NRAC since it is being considered within a separate UK-wide review process on a different timescale. 29. Primary Care Services were formerly known as Family Health Services and cover pharmaceutical, dental and ophthalmic services. Currently these funds are not allocated using a funding formula but Boards are given indicative allocations based on their historic spend which is uplifted each year.
8

SCRA, the predecessor to NRAC, initiated research into allocation formulae for these services and this is discussed further in section 10.2. 30. Capital funding is allocated using a variation of the Arbuthnott Formula with 90% of the capital budget distributed in line with Arbuthnott shares, adjusted for cross-border flows. The remaining 10% is distributed among the four main tertiary centres based on their share of regional specialty flow. Changes to the Formula will therefore impact on capital funding and NRAC will address this in their final recommendations. 31. The Other Funding listed in Table 1 covers a wide range of services including nurse education and training, some health improvement initiatives and research support, not all of which are allocated to the territorial Boards. The funds for these services are allocated by a variety of means including Arbuthnott and other formulae and on the basis of bids. NRAC has reviewed the allocation of some of these funds and this is described in section 10.1. 4.2 Allocating funds using the Arbuthnott Formula 32. Currently around 70% of funds for NHSScotland are allocated to Boards on the basis of the Arbuthnott Formula. It is used to calculate the relative shares of the budget among the Boards rather than the final allocated sums which depend on the size of the total NHS budget. 33. The Arbuthnott Formula is a weighted capitation formula – it is based on the size of population in each NHS Board area (capitation), with special weight given to factors that seek to adjust for the relative need for healthcare funding among the population. A simple unweighted capitation method would, for example, give a Board with 10% of the Scottish population, 10% of the funds. The Arbuthnott Formula starts with these unweighted population shares and then weights them using three indices that adjust for relative needs and the relative cost of supplying services as shown in Figure 2 below.
Figure 2 The Arbuthnott Formula
34. The three indices are: • Age-sex cost weights – these take account of the differing need for
healthcare across different age groups and between males and females. In
Relative need due to
age and sex profile
Relative need due to
morbidity and life
circumstances
Relative cost of providing services in
remote areas × × × ═
ArbuthnottWeighted
Share %
Excess Costs of Supply Population
Age-Sex Cost Weights
Morbidity & Life Circumstances
Crude Board
population share
%
9

general, older age groups have a greater need for healthcare and therefore this index gives greater weight to Boards with older populations.
• Morbidity and life circumstances – this takes into account factors that
affect the need for healthcare in addition to age and sex. In general, people who are less healthy and more deprived have a greater need for healthcare so this index gives more weight to Boards with higher premature death rates and greater socioeconomic deprivation.
• Excess costs of supply - this takes account of the unavoidable cost of
supplying health services in remote and rural areas where hospitals and clinics serve smaller populations and where dispersed populations mean greater travelling distances for staff and patients. This index gives greater weight to Boards with more sparsely distributed populations.
The resulting weighted share, sometimes called the Arbuthnott-weighted population, is then applied to the total budget to give each Board’s allocation.
How it works in practice Board X has 10% of the total Scottish population. Since it has an older than average population its age-sex cost index comes out at 1.05, meaning its relative share is adjusted up by 5%. Needs due to morbidity and life circumstances are no different from the national average so the index is 1.0. As a Board with an urban population less sparsely dispersed than average, the excess cost index is 0.9 meaning its relative share is adjusted down by 10%. The Board’s final share is therefore 9.45%, slightly less than its population share as follows: 10% × 1.05 × 1.0 × 0.9 = 9.45%
4.3 How the Formula has been implemented 35. The introduction of a new formula was inevitably going to lead to changes in some Boards’ shares, due to the more detailed assessment of their circumstances. A gradual move towards the new Formula shares was agreed to avoid imposing undue pressure on Boards. It was also agreed that no Board would lose financially over this period. All Boards were guaranteed a minimum growth in funding year-on-year plus additional growth for those below their target Formula share. 36. There have now been six years of implementation of the Formula. In that time, target shares for individual Boards based on the Formula have been relatively stable. Figure 3 shows the trends in Boards’ shares taking the last year under the SHARE formula, 2000-1, as the base year (value of 100). Typically, each year target shares for Boards have changed by around 1% relative to the previous year. Changes within the Population and Morbidity and Life Circumstances components have accounted for the largest increases and decreases in overall shares among Boards under Arbuthnott.
10
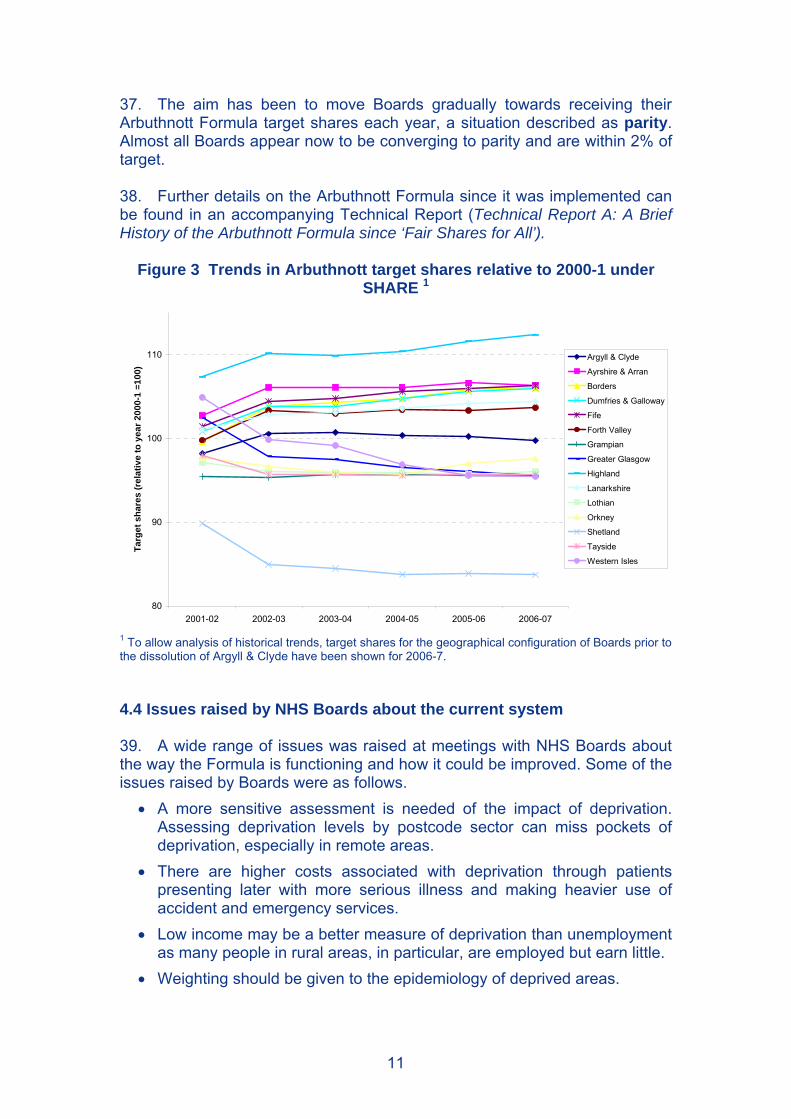
37. The aim has been to move Boards gradually towards receiving their Arbuthnott Formula target shares each year, a situation described as parity. Almost all Boards appear now to be converging to parity and are within 2% of target. 38. Further details on the Arbuthnott Formula since it was implemented can be found in an accompanying Technical Report (Technical Report A: A Brief History of the Arbuthnott Formula since ‘Fair Shares for All’).
Figure 3 Trends in Arbuthnott target shares relative to 2000-1 under SHARE 1
80
90
100
110
2001-02 2002-03 2003-04 2004-05 2005-06 2006-07
Targ
et s
hare
s (r
elat
ive
to y
ear 2
000-
1 =1
00)
Argyll & Clyde
Ayrshire & Arran
Borders
Dumfries & Galloway
Fife
Forth Valley
Grampian
Greater Glasgow
Highland
Lanarkshire
Lothian
Orkney
Shetland
Tayside
Western Isles
1 To allow analysis of historical trends, target shares for the geographical configuration of Boards prior to the dissolution of Argyll & Clyde have been shown for 2006-7. 4.4 Issues raised by NHS Boards about the current system 39. A wide range of issues was raised at meetings with NHS Boards about the way the Formula is functioning and how it could be improved. Some of the issues raised by Boards were as follows.
• A more sensitive assessment is needed of the impact of deprivation. Assessing deprivation levels by postcode sector can miss pockets of deprivation, especially in remote areas.
• There are higher costs associated with deprivation through patients presenting later with more serious illness and making heavier use of accident and emergency services.
• Low income may be a better measure of deprivation than unemployment as many people in rural areas, in particular, are employed but earn little.
• Weighting should be given to the epidemiology of deprived areas.
11
• Remoteness may be better assessed by travel times rather than geographic distance.
• The higher costs of providing services in remote areas is not always adequately reflected.
• Areas with a mix of urban/ rural and affluent/deprived populations can lose out.
• Mid year population estimates used in the Formula do not adjust quickly enough to take account of rapid population growth.
• The current Formula is difficult to understand and therefore lacks transparency.
• It is inappropriate to have different funding formulae for different funding streams – the Arbuthnott Formula should be extended to all Scottish Executive Health Department funding.
• Rapid population growth (from summer visitors, for example) places pressure on health services but is not given adequate recognition in the Formula.
• There are difficulties in recruiting and retaining staff in different parts of the country which should be reflected in the Formula.
40. A full listing of the issues raised by Boards can be found at http://www.nrac.scot.nhs.uk/nhs_board.htm.
12

5. Overview of Research Programme 5.1 Approaches to developing a needs-based formula 41. The Arbuthnott Formula was the outcome of the Arbuthnott Review which had a remit to be “as objective and needs-based as available data and techniques permit.” However, measuring healthcare needs is complex. Although ill-health is generally understood to lead to a need for healthcare services, measuring the level of resources that are required to meet that need is fraught with difficulty. Complicating factors such as co-morbidity and age can mean that individuals with the same apparent level of ill-health may require quite different levels of resource. 42. A number of approaches are available in developing health funding formulae. The Arbuthnott Review considered a number of these approaches including a direct epidemiological approach and measuring ‘proximity to death’ but decided that the Formula should be based on a utilisation approach. 43. A utilisation-based formula uses variables that are related to the increased or decreased use of healthcare services. These variables, such as the age and deprivation status of the resident population are used as a proxy for healthcare need and are used to predict the healthcare need across the population. In the Arbuthnott Formula, use of services is measured using data on the costs of delivering services as reported by Boards. 44. One consequence of a utilisation-based approach such as the current Formula is the possibility of unmet need. This can arise when some groups within the population do not use healthcare services to the same extent as other groups who have the same level of need, for example due to problems of access. This problem was recognised by the Arbuthnott Review and work carried out to address this issue is described in section 10.3. 45. In the current review, NRAC looked again at the epidemiological approach while recognising that any such move in that direction would involve a substantial change from the current resource allocation formula. This method requires detailed data on the morbidity of the population with a wide range of coverage across all the NHS Boards in the country. It also requires the ability to link the morbidity data to data on subsequent use of health services, at a patient level, to determine a method of allocating costs. 46. After reviewing the available data sources for measuring the morbidity of the population with suitable linkages to health service activity, it was concluded that testing a formula based on a full epidemiological approach was not feasible within the timescale of the Committee’s work. However NRAC believes there may be scope in future for using morbidity data and direct measures of healthcare need where possible.
13

5.2 Scope of the research 47. The remit that NRAC was given by the Scottish Executive was to examine ways of refining and improving the current Formula. There have been calls from some NHS Boards for more radical changes to the Formula but that is not what NRAC was charged to do. Its work has been about modifying and improving what is already in place, not overhauling it. 48. There have been a number of changes in NHSScotland since the Arbuthnott Review and policy developments such as those outlined in the Scottish Executive’s report Delivering for Health in 2005 that will mean services with continue to evolve further into the future. Researchers were asked to consider these changes where possible in their recommendations and NRAC will seek to ensure that any final recommendations for change take account of the changing NHS. 49. NRAC is committed to ensuring that the Formula is based on sound economic and statistical principles and has sought to learn from experience around the world. It requested that researchers undertake a literature review of comparable resource allocation methods in other countries to provide this international background. 50. It has also sought to take advantage of new data sources. Researchers were expected to use the most up to date information available in carrying out their work. That has included information from the 2001 census, Scottish Neighbourhood Statistics and the Scottish Index of Multiple Deprivation. The analysis for the Arbuthnott Formula was completed in 1999 and used data sources that were up to date at that time, including the 1991 census. However, some data sources used then, such as socio-economic variables, are no longer available due to changes in legislation or data collection methods. 51. One major change that has taken place in recent years relates to geographic information. It is important to have good local data on population composition, for example, to ensure that the Formula is as sensitive as possible. The Arbuthnott Review created some 717 Arbuthnott areas that were formed from postcode sectors to assist in this process. However, they do not fit exactly into administrative boundaries such as NHS Boards and local authorities which creates challenges in mapping local needs. 52. In recent years, the Scottish Executive has introduced a small area unit of geography called data zones to allow information from a variety of sources to be brought together to provide key local data in a meaningful way. Data zones are much smaller than postcode sectors and total 6,505 across Scotland. They were established in consultation with local authorities to help ensure they are relevant and understandable to local communities. Data zones average only around 500-1000 people and this can cause problems with data disclosure and confidentiality. Therefore intermediate data zones have been introduced with average populations of around 2,500-6000 people which are based on aggregating several neighbouring data zones. Both data
14

zones and intermediate data zones have benefits over postcode sector geography on which the current Formula is based, namely:
• smaller average population sizes • less variability in population size • more coherence with administrative boundaries (e.g. NHS Boards) • greater homogeneity of populations based on measures of deprivation • greater local involvement in their construction.
5.3 The research programme 53. The need to plan a programme of research was recognised by NRAC from an early stage. This was required to ensure that the various components of the Arbuthnott Formula were properly scrutinised and that the Committee had appropriate technical input to support its aims. This work could either be commissioned from external contractors such as consultancy firms and academics or carried out by statisticians and economists within the Scottish Executive Health Department (SEHD) and Information Services Division (ISD), part of NHS National Services Scotland. 54. It was agreed that the most substantial and technically complex components of the Formula were the Morbidity and Life Circumstances and Excess Costs adjustments and it was considered best to commission external contractors to review these two components. This would allow the Committee to obtain input from research teams with proven skills, knowledge and experience in developing resource allocation formulae. They would also have awareness of the most appropriate and up-to-date sources of health, social and economic data that could feed into a formula. 55. A large number of independent research teams from around the U.K. were invited to tender for the two research projects that would review the resource allocation adjustments for
• Healthcare needs due to morbidity and life circumstances and other factors
• Excess costs of supplying healthcare services. 56. Short-listed bidders were invited to present their proposals to a sub-group of the Committee and bids were evaluated on a number of criteria such as understanding of current resource allocation methods, feasibility within timescales and value for money. Final contracts for the research projects were offered to Tribal Secta, for the healthcare needs project, and the Health Economics Research Unit (HERU), for the work on the excess costs of supply. 57. An internal programme of research was planned to cover the remaining demographic components of the Formula:
• Population basis of the Formula • Age-sex cost weights
15

58. More detailed information on the scope and results of each of the research projects are described in the following chapters. The recommendations being issued for consultation are drawn from the results of these projects and these are summarised in each chapter along with the questions NRAC would like to consult on.
16

6. Reviewing the Population Basis 6.1 Overview 59. Population is the main driver in the Arbuthnott Formula for allocating resources to NHS Boards. It is therefore important that population data within the Formula are as accurate and timely as possible to ensure that a fair share of resources is given to particular areas. 60. Staff in the Analytical Services Division of the SEHD reviewed the population data behind the current Formula and recommend that the source of population data for Boards be changed. 61. A report has been prepared by the analysts to accompany this document (Technical Report B: Review of the Population Basis of the Arbuthnott Formula). This chapter includes a summary of the methods and findings of the Technical Report but those wanting further details should refer to the Technical Report. 6.2 How the current Formula works 62. Two different sources are used to estimate the population of an NHS Board area. For Hospital and Community Health Services (HCHS) it is the mid-year estimates (MYEs) of Boards’ residential populations provided annually by the General Register Office for Scotland (GROS). These are the estimated populations usually resident in each Board as at 30 June each year. NHS Boards are responsible for providing HCHS to their resident population and this is the basis for allocating shares to Boards using the Formula. Separate mechanisms exist for balancing expenditure spent on non-residents. 63. For GP Prescribing, the source is the Community Health Index (CHI) which is a database of all patients registered with a GP practice in Scotland maintained by the NHS. This more accurately reflects the Boards in which patients’ prescribing is managed which is the basis for allocations by the Formula. An extract of this database is taken at the midpoint of each year to coincide with the available MYE figure from GROS. The total number is then deflated to take account of ‘list size inflation’, a phenomenon whereby delays in updating details of patients on GP lists who have moved or died means the total population tends to be overestimated at any point in time. In addition, the total number of temporary residents registered with practices are included and given a nominal age-sex cost weight equal to half the cost of the male 0-4 age group since, unlike for hospital services, there are no arrangements for reimbursement of these prescribing costs. 64. Board total populations are fed into the Formula broken down into relevant age and sex categories to allow the age-sex cost weights to be applied as described in Chapter 7. Both GROS and CHI provide population data by age and sex.
17

6.3 Issues around the application of the current Formula 65. The meetings held between NRAC and NHS Boards uncovered concern about some aspects of the population basis of the Formula. These issues are summarised in Table 2. Table 2 Summary of population issues Transient populations There are transient sub-groups among the
population who access NHS services such as asylum seekers, homeless/rough sleepers and travelling people. Questions were raised about whether or not they are counted within the population estimates
Temporary populations The same issue applies to tourists, visitors and other non-residents who access NHS services.
Communal establishments There was a lack of clarity around residents in certain communal establishments, e.g. prisons, student residences.
Population growth areas There was concern raised that, in Boards with fast growing populations, the Formula’s estimates would lag behind the true population size.
Other population sources Some alternative population sources were suggested such as Community Health Index, land registers and populations used for local authority allocations
6.4 Scope of the review The objectives of the research were to:
• review the sources of population data that form the basis of the weighted capitation Formula
• consider population issues raised by Boards • review sources of populations for other relevant allocation formulae • prepare recommendations for NRAC.
66. The main component of the research involved comparing the use of MYEs and population projections over the period since the last review, updating a piece of work that was carried out under the Arbuthnott Review. In addition, information was obtained on how population was measured in allocation formulae used by other UK health services and by local authorities.
18
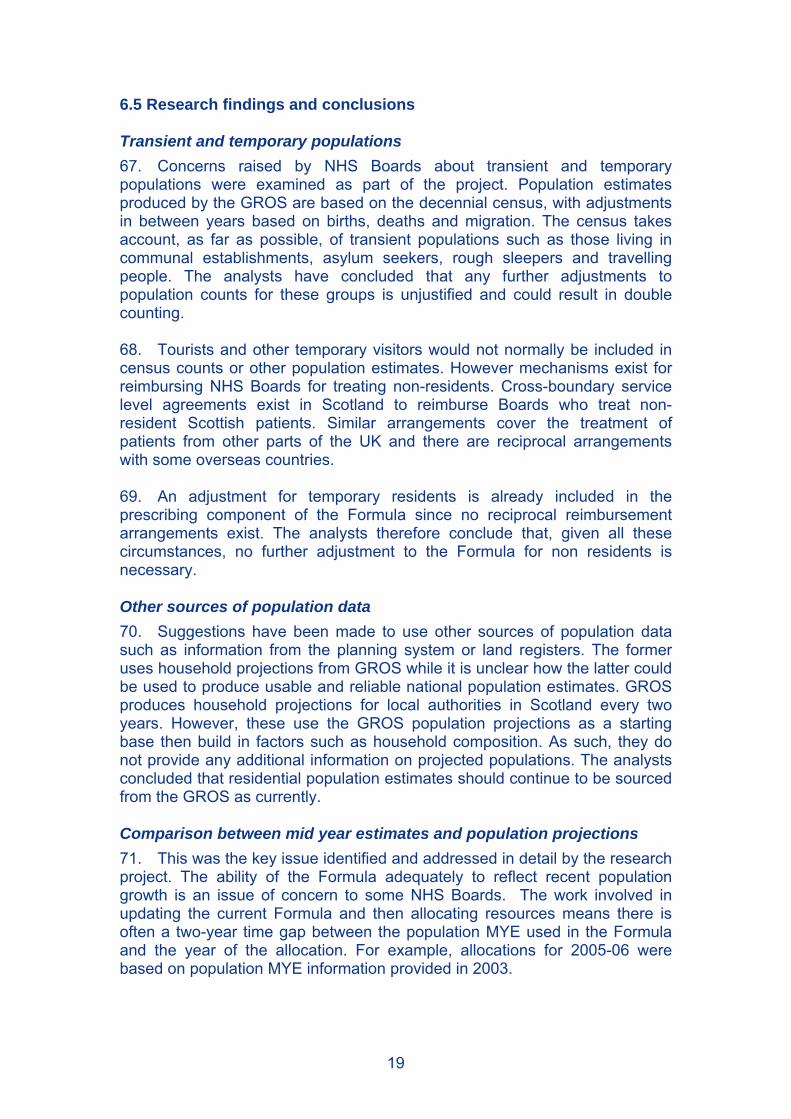
6.5 Research findings and conclusions Transient and temporary populations 67. Concerns raised by NHS Boards about transient and temporary populations were examined as part of the project. Population estimates produced by the GROS are based on the decennial census, with adjustments in between years based on births, deaths and migration. The census takes account, as far as possible, of transient populations such as those living in communal establishments, asylum seekers, rough sleepers and travelling people. The analysts have concluded that any further adjustments to population counts for these groups is unjustified and could result in double counting. 68. Tourists and other temporary visitors would not normally be included in census counts or other population estimates. However mechanisms exist for reimbursing NHS Boards for treating non-residents. Cross-boundary service level agreements exist in Scotland to reimburse Boards who treat non-resident Scottish patients. Similar arrangements cover the treatment of patients from other parts of the UK and there are reciprocal arrangements with some overseas countries. 69. An adjustment for temporary residents is already included in the prescribing component of the Formula since no reciprocal reimbursement arrangements exist. The analysts therefore conclude that, given all these circumstances, no further adjustment to the Formula for non residents is necessary. Other sources of population data 70. Suggestions have been made to use other sources of population data such as information from the planning system or land registers. The former uses household projections from GROS while it is unclear how the latter could be used to produce usable and reliable national population estimates. GROS produces household projections for local authorities in Scotland every two years. However, these use the GROS population projections as a starting base then build in factors such as household composition. As such, they do not provide any additional information on projected populations. The analysts concluded that residential population estimates should continue to be sourced from the GROS as currently. Comparison between mid year estimates and population projections 71. This was the key issue identified and addressed in detail by the research project. The ability of the Formula adequately to reflect recent population growth is an issue of concern to some NHS Boards. The work involved in updating the current Formula and then allocating resources means there is often a two-year time gap between the population MYE used in the Formula and the year of the allocation. For example, allocations for 2005-06 were based on population MYE information provided in 2003.
19
72. The original Arbuthnott Review considered using population projections for NHS Boards, provided by GROS. However, it concluded that information available at that time showed that MYEs data gave more accurate and stable predictions of actual populations than population projections. Given the importance of the issue it was felt it was important to update the work done by NRRA by comparing the use of MYEs and population projections. 73. Population projections are based on the same component method as MYEs. The most recent MYE is taken as the base population and this is then rolled forward year-on-year, taking account of projected number of births, deaths and net migration. This method gives population projections for each year up to 20 years in the future. However projections are only based on extrapolating current trends in birth, deaths and migration and do not attempt to predict future changes due to other factors which may influence future demographics (e.g. policy initiatives). 74. A third method, using re-based population projections, was also compared. This was similar to a method used in the formula to allocate local authority funding. Re-basing is a simple adjustment to the population projections, updating them using actual population estimates that have been published since the projections were published. (Projections are only published every two years at Board level and follow after publication of the latest MYE). 75. The analysts compared the performance of MYEs (lagged by two years as in the Formula), population projections and re-based projections retrospectively over the five years since the last review, from 2000-2005. The three measures were compared to the actual population for these years based on:
• accuracy – how close each was to the actual population in the allocation year.
• misallocation - the percentage of the population allocated to the “wrong” Board.
• stability – the variability in the measure from year to year. 76. Rather than comparing the crude population counts of these measures, the analysts compared them after applying the age-sex cost weights to mimic the way in which population figures are actually used in the Formula. 77. All three measures were found to be accurate and able to predict Boards’ cost-weighted population shares within 0.1% of the value based on the actual population in the allocation year. However projections tended to be more accurate than the MYEs (in 52% of comparisons), with the re-based projections improving the accuracy of projections further (in 61% of comparisons). Similarly, re-based projections tended to misallocate populations to a lesser degree than the other methods and were slightly more stable from year-to-year than MYEs.
20

78. The English allocation formula has used both population projections and MYEs in the past and has decided to revert to using population projections from 2006-07. MYEs are in use in both Wales and Northern Ireland, although Northern Ireland has considered a move to using population projections following pressure from Health Boards. 79. For prescribing, it is not practical to produce projections for CHI population data. Therefore the analysts recommended that the most up-to-date extract was used when updating the Formula and that the population count was deflated to the same projected population total as used in the HCHS for consistency. 6.6 Recommendations 80. The analysts say there is a clear advantage in measuring the size of the population in the year that the allocation is to apply, particularly when populations are rising or falling. The comparative method applied here has also shown that, in terms of accuracy, population projections scored higher than MYEs and the re-basing method improved the accuracy of the projections further. They therefore recommended that:
• for HCHS, the population basis of the Arbuthnott Formula be changed to use population projections to predict residential populations in the allocation year. The simple re-basing technique should be used to improve the accuracy of projections further.
• For prescribing, it is recommended that population counts from CHI
continue to be used ensuring totals are consistent with the projected residential population totals for HCHS.
.
NRAC would like your views… Q1. Is there a better alternative to continuing to use the General Register Office for Scotland as the source of data on Boards’ resident populations for hospital and community services within the Formula ? Q2. Should the formula move to using re-based population projections, rather than mid-year estimates as at present, to better reflect the populations using services in the allocation year ? Q3. Do you have any other comments on the recommendations for changes to the population basis of the Formula ? Please respond using the Feedback Form
21

7. Reviewing the Age-sex Cost Weights 7.1 Overview 81. As discussed in chapter 6, the Formula starts with the NHS Board population shares and then adjusts these shares to take account of differences in the age and sex structure of the population. 82. Analysts at the Information Statistics Division (ISD) of NHS National Services Scotland and the Analytical Services Division of the SEHD reviewed the basis on which these adjustments are made and recommend that greater refinements can be made that will achieve greater precision. 83. A report has been prepared by the analysts to accompany this document (Technical Report C: Review of the Resource Allocation Adjustment for Age and Sex Cost Weights). This chapter includes a summary of the methods and findings of the Technical Report but those wanting further details should refer to the Technical Report. 7.2 How the current Formula works 84. Much of the detailed methodology for calculating age-sex costs was devised after the original Arbuthnott Review was complete and does not appear in the official reports. 85. For HCHS care programmes, the current method starts with the national specialty costs in the Scottish Health Service Cost Book, commonly known as the Cost Book and applies national average costs to patient level activity data from national data schemes, such as SMR01. This gives costs by the age and sex of the patient which are then grouped into age and sex categories. Where no national activity data are available, a suitable proxy is used (e.g. new outpatient activity applied to day patient costs). 86. Costs are applied to activity based on either a cost per episode (i.e. reflecting fixed costs) or cost per day (i.e. reflecting variable costs), or a mixture of both, depending on the care programme and type of patient. Once disaggregated by age and sex category, costs are expressed as a cost per head of population by dividing by a population estimate. For maternity services, costs are expressed per birth. This gives, for each care programme, a set of age-sex cost weights. 7.3 Issues around the application of the current Formula 87. In the meetings between NRAC and NHS Boards, very few issues were raised about the age-sex components of the Formula. This is likely to reflect the limited alternative options based on the current methodology. More substantial changes to the way age and sex were treated in the Formula were raised at NRAC, such as a ‘proximity to death’ approach and treating age as a needs variable similar to deprivation. Full review of these approaches was
22

not possible within the timescale of the research. However drawing on the previous research, including work carried out for the Arbuthnott Review, the analysts noted practical problems with these approaches and concentrated their efforts in improving and refining data sources and methods used in the current adjustment. 7.4 Scope of the review 88. The objectives of the review were to:
• refine the age band widths where relevant and possible • review the methodology used to cost acute hospital services • review data sources for costing community services • review data sources for costing prescribing data by patient age and sex.
89. The research involved calculating age-sex cost weights using more refined age bands and comparing these to the current method. Reviews were also conducted into the costing methodology used in acute hospital services and into the data sources used for costing community services and prescribing. 7.5 Research findings and conclusions Refinement of age band widths 90. The Arbuthnott Formula calculates costs based on activity levels split across eight age bands namely:
0-4, 5-14, 15-24, 25-44, 45-64, 65-74, 75-84, 85 and over.
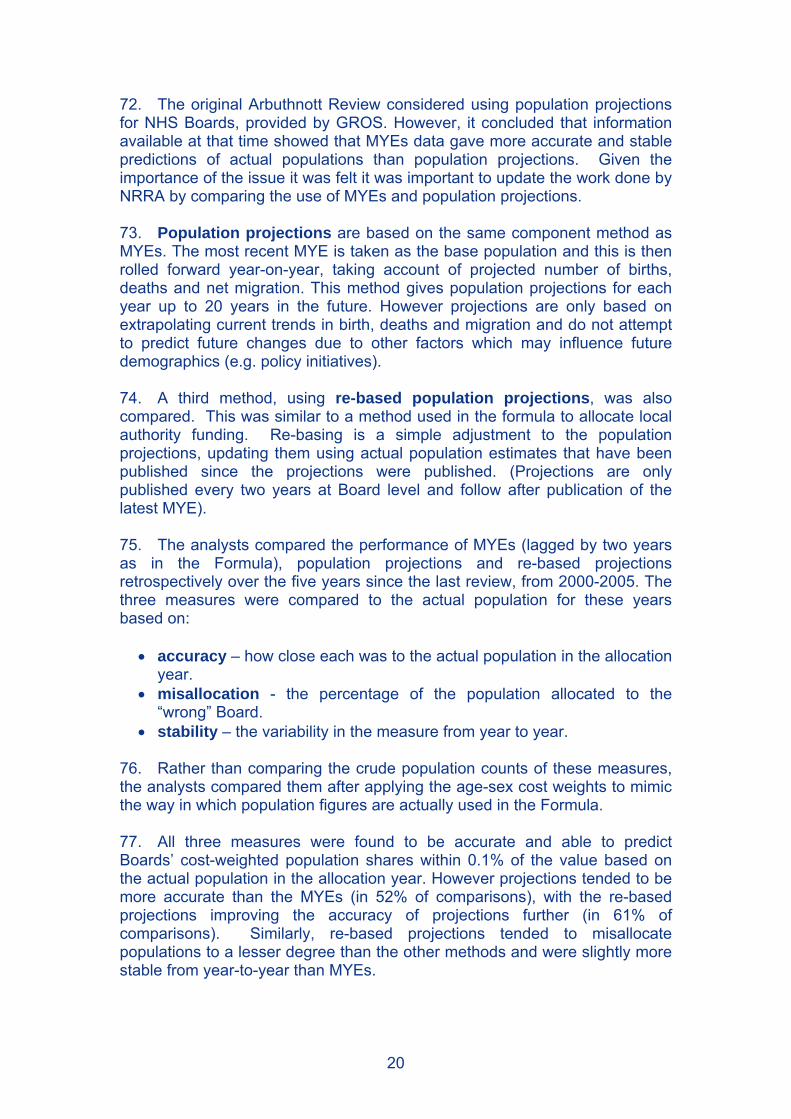
Maternity costs are based on the age of the mother and so use a narrower range of 5-year age-bands. 91. These give a cost per head, or cost per birth, which is then applied to the number of people within these age bands in the Board’s population. However, it has been recognised that having eight age bands does not fully take into account cost differentials between different age groups, especially among the very young and the very old. Lengthening life expectancies mean that there are many more people in the oldest age group than previously and it is important for the Formula to remain sensitive to the cost differentials within this group. The research looked at refining these into five-year age bands plus two bands for the under-fives and increasing the oldest age band to 90 plus. This gives 20 different age bands in total. 92. It was found that reducing the age band widths gave a more precise estimate of costs in the acute, care of the elderly and mental illness care programmes and this was recommended. Figure 4 compares the cost weights using the current 8 age bands and proposed 20 age-bands. Five-year age bands are already currently in use for maternity and no change is recommended.
23
93. For learning disabilities, there were concerns about the stability of cost weights year-on-year with the new age banding structure due to the relatively low level of hospital activity in this programme and service changes are likely to reduce this further. It is not recommended that changes should be made to the age band widths in this programme.
Figure 4 Acute services costs per head; Males
0
500
1000
1500
2000
2500
3000
0-1
2-4
5-9
10-1
415
-19
20-2
425
-29
30-3
435
-39
40-4
445
-49
50-5
455
-59
60-6
465
-69
70-7
475
-79
80-8
485
-89
90+
Age Category
Cost
Per
Hea
d (£
)
20 Age Bands
8 Age Bands
Costing acute services 94. Under the current Formula, fixed and variable costs are applied to in-patient activity to cost acute services. Fixed costs are assumed to be the same for all patients treated in a specialty (medical costs, laboratory costs etc) while variable costs (nursing costs, linen costs etc) are assumed to vary with length of stay. Variable costs are applied to all bed days. Fixed costs are applied to all episodes of care except the following:
• transfers which represent a return to a specialty in which a patient has formerly been treated within the same continuous inpatient stay; and
• transfers of emergency medical admissions within the first 48 hours only if transferred to another medical specialty.
95. The review considered the methodology for calculating fixed and variable costs and examined if fixed costs should be applied to all in-patient activity without exception. It concluded that simplifying the Formula to apply fixed costs to all patient episodes, without exception, produced almost identical figures with the benefit of greater transparency. 96. The analysts also examined the potential of using national tariff methodology in developing acute sector costings (Technical Report C, section 3.3). The Scottish National Tariff is designed to create a set of standard prices for particular treatments such as surgical operations. It is being developed and implemented over a three year period, starting in 2005-06. A comparison
24

of costs per head calculated under the current Formula with the tariff methodology found the two methods to be very similar. The main differences were in the older age groups where the tariff methodology produced slightly lower costs because it does not take account of their longer average lengths of stay in hospital. Costing community services 97. The lack of activity data in the community care programme makes it more difficult to produce costings. Direct activity data are only available for district nursing and health visiting and, for other areas, proxies are used such as outpatient attendances to give and age/sex breakdown as can be seen in Table 3. Table 3 Community costs breakdown 2003-4
Cost %Current source of patient activity profiles
District Nursing 17.3 Patient contacts from ISD(S)29/301
Health Visiting 9.8 Patient contacts from ISD(S)29/301
Midwifery 3.5 New outpatient attendances for maternity
Psychiatric Team 13.2 New outpatient attendances for mental illness
Learning Difficulties Team 3.4 New outpatient attendances for learning disabilities
Immunisation 0.9 Population aged 0-14
Other 51.8 Total population
Total 100.0Source: Scottish Health Service Cost Book 2003/4, Information Services, NHS National Services Scotland 1 ISD(S)29/30 is an aggregate data return from Boards on nursing contacts 98. A recent review has led to community costs being published at a more detailed level from 2004-05. This has the potential to provide new sources of patient activity data that can be used to calculate costs. One useful source that has emerged since the last review are the Practice Team Information (PTI) data at ISD. These provide information on patient contacts from a nationally representative sample of practices covering 300,000 patients. PTI data can be used as a proxy for the age profile of patients using community services where there is no national activity data source. 99. The analysts propose activity sources for Community Services costs as shown in Table 4.
25

Table 4 Proposed Activity sources for Community Services Costs
Cost
Percentage of community costs
2004-5 (%)Proposed source of patient activity profiles
District Nursing 16.1 District nurses patient contacts from PTI1
Health Visiting 8.4 Health visitors patient contacts from PTI
Midwifery 3.0 No change - New outpatient attendances
Psychiatric Team 14.1 Patient contacts from PTI for mental illness
Learning Difficulties Team 3.1 No change - New outpatient attendances
Child Health 3.6 Population aged under 14
Specialist Nursing 3.3 Patient contacts from PTI
Addiction Services 2.4 Drug and alcohol misuse data held at ISD
Family Planning 2.0 Female population aged 15-44
Clinical Psychology 1.6 All patient contacts from PTI
Physiotherapy 2.8 All patient contacts from PTI2
Occupational Therapy 1.5 All patient contacts from PTI2
Chiropody 2.9 All patient contacts from PTI2
Dietetics 0.7 All patient contacts from PTI2
Allied Health Professionals
Speech Therapy 2.1 All patient contacts from PTI2
Community Dentistry 4.1 Community Dental Service treatment
data
Home Dialysis 0.6 Population aged 50-65
Breast Screening 1.2 Female population aged 50-69
Incontinence 1.9 Female population aged 65+
Health Promotion 0.5 Population all ages
Other Services
Other 23.9 All patient contacts from PTI
Total 100.0 1 PTI is the Practice Team Information database at ISD. 2 Could be checked with locally collected data where available.
Costing GP prescribing 100. Age-sex cost weights for GP prescribing are based currently on the cost of prescribed items that are taken from an annual random sample of around 12,000 prescription forms from a central database of all prescriptions dispensed in the community. A random sample is used because, until
26
recently, no patient level information was routinely collected for these prescriptions. The only way to determine the age and sex of the patient was manually extracting the names, addresses and CHI numbers as they were printed on the forms. From a CHI number, the patient’s age and sex can be determined. 101. ISD are now routinely capturing and storing CHI numbers if they appear on prescription forms but at present this only covers around half of all prescriptions and may be biased towards certain areas and groups of patients. A restructuring of the prescribing database at ISD will aid the extraction of patient level information but it is likely to be into 2007 before this will be possible. Until a full analysis of the CHI information from the database can be analysed, the analysts recommend continuing with the current random sample method. They also recommend pooling the samples over three years to increase the precision and smooth out a lack of stability in the cost weights from year to year. 7.6 Recommendations 102. The analysts say they have shown that greater precision in age-sex costs can be achieved by refining age bands, without loss of stability. Greater transparency in the application of fixed and variable costs can be achieved without impact on age-sex cost indices. A more detailed breakdown of community costs is now available, and sources of community activity data can be used to produce costs by age and sex. Patient level information is now more routinely available on prescriptions but significant data recording and capture issues remain. There is evidence of instability in prescribing age-sex cost weights year-on-year using the current random sampling method. 103. They therefore recommended that:
• age band widths are refined in the acute, mental illness and care of the elderly care programmes where lack of stability year-on-year is not an issue;
• the current method of costing hospital episodes is modified to improve transparency in applying fixed and variable costs;
• the proposed patient activity data sources listed in Table 4 are used to produce community costs by age and sex;
• prescribing cost weights are based on pooling random samples over the most recent three years to improve stability and precision until routinely collected patient information on prescriptions is available for analysis.
27

NRAC would like your views … Q4. Are there more appropriate sources of data for the age-sex profile of patients accessing community services than those proposed in Table 4 ? Q5. Is there a better alternative to the recommendation that prescribing cost weights should continue to be based on the national random sample of prescriptions, pooled across several years data to improve stability and precision ? Q6. Do you have any other comments on the recommendations for changes to the age-sex cost weights within the Formula ? Please respond using the Feedback Form
28

8. Reviewing the Adjustment for Healthcare Needs Due to Morbidity and Life Circumstances 8.1 Overview 104. Areas with greater levels of ill health will face increased costs in meeting the need for health care. The Arbuthnott Formula introduced a morbidity and life circumstances (MLC) adjustment to take account of these differences. 105. Researchers at Tribal Secta won the tender to review the basis of the original adjustment and recommend improvements and refinements. They have concluded that the index used in the Arbuthnott Formula should be replaced by new indices that take advantage of new data sources on smaller geographical areas. 106. A report has been prepared by the researchers to accompany this document (Technical Report D: Review of the Resource Allocation Adjustment for Healthcare Needs due to Morbidity and Life Circumstances and Other Factors). This chapter includes a summary of the methods and findings of the Technical Report but those wanting further details should refer to the Technical Report. 8.2 How the current Formula works 107. The current Formula makes an adjustment for MLC that takes account of additional healthcare needs over and above the needs due to the age and sex profile of Boards’ populations. 108. Initially some 50 indicators were used in the Arbuthnott Review to analyse the influence of MLC on the relative need for healthcare resources. The initial results were felt to be too complex and subsequent work after consultation identified four key indicators that were closely associated with healthcare needs. These were:
• the standardised mortality rate among people under 65; • the standardised unemployment rate (based on benefit claimants); • the proportion of elderly people on income support; • the proportion of households with two or more indicators of deprivation
based on the 1991 census.
109. These four indicators are compiled into a single index, the Arbuthnott index, which is used to predict the relative need for healthcare resources in different areas of Scotland each year. Predictions are made for 717 areas of Scotland, similar to postcode sectors, called Arbuthnott areas.
29
110. The MLC adjustment is calculated separately for each care programme and diagnostic group. Diagnostic groups are a further breakdown of care programme costs using diagnostic information recorded on patient activity records (Annex 3). The evidence shows that the increased use of healthcare associated with the Arbuthnott index is not the same across all diseases. For example, treatment for respiratory and circulatory diseases is more common among people living in areas of deprivation but this is not the case for infections. 111. Three of the four indicators on which the index is based can be updated annually. The exception is households with two or more indicators of deprivation which is based on data from the 1991 census. 8.3 Issues around the current application of the Formula 112. The meetings held between NRAC and NHS Boards identified concern about some aspects of the MLC adjustment in the Formula. Concern was expressed that the four indicators used in the Arbuthnott index were too narrow and more variables were needed to give a broader and more sensitive adjustment. Some of the present measures used were criticised as being more appropriate to urban and metropolitan rather than rural areas, meaning that rural deprivation goes undetected as a result. 113. Questions were also raised about the appropriateness of some of the indicators such as the mortality rate for people under 65 and whether or not the age limit is too low. Suggestions were also made for including new indicators such as the number of benefit claimants in particular areas. 8.4 Scope of review 114. The research aimed to review the original MLC adjustment and recommend improvements and refinements based on new evidence, methods and data sources that have emerged since the original Formula was developed.
• The key stages in the review involved : • investigating the workings of the existing MLC adjustment and the
components of the present Arbuthnott index; • identifying new and updated sources of data, such as the 2001 census,
that can be used to improve the needs adjustment; • testing the suitability of using data zones or related areas as the
geographic basis for the adjustment to ensure it is sensitive to the needs of small areas of deprivation ;
• considering the suitability of a new index, or small number of indices, to replace the current Arbuthnott index
• identifying whether specific sub-groups of the population, such as minority ethnic groups and asylum seekers have higher relative needs that should be adjusted for and considering how this should be done;
30

• reviewing evidence of unmet need (the gap between the use of services and the underlying need of particular groups.)
115. The researchers also compiled a comprehensive database of possible explanatory variables or indicators of need (described in the research as ‘needs drivers’) that can be used to measure the need for healthcare in particular geographic areas. This was based on data from the 2001 census, national surveys, administrative data sources and NHS national datasets held at ISD. In addition, the Scottish Neighbourhood Statistics system provided an in-depth source of variables on housing, environment, education and socioeconomics at local level. 116. Measures of supply were also identified such as distance to hospitals, hospital capacity and access to GPs. These measure how easy it is for patients living in different parts of the country to access NHS services. It is important to take account of the supply of healthcare services since this can have an influence on how well services are used. The researchers therefore made allowance for supply variables in their analyses to ensure that ‘real’ underlying need was being measured rather than variations in healthcare supply. The research used the same configuration of care programmes and diagnostic groups as the Arbuthnott Formula. 117. The main focus of the research was to explain the variation in actual costs of healthcare within small-areas using the database of potential indicators of need. For this they used a cost ratio to measure the cost of patient activity, using national average unit costs, relative to the expected cost based purely on applying the age-sex cost weights to the population within each small area. In this way they analysed the cost of healthcare over and above the effects of age and sex. 118. The researchers then used statistical regression analysis, similar to the work that was carried out in the Arbuthnott Review. Preliminary analysis involved:
• grouping care programmes in line with similar indicators of need; • determining how much of the variation in costs was due to basic
differences among Boards and due to supply of healthcare. • producing a reduced list of candidate indictors of need for each group of
care programmes. 119. From this reduced list, indices were developed based on the indicators of need that best explained the variation in the costs of healthcare for the groups of care programmes. They used an R squared value (R2) to measure how well the indices predicted the variation in costs across all areas. This could range from 0%, if the indices could not predict any of the variation in costs, to 100% if they could predict costs perfectly. Testing then took place to compare the performance of these indices with an index containing all candidate indicators of need and with the current Arbuthnott index. The performance of the new indices was also compared between rural and urban
31

areas and areas with differing proportions of people from ethnic minority groups. 8.5 Research findings and conclusions Developing new indices 120. The researchers recognised the strengths of the MLC adjustment in the Arbuthnott Formula and said it has a number of advantages over many of the approaches used elsewhere. Consequently, their preference was to build on the existing process, rather than explore radical alternatives. However, they also concluded that it could be improved by introducing more than one index for the various care programmes to improve the ability of the Formula to predict actual costs. 121. Based on the analysis work carried out, they have arrived at a number of conclusions. They suggest that the geographic basis of the current MLC adjustment be changed to intermediate data zones, of which there are 1235 across the country compared to the current 717 Arbuthnott areas. 122. After initial modelling results Tribal Secta based their subsequent analyses on grouping care programmes and analysing indicators of need separately within these groupings. They retained the current arrangement of diagnostic groups but separated out for analysis outpatient services within both acute and mental illness programmes. 123. They produced separate needs indices for each of the groupings of care programmes:
• Acute and Care of the Elderly – Acute index • Mental Illness and Learning Disabilities – Mental Health index • GP Prescribing – Prescribing index • Community – Community index • Maternity – Maternity index
These indices would apply separately to each diagnostic group apply the appropriate coefficient estimated from the regression models. 124. They looked at the possibility of using a single index, similar to the Arbuthnott index, but recommend that this would be inferior to using the multiple indices they propose. These indices are shown in Table 5. The indices were formed by normalising each indicator (by subtracting the mean and dividing by the standard deviation) and adding them together, similar to the construction of the Arbuthnott Index from its four component variables.
32
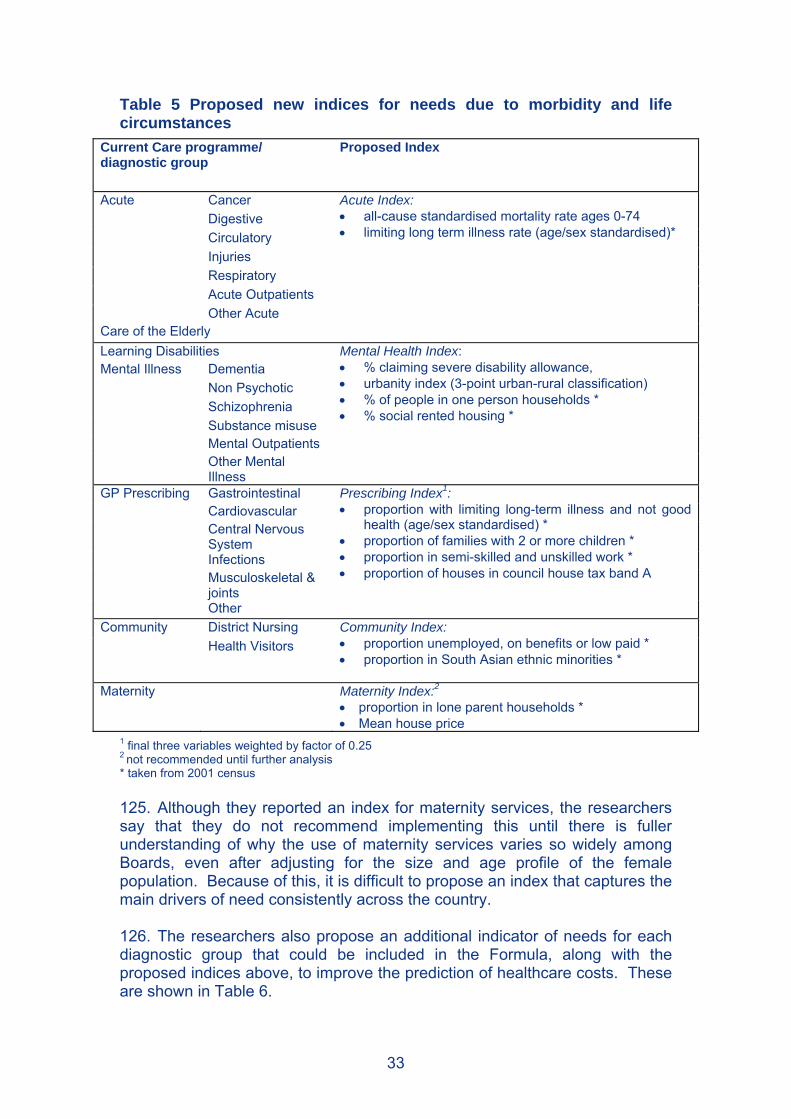
Table 5 Proposed new indices for needs due to morbidity and life circumstances
Current Care programme/ diagnostic group
Proposed Index
Cancer Digestive Circulatory Injuries Respiratory Acute Outpatients
Acute
Other Acute Care of the Elderly
Acute Index: • all-cause standardised mortality rate ages 0-74 • limiting long term illness rate (age/sex standardised)*
Learning Disabilities Dementia Non Psychotic Schizophrenia Substance misuse Mental Outpatients
Mental Illness
Other Mental Illness
Mental Health Index: • % claiming severe disability allowance, • urbanity index (3-point urban-rural classification) • % of people in one person households * • % social rented housing *
Gastrointestinal Cardiovascular Central Nervous System Infections Musculoskeletal & joints
GP Prescribing
Other
Prescribing Index1: • proportion with limiting long-term illness and not good
health (age/sex standardised) * • proportion of families with 2 or more children * • proportion in semi-skilled and unskilled work * • proportion of houses in council house tax band A
District Nursing Community Health Visitors
Community Index: • proportion unemployed, on benefits or low paid * • proportion in South Asian ethnic minorities *
Maternity Maternity Index:2
• proportion in lone parent households * • Mean house price
1 final three variables weighted by factor of 0.25 2 not recommended until further analysis * taken from 2001 census 125. Although they reported an index for maternity services, the researchers say that they do not recommend implementing this until there is fuller understanding of why the use of maternity services varies so widely among Boards, even after adjusting for the size and age profile of the female population. Because of this, it is difficult to propose an index that captures the main drivers of need consistently across the country. 126. The researchers also propose an additional indicator of needs for each diagnostic group that could be included in the Formula, along with the proposed indices above, to improve the prediction of healthcare costs. These are shown in Table 6.
33

Table 6 Supplementary indicators in addition to needs indices Current Care programme/ diagnostic group
Proposed Supplementary variable
Cancer standardised mortality for cancer aged 70 and under Digestive standardised mortality for digestive disorders 75 and under Circulatory Incapacity benefit aged 16-64 Injuries Proportion receiving income support Respiratory Sulphur dioxide concentration Acute Outpatients Urbanity index
Acute
Other Acute Directly standardised morbidity rate under 75 Care of the Elderly Unemployment rate Learning Disabilities Mean house price
Dementia Proportion in black ethnic minority groups * Non Psychotic Proportion in households without sole use of bathroom* Schizophrenia Multi-person households (not students) * Substance misuse Owns house outright * −
Mental Outpatients Owns house outright * −
Mental Illness
Other Mental Illness
Proportion in households without sole use of bathroom*
Gastrointestinal Proportion with limiting long-term illness and not good health (age/sex standardised) *
Cardiovascular Pension credit aged 75 and under Central Nervous System
Income support recipients
Infections Incapacity benefit and severe disability allowance recipients Musculoskeletal & joints
Incapacity benefit and severe disability allowance recipients
GP Prescribing
Other Incapacity benefit and severe disability allowance recipients District Nursing n.a. Community Health Visitors n.a.
Maternity1 n.a. 1 not recommended until further analysis * taken from 2001 census - negatively related to needs 127. For most acute diagnostic groups, a substantial proportion of the variation in costs among small-areas was found to be explained by the potential indicators of need. However, this is not true in several other areas where it was not possible to identify indicators that could adequately predict costs of healthcare consistently across the country (Technical Report D, chapter 6). Because of this the researchers proposed that an option of flat funding be considered for several diagnostic groups, meaning that needs should only be based on the population and age-sex components of the Formula, without a further MLC adjustment. These diagnostic groups are:
• Cancer within Acute • Other within Mental illness • Care of the elderly • Dementia within Mental illness • Non-psychotic conditions within Mental illness
34

• Infections within Prescribing For the first two diagnostic groups above this is a “strong” recommendation, for the remainder it is “moderate” recommendation. 128. The researchers also demonstrated that the performance of their proposed indices was reasonably robust in rural areas as well as urban areas. Ethnic minority groups and asylum seekers 129. The researchers report that ethnic minority groups make up a small proportion of the national population (around 2% at the last census) and are highly concentrated geographically in certain areas of Scotland, particularly urban areas. The largest single group is the South Asian category. Apart from the census, data collected on ethnicity and health in Scotland are sparse. 130. The researchers looked at whether additional adjustments should be made to the formula specifically to take account of the needs of ethnic minority groups (Technical Report D, section 7.1). They concluded that areas with higher proportions of ethnic minority groups also tended to have higher values of many of the main indicators of need, particularly those related to deprivation. In effect, including these indicators in the formula also captures the needs of ethnic minorities. Indeed, including indicators for specific ethnic groups in addition to these variables often suggests there are shortfalls in the use of health services among some ethnic groups, though the evidence is inconclusive. 131. The researchers conclude that, apart from the largest category of South Asian, there is no case for introducing indicators of ethnic minority groups into the needs adjustment of a national formula. They propose that allocations to cover specific costs of delivering services to ethnic minority groups, such as language services, should be distributed using a separate allocation mechanism. 132. Similar problems are posed in relation to including an indicator for asylum seekers in the needs adjustment given their relatively small number, the lack of data at small area level and their high concentration in certain areas. Almost all the asylum seekers in Scotland are based within a single NHS Board, Greater Glasgow. The researchers are clear that including the number of asylum seekers as part of a needs index within a national formula is not appropriate. Instead, they recommend that the needs of this particular sub-group are addressed using a separate allocation mechanism based on estimates of the numbers of each group in each NHS Board and the typical costs of resources required per person per group. Unmet need 133. The recommendations for the proposed indices are based on data on the utilisation of healthcare services. The researchers were therefore asked to look for evidence of unmet need which can arise when some groups within
35

the population do not use healthcare services to the same extent as other groups who have the same level of need. They looked for evidence of unmet need among those predicted to have the greatest need for healthcare based on the proposed indices. Because of the difficulty in detecting and measuring a gap between the true need of the population and their use of services across small areas, the researchers used four different statistical methods. 134. In general the researchers concluded that the four approaches did not yield convincing evidence of unmet need. However in one of the methods, which used data from the Scottish Health Survey and proxies for morbidity in small areas, they found some evidence of unmet need for circulatory conditions which they recommend would be worthy of further exploration. See section 10.3 for more discussion of unmet need. 8.6 Recommendations 135. The aim is to produce an adjustment that is both equitable and transparent. The most equitable solution is to use indices that capture as much of the variation in costs as possible that are due to indicators of need. However, that is likely to lead to a large number of indicators being considered and, almost certainly, a different set for each care programme and diagnostic group. The researchers conclude that the drive for transparency therefore encourages the use of indices that at least appear simplistic although they are, through their construction, often quite complex. 136. That has led them to recommend two options: Option 1: A separate needs index for each of the care groupings for acute, mental health, GP prescribing and community services as in Table 5.
Option 2: Separate indices as in Option 1 plus an additional variable for each diagnostic group, as in Table 6, to provide flexibility and leading to a more equitable distribution. Both of these options would be applied at the level of intermediate data zones. 137. They recommend further work on analysing the use of maternity services across the country, before any index can be recommended, to determine why there is so much variation among Boards. 138. In addition to either of these options, the researchers recommend a further option for specific care programmes and diagnostic groups for which the proposed indices explain very little of the variation in costs. For the following areas they recommend flat funding, meaning that no MLC adjustment is made over and above adjustments for population and age-sex cost weights:
• cancer and ‘other’ conditions within mental illness (strong recommendation)
36

• care of the elderly, dementia and non-psychotic conditions within mental illness and prescribing for infections (moderate recommendation).
NRAC would like your views … Q7. What are your views on the first two options proposed by the researchers recommending separate needs indices and supplementary variables ? Q8. What are your views on their additional option that no MLC adjustment is required for certain care programmes and diagnostic groups for which the needs indices explain very little of the variation in costs ? Q9. Can you help us explain why, for maternity and outpatients in particular, variation in costs across the country are largely explained by differences in levels of activity among Boards, rather than indicators of need, and how should this be taken account of in a resource allocation formula ? Q10. What are your views on the recommendation that data on ethnic minorities and asylum seekers should not be included in the need indices within the Formula but allocation should be addressed via separate mechanisms ? Q11. Do you have any other comments on the recommendations for changes to the adjustment for healthcare needs due to MLC within the Formula ? Please respond using the Feedback Form
37

9. Reviewing the Adjustment for Excess Costs of Supplying Healthcare Services 9.1 Overview 139. There are unavoidable costs that some NHS Boards have to meet based on their geographic location such as having to provide services across large sparsely populated areas. The Arbuthnott Formula made an adjustment for remoteness to compensate for such costs. 140. Research conducted by Health Economics Research Unit (HERU) at the University of Aberdeen reviewed the Arbuthnott Formula remoteness adjustments for hospital and community services and examined if additional adjustments need to be made for other unavoidable geographic variations in costs of supply, such as recruiting and retaining staff and the prices of buildings and land. The research team has concluded that improvements can be made to the Formula and makes recommendations for change. 141. A report has been prepared by the researchers to accompany this document (Technical Report E: Geographic Differences in the Costs of Delivering Health Services in Scotland: Implications for the National Resource Allocation Formula). This chapter includes a summary of the methods and findings of the Technical Report but those wanting further details should refer to the Technical Report. 9.2 How the current Formula works 142. Population counts, age compositions and levels of morbidity and life circumstances are used to indicate the levels of need in each NHS Board area. The purpose of an excess cost adjustment is to compensate Boards for the unavoidable factors that influence the costs of delivering services to meet those needs. It is based on separate remoteness adjustments for community and hospital services. 143. The adjustment for community services has two components relating to travel-intensive services and clinic-based services. These are:
• for travel-intensive services is based on a simulation model of the additional travel associated with the delivery of services by district nurses and health visitors in rural areas;
• for clinic-based services it is derived from an analysis of the costs of providing General Medical Services in remote areas.
144. The remoteness adjustment for hospital services is based on analysis of Board level information on unit costs and a single indicator of remoteness – road kilometres per 1,000 population. Each of the three wholly island Boards receives the same adjustment.
38

145. Although the Formula is updated on an annual basis, the cost adjustments for remoteness have not been changed since the original analysis was undertaken as this factor changes little over time. 146. The Arbuthnott Review also examined the case for including adjustments for geographical differences in the costs of labour, land and buildings but rejected such an approach. It concluded there was no evidence to support an adjustment for labour costs and that the other adjustments were unlikely to have a material impact on allocations because of their minor contribution to overall expenditure. 9.3 Issues around the application of the current Formula 147. The adjustment for remoteness is calculated only at NHS Board level and it has been criticised for failing to compensate Boards that have a mix of urban as well as remote and rural areas. A related concern is that it cannot be used to inform planning of services at sub-Board level. These problems may be overcome if the adjustment was to be based on smaller geographic areas. 148. The current hospital adjustment for remoteness and rurality uses a single measure – road kilometres per thousand population – to try to capture the effects of remoteness and rurality on the relative costs of delivering hospital services across all NHS Boards. It was recognised in the Fair Shares for All report that this was a relatively simple approach to a complex issue. 149. In addition to this, a number of Boards have pointed out that they may face increased costs because of the generally high prices for labour and other resources in their local area. Recruitment and retention of staff may also be more difficult in areas where the cost of living is high or amenities are low. Boards have also identified higher costs in providing services in smaller hospitals and employing staff at higher grades to provide flexible services. 9.4 Scope of the review 150. The aim of the research was to review the Arbuthnott Formula remoteness adjustments for hospital and community services and review the evidence for inclusion of other unavoidable excess costs of supply, such as market forces. The scope of the research is confined to hospital and community services. It excludes capital resources, teaching and research, GP prescribing and Family Health Services. 151. The specific objectives were:
• to review the current remoteness adjustment for hospital services and, if necessary, propose a more appropriate alternative;
• to review the excess cost adjustment for travel-intensive community services and propose improvements taking account of changes in service provision since the original analyses; and
• to review the evidence for inclusion of other unavoidable excess costs of supply in the Formula, taking account of changes in service provision and market forces since the original analyses.
39

152. The remoteness adjustment has changed very little since it was introduced. The HERU research team therefore took the opportunity to update variables and undertake analysis on more recent data to reflect any changes in the way care is delivered. They wanted to explore the possibility of updating the original work while also examining if there is a better way of approaching this issue. That involved reviewing the work of the Arbuthnott Review on unavoidable costs, examining the approaches taken in other countries in addressing this issue and investigating what data improvements have been made since the Formula was first introduced. 153. HERU identified two principal sources of unavoidable costs that create geographic differences in healthcare costs across Scotland:
• differences in local costs for labour, buildings and land, which they call input prices, due to market forces;
• higher travel costs for providing community services to dispersed populations and higher costs of providing hospital services that do not benefit from economies of scale, due to remoteness.
9.5 Research findings and conclusions Measuring rurality and remoteness 154. Several indicators have been proposed for measuring rurality and remoteness. The researchers reviewed the literature and concluded that classifications based on multiple indicators are generally preferred. Where service delivery involves significant travel for NHS staff, such as community services, rurality will be the significant cost factor. Where patient access to facilities is the primary concern, such as hospital services, remoteness is likely to be more important. As such, the researchers looked for a classification that distinguished between rurality and remoteness. 155. They opted for a recent categorisation created by the Scottish Executive, the Scottish Executive Urban Rural Classification, that distinguishes these two elements for all small geographical areas within Scotland. They also added a refinement to identify islands separately. Most Boards contain a mixture of urban-rural categories and no pre-2006 NHS Board has a monopoly on any of the categories. This measure provides a rich picture of the heterogeneity of the population in each NHS Board area and Scotland as a whole. Market Forces Factor (MFF) 156. Since labour costs account for around two-thirds of NHS Board expenditure on hospital and community health services, the researchers concentrated on examining market forces affecting labour costs. They measured geographic variations in private sector pay and tested if these had cost implications for the NHS. They also looked at variations due to market forces affecting the prices of buildings and land. The capital cost of building is funded through the capital allocation formula. However NHS Boards incur
40

capital charges, a revenue item, which reflect the money tied up in assets and these vary according to geographic variations in the costs of building. 157. Although national pay-setting arrangements exist across the NHS, the service faces competition from the private sector for many of the staff groups it employs including cleaners, porters, clerks, administrators, accountants, human resource personnel and managers. This, plus factors such as the cost of living and the attraction of living in certain areas can affect the ability of the NHS to recruit and retain the required staff. These could result in unavoidable direct costs in the form of the level of pay required to induce staff, and indirect costs in the form of higher turnover costs, higher recruitment and training costs and loss of experienced staff. These are justifications for including a market forces factor adjustment within the Formula. 158. The extent of a market forces factor can be measured by mapping the variation in private sector pay rates across the country. The researchers used a technique known as Standardised Spatial Wage Differentials (SSWDs) to map variations in private sector pay across Scotland using data from an annual survey of around 1% of the working population called the New Earnings Survey, now the Annual Survey of Hours and Earnings. These SSWDs are adjusted to take account of differences in the age, sex, occupation and industry of employees so that what is left reflects the real underlying market forces rather than differences in the make-up of the workforce. These SSWDs are shown in Table 7. SSWDs are scaled so that the Scottish average is 100. So, for example, a value of 107 means that wages are 7% higher after adjusting for all other factors. 159. These results revealed significant private sector wage variation in Scotland with the highest labour cost areas in the central belt, Aberdeen City and the Shetland Islands. The researchers also found that these values have changed little over the period 1999-2005. 160. The research examined if NHS employers experienced higher vacancy and turnover rates when they tried to recruit in areas where competition from the private sector was highest. It found a positive correlation between vacancy rates and staff turnover in areas with the highest SSWDs (Technical Report E, sections 6.2.4, 6.2.5). This effect was seen for nurses and allied health professions (AHPs) but not for doctors. The researchers conclude that a market forces factor adjustment based on the SSWDs for the private sector is justified for all staff groups, with the exception of doctors. 161. This adjustment would be based on local authority values in Table 7 mapped onto Boards areas so that the market forces factor would apply to the Boards where patients resided, rather than where they were treated, to be consistent with the rest of the Formula.
41

Table 7 Labour and Buildings costs Market Forces Factors
Local Authority District Labour costs
SSWDs 2003-2005
Buildings costs Location factors
April 2005 Aberdeen City 107.9 0.94 Aberdeenshire 97.6 0.93 Angus 93.5 0.97 Argyll & Bute 92.5 1.07 Scottish Borders, The 90.6 1.05 Clackmannanshire 94.5 1.01 Dumfries & Galloway 94.3 1.00 Dundee City 97.7 0.98 East Ayrshire 92.4 1.02 East Dunbartonshire 101.1 1.03 East Lothian 95.2 1.02 East Renfrewshire 96.6 1.03 Edinburgh, City of 105.2 1.07 Falkirk 102.6 1.01 Fife 96.4 1.01 Glasgow City 101.9 1.03 Highland* 94.6 0.91 Inverclyde 94.5 1.03 Midlothian 96.9 1.02 Moray 93.3 0.93 North Ayrshire 94.3 1.02 North Lanarkshire 100.6 1.03 Orkney Islands 91.1 1.25 Perth & Kinross 94.0 0.97 Renfrewshire 101.1 1.03 Shetland Islands 105.9 1.12 South Ayrshire 101.7 1.02 South Lanarkshire 97.9 1.03 Stirling 96.4 1.01 West Dunbartonshire 102.5 1.03 West Lothian 103.3 1.02 Western Isles 88.5 1.09 Scottish Average 100.0 1.00
* Figure quoted excludes Highland South consisting previously of mainland area of Lochaber and Skye & Lochalsh for which factor is 1.05. 162. The Scottish Executive compile an index of tender prices for public sector building contracts called location factors that demonstrated that there were geographic variations in costs of buildings (Table 7). The researchers propose that these could be used to derive a market forces factor adjustment for buildings by NHS Board. The high building-cost areas were not found to be the same as the high-SSWD areas and, therefore, an adjustment for building costs will not reward the same Boards as the adjustment for labour costs. 163. Data from the Valuation Office on the value of NHS land in different areas of Scotland also showed wide variation in the value of NHS land.
42

However the researchers conclude that better quality data are required on land costs before any recommendation can be made on an adjustment for higher land costs in some areas. Remoteness adjustment for Community health services 164. Although the range and quality of national data on the costs of all community services has increased in recent years, it is still not sufficiently refined to permit robust estimation of an adjustment for community health services. There have, however, been more useful developments in patient activity datasets for the two aspects of community health services - district nursing and health visiting - that formed the basis of the original community health services adjustment in the Arbuthnott Formula. This allowed testing of the assumptions underpinning the adjustment. 165. The current adjustment for remoteness is based on a simulation model for travel-related services by community nurses commissioned from National Economic Research Associates (NERA) at the time of the Arbuthnott Review. The researchers from HERU have developed this model to simulate this activity and give required patient contact times for 42,604 Census Output Areas in Scotland (Technical Report E, chapter 8). These can be aggregated to higher-level geographical areas, such as urban-rural categories or NHS Boards, using estimates of expected demand. 166. Assuming these services are based in settlements of 3,000 or more people, the researchers estimate that the unit costs of district nurse and health visitor services are raised in very remote rural areas by over 75% and 40% respectively. The lower figure for health visitors reflects a lower proportion of their contacts in patients’ homes. 167. This model is based only on activity for district nurses and health visitors which accounts for less than a quarter of community services expenditure. However, the researchers say the model is capable of refinement to create a general model for community services. The key determinant of the excess cost adjustment for rural areas is settlement size. The other remaining elements of community services can be classified into ‘small settlement’ and ‘large settlement’ services and this information used to derive a unit cost adjustment for all community services expenditure. 168. Table 8 gives a summary of the likely effect of such a model. It shows that all areas benefit other than primary cities, urban settlements and accessible small towns.
43

Table 8 Simulated cost indices by category of residence for community health services
Category of residence IndexPrimary Cities 0.963Urban Settlements 0.963Small Towns – Accessible 0.986Small Towns – Remote 1.065Small Towns - Very Remote - Mainland 1.267Small Towns - Very Remote - Island 1.277Rural Areas – Accessible 1.012Rural Areas – Remote 1.124Rural Areas - Very Remote - Mainland 1.534Rural Areas - Very Remote - Island 1.577 Scottish Average 1.000
Remoteness adjustment for hospital services 169. The existing remoteness adjustment, based on a single indicator for road kilometres per head of population, was recalculated for the seven years from 1998/9 to 2004/5. The data on which it is based were found to be highly inconsistent year-on-year and HERU concluded that an adjustment based on these data would not be robust. Another reason for examining alternatives is that the current adjustment cannot be broken down to a sub-NHS Board level. 170. The research sought to refine the hospital services adjustment using data that matched patient activity to hospital expenditure for each data zone in Scotland. They used a cost ratio to analyse the variation in actual local costs relative to the costs for the same care at national average unit costs which are used in needs adjustment. This ensures that it was the excess costs of supplying services locally that is identified and that the needs and supply adjustments of the Formula do not overlap. 171. Cost ratios were analysed for six hospital care programmes: acute; maternity; mental health; geriatric continuing care; people with learning disabilities and outpatient services. They also examined how indicators of case-complexity, and the characteristics of facilities used, varied depending on the urban-rural category of patients’ areas of residence. 172. The results show that costs for maternity, mental health and geriatric continuing care are clearly higher than the national average for residents in more rural and remote categories. There is little evidence of higher costs for acute care, except in the most remote areas. The researchers demonstrated that this is because most of the additional costs for remote and rural areas are reflected in a lower proportion of day cases, longer lengths of stay and a more expensive speciality mix and these costs are subsumed within the needs element of the formula described in chapter 8. 173. These results are summarised in Table 9 which shows that overall the islands and the very remote mainland have the highest costs, with little
44

difference among the other categories. Overall costs of providing hospital services to island residents were found to be approximately 15% higher than the national average.
Table 9 Ratios of local to national average costs by hospital care programme
Category of residence
Acute Maternity Mental health
Geriatric continuing
care
learning disabilities
Out-patients
Total
Primary Cities 101.38 94.75 95.40 96.0 95.6 103.2 100.30
Urban settlements 98.96 101.17 99.73 92.5 103.9 98.9 99.00
Small Towns:
- Accessible 98.68 98.90 104.74 109.0 102.5 95.4 99.31
- Remote 98.64 92.05 110.24 139.6 99.1 91.5 100.02
- Very Remote
Mainland 99.31 132.70 113.45 127.4 104.7 101.4 104.46
Island 104.31 153.97 150.23 117.6 95.2 113.6 114.83
Rural Areas:
- Accessible 98.23 103.08 101.91 102.5 104.0 96.0 98.80
- Remote 97.85 101.67 113.95 136.7 99.9 90.6 100.27
- Very Remote
Mainland 98.26 109.58 109.56 141.6 97.4 93.9 101.15
Island 109.72 145.13 144.36 125.4 95.5 116.5 117.59 174. For hospital services, the researchers say there is potential for double-counting between the remoteness adjustment and market forces factor for labour depending on the extent to which labour costs are reflected in the cost ratios used in the remoteness adjustment. However the researchers recommend that this only affects primary cities and propose that a hospital remoteness adjustment should be applied in addition to a labour cost market forces factor. 9.6 Recommendations 175. HERU recommends that: For community services:
• A market forces factors adjustment for labour costs should be introduced, based on private sector wage variations, and should apply to all staff, with the exception of doctors.
• The existing remoteness adjustment for travel-related services should be
revised using the updated simulation model.
45

For hospital services:
• A market forces factors adjustment for labour costs should be introduced, based on private sector wage variations, and should apply to all staff, with the exception of doctors.
• The existing remoteness adjustment should be replaced by a more
refined method that takes account of higher unit costs in remote areas. This adjustment would reflect increased costs for populations living on Islands, whose costs are increased by 15% (Small Towns) and 18% (Rural Areas), and in Very Remote Small Towns, whose costs are increased by 4%.
In general:
• There may need to be additional adjustments for input prices for land and buildings, but consideration may need to be given to whether these are already reflected in the other proposed cost adjustments.
• The researchers make several recommendations on improving the
quality and completeness of NHS cost and activity data.
NRAC would like your views …. Q12.What are your views on the recommendation to replace the current hospital remoteness adjustment, based on road kilometres per head, with an adjustment based on mapping the actual costs of treating patients living in areas of different levels of remoteness and rurality ? Q13.Is the recommendation to introduce a market forces factor for non-medical staff costs justified based on the comparison of NHS vacancy and turnover rates with private sector wage variations ? Q14.Could the introduction of market forces factors for labour, land and buildings, in addition to the recommended remoteness adjustment for hospital services, lead to double-counting of costs within the Formula ? Q15.Are the assumptions and data sources used in updating the current simulation model for travel-intensive community nursing services appropriate, and are there better alternative sources of data or evidence to support this ? Q16.Do you have any other comments on the recommendations for changes to the adjustment for the excess costs of supply healthcare services within the Formula ? Please respond using the Feedback Form
46

10. Other Resource Allocation Issues 10.1 Other Areas of the NHS Budget 176. NRAC has considered how all the funding from the SEHD to Boards is distributed. As shown in Table 1, the resource revenue allocation accounts for a large proportion of the total funding. Primary Medical Services and Capital funds are already distributed by a separate needs formula and developments are underway to devise needs formulae for the three Primary Care Services as described in section 10.2. The remaining funds account for only around 6% of the total budget. Some of these funds are distributed on the basis of bids from Boards and some are not relevant for distribution using a national formula (e.g. grants, awards, training schemes) or require specific needs formulae (e.g. funding blood borne viruses). See Annex 4 for more details. 177. NRAC has considered how health improvement funding is allocated to the NHS Boards. Activities that contribute to health improvement – such as encouraging people to increase physical activity, improve diet and reduce smoking, alcohol and drug misuse - are wide-ranging and cross all Ministers’ portfolios. Community Planning Partnerships are responsible for planning and implementing integrated and concerted action to improve health. Local authorities and other community planning partners contribute substantial resources to health improvement programmes. They work within the context of locally-agreed health improvement priorities determined through the Joint Health Improvement Planning process. 178. Total funding for health improvement was £114m in 2005-6. Geographical NHS Boards received £61.4m and just over half of that money, £31.5m, was allocated on the basis of the Arbuthnott Formula. Some health improvement funds allocated to Boards outwith the Formula are for specific initiatives or programmes, many of which relate to pilot projects which will inform future policy development and implementation. If such projects establish their effectiveness they would attract mainstream health improvement funding, allocated under the Formula. 179. NRAC does not recommend that distinct formulae be developed for allocating all health improvement funds. It recommends that, wherever possible, the Arbuthnott Formula, or its successor, should be used. Failing that, an element of the Formula should be used and, in cases where the Formula is not used, clear justification should be provided for the method of allocation. 10.2 Primary Care Services 180. Due to time constraints, the Arbuthnott Review did not consider allocation formulae for three of the Family Health Services (FHS), now known as Primary Care Services, namely:
47

• Pharmaceutical Services • General Dental Services • General Ophthalmic Services.
181. The Standing Committee for Resource Allocation (SCRA) subsequently agreed to commission work on these programmes. After some initial delay, Deloitte MCS Ltd was chosen to work on developing these needs based resource allocation formulae. No constraints were placed on the methods to be adopted. It was stated that the research should explore alternative methods for assessing needs, including the scope for using analytical methods similar to those used in the Fair Shares for All report.
182. NRAC was established with a remit to “advise on possible formulaic approaches to the parts of health expenditure not currently covered by the Arbuthnott Formula (e.g. primary care dental, pharmaceutical and ophthalmic services).” Accordingly the reports prepared by Deloitte were submitted to NRAC for consideration in August 2005. NRAC decided to seek the views of a number of relevant organisations, in particular professional bodies and NHS Boards, on the formulae proposed in the three reports before reaching a view on the best way forward. The reports were issued for consultation during December 2005 and January 2006. 183. In total, 21 responses were received from a mixture of NHS Boards, professional organisations and individuals. The responses covered a variety of issues for the three proposed formulae – some looked at all three reports, other concentrated on the report of most direct interest to them. 184. There was a generally positive response to adopting a formulaic approach to allocating funding from most of those who responded. However most also had concerns with the proposed formulae. There were concerns about:
• specific elements of the formula including MLC adjustments, what to do about unmet need, the issue of cross boundary flow and deprivation in rural areas
• data quality and availability • research – more work is needed on some aspects of the formulae • timing – should these formulae be introduced at a time when contracts
are changing? • financial issues – should a formula be used to distribute cash limited
funds when expenditure is largely determined by national contracts ? 185. NRAC has considered the responses and carried out its own review of the formulae. Based on this, and given the contractual changes that have affected these services since the period on which the reports are based, it has decided to carry out further work to develop these formulae. A plan of work has been prepared to revisit the formulae, gather more up to date data, test for stability and further develop the formulae in the light of recent contractual changes. NRAC will then advise on possible formulaic approaches in the Final Report in 2007.
48

10.3 Unmet Need 186. Unmet need for health services can be general or specific. General unmet need occurs if there are insufficient resources to meet the entire needs of the population, and is not an issue for an allocation formula. Specific unmet need occurs when one population group does not use the same level of resources as other population groups with the same level of need. This is an issue for the Arbuthnott Formula because it aims to be needs-based and it derives its measures of relative need from patterns of health care use. 187. Unmet need is most commonly referred to in relation to deprived populations, but it can equally occur in relation to other characteristics, such as ethnicity, rurality, sex, etc. It refers to unmet need for existing health care services. It is not about inequalities in health between population groups. Nor is it about potential new services which might be desirable or from which particular groups might benefit. 188. The pilot exercises which are referred to in the NRAC remit relate to deprivation-related unmet need. The Arbuthnott Committee was concerned about whether people in the most deprived areas made sufficient use of healthcare services compared to their ‘need’ for such services. Research was commissioned to look for evidence of unmet need, concentrating particularly on acute, in patient mental health and prescribing services. A research report was produced for the Inequalities Sub-Group of SCRA to consider1 . 189. The research concluded that there was significant unmet need in the most deprived areas 2 and SCRA recommended an adjustment to the Formula to take account of this. However, before the Formula was changed, it was decided that evidence should be sought as to whether increasing the resources to NHS Boards for deprived areas would improve access to NHS services for people in these areas. This led to the Unmet Needs Pilots being commissioned. Unmet Need Pilot Studies 190. In February 2004, the Health Minister announced the establishment of the Unmet Needs Pilots in three NHS Board areas (Argyll and Clyde, Greater Glasgow and Tayside) at a cost of £15m. The aim of the pilot projects is to provide practical evidence that inequities in access to treatment can be
1 McConnachie and Sutton, ‘Derivation of an Adjustment to the Arbuthnott Formula for Socioeconomic Inequities in Health Care’ etc 2 The results are more complex than suggested by this summary statement. The research found evidence of socioeconomic inequity in all care programmes. However, the nature of this inequity varied across diagnostic groups. It was not always the case that deprived areas had lower than expected use of health care, and even across models with significant shortfalls, there was considerable variation in the size of the population affected. In most cases, the relative needs of the most deprived areas appeared to have been under-estimated, and those of the most affluent areas over-estimated, in the original Arbuthnott work. However, there were some exceptions, in particular for mental health there appeared to be shortfalls in health care use at both ends of the affluence-deprivation spectrum.
49

addressed by directing additional financial resources to the relevant health boards. This would inform whether an adjustment for unmet need should be made to the Arbuthnott Formula. 191. It was initially intended that the outline plans would be approved by July 2004, to enable the pilots to be implemented during 2004-05. The pilot projects were due to be completed by the end of 2005-06 and overall conclusions reached about their effectiveness (and cost-effectiveness) by mid 2006-07. However, it took until November 2005 for all three bids to be approved. The timescales slipped partly due to unexpected difficulties in finding suitable projects for the pilots; difficulties with the interpretation of the pilots by Greater Glasgow ; and (latterly) the dissolution of Argyll & Clyde. 192. A workshop was held in January 2006 to provide an opportunity for the three Boards to share knowledge and experience from the pilots with each other. The Boards have been asked to provide an interim report on progress in September 2006 to feed into NRAC’s consideration of the issue of unmet need for the final report. However, the final evaluation stage of the pilots will not be completed until late 2007. That will be too late to help NRAC decide how the Formula can be adjusted to take account of unmet need. However, any relevant results from the pilots will be reported to NRAC during 2006-07 and will be incorporated in the committee’s final report, together with any recommendations for future work. NRAC research projects 193. The work being carried out on behalf of NRAC on the adjustment for Morbidity and Life Circumstances has involved looking at unmet need. It cannot be assumed, for instance, that a revised specification of the Formula would lead to the same degree of unmet need as the Arbuthnott specification. The researchers looking at the MLC adjustment were therefore asked to carry out similar analysis to the SCRA work, looking for any evidence of unmet need based on their new needs indices. 194. In general they concluded that the four approaches they used did not yield convincing evidence of unmet need. However in one of the methods, which used data from the Scottish Health Survey and proxies for morbidity in small areas, they found some evidence of unmet need for circulatory conditions which, they say, would be worthy of further exploration. 195. NRAC will now consider these results and plan any further work that is necessary in working towards final recommendations on how to treat unmet need within the Formula.
50

NRAC would like your views … Q17.The Formula is designed to allocate funds to Boards to distribute as they see fit. However, how could information be provided to best serve the requirements of Boards in distributing funds within their own areas ? Q18.Unmet need has been defined as the gap between the use of services, on which the Formula is based, and the true underlying need for those services in different parts of the country or among different population groups. Should the Formula take account of unmet need and if so, how ? Q19.How can we ensure that the Formula does not create perverse incentives or reward inefficiency ? Q20.Do you agree with NRAC’s recommendation not to develop distinct formulae for all health improvement funds but to use wherever possible the Arbuthnott formula to allocate funds to Boards ? In addition, do you think the Formula should be extended to allocating any other areas of NHS expenditure not previously considered (see Annex 4) ? Q21.Do you have any other comments on the research and recommendations for change to the Arbuthnott Formula ? Please respond using the Feedback Form
51
11. Feedback 11.1 How to Respond 196. This report has sought to summarise the considerable programme of research work into resource allocation that has been considered by NRAC over the past year. NRAC would now like to receive your views on the proposals and recommendations resulting from this research to help it in the process of developing final recommendations to submit to the Minister. 197. A number of consultation questions relating to the research have appeared throughout this report. These questions have been collated in a Feedback Form which accompanies this report available at www.nrac.scot.nhs.uk/consultation.htm. Please use this Feedback Form to complete your responses to the questions, using as much space as necessary, and return it by email to: [email protected] 198. The consultation questions are also collated in Annex 6 of this report. Hard-copy responses to these questions can be sent to the NRAC Secretary at:
Ross Scott Basement Rear St Andrew’s House EDINBURGH EH1 3DG
Fax: 0131 244 2371
Feedback should be returned by Friday 29 September 2006, the final date for receipt of comments. 11.2 Handling your response 199. We need to know how you wish your response to be handled and, in particular, whether you are happy for your response to be made public. A Respondent Information Form, which will ensure that we treat your response appropriately, should also be completed and can be found within the Feedback Form or in Annex 7. 200. If you ask for your response not to be published we will regard it as confidential, and we will treat it accordingly. All respondents should be aware that the Scottish Executive is subject to the provisions of the Freedom of Information (Scotland) Act 2002 and would therefore have to consider any request made to it under the Act for information relating to responses made to this consultation exercise.
52
11.3 Next Steps 201. NRAC will use the consultation responses to help develop an improved formula. Where respondents have given permission for their response to be made public these will be made available to the public on the NRAC website. We will check all responses where agreement to publish has been given for any potentially defamatory material before placing them on the website. 202. NHS will be updated on a new formula in early 2007 and a final report, including recommendations, will be prepared for the Minister for Health and Community Care for mid-2007. On the basis of this, and any possible further considerations, any changes to the current Formula may not be implemented before the allocations for 2009-10. 203. In the meantime, the current Arbuthnott Formula will continue to be used by the Scottish Executive Health Department to allocate funds to Boards until any changes have been agreed by the Minister in the light of the final recommendations made by NRAC. 204. The Committee looks forward to hearing your views on their work so far. To keep up-to-date on the progress of NRAC please see the NRAC website at www.nrac.scot.nhs.uk.
53

References and Links NHSScotland Resource Allocation Committee NHSScotland Resource Allocation Committee website http://www.nrac.scot.nhs.uk/ Technical Report A: A Brief History of the Arbuthnott Formula since ‘Fair Shares for All’. Technical Report B: Review of the Population Basis of the Arbuthnott Formula. Technical Report C: Review of the Resource Allocation Adjustment for Age and Sex Cost Weights. Technical Report D: Review of the Resource Allocation Adjustment for Healthcare Needs due to Morbidity and Life Circumstances and Other Factors. Technical Report E: Geographic Differences in the Costs of Delivering Health Services in Scotland: Implications for the National Resource Allocation Formula. http://www.nrac.scot.nhs.uk/consultation.htm Key Data Sources Scottish Neighbourhood Statistics http://www.sns.gov.uk/ Information Services, NHS National Services Scotland http://www.isdscotland.org Scottish Health Service Costs (Cost Book) http://www.isdscotland.org/costs Practice Team Information (PTI) http://www.isdscotland.org/pti General Register Office for Scotland http://www.gro-scotland.gov.uk/statistics/library/index.html Scotland’s Census 2001 http://www.gro-scotland.gov.uk/statistics/census/censushm/index.html Scottish Health Survey http://www.scotland.gov.uk/Topics/Statistics/17861/10352 Scottish Executive Urban Rural Classification 2003-4 http://www.scotland.gov.uk/Publications/2004/06/19498/38784 Scottish Index of Multiple Deprivation 2004
54

http://www.scotland.gov.uk/stats/simd2004/ Annual Survey of Hours and Earnings (Office for National Statistics) http://www.statistics.gov.uk/statBase/product.asp?vlnk=13101 Research on Resource Allocation for Family Health Services The Development of a Needs Based Resource Allocation Formula for Primary and Community Dental Services in Scotland. Deloitte MCS Limited. (2005). The Development of a Needs Based Resource Allocation Formula for General Ophthalmic Services in Scotland. Deloitte MCS Limited. (2005). The Development of a Needs Based Resource Allocation Formula for Pharmaceutical Services in Scotland. Deloitte MCS Limited. (2005). http://www.nrac.scot.nhs.uk/research.htm Previous Reviews Fair Shares For All Report of the National Review of Resource Allocation for the NHS in Scotland. Scottish Executive. (1999). (http://www.scotland.gov.uk/library2/doc01/fsag-00.htm) A Short Guide to the Report of the National Review of Resource Allocation for the NHS in Scotland. Scottish Executive. (1999). http://www.scotland.gov.uk/library2/doc01/fsas-00.htm Technical Report. Scottish Executive. (1999). (http://www.scotland.gov.uk/library2/doc02/fsat-00.htm) Final Report. Scottish Executive. (2000). (http://www.scotland.gov.uk/fairshares/docs/fsfa-00.asp) A Guide to the Final Report. Scottish Executive. (2000). http://www.scotland.gov.uk/fairshares/docs/fsfg-00.asp Standing Committee on Resource Allocation. SCRA Newsletter No. 1. Scottish Executive. (2002) http://www.show.scot.nhs.uk/sehd/publications/dc20020520scranews1.pdf SCRA Newsletter No. 2. Scottish Executive. (2004) http://www.show.scot.nhs.uk/sehd/publications/DC20040326SCRAnews2.pdf
55

Previous Resource Allocation Research Assessing the Excess Cost of Delivering Community Health Services in Remote and Rural Areas of Scotland. National Economic Research Associates (NERA). (1999). http://www.nera.com/image/3849.pdf Derivation of an Adjustment to the Arbuthnott Formula for Socioeconomic Inequities in Health Care. McConnachie A., Sutton M. (2004). http://www.scotland.gov.uk/Publications/2004/02/18945/33395 Research on Addition Costs of Teaching in NHSScotland. Final Report. Spollen et al. (2003). http://www.scotland.gov.uk/Resource/Doc/47171/0013508.pdf
Other UK Health Resource Allocation Formulae Department of Health – Revenue Allocations http://www.dh.gov.uk/PolicyAndGuidance/OrganisationPolicy/FinanceAndPlanning/Allocations/AllocationsArticle/fs/en?CONTENT_ID=4108515&chk=t1hmGo Allocation of Resources to English Areas; Individual and Small Area Determinants of Morbidity and Use of Healthcare Resources. Report to the Department of Health. Sutton, M. et al. (2002). (http://www.isdscotland.org/isd/info3.jsp?pContentID=2859&p_applic=CCC&p_service=Content.show&) Targeting Poor Health. Professor Townsend’s Report of the Welsh Assembly’s National Steering Group on the Allocation of NHS Resources (Volume 1). The National Assembly for Wales. (2001). http://www.wales.nhs.uk/sites3/docopen.cfm?orgid=452&ID=50141&F27C0D8E-72BF-44F7-A2D4191612FA36C6 Targeting Poor Health. Report of the Welsh Assembly’s National Steering Group on the Allocation of NHS Resources. Volume 2: Independent Report of the Research Team. The National Assembly for Wales. (2001). http://www.wales.nhs.uk/publications/1-NHS-ALL-LO_RES.pdf
56

Annex 1 Committee Membership Dr Karen Facey , self-employed evidence-based health policy consultant and non-executive Director of Forth Valley NHS Board (Chair) Reverend Alistair Bennett , Minister, Melrose Parish Church and former non-executive Director of Borders NHS Board (Alistair’s appointment to the Board ceased on 31 March 2006.) Dr Colin Brown , General Medical Practitioner, Glenburn Health Centre, Paisley Richard Copland , Director, ex Information and Statistics Division, NHS National Services Scotland and currently Director for National Programme for Information Technology (NPfIT) at Avon, Gloucestershire and Wiltshire Strategic Health Authority. Dr Frances Elliot , Medical Director, Fife NHS Board (pro-tem Vice Chair) Malcolm Iredale , Director of Finance, Highland NHS Board Ms Kirsten Major , Director of Strategic Planning and Performance, Ayrshire and Arran NHS Board Alexander Smith , Formerly Interim Chief Executive, Grampian NHS Board (Vice-Chair). On leaving Grampian NHS Board in January 2006, Alex has been Interim Director of Finance within the Scottish Executive Health Department and whilst holding that post has stood down as Vice-Chair of NRAC. Professor Matthew Sutton , Professor of Health Economics, Health Economics Research Unit, University of Aberdeen. Co-opted members: Dr Marion Bain , Medical Director, NHS National Services Scotland - Information Services Support is provided from the Scottish Executive Health Department by the following members: Duncan Buchanan, Statistician, Analytical Services Division (NRAC Project Manager) Mrs Angela Campbell , Economic Adviser, Analytical Services Division Keith MacKenzie , Economic Adviser, Analytical Services Division David Palmer , Deputy Director of Finance (till his retiral in April 2006) Dr Jonathan Pryce, Head of Primary Care Division (since January 2006) Ross Scott , Head of Policy Implementation and Development Branch, Health Finance Division (Secretary)
57

Dr Hamish Wilson CBE, Head of Primary Care Division (till his retiral in January 2006) Support is provided from the Information Services Division in NHS National Services Scotland by: Ms Jennifer Bishop , Senior analyst, Information Services
58
ANNEX 2 NRAC Core Criteria Equity — the primary consideration should be to achieve the greatest possible accuracy in capturing the cost implications of variations in need across the country, in order to develop a formula that delivers the greatest possible equity of access to health services.
Practicality — use should be made of good-quality, routinely-collected data, in order to produce an administratively feasible formula that can be readily updated.
Transparency — the rationale informing the formula’s methodology should be explicable and any judgements should be made explicit, although this should not lead to over-simplification of details which might add precision to the methods.
Objectivity — the formula should as far as possible be evidence-based, using as necessary the full range of available robust data, although it should guard against perverse incentives and any consequences which might threaten the integrity of the data.
Relevance — there is a need to avoid the dangers of extrapolation and to make explicit where hard information is being used about one aspect of a service to make some assumption about an area where information is less good or absent.
Stability — there should be a reasonable degree of year-to-year stability in the formula.
Responsiveness — the formula should result in shifts in the allocation of resources in response to changes in the need for healthcare services.
Evaluability — the recommended formula should be capable of being tested against the objective of increasing equity of opportunity of access. Face validity — the outcome of any changes to the formula should be subjected to a 'common-sense' check.
59

ANNEX 3 Care programmes and diagnostic groups Care Programme Diagnostic Group Acute Cancer circulatory diseases respiratory diseases diseases of the digestive
system injuries and poisonings other acute Mental Illness Schizophrenia Dementia non-psychotic conditions substance misuse other mental illness Care of the Elderly Maternity Learning Disabilities Community district nursing heath visiting GP Prescribing Gastrointestinal Circulatory mental illness Infections musculoskeletal and joint
diseases other GP prescribing
60

ANNEX 4 NHS Budgets and Method of Distribution
Budget % of total
budget Method of Distribution NHS Boards 68.3% Unified Budget - Arbuthnott Formula Special Health Boards 8.7% Separate allocations made on basis of needs National Priorities: Cancer Services 0.3% Unified Budget -Arbuthnott Formula Coronary Heart Disease/Stroke 0.2% Unified Budget - Arbuthnott Formula Delayed Discharge 0.3% Separate Allocation - Arbuthnott Formula Drug Misuse expenditure by NHS Boards 0.3% Separate Allocation on basis of specific formula Centre for Change & Innovation 0.3% Separate allocations made on the basis of bids Audiology Services Modernisation 0.1% Separate Allocation - Arbuthnott Formula Funds for National Priorities Incl. Waiting Times
0.5% Separate allocations made on the basis of bids
Education & Training: Nurse Education & Training 1.4% Central Payments to Provider Education & Training Other 0.1% Separate allocations on basis of bids/specific projectsPrimary Care Services: General Medical Services 7.3% GMS Formula Pharmaceutical Services 1.3% Indicative allocations on basis of historic spending General Dental Services 2.6% Indicative allocations on basis of historic spending General Ophthalmic Services 0.5% Indicative allocations on basis of historic spending Miscellaneous Services: Research Support 0.4% Separate allocation on basis of bids IT Revenue 0.4% Separate allocations made on the basis of bids NHS Central Register 0.0% Separate allocation made on the basis of actual cost Waiting Times Co-ordinating Unit 0.1% Separate allocations made on the basis of bids Glasgow Hostels 0.1% Single Allocation to Glasgow Distinction Awards 0.2% Actual Costs Impairments 0.3% Separate allocations made on the basis of bids Miscellaneous Hospital & Community Services
0.4%
NHS Receipts -1.2% N.A. Capital Investment: Capital 4.8% Variation of Arbuthnott Formula Capital Receipts -0.1% N.A. Unallocated Resources: Departmental Unallocated Provision 0.5% N.A. Health Improvement: Health Improvement 0.6% Separate Allocations related to specific projects Blood borne Virus 0.1% Separate Allocation using Specific Formula Mental Wellbeing Fund 0.1% Separate Allocations related to specific projects Drug Misuse 0.1% Separate Allocations related to specific projects Other Health Services: Training for Prosthetists and Orthotists 0.0% Central Payments Grants to Voluntary Bodies 0.0% Separate allocations made on the basis of bids Miscellaneous Other Health Services 0.1% Research 0.2% Separate allocations made on the basis of bids Welfare Foods 0.2% Central Payments based on actual costs Mental Health Act Implementation 0.2% Separate allocations made on the basis of bids Scottish Low Income Scheme Administration
0.0% Central Payments
Other Health Service Receipts -0.0% N.A. Community Care:
61

Grants to the Voluntary Sector 0.0%Separate allocations made on basis of bids Scottish Commission for the Regulation of Care
0.3%Separate allocation made to Commission
Scottish Commission for the Regulation of Care -Income
-0.1%N.A.
Mental Illness Specific Grant 0.2%Separate allocations made on the basis of bids TOTAL 100.0% Percent figures are sourced from the Scottish Executive Draft Budget 2005-06
62

Annex 5 Glossary of Acronyms AHP Allied Health Professional CHI Community Health Index – database of patients
registered with GPs FHS Family Health Services – now Primary Care Services,
covering services provided by pharmacists, dentists and optometrists
GMS General Medical Services – now Primary Medical Services, covers services provided by GP practices
GROS General Register Office for Scotland HCHS Hospital and Community Health Services – Healthcare
budget to which the Arbuthnott Formula is applied HERU Health Economics Research Unit ISD Information Services Division – part of NHS National
Services Scotland, a Special Health Board MLC Morbidity and Life Circumstances – an adjustment
within the Arbuthnott Formula covering the need for healthcare in addition to age and sex
MYE Mid-year estimate – population estimate published by GROS
NERA National Economic Research Associates NRAC NHSScotland Resource Allocation Committee NRRA National Review of Resource Allocation – or Arbuthnott
Review, predecessor to SCRA PTI Practice Team Information – GP practice database
maintained by ISD SCRA Standing Committee for Resource Allocation –
predecessor to NRAC SEHD Scottish Executive Health Department SHARE Scottish Health Authorities Revenue Equalisation –
predecessor to the Arbuthnott Formula SMR01 Scottish Morbidity Record – patient activity data scheme
collected by ISD with different schemes covering different patient types (e.g. SMR01 for inpatients)
SSWD Standardised Spatial Wage Differential – a method of comparing variation in wages across geographical areas
63

ANNEX 6 Consultation Questions Population Q1. Is there a better alternative to continuing to use the General Register Office for Scotland as the source of data on Boards’ resident populations for hospital and community services within the Formula ? Q2. Should the Formula move to using re-based population projections, rather than mid-year estimates as at present, to better reflect the populations using services in the allocation year ? Q3. Do you have any other comments on the recommendations for changes to the population basis of the Formula ? Age-sex Cost weights Q4. Are there more appropriate sources of data for the age-sex profile of patients accessing community services than those proposed in Table 4 ? Q5. Is there a better alternative to the recommendation that prescribing cost weights should continue to be based on the national random sample of prescriptions, pooled across several years data to improve stability and precision ? Q6. Do you have any other comments on the recommendations for changes to the age-sex cost weights within the Formula ? Healthcare Needs due to Morbidity and Life Circumstances Q7. What are your views on the first two options proposed by the researchers recommending separate needs indices and supplementary variables ? Q8. What are your views on their additional option that no MLC adjustment is required for certain care programmes and diagnostic groups for which the needs indices explain very little of the variation in costs ? Q9. Can you help us explain why, for maternity and outpatients in particular, variation in costs across the country are largely explained by differences in levels of activity among Boards, rather than indicators of need, and how should this be taken account of in a resource allocation formula ? Q10. What are your views on the recommendation that data on ethnic minorities and asylum seekers should not be included in the need indices within the Formula but allocation should be addressed via separate mechanisms ?
64

Q11. Do you have any other comments on the recommendations for changes to the adjustment for healthcare needs due to MLC within the Formula ? Excess Cost of Supplying Healthcare Services Q12. What are your views on the recommendation to replace the current hospital remoteness adjustment, based on road kilometres per head, with an adjustment based on mapping the actual costs of treating patients living in areas of different levels of remoteness and rurality ? Q13. Is the recommendation to introduce a market forces factor for non-medical staff costs justified based on the comparison of NHS vacancy and turnover rates with private sector wage variations ? Q14. Could the introduction of market forces factors for labour, land and buildings, in addition to the recommended remoteness adjustment for hospital services, lead to double-counting of costs within the Formula ? Q15. Are the assumptions and data sources used in updating the current simulation model for travel-intensive community nursing services appropriate, and are there better alternative sources of data or evidence to support this ? Q16. Do you have any other comments on the recommendations for changes to the adjustment for the excess costs of supply healthcare services within the Formula ? General Questions Q17. The Formula is designed to allocate funds to Boards to distribute as they see fit. However, how could information be provided to best serve the requirements of Boards in distributing funds within their own areas ? Q18. Unmet need has been defined as the gap between the use of services, on which the Formula is based, and the true underlying need for those services in different parts of the country or among different population groups. Should the Formula take account of unmet need and if so, how ? Q19. How can we ensure that the Formula does not create perverse incentives or reward inefficiency ? Q20. Do you agree with NRAC’s recommendation not to develop distinct formulae for all health improvement funds but to use wherever possible the Arbuthnott Formula to allocate funds to Boards ? In addition, do you think the Formula should be extended to allocating any other areas of NHS expenditure not previously considered (see Annex 4) ? Q21. Do you have any other comments on the research and recommendations for change to the Arbuthnott Formula ?
65

ANNEX 7 Respondent Information Form IMPROVING THE ARBUTHNOTT FORMULA Please complete the details below and return it with your response. This will help ensure we handle your response appropriately. Thank you for your help. Name: Postal Address: 1. Are you responding: (please tick one box) (a) as an individual go to Q2a/b and then Q4 (b) on behalf of a group/organisation go to Q3 and then Q4 INDIVIDUALS 2a. Do you agree to your response being made available to the public (on the
NRAC website)? Yes (go to 2b below)
No, not at all We will treat your response as confidential 2b. Where confidentiality is not requested, we will make your response available to the public on the following basis (please tick one of the following boxes) Yes, make my response, name and address all available Yes, make my response available, but not my name or address Yes, make my response and name available, but not my address ON BEHALF OF GROUPS OR ORGANISATIONS 3 The name and address of your organisation will be made available to the public (on the NRAC website). Are you also content for your response to be made available? Yes No We will treat your response as confidential SHARING RESPONSES/FUTURE ENGAGEMENT 4 We will share your response internally with other Scottish Executive policy teams who may be addressing the issues you discuss. They may wish to contact you again in the future, but we require your permission to do so. Are you content for the Scottish Executive to contact you again in the future in relation to this consultation response? Yes No
66


www.nrac.scot.nhs.uk