Embed Size (px)
Citation preview

2012 International Conference on Diabetes and Metabolism
Improving statistical powers in large scale
genetic association studies
Taesung Park
Bioinformatics and Biostatistics (BIBS) Laboratory
Department of Statistics
Seoul National University
� Improving Powers in Genome-Wide Association Studies(GWAS)
1. Analysis of Multiple SNPs
① Regularized Regression (Elastic-Net)
② Multifactor Dimensionality Reduction
③ Gene-set analysis
2. Multivariate Analysis
� T2D Consortium supported by NIDDK and preliminary analysis
� Improving Powers in Next Generation Sequencing Analysis
Introduction Elastic-Net MDR Gene Set Multivariate T2D Consortium
Genome Wide Association Studies : GWAS
• Studies of genetic variation across the entire genome
• Designed to identify associationsbetween genetic markers & observable traits, or the presence/absence of a disease
• Rely on research tools and technologies (eg. Affy SNP chips)
Introduction

Published Genome-Wide Associations through 06/2011,
1,449 published GWA at p≤5x10⁻⁸ for 237 traits
NHGRI GWA Catalog
www.genome.gov/GWAStudies

237 traits237 traits

Introduction Elastic-Net MDR Gene Set Multivariate T2D Consortium
5
2000 2003 2009 / 20102006 2007 2008
PPARG KCNJ11
Candidate Gene Studies
For purposes of presentation, loci are named
according to a nearby gene of interest. In
only a few cases is the causal gene yet
proven.
TCF7L2
Linkage studies of Mendelian subtypes
MODY1-6
1990’s
GWAS of Type 2 diabetes
HNF1B
WFS1
THADA
NOTCH2
ADAMTS9
JAZF1
CAMK1D
TSPAN8
KCNQ1
IRS1
HMGA2
CHCHD9
BCL11A
HNF1A
ZBED3
KLF14
TP53INP1
9p21
IGF2BP2
CDKAL1
HHEX/IDE
SLC30A8
FTO
54 regions containing genes influencing T2D risk
SRR
PTPRD
DGKB
PROX1
GCKR
GCK
ADCY5
HCCA2
CENTD2
PRC1
ZFAND6
KCNQ1 [2]
DUSP9
RBMS1
UBE2E2
SPRY2
FAM148A
GWAS of Related Traits
MTNR1B
[Slide courtesy of David Altshuler]
T2D genetics through 2011
Introduction

Introduction Elastic-Net MDR Gene Set Multivariate T2D Consortium
Korea Association Resource (KARE) Project
• To identify genetic factors of quantitative clinical traits and life-style related diseases (eg. T2DM) from Genome-Wide Association Study using population-based cohorts
Objective
• Over 10,000 subjects from two community-based cohorts in Korea (Ansung & Ansan cohorts)
• Affymetrix 5.0
• Over 10,000 subjects from two community-based cohorts in Korea (Ansung & Ansan cohorts)
• Affymetrix 5.0
Genotyping
First high density large scale GWA Study
performed in the East Asian population
Courtesy of KNIH
Introduction
Introduction Elastic-Net MDR Gene Set Multivariate T2D Consortium
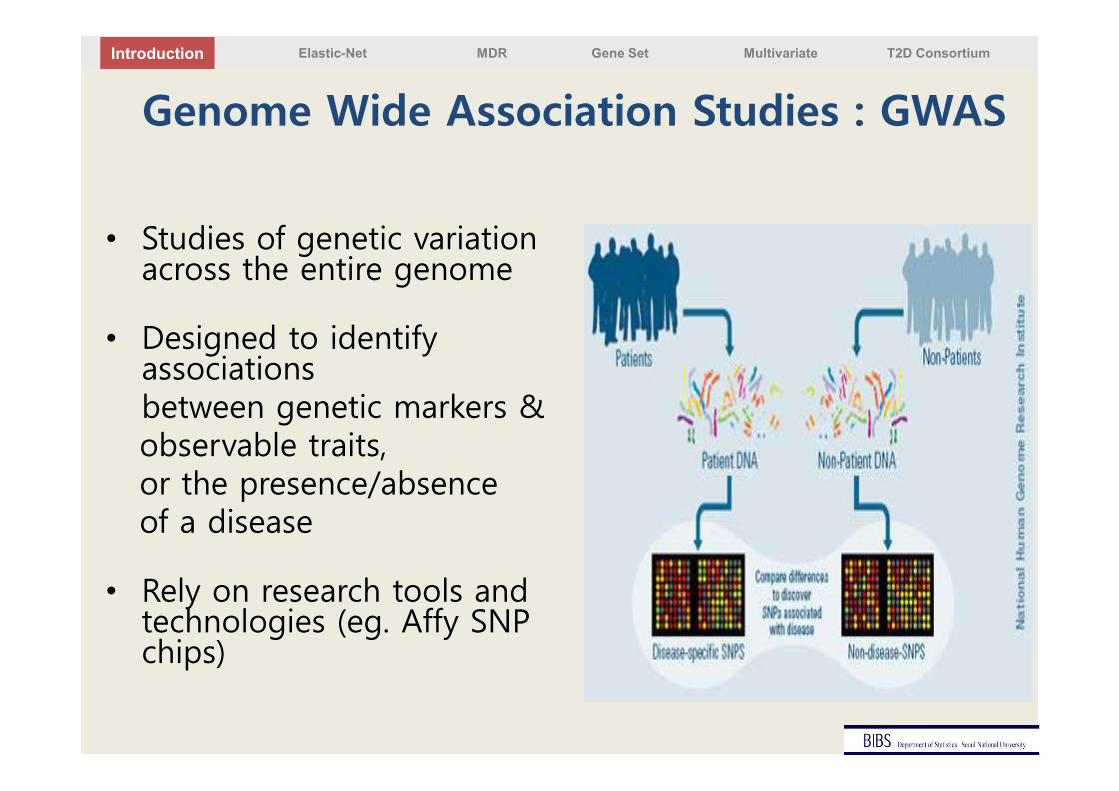
KARE: Characteristics
Baseline study
Ansung Ansan
Participants 5,018 5,020
Sex (women/men)2,778/2,240
2,497/2,523
Age (mean) 55.5 49.1
40th (%) 31.2 62.8
50th (%) 29.1 23.0
60> (%) 39.6 14.3
Courtesy of KNIH
Introduction

Introduction Elastic-Net MDR Gene Set Multivariate T2D Consortium
KARE: Result
SNPSNP
Clinical DataClinical Data
2009 Nature genetics
Detection of 11 SNPs influencing traits in Korean
population
Blood pressure, pulse rate, BMI, height, waist-hip ratio,
bone mineral density
Taesung Park
Introduction

Introduction Elastic-Net MDR Gene Set Multivariate T2D Consortium
Current GWA Analysis
• Single SNP analysis– Focus on one phenotype and single SNP
–
– Report the SNPs with high significance at α=1×10⁻⁸
εββ ++= iSNPTrait 10
Common Complex
Trait
Common Complex
Trait
SNP K
SNP K
SNP K
SNPJ
SNPJ
SNPJ
SNP I
SNP I
SNP I
SNP1
SNP1
SNP1
SNP2
SNP2
SNP2
……
SNP 500K
Introduction

Introduction Elastic-Net MDR Gene Set Multivariate T2D Consortium
Challenges in GWAS• Common complex traits are related with many genes
• Low power– Not easy to identify genetic variants with high significance at α=1×10⁻⁸
• Not easy to get replicated results
• Further, these variants explain only small fraction of disease etiology– Confounding effects
– Gene-gene and/or gene-environment interaction
• Need to develop a more powerful method for identifying genetic variants
Introduction

Introduction Elastic-Net MDR Gene Set Multivariate T2D Consortium
Methods for Improving Power in GWAS
1. Meta analysis
2. Analysis of multiple SNPs① Regularized Regression (Elastic-Net)
② Gene-Gene Interaction
Multifactor Dimensionality Reduction
③ Gene Set Analysis
3. Multivariate analysis
Introduction

Introduction Elastic-Net MDR Gene Set Multivariate T2D Consortium
GWAS meta-analysis using KARE
Nature, 2010Nature, 2010
Detection of 95 loci influencing traits in 100K European
population and replication study in non-European
populations (East Asians, South Asians, and African Americans)
Total cholesterol (TC), LDL-C, HDL-C, TG
Identifying potential novel drug targets for treatment of extreme
Lipid phenotypes and prevention of coronary artery disease (CAD)
SNPSNP
Clinical DataClinical Data
Lipid TraitsLipid Traits
European /Non-EuropeanEuropean /Non-European
,
Biological, Clinical, and Population Relevance of
95 Loci Mapped for Serum Lipid Concentrations
Tanya M. Teslovich1,118, Kiran Musunuru2,3,4,5,6,118, Albert V. Smith7,8, Andrew C. Edmondson9,10, Ioannis M. Stylianou10, Masahiro Koseki11, James P. Pirruccello2,5,6, Samuli Ripatti12,13, D.. , Yoon Shin Cho29, Min Jin Go29, Young Jin Kim29, Jong-Young Lee29, Taesung Park30, Kyunga J. Kim31,32, ..... , Gonçalo R. Abecasis1,119, Michael Boehnke1,119, Sekar Kathiresan2,3,4,5,119
Introduction

Introduction Elastic-Net MDR Gene Set Multivariate T2D Consortium
GWAS meta-analysis using KARE
Nature Genetics, 2011Nature Genetics, 2011
Detection of 10 loci influencing traits in east Asian populations
SNPSNP
Clinical DataClinical Data
Metabolic TraitsMetabolic Traits
East Asian (Korea, China, Japan)East Asian (Korea, China, Japan)
Large-scale genome-wide association studies in
east Asians identify new genetic loci influencing
metabolic traits Young Jin Kim, Min Jin Go, Cheng Hu, Chang Bum Hong, YunKyoung Kim, , D.. , Yukinori Okada, Atsushi Takahashi, Michiaki Kubo, Toshihiro Tanaka, Naoyuki Kamatani, Koichi Matsuda, MAGIC consortium, Taesung Park, Bermseok Oh, Kuchan Kimm, Daehee Kang, Chol Shin, Nam H Cho, Hyung-Lae Kim, Bok-Ghee Han, Jong-Young Lee & Yoon Shin Cho
High density lipoprotein cholesterol (HDLc), fasting plasmaglucose (FPG), albumin (ALB), blood urea nitrogen (BUN), gammaglutamyl transferase (GGT), alanine aminotransferase (ALT),aspartate aminotransferase (AST).
Introduction

Introduction Elastic-Net MDR Gene Set Multivariate T2D Consortium
T2D GWAS meta-analysis using KARE
Nature Genetics, 2012Nature Genetics, 2012
Detection of 8 loci influencing T2D in east Asian populations
SNPSNP
Clinical DataClinical Data
Type 2 diabetesType 2 diabetes
East Asian
(Korea, China, Singapore, Japan)
East Asian
(Korea, China, Singapore, Japan)
Meta-analysis of genome-wide association
studies identifies eight new loci for type 2
diabetes in east AsiansYoon Shin Cho, Chien-Hsiun Chen, Cheng Hu, Jirong Long, Rick Twee Hee Ong, Xueling Sim, Fumihiko Takeuchi, Ying Wu, Min Jin Go, Toshimasa Yamauchi, Yi-Cheng Chang, Soo Heon Kwak, Ronald C W Ma, Ken Yamamoto, D.. Bok-Ghee Han & Mark Seielstad
Findings from this study highlight not only previously unknownbiological pathways but also population specific loci for T2D.The association of rs9470794 in ZFAND3 with T2D seems to behighly specific to east Asian populations
Introduction

1. Meta Analysis
2. Analysis of multiple SNPs① Regularized Regression (Elastic-Net)
② Gene-Gene Interaction
Multifactor Dimensionality Reduction
③ Gene Set Analysis
3. Multivariate analysis
mproving powers in GWAS

Introduction Elastic-Net MDR Gene Set Multivariate T2D Consortium
y
x1
x2 = 1
x2 = 2
No
information
Multiple SNP AnalysisWhy multiple?
Elastic-Net

Introduction Elastic-Net MDR Gene Set Multivariate T2D Consortium
y
x1
x2 = 1
x2 = 2
No
information
Multiple SNP AnalysisWhy multiple?
Elastic-Net

Introduction Elastic-Net MDR Gene Set Multivariate T2D Consortium
Multiple SNP Analysis
• Gene-gene interaction analysis
Elastic-Net

Introduction Elastic-Net MDR Gene Set Multivariate T2D Consortium
Multiple SNP Analysis
� Current GWAS
� Simple regression:
� Parallel application for each of 500K SNPs
� Multiple regression
� Model:
� High dimensionality (n << p): n = 8842, p = 500K
� Correlation among input variables: LD among SNPs
),,1( 110 njSNPSNPy jpjpjj LL =++++= εβββ
),,1,,,1( 0 njpiSNPy ijijiij LL ==++= εββ
Elastic-Net

Introduction Elastic-Net MDR Gene Set Multivariate T2D Consortium
2020
Regularization
� Key idea: introduce ‘additional information’ to solve an ill-posed problem
– Ill-posed problems� Small n, large p
n << p : Problem of “Curse of dimensionality”
� Correlation among input variable
• Regularization methods
– LASSO (L1 penalty)
– Ridge regression (L2 penalty) – Elastic-net, composite absolute penalties
Elastic-Net

Introduction Elastic-Net MDR Gene Set Multivariate T2D Consortium
2121
Challenges in Regularization-based variable selection
• No p-values for selected SNPs– cf. testing-based variable selection
– Unable to provide statistical significance of selected variables
– Hard to discuss false positives
• Bootstrap selection stability (BSS)
– Generate B bootstrap datasets
– Bootstrap sample is constructed by random sampling with replacement from the original dataset
– Conduct EN variable selection with each bootstrap dataset
– Calculate BSS for each selected SNPs
Elastic-Net

Introduction Elastic-Net MDR Gene Set Multivariate T2D Consortium
Explanatory Power of Identified SNPsApplication of EN to KARE
Proposed three-stage (solid) vs. standard (dotted) approaches
– This power difference increased as the number of the
SNPs in multiple regression models increased.
Elastic-Net

Introduction Elastic-Net MDR Gene Set Multivariate T2D Consortium
23
Elastic-Net

1. Analysis of multiple SNPs① Regularized Regression (Elastic-Net)
② Gene-Gene Interaction
Multifactor Dimensionality Reduction
③ Gene Set Analysis
2. Multivariate analysis
mproving powers in GWAS

Introduction Elastic-Net MDR Gene Set Multivariate T2D Consortium
Multifactor-Dimensionality Reduction (MDR)
• Method for detecting and characterizing interactions in common complex multifactorial disease (Ritchie et al., 2001)
• Applicable even when sample size is small or dataset contains alleles in LD
• Indicate which alleles or genotypes increase susceptibility (High, Low)
MDR

Introduction Elastic-Net MDR Gene Set Multivariate T2D Consortium
Bioinformatics
Bioinformatics
Bioinformatics
Genetic Epi
BMC Bioinformatics
Bioinformatics
MDR: by BIBSMDR

Introduction Elastic-Net MDR Gene Set Multivariate T2D Consortium
Increase in Search Space
MDR

Introduction Elastic-Net MDR Gene Set Multivariate T2D Consortium
Architecture of Graphic Process Unit
ALU : Arithmetic-logic unit
(4-cores) (128-cores)
GPU-G/MDR GPU version
MDR

Introduction Elastic-Net MDR Gene Set Multivariate T2D Consortium
# SNP Xeon
(1 core)
Xeon
(100 cores)
3 GPU
(1 node)GTX285
8 GPU
(4 nodes)
(= Xeon 17800 cores)Tesla M2070
100K 12.5 days 3 hrs 50 min 2 min
500K 10mon 3days 3hrs 1day 20hrs 27 min
1M 3yr 5mon 12days 11hrs 3days 9hrs 2 hrs
2M 13yr 1mon 19days 13days 12hrs 7 hrs
3M 30yr 3mon 22days 1 mon 16 hrs
#sample : 1000, no. of cross-validation : 1
GPU-based Computing
SNP chip
Reseq.
CPU-based Computing
GTX285Tesla M2070
Performance Comparison (CPU-based GWAS-GMDR vs. GPU-based GWAS-GMDR)
MDR

Introduction Elastic-Net MDR Gene Set Multivariate T2D Consortium
A generalized GWAS-MDR that permits adjustment for covariates.
A program for visualizing gene-gene interaction in genetic association analysis
GWAS-GMDR
CuGWAM
R packageR package
CPU based
clusters
CPU based
clusters
GPU based system
GPU based system
Odds ratio based multifactor-dimensioinalityreduction methodOR-MDR
A program for genome-wide association analysis based on multifactor dimensionality reductionGWAS-MDR
MDR method for ordinal phenotypes in Gene-Gene interaction analysisOrdinal MDR
Ultra-high performance G/MDR program based on GPU (graphic processing unit)GPU-G/MDR
Software by BIBSMDR

Introduction Elastic-Net MDR Gene Set Multivariate T2D Consortium
Application of MDR to KARE Top 20 Two-way Interactions for BMI
Rank Best combination WCVC Aver. Train BA Aver. Test BA gene1 gene2
1 rs11590737 rs1793699 9.962234 0.577627 0.574391 PYHIN1
2 rs1578477 rs1793699 9.925482 0.575497 0.572283
3 rs1615480 rs1793699 9.925479 0.575497 0.572283 PYHIN1
4 rs856127 rs1793699 9.918798 0.575109 0.573035
5 rs7517009 rs11000212 9.898516 0.573933 0.571749 PM20D1 ASCC1
6 rs1861985 rs4921336 9.897281 0.573854 0.563459 ATP10B
7 rs4666111 rs11000212 9.896606 0.57382 0.563811 PLB1 ASCC1
8 rs2274226 rs17519968 9.888902 0.573366 0.573365 C1orf182
9 rs1861985 rs7732722 9.885448 0.573168 0.564004 ATP10B
10 rs2274226 rs12880601 9.884424 0.573106 0.573115 C1orf182
11 rs2597876 rs11000212 9.882513 0.573002 0.569767 ASCC1
12 rs2597875 rs11000212 9.881824 0.572963 0.568686 ASCC1
13 rs2274226 rs17519813 9.880116 0.572856 0.572859 C1orf182
14 rs2274226 rs17441237 9.879123 0.572799 0.572803 C1orf182
15 rs2274226 rs17441461 9.878351 0.572754 0.572757 C1orf182
16 rs2274226 rs12434663 9.873057 0.572447 0.57245 C1orf182
17 rs2274226 rs7147945 9.873057 0.572447 0.57245 C1orf182
18 rs2274226 rs7146744 9.873057 0.572447 0.57245 C1orf182
19 rs360990 rs9583489 9.871902 0.57238 0.56012 COL4A2
20 rs2274226 rs12434762 9.87129 0.572345 0.572348 C1orf182
MDR

Introduction Elastic-Net MDR Gene Set Multivariate T2D Consortium
• FTO
• FTO neighbor
• BDNF
• BDNF neighbor
Two-way Interaction Network: MDRMDR

1. Analysis of multiple SNPs① Regularized Regression (Elastic-Net)
② Gene-Gene Interaction
Multifactor Dimensionality Reduction
③ Gene Set Analysis
2. Multivariate analysis
mproving powers in GWAS

Introduction Elastic-Net MDR Gene Set Multivariate T2D Consortium
• Gene set− A pre-defined group of related genes (Biological function,
Chromosomal location, regulation)
• Objective of gene set analysis (GSA)– Identify the gene set which is significantly associated with
disease status
• Focus on gene sets rather than on individual genes or SNPs
• Benefits− Increase the power to detect association signals by combining
weak individual signals
− Reduce dimensionality of data
− Provide a more expansive view of the underlying processes
Gene set analysis in GWAS
Gene Set

Introduction Elastic-Net MDR Gene Set Multivariate T2D Consortium
Gene set analysis in GWAS
SNP1
Gene1
SNP2 SNP3SNP4 SNP5
Gene2
SNP6 SNP7 SNP8
Gene3
SNP9 SNP10
Test under H0
Parametric/NonparametricConclusion
H0 :Gene set is not associated with trait
Gene summary 1
Gene set summary
Gene summary 2 Gene summary 3
SNP-level association SNP-level association SNP-level association
Gene Set

Introduction Elastic-Net MDR Gene Set Multivariate T2D Consortium
Gene set analysis in GWAS
Gene Set

1. Analysis of multiple SNPs① Regularized Regression (Elastic-Net)
② Gene-Gene Interaction
Multifactor Dimensionality Reduction
③ Gene Set Analysis
2. Multivariate analysis
mproving powers in GWAS

Introduction Elastic-Net MDR Gene Set Multivariate T2D Consortium
• Multivariate analysis– Focus on multiple correlated phenotypes and single SNP
SNP K
SNP K
SNP K
SNPJ
SNPJ
SNPJ
SNP I
SNP I
SNP I
SNP1
SNP1
SNP1
SNP2
SNP2
SNP2
……
Trait 1 Trait 2 Trait 3
Trait 4 Trait 5
Related phenotypes
SNP 500K
Multivariate analysis
Multivariate

Introduction Elastic-Net MDR Gene Set Multivariate T2D Consortium
• Examples: Related phenotypes
– Obesity• BMI, Waist circumference, Weight, WHR, Body Fat
– Hyperlipidemia• Total cholesterol, HDL/LDL cholesterol, Triglyceride
– Metabolic Syndrome• Triglyceride, HDL cholesterol, Blood pressure, Insulin
resistance
Multivariate AnalysisMultivariate

Introduction Elastic-Net MDR Gene Set Multivariate T2D Consortium
• Obesity related phenotypes– BMI, Waist circumference, Weight, and WHR
• BMI = Weight/Height(m)2
• WHR = Waist / Hip circumference
– Which genes are associated with obesity related phenotypes?
BMI Waist Weight WHR
BMI 1
Waist 0.7607 1
Weight 0.7308 0.6862 1
WHR 0.3819 0.7971 0.2920 1
Multivariate AnalysisMultivariate

Introduction Elastic-Net MDR Gene Set Multivariate T2D Consortium
Univariate Analysis• Most GWAS are conducted under this framework• Focus on one phenotype and single SNP
• Obesity related phenotypes• Separate univariate analyses
141312111011 εβββββ +++++= SNPAreaAgeSexYBMI:
Waist:
Weight:
242322212022 εβββββ +++++= SNPAreaAgeSexY
343332313033 εβββββ +++++= SNPAreaAgeSexY
WHR:444342414044 εβββββ +++++= SNPAreaAgeSexY
Multivariate

Introduction Elastic-Net MDR Gene Set Multivariate T2D Consortium
Univariate Analysis Results
• Number of significant genetic variants at a given level of α
P-value ≤ 10-7 10-7< p ≤ 10-6 10-6< p ≤ 10-5 10-5< p ≤ 10-4
BMI 1 0 6 23
Waist 0 0 7 39
Weight 0 3 5 32
WHR 0 4 7 25
Multivariate

Introduction Elastic-Net MDR Gene Set Multivariate T2D Consortium
Waist
Weight
WHR
BMI
Multivariate

Introduction Elastic-Net MDR Gene Set Multivariate T2D Consortium
Overlay Plot
� Some SNPs have consistent significant effects on all four phenotypes
� Want to confirm by statistical testing� Want to know whether joint analysis (multivariate analysis) of all
correlated phenotypes increase power or not
Multivariate
Introduction Elastic-Net MDR Gene Set Multivariate T2D Consortium
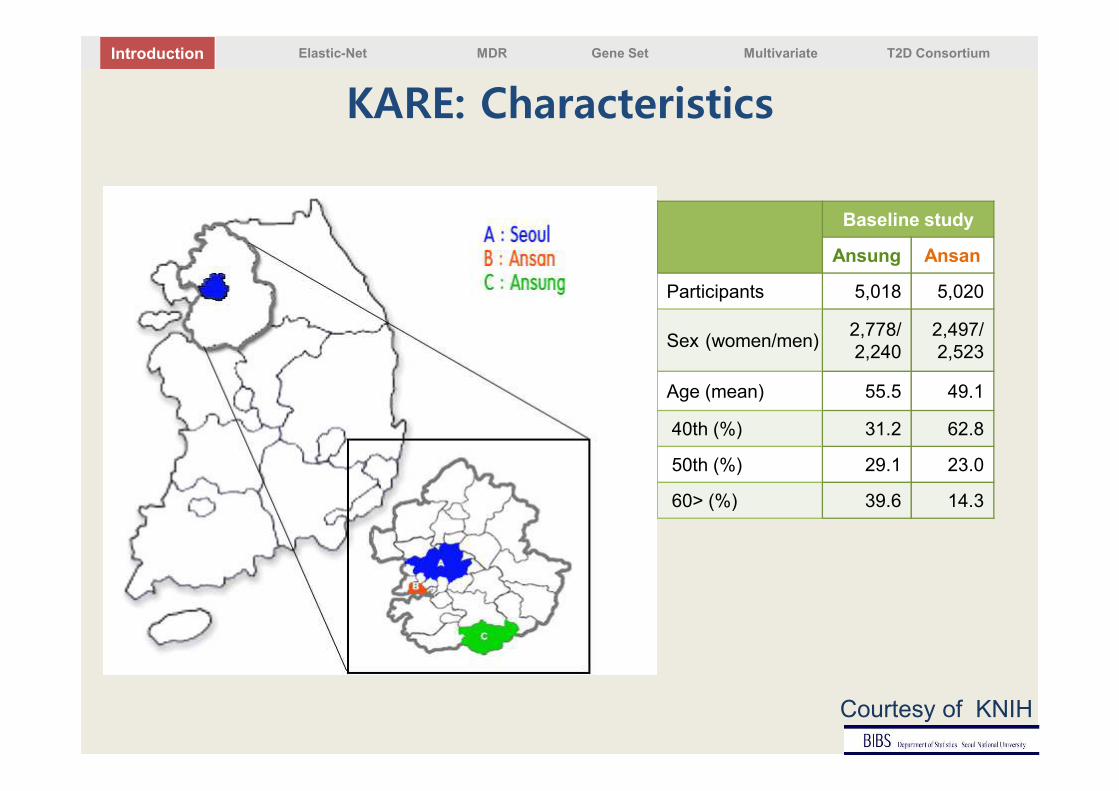
Results of Multivariate Analysis
P-value ≤ 10-7 10-7< p ≤ 10-6 10-6< p ≤ 10-5 10-5< p ≤ 10-4
BMI 1 0 6 23
Waist 0 0 7 39
Weight 0 3 5 32
WHR 0 4 7 25
Multivariate analysis
53 48 89 220
≤ 10-12 10-12< p ≤ 10-10 10-10< p ≤ 10-8 10-8< p ≤ 10-7
2 3 20 28
Multivariate

Introduction Elastic-Net MDR Gene Set Multivariate T2D Consortium
• Newly identified obesity-related genes in KARE
CHR SNP P-value Gene Function
2 rs1377819 1.31E-08 CNTNAP5
Belongs to the neurexin family, member of which function in the vertebrate nervous system as cell adhesion molecules and receptors. This gene is related with carotid-femoral pulse wave velocity
10 rs2804219 5.24E-07 ATRNL1
A binding partner of the melanocortin-4 receptor (MC4R) geneMC4R is related to BMI and obesity and many genetic variants have been identified in GWAS
14 rs17109739 4.31E-07 NRXN3Associated with waist circumference, BMI, and obesity
Multivariate Analysis of KARE DataMultivariate

1. Introduction
2. Projects① Project 1
② Project 2
③ Project 3
3. Our preliminary analysis results① Single variant & Meta analysis
② Analysis of multiple variants
2D Consortium

Introduction Elastic-Net MDR Gene Set Multivariate T2D Consortium
• Variants identified by GWAS explain only limited proportion of genetic variability; where’s the missing heritability ?– X chromosome– structural variants: indels, CNPs, CNVs
– G x G, G x E– less common variants with low allele frequency (<1%): => sequencing
Post GWAS

Introduction Elastic-Net MDR Gene Set Multivariate T2D Consortium
Post GWASFeasibility of identifying genetic variants
TA Manolio et al. Nature 461, 747-753 (2009) doi:10.1038/nature08494

Introduction Elastic-Net MDR Gene Set Multivariate T2D Consortium
Motivation for T2D-Consortium
• GWAS, candidate genes have identified >60
T2D-associated common variants
• Identified variants explain ~10% of T2D H2
• Hypothesis :
� less common and rare variants also contribute to T2D risk
� may do so differentially across ancestry groups
• Large-scale sequencing studies now allow us to address
this hypothesis efficiently
T2D Consortium

Introduction Elastic-Net MDR Gene Set Multivariate T2D Consortium
• Funding from NIDDK (and NHGRI)
• ~5 years of support: 9/20/2009 ~ 7/31/2014
• Funding :
� $ 400-500K annual direct costs per group
� $ 2M central funds annually
Introduction(cont.)
T2D Consortium

Introduction Elastic-Net MDR Gene Set Multivariate T2D Consortium
T2D Consortium
COMTAG1
Broad
San
Antonio
Chicago
Starr Co
GDC2
Mark McCarthy- European- E Asian- S Asian- Arab- African
Mike Boehnke- European- Ashkenazim- E Asian
Nancy CoxCraig Hanis- Mexican American
John BiangeroRavi Duggirala- Mexican American
David AltshulerJose FlorezJim Wilson- African American
•COMTAG1 : Consortium for multiethnic type 2 diabetes associated genes•GDC2 : Global diabetes consortium
T2D Consortium

Introduction Elastic-Net MDR Gene Set Multivariate T2D Consortium
T2D-Consortium• Project 1: Deep whole-exome sequencing
(10,000 individuals from 5 ethnicities)
• Project 2: Deep whole-genome sequencing
(600 individuals, Mexican American pedigrees)
• Project 3: Trans-ethnic fine mapping project
T2D Consortium

1. Introduction
2. Projects① Project 1
② Project 2
③ Project 3
3. Our preliminary analysis results① Single variant & Meta analysis
② Analysis of multiple variants
2D Consortium

Introduction Elastic-Net MDR Gene Set Multivariate T2D Consortium
Project 1 : Introduction
• Project 1 seeks to assess whether less common variants
play a role in T2D risk and to assess similarities and
differences in the distribution of T2D risk variants across
ancestry groups.
• Five ancestry groups : European, East Asians, South Asians,
American Hispanics, and African Americans.
• Sequencing is underway at the Broad using the Agilent v2
capture reagent on Hiseq machines(65x coverage).
T2D Consortium

Introduction Elastic-Net MDR Gene Set Multivariate T2D Consortium
Samples selected for sequencing
Population Study description
African American Jackson Heart StudyWake Forest
East Asian KoreanChinese from Singapore
European AshkenaziFinnish (METSIM)
Hispanic San AntonioStarr County
South AsianIndians living in London
(LOLIPOP*)Indians from Singapore
• 500 cases / 500 controls from each of 10 cohorts
from 5 ethnicities
LOLIPOP* : the London Life Sciences Population Study
T2D Consortium

Introduction Elastic-Net MDR Gene Set Multivariate T2D Consortium
Samples & populations
• 10 cohorts(represent)
• 5 major ancestry groups
T2D Consortium

Introduction Elastic-Net MDR Gene Set Multivariate T2D Consortium
Samples & populations(cont.)
PC1
PC
2
� African American
� East Asian (Korea)
� East Asian (Singapore)
� South Asian (Singapore)
� European (Finland)
Three outliers (circled)
excluded from analysis
T2D Consortium

Introduction Elastic-Net MDR Gene Set Multivariate T2D Consortium
Samples & populations: Variant statisticsTable. SNP variation across cohorts (Autosomal only)
-- # Samples = 5334; # Variants = 1,768,095
Counts (%) Wake Forest KARE SingaporeChinese
Singapore Indians
METSIM
# samples 1069 1093 1070 1140 962
# variants* 716,411 432,944 481,281 578,528 244,704
Private to EACH cohort
# variants 490,155 (100) 219,813 (100) 255,203 (100) 366,525 (100) 78,208 (100)
# singletons 254,863 (52.0) 153,052 (69.6) 184,095 (72.1) 234,524 (64.0) 47269 (60.4)
# rare variants ( < 1%) 425,467 (86.8) 219,064 (99.7) 254,493 (99.9) 357,805 (97.6) 74,501 (95.3)
# common variants (≥ 5%) 15,548 (3.2) 0 (0) 2 (0) 265 (0.07) 115 (0.15)
Shared across ALL cohorts
# variants 71,062 (100)
# singletons 1,336 (1.9) 2,431 (3.4) 2,251 (3.2) 1,204 (1.7) 1,784 (2.5)
# rare variants (< 1%) 8,995 (12.7) 9,913 (14.0) 10,088 (14.2) 6,969 (9.8) 8,652 (12.2)
# common variants (≥ 5%) 52,225 (73.5) 50,927 (71.7) 50,795 (71.5) 55,371 (77.9) 52,138 (73.4)
*Excludes 39,526 variants on chrX and 307 variants on chrY
T2D Consortium

Introduction Elastic-Net MDR Gene Set Multivariate T2D Consortium
VariableColumn heading
Variable Column heading
Diabetes disease status T2D Hip circumference HIPC
Diabetes of diagnosis AOD Waist circumference WAISTC
Fasting glucose FAST_GLU Diabetes medication DIABMEDS
Fasting insulin FAST_INS Hypertension medication BPMEDS
Fasting C-peptide FAST_CPEP Weight WIEGHT
HbA1C HBA1C 2-hour glucose 2H_GLU
GAD Ab GAD 2-hour insulin 2H_INS
Creatine CREATINE 2-hour C-peptide 2H_CPEP
Adiponectin ADIPONECTIN SEX SEX
Leptin LEPTIN AGE AGE
Total cholesterol CHOL Current use female hormone HORMONES
LDL cholesterol LDL BMI BMI
HDL cholesterol HDL Family ID FAMID
Triglyceride TG STUDY ID STUDYID
Height HEIGHT STUDY ID of father FATHER
Systolic Blood pleasure SBP STUDY ID of mother MOTHER
Diastolic Blood pleasure DBP
Phenotypes
T2D Consortium

1. Introduction
2. Projects① Project 1
② Project 2
③ Project 3
3. Our preliminary analysis results① Single variant & Meta analysis
② Analysis of multiple variants
2D Consortium

Introduction Elastic-Net MDR Gene Set Multivariate T2D Consortium
Project 2 : Introduction
• Main task: Detect rare (even private) functional variants influencing diabetes risk and diabetes-related phenotypes
• Assessed available pedigrees for potential to generate large number of copies of private variants, sequencing efficiency, diabetes prevalence
• Sequencing performed at Complete Genomics. ~600 samples at 60x coverage.
T2D Consortium

Introduction Elastic-Net MDR Gene Set Multivariate T2D Consortium
Project 2 : Introduction(cont.)
• Rare Variant Hypothesis
� Human quantitative variation has a substantial component due to
the effects of “rare” sequence variants in multiple genes.
� Larger effects or rare variants will make disease related gene
discovery easier.
• How can we study Rare Variant
� Very rare functional variants are best detected using a large
pedigree based design.
� Pedigrees allow observation of multiple copies of a private variant.
T2D Consortium

Introduction Elastic-Net MDR Gene Set Multivariate T2D Consortium
WGS in 20 Mexican American Pedigrees
• # of families : 20 families
• # of founders : 117 individuals
PEDIGREE count
2 86
3 77
4 64
5 68
6 64
7 38
8 68
9 33
10 64
11 35
PEDIGREE count
14 40
15 41
16 48
17 42
20 36
21 35
23 32
25 33
27 35
47 22
T2D Consortium

Introduction Elastic-Net MDR Gene Set Multivariate T2D Consortium
Mexican American Pedigrees plot
T2D Consortium

Introduction Elastic-Net MDR Gene Set Multivariate T2D Consortium
Phenotypes• Glycemic traits
� Fasting glucose
� Fasting insulin
� HbA1c
� HOMA-B
� HOMA-IR
• Blood pressure
� SBP
� DBP
• Other biomarkers
� eGFR (creatinine)
� Adiponectin
� Leptin
� GAD ab
• Anthropometric traits
� Height
� BMI
� Waist circumference
� Hip circumference
� Waist to hip ratio
� Lipids
� HDL
� LDL
� Total cholesterol
� triglycerides
T2D Consortium

1. Introduction
2. Projects① Project 1
② Project 2
③ Project 3
3. Our preliminary analysis results① Single variant & Meta analysis
② Analysis of multiple variants
2D Consortium
Introduction Elastic-Net MDR Gene Set Multivariate T2D Consortium
Project 3 : Introduction
• Fine-mapping
� Involves the identification of markers that are very tightly linked to a
targeted gene.
� Implies finding all the variants at the locus and trying to determine
which changes may be related to pathogenesis with the use of
statistical, functional, or bio-informatic methods.
T2D Consortium

Introduction Elastic-Net MDR Gene Set Multivariate T2D Consortium
Project 3 : Introduction(cont.)
• Meta-analysis of GWAS studies of T2D from diverse ethnic
groups: European descent, South and East Asian descent,
Hispanics and African-Americans.
• Initial focus on five T2D loci: CDKAL1, KCNQ1, CDKN2A/B,
FTO and IGF2BP2 :
� Strongest signals of association in most ethnic groups.
� Evidence of differences in association signals and patterns of LD
between ethnic groups.
T2D Consortium

Introduction Elastic-Net MDR Gene Set Multivariate T2D Consortium
Project 3 : Introduction(cont.)
Ethnic Groups
Study PopulationEthnic Groups
Study Population
European
WTCCC UK
East Asian
HK1 Hong Kong
FUSION Finnish HK2 Hong Kong
LONGENETY Askenazim SGP-SIMES Singapore Malay
FHS US SGP-SP2 Singapore Chinese
DGDG French CLHNS Phillipino
South Asian
SGP-SINDI Singapore Indian JAPAN-KATO Japanese
PROMIS Pakistani JAPAN-KADO Japanese
INDIGO North IndianMexican American
StarrCountry Mexican American
LOLIPOP IndianAfrican
AmericanJHS African American
• Summary of studies
T2D Consortium

1. Introduction
2. Projects① Project 1
② Project 2
③ Project 3
3. Our preliminary analysis results① Single variant & Meta analysis
② Analysis of multiple variants
2D Consortium

Introduction Elastic-Net MDR Gene Set Multivariate T2D Consortium
Project 1: KARE Data
• GOAL
How do rare variants (MAF<0.05)Contribute to T2D and BMI?
• KARE(Korean Association REsources)
� Exome data from 1093 Korean individuals
� Independent sample : 1079
� Related sample : 14
MAF<0.01 0.01≤MAF≤0.05 MAF>0.05 Total SNP
Total 328,560 (74%) 24,320 (6%) 89,476 (20%) 442,356
Independent 326,377 (82%) 24,040 (6%) 49,312 (12%) 399,729
T2D Consortium

Introduction Elastic-Net MDR Gene Set Multivariate T2D Consortium
Methods
• Covariates
� T2D : AGE+SEX+ AREA + AGE*SEX
� BMI : AGE+SEX + AREA + AGE*SEX
• Methods
PhenotypeIndependent Individual
(1079)Total individual
(1093)
T2D Logistic model EMMAX(Kang et al, 2010
Nat Genet)BMI Linear model
T2D Consortium

Introduction Elastic-Net MDR Gene Set Multivariate T2D Consortium
Project 1: Specific hypotheses
• Hypothesis 1
� For any causal gene, the same rare variants will be associated (with
similar effect) in all populations (Mega-analysis)
• Hypothesis 2
� A causal gene will be associated with T2D in all populations, but with
different causal variants and/or directions of effect (Meta-analysis)
• Hypothesis 3
� Different causal genes will be associated in each population (Single-
cohort analysis)
T2D Consortium
Introduction Elastic-Net MDR Gene Set Multivariate T2D Consortium
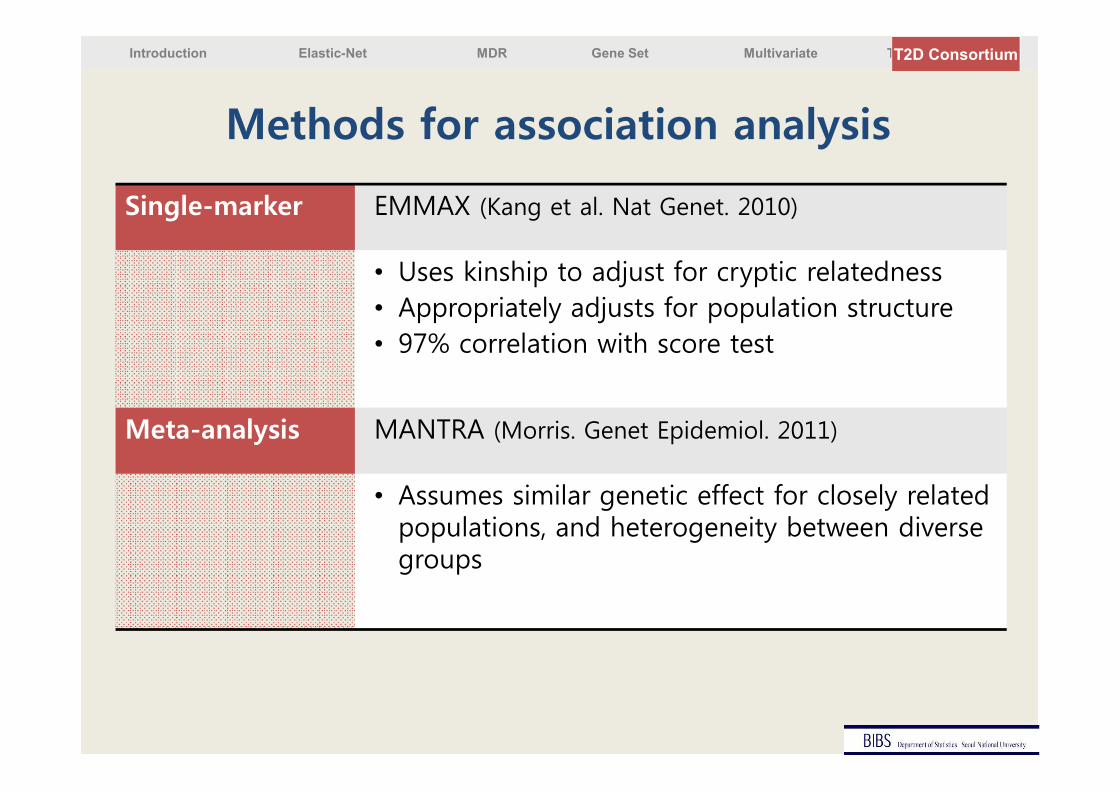
Methods for association analysis
Single-marker EMMAX (Kang et al. Nat Genet. 2010)
• Uses kinship to adjust for cryptic relatedness• Appropriately adjusts for population structure• 97% correlation with score test
Meta-analysis MANTRA (Morris. Genet Epidemiol. 2011)
• Assumes similar genetic effect for closely related populations, and heterogeneity between diverse groups
T2D Consortium

Introduction Elastic-Net MDR Gene Set Multivariate T2D Consortium
T2D : EMMAX Manhattan plot
MAF ≤ 0.01
SNP = 328,560
0.01 < MAF ≤ 0.05
SNP = 24,320
MAF > 0.05
SNP = 89,476
T2D Consortium

Introduction Elastic-Net MDR Gene Set Multivariate T2D Consortium
T2D : Logistic regression Manhattan plot
MAF ≤ 0.01
SNP = 326,377
0.01 < MAF ≤ 0.05
SNP = 24,040
MAF > 0.05
SNP = 49,312
T2D Consortium

Introduction Elastic-Net MDR Gene Set Multivariate T2D Consortium
T2D : EMMAX vs. logistic regression
MAF≤0.01 -log10(p-value)
0.01<MAF≤0.05-log10(p-value)
MAF>0.05 -log10(p-value)
T2D Consortium

Introduction Elastic-Net MDR Gene Set Multivariate T2D Consortium
T2D : Effect size vs. MAF
• EMMAX
• Logistic Regression
T2D Consortium

Introduction Elastic-Net MDR Gene Set Multivariate T2D Consortium
BMI : EMMAX Manhattan plot
MAF ≤ 0.01
SNP = 328,560
0.01 < MAF ≤ 0.05
SNP = 24,320
MAF > 0.05
SNP = 89,476
T2D Consortium

Introduction Elastic-Net MDR Gene Set Multivariate T2D Consortium
BMI : Linear regression Manhattan plot
MAF ≤ 0.01
SNP = 326,377
0.01 < MAF ≤ 0.05
SNP = 24,040
MAF > 0.05
SNP = 49,312
T2D Consortium

Introduction Elastic-Net MDR Gene Set Multivariate T2D Consortium
BMI : EMMAX vs. linear regression
MAF≤0.01 -log10(p-value)
0.01<MAF≤0.05-log10(p-value)
MAF>0.05 -log10(p-value)
T2D Consortium

Introduction Elastic-Net MDR Gene Set Multivariate T2D Consortium
BMI : Effect size vs. MAF
• EMMAX
• Linear Regression
T2D Consortium
Introduction Elastic-Net MDR Gene Set Multivariate T2D Consortium
• Since frequencies of rare variants are very low, even with high penetrance, it will be difficult to detect association with any single rare variants
• This has motivated the development of new statistical tests for detecting signals of rare variants
• Recent studies have shown that multiple rare variants could contribute to common diseases
• The burden test often employ the idea of collapsing multiple rare variants within a region
Burden test for rare variants
Introduction Elastic-Net MDR Gene Set Multivariate T2D Consortium
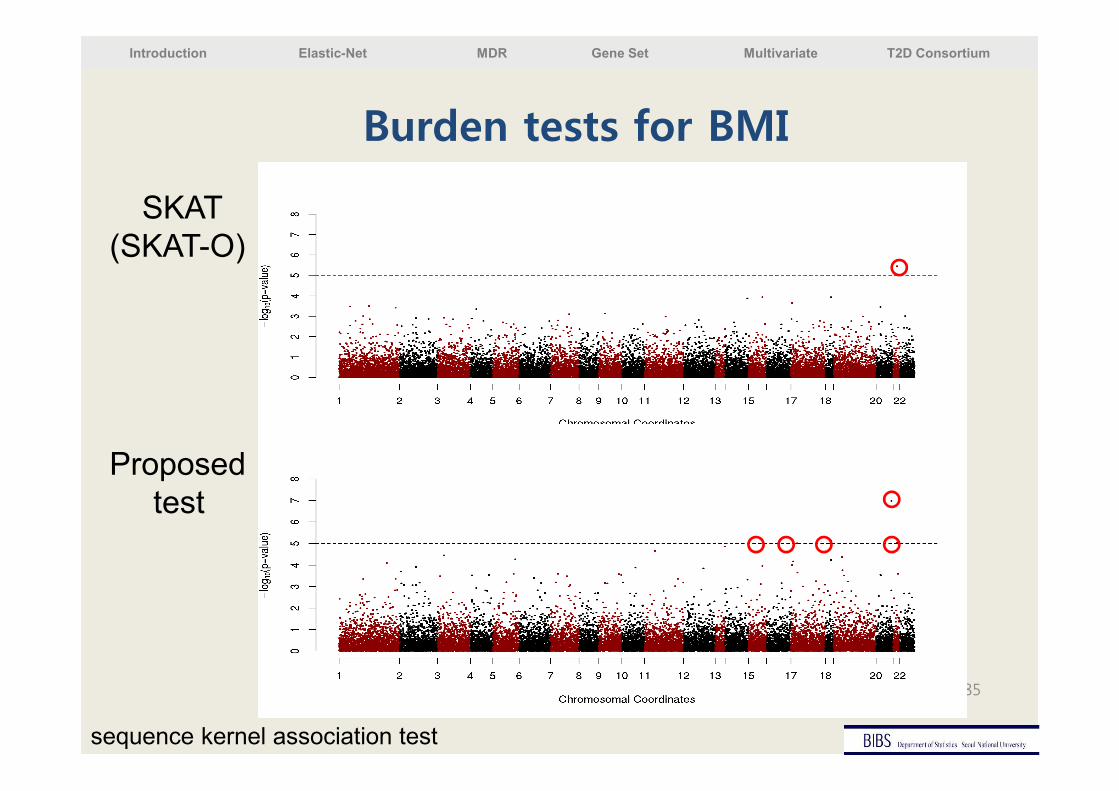
Burden tests for BMI
85
SKAT(SKAT-O)
Proposed test
sequence kernel association test

1. Analysis of multiple rare variants① Regularized Regression (Elastic-Net)
② Gene-Gene Interaction
Multifactor Dimensionality Reduction
③ Gene Set Analysis
2. Multivariate analysis
mproving powers in NGS Data

Introduction Elastic-Net MDR Gene Set Multivariate T2D Consortium
• When the number of rare variants is large, the performance of burden test is not assured
• In this case, traditional regularized regression method (Ridge regression, LASSO, Elastic net, PCR and so on) could perform better than existing burden tests
• Each rare variant may not have stable association statistic especially when trait is binary
• Two step regularized regression method can be possible1. Collapse multiple rare variants into gene-level2. Conduct regularized regression for multiple gene-level variants
Regularized regression for rare variants

Introduction Elastic-Net MDR Gene Set Multivariate T2D Consortium
• Interaction among rare variants do not occur as much as interaction among common variants
• If MDR is applied to rare variants, zero cell easily occurs and performance of MDR depends on one rare mutation very sensitively � another version of MDR for rare variants should be developed
• If we collapse rare variants in gene-level first, then these collapsed variants could be used to conduct MDR
MDR for rare variants

Introduction Elastic-Net MDR Gene Set Multivariate T2D Consortium
• One-stage analysis (rare variants � Gene set)• Extension of gene-level burden tests (GRANVIL, SKAT, VT,
WSS, and so on)• Traditional one-stage gene-set analysis
– Sum of – log(p-value)– Enrichment score for chi-square statistics
• Two-stage analysis (rare variants � Gene � Gene set)• Traditional two-stage gene-set analysis
– Highest chi-square + Enrichment score– Adaptive rank product +Adaptive rank product– Minimum p-value + network-based combined score– …
Gene set analysis for rare variants

Introduction Elastic-Net MDR Gene Set Multivariate T2D Consortium
• Limitations• If trait is binary, then association statistic (eg. p-value,
chi-square statistic, …) for each rare variant is not stable– In this case, most of traditional gene set analysis cannot
be applied • When a gene-set has a lot of variants (eg. ~1000
variants), then performance of burden tests are not assured yet
• What if common variants and rare variants are together? – Most of burden test for rare variants give a larger weight
to rarer variants– If burden tests are applied to real sequencing data,
common causal variants will not be focused– Before combining rare variants and common variants, we
should collapse multiple rare variants at first
Gene set analysis for rare variants

Introduction Elastic-Net MDR Gene Set Multivariate T2D Consortium
Methods for Improving Powers
GWAS Rare Variant Analysis
1. Single SNP analysis1. Single SNP analysis
Burden test
2. Meta analysis 2. Meta / Mega analysis
3. Analysis of multiple SNPs① Regularized Regression② Gene-Gene Interaction
Multifactor DimensionalityReduction
③ Gene Set Analysis
3. Analysis of multiple SNPs① Regularized Regression② Gene-Gene Interaction
Multifactor DimensionalityReduction
③ Gene Set Analysis
4. Multivariate analysis 4. Multivariate analysis

Introduction Elastic-Net MDR Gene Set Multivariate T2D Consortium
Acknowledgement
� DNA-LinkJong-Eun Lee
� Sejong UniversitySeungyeoun Lee
� University of Virginia Ming Li
� Case-Western University Robert Elston
� Bioinformatics and Biostatistics Lab., SNUSohee Oh, Dankyu Yoon, Min-SeokKwon, Jaehoon Lee, Iksoo Huh, Seongyoung Lee
� Center for Genome Science , KNIH, KCDCYoung Jin Kim, Joo-Young LeeJong-Young Lee, Bok-Ghee Han,
� KARE ConsortiumBermseok Oh, Kyunghee Univ.Sangoo Kim, Soongsil Univ.
� KARE Cohort PIsNam Han Cho, Chol Shin

Introduction Elastic-Net MDR Gene Set Multivariate T2D Consortium
Acknowledgement
� T2D Project Consortium
• Broad Inst.Nöel Burtt, Mark DePristo, Pierre Fontanillas
• ExterTim Frayling
• Harvard / MGH Jose Florez, Jonna Grimsby, James Meigs
• National Univ. of Singapore
Yik Ying Teo, Xueling Sim• Oxford
Mark McCarthy, Andrew Morris,Anubha Mahajan, Manny Rivas,Inga Prokopenko
• Singapore Eye Research Inst. Kamran Ikram
• Univ. of ChicagoNancy Cox, Mathew Barber
• Univ. of Michigan
Mike Boehnke, Tanya Teslovich,Christian Fuchsberger
• Univ. of Texas Health Sci. Ctr.
Craig Hanis, Taylor Maxwell, Heather Highland
• Wake Forest Univ. Sch. of Med.
Don Bowden, Maggie Ng• Wellcome Trust Sanger Inst.
Ele Zeggini, Aaron Day-Williams

Introduction Elastic-Net MDR Gene Set Multivariate T2D Consortium
Major: Biostatistics Major: Bioinformatics
• Ph. D. students : Jaehoon Lee, Iksoo Huh,
• M.S. student : Seojin Bang, Yonggang Kim, Seungyeoun Hong Serong Lee, Byungju Min
• Ph. D. students :
Jungsoo Gim, Taejin Ahn, Minseok Kwon, Youngjin Kim, Sunkyoung Choi, Sungyoung Lee, Minseok Seo
• M.S. students : Sunghwan Cho, Eunyoung Ahn
BIBS
•Post-Doc:
Jiin Choi
Shinik Kim
IT + BT•Post-Doc:
Miae Doo
AcknowledgementBIBS

Introduction Elastic-Net MDR Gene Set Multivariate T2D Consortium
Post docs
2012 BIBS members

Introduction Elastic-Net MDR Gene Set Multivariate T2D Consortium
Thank you!

Introduction Elastic-Net MDR Gene Set Multivariate T2D Consortium
KARE: Type 2 Diabetes Characteristics
Case Control
# of Samples 1,042 2,943
Area(Ansung/Ansan)
531/511 1,669/1,274
Sex (Women/Men)
503/539 1,588/1,355
Age (Mean) 56.37 51.06
40th (%) 29.3 56.3
50th (%) 31.5 24.6
60 > (%) 39.2 19.1
Courtesy of KNIH
KARE
• Type 2 Diabetes1) Treatment of T2D2) Fasting plasma glucose (FPG)
≥ 7 mmol/L or plasma glucose 2-h after ingestion of 75gm oral glucose load ≥ 11.1 mmol/L
3) Age of disease onset ≥ 40 years
• Controls1) No history of diabetes2) FPG < 5.6 mmol/L and plasma
glucose 2-h after ingestion of 75gm oral glucose load < 7.8 mmol/L at both baseline and follow up studies

Introduction Elastic-Net MDR Gene Set Multivariate T2D Consortium
98
Three-Stage Approach for GWAS
98
� Stage I: Pre-screening for dimensionality reduction
� Based on marginal regression � Selecting subset of SNPs showing strongest association with the trait � Sure Independence Screening (SIS, Fan & Lv, 2008)
� Stage II: Joint identification of putative causal SNPs via penalized regression with elastic net variable selection
� Choice of optimal parameter λ� Based on10-fold cross validation � Minimizing prediction error rate
Elastic-Net

Introduction Elastic-Net MDR Gene Set Multivariate T2D Consortium
99
Three-Stage Approach for GWAS
99
Stage III: Validation of the jointly identified SNPs via EN based onBootstrap Selection Stability(BSS)
� Investigate the consistency of the selected SNPs � Use fixed optimal value of λ chosen at step II� Elastic-net variable selection at each B=1000 bootstrap dataset
�Empirical replication of identified SNPs based on BSS is defined for i th SNP as follows:
1
1 if replicated in bootstrap sample1, where
0 otherwise
thBb b
i i i
b
bBSS I I
B =
= =
∑
Elastic-Net
Introduction Elastic-Net MDR Gene Set Multivariate T2D Consortium
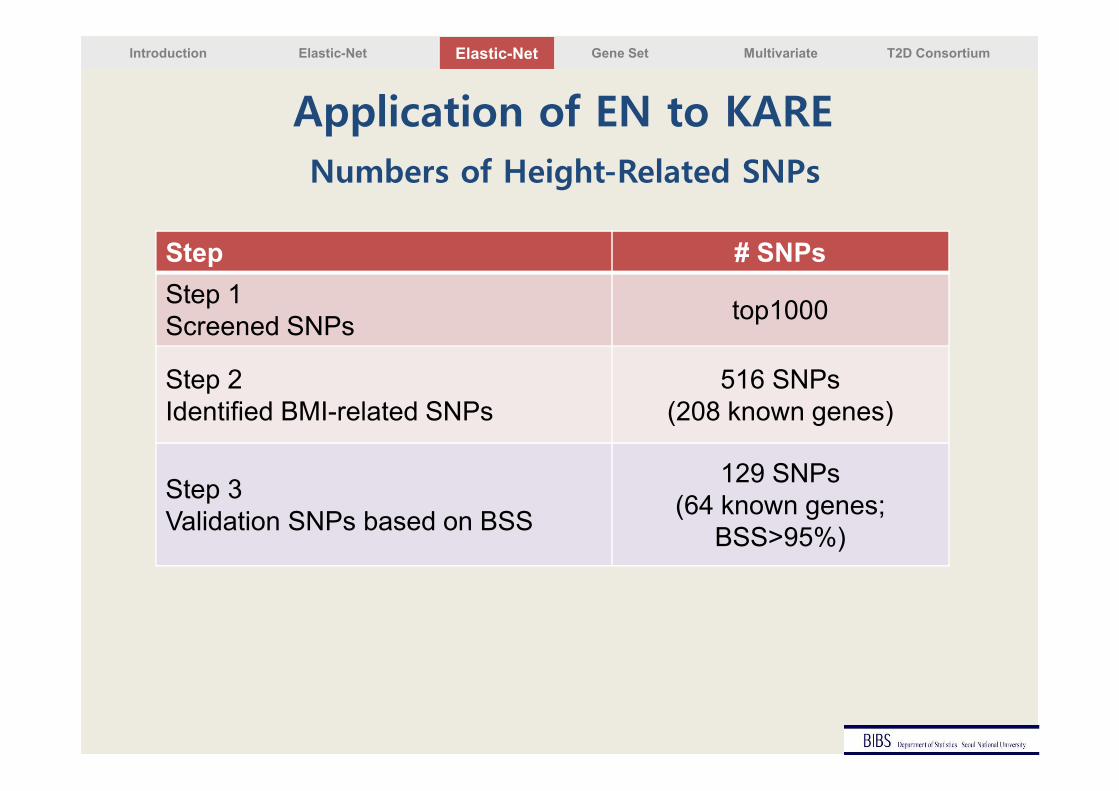
Numbers of Height-Related SNPs
Step # SNPs
Step 1Screened SNPs
top1000
Step 2Identified BMI-related SNPs
516 SNPs(208 known genes)
Step 3Validation SNPs based on BSS
129 SNPs (64 known genes;
BSS>95%)
Application of EN to KARE
Elastic-Net

Introduction Elastic-Net MDR Gene Set Multivariate T2D Consortium
� For each of 516 selected SNPs
� 1000 bootstrap datasets with the fixed optimal λ
� Compute BSS (%)
� Out of those 517 SNPs
� 8 SNPs have 100% BSS
� For 129 SNPs, BSS ≥ 95%
� For 60 SNPs, BSS < 50%
8
121
59
104
7050 45
60
0
20
40
60
80
100
120
140
100 95-100 90-95 80-90 70-80 60-70 50-60 <50
Num
ber
of
SNPs
BSS(%)
Application of EN to KARE Bootstrap selection stability(BSS)
Elastic-Net
Introduction Elastic-Net MDR Gene Set Multivariate T2D Consortium
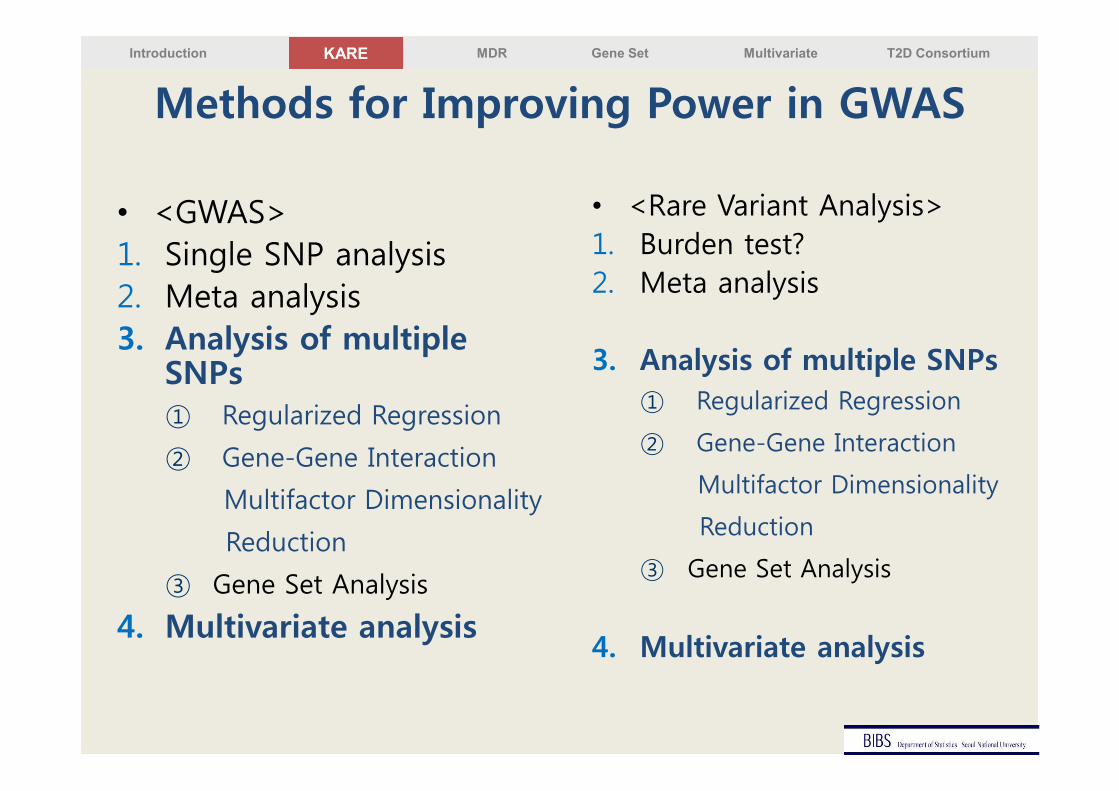
Methods for Improving Power in GWAS
• <GWAS>1. Single SNP analysis2. Meta analysis3. Analysis of multiple
SNPs① Regularized Regression
② Gene-Gene Interaction
Multifactor Dimensionality
Reduction
③ Gene Set Analysis
4. Multivariate analysis
KARE
• <Rare Variant Analysis>1. Burden test?2. Meta analysis
3. Analysis of multiple SNPs① Regularized Regression
② Gene-Gene Interaction
Multifactor Dimensionality
Reduction
③ Gene Set Analysis
4. Multivariate analysis

Introduction Elastic-Net MDR Gene Set Multivariate T2D Consortium
• Interaction among rare variants do not occur as much as interaction among common variants
• Interaction between rare variants and common variants should be considered
• If MDR is applied to rare variants, zero cell easily occurs and performance of MDR depends on one rare mutation very sensitively � another version of MDR for rare variants should be developed
• If we collapse rare variants in gene-level first, then these collapsed variants could be used to conduct MDR
MDR for rare variants
Remarks

Introduction Elastic-Net MDR Gene Set Multivariate T2D Consortium
• One-stage analysis (rare variants � Gene set)
• Extension of gene-level burden tests (GRANVIL, SKAT, VT, WSS, and so on)
• Traditional one-stage gene-set analysis
– Sum of – log(p-value)
– Enrichment score for chi-square statistics
• Two-stage analysis (rare variants � Gene � Gene set)
• Traditional two-stage gene-set analysis
– Highest chi-square + Enrichment score
– Adaptive rank product +Adaptive rank product
– Minimum p-value + network-based combined score
– …
Gene set analysis for rare variants
Remarks

Introduction Elastic-Net MDR Gene Set Multivariate T2D Consortium
• Limitations• If trait is binary, then association statistic (eg. p-value, chi-
square statistic, D) for each rare variant is not stable– In this case, most of traditional gene set analysis cannot be
applied
• When a gene-set has a lot of variants (eg. ~1000 variants), then performance of burden tests are not assured yet
• What if common variants and rare variants are together? – Most of burden test for rare variants give a larger weight to
rarer variants
– If burden tests are applied to real sequencing data, common causal variants will not be focused
– Before combining rare variants and common variants, we should collapse multiple rare variants at first
Gene set analysis for rare variants
Remarks

Introduction Elastic-Net MDR Gene Set Multivariate T2D Consortium
Multivariate Analysis of KARE Data
• Different association direction in each phenotype– Multivariate has larger power than univariate analysis
CHR SNP BMI Waist Weight WHR Multivariate
Beta P-value Beta P-value Beta P-value Beta P-value 4 slopes
2 rs41498545 0.085 4.97E-02 -0.019 6.53E-01 0.044 2.56E-01 0.043 2.19E-01 1.38E-10
2 rs13410696 0.097 4.09E-02 -0.022 6.25E-01 0.119 4.50E-03 -0.012 7.56E-01 7.56E-11
3 rs17586294 0.038 2.55E-01 -0.076 1.97E-02 0.036 2.31E-01 -0.047 8.70E-02 3.86E-13
4 rs17501169 0.117 1.24E-02 -0.014 7.49E-01 0.096 2.00E-02 0.009 8.09E-01 3.06E-10
5 rs6866705 0.081 1.05E-01 -0.059 2.26E-01 0.088 4.94E-02 -0.023 5.71E-01 2.03E-11
6 rs6900453 0.065 1.28E-01 -0.056 1.79E-01 0.044 2.44E-01 -0.011 7.59E-01 2.87E-10
7 rs17168600 0.038 3.57E-01 -0.081 4.23E-02 0.026 4.72E-01 -0.035 3.01E-01 2.68E-10
11 rs17404578 0.004 9.29E-01 -0.111 4.65E-03 -0.003 9.29E-01 -0.037 2.66E-01 7.21E-13
11 rs41476549 0.112 1.26E-02 -0.007 8.66E-01 0.080 4.42E-02 0.042 2.53E-01 4.82E-12
18 rs11876341 -0.008 7.56E-01 0.018 4.60E-01 -0.033 1.39E-01 -0.020 3.36E-01 1.51E-10
Multivariate

Introduction Elastic-Net MDR Gene Set Multivariate T2D Consortium
Multivariate Analysis of KARE Data
• Same association directions
CHR SNP BP BMI Waist Weight WHR Multivariate
Beta P-value Beta P-value Beta P-value Beta P-value 4 slopes
2 rs17584842 118474656 0.189 1.42E-02 0.095 2.03E-01 0.136 4.65E-02 0.182 3.82E-03 7.29E-08
2 rs1377819 125192366 -0.012 7.79E-01 -0.125 1.97E-03 -0.012 7.40E-01 -0.076 2.57E-02 1.31E-08
2 rs2360719 137105093 0.043 2.95E-02 0.001 9.71E-01 0.034 5.02E-02 0.014 3.76E-01 1.24E-07
3 rs6762722 142627906 0.055 1.50E-03 0.048 3.77E-03 0.080 1.59E-07 0.011 4.38E-01 1.23E-07
5 rs9327231 121131826 -0.006 9.01E-01 -0.134 5.07E-03 -0.002 9.69E-01 -0.089 2.72E-02 1.59E-07
7 rs4429999 70619015 0.199 1.47E-03 0.079 1.92E-01 0.116 3.72E-02 0.115 2.50E-02 4.98E-07
7 rs7792191 120165184 -0.001 9.89E-01 -0.140 1.12E-02 -0.020 6.86E-01 -0.071 1.27E-01 7.54E-07
10 rs2804219 117303461 0.064 3.86E-01 0.194 6.23E-03 0.030 6.40E-01 0.086 1.53E-01 5.24E-07
11 rs17145229 82862073 0.106 3.96E-02 0.002 9.67E-01 0.095 3.73E-02 0.046 2.75E-01 1.04E-08
12 rs1371090 89107773 0.159 8.78E-04 0.015 7.40E-01 0.118 5.45E-03 0.009 8.08E-01 7.51E-09
14 rs17109739 79218034 -0.003 9.42E-01 -0.091 2.08E-02 -0.012 7.33E-01 -0.032 3.35E-01 4.31E-07
16 rs16951883 10226280 0.115 4.87E-02 0.145 1.02E-02 0.111 3.09E-02 0.233 9.33E-07 2.35E-09
Multivariate

Introduction Elastic-Net MDR Gene Set Multivariate T2D Consortium
MDR: Overview
• Step1.
– Identify the best combination of factors like SNPs and discrete environmental factors
• Step 2.
– Define levels that are associated with the high risk of disease and levels that are associated with low risk
MDR

Introduction Elastic-Net MDR Gene Set Multivariate T2D Consortium
MDR: Overview
(SNP1, SNP2) # of cases # of controls #case/#cont
(AA, BB) 50 40 1.25 High
(AA, Bb) 30 25 1.20 High
(AA, bb) 20 30 0.67 Low
(Aa, BB) 40 45 0.89 Low
(Aa, Bb) 25 30 0.83 Low
(Aa, bb) 20 10 2.00 High
(aa, BB) 10 18 0.56 Low
(aa, Bb) 3 1 3.00 High
(aa, bb) 2 1 2.00 High
Total 200 200
ctl
case
ctl
case
n
n
n
n
ij
ij ≥⇔
ctl
case
ctl
case
n
n
n
n
ij
ij <⇔
High Risk Group
Low Risk Group
Disease
Case
High 105 77
Low 95 123
Control
Risk
TP
FN
FP
TN
MDR
Introduction Elastic-Net MDR Gene Set Multivariate T2D Consortium
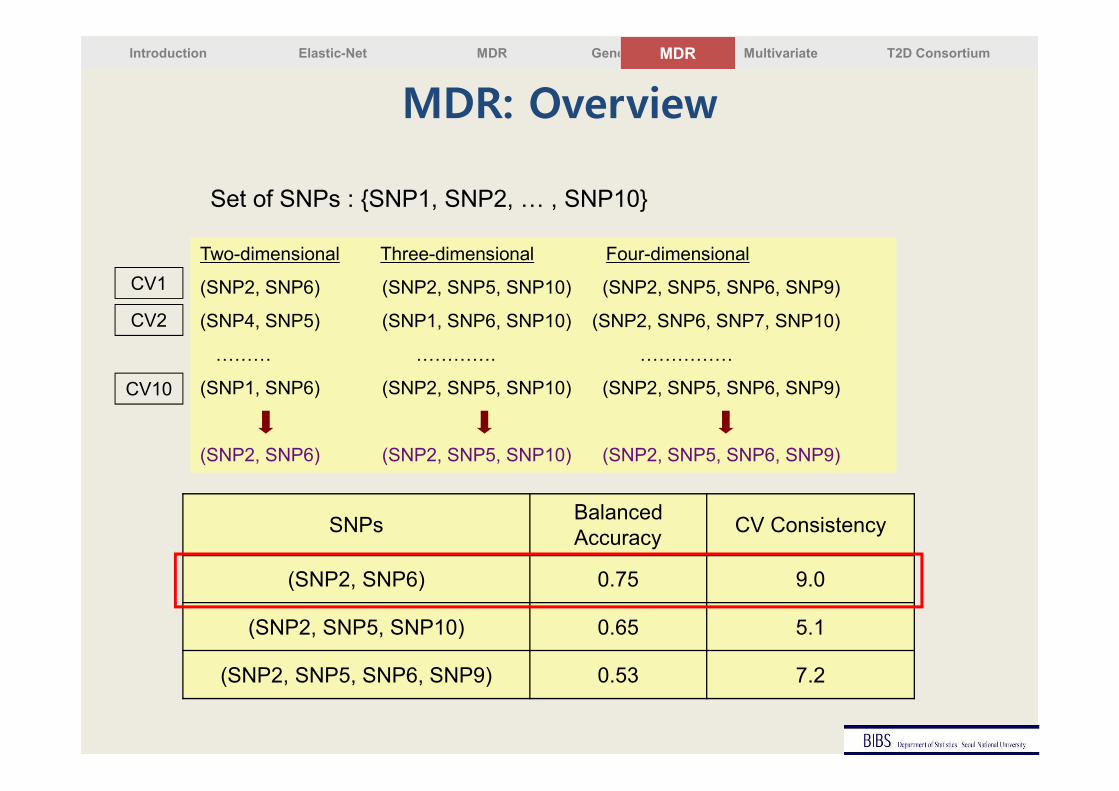
SNPsBalanced Accuracy
CV Consistency
(SNP2, SNP6) 0.75 9.0
(SNP2, SNP5, SNP10) 0.65 5.1
(SNP2, SNP5, SNP6, SNP9) 0.53 7.2
Two-dimensional Three-dimensional Four-dimensional
(SNP2, SNP6) (SNP2, SNP5, SNP10) (SNP2, SNP5, SNP6, SNP9)
(SNP4, SNP5) (SNP1, SNP6, SNP10) (SNP2, SNP6, SNP7, SNP10)
DDD DDDD. DDDDD
(SNP1, SNP6) (SNP2, SNP5, SNP10) (SNP2, SNP5, SNP6, SNP9)
(SNP2, SNP6) (SNP2, SNP5, SNP10) (SNP2, SNP5, SNP6, SNP9)
Set of SNPs : {SNP1, SNP2, D , SNP10}
MDR: OverviewMDR
CV1
CV10
CV2

Introduction Elastic-Net MDR Gene Set Multivariate T2D Consortium
Type 2 Diabetes Risk Prediction
Introduction
Jostins and Barrett Human Molecular Genetics 2011

Introduction Elastic-Net MDR Gene Set Multivariate T2D Consortium
Acknowledgement
� T2D Consortium PIsMike Boehnke, Mark McCarthy, David Altshuler, John Biangero, Nancy Cox
� University of Virginia Ming Li
� Case-Western University Robert Elston
� Center for Genome Science, KNIH, KCDCYoung Jin Kim, Jong-Young LeeBok-Ghee Han,
� KARE Consortium
� Ansung and Ansan Cohort PIsNam Han Cho, Chol Shin
� DNA-Link
Jong-Eun Lee