Embed Size (px)
Citation preview
Improving Solar Radiation
Forecasting
Betsy Weatherhead, U. Colorado
Craig S. Long, NOAA/NWS/NCEP/CPC
NCAR Wind Forecasting Meeting, May 12, 2010

Needs of Renewable Energy
Community Solar radiation can reduce the demand
on the grid (personal Photo-voltaic panels). Highly angle dependent. Total Solar Radiation.
Maximum production during the middle of the day.
Passive maintenance of many systems.
PV plants depend on total solar radiation.• Fixed angle• Single axis• Full rotation
Concentrated Solar Energy highly dependent on direct beam radiation• Various forms of energy storage
Time scales from seconds to decades with a strong focus on minutes to days.

Solar Radiation - Basics
Solar radiation reaching the surface of the Earth is affected by many factors:• Sun angle• Clouds• Aerosols• Surface reflectivity• Water vapor• Ozone
All of these factors can change dynamically on a day-to-day basis.
Each part of the solar spectrum is affected differently by these factors.

Technologies are
still developing
Wavelength matters.
Clouds, aerosols, ozone, water vapor all matter.

Technological Improvements
Courtesy of NREL
Multiple paths to making solar
forecasts
Proprietary
Data extrapolation
Statistical modeling
Physical modeling
Ensemble forecasts
Data assimilation, rapid refresh

Rapid Update
for Aviation,
Severe
Weather
Air Quality
WRF NMM
WRF ARW
WRF: NMM+ARW
ETA, RSM GFS, Canadian Global Model
MostlySatellite+Radar
North American
MesoscaleWRF NMM
North American Ensemble
Forecast System
Hurricane GFDL
HWRF
GlobalForecastSystem
Dispersion
ARL’s HYSPLIT
For
eca
st
Severe Weather
Climate
CFS
~2B Obs/Day
Short-Range
Ensemble Forecast
NOAA’s NWS Model Production Suite
MOM3
NOAH Land Surface Model
Global Data
Assimilation
Oceans
HYCOM
WaveWatch III
NAM+CMAQ
Courtesy Stan Benjamin

Forecasting Solar UV Radiation
UV Forecasts have taken place for fifteen years in support of human health.
NOAA, various weather services, Accu-Weather
Private monitoring offers Nowcasts.
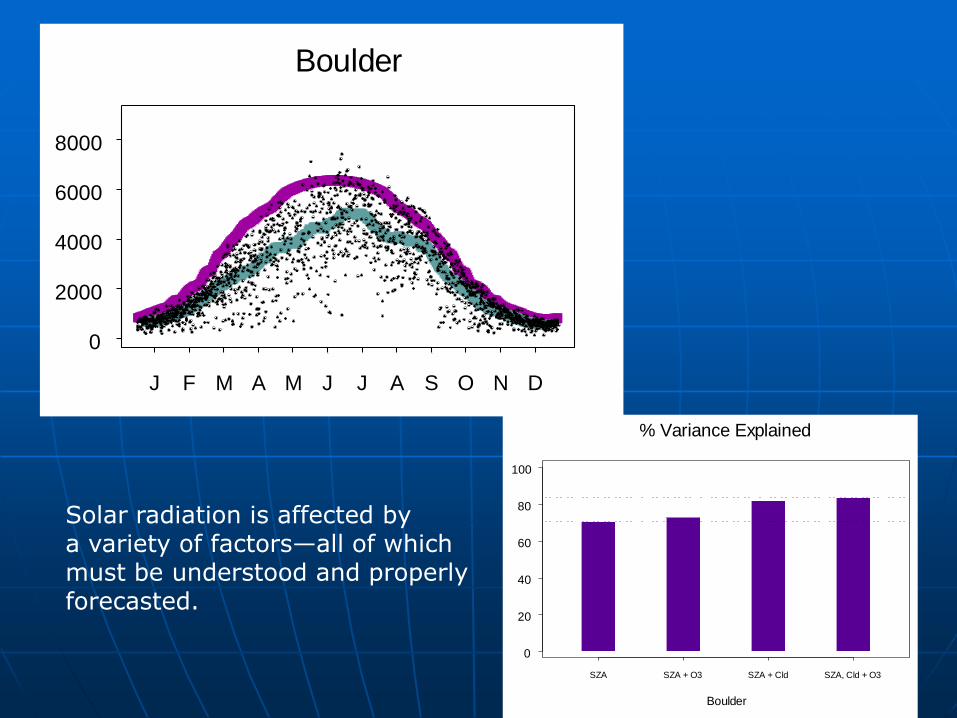
Boulder
J F M A M J J A S O N D
0
2000
4000
6000
8000
% Variance Explained
Boulder
0
20
40
60
80
100
SZA SZA + O3 SZA + Cld SZA, Cld + O3
Solar radiation is affected bya variety of factors—all of which must be understood and properlyforecasted.

NCEP 5-Day UV Predictions
Five Successive Days

UV Index Algorithm Old (virtually unchanged since 1994)
• Weight UV relationship w/total ozone and SZA derived from delta Eddington RT model.
• Total ozone fcsts from GFS.
• Surface UV albedo held constant at 5%, (no allocation for snow or ice cover).
• Aerosols: AOD is constant at 0.2 and SSA = 1.0.
• Elevation increases UV flux by ~6% per km.
• UVI clear sky field on 1x1 grid up to this point.
• Relationship between NGM MOS cloud prob and cloud attenuation of UV flux.
• Cloudy UV Index values at all (~800) MOS locations.
• Bulletin, Eta grid 211 and 207 are created by interpolation from MOS cities.
• Products are limited to next day solar noon over US.
New• Weight UV relationship with total ozone, and SZA derived from NCAR-TUV RT model.
• Total ozone fcsts from GFS.
• Surface UV albedo held constant at 3% for non-snow conditions. GFS albedo is used when > 30% (where snow is possible).
• Aerosols: AOD and SSA vary, derived from seasonal global climatology grids.
• Elevation increases UV flux by ~ 6% per km.
• Ratio of GFS down-welling UVB flux w & w/o clouds determines cloud attenuation.
• Output remains on gaussian grid.
• GFS inputs available at 3hr interval.
• UV Index products are outputted globally at 1 hr intervals out to 96 hours

- f19


Cloud Impacts•Broken clouds can be difficult to forecast. Within a balancing area, this may not be important. Defining appropriate areas is unclear.
•Very light cirrus clouds can have a large impact on direct beam efficiency.
•Both types of clouds can be difficult to predict.

Satellite IR Clouds obs at 11:45 UTC Oct 12, 2003

- f19

Bondville

25 mWatts/sq m = 1 UV Index unit
__ Diurnal trace of observed UV
x 1 hour mean about 18 UTC
| St Dev of obs +/- 0.5 hr about 18 UTC
o 18 hr FCST from 00Z run valid at 18 UTC
40.04N, 88.36W
Ery
them
al
Do
se R
ate
(m
W/s
q m
)

Improvements in NWS’ solar UV
forecast
Improvements in cloud and ozone forecasts result in a much improved solar forecast.
Verification depends strongly on time period of averaging when single locations are considered.
Significant improvements in solar
radiation forecasts
Cloud modeling has improved significantly over the past twenty years.
Inclusion of “cloud optical depth” and “cloud height” are of considerable importance to assessing transmission.
Aerosol forecasts are currently under consideration in NWS.

Erythemal Dose Rate - Bondville, IL - Oct 2003
0
25
50
75
100
125
274 277 280 283 286 289 292 295 298 301 304
Day of Year
Ery
thm
al
Do
se R
ate
(m
W/s
q m
)
SURFRAD New UVI-1 Current UVI25 mWatts/sq m = 1 UV Index unit
1 Day Forecast Verification

Erythemal Dose Rate - Bondville, IL - October 13 & 14, 200340.04N, 88.36W
0
25
50
75
100
125
286.0 286.5 287.0 287.5 288.0
Day of Year
Ery
them
al
Do
se R
ate
(m
Wa
tts/
sq m
)
OBS UVI Clear UVI w/clouds
25 mWatts/sq m = 1 UV Index unit
278 DU 309 DU
Fine temporal structure is extremely difficult.

Renewable Energy Needs
Improved forecasts are necessary for optimal use of solar energy
integration.
Multiple factors must be considered to make accurate forecasts:
clouds, aerosols, water vapor.
NWS currently makes solar radiation forecasts for 57 locations for UV
index. Significant improvements have been achieved using state of the
art cloud forecasting.
Fundamentally, improvements require accurate measurements of
both direct and diffuse radiation.

Actual hourly
variation of solar
energy potential
- accurate forecasts
are essential
Long-term estimates of solar radiation will need to take into multi-year factors including el nino, solar cycles, NAO, changes in climate, including in changes in the jet stream.
Predictions of long-term changes will require research into past long-term datasets as well as best available climate models.
Long-term Predictions
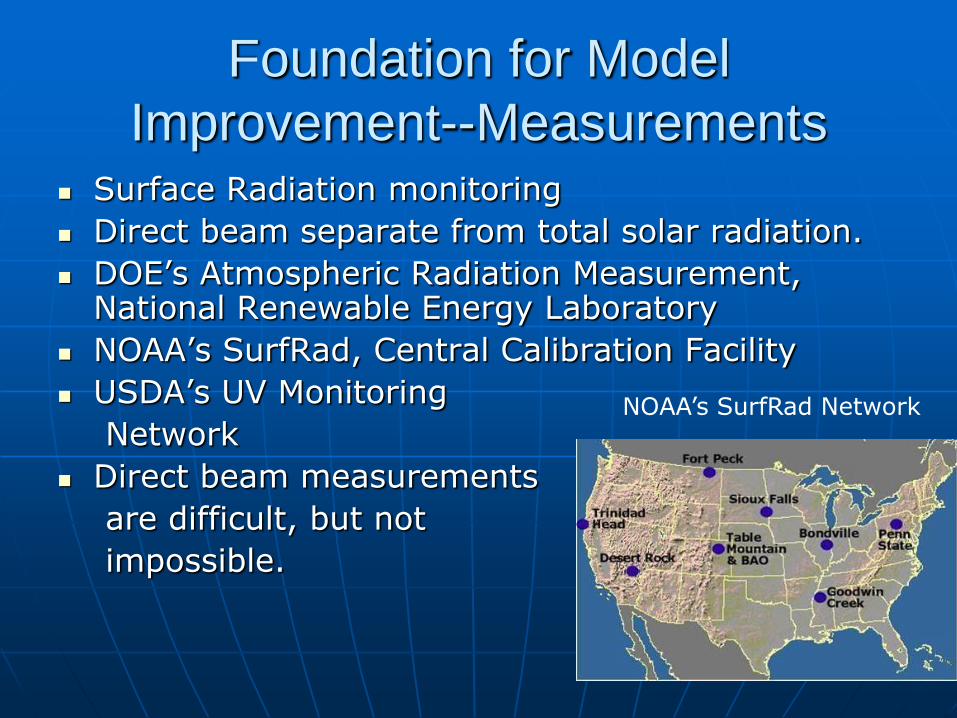
Foundation for Model
Improvement--Measurements Surface Radiation monitoring
Direct beam separate from total solar radiation.
DOE’s Atmospheric Radiation Measurement, National Renewable Energy Laboratory
NOAA’s SurfRad, Central Calibration Facility
USDA’s UV Monitoring
Network
Direct beam measurements
are difficult, but not
impossible.
NOAA’s SurfRad Network

Summary
Data are the foundation for improving forecasts.
Current solar monitoring is inadequate, but can be easily adapted and expanded.
Multiple modeling approaches will be needed to address the multiple needs of the renewable energy communities.