Embed Size (px)
Citation preview

Technical Report Documentation Page 1. Report No. TRP 99-25
2. Government Accession No.
3. Recipient's Catalog No. 5. Report Date November 2001
4. Title and Subtitle TRP 99-25 Improving Safety and Operational Conditions at Railroad Crossings- Bolt Installations, Designs and Torque Procedures 6. Performing Organization Code
7. Author(s) Dr. Richard Begley
8. Performing Organization Report No. 10. Work Unit No. (TRAIS)
9. Performing Organization Name and Address Nick J. Rahall II, Appalachian Transportation Institute at Marshall University, 1 John Marshall Drive, Huntington, WV 25755
11. Contract or Grant No. DTRS-98G-0012 13. Type of Report and Period Covered Final
12. Sponsoring Agency Name and Address US Department of Transportation Research and Special Programs Administration 400 7th Street SW Washington, DC 20590-0001
14. Sponsoring Agency Code USDOT-RSPA
15. Supplementary Notes
16. Abstract Torque bleeding, the unwanted loosening of the nut from a bolt connected assembly, is a common occurrence throughout industry. The phenomenon occurs for various reasons, but it mainly results from improper torque requirements upon fastening due, in part, to the improper characterization of static and dynamic loadings in which the connected assembly is subjected. This project will review the torque bleeding problem for railway crossings and perform several field tests designed to improve the performance of the bolts in railway crossings.
17. Key Word Railroad safety, Railroad Engineering, Bolt Torque
18. Distribution Statement
19. Security Classif. (of this report) Unclassified
20. Security Classif. (of this page) Unclassified
21. No. of Pages
22. Price
Form DOT F 1700.7 (8-72) Reproduction of completed page authorized

IMPROVING SAFETY AND OPERATIONAL CONDITIONS AT RAIL TRACK CROSSINGS – AN ANALYSIS OF BOLT INSTALLATIONS,
DESIGNS AND TORQUE PROCEDURES
Prepared for:
4901 Belfort Road, Jacksonville, FL 32256
Prepared by:
MARSHALL UNIVERSITY
NICK J. RAHALL, II APPALACHIAN TRANSPORTATION INSTITUTE
November 2001

IMPROVING SAFETY AND OPERATIONAL CONDITIONS AT RAILROAD CROSSINGS – AN ANALYSIS OF BOLT
INSTALLATIONS, DESIGNS AND TORQUE PROCEDURES
November 2001
Prepared for:
4901 Belfort Road, Jacksonville, FL 32256
Abstract: The Nick J. Rahall, II Appalachian Transportation Institute, at Marshall University, has prepared this draft report for CSX Transportation. The objective of this project was identify, develop and test procedures for reducing maintenance cost and reducing safety risks at railroad crossings as a function of the bolt and nut connections currently employed. The project required a preliminary research in order to understand all the factors involved. This research included literature related to the assembly process, joint behavior under loaded conditions, and methods of inspection. In addition, brief research into other crossing designs was conducted. Both mechanical and economic analysis of the bolted connection were made. This analysis included; the determination of the external loads and boundary conditions, calculation of the optimal clamping torque and selection of the locking devices that better fit the requirements of this application. A maintenance cost survey is also included in this section. Results were experimentally validated through in-field tests.
For more information, contact:
Nick J. Rahall, II Appalachian Transportation Institute 1900 Third Avenue
West Wing Huntington, WV 25703-1107
Phone: (304) 696-7103
Email: [email protected]
i
Disclaimer The contents of this report reflect the views of the authors, who are responsible for the facts and the accuracy of the information presented herein. This document is disseminated under the sponsorship of the Department of Transportation, University Transportation Centers Program, in the interest of exchange. The U.S. Government assumes no liability for the contents or use thereof.
COVER
Cover photograph provided by the Nick J. Rahall, II Appalachian Transportation Institute Photograph by Fernando Pascual.
Crossing at CSX line at Huntington, WV.
Prepared By:
Nick J. Rahall, II Appalachian Transportation Institute at Marshall University
Huntington, West Virginia (304) 696-7098
Participating researchers:
Richard D. Begley, PhD, Professor in Engineering Anthony Szwilski, PhD, P.E., Professor in Engineering David Cartwright, M.S. Assistant Professor in Engineering John Ball, P.E., Research Associate Fernando Pascual, B.S. Mechanical Engineering, PhD Candidate
ii

TABLE OF CONTENTS
1. PURPOSE AND NEED……………………………………………….…………….1 2. SCOPE………………………………………………………………….…………….3 3. TECHNICAL MEMORY
3.1.-Introduction………………………………………………………..……………4 3.2.-Foreword…………………………………………………………..….…………6 3.3.- Technical Review
3.3.1.- Bolted Joints ………………………………………………….………..12 3.3.1.1.-Importance of the joining process………………….………12 3.3.1.2.-Service in the joint: Vibrations …………………….……….17 3.3.1.3.-Bolted joints inspection…………………………….………..29
3.3.2.- Brief review of crossings…………………………………….………..33
3.4.- Tests on the track…………………………………………………………...34 3.4.1.-Need and purpose……………………………………………………..34 3.4.2.-Present maintenance procedure………………………………….….36 3.4.3.- First Test………………………………………………………….....…37 3.4.4.-Second test……………………………………………………………..44 3.4.5.-Third test………………………………………………………………50
3.5.- Analysis of the joint…………………………………………………………53 3.5.1.-Need and approach……………………………………………………53 3.5.2.-Analitic Calculus: Static, dynamic & fatigue; Thermal; Fracture…..54 3.5.3.-Computer simulation…………………………………………………..65
3.6. Economical analysis for the possible replacement of a frog…………71 3.6.1.- Objectives……………………………………………………………...71 3.6.2.- Replacement analysis literature review………………………….…72 3.6.3.- Replacement analysis proposed………………………………….…74 3.6.4.- Application of a simple replacement analysis to the frog case…...78
3.7.- Results………………………………………………………………………....81 4. REFERENCES…………………………………………………………………..….84
APPENDIXES
I. Frog & Turnout terms II. Crossing sketch III. Fastener Test Method MIL-STD-1312-7 A IV. Computer analysis results V. Chemical composition of the Bolt
iii

1.- Purpose and Need
CHAPTER 1: PURPOSE AND NEED. The objective of this project is to study maintenance problem(s) due to the self-loosening and fracturing of the bolts clamping the components of the railroad crossings frogs installed on CSX freight lines.
The Appalachian Transportation Institute (ATI), established at Marshall University (MU) was created by the US Congress in the Transportation Equity Act for the 21st Century June 8, 1998. ATI is part of 33 University Transportation Centers (UTC) located throughout the US. During the last three years, Marshall University’s ATI (MU-ATI) has been working on research, technology transfer and education projects related to transportation. The project presented here is one of the first of the MU-ATI technology transfer projects. Due to the pioneering nature of this project within MU-ATI, a goal was established to conduct an in-depth review of all the aspects related to the problem, to better understand the main technical issues.
Therefore, the main objective is to study the self-loosening and fracturing of the bolts reported previously. The self-loosening in bolted joints is a common problem in all kinds of applications. Usually this is due to the application of a clamping force inadequate to the working conditions of the joint. It can also be caused by the inaccurate evaluation of the static and dynamic loads acting upon the joint. The fatigue failure of the bolts in the frog crossing joint is usually induced by previous loosening, which leads to clearances and undesired displacements, and a acceleration the fatigue mechanisms
Hence, the main goal was divided into several objectives, corresponding to
the multiple tasks of the project: -Research of the existing resources related to the problem, including:
• A literature review to find the last advancements on self-loosening of bolted joints theories under vibration.
• A state of the art of the bolting tool technology • A study of the off-the-shelf locking devices: adhesives, nuts,
washers… • Techniques for inspecting joints
-Evaluation of the static and dynamic forces acting upon the joints by means of analytical and/or computational methods
1

1.- Purpose and Need
-A study of the possibility of conducting some in-field and/or in-laboratory
tests to obtain the optimal solution and design such experiments.
- A review of the economic magnitude of the problem. Following those steps, it was intended to separate both problems, the self-loosening and the fracture of the bolts, with the aim of studying solution(s) for each one. Although this is clearly a maintenance problem, certain research character was required in the project, due to the academic profile of the institution (ATI).
2

Chapter 2.- Scope of the project
CHAPTER 2: SCOPE OF THE PROJECT
The main goal of the project presented in the prior chapter is to decrease and/or eliminate the occurrence of self-loosening and fatigue fracturing of the bolted connection. In order to achieve these objectives, the project was divided in four sections:
1. Preliminary Research
Preliminary research was required in order to understand all the factors
involved. This research included literature related to the assembly process, joint behavior under loaded conditions, and methods of inspection. In addition, brief research into other crossing designs was conducted.
2. Analysis of the problem
Both a mechanical and economic analysis of the bolted connection were made. This analysis included; the determination of the external loads and boundary conditions, calculation of the optimal clamping torque and selection of the locking devices that better fit the requirements of this application. A maintenance cost survey is also included in this section.
3. In-field experimental validation of the mechanical devices and derived
results from the analysis above.
4. Conclusion
Based upon a review of all available data, a general solution to the problem is presented
Appalachian Transportation Institute Chapter 2 - Pag 3

Section 3.1:Introduction
CHAPTER 3: TECHNICAL MEMORY SECTION 3.1.- Introduction
After a literature review on the different facets concerning the project took place, the project was divided into three sections to best accomplish the stated goal of the project. The three sections of the project were studied and analyzed simultaneously due to their mutual dependency. The three sections are: analysis of the joint, field tests on the railroad track, and an economics consequence survey of the bolted joint. The following contains a brief description of the work performed.
Analysis of the problem is described in detail in section 3.2. This section was more difficult than expected, because to completely understand the problem and collect the needed data, many visits to railroad track locations, as well as to the Engineering Department of CSX were made. Finally, variables such as geometry, traffic, and the relevance of the problem were established. Several days were spent in the field studying current frog maintenance operations, in which important differences between the actual and written procedure(s) suggested by CSX were observed.
Once the problem was defined and understood, research was focused to gather information about the state of the art of bolting tool technology, locking devices for bolted joints, standardized tests, etc…The results are presented as a technical review introduction in section 3.3.
At this point, it was considered appropriate to perform calculations on the joint with the purpose of understanding the loads acting on the frog and to determine the optimum clamping torque. The mechanical analysis of the joint is shown on section 3.5 and is divided into two sections: In the first, a model for the loads and boundary conditions is shown. In this particular case, the most unfavorable cross section of the bolt is not located in the threaded portion of the bolt as expected, but in the middle of the bolt shank, at contact points with the web of the rail. Once the torque (clamp load) needed to avoid the impact between rail web and bolt shank is calculated, the weakest section becomes the threaded section of the bolt. In order to make an accurate analysis on this section, commercial software for bolted joints (www.boltscience.com) was used. The software performs analysis of the torque, static and dynamic calculus of the joint, and the fatigue of the threads. By using this software, it is also possible to
Appalachian Transportation Institute Chapter 2 - Pag 4

Section 3.1:Introduction
display the frictional loss of the energy supplied during the tightening process. These displays are interesting because they show how important the use of a lubricant is in order to convert the applied torque into elongation of the bolt.
After the initial visits to the railroad track, the actions were designed to orient or to modify some aspect of the actual maintenance procedure (new torque, new tools…), and/or introduce some new elements in the joint (washers, nuts, support plates…), in order to change its behavior. In order to check the most convenient solution some field tests on the railroad track were arranged. These tests are described in section 3.4. In the first one, the tools and the torque operations were tested, and some different anti-vibration devices were used. The second field trail tested the same premises, by at a different, and more highly traveled section of rail. The third field test was conducted to evaluate lock nuts and to test torque capabilities of CSX equipment.
As the continuous visits to the railroad took place, it was observed that the costs associated with the joint were only part of the total maintenance costs associated to the frogs. Besides the retightening and the replacement of the nuts, washers and bolts, other elements have important maintenance costs. Some examples of these costs are the periodic replacement of the manganese steel insert, the welding of the nose, and other extra maintenance tasks associated to the ballast, spikes and the tie plates.
These maintenance costs are a direct consequence of the design of the frogs; recent improvements in the design of frogs avoid most of those maintenance costs through improvements on the design although these modern frogs present a high initial cost. For this reason, it was decided to prepare a replacement analysis so that after observing the costs during a period of six months, CSX would have a tool to make the decision on the replacement of one frog if needed. That replacement analysis is presented in section 3.6.
Appalachian Transportation Institute Chapter 2 - Pag 5

Section 3.2.- Foreword
SECTION 3.2. - Foreword
Magnitude and approach
According to the definition of the AREA (American Railway Engineering
Association), a crossing such as the one that we are concerned is denominated “Railbound manganese steel frog” and is defined as “a frog consisting of a manganese steel center casting fitting into and surrounded by rolled rails and rigidly held together with bolts.” The pictures in figure 3.2-1 show the geometry of the part of the track studied.
Figure 3.2-1- Pictures of the frogs in CSX territory.
Appalachian Transportation Institute Chapter 2 - Pag 6

Section 3.2.- Foreword
CSXT has in the Huntington area 79 frogs installed in main tracks and around 250 in the yards. The maintenance frequency of the frogs depends on the track class, being higher in the IV class, in which the traffic is faster and the loads heavier. In these frogs the frequency of the maintenance operations frequency is even higher than once each three weeks. Those operations include the retightening of the loosen nuts in that period of time and the substitution of the broken bolts or the replacement of the broken washers.
Other maintenance operations that are usually conducted on these frogs are
the replacement of the manganese steel center and the welding works at the frog point. On the other hand, the bolt bleeding leads into enlarged vertical displacements of the frog itself, which allows destructive movements of the spikes, ties and ballast and represents further maintenance costs. The time needed for each maintenance operation is variable, with a minimum time of half an hour the time of two specialized workers.
Figure 3.2.-2 Up: A broken washer, a nut and a plate which, after loosening, have fallen into the floor. Down: A broken frog and a frog point that need to be repaired
Appalachian Transportation Institute Chapter 2 - Pag 7
Section 3.2.- Foreword
As can be observed from this data, the expenses associated with this part of
the track are elevated, and the study of how to reduce these costs is the main objective of this project.
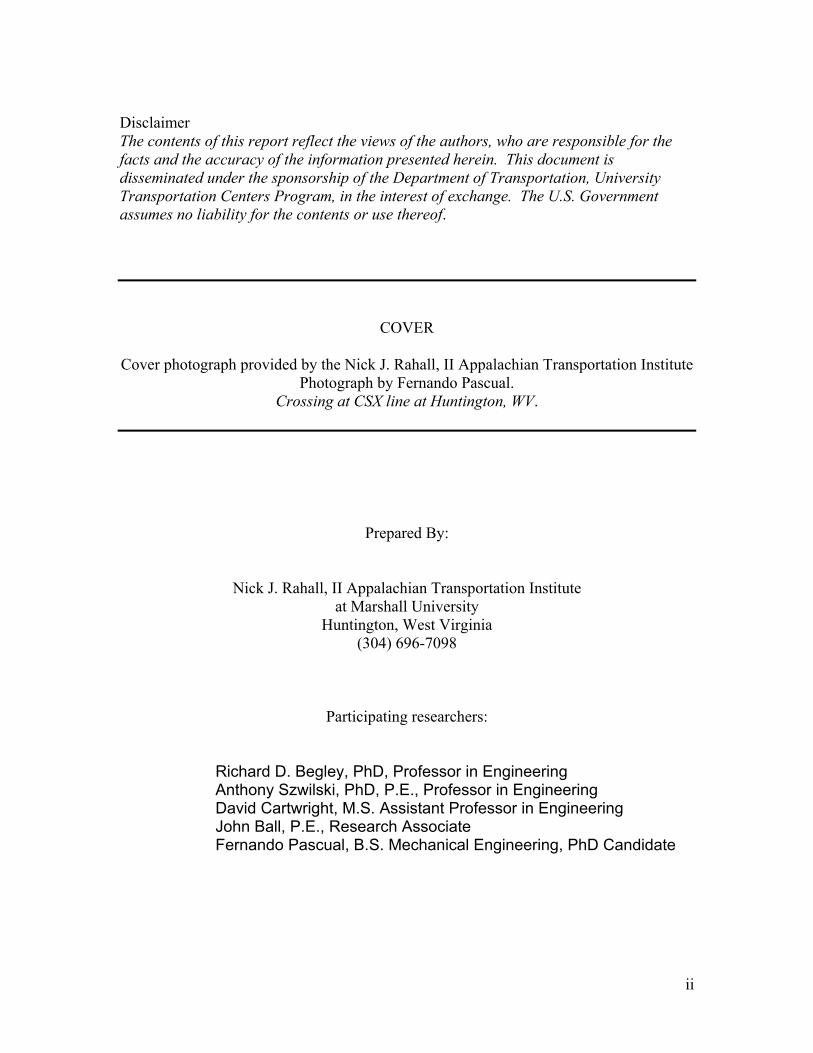
The bolts presenting the most severe bleeding troubles (thus maintenance
cost) are located at the heel of the frog, or, the group of bolts (3 or 4 bolts) situated closest to the running rail.
Guard Rail
Figure 3.2.-3: Scheme of a fr
Geometry
The geometry of the studied bolts is 1’’ 3/8-19 6 UNC SAE grade 8 ó Diameter: 1.375 inches (34.925 mmLength: 19 or 21 inches (482 ó 533.4Threads per inch: 6 Coarse Series Material: steel SAE grade 8
Appalachian Transportation Institute
Flangeway Guard Rail-Rail
Comm
og. From Garcia-Rodrigu
as follows:
1’’ 3/8-21 6 UNC SA
) mm )
C
Guard Rail
Flangeway 1 7/8’’ wide
Frog Point
Check Rail
Heel on Crossing
ez, [ref. 26]
E grade 8
hapter 2 - Pag 8
Section 3.2.- Foreword
Further detail about the length of each bolt in the crossing frog can be obtained in APPENDIX II. APPENDIX IV contains a complete set of data (geometry, material, etc..) used for the computer analysis. The chemical composition of the bolts can be observed in APPENDIX V.
During a visit to the quality control laboratories of a local bolt manufacturing
company, Level 1 Fasteners, the profiles of the threads, internal and external, were measured. The results allowed MU-ATI to classify the threads as 2A for the external thread and 2B for the internal thread. This data is important for the fatigue analysis of the joint.
External Thread: Internal Thread; External Diameter 1.359’’ External Diameter 1.2607’’ Root Diameter 1.259’’ Root Diameter 1.2667’’
A grower washer is typically installed with the nuts on CSX frogs to avoid bleeding due to vibrations. By direct observation of the washers installed in the track it could be concluded that an insufficient torque was being applied since no washer demonstrated the complete alignment of its ends, thereby indicating insufficient torque. The nut, when tightened, is mounted on a steel plate with a geometry that it will not allow it to rotate since it interferes with the rail. This implies that it is the nut that loosens by overcoming the friction between the plate and the nut. Another plate is situated under the head of the bolt. This plate has a raised flange that also prevents the bolt from rotating.
Loads When calculating bolted joints, two different types of forces have to be studied. One force is induced during the assembly of the joint, when torque is applied. Another set of forces are the external forces. In this case, the external load is transversal and is caused by the passing of the train over the bolted frog. Both forces are discussed in detail in section 3.5. In the next paragraphs, the loads due to the train are briefly exposed. The bolts in the frog are also subjected to thermal stresses due to the variations of temperature throughout the year. John Armstrong, in his book “The Railroad” [ref.3, Railway Dynamic references] proposes the following table for the weights and loads of the most common railcars.
Appalachian Transportation Institute Chapter 2 - Pag 9

Section 3.2.- Foreword
Nominal Load per Car
(Tons) Nominal Load per Car
( Pounds) Total load on the track( 4-
axle wagon), pounds 30-ton 60,000 lbs 103,000 lbs 40-ton 80,000 lbs 142,000 50-ton 110,000 lbs 199,000 70-ton 154,000 lbs 220,000 100-ton 200,000 lbs 263,000 125-ton 250,000 lbs 315,000
As only one of the wheels othat each railcar has 4 axleswould be eighth of the total will have a 1.5 coefficient, wlb), equivalent to 30,000 kg calculating the static and dy Traffic The traffic on the tracks in Hgraphically presented in figuapproximately 56 millions to
Figure 3.2.-4: Ann
Appalachian Transportation Institu
Table 3.2.-1
f each axle passes through the frog, and knowing , the maximum weight per wheel for a 125 T car weight, 39,375 lb. For calculation purposes this load hich results in a load per wheel of 59,062 lb (60,000 in S.I. This data will be used in section 3.5 for namic stresses in the bolt.
untington, WV, area that are being studied is re 3.2.-4 . Maximum tonnage for the area is ns per year.
ual tons (millions) for the Huntington area of WV (CSX)
te Chapter 2 - Pag 10

Section 3.2.- Foreword
To have an idea of the magnitude of the number of times that the joint is loaded and unloaded, imagine a train that transports the whole 56 million tons. If the average load that a rail car can transport is 125 Tons, the train would have a length of 448,000 cars. As each car has 4 axles, the frog is loaded and unloaded 1,792,000 times each year. (149,333 times each month, 4,910 times each day.) From other point of view, assuming that each train has 100 cars, each time that a train passes there are 400 cycles (without computing the 6 axles of the locomotive). To constitute the numbers above, there would be about 10.5 daily trains of 100 cars each.
Appalachian Transportation Institute Chapter 2 - Pag 11

3.3 –Technical review
SECTION 3.3: Technical review In this section, some topics that are considered relevant for the better understanding of the rest of the text are presented. With the objective of making this part as brief as possible, all the information that was not considered strictly necessary is omitted, but it can be observed in the references at the end of the text.
3.3.1. Bolted Joints 3.3.1.1. Importance of the assembly process: tools and lubricant
Tools: Hydraulic Torque wrenches The first commercial hydraulic torque wrenches appeared in 197,1 so it can still be considered new technology. The need for more powerful and precise tools encouraged the apparition of these wrenches. The substitution of the hydraulic torque wrenches over other tools used to tighten (manual wrenches, pneumatic wrenches, impact hydraulic wrenches etc,) depends on the application. Hydraulic torque wrenches have the following advantages compared to other wrenches:
• Torque: For commercial models, torques of 35 000 ft⋅lb can be reached for a 6.166” nut. The torque is limited by the power of the hydraulic unit.
• Precision: Most of the suppliers stipulate an error of +/- 3% for their tools.
Impact wrenches, which are the next most precise tool, have a 10% error in the best cases.
• Control: The pressure indicated in the hydraulic unit can be easily converted
to a torque using a conversion table that is printed on the wrench. The torque reaches the desired pressure gradually. Currently, impact wrenches do not have an adjustable hydraulic feed.
Appalachian Transportation Institute Section 3.3 - Page 12
3.3 –Technical review
Ergonomically, the hydraulic wrenches eliminate the high level of noise and vibrations to which the user is subjected when he uses impact wrenches.
In order to use a hydraulic wrench it is necessary to have with a unit that
generates the necessary pressure. Some of the elements that constitute the tool, the wrench and the hydraulic unit, are described in the next paragraphs.
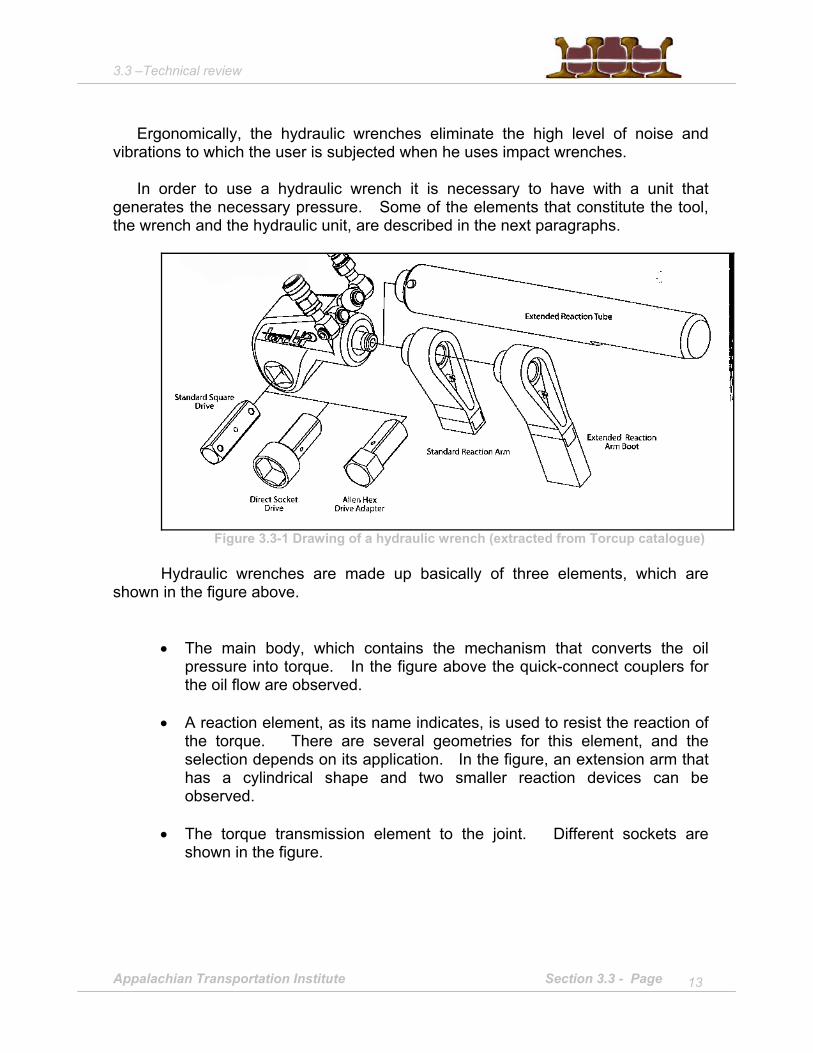
Figure 3.3-1 Drawing of a hydraulic wrench (extracted from Torcup catalogue) Hydraulic wrenches are made up basically of three elements, which are
shown in the figure above. • The main body, which contains the mechanism that converts the oil
pressure into torque. In the figure above the quick-connect couplers for the oil flow are observed.
• A reaction element, as its name indicates, is used to resist the reaction of
the torque. There are several geometries for this element, and the selection depends on its application. In the figure, an extension arm that has a cylindrical shape and two smaller reaction devices can be observed.
• The torque transmission element to the joint. Different sockets are
shown in the figure.
Appalachian Transportation Institute Section 3.3 - Page 13

3.3 –Technical review
A remote hydraulic unit is in charge of generating and controlling the necessary oil pressure into the wrench. These units can be powered by a small combustion engine, pneumatically or, through a standard AC line. All the units have an engine, a hydraulic pump, an oil reservior, a direction fluid control valve, a pressure valve and a remote control that controls the machine. The range of the maximum pressure oscillates from 420-700 bars.
Figure 3.3-2 Examples of hydraulic power units offered by Torcup.
Importance of the lubricant Lubricants are compounds that are applied on the threads of the bolt, the nut,
and other contacting surfaces to decrease friction during the tightening of the joint. The lubricant has a very important effect on the bolted joint, in the tightening and throughout the service of the joint. When lubricant is used better results are obtained.
Although it may seem that a lubricant could accelerate the loosening process
of the joint, the actual consequence of the proper use of lubricant leads to these advantages:
• Avoids the phenomena of deformation and stripping of the threads when
tightening. • Increases the tension stress transmitted to the shank of the bolt.
• Increases the repeatability of the tensile stress achieved in the shank.
Appalachian Transportation Institute Section 3.3 - Page 14

3.3 –Technical review
• Decreases corrosion and fatigue problems. Protects the threads against other chemical reactions.
• Increases the uniform stress distribution on the thread.
• Facilitates disassembly of the joint.
The lubricant fills the spaces between the threads, making a fine layer that minimizes the contact between the nut and the bolt, avoiding the contact between metals and decreasing friction. In addition, it provides for a more even distribution of stress from the nut to the bolt.
In the next graph the importance of the lubricant in the reduction of friction is
shown.
Figure 3.3-3 Screenshot from Fastener software.
It can be observed that for such a joint, the absence of lubricant implies that only 12% of the supplied energy of the tightening process is transformed in tension to the bolt, as the rest is dissipated in friction. Haviland (see refs. Bolted joints) proposes that for long series, the absorption values by friction in the torque are 39% in the threads and 46% under the nut head, and only 15% becomes tension in the bolt.
Viscosity of the lubricant is the first parameter that has to be checked in order
to assure thread filling. The viscosity value depends on the clearance between the
Appalachian Transportation Institute Section 3.3 - Page 15

3.3 –Technical review
bolt and nut. To assure the correct viscosity selection, Haviland proposes the next table:
Figure 3.3-4 Selection of the viscosity of the lubricant to assure the right use of the lubricant.
Once the lubrication condition has been checked, the temperature range, as well as the other environmental variables, has to be taken in account.
Following the classification proposed in the Handbook of joints and bolted
joints (see refs. Bolted Joints), lubricants can be arranged in three different groups: liquids, greases (combination of a solid and liquid lubricant) and solid. Liquid lubrications are based on oil compounds and silicones, esters, glycols and polybutanes. They have a limited application due to the oxidation processes that start at 347ºF (175ºC), temperatures that can be reached locally in the tightening when the torque is elevated. Greases contain solid lubricants dispersed in some kind of oil. The more common solid particles are powders and shavings of copper, nickel and aluminum. These lubricants can stand high temperatures and loads. Finally, yet importantly, are lubricants consisting of a liquid that have some solid particles. Once used in the joint, the liquid evaporates, leaving a fine layer of solid lubricant on the threads.
For this case, a Loctite grease with the following reference was chosen: NAPA Loctite Lubrigard Anti-seize compound, Part No.765-1151. This grease is capable of withstanding the most aggressive climates such as interior of engines, where the conditions are more severe than in this case of study. The viscosity is also appropriate for this study. The selection was made with the help of a technician from Loctite and Mr. Barry R. Ralph II, who specializes in tool technology. With cost and availability considerations, Loctite is a product widely used in the bolting industry.
Appala
Figure 3.3-5
chian Transportation Institute Section 3.3 - Page 16

3.3 –Technical review
3.3.1.2. The joint in service: Vibrations and bolted joints Existing theories review
Archimedes was the first person to develop and use a spiral screw in 250 B.C. as a method to improve irrigation systems. Prior to 1450 A.D., the unique application for screws was for fluid transmission. The first application of screws with slotted heads for fastening was in the 18th century when the use of screws and nuts became widespread. Along the last century, many researchers have focused on fasteners, as dynamic loosening is a very fertile field. A comprehensive survey on vibration loosening can be found in the Handbook of bolts and bolted joints [3]. At this point, only a few outstanding authors will be named.
The first investigators who theoretically and experimentally studied bleeding
under an axial dynamic loading were Goodier and Sweeney [6] in 1945. They anticipated that threaded fasteners loosen due to the relative displacements between nut and bolt, giving some expressions for the torque required to make the nut loose as a function of the geometry and the friction conditions of the joint.
Junker [8] is another relevant name in the study of dynamic loosening is He was
the first to study bleeding due to a transversal vibration. In addition, the testing machine he designed for conducting tests has become the typical device for testing joints under transversal vibrations. He stated, “Bolted connections loosen because the combined external force and circumferential component of the normal thread force overcome the friction forces holding the joints.”
During the last decades, many of papers have been published in this field. As a
list of readings for further information, the following papers are suggested: Blake [2], Sauer [7], Koga [10,11], Sweeny [15] and Haviland [17]. Additional references can be found in chapter 4.
The loosening mechanism proposed by Hess and Coworkers (1996) represents
the state of the art for axially loaded connections. That mechanism is similar to the one presented by Zadorks and Xu for transversal vibrations, as this scenario is comparable to that observed in the crossings. This model was chosen to explain the loosening mechanism because it represents the most complete mathematical model and it is the only existing theory to simulate this phenomenon that has been experimentally confirmed. Basically, this theory establishes that, once the transversal impact on the bolt is determined, the angle in which the nut loosens as a function to the vibrations can be calculated with accuracy.
Appalachian Transportation Institute Section 3.3 - Page 17

3.3 –Technical review
Certainly, all of these theories match, and lead to the conclusion that the principal cause of loosening in bolted joints is the application of an insufficient torque. It is important to mention that the friction in the threads that keeps the joint clamped must be proportional to the tension communicated to the bolt through the torque. Moreover, if the torque is not high enough, there will be a situation in which the extern loads will surpass the friction and the joint will loosen.
All of the theories begin with the hypothesis that the bolt has been tensioned in
the tightening to at least the 60% of its yield point.
Figure 3.3-6. The diagram shows that the behavior of the joint when the tension corresponds
to 50% to 60% of the yield point is unpredictable, being inappropriate tensional states under those figures. Most of the consulted references recommend tensions from 60% to 80%, and some authors recommend to tighten bolts to yield by means of this technique. Better control and a higher initial clamping force are reached because strain in the bolt is easier to control than friction. However, the safety margin for transversal actions decrease.
Appalachian Transportation Institute Section 3.3 - Page 18

3.3 –Technical review
Loosening theory due to vibrations
The chosen theory constitutes the most recent attempt to explain the loosening of bolted joints under transversal vibration. Herein, R.I. Zadoks and X. Yu propose a mathematical model that relates the received transversal vibration in the shank of the bolt to the rotation angle of the nut in its loosening movement.
The theory is not exposed in depth in this text because the main objective of this project is to avoid the costs associated with the maintenance problem. Nevertheless, if further research is conducted in this direction, this model could be adapted to the track problem in the study, using as input the impact that the bolt in the frog receives. This impact could be calculated using the Gilles Sauvage model (see Rairoad references). Both models could be integrated and by the use of the appropriate software, (for example Matlab/Simulink), would result in a model with speed and load as inputs and the angular speed of the loosening as output.
In order to develop this mo
the mechanisms involved in the lothe static. The article and the tcomplete his Master in Sciences,are the loosening sources when thresearch produced as the main rshank of bolt and the rest of the make the bleeding phenomena ap
To determine the amplitud
dynamic model of two degrees of system that simulates the behavobtained using the contact theory the bolt, the input used was aexcitation, from which the amplexperiments to determine the influe
Appalachian Transportation Institute
Figure 3.3-9
del, Zadoks and Yu made and extensive study of osening process, as for the dynamic loads as for hesis that X. Yu presented as a requirement to study a mathematical model to determine which e bolt is subjected to transversal excitation. This esult the following assert: ” impact between the parts of the case is a necessary circumstance to pear.”
e and duration of the impact, they proposed a freedom. It can be seen in figure 3.3-9. In this ior of the bolt, the stiffness of the contact is
of Hertz. To evaluate the complete movement of step function that represents the transversal itude and frequency was changed in different nce of such variables.
Section 3.3 - Page 19

3.3 –Technical review
With this simulation the number of impacts is obtained. The amplitude and
duration can be obtained by the use of another model proposed by the same authors. Once the nature of these impacts is known, and the rest of the variables of the problem are identified (as geometrical variables and others related to materials), the authors propose a formula that results in the bleeding angular velocity of the bolt.
Review of locking devices.
Many bolted joints use antivibration or blocking mechanisms to avoid loosening. Although many devices can be found on the market, the following classification can be set: (Bickford, Handbook of bolts and bolted joints):
a. Free running preload-independent locking fasteners. b. Free running preload-dependent locking fasteners. c. Prevailing torque locking fasteners. d. Chemical blocking.
Next, some examples of the different groups will be briefly explained. Emphasis will only be placed upon those devices considered appropriate for this case. Last in this section, a brief discussion of the possibility of modifying the design of the joint, as a way to decrease the influence of vibrations, will be made.
a. Free running preload-independent locking fasteners. These kinds of devices are independent of the stress in the bolt. First, the
joint is installed following the ordinary procedure, and then the device is installed. When one of these mechanisms is used, the objective is to avoid rotation, which is accomplished by means of a mechanical blocking. This involves problems in the disassembly of the joint and modifications in its initial design. Some examples of these devices are:
Lock nut: Installing a second nut on the first. The first step is to tighten the
first nut until the desired torque is achieved. Then the second nut is tightened upon the first one. In the case that is being studied, the lock nut would require an extra length of the bolt, which it is not available.
Appalachian Transportation Institute Section 3.3 - Page 20

3.3 –Technical review
Lock Wire between nuts: in this case a wire is fed between two nuts. This solution would imply a modification of the nuts so that the wires could be used, which would involve an extra installation cost as well as a disassembly cost. Also, the geometry of the frog would make the installation difficult.
Welding: The possibility of welding the nuts to the bolt would transform the
joint to a permanent one. Because some maintenance activities such as the replacement of the manganese steel insert require the disassembly of the joint, welding will not be studied. However, some welded nuts were observed in crossings that were visited as part of this project.
Cotter pins and slotted nuts: This variety of devices would imply a new
design that allowed a cotter pin to connect the slotted nut and the cotter pin. Usually, this design is a hole made with a drill in both elements, located in a way so that when the desired torque is reached, they match, thus allowing a pin to pass through the bolt and nut, locking the joint. These devices are not recommended due to the labor that would be involved to precisely drill the nuts and bolts.
Other devices that are not as common as those mentioned above are the
bolts called Truelock, developed by a company with the same name located in Virginia.
Another interesting solution is the use of Shape Memory Alloys, (SMA). This
kind of material changes its dimension depending on the temperature, following different mechanisms further than thermal expansion. The SMA steel has proved effective in blind joints. Steel with a critic temperature lower than the ambient temperature is used. The pin is designed so that after being installed at low temperature, the bolt expands when it is subjected to room temperature: Due to the special shape of the bolts, during the expansion some parts fit into some gaps, locking the joint. A company, Intrinsic Devices Inc., from San Francisco specializes, in SMA locking technology. (http://www.intrinsicdevices.com/). Applications are normally used in single-cycle small-size applications.
Appalachian Transportation Institute Section 3.3 - Page 21

3.3 –Technical review
b. Free running preload-dependent locking fasteners In this type of device, when torque is applied, part of the energy falls on the locking mechanism. This category includes all the washers and special nuts designs. The number of locking designs for washers and nuts is immeasurable but the most relevant designs for this application are mentioned below. Spiralock: Spiralock is an internal thread design that incorporates a 30 degree ramp. Nuts with this thread design are used with standard bolts. During the tightening process, the ramp interferes with the external thread, thus creating a more homogeneous stress distribution and implying two advantages over the standard design: better resistance to the loosening due to vibrations and self-centering of the nut. The latter represents the main competitive advantage of these devices for precision applications such as medical or weapons manufacturing.
Figure 3.3-10: Spiralock Thread: Scheme and photoelastic analysis.
Several studies on this type of thread design have been performed. The most important were those developed by MIT and NASA (see refs). In the web site www.spiralock.com, Spiralock provides further information on these products, as well as the results of the photo-elastic tests and finite element modeling analysis.
Due to the interest shown in this product, Spiralock committed to deliver some samples in order to test its efficiency on the tracks and, therefore, compare the Spiralock design versus other mechanisms. On April 30th 2001, the marketing director and the sales manager for the East Coast visited ATI. They brought eight 1’’3/8 nuts which the required dimensions for application in the test frogs. Spiralock adjusted a production schedule to deliver these bolts in time for the test. The
Appalachian Transportation Institute Section 3.3 - Page 22

3.3 –Technical review
authors appreciate the cooperation and interest that Spiralock has shown in this project.
Deadnut: Faxtenix offers an anti-vibration design made up of two nuts; one
of them is the nut itself, which are in charge of transforming the torque into tension. The other nut is a blocking device. The locking action is accomplished by means of the interference with the main nut. In figure 3.3-11 the design is shown. In the first picture the position in which both nuts rotate around the bolt can be seen. Once the desired torque is reached, the lock nut rotates around the principal nut, thus creating a block by interference. In www.faxtenixcorp.com there is more information on this design.
This design was not tested because no Fastenix nut of the required size was
available for testing purposes.
Free rotation position
Blocking by interference
maximum security position. Medium security blocking
position. Figure 3.3-11. Deadnut
Appalachian Transportation Institute Section 3.3 - Page 23

3.3 –Technical review
Hbrobotics: The vibration resistant nut that Honeybee Robotics offers was developed under a NASA request. In the agreement, Honeybee Inc. was committed to develop a nut compatible with standard screws capable of withstanding the strong vibration level during launching. The nut was successfully tested under the standard MIL-STD-1312-7 A. The main characteristics of this device are: it can be reused, has great resistance to vibrations, is compatible to standard bolts, is reversible and has excellent stress distribution along the thread. In figure 3.3-12 shows the special design of the thread of the nut. For more information, including the results of MIL-STD-1312-7A, www.hbrobotics.com
ATI contacted Honeybee Robotics and no nuts were available for testing.
However, Honeybee Robotics did offer ATI authorization to manufacture several nuts if necessary. Due to uncertain cost and time constraints to accomplish the task, this option was not pursued.
Figure 3.3-12. Design of the Hbrobotics thread. Picture from www.hbrobotics.com
Nord Lock Washers: Nord Lock is a Corporation that produces locking devices formed by a pair of washers that prevents loosening by means of tension instead of friction. The device is formed by two washers and each one has cams in one face while the other face has radial teeth. In order to assemble the device, both washers are brought together cam face to cam face. The teethed surface has
Appalachian Transportation Institute Section 3.3 - Page 24

3.3 –Technical review
the function of preventing the washers from slipping. Then, the rotating movements have to appear between the cams, and not between the device and the nut.
The angle of the cams is greater than the pitch of the bolt thread, in such a
way that when an excitation that could make the nut rotate appears, it attempts to make one washer rotate around the other. In this way, when trying to displace the cams, an increase of the tightening force appears as a result. Therefore, this device uses tension instead of friction to avoid loosening.
In fig
provided by the loss of lothat in ordera peek in thinclined plan
Appalachian T
Figure 3.3-13. Picture of a Nordlock washer and its functioning.
ure 3.3-14 the results of a test MIL-STD-1312-7A are shown (data the manufacturer). In the left picture there is a comparison between ad and the number of cycles. In the second figure, it can be observed
to loosen a nut in which a Nordlock washer has been installed, there is e graph. This is the missing tension, equal to the resistance of the es.
Figure 3.3-14. Results from a vibration analysis over the Nordlock washerransportation Institute Section 3.3 - Page 25

3.3 –Technical review
Mr. John Gordenflo, a mechanical engineer and sales director of Nord-Lock USA, attended the first test on the track when some Nord-lock washers were installed. In addition, he made an interesting demonstration of a vibration test with a portable Junker machine, which besides proving the effectiveness of their products, it proved the resistance to bleeding of the different devices. For more information: http://www.nord-lock.com/
Security Nutlock: These nuts are made out of two parts. On the one hand, there is one in charge of the torque transmission, the nut itself. On the other hand, there is a socket in the internal part of the nut that is in charge of protecting against loosening.
Mr. Bickford, a bolted joints consultant,
calculated for Security Nutlock Inc. the torque needed for installing these nuts in diamond crossings. Further interesting conclusions can be extracted from this paper [ref.25], such as a statistical verification of the low efficiency of impact wrenches for this sort of applications and the unfeasibility of using ultrasonic measurement in crossings due to the geometry of the joint.
Figure 3.3-15. Security Nutlockc. Prevailing torque locking fasteners.
These devices are based on creating interference between the external and internal threads. There are two different groups, depending on the cause of the interference: metal (i.e. elliptical shaped collar) or chemical (i.e. nylon inserts). Under the action of static loads, these elements fulfill the objectives, but when they are tested in a Junker machine, their performance decreases.
Besides the high price of these nuts, other
inconveniences are: they cannot be reused, It is difficult to determine the friction coefficients in the threads, and the increase of the necessary torque compared to the standard nuts.
Figure 3.3-16.
Today there are many different designs that can be included in this group.
Fortunately, in 1988 the IFI (Industrial Fasteners Institute) established a standard for the regulation of this group (IFI standard 1001107 and 124, [ref18]).
Appalachian Transportation Institute Section 3.3 - Page 26

3.3 –Technical review
d. Chemical Locking. The adhesives typically used to block bolted joints are anaerobic. These can be
easily applied on the threads during assembly or pretreated bolts and nuts can be purchased. The latter are delivered with the adhesive in a capsule in the threads, so during the tightening the capsule breaks and the adhesive spreads and fills the clearance between the internal and external thread. Adhesives can be purchased to permanently lock the joint or to provide for fast disassembly, depending on the product. The selection of the proper adhesive depends on the size, the range of working temperature and stress and if it is compatible with the lubricant that will be used. Loctite shows in its web site (www.loctite.com) a broad catalogue of adhesives for bolted joints. In 1988 IFI established a standard for this blocking method. In a publication of Loctite chemical engineer Mr. Haviland (refs.16,17), he proposes a guide for the correct selection of the adhesive.
Dappropwith thestill in b
e. D
Texplainchangeproblem
Nbolted cexpenstransvelongitud
Toffers a
Appalac
Figure 3.3-17.
ue to the dimensions and stress magnitude of the study, there was no riate adhesive found on the catalogs. However, after having a conversation Engineering Department of Loctite Co, they provided an adhesive that is eing tested by Loctite that would fit the requirements.
esign considerations
hroughout this section, different methods to avoid loosening have been ed, always with respect to the initial design. In case the design could be d, these design variations may become the most effective way to solve the .
o further efforts will be made in the discussion of redesigns of the bolt or the onnection. Furthermore, any modification in the design would lead to a great
e due to the amount of bolts involved. However, it has to be mentioned that rsal vibrations could be avoided by changing the design in order to receive a inal excitation instead of transversal. he third volume of “Engineering Design” of R. Orlov (see refs. Bolted Joints) n excellent guide to the bolted joints design.
hian Transportation Institute Section 3.3 - Page 27

3.3 –Technical review
Standardized tests.
According to a recent publication of the “Division VI Aerospace Fasteners of the Industrial Fasteners Institute (IFI, 1995),” there are only two standardized tests referent to bolted joints subjected to vibrations: The NASM- 1312-7- A (named MIL-STD-1312-7 A until 1997) and a test of the fatigue limit, NAS 1675.
The US Defense Department developed the MIL-STD-1312-7 A, also known as the ALMA test. The standard is attached in Appendix III and represents the only test for the testing of joints. Obviously (IFI 1995) such tests for bolted joints do not represent real use conditions, and the results must be used in a comparative way, using the reference that best fits this case. The industry has been looking for a definitive test during the last 25 years; however, since a new standard has not been developed, both tests will continue to be the only possible options to prove the resistance of a bolted joint under vibrations. • Standard for the joints: NASM- 1312-7 A
The NASM- 1312-7 A (MIL-STD-1312-7 A, U.S. DoD, 1984) provides a procedure for testing bolted joints under transversal vibrations. The test can be used to estimate the service life for the joint and to compare the effectiveness of different blocking devices. The effectiveness is measured in function of rotation of the bolt or by the presence of fatigue cracks.
Figure 3.3-18. Drawing of the bolt in the passing joints.
Appalachian Transportation Institute Section 3.3 - Page 28

3.3 –Technical review
This standard can be viewed in Appendix III
• Standard for blind joints: NAS 1675
The vibration endurance limit test called NAS 1675 (AIAA, 1989) establishes a procedure to test blind bolted joints, when only one of the two ends of the joint can be reached.
As the studied joint provides access to both ends of the bolt, no further explanation is required. 3.3.3. - Bolted joints inspection When inspecting bolted joints, the tensile stress in the shank of the bolt is the most important magnitude to be measured. All of the available methods to measure tensile stress can be grouped in two procedures; indirect tension measurement and direct tension measurement.
Torque-angle Control This is a case of controlling the angle to which the nut rotates or the torque in the assembly process. It is impossible to accurately determine the tensile stress in the shank of the bolt when using this method. This is due to the friction, which varies in each assembly process that appears in the threads and under the head of the nut. This friction depends on the lubricant, the surface quality of the elements of the joint, the temperature, the precision of the wrench being used, corrosion, dust, and many other variables.
To control the tension of the bolt by using the torque-angle relationship, two steps are applied:
1. Apply a torque. 2. Rotating the nut an additional angle. In order for this process to be considered statistically reliable, both the initial
torque and the suitable angle must be determined with help of one of the direct control methods subsequently explained.
Appalachian Transportation Institute Section 3.3 - Page 29
3.3 –Technical review
Bolt elongation control. The methods for quantifying the tension in the bolt by the measurement of the elongation of the shank constitute the only way to exactly determine the stress. • Micrometers: Traditional micrometers, such as the C type, measure the total
elongation of the bolt. Both ends of the bolt must be accessible. The size of the bolts that could be measured by this method was limited. New micrometers called in-depth micrometers require that a hole is drilled in the bolt. A rod is installed so that when the bolt extends in the tightening, the rod displaces. The magnitude is then measured by a technician.
• Strain gauges: By means of strain gauges, the elongation of the shank
during the tightening process is obtained. Strain gauges are devices with an electric resistance that varies depending on the strain. Installed on a bolt, and being part of an electric circuit as the variable resistance of a Wheastone bridge, the elongation can be read as stress. In the particular case of crossings, the use of this type of devices is impossible because only the ends of the bolt are accessible and not the shank. In addition, the installation of a gauge on a bolt would not provide enough information to determine the necessary torque for the rest of the bolts. This test would only be useful to prepare a control procedure for the torque-angle methodology that was described before.
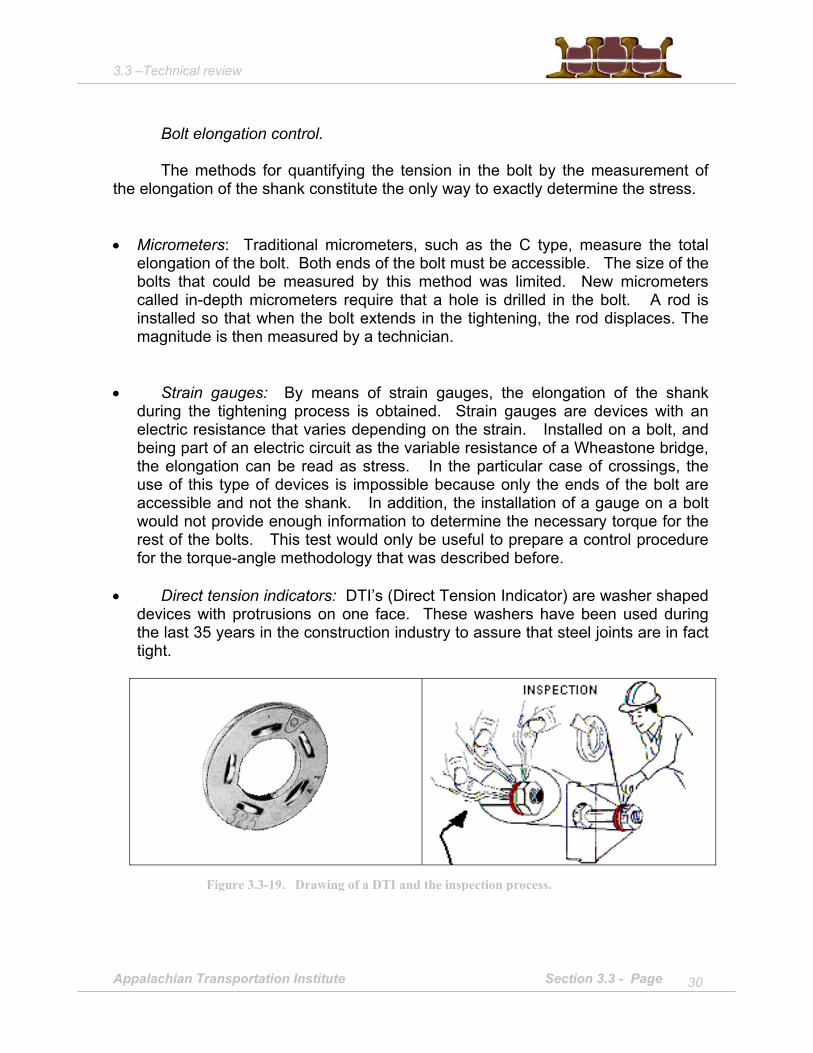
• Direct tension indicators: DTI’s (Direct Tension Indicator) are washer shaped
devices with protrusions on one face. These washers have been used during the last 35 years in the construction industry to assure that steel joints are in fact tight.
Appalachian T
Figure 3.3-19. Drawing of a DTI and the inspection process.
ransportation Institute Section 3.3 - Page 30

3.3 –Technical review
The installation method of a DTI is the same as that for used for a washer,
with the protrusions pointing towards the head of the bolt. The torque is applied until the bumps deform to a previously calculated length, which can be checked by means of a micrometer.
• Ultrasonic measurement. Presently, this technique represents the most
accurate method to control the stress on the bolt. The method consists of sending ultrasonic pulses through the bolt. The pulse is induced in one end of the bolt and is reflected at the other end bouncing back to the transducer. Since either the length of the bolt and the speed of those waves in the steel are known, the elongation can be obtained from the measurement of the time taken by the wave to return to the transceiver.
In the pictures below, different instants of a demonstration that a Dakota
Instruments technician (www.dakotainst.com) made for ATI can be observed. The test always begins with the measurement of the length of the bolt that is going to be installed. Next the bolt is installed and a second measurement is made of the length, giving as a result the elongation that the bolt has undergone due to the applied toruqe, and therefore the tensile stress that the bolt has.
This equipment is easy to use; it has great portability and high resistance to the working environment. Beside Dakota Co. another two companies commercialize this type of equipment: Stresstel Inc. and Raimond Engineering. Each has been contacted and their equipment prices vary approximately from $8,000 to $13,000.
Appalachian Transportation Institute Section 3.3 - Page 31

3.3 –Technical review
Figure 3.3-21. Control unit of the ultrasound equipment
from Dakota Instruments
John Bickford, author of the book “Handbook of bolts and bolted joints” worked as an external consultant for Security Locknut Co. in a project similar to this one. When he tried to control the stress on the bolt he tried to use ultrasound (equipment and technicians from Raimond Engineering), but he found a difficulty that did not allow him to accomplish the test. The reason was that the frog check rails are not parallel, presenting a certain angle in the bolt. Therefore, when the torque is applied a bending stress appears and creates a non-homogenous stress distribution in the bolt. This irregular and unpredictable stress distribution makes the ultrasonic signals propagate following an unexpected pattern, confusing the control unit. Finally, Bickford had to abandon the in-field tests, using only the ultrasonic technique for measuring the nut factor under controlled circumstances in a laboratory. This phenomenon may not present interference with other instruments, but has not been field-tested.
Appalachian Transportation Institute Section 3.3 - Page 32

3.3 –Technical review
3.3.2 Brief review about Crossings
Frogs Since the subject of the study is the crossing frog, this technical review introduction would be incomplete if a brief review about turnouts had not been conducted. Obviously, to have a better comprehension of the problem, the existing bibliography did not only cover frogs but also train dynamics in general. The different manufacturers of the railroad tracks were also reviewed, and the American branch of the world leading frog manufacturer was contacted (www.nordtrack.com) and asked to submit information about recent advances and products.
Although the literature review about train dynamics was very intense, it was not included in this report because the field is too broad as to give a general vision in a brief summary. Checking the bibliography, only two books on turnouts were found. A German engineer wrote the first one more than fifty years ago, and the second one was written by a Spanish author Dr. Díaz de Villegas. The book “Desvios”, today represents the most important reference about turnout. It covers a broad range of opics such as analysis and design of every single element of the turnout, historical evolution, manufacturing, material, studies, etc. [See ref.29]
The book includes software for the analysis of turnouts. A screenshot is shown below. (Fig.3.3.-22).
Calculating turnouts.
Figure 3.3-22.Picture from the turnout analysis software from the “Desvíos” book.
Appalachian Transportation Institute Section 3.3 - Page 33
3.5.- Analysis of the joint
SECTION 3.4: Tests on the Track
3.4.1 Needs and purpose of the tests
Prior to the first visit to the railroad track for the purpose of viewing the subject crossovers and studying the actual maintenance procedure employed by CSX personnel, the CSX Engineering Department submitted a maintenance procedure document for the crossing frog and placement of the subject bolts (see Appendix A). This document stated the following requirements; 2200 lb/ft (+/- 200) lubricated torque.
Based on the specified torque, the bolt was being tensioned up to 60% of its yield stress point. Therefore, the bleeding problem would seem to be caused by the failure of the existing lock washer assembly and a solution would be to install an effective locking device or other design modifications. After studying the mechanics of the locking devices currently available on the market, some devices were chosen (Nord-Lock washers, Spiralock and SecurityLock nuts, adhesives…) for additional study. Then, to determine the effectiveness of each mechanism in a field environment, it became necessary to make comparative tests.
The initial approach was to try to simulate a frogs working conditions in a laboratory environment, subjecting a fabricated frog heel to similar loads as registered on the actual railroad track (extreme high amplitude and low frequency loads). Due to size and complex variability (wheel, tie, and ballast properties) of loadings experienced on the track, a laboratory simulation of the bolted connection and loading conditions was cost prohibitive (for this project).
The second possibility taken into account was to conduct an accelerated
test of just a bolt set, not including the frog. As mentioned in the section 3.1, there is only one standardized test for passing joints, MIL-STD-1312-7 A. The complete document with a descriptive narrative is attached on Appendix III. This test consists of subjecting a testing piece with bolts in place to low amplitude and high frequency vibrations. The test consists of vibrating the bolts that were placed in the piece as shown in figure 3.4-1, so the bolts will receive two transversal impacts on each cycle. Due to limited availability of sample locking devices suited to the size of the testing apparatus used, testing was not performed on several of the chosen locking devices. The results shown are typical of the test performed on the tested devices.
Appalachian Transportation Institute Page 34

3.5.- Analysis of the joint
Fig.3.4. -1. Typical results from the MIL-STD-1312-7 A test (left) and a diagram of a typical shaker assembly (right).
This test is ideal for comparing the effectiveness of the anti-vibration devices. Again, due to the size of the apparatus required to test the subject bolt assemblies, the cost was prohibitive (for this project).
To test the devices, actual application of these devices on active railroad
track crossing frogs was performed. Performance of the different locking devices will be monitored over the life of the project and different or additional devices may be tested as the project evolves.
Appalachian Transportation Institute Page 35

3.5.- Analysis of the joint
3.4.2.- Present Maintenance Procedure
Before any field application of the chosen locking devices took place, inspection / observation of a CSX maintenance crew was arranged. These observations were fundamental, because it was discovered that the in-field operations differed from the initial conditions submitted by CSX (2,200 lb ft, lubricated)
Fig. 3.4.-2 Pictures from the maintenance operations (22/02/01). At the left a Matweld impact wrench in action (note that one nut has been installed with lubricant). At the right, a
worker using a manual wrench.
After several additional observations of CSX maintenance operations were
conducted on the crossings, some remarks were made:
• Lubricant: The nut was being tightened without applying lubricant either on the thread or under the nut head. This fact means that a great amount of the energy, which is applied by the tool by means of the torque is dissipated as friction instead of elongating the bolt in order to produce clamping force. The importance of using a proper lubricant will be shown in section 3.5, where the mechanical analysis of the joint is presented.
• Tools: CSX workers were observed to have three possible tools to tighten
the joint. The most powerful one can be seen on the previous figure; a hydraulic impact wrench from the Matweld Company, which is commonly called the Matweld. A contractor under contract with MU-ATI proved a hydraulic torque wrench with a calibrated gage on the wrench; it was found
Appalachian Transportation Institute Page 36

3.5.- Analysis of the joint
that the maximum torque the Matweld tool was able to deliver under the actual working conditions was about 850 lb ft, which is far below from the 2,200 lb ft recommended by the CXS Engineering Department. Because the bolts are being installed without applying any lubricant, the values of the bolt elongation correspond to a stress value below 10% of the yield point, which is insignificant compared to the pointsones recommended to avoid self-loosing (above 60%). The second choice is an impact wrench powered by a small gasoline powered engine. This wrench has a maximum torque of 1,000 ft-lb, which makes it obviously inadequate for this application due to its lack of power. The third possibility is the use of a manual wrench, as can be seen on the figure above. This tool seems to be used on only a limited basis, due to the physical nature of its use. It was only used once during the observations made by MU-ATI and was just used to loosen the nut so an impact socket could be applied. With the manual wrench the nut is just tightened until it is “tight.” This method varies greatly due to the strength and effort of individual workers, so a consistent torque can not be measured. Hence, the result could be that no clamping force is being applied.
As it has been mentioned previously, the maintenance operations that are
conducted on the frogs are not limited to tightening and/or replacing the bolts/nuts. Other operations needed are the replacement of the manganese steel insert and welding of the frog point of the crossing. Furthermore, it was noticed that a high percentage of frogs were broken at the common crossing, close to the heel end of the frog, which can be seen in figure 5.3.3. This crack produces a discontinuity on the railroad track that make the load transmitted to the bolts higher than the normal expected loading.
3.4.3. - First test on the railroad track
Objectives
The objectives of the first test were focused on the separation of the two problems that were being faced: the self-loosing of the nut and the breakage of the bolt. Once the nut begins self-loosing, it quickly looses any clamp load that it had and undesired displacements and clearances appear, thus subjecting the bolts to greater dynamic loads, which accelerates the fatigue failure. Hence, it is impossible to face the fatigue problem without solving the bleeding issue.
When talking about joints in general, the main cause of bleeding is the application of a torque corresponding to stress values on the bolt shank under 60% of its yield stress. This longitudinal stress is responsible, by means of friction on
Appalachian Transportation Institute Page 37

3.5.- Analysis of the joint
the threads, of blocking the loosening tendencies of the nut when the joint works under static and dynamical forces. When the bolt is exposed to high-levels of vibration, the friction that was high enough to avoid rotation of the nut under static loads is not enough under the dynamic condition and the nut begins to self-loosen. In the cases when the vibration is so severe that the self-loosing cannot be avoided even if the torque is increased, it becomes necessary to use a locking device specifically designed for this type of environment.
Hence, the first test objective became: to determine, in a qualitative way, if the application of torque alone (specified to be 2,200 ft/lbs) would be enough to avoid loosening under any level of loads or if some anti-vibration device would be needed to help the joint to keep its initial torque value.
With the aim of separating both failure causes (torque default or vibrations), CSX authorized an in-field test on four frogs. The first step after studying the latest torque tools was to contact the Torcup Co. Torcup is a high quality precision bolting equipment manufacturer and services company (www.torcup.com). Torcup makes almost everything related to bolted joints: consulting, equipment sales and leasing, ultrasonic measurement, etc. By using the equipment and services offered by Torcup, MU-ATI could accurately achieve the specified torque and also determine the torque of in-place bolted assemblies. When the torque was achieved, any subsequent self-loosening would be attributed to the dynamic vibrations in the railroad track environment. The advantages and disadvantages of the hydraulic wrenches were explained on section 3.3.1.1.
Of the available locking washers, only the Nord-Lock washers were tested
because they were found to be robust (made of hardened alloy steel), easy to install and relatively inexpensive locking devices. These devices were explained in section 3.3.1.2. In addition, a lubricant was used during the assembly process.
Introducing only the elements referenced above, at the end of the test, the
efficiency of the tools, the importance of the lubricant and the effectiveness of the Grower washer and the Nordlock washer will be compared.
On the other hand, it was considered relevant to keep a record of the temperature in the region during the test period, because it was indicated to MU-ATI that temperature fluctuation was a factor in determining the frequency of required maintenance. This parameter would be useful to determine the importance of temperature changes in case any bolt failed. This kind of breakage failure is common in the winter months.
Appalachian Transportation Institute Page 38
3.5.- Analysis of the joint
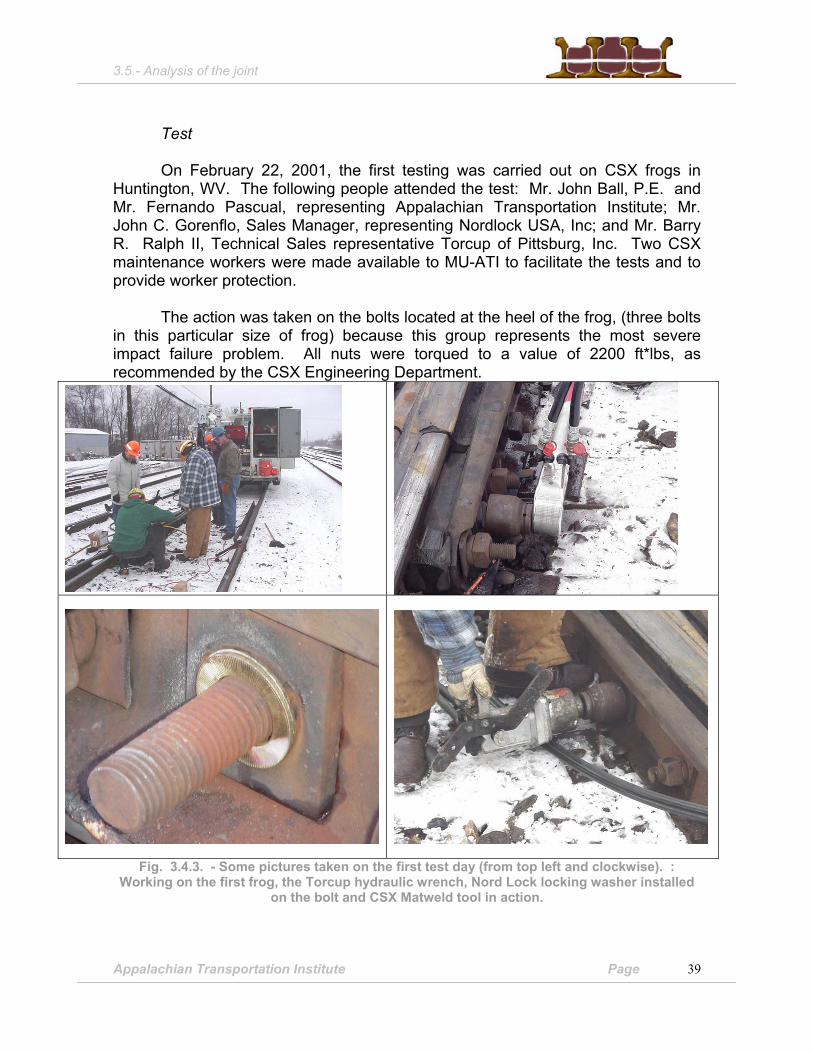
Test
On February 22, 2001, the first testing was carried out on CSX frogs in Huntington, WV. The following people attended the test: Mr. John Ball, P.E. and Mr. Fernando Pascual, representing Appalachian Transportation Institute; Mr. John C. Gorenflo, Sales Manager, representing Nordlock USA, Inc; and Mr. Barry R. Ralph II, Technical Sales representative Torcup of Pittsburg, Inc. Two CSX maintenance workers were made available to MU-ATI to facilitate the tests and to provide worker protection.
The action was taken on the bolts located at the heel of the frog, (three bolts in this particular size of frog) because this group represents the most severe impact failure problem. All nuts were torqued to a value of 2200 ft*lbs, as recommended by the CSX Engineering Department.
Fig. 3.4.3. - Some pictures taken on the first test day (from top left and clockwise). : Working on the first frog, the Torcup hydraulic wrench, Nord Lock locking washer installed
on the bolt and CSX Matweld tool in action.
Appalachian Transportation Institute Page 39

3.5.- Analysis of the joint
Noted below are the torque-device combinations used during the test. The bolt numeration begins on the heel end of each frog, therefore, the closest bolt to the heel end is bolt #1, the next one is bolt #2, and then bolt #3.
In case that bleeding behavior had appeared subsequent to test,
comparisons would have been made: first The Matweld tool delivered around 850 ft*lb versus 2200 ft*lb, which was the figure calculated by CSX. Then, we would be able to compare the performance of the Grower washer currently used versus the anti vibration Nord Lock washer when the joint has under-elevated torques. Finally we wanted to evaluate the efficiency of the Nord Lock washer when low torques are used (Matweld tool).
• Frog#1: DK CABIN MP MILEPOST 502.4 WEST END #9 X0 Bolt #1: Nordlock Washer, lubricant, Matweld wrench Bolt #2 Nordlock Washer, lubricant, Torcup wrench (2200 ft⋅lb) Bolt #3 Grower washer, original, no lubricant, Torcup wrench (2200 ft*lb)
• Frog#2: DK CABIN MP MILEPOST 502.4 EAST END #9 Bolt #1 Nordlock Washer, lubricant, Matweld wrench Bolt #2 Nordlock Washer, lubricant, Matweld wrench Bolt #3 Nordlock Washer, lubricant, Matweld wrench
• Frog#3: DK CABIN MP MILEPOST 502.4 WEST END #3 Bolt #1 Grower washer, no lubricant, Matweld wrench Bolt #2 Grower washer, lubricant, Torcup wrench (2200 ft⋅lb) Bolt #3 Grower washer, lubricant, Torcup wrench (2200 ft⋅lb)
• Frog#4: DK CABIN MP MILEPOST 502.4 WEST END #1 Bolt #1 Nordlock Washer, lubricant, Torcup wrench (2200 ft lb) Bolt #2 Nordlock Washer, lubricant, Torcup wrench (2200 ft lb) Bolt #3 Nordlock Washer, lubricant, Torcup wrench (only to 1800 ft*b,
because the threads were damaged while installing the frog bolt)
In five instances, a joint was tightened first using the Matweld wrench to its maximum power (this wrench doesn’t have a torque indicator, it works to its maximum potential, depending upon the hydraulic power supplied to the unit), and then was further tightened to 2200 ft*lb using the hydraulic Torcup wrench.
Appalachian Transportation Institute Page 40

3.5.- Analysis of the joint
Therefore, in this instance, it was evident that the CSX Matweld wrench did not deliver a torque above 850 ft*lb under those conditions.
The optimum experimental control would have been to measure the loss of the tensile stress in the bolt as a function of the load cycles. But due to the difficulty and expense of tracking this magnitude (strain gauges and ultrasonic devices are difficult and expensive to implement), the angle turned by the nut in its loosening movement was chosen as the measurable magnitude. In this way, some angle-cycles curves could be obtained and compared for each torque-washer combination. To control the nut angle variation indelible marks where made on the nuts with special weatherproof paint, therefore any rotation could be noticed and measured.
Since the day of the test, the bolts were monitored periodically. During the first week the bolts were inspected daily. Not noticing any rotation during the second week, the inspections were changed to twice a week for the first month and once in a week since then.
In Figure 3.4.4 some representative pictures from those taken for the self-loosing control are shown. It is not considered relevant to show every picture taken from the bolts since there was no rotation.
It is important to remark that on the third week of March (around day 35) CSX had to replace the insert in the #2 frog. This maintenance operation meant all of the bolts were removed to open the frog, replace the insert and close it again , thus tightening the bolts. Obviously, CSX tightened the bolts following the usual procedure; without lubricant, using a Grower washer and a Matweld wrench. The test was over on that frog, however, all of the nuts were marked again with weatherproof paint to determine if self-loosing on that frog is evident and to make general observations and comparisons about the longevity of the bolted assembly.
Appalachian Transportation Institute Page 41

3.5.- Analysis of the joint
Fig 3.4.4. Control pictures for the rotation angle of the #2 bolt on the first frog. From top left (clockwise). Installation day, day # 5, day # 8, day# 18, day # 34.
Appalachian Transportation Institute Page 42
3.5.- Analysis of the joint
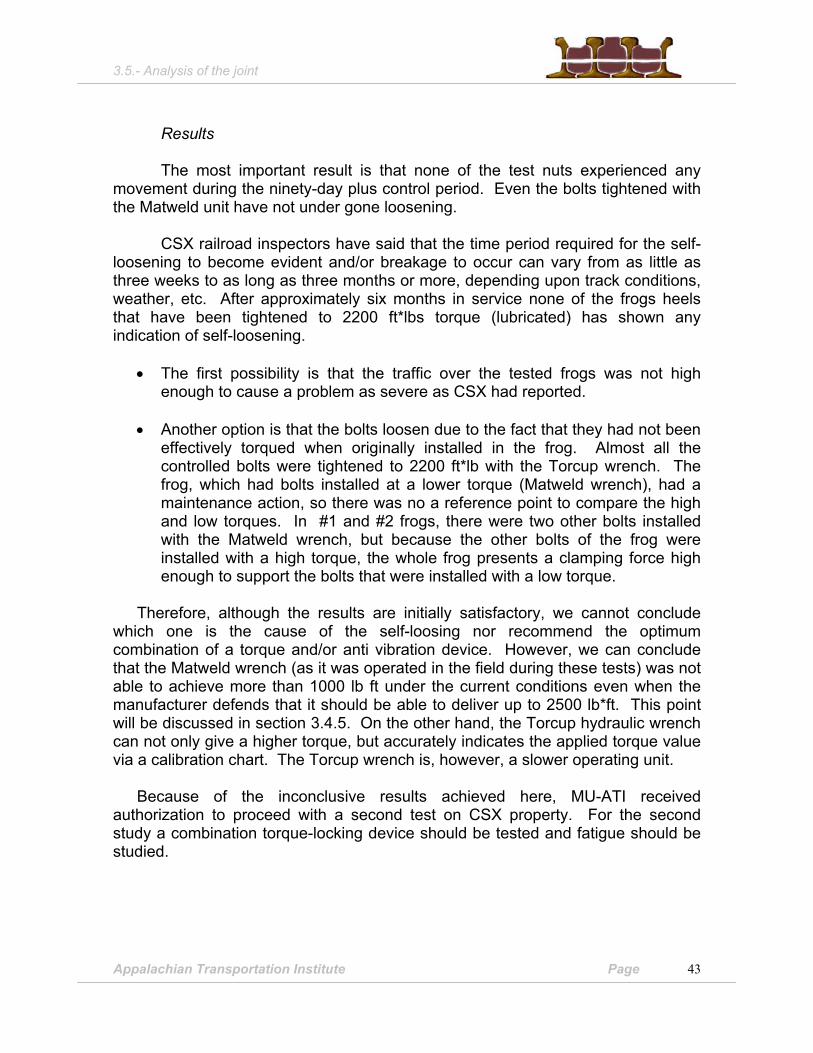
Results The most important result is that none of the test nuts experienced any movement during the ninety-day plus control period. Even the bolts tightened with the Matweld unit have not under gone loosening. CSX railroad inspectors have said that the time period required for the self-loosening to become evident and/or breakage to occur can vary from as little as three weeks to as long as three months or more, depending upon track conditions, weather, etc. After approximately six months in service none of the frogs heels that have been tightened to 2200 ft*lbs torque (lubricated) has shown any indication of self-loosening.
• The first possibility is that the traffic over the tested frogs was not high enough to cause a problem as severe as CSX had reported.
• Another option is that the bolts loosen due to the fact that they had not been
effectively torqued when originally installed in the frog. Almost all the controlled bolts were tightened to 2200 ft*lb with the Torcup wrench. The frog, which had bolts installed at a lower torque (Matweld wrench), had a maintenance action, so there was no a reference point to compare the high and low torques. In #1 and #2 frogs, there were two other bolts installed with the Matweld wrench, but because the other bolts of the frog were installed with a high torque, the whole frog presents a clamping force high enough to support the bolts that were installed with a low torque.
Therefore, although the results are initially satisfactory, we cannot conclude
which one is the cause of the self-loosing nor recommend the optimum combination of a torque and/or anti vibration device. However, we can conclude that the Matweld wrench (as it was operated in the field during these tests) was not able to achieve more than 1000 lb ft under the current conditions even when the manufacturer defends that it should be able to deliver up to 2500 lb*ft. This point will be discussed in section 3.4.5. On the other hand, the Torcup hydraulic wrench can not only give a higher torque, but accurately indicates the applied torque value via a calibration chart. The Torcup wrench is, however, a slower operating unit.
Because of the inconclusive results achieved here, MU-ATI received authorization to proceed with a second test on CSX property. For the second study a combination torque-locking device should be tested and fatigue should be studied.
Appalachian Transportation Institute Page 43

3.5.- Analysis of the joint
3.4.4 Second Test Objectives This second test is the natural progression of the first; both tests present the same nature with the difference being that the frogs in this second test carry much greater traffic loads.
Besides the traffic, some differences between the first and the second tests can be enumerated: The Matweld wrench was not used (all the bolts were tighten with the Torcup wrench); a chemical locking adhesive was tested; In addition to the Nord Lock and the Grower washer, a flat washer was used. Furthermore, due to the heavy traffic, the frogs were a larger size (#16, see Appendix II) having four bolts on the heel end instead of three as on the crossings of the first test.
Besides the three tested crossings, a fourth frog was intended to be used as reference of the performance of the CSX procedure. However, due to the heavy traffic of these lines, continuous interruptions occurred, keeping the fourth from being tightened by standard CSX procedures. Therefore the frog was made a reference point using the existing conditions as a baseline, without the baseline maintenance being performed.
Again, the torque used on this test was 2200 ft lb, which is recommended by the CSX Engineering Department. On the three frogs, the same device pattern was followed to avoid the possibility that the results were modified by a lower traffic on any of the crossings tested. Following the same pattern on each frog, it can be assured that each device receives the same percentage of load on each frog, independently of the traffic on the line.
A purpose of this test was also to investigate the fatigue problem. The bolts already installed were supposed to be replaced with new ones before applying the new torque; in this way, if any replaced bolt under the conditions of this new test presented a fatigue failure, clear conclusions could be drawn. Otherwise, any failure of an old bolt after the new conditions could be due to cracks formed prior to the start of this test.
Appalachian Transportation Institute Page 44

3.5.- Analysis of the joint
Test
The second test took place on the railroad track located on the Big Sandy Subdivision in Ashland, KY, April 12th, 2001. Mr. John Ball, P.E. and Mr. Fernando Pascual attended for the Appalachian Transportation Institute. Mr. Barry R. Ralph II, who performed the bolting services, represented Torcup. Mr. John Fortune, a CSX track inspector and two track maintenance workers represented CSX. Mr. Paul Tucker, a Chief Engineer with CSX also was also on-site for the test.
Fig. 3.4.-5.Pictures from the second railroad test. From top left (clockwise): Lubrication installed on the threads and under the head of the nut; two frog bolts clearly showing signs of impact and fatigue
cracks; Torcup wrench installing nut with the Nordlock washer installed; John Ball (ATI) and a CSX worker looking at the Torcup wrench in action.
Below, the installation pattern is detailed, specifying position, torque, anti
vibration device and if the bolt was replaced or reused. The bolt is numbered as in the first test. (ascending order from the heel end.)
Appalachian Transportation Institute Page 45

3.5.- Analysis of the joint
Loctite lubricant was used just like in the first test. Lubricant was placed on the four bolts, on the threads of the nut and on the contacting face of the nut. The wrench used was the Torcup hydraulic unit calibrated to 2200 ft*lbs of torque.
• Frog #1: East End #7 on #2 track
All the bolts from this frog are the ones that were there previously (No replacements, all reused). Lubricant was used on all of the installed nuts.
Bolt #1 Loctite product and Grower washer Bolt #2 Grower washer Bolt #3 Flat washer Bolt #4 Nordlock washer
• Frog #2: East End #7 on #1 track
Bolt #1 Loctite and Grower washer (existing bolt reused) Bolt #2 Grower washer (existing bolt reused) Bolt #3 Flat washer (existing bolt reused) Bolt #4 Nordlock washer
• Frog #3: East End #5 on #2 track
All the bolts on this frog were replaced with new ones
Bolt #1 Loctite and Grower washer Bolt #2 Grower washer Bolt #3 Flat washer Bolt #4 Nordlock washer
In this test, the maximum torque the Matweld tool could supply was checked
again. 923 ft lbs torque was the maximum torque generated by this particular unit.
Notice that when some bolts from the #2 and #3 frogs were removed, some fatigue cracks were observed, matching with the intersection of the shank with the web of the rail. These cracks mean that a great percentage of the load generated by the train when passing over the frog is transmitted to the bolt by the rail, without distributing the stress to the insert or to the common crossing and to the rest of the components of the track. The detection of this fact was extremely important to
Appalachian Transportation Institute Page 46
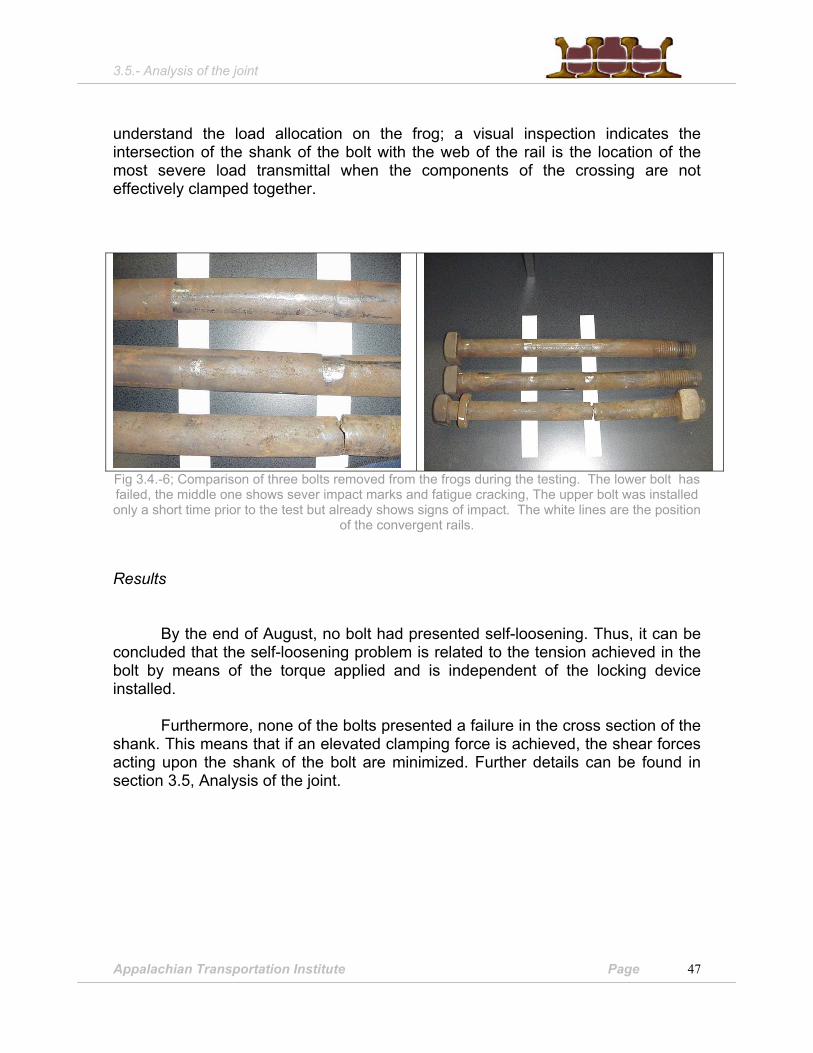
3.5.- Analysis of the joint
understand the load allocation on the frog; a visual inspection indicates the intersection of the shank of the bolt with the web of the rail is the location of the most severe load transmittal when the components of the crossing are not effectively clamped together.
Fig 3.4.-6; Comparison of three bolts removed from the frogs during the testing. The lower bolt has failed, the middle one shows sever impact marks and fatigue cracking, The upper bolt was installed only a short time prior to the test but already shows signs of impact. The white lines are the position
of the convergent rails. Results
By the end of August, no bolt had presented self-loosening. Thus, it can be concluded that the self-loosening problem is related to the tension achieved in the bolt by means of the torque applied and is independent of the locking device installed. Furthermore, none of the bolts presented a failure in the cross section of the shank. This means that if an elevated clamping force is achieved, the shear forces acting upon the shank of the bolt are minimized. Further details can be found in section 3.5, Analysis of the joint.
Appalachian Transportation Institute Page 47

3.5.- Analysis of the joint
Picture 3.4-6: Broken bolt. The failure occurred under the head of the bolt. The ductile part of the fracture (the silver and non-rusted area) represents no more than 10% of the total area.
The crack advanced slowly during 6 months (observe the beach marks). During the last visual inspection a broken bolt was detected in the frog #3 (East End #5 on #2 track). The bolt had been installed April 22nd using a hydraulic torque wrench, lubricant and a Nord-Lock washer as its locking device. As it can be seen in the figure above, the failure occurred under the head of the bolt. The fracture presents fatigue-corrosion morphology, (beach marks can be easy observed in the pictures), being approximately 90% of the surface brittle and only 10% ductile. The crack started in the chamfer, probably in a manufacturing imperfection, advanced slowly during six months (106 load-unload cycles estimated*). The crack decreased the effective area of the cross section until the area was not enough to withstand the load and then the ductile failure happened. Hence, the question is: Since the tension in the shank when the bolt was installed was equivalent to approximately 90% of its yield strength, how could the area decrease up to 90% before the failure occurred? Obviously, the bolt had to be released from its original tension sometime before the crack appeared. A logical explanation lays on the fact that the bolts were not tightening as a group of fasteners, taking in count that when one bolt is tightened, the tension in rest of the bolts of the joint is changed. This phenomenon is known as elastic interaction or bolt cross talk and the way to avoid it is to use sequential tightening techniques. Thus, once the first bolt was installed, the tightening of the second bolt produced a contraction of the surfaces of the joint, releasing the first one of its original tension. As a result, the tension in the bolt was equivalent to 90% of the yab
A
ield only until the installation of the rest of the bolts. The final tension was pproximately equivalent to xxx% of the yield**. The bolt did not fail in the shank * Estimated annual traffic over that frog: 56M tons. Since each car transports 125 tons, and has 4 axles, the
monthly impacts in the crossing are 150,000, which makes 900,000 for a six-months period.
ecause the clamping force due to the other bolts was still high enough. Then, Tons 411 impactsCarAxles
TonsCar
monthsyear
year000,150149333
1*
125*
12*10*56 6 ≅=
ppalachian Transportation Institute Page 48

3.5.- Analysis of the joint
fatigue should appear in the threads or under the head of the bolt, the weakest sections. A remarkable observation is that although tension in the bolt was lower than the tension required to prevent self-loosening, no bleeding was observed during the six-months control period, and even after the bolt failed, the nut remained there. This is evidence of the excellent performance of the locking device used, the Nord-lock washer, that prevented the bolts from loosening even after the bolt failed and the only tension in the bolt was due to the deformed shape of the bolt. Such a low tension obviously led to a severe vibration level in that particular bolt.
A
** This estimation is based in the assumption that 10% of the original area of the bolt Force necessary to break the bolt when only 10% of the area works:
lbpsiFF
nalareaoftheorigiultimate 38.273,22
102375.1*
*000,15010/1
2
=
=⇒=π
σ
If this force were acting on the whole area, the tension achieved would be:
psiAF 000,15
4848.138.273,22
===σ
This represents 11% of the yield.(Yield stress: 130,000 psi). The bolt was released ofapproximately 80% of the initial tension. This is equivalent to a contraction in the bolt of 0.06 in (seefigure 3.7-1) This contraction is due to the incremental shrinkage of the joint when the rest of the boltsare tightened.
ppalachian Transportation Institute Page 49

3.5.- Analysis of the joint
3.4.5 Third Test Objectives The objective of the third test was to test the effectiveness of two of the locking nuts previously referenced in this report. The Security Locknut and the Spiralock were the only locking nuts designated for testing, because they are both commercially available. The other nuts are presented as semi-specialized or proved to be difficult to obtain, and were not considered for testing at this time. Note: in the event that the test of the locking nuts results in a locking assembly that is superior to the other tested devices, then it would be advantageous to more thoroughly research and test these locking nuts. Due to a request from CSX that of the ability of the Matweld and Stanley units to achieve the required torque of 2200 ft*lbs is clarified, CSX arranged track time for this test as well as a demonstration of track related equipment from the various suppliers.
This test was designed to evaluate only locking nuts, specifically the Security locknut and the Spiralock nut. Like the second test, the frogs were #16’s which have four bolts on the heel end. This test was conducted on CSX track just west of the Barboursville, WV bridge shop.
The test called for placing four new bolts in service in the heel of each tested frog and to install four identical locknuts on these bolts. This is because a purpose of this test was also to investigate the fatigue problem and if any failure of an old bolt occurred after the new conditions were introduced, the failure could be due to cracks formed prior to the start of this test.
Lubricant and the Torcup hydraulic torque wrench were specified for use in the test.
Spiralock was used in the first test. Following Spiralock’s installation
instructions, the nuts were installed to 2,400 ft lbs torque, lubricated. Because of the hot weather on that day the bolts were difficult to remove and were not replaced in the frog, only the existing bolts were utilized.
Due to the equipment demonstration and vendor meeting running longer
than planned, the track time afforded for the tests ran out prior to the end of only one test. Thus, only the Spiralock nut was installed in the track environment.
Appalachian Transportation Institute Page 50
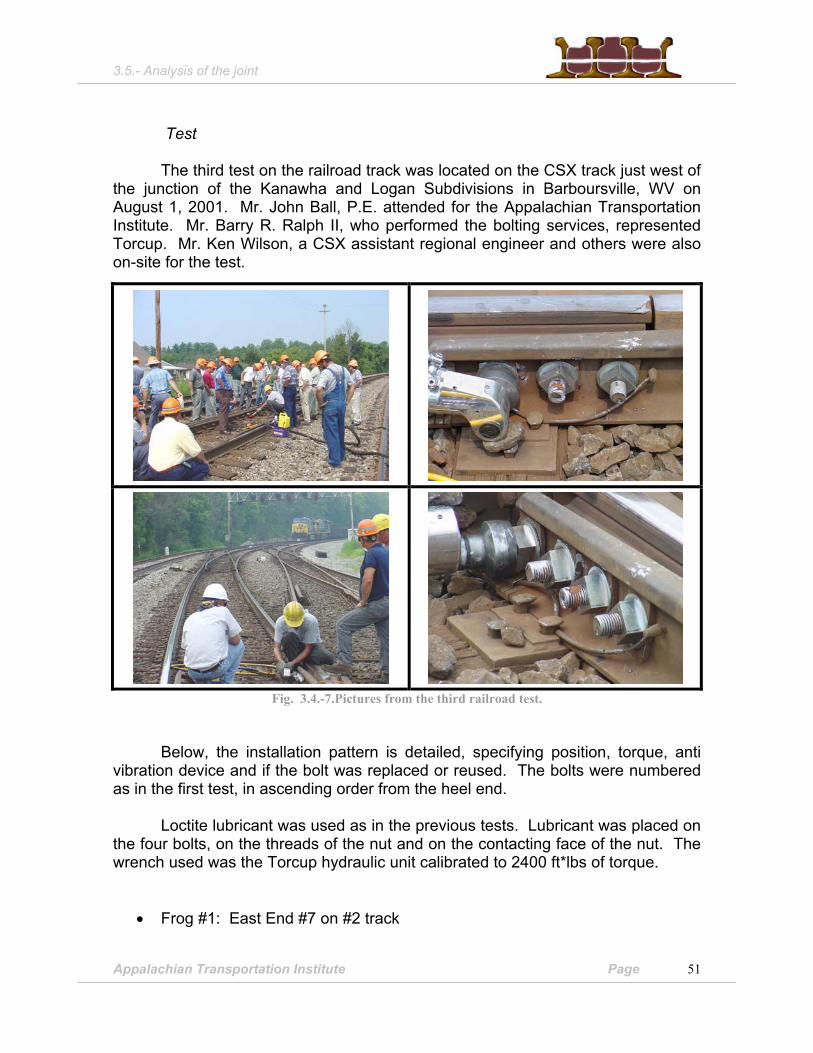
3.5.- Analysis of the joint
Test
The third test on the railroad track was located on the CSX track just west of the junction of the Kanawha and Logan Subdivisions in Barboursville, WV on August 1, 2001. Mr. John Ball, P.E. attended for the Appalachian Transportation Institute. Mr. Barry R. Ralph II, who performed the bolting services, represented Torcup. Mr. Ken Wilson, a CSX assistant regional engineer and others were also on-site for the test.
Fig. 3.4.-7.Pictures from the third railroad test.
Below, the installation pattern is detailed, specifying position, torque, anti vibration device and if the bolt was replaced or reused. The bolts were numbered as in the first test, in ascending order from the heel end.
Loctite lubricant was used as in the previous tests. Lubricant was placed on the four bolts, on the threads of the nut and on the contacting face of the nut. The wrench used was the Torcup hydraulic unit calibrated to 2400 ft*lbs of torque.
• Frog #1: East End #7 on #2 track
Appalachian Transportation Institute Page 51

3.5.- Analysis of the joint
All the bolts from this frog are the ones that were there previously (No
replacements, all reused). Lubricant was used on all of the installed nuts.
Bolt #1 Loctite lubricant and Spiralock Nut Bolt #2 Loctite lubricant and Spiralock Nut Bolt #3 Loctite lubricant and Spiralock Nut Bolt #4 Loctite lubricant and Spiralock Nut
Fig 3.4.-8; Picture of the frog by Augost,22. No self-loosening was observed.
Results Results of the third test are valid for the time period between August 1, 2001 and October 10, 2001 (71 days), the most recent time that the bolted connection was inspected. The most important result is that none of the test nuts have experienced any movement during the 71-day control period. No bolts have experienced fatigue failure. The scenario that makes this locking nut different from others is that it does not require a washer to be placed in conjunction with the nut, thus eliminating an inventory item.
Appalachian Transportation Institute Page 52

3.5.- Analysis of the joint
SECTION 3.5. - Analysis of the joint 3.5.1 Need and approach
The bleeding problem depends mostly upon one variable: torque. Therefore, it is necessary to conduct a detailed analysis to study it. Most of the variables for the analysis of the joint are accessible and the necessary data are standardized (geometry, resistance) or they can be obtained from experimental data (nut factor, fatigue coefficients, etc.)
The frog joint has many more variables than a standard bolted joint. This
makes a more complex analysis necessary. One complexity is that the forces that bolts receive when the train passes over the frog are not easy to quantify; consequently an approximate load model was developed. A second complexity is that the bolt fatigue analysis became necessary, because the bolts usually fail in the shank, instead of in the threaded area as expected. This implies that the fatigue factors obtained from charts are not valid but only indicative given that they refer to fatigue failure on the threads.
Consequently, considering the bleeding problem solved, a load model is
required to predict the fatigue failure. The bolts will be calculated as a beam subjected to a tri-axial load scenario: tension due to the torque, vertical shear (static and dynamic) and thermal stress.
By the use of this model, a torque value can be recommended. Once the
joint is considered tightened to the torque value calculated, it is time to repeat the analysis for the threaded area. The software for bolted joints developed by Boltscience (Fastener, Torque, Boltcalc and Torksense) was used to carry out this part of the analysis. This software considers the threaded area as the weakest zone, performing static, dynamic and fatigue analysis at this location.
Appalachian Transportation Institute Page 53

3.5.- Analysis of the joint
3.5.1.- Analytical Calculus Load model
The bolted joint that is the subject of our study has two possible failure modes:
breakage and self-loosening. Self-loosening makes the clamping force decrease drastically. The loads that appear over the rail (C) because of the train passing over the frog are fully transmitted to the bolt in the rail-bolt intersection, creating an alternant force that produces the fatigue failure of the bolt. To avoid self-loosening, the torque must be taken to approximately 75% of the bolts yield point. In this section we’ll assume that the self-loosening problem is solved and we’ll study the loads that the bolt receives as a function of the torque.
A: Check rail B: Insert C: Rail D: Common crossing
Figure 3.5. -1: Diagram of the transversal section of a frog in its most problematic section. The joint analysis software Boltscience has been used as a reference tool
for analyzing the thread strength.
Figure 3.5. -2: Bolts removed from active service. Impact abrasions are clearly visible at the intersection with the rail. Close inspection of the bolts reveals fatigue cracks that lead to
breakage (right photo, bottom bolt)
Appalachian Transportation Institute Page 54

3.5.- Analysis of the joint
It can be seen in Figure 3.5-2 that the bolts indicate the presence of load passing marks located at the intersection with the rail, showing clearly the bolt weakest section. In this section cracks appear which indicates fatigue breakage. Next, the torque, thermal and train passing loads are analyzed. The percentage of the trainload received by the bolt depends on the clamping force. Higher torque values lead to better stress distribution among the different parts forming the frog.
Static analysis: Stresses due to the initial torque and thermal loads Stresses due to the initial torque Tension. Following the nut factor method, the tension induced in the shank when the torque is applied is
• T: Torque applied (in lb⋅in) ADK
TASDK T s ⋅⋅=⇒⋅⋅⋅⋅= S
• K : Nut factor. The value used was proposed by J.Bickford in a report for Security Locknut when trying to determine the optimal torque for the same size of bolts. By the use of this coefficient, a very important hypothesis is introduced. The only way to eliminate this source of error would be to estimate the relationship between torque applied and elongation induced by means of an ultrasonic device under controlled conditions.
• D: Diameter of the bolt, 1 3/8’’ • S: Tension induced in the shank (130,000 psi to yield, 150,000 to breakage
for Grade 8, 1 3/8’’ bolts) • A: Effective area of the bolt. (Standardized) 1.115 in2
Torsion: Some torsion is induced when tightening a bolt. Torsion effectively decreases the maximum tensile stress before failure occurs. This percentage was estimated at 11% with the fastener program when lubricant is used. This is equivalent to an 11% increase in the tension calculated with the nut factor formula. Bending: Some bending stress appears due to the angle of the clamped surfaces. The importance of those stresses is quite low, but the bending induces a non-homogeneous stress distribution in the bolt that makes it difficult to use an ultrasonic device to measure the elongation of the bolt when the torque is applied. [J. Bickford conclusion]
Appalachian Transportation Institute Page 55

3.5.- Analysis of the joint
020000400006000080000
100000120000140000160000
0 1000 2000 3000
Torque
stre
ss (p
si)
0
200
400
600
800
1000
1200
Stre
ss (M
Pa)
static (psi) Static (Mpa)
00,5
11,5
22,5
33,5
200 700 1200 1700 2200 2700
Torque applied
Secu
rity
fact
or
0 50 100 150
%yield in the bolt
For the prevention of self-loosening, 75% of the yield strength of the bolt should be achieved by means of the initial torque.
Thermal loads and brittle-ductile behavior
Due to its own volume, some thermal stresses are induced in the bolts because of the variation of the temperature: Transversal loads: the cross-section of the bolt expands and contracts with change in temperature. However, since the material surrounding the bolt is steel too (rail and insert), the thermal displacements are the same; therefore no transversal stress in induced in the bolt. Longitudinal loads: As explained above, since all of the clamped elements are made of steel (the thermal coefficient is very similar for all of them), no thermal stresses will be induced. Demonstrating a worst-case scenario, if only the bolt would expand or contract, to determine the magnitude of the maximum forces:
σθ = E·α·∆θ
αbolt = 6,5·10-6 in / in·ºF Ebolt= 30·106 lbf / in2 Installation temp: 45ºF ; Max.Temp:104ºF ; Min.Temp: 0ºF .
∆θ1 = 45-0 = 45ºF (Contraction) ∆θ2 = 104-45 = 59ºF (Expansion)
Then:
θ∆⋅α⋅=σθ E
1= 8.775 lbf/in2 (Thermal compression in the bolt)
Appalachian Transportation Institute Page 56

3.5.- Analysis of the joint
θ∆⋅α⋅=σθ E2
= 11.505 lbf/in2 (Thermal tension in the bolt)
It can be observed that these values would be very low, too low for being the cause of the failure of the bolts.
Furthermore, several broken frogs have been detected. In those cases, the bolts receive the load due to the thermal displacement of the rail.
θ∆⋅α⋅=σθ E = 12.375 lbf / in2 with:
+ ∆θ=Installation temp - Min. Temp.annual =80ºF-5ºF = 75ºF + αrail =6,6·10-6 in / in·ºF
+ Erail= 25·106 lbf / in2
The shear stress induced temperature changes in the bolt is quite low. Since CSX has reported that most of the failures are found in winter, other failure mechanisms have to be involved. The possibility of a ductile-brittle transition in the steel for the winter range of temperatures has been studied. Bolts are SAE grade 8, therefore they meet the following specifications according to the standard SAE J429: Material and Treatment
"Medium carbon alloy steel; the product is quenched and tempered" Mechanical Requirements
Proof Load stress: 120 kpsi Min. Yield Strength: 130 kpsi Min. Tensile Strength: 150 kpsi Product Hardness Rockwell: Surface Max: 30N58.6 Core min: C33 Core max: C39
Appalachian Transportation Institute Page 57

3.5.- Analysis of the joint
However, the standard highlights that these properties are compiled at room temperature (68°F) and are valid within a finite range, depending on the grade. Furthermore, the standard emphasizes that other properties such as fatigue behavior, corrosion resistance, and so on are beyond the scope of the standard. Hence, the possibility of a brittle behavior due to the nature of the steel had to be studied. The bolt supplier in this case, United Steel and Fasteners Inc, delivered an inspection report that is attached as Appendix VI; the company also reported that the commercial designation of steel is AISI 1045. The data showed in the table below was extracted from that quality control report.
Mechanical Properties
Yield strengh
psi
Tensile strength
psi Elongation
% Reduction of area %
Core hardness
Rockwell C
150,466 167,185 16 49.4 37
Chemical Composition C % Si % Mn % P % S %
0.40 0.22 0.81 0.010 0.014
After examining some specific literature, no range of the Ductile-Brittle Transition Temperature (DBTT) was found for this steel once it has been quenched and tempered. All references recommended that Charpy impact tests have to be conducted to accurately determine DBTT. For this family of steels, DBTT before quenching and tempering is within the 86-122 ° F range. However, quenching and tempering processes improve the toughness, decreasing the DBTT. Steels with 0.4-0.5 % of carbon, quenched and tempered, have an elevated toughness at room temperature depending on the quenching temperature as can be observed on the following table.
Appalachian Transportation Institute Page 58

3.5.- Analysis of the joint
Impact toughness as a function of tempering temperature of hardened, low-alloy, medium-
carbon steels. Source: Handbook of Metals
As an indication, AISI 4140 steel quenched and tempered has a BDTT of -212 ° F. This steel has a similar content in carbon and its hardness is also similar to that reported by United Steel and Fasteners Inc. Although the AISI 4140 is a low-alloy steel, it serves as a reference for estimating the DBTT of the bolts.
Phosphorus and sulfur contents are low enough to keep the BDTT low. Manganese content increases the BDTT in tempered-quenched structures, but in this case, the content seems to be low enough.
Consequently, the brittle-ductile transition does not seem to be a problem. However, if failure occurs even after applying the proper torque, some Charpy impact tests should be conducted in order to accurately determine the BDTT.
Hydrogen embrittlement is another possible failure mechanism. According to Professor Richard Sisson, from the Worcester Polytechnic Institute, “failure due to hydrogen embrittlement is a surprising event that occurs even when the fastener meets all the specs and test required”. However, the main hydrogen source in fasteners is electroplating. Actually, a bolt that is made of high strength steel that has been quenched and tempered, cold worked after heat treatment, electroplated and installed to a high torque, would be a bolt very susceptible of failure. Nevertheless, since the bolts are not electroplated, they can only be exposed to hydrogen during service. This would accelerate corrosion and a crack would grow faster, accelerating but not initiating the failure.
Appalachian Transportation Institute Page 59

3.5.- Analysis of the joint
Dynamic analysis: Stress due to the train circulation
As a train passes over a frog, it induces longitudinal, transversal and lateral stresses in the frog. In this model, the effects of the longitudinal and lateral forces are not calculated, because the main responsibility of failure of the bolts is the vertical load transmitted from the wheels to the shank of the bolts. The nature of lateral forces is different in crossings and in straight rail, due to the special geometry of the crossings, but the vertical behavior can be studied following the same theories. The force made by the wheel on the rail when rolling on the frog is the same, and the stresses induced in the web of the rail depends on the clamping force in the joint. When the clamping force is low, the rail of the crossing receives a high percentage of the load of the wheel. As the clamping force increases, the percentage of the load transmitted to the other pieces of the frog increases.
The ASCE-AREMA committee accepted in 1917 as a standard the model proposed by Timoshenko-Zimmermann for calculating the stresses (static-dynamic) induced to the rail due to the rolling of the train. For the geometry, materials and boundary conditions of this problem, the maximum value of the stress induced in the rail following this theory is 74,622 psi. This value would be valid for straight rail; in the frog the shear load transmitted to the bolts depends on the clamping force. As pictured in figure 3.5, when only a low clamping force is achieved, most of the load is transmitted to the bolts through the web of the rail.
Subsequently, a second hypothesis should be introduced in the model for determining the percentage of the load transformed as shear in the bolts. A linear relationship between torque applied and load transmitted is supposed: for a 850 lb⋅ft torque, 95% of the 74,622 psi is transmitted to the bolts, and only 20% of such a load is converted in shear when a 2,200 lb⋅ft torque is applied.
Dynamic+Static stresses vs. Torque applied
020000400006000080000
100000120000140000160000
500 700 900 1100 1300 1500 1700 1900 2100 2300 2500
Torque (ft lb)
Stre
ss(p
si)
Dynamic+staticStatic (torque)
0.5
1
1.5
2
2.5
500 1000 1500 2000 2500Torque applied (lb ft)
Secu
rity
fact
or
0 25 50 75 100 125
%yield in the bolt (torque)
Finally, the total tension due to the torque (static) and the shear produced by
the train (dynamic & static) can be computed using the Von Misses criteria: sheartensiontotal 22 σσσ +=
Appalachian Transportation Institute Page 60

3.5.- Analysis of the joint
Appalachian Transportation Institute Page 61
Fatigue analysis: Goodman (Sodeberg) diagram
0
0,05
0,1
0,15
0,2
0,25
0 0,2 0,4 0,6 0,8 1 1,2mean stress (GPa)
alte
rnat
e st
ress
(Gpa
)
Security line(Sodeberg)
Load Lines
800 lb ft
900 lb ft
1500 lb ft
1300 lb ft
1000 lb ft
1700 lb ft1900 lb ft 2100 lb ft
2300 lb ft
Fatigue analysis The traffic over the frogs installed in the area with the heaviest traffic
corresponds to 56 millions gross tons per year (CSX data, 1997). If this traffic would be evenly distributed over the year, those frogs would carry the passing of approximately 12 trains of 100 cars each day, which represents approximately around 5,000 load cycles per day. Obviously, a fatigue analysis should be conducted.
A classical graphic method will be used. First, the limit line is drawn in a
σmean vs. σalternate graphic. For this limit is chosen the linear approach of Sodeberg; the line proposed starts in the point (Sut,0) where Sut is the maximum tensile stress of the steel and ends in the point (Se/k,0), where Se represents the endurance limit of the steel. The value of Se is easily estimated using an experimental correlation for Sut; the value of K, the fatigue factor, is tabulated for 13/8’’ grade 8 bolts, ranging from 1 to 4 depending on the manufacturing process, but these coefficient are tabulated for use them if the crack would appear in the threads. Since the initial crack appears in the shank, a value of K=2 is estimated.
Then, for each torque, a load line is represented. Each load line starts in
the value of the minimum stress (σmin,0), and ends in the point given by the pair (σmean,σalternate). The load lines ending under the limit line can be considered secure load lines. The security factor is given by the distance between the end of the load line and the limit line, divided by the length of the load line.

3.5.- Analysis of the joint
Discussion of the results
As explained in section 3.3. (Technical Review) to prevent bolts from
loosening at least 65% of the yield point need to be achieved. If 70% is considered as a safe percentage, then the torque has to be higher than 1,500 ft*lb (nut factor = 0.13).
In the graphic below, it can be observed that at 1,500 ft*lb torque a dynamic
+static security factor of 1.45(green line), a static safety factor of 1.55 (pink line) and a fatigue safety factor of 2.2 (black line) are realized.
A higher torque leads to lower static and static + dynamic safety factors, but
higher fatigue safety factor. Because in this model several hypotheses were introduced, the minimum security factor should be considered at least 3, and anything less than 2.5 should not be considered.
On the other hand, to try to get very accurate results is difficult because we
cannot exactly determinate the tension induced in the bolt by the torque (the nut factor method would be very inaccurate unless the nut factor were determined in the lab; the proper wrench should be used too, in order to assure the minimum error).
0
0.5
1
1.5
2
2.5
3
3.5
500 1000 1500 2000 2500
Torque (lb ft)
secu
rity
fact
or
25 45 65 85 105 125%Yield
Static
Fatigue
Dynamic+Static
Appalachian Transportation Institute Page 62

3.5.- Analysis of the joint
Study of the Fracture
Fig.3.5. -8 Fractures bolt (two views of each flange) In the pictures, the fracture surface as a result of the bolt fatigue failure can be observed (two pictures of each surface for a better understanding). The characteristic morphology of the fatigue breakages can be seen, with a part of the surface showing a completely brittle breakage (completely smooth surface) and the other part showing a completely ductile breakage (notice how on this part the steel was plastically deformed before the final failure). In the picture notice a beach mark pattern on the brittle part of the fracture, which is a characteristic of those
Appalachian Transportation Institute Page 63

3.5.- Analysis of the joint
fracture mechanisms in which the crack advances in a gradual way, as an example of the corrosion-fatigue that this case shows. To understand the load model observe the top picture in figure 3.5-8 where approximately 50% of the ductile breakage is shown. Therefore, when only 50% of the bolt’s transversal area is working, the breakage stress is reached. So, when the bolt breaks it is supporting a force.
ASF
AFS *=⇒= F = 1034 N / mm2 * 0.5 * 1219 mm2= 378133.8 N
Bolt transversal area: 1.89 in2 = 1219 mm2 Breakage limit: 150 000 psi = 1034 N / mm2
This is the same force that withstands the bolt over its whole section before
the crack decreases the working area. Therefore dividing force by the whole area will obtain the amount of stress that the bolt stood before cracking.
2
2 /5171219
8.378133 mmNmm
NAFS === =52.75 kg /mm2
This is the stress that the broken bolt supported, which is very similar to the total load (static + dynamic), calculated for a bolt that is tightened to 850 lb*ft without lubricant, which is how the bolt from the picture was installed under the normal CSX maintenance procedure.
σmax= σdin+est =59.88 Kg /mm2
Conclusion Because several hypotheses were introduced in the model, the security
factors are too low to be able to recommend a 100% safe torque. Nevertheless, it seems that a torque within the 1600-2100 lb⋅ft range would minimize the maintenance costs. On the one hand, this torque assures that more than 65% of the yield is achieved, which is a necessary condition to avoid self-loosening. On the other hand, the security factors (dynamic + static and fatigue) are higher than one.
Appalachian Transportation Institute Page 64
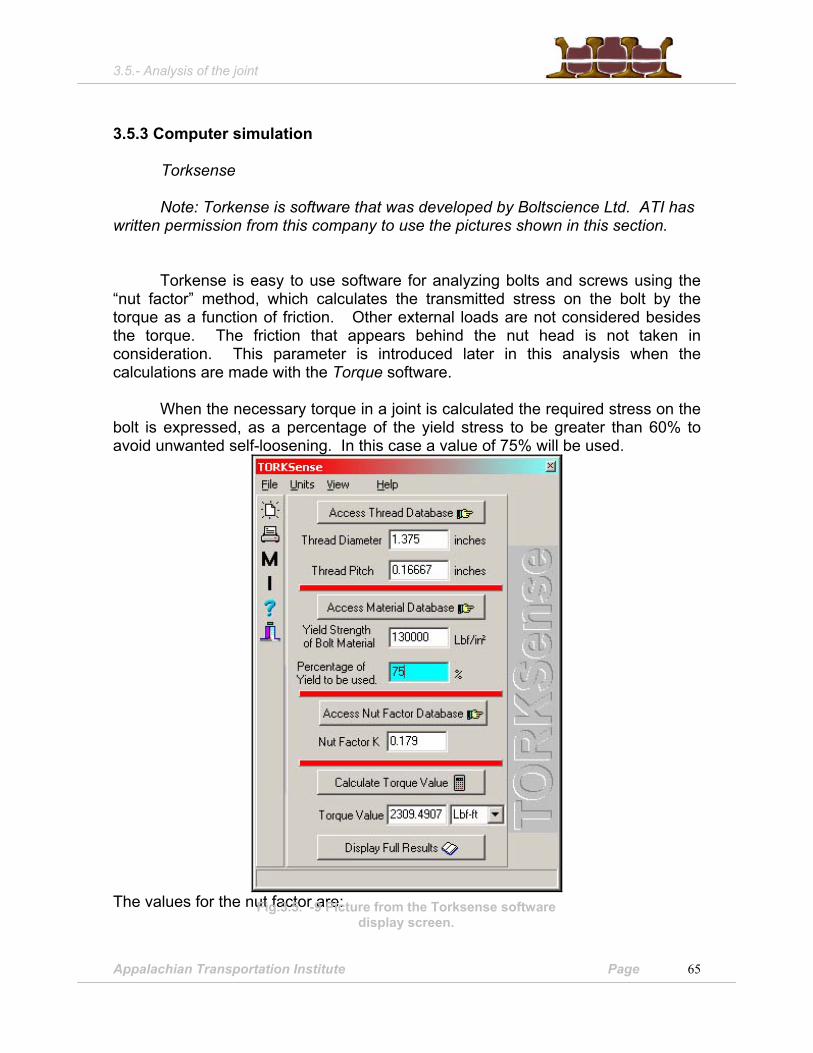
3.5.- Analysis of the joint
3.5.3 Computer simulation
Torksense
Note: Torkense is software that was developed by Boltscience Ltd. ATI has written permission from this company to use the pictures shown in this section.
Torkense is easy to use software for analyzing bolts and screws using the
“nut factor” method, which calculates the transmitted stress on the bolt by the torque as a function of friction. Other external loads are not considered besides the torque. The friction that appears behind the nut head is not taken in consideration. This parameter is introduced later in this analysis when the calculations are made with the Torque software.
When the necessary torque in a joint is calculated the required stress on the
bolt is expressed, as a percentage of the yield stress to be greater than 60% to avoid unwanted self-loosening. In this case a value of 75% will be used.
The values for the nut factor are: Fig.3.5. -9 Picture from the Torksense software
display screen.
Appalachian Transportation Institute Page 65

3.5.- Analysis of the joint
- Using lubricant on the threads and on the nut head, the proposed K factor is 0.13
- Without lubricant the greatest value of this factor is 0.21 The Torksense software contains a complete data base of nut factors as a
function of the material and the used lubricant, This program demonstrates the importance of the use of lubricant in affecting the “nut factor” (friction factor). Introducing the bolt geometry and the material, the results for the two friction
factors are: K=0,13 Ttorque= 1677.2838 Lbf-ft = 2274.0915 NmNm Fcrossing= 112600.8695 Lb ft = 500873.4395N K=0.21 Ttorque= 2709.4584 Lbf-ft = 1986.4465 Nm
Fcrossing= 112600.8695 Lbf = 3673.5325 Nm
The results of the complete analysis can be seen in Appendix V
Percentage of yield vs torque applied for different nut factors
0100020003000400050006000
asreceived
stee
Blackoxidefinish,slightlyrusty
Asreceivedsteel with
wax
Rustysteel,
exposed tooutdoors 2
weeks
Different nut factors
Torq
ue (l
b-ft)
25% of yield50% of yield75% of yield
Fig.3.5-10 Comparative graph of the torque required to reach 25%, 50% and 75% of the flow stress as a function of the friction factor on the bolts. From left to right, the friction
factors for the steel just as it’s received from the factory, with black oxide finish, as received with wax and rusty steel exposed to the outdoors for two weeks.
Appalachian Transportation Institute Page 66

3.5.- Analysis of the joint
Torque: Note: Torque is a software that was developed by Boltscience Ltd. ATI has
written permission from this company to use the pictures in this section. The Torque software analyzes the torque distribution that is applied to the bolt.
As can be seen in Figure 3.5.11 the software shows the loss due to friction under the nut head and in the threads. To make the analysis we have to introduce the geometry and materials of the joint. A complete data base of nut factors are provided in the software. The input data is shown below:
For the threads:
Black oxide steel external thread, no finish on steel internal thread, no lubricant..........................................................................................................0.12 For the contact under the nut head:
Black oxide steel nut or bolt, no oil, machined steel bearing surface………..…………………………………………………………………… 0.12
The complete results can be reviewed on Appendix V
Figure 3.5-11: Distribution of the applied torque. Red indicates the percentage of energy lost
due to the threads friction; blue indicates the energy lost under the nut head and green indicates the percentage that becomes tension in the bolt.
Fastener:
Appalachian Transportation Institute Page 67

3.5.- Analysis of the joint
Note: Fastener is software designed by Boltscience Ltd. ATI has written permission from this company to use the pictures from this section. The Fastener software analyzes the forces needed to deform the threads of a bolt or a screw as well as to break a bolt or a screw in a threaded section. To make this analysis, it is necessary to introduce the selected geometry, materials and friction factors from a database. In the case of the nut, friction between the nut head and the joint is not taken into consideration because it is not relevant for the threads analysis. However, when the geometry is introduced in the software, it needs a great amount of detailed information about the threads. The bolt dimensions were measured with special micrometers for threads at Fastener Level 1 Co. as mentioned on section 3.2.
Figure 3.5-12. Introductory menu from FASTENER software.
Appalachian Transportation Institute Page 68

3.5.- Analysis of the joint
The induced stresses from the torque on the threads, including torsion and traction, give a security factor of 1.363 for the threads sockets (bolt) and 1.703 for the internally threaded nut. These results are independent from the torque because they are analyzed as a function of the mechanical properties.
The complete results can be viewed in Appendix V. Boltcalc: Note: Boltcalc software was developed by Boltscience Ltd. ATI has written
permission from this company to use the pictures from this section. The Boltcalc software determines if the bolt will resist the operating forces
and the loads due to assembly. When the data is input five steps have to be followed:
1. - Introduction of external forces. - External axial force: In this case there are no external axial forces, so the
value is equal to zero. - Needed clamping force to support the shear load: In this case, when the
number of planes of the joint is introduced, the friction factor among the joined parts and the applied share force value, the software analyzes the necessary clamping force to support the shared load.
Plane Number = 3 Friction factor = 0.2 A share force = 30 000 Minimum value of the alternating force = 125 000 lb
When the friction factor is introduced, an error is made, because it is not taken into consideration that among the different joined parts there are transmissions not only due to friction, but also as a result of the design that allows the transmission among them. To decrease this effect, a shear force under the real value, that according to the load model is 60 000 lb, will be used.
- Minimal necessary clamping force: This force is zero because no minimal force is needed
Appalachian Transportation Institute Page 69

3.5.- Analysis of the joint
Figure 3.5.-13: Picture from the Forces Introductory menu from Boltcalc software.
The software above requires the following input data
1. Bolt geometry 2. Mechanical bolt properties 3. Joint details 4. Details about the torque
The software output can be summarized by means of the safety factors, as it is
shown next: Necessary clamping force: n = 1.4 Safety factor for fatigue: n = 2.73 Resistance to the material failing under the bolt head and the nut: n=1 .39 Therefore, following the analysis results, the bolt will support the external loads.
However, it has to be considered that some uncertainty factors have been introduced when the importance of the shear force was considered. Knowing this information and looking at the low safety factors obtained, it can be concluded that the bolt will be subjected to stresses very near the yield point; therefore a joint failure is possible.
Appalachian Transportation Institute Page 70

Section 3.6 Economic Analysis
SECTION 3.6.- Economical analysis for the possible replacement of a frog. 3.6.1. - Objectives
During the eight months in which the frog problem has been studied, the magnitude of the problem has been observed. It constitutes a chronic maintenance issue, which implies a daily inspection of each frog as the only way to detect and solve the defects that could risk the safety of the traffic on those tracks. As it was exposed in section 3.1, the maintenance associated with the frogs concern not only to the bolts, but other issues such as the condition of the manganese steel insert and the condition of the frog point by welding. In addition, excessive displacement in the rail, as a result of loose or missing (broken) bolts, leads to a higher frequency of repair / replacement of spikes, tie plates and ballast tamping.
Hence, the high maintenance costs can be allocated in part to the archaic design of the crossings and, consequently a review of the state of the art on crossings was required. After studying the available technology, it was detected that new designs of crossings avoid most of the maintenance costs by means of the use of new materials and manufacturing techniques, although the purchase cost is higher. Thus, it was considered positive to prepare a replace analysis. In this section a brief study of replacement analysis models is performed and a method for gathering the present maintenance costs associated to frogs the by means of a Maintenance, Repair and Operation form is proposed. In order to clarify the modus operandi, an example using an estimation of the cost is attached. ATI does emphasize the replacement analysis is not being solved in this document, and no final recommendation can be extracted from this section. The unique purpose is to consider the replacement possibility and propose a methodology to conduct it. Furthermore, ATI understands that such an inversion would involve not only raise financial issues but also many other factors. That is why any final decision cannot be made based only on the simple economical analysis proposed.
Appalachian Transportation Institute Page 71

Section 3.6 Economic Analysis
3.6.2.. Review of literature Managers can make decisions regarding the replacement of assets through
different methods. Several studies and models have been made about this topic, some of which are summarized below.
ECON System (Equipment Replacement Analysis System)
ECON is a program written in BASIC and runs in IBM and compatible computers. The ECON analysis considers the most important economic factors such as value of money, operating costs, depreciation, and salvage value.
The Replacement analysis consists of two parts. First, there is the economic
life analysis module, which determines the economic life of the challengers. Inputs are the parameters such as original cost, service life, interest rate, inflation rate, operating costs, etc. Then the program computes the annual profits for every service life. The output is the economic life of the challenger for the maximized annual profits.
Second, there is the replacement life analysis module, which determines the most profitable moment to change the defender for the challenger. The inputs are the same parameters as well as the annual profits of the challenger (based on the economic life analysis of the first part) and the remaining service life of the defender (current salvage and book values). Then the values of each year of the remaining service must be entered. The output is the replacement life associated with the maximum present worth of the defender.
Actual Cost Analysis
This is an alternative analysis for the traditional future cost analysis, and it
only requires a monthly equipment record and a replacement analysis worksheet. First the monthly equipment record gathers information on the expenses
incurred by using a table, that describes each month. The output of this table is the total (operating and maintenance) costs for each month. Secondly, the replacement analysis worksheet must be done with the information gathered from the first table. The outputs of the table are the Average Annual Operating and Maintenance Costs and the Average Annual Capital Costs for each month. The sum of these two give the Average Annual Total Costs for each year. Finally, the equipment becomes a candidate for replacement as soon as the Average Annual Total Costs stop decreasing and start increasing.
Appalachian Transportation Institute Page 72

Section 3.6 Economic Analysis
Discounted cash flow techniques
Using these techniques a company can plan ahead for the replacement cycle that minimizes the operating costs of a particular asset. This method takes into account the capital costs and the maintenance costs. The objective is to minimize the cost cycle function: AC= Actual Cost
AC = Vn * CRFrn
Where:
Vn = n-r) (1 - 1Sn -Rn C
++
Sub index n in the formulas indicates that the magnitude corresponds to the year n.
V = cost of cycle n = number of years C = capital cost R = annual operating cost S = residual value r = discount rate CRFrn = Capital recovery factor
(reciprocal of annuity factor)
Fig. 3.6.-1
Finally the optimal replacement cycle is the cycle with the minimum total annual cost. For this method, a number of facts must be certain, such as the relevant discount rate and the projected cash outgoings for capital and maintenance.
Appalachian Transportation Institute Page 73

Section 3.6 Economic Analysis
3.6.3.- Replacement analysis proposed
Introduction
A replacement analysis deals with the idea of finding the optimal “economic life” for an asset or to determine when to replace an asset. In this particular case, the frogs that are presently installed represent the defenders. Most of them have not yet reached the end of their “physical life”, but due to the high maintenance costs associated when these frogs, a replacement analysis is recommended. The challenger is a new model of frog, which, due to its advanced design, needs only a minimal level of maintenance.
THE CHALLENGER THE DEFENDER
Picture from
www.nortrak.com Picture courtesy of CSX
In the next section, a method for obtaining the maintenance costs associated
with the defender is proposed. Then, a replacement analysis on actual cost basis is presented using the data acquired via the Maintenance, Repair and Operation (MRO) sheet proposed. Finally, estimating the maintenance costs, a replacement analysis is conducted as a clarifying example.
Appalachian Transportation Institute Page 74

Section 3.6 Economic Analysis
Costs survey: the MRO sheet
The main data needed to conduct any cost analysis is a detailed description of all the costs associated with the asset. In this particular case there is a lack of available data. In order to acquire the data, a MRO sheet has been designed and can be seen on the next page. The responsible worker should fill out this document any time a maintenance operation is conducted.
A time frame of six months is considered appropriate to get some initial results. From the analysis of the MRO sheet, the following costs will be identified for each particular frog:
• Labor costs: visual inspection, retightening of the bolts, replacement of the bolts,
welding labor, replacement of the manganese piece, other labors • Direct material costs: bolts, nuts and washers replaced, manganese insert
replaced, welding costs • Overhead costs: any other cost
More information can be deducted from this page: Since each frog is associated
with certain traffic, depending on the class of track where it is installed, we will be able to relate the maintenance costs to the traffic. This would be very useful in order to calculate the depreciation as a function of the millions of tons that run over each frog per year (units-of-production method). On the other hand, some mechanical data can be deducted from the diagram where the responsible worker has to mark the position of the bolts replaced or retightened.
Appalachian Transportation Institute Page 75

Section 3.6 Economic Analysis
Appalachian Transportation Institute Page 76
Maintenance, Replacement & Operation Record sheet
1. Worker Name: Worker Name:
2. Frog#: 3. Date:
4. Starting Time: 5. Ending Time: 6. Just visual inspection (No labor conducted)………………………………(mark here) 7. Was any bolt retightened? …………………………………....(Mark here) 8. How many bolts were retightened? (Write the number within the box)…………… 9. Please, mark in the picture on the right the position of the bolts retightened 10. How many bolts were replaced? (Write the number within the box)…………... 11. How many nuts were replaced? (Write the number within the box.…………… 12. How many washers were replaced? (Write the number within the box)………. 13. Please, mark in the picture on the right the position of the bolts, washers and nuts replaced. 14. Was welding labor conducted?………………………………………. 15. Was the manganese steel insert replaced?……………………….….. 16. Other maintenance or observation:
YES NO
YES NO
YES NO

Section 3.6 Economic Analysis
Replacement analysis on actual cost basis
For this case, the replacement analysis on actual cost basis will be used because it is the most suitable for the available data. At this point, with the data gathered from the MRO sheet, we should be able to fill in the table below, which basically contains all the incurred monthly costs.
Frog Ref: ____________ Date purchased:________________ Description: ____________ Price purchased________________
A B C D E F G H I J K
Month Labor cost
due to inspection
Labor cost
due to retight
en
Labor cost due to replacement
Labor cost due
to welding
Other labor costs
Part cost: Bolts
Part cost: Wash
ers
Part cost: Nuts
Lubricant Other costs
Total operatin
g and mainten
ance
April May June July Aug. Sept
The semester cost is obtained by adding all the values of column P. This value, together with the semester depreciation cost, is needed to calculate the total cost of the period. The total annual cost will be compared to the new frog, which will be calculated by adding the depreciation with the maintenance costs. In this case, the new model of frogs presents an initial cost, which is much higher, but the maintenance costs reduce drastically.
It is important to emphasize that in the last table the depreciation is distributed in a linear way, and it could be calculated as a function of the number of tons.
Appalachian Transportation Institute Page 77

Section 3.6 Economic Analysis
3.6.4. - Application of simple replacement analysis to the frog case.
Maintenance cost estimation: In the Huntington area, CSXT maintains 79 frogs in the main line and 250 in the yards. Since the principal expense is the main line, and the experiments are being conducted there, only these frogs will be considered.
• Labor cost due to inspection: A team of two workers inspect each frog,
approximately every three weeks approximately. The inspection time is estimated on 10 minutes, because when inspectors only make a visual inspection, they take time to move from one frog to the next. Each worker is paid approximately $20 per hour.
The annual cost is: 79 frogs x 26 times inspected x 0.17 hours (=10 minutes) per time x two workers x $20 per worker per hour……………..$13,976 • Labor cost due to retightening: Each time the two workers detect a bolt to be
just retightened they spend 10 minutes per frog. Around one third of the times that the frog is inspected, one bolt has to be retightened. The cost associated to the equipment used is not being considered, because as explained above, it represents a sunk cost.
79 frogs x 26 times inspected x 1/3 x 0.17 hours (=10minutes) per time x two workers x $20 per worker and per hour……………………………….$4,655 • Labor cost due to replacement: When the nut, the bolt or the washer are
broken, the maintenance operation is more complicate and takes longer, especially if the bolt das to be replaced. Sometimes, inspectors even have to apply fire to the frog to heat up the joint and remove the deformed bolt. Around a quarter of the times the frog is inspected, a bolt, nut or washer is replaced, which it takes an average of 15 more minutes.
79 frogs x 26 times inspected x ¼ x 0.20 hours (+15 minutes) per time x two workers x $20 per worker and per hour……………………………….$4,108 • Hardware cost: One bolt and one nut costs approximately $13, and the spring
washer costs 63 cents. At least one nut and washer per frog is changed every 4 frogs tested. If a bolt is found broken every 10 frogs are tested. It is very difficult to predict this cost, but it represents a small part of the total maintenance costs. Only in the case when the spring washer was considered as the defender and compared with another washer, such as Nord Lock as the challenger, would the cost be more accurate.
79 frogs x 26 times inspected x (0.1 x $13) x (0.2 x $0.63)…….………$233
Appalachian Transportation Institute Page 78

Section 3.6 Economic Analysis
As mentioned before, besides the costs referent to the bolts, the costs
associated to the welding labors and replacement of steel pieces should also be considered.
• Welding: The person in charged of welding said 10 frogs are welded per month, Which uses 6 hours and two workers. The weld cost is not considered because if it is not used in the frogs it will be used somewhere else.
10 frogs per month * 12 months * 2 workers * 6 hours * $20 per hour.....................................................................................................$28,800
• The data referent to the replacement of the steel pieces is not known, but it is very low so it will not be considered.
Total cost for the 79 frogs is …………………………………………………$54,459 This would represent an annual cost per frog of ……………………..$690
Application of the replacement analysis in base of the costs estimated above.
By means of an example, the previously cited method will be explained. Some factors such as the price of money, inflation, annual tons per crossing, etc will not be considered.
• Maintenance cost of keeping the existing crossing for one additional year:
The price of each Railbound Manganese frog (RBM frog) is $13,000, and its life is 10 years. The recovery value is 0. The capital cost (C/C), considering linear depreciation is:
C/C= $13,000 / 10 years=$1,300 per year and crossing.
The maintenance costs, if a frog is maintained for one more year, plus the
estimated cost (above) for one frog of $690 would be: Total cost =C capital + C maintenance = $1,300 + $690 = $1,990 (1)
Appalachian Transportation Institute Page 79
Section 3.6 Economic Analysis
Estimating that the price of a modern frog is $30,000, that it would have a 15-
year service life, and the maintenance costs would be a tenth of those of the old frog:
C/C = $30,000 / 15 = $2,000 Maintenance cost = $690 / 10 = $69 Total cost = C/C + C maintenance = $2,000 + $69 = $2,069 (2) In this case, as (2) is bigger than (1), the cost of maintaining the frog one
more year is less than that of installing a new one.
Appalachian Transportation Institute Page 80

3.7.- Results
SECTION 3.7.- Results Originally the problem was described as breakage and/or self-loosening of
the joints clamping the different parts of a frog. Hence, the first step was to separate both phenomena. Since fatigue is frequently initiated by loosening, isolation of the latter represented the primary aim. Joints can easily loosen if at least 60-70 % of the yield strength of the bolt is not achieved during the assembly process. Even when the initial clamping force is achieved, severe vibration levels can overwhelm friction in the threads and start the self-loosening. Therefore, loosening due to insufficient torque must be considered prior to facing the vibration question. It can be concluded that an insufficient elongation (tension) of the bolts during assembly is the main cause of loosening in this particular case. It was demonstrated that under the current circumstances, the impact wrenches utilized are not achieving the torque required to result in a sufficient bolt tension to prevent self-loosening. An accurate wrench capable of supplying a torque up to 3,000 ft*lb with high repeatability and some type of torque meter is considered necessary. Furthermore, the use of an appropriate lubricant, like the grease tested, is recommended as well as the protection of the bolts from external elements before installation. The bolts should be tightened as a group of bolts, trying to avoid that the elongation of any particular bolt would release any other bolt of the crossing from its original tension. Additionally, training for at least one worker is suggested because it would improve the efficiency of the existing maintenance procedure. By means of the actions recommended above, the achievement of the torque needed to achieve sufficient bolt tension would be assured. If further self-loosening problems appeared, then the installation of some locking device other than the spring washer currently installed would become necessary. Among the different mechanisms tested, the most efficient yet inexpensive demonstrated to be the Nord-Lock washer. If required, this device could be installed together with an adhesive, because the washer would not start its locking function until the adhesive failed , thus allowing certain rotation: By means of this parallel configuration, the service life of the joint would be increased. Once the self-loosening has been controlled, it is time to face the fatigue problem. Bolts usually break near the mid section of the shank, where it intersects with the web of the rail, instead of failing at their weakest section, the threads. Such observable facts lead to the preparation and resolution of a load model for studying the influence of the clamping force (torque) on the forces (shear) transmitted to the bolt. Although several hypotheses were introduced, the calculations revealed that
Appalachian Transportation Institute Page 81

3.7.- Results
0
500
1000
1500
2000
2500
3000
3500
0 50000 100000 150000 200000 Tension (psi)
Torq
ue A
CHIE
VED
(lb*ft
)
No Lubricated K=0.21
Lubricated K=0.13
Elongation(in)0.022 0.043 0.066 0.086
when torque is increased, static and dynamic safety factors for the mid section decrease and fatigue safety factor increases. Since achieving a minimum of 70% of the yield strength is a requirement for preventing self-loosening, a torque as high as possible should be applied to avoid fatigue failure in the middle section of the shank. Although at those elevated torque values dynamic loads can make the bolts fail in the cross section of the shank. Therefore, the optimum torque for avoiding breakage in the middle of the shank would be the maximum to put the bolt to its limit for withstanding the dynamic forces, which would assure the maximum fatigue coefficient factor and consequently the longest service life. However, the high tension required to avoid failure in the shank, can accelerate the fatigue mechanisms in the weakest parts, now the threads and the section under the head of the bolt. Summarizing, the minimum tension achieved should be higher that 70% of the yield point to avoid self-loosening due to vibrations, as high as possible to avoid failure in the middle section, and lower than 100% of the yield point to minimize the fatigue failure in the threads and/or under the head of the bolt.
25% 75%50% 100%% of the yield strength
Figure 3.7-1. Chart for the bolts studiedrelating the torque ACHIEVED(depends on the assemblyprocess) and the tensiontransmitted to the bolt(depends on the friction in thethreads). The nut factors (K) usedwere experimentally obtained[see ref.25].
Notice again that the tension achieved depends drastically on the assembly
method. In Figure 3.7-1, it can be observed that one of the variables affecting the tension achieved is the lubrication in the threads and under the head of the nut. Furthermore, the torque achieved depends on the efficiency of the tool used and on the tightening sequence of the group of bolts. The achievement of the tension required in one bolt can decrease the tension in the contiguous one. In the chart , it can be seen that a compression of the joint as low as 1/50 ‘’ due to the tightening of one bolt could release up to 25% of the tension in the next. Thus, the bolts should be tightened in two steps: first, all of them up to 75% of the final torque required
Appalachian Transportation Institute Page 82

3.7.- Results
should be tightened. Then, the other 25% remaining should be applied, starting with the bolts at the extremes of the joint and then continuing with the bolts in the center.
In-field tests demonstrated that when using an efficient assembly method, (lubrication, hydraulic torque wrench with control by pressure measurement) the problem of loosening is eliminated, independently of the locking device installed. No bolts presented loosening. Around 85-90% of the yield point was used in the tests (2,200 ft*lb under those lub and tool conditions), and this value has demonstrated to be effective for preventing from breakage. Only one bolt failed due to fatigue; the rupture occurred under the head of the bolt. Observing the fracture it can be concluded that the bolt was released from its original tension due to a bad tightening sequence leading to a six-month period in which such a bolt was subjected to millions of low amplitude impacts that made it fail in its weakest part. Since the other three bolts remained tightened, the shear forces in the middle part of the broken one were not relevant. If further fatigue failures under the head of the bolts occur even when the correct assembly procedure is used, the chamfer between the head and the shank should be rounded to enhance fatigue performance.
Another factor affecting the torque-preload relationship is the fact that joint surfaces are non-parallel in this case. This phenomenon could be decreased by using spherical washers.
In addition, since CSX reported that failure due to breakage is more severe during the winter months, the possibility of a ductile-brittle transition of the bolts was studied. The chemical composition and the manufacturing process were checked. Although the brittle-ductile transition temperature (BDTT) could be only obtained by means of conducting some Charpy impact tests, the BDTT expected for the bolts is lower than the winter minimum temperature
Finally, and although the problem initially reported by CSX did not include any other request but the bleeding/fracture issue, a simple economic study was conducted. In view of the fact that the maintenance associated with the frogs concern not only to the bolts but further issues with the frog itself and the track where it lies, thus making these crossings a chronic maintenance concern, other designs of frogs were studied. After noticing that modern designs offer better performance at a higher price, it was considered positive to prepare a replacement analysis. With such purpose, a Maintenance, Operation and Replacement (MRO) sheet was prepared; by means of the MRO sheet, costs during a six-month period could be gathered. In base of these costs, a simple methodology is proposed to help managers to make the decision of a possible replacement of one frog.
Appalachian Transportation Institute Page 83

REFERENCES
REFERENCES:
1. - Bolted Joints References
2. - Railway Dynamics References
3. - Replacement Analysis References
Appalachian Transportation Institute References - Page 84

REFERENCES
1. - Bolted joints references
1. Bickford, J.: "An Introduction To The Design And Behavior Of Bolted Joints" 2nd ed., Ed. Marcel Dekker Inc., 1995.
2. Blake, A.: "Design Of Mechanical Joints", Ed. Marcel Dekker Inc., 1985.
3. Bickford, J. / Nassar, S.: "Handbook of Bolts and Bolted Joints,” Ed. Marcel Dekker Inc., 1998.
4. Basava, S. / Hess, D. P.: "Bolted joint clamping force variation due to axial vibration,” Journal of Sound and Vibration, Feb. 1998, Vol. 210, 2nd 2, pp. 255-265.
5. Zadoks, R. I. / Yu, X.: "An investigation of the self-loosening behavior of bolts under transverse vibration,” Journal of Sound and Vibration, Nov. 1997, Vol.208, 2nd 2, pp. 189-209.
6. Goodier, J. N. / Sweeney, R.J.: "Loosening by vibration of threaded fasteners,” Mechanical Engineering, 1945, 2nd 67, pp. 798-802.
7. Sauer, J. A. / Lennon, D. C. / Lynn, E. K.: "Bolts-How to prevent their loosening,” Mechanical Design, 1950, 2nd 22, pp. 133-139.
8. Junker, G.H.: "New criteria for self-loosening of fasteners under vibration,” SAE Paper, 1969, 2nd 69005.
9. Sakai, T.: "Investigation on bolt loosening mechanisms (Second Report),” Bulletin of the Japanese Society of Mechanical Engineers, 1978, 2nd 21, pp. 1391-1394.
10. Koga, K. / Isono, H.: "Loosening by repeated impact of threaded fasteners,” Bulletin of the Japanese Society of Mechanical Engineers, 1969, 2nd 13, pp. 140-149.
11. Koga, K. / Isono, H.: "Study of self-loosening of bolted joints taking account of characteristics of impulsive friction,” Bulletin of the Japanese Society of Mechanical Engineers, 1986, 2nd 29, pp. 1004-1012.
12. Hess, D. P.: "Vibration-induced loosening in bolted connections". New York: The American Society of Mechanical Engineers 1995 in Vibration of Non-Linear, Random and Time-Varying Systems, DE 84-1, 1165-1170.
Appalachian Transportation Institute References - Page 85

REFERENCES
13. Zadoks, R. I. / Yu, X.: "A preliminary study of self-loosening in bolted connections,” 1993 in Nonlinear Vibrations, DE 54, 79-88.. New York: The American Society of Mechanical Engineers.
14. Yu, X.: "An investigation of the self-loosening behavior of bolts under transverse vibration,” Ph. D. Dissertation, 1994, The University of New Mexico, Albuquerque.
15. Sweeney, R. J.: "How to avoid loosening of bolts and nuts,” Machine Design, June 1946, pp.139-144.
16. Haviland, G. S.: "A Logical Approach to Secure Bolting and Locking,” Loctite Corporation, Newington, CT, 1980.
17. Haviland, G. S.: "Designing with threaded fasteners,” Mechanical Engineering, 1983, 2nd 105, pp. 17-31.
18. IFI (1988): “Fastener Standards,” 6th Edition, Industrial Fasteners Institute, Cleveland, OH, Section F, pp. F1-F24
19. Hess, D. P.: "Vibration-Induced Loosening and Tightening of Threaded Fasteners" ASME 1995 Design Engineering Technical Conferences Volume 3-Part A, DE-Vol.84-1,
20. U.S. DoD (1984). Military Standard, MIL-STD-1312-7A, Fastener Test Methods-Method 7: Vibration, U.S. Department of Defense, Washington D.C.
21. Orlov, P.: “Ingeniería de diseño,” Ed. Mir, 1979 22. Shigley, J. E.: “Mechanical engineering design,” 3nd ed., Ed. McGraw-Hill, 1977.
23. Loctite: Catalogs www.loctice.com 24. BOLT SCIENCE TUTORIALS: www.boltscience.com
25. Louis G.Polydoris, Security Locknut, Inc.: “Torque and preload Tests for Grade 8
Frog bolts”. Internal report, 1996
26. Narayan Nayak, MIT; “Spiralock vibration resistance and stress distribution”. Internal report, 1978.
Appalachian Transportation Institute References - Page 86

REFERENCES
2. - Railway Dynamics References
1. GARG AND DUKKIPATI “Dynamics of Railway Vehicle System”. Academic
Press, 1984. ISBN 0-12-275950-8 2. COENRAAD ESVELD, ”Modern Railway Track,” MRT Productions, 1989, ISBN
90-800324-1-7 3. Armstrong, J. “The Railroad, What it is, what it does.” Simmons-Boardman
Books, Inc.4th edition, 1998 4. A.N. TALBOT, 1980 “Stresses in Railroad Track-The Talbot Reports.” American
Railway Engineering Association. 5. WILLIAM W.HAY, ”Railroad Engineering (Second Edition”), Ed. John Willey &
Sons 6. Sperry Rail Service. ”Rail Defect Manual”. 1999 7. AREMA, “Manual for Railway Engineering,” 2000, Ed. AREMA (CD-ROM) 8. Z. CAI, G.P. RAYMOND, 1994, “Modeling the dynamic response of railway track
to wheel/rail impact loading”; Structural Engineering and Mechanics, Vol.2, No1, 95-112.
9. ESVELD, C, SUIKER, A.S.J., “Dynamic behavior of railway track“; Rail
Engineering International Edition 1996 No.2, 10. LOPEZ PITA, “Analysis of the vertical deformability of the track with the finite
element method.”; A. Revista AIT no.15, April 1977, 11. ARBABI F., LI, F. “Effect of Nonlinear Parameters on Stresses in Railroad
Tracks”; Journal of Structural Engineering, Vol.114, No. 1, January 1988. 12. BANDEIRA, C.A., RODRIGUES, F., LIMA DE PAVIA, C.E. “A Vertical Dynamic
Train / Track Interaction Model.”; Railway Vibration and Rail Vehicle Dynamics. 13. TASSILLY, E. “Dynamic Interaction Rail/Wheel: Existent theories and
researching perspectives; “Revue Generale des Chemins de Fer, year 107.
Appalachian Transportation Institute References - Page 87

REFERENCES
14. S.P. TIMOSHENKO 1934 Theory of Elasticity. New York: McGraw-Hill 15. HALL, HOLOWENKO, LAUGHLIN, “Machine Design,” Schaum Publishing co.,
New York 16. GRASSIE S.L. , COX S.J. “The dynamic response of railway track with flexible
sleepers to high frequency vertical excitation.”; Proc Instn Mech. Engrs, vol 198D No 7
17. GRASSIE S.L., COX S.J; “The dynamic response of railway track with
unsupported sleepers.”; Proc Instn Mech. Engrs, vol 199 No D2 18. NAGAFUJI T.,. “Durability Design of Rail Fastening System”. QR of RTRI, Vol
35, No 4, Nov 1994 19. J. VAN ‘T ZAND, J. MORAAL, DELFT. “Static and Dynamic Test on Rail
Fastening Systems”; Delft University of Technology 20. ESVELD, C http://vbk.ct.tudelft.nl/railbouwkunde/. Innovations in Railway Track
21. AMY DE MAN, ESVELD C.,” DELFT Recording, Estimating and Managing the Dynamic Behavior of Railway Structures” Delft University of Technology
22. C. ESVELD, A.W.M. KOK, A.DE MAN, “DELFT Integrated numerical and
experimental research of railway track structures”; Delft University of Technology.
23. C. ESVELD, V.L. MARKINE, A.DE MAN. “A procedure for Design and
Optimization of a Railway Track Structure”; Delft University of Technology, DELFT
24. C. ESVELD, V.L. MARKINE, Delft University of Technology, DELFT. Analysis of
Longitudinal and Lateral Behavior of a CWR Track Using a Computer System Longin
25. C. ESVELD, “Slab track: A Competitive Solution” Delft University of Technology,
DELFT
Appalachian Transportation Institute References - Page 88

REFERENCES
26. García Díaz-de-Villegas, J.M., Rodriguez Bugarín, M. “Desvíos Ferroviarios”.
Ed. Ingeniería Cántabra. ISBN: 84-605-4337-4 27. G. VOHLA, http://fafner.ethz.ch . A Wheel / Rail Contact Module 28. Class Notes “Automóviles y Ferrocarriles,” 6th year of mechanical engineering
UNED (Distance Learning Spanish University). 29. Class Notes “Ferrocarriles y Tracción eléctrica,” 5th year of mechanical
engineering, Zaragoza University. 30. Class Notes “Ferrocarriles,” 6th year of mechanical engineering, Ports and
Channels. ”UPM. Losada”
Appalachian Transportation Institute References - Page 89

REFERENCES
Replacement Analysis References.
31. Hartman, Joseph ; The Engineering Economist; Norcross; 1999; A general
procedure for incorporating asset utilization decisions into replacement analysis 32. Tavakoli, Amir; Project Management Journal; Drexel Hill; Jun 1992; ECON: An
Equipment Replacement Analysis System 33. Project Management Journal; Drexel Hill; European Journal of Operational Research;
Amsterdam; May 5, 1989; European Journal of Operational Research; Amsterdam; May 5, 1989
34. Sprague, James C.; Whittaker, John D.; Cost Engineering; Morgantown; A
Systematic Approach to Replacement Analysis 35. Burns, Paul; Management Accounting; London; Mar 1980; Replacement
Analysis 36. Kulonda, Dennis J.; The Engineering Economist; Norcross; Spring 1978;
Replace Analysis with Unequal Lives-The Study Period Method 37. Estes, Carl B.;Jalali Yazdi, Abraham Industrial Engineering; Norcross; Nov.
1978; Now Replace Equipment on Actual Cost Basis 38. Adam, Everett E.;Pohlen, Michael F.; Journal of Purchasing; New York;
Equipment replacement models - User eval7
Appalachian Transportation Institute References - Page 90

APPENDIX
List of Appendixes:
I. Frog terms
II. Frog sketch
III. Fastener test method NASM-1312-7A
IV. Boltscience software results
V. Bolt chemical composition. Inspection Report from United Steel and Fasteners, Inc
Appalachian Transportation Institute ANEXOS 91

APPENDIX
APPENDIX I: Frog terms
Appalachian Transportation Institute ANEXOS 92

APPENDIX
AREA Track Definitions
FROG TERMS
bolted rigid frog A frog build entirely of rolled rails, fillers between the rails and rigidly held together with bolts.
clamp frog A frog built of rolled rails, fillers between the rails, and held together with clamps.
spring rail frog A frog having a movable wing rail held against the point rail by springs, normally presenting an unbroken running surface to wheels using one track while the flanges of wheels on the other track force the wing rail away from the point rail to provide opening.
spring rail frog, right hand and left hand
Standing at the toe end of the frog and looking towards the point, the right-hand spring frog has the spring wing rail located on the right-hand side, and the left-hand spring rail frog has it located on the left-hand side.
railbound manganese steel frog
A frog consisting of a manganese steel center casting fitting into and surrounded by rolled rails and rigidly held together with bolts.
self guarded frog (flange frog)
A frog provided with a guard member for guiding the flange of a passing wheel past the point of the frog by engaging the tread rim of the wheel in a horizontal plane above the top of running surface of the frog.
frog angle The angle formed by the intersecting gage lines of a frog. frog number One-half the cotangent of one-half the frog angle, or the number of units
of center line length in which the spread is one unit. heel end of frog The end of a frog farthest from the switch and where the running
surfaces, diverging from the point, terminate. toe end of frog The end of a frog in front of the point and towards the switch. heel spread The distance between the gage lines at the heel end of the frog. toe spread The distance between the gage lines at the toe end of the frog. throat of frog The point at which the converging wings of a frog are closest together. frog point The part of a frog lying between the gage lines extending from their
intersection to the heel end. point of frog, theoretical
The point of intersection of gage lines of the frog.
point of frog, A point located at a distance from the theoretical point towards the heel
Appalachian Transportation Institute ANEXOS 93
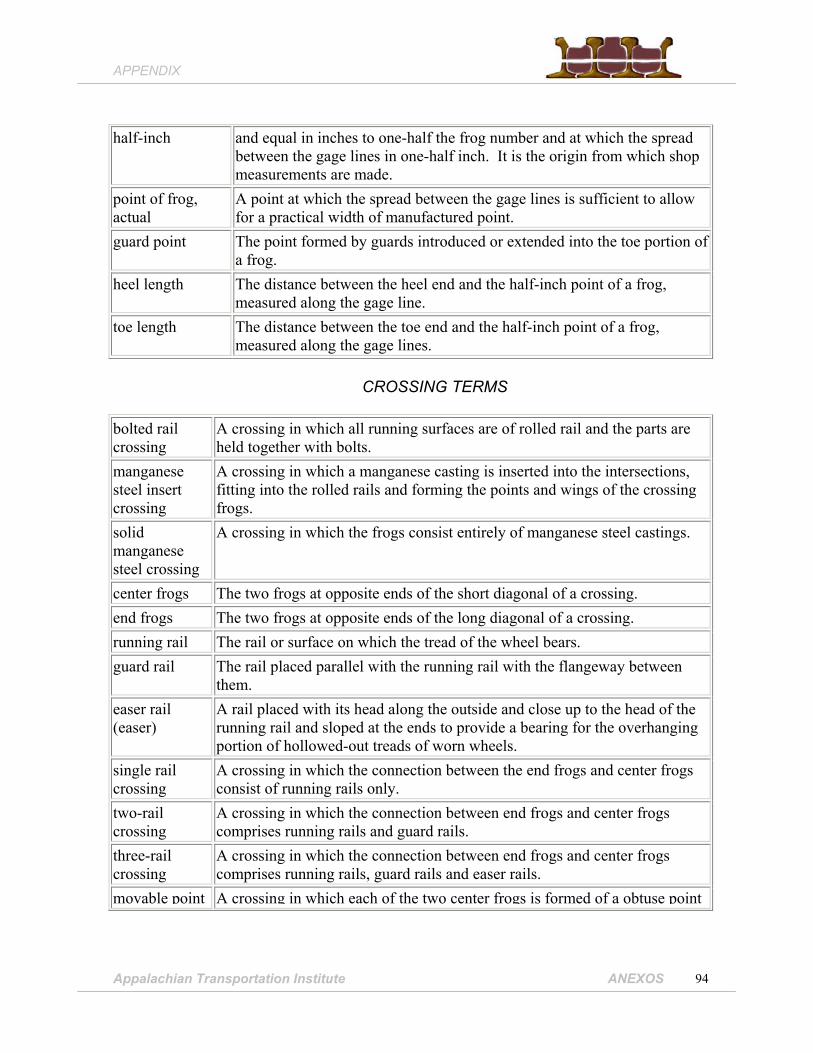
APPENDIX
half-inch and equal in inches to one-half the frog number and at which the spread between the gage lines in one-half inch. It is the origin from which shop measurements are made.
point of frog, actual
A point at which the spread between the gage lines is sufficient to allow for a practical width of manufactured point.
guard point The point formed by guards introduced or extended into the toe portion of a frog.
heel length The distance between the heel end and the half-inch point of a frog, measured along the gage line.
toe length The distance between the toe end and the half-inch point of a frog, measured along the gage lines.
CROSSING TERMS
bolted rail crossing
A crossing in which all running surfaces are of rolled rail and the parts are held together with bolts.
manganese steel insert crossing
A crossing in which a manganese casting is inserted into the intersections, fitting into the rolled rails and forming the points and wings of the crossing frogs.
solid manganese steel crossing
A crossing in which the frogs consist entirely of manganese steel castings.
center frogs The two frogs at opposite ends of the short diagonal of a crossing. end frogs The two frogs at opposite ends of the long diagonal of a crossing. running rail The rail or surface on which the tread of the wheel bears. guard rail The rail placed parallel with the running rail with the flangeway between
them. easer rail (easer)
A rail placed with its head along the outside and close up to the head of the running rail and sloped at the ends to provide a bearing for the overhanging portion of hollowed-out treads of worn wheels.
single rail crossing
A crossing in which the connection between the end frogs and center frogs consist of running rails only.
two-rail crossing
A crossing in which the connection between end frogs and center frogs comprises running rails and guard rails.
three-rail crossing
A crossing in which the connection between end frogs and center frogs comprises running rails, guard rails and easer rails.
movable point A crossing in which each of the two center frogs is formed of a obtuse point
Appalachian Transportation Institute ANEXOS 94

APPENDIX
crossing or knuckle rail and two opposed movable tapered rails, with operating mechanism connecting them so that when two of the movable rails lie against the point or knuckle rails, giving a continuous running surface on one track, the other two stand away from the point to give clearance for the wheel flanges to pass. (Used in small angle crossings and slip switches.)
knuckle rail A bent rail forming the obtuse point against which the movable rails operate in a movable point crossing.
reinforcing rail A piece of rail placed along the outside of the head of the knuckle rail or movable center point for strengthening and to act as an easer rail.
TURNOUT TERMS
lead (theoretical) The distance from the theoretical point of a uniform turnout curve to the theoretical point of the frog, measured on the line of the parent track.
lead (actual) The length between the actual point of the switch and the half-inch point of the frog measured on the line of the parent track.
lead curve The curve in the turnout interposed between the heel of the switch and the frog.
curved lead The length measured on the outside gage line of turnout from the point of switch to the point of frog.
closure rails (lead rails)
The rails connecting the heels of the switch rails with the toe end of the frog.
turnout number The number corresponding to the frog number of the frog used in the turnout.
Appalachian Transportation Institute ANEXOS 95

APPENDIX
APPENDIX II: Frog sketch
Appalachian Transportation Institute ANEXOS 96

APPENDIX
APPENDIX III: Fastener test method NASM-1312-7A
Appalachian Transportation Institute ANEXOS 97

APPENDIX
APPENDIX IV: Boltscience software results
1. Boltcalc Results 2. Torque Results 3. Fastener
4. Torksense Results
Appalachian Transportation Institute ANEXOS 98

APPENDIX
APPENDIX IV:
1. Boltcalc Results
Appalachian Transportation Institute ANEXOS 99

APPENDIX
PROJECT TITLE: BOLTCALC FROG JOINT ANALYSIS FASTENER DETAILS
Fastener Diameter = 1.3750 inches Thread Pitch = 0.1667 inches Thread Pitch Diameter = 1.2667 inches Thread Root Diameter = 1.1585 inches Diameter related to the Thread Stress Area = 1.2126 inches Thread Stress Area = 1.15483 in² Thread Root Area = 1.05401 in² Bearing Area under Nut/Bolt Head = 1.04883 in² Fastener Outer Bearing Diameter = 1.994 inches Fastener Inner Bearing Diameter = 1.625 inches Fastener Clearance Hole Diameter = 1.625 inches Fastener Yield Strength = 130000.000 Lb/in² Fastener Modulus of Elasticity = 30000000.000 Lb/in² Fatigue Endurance Limit for the Fastener = 6217.104 Lb/in² Note: The Fatigue Endurance Limit of the fastener is based upon the thread being rolled before heat treatment.
JOINT DETAILS
Clamped Length for the Joint = 17.000 inches Clamped Length to Diameter ratio = 12.36 Load Introduction Level Factor = 0.50 Joint Material Modulus of Elasticity = 30000000.00 Lb/in² Amount of Embedding within the Joint = 3.046E-4 inches Friction value between Joint Plates = 0.20 Limiting Surface Pressure for the Material = 150000.00 Lb/in²
DETAILS OF APPLIED FORCES
Axial force = 0.00 Lb Direct shear force = 30000.00 Lb Force required to prevent shear movement = 50000.00 Lb Force required for functional reasons = 0.00 Lb Lower value of the applied dynamic force = 125000.00 Lb
BOLT AND JOINT RESILIENCES
Fastener Resilience = 4.281E-7 in/Lb Joint Resilience = 3.563E-8 in/Lb
Appalachian Transportation Institute ANEXOS 100

APPENDIX
Load Factor = 0.077 Load Factor adjusted for Load Introduction = 0.038
JOINT ASSEMBLY DETAILS
Tightening Details: Torque controlled tightening using dynamic torque measurement and precision tools. Torque value theoretical.
Tightening Factor = 1.60 Thread Frictional Conditions: Black oxide steel external thread, no finish on steel internal thread, no lubricant. Thread Friction Value = 0.120 Underhead Frictional Conditions: Black oxide steel nut or bolt, no oil, machined steel bearing surface. Nut/Bolt Head Friction Value = 0.120
BOLT TIGHTENING ANALYSIS
Yield Point Tightening Factor specified = 0.90 Total Tightening Torque = 2104.576 Lb-ft Torque needed to extend the fastener = 250.121 Lb-ft Torque needed to overcome thread friction = 827.367 Lb-ft Torque needed to overcome nutface friction = 1027.088 Lb-ft
ANALYSIS RESULTS
Fastener Preload = 113129.67 Lb Direct Force that would Yield the Fastener = 150127.26 Lb Preload Loss due to Embedding = 656.85 Lb Maximum Clamping Force required = 81050.96 Lb Minimum Clamping Force required = 50656.85 Lb Surface Pressure under the Nut Face = 107862.80 Lb/in² Induced Alternating Stress in the Fastener = 2278.31 Lb/in² Maximum Fastener Force = 113129.67 Lb Minimum Residual Force on the Joint = 32078.71 Lb Force reducing Clamp Force on the Joint = 0.00 Lb Force increasing the Fasteners Tension = 0.00 Lb Tensile Stress due to Preload = 97962.60 Lb/in²
Appalachian Transportation Institute ANEXOS 101

APPENDIX
S U M M A R Y O F T H E R E S U L T S FASTENER CLAMP FORCE ANALYSIS
Fastener Preload = 113129.67 Lb Maximum Clamping Force required = 81050.96 Lb Factor of Safety = 1.40
CONCLUSION
The residual clamp force present when the applied forces have been taken into account will provide the fastener with a degree of resistance to loosening based on the data entered.
FASTENER OVERLOADING ANALYSIS
Direct Force that would Yield the Fastener = 150127.26 Lb Maximum Fastener Force = 113129.67 Lb Factor of Safety = 1.33
CONCLUSION
The force in the fastener will not exceed its yield strength based on the data entered.
FASTENER FATIGUE FAILURE ANALYSIS
Fatigue Endurance Limit for the Fastener = 6217.10 Lb/in² Induced Alternating Stress in the Fastener = 2278.31 Lb/in² Factor of Safety = 2.73
CONCLUSION
The fastener should not sustain fatigue failure based upon the data entered.
SURFACE PRESSURE ANALYSIS
Limiting Surface Pressure for the Material = 150000.00 Lb/in² Surface Pressure under the Nut Face = 107862.80 Lb/in² Factor of Safety = 1.39
Appalachian Transportation Institute ANEXOS 102

APPENDIX
CONCLUSION
The surface pressure calculated is within the quoted maximum value. OVERALL CONCLUSIONS
All safety factors are greater than unity, the defined fastener is capable of sustaining the applied forces entered by the user.
Appalachian Transportation Institute ANEXOS 103

APPENDIX
ANEXO IV:
2. Torque results
Appalachian Transportation Institute ANEXOS 104

APPENDIX
TORQUE TIGHTENING ANALYSIS RESULTS FASTENER DETAILS Fastener Thread Description: 1 3/8 - 6 UNC (1.375" dia. 8 tpi) Fastener Diameter = 1.3750 inches Fastener Shank Diameter = 1.3750 inches Thread Pitch = 0.1667 inches Included angle between the thread flanks = 60.000 degrees Thread Pitch Diameter = 1.2667 inches Thread Root Diameter = 1.1585 inches Diameter related to the Thread Stress Area = 1.2126 inches Thread Stress Area = 1.15488 inches² Thread Root Area = 1.05408 inches² Bearing Area under Nut/Bolt Head = 1.04883 inches² Fastener Outer Bearing Diameter = 1.9940 inches Fastener Inner Bearing Diameter = 1.6250 inches Fastener Clearance Hole Diameter = 1.6250 inches Effective friction diameter of nut/bolt = 1.8158 inches Fastener Yield Strength = 130000.00 Lb/in² JOINT ASSEMBLY DETAILS Black oxide steel external thread, no finish on steel internal thread, no lubricant. Black oxide steel nut or bolt, no oil, machined steel bearing surface. No prevailing torque included. Thread Friction Value = 0.120 Nut/Bolt Head Friction Value = 0.120 TORQUE TIGHTENING ANALYSIS RESULTS Tightening Torque specified by the user = 2104.68 Lb-ft Total Tightening Torque = 2104.679 Lb-ft This torque is composed from: Torque needed to extend the fastener = 250.093 Lb-ft Torque needed to overcome thread friction = 827.433 Lb-ft Torque needed to overcome nutface friction = 1027.154 Lb-ft Prevailing Torque Value = 0.000 Lb-ft FORCE ANALYSIS RESULTS Fastener Preload = 113136.93 Lb Direct Force that would Yield the Fastener = 150134.49 Lb Preload as a percentage of Yield Force = 75.36 % MAXIMUM STRESSES INDUCED INTO THE FASTENER
Appalachian Transportation Institute ANEXOS 105
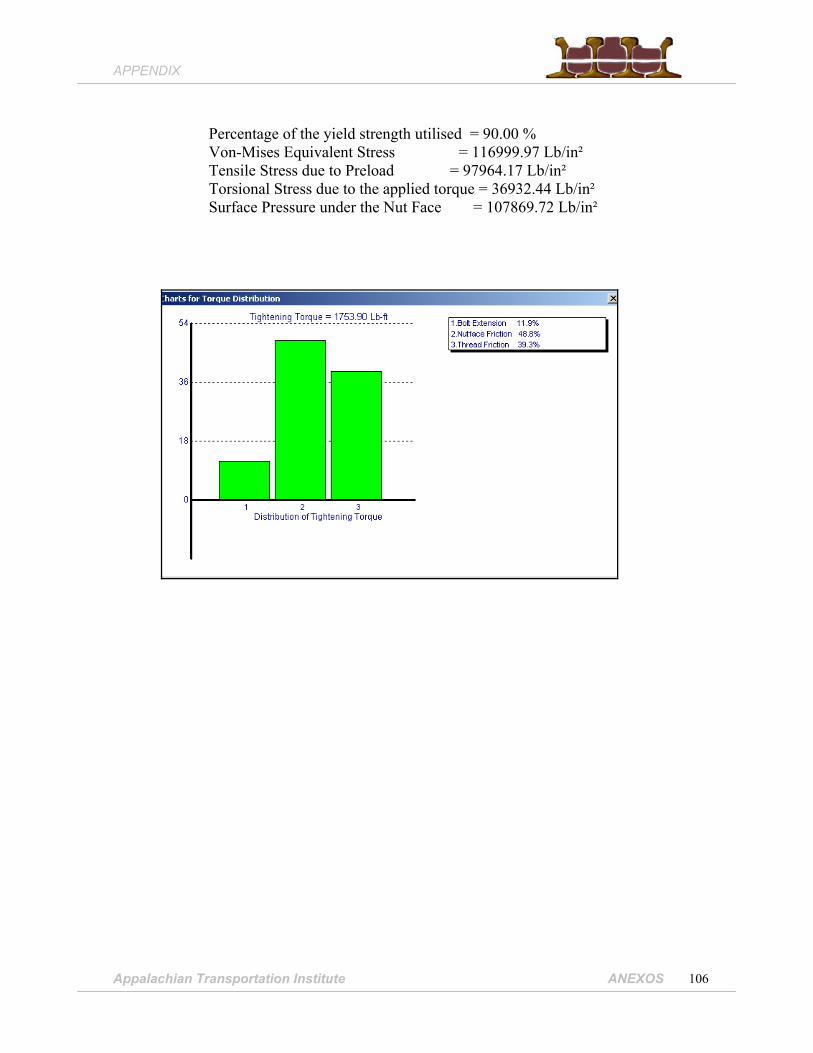
APPENDIX
Percentage of the yield strength utilised = 90.00 % Von-Mises Equivalent Stress = 116999.97 Lb/in² Tensile Stress due to Preload = 97964.17 Lb/in² Torsional Stress due to the applied torque = 36932.44 Lb/in² Surface Pressure under the Nut Face = 107869.72 Lb/in²
Appalachian Transportation Institute ANEXOS 106

APPENDIX
APPENDIX IV: Fastener Results
Appalachian Transportation Institute ANEXOS 107

APPENDIX
FASTENER - THREAD STRIPPING STRENGTH PROGRAM THREAD DETAILS ______________ Fastener Diameter = 1.3750 inches Thread Pitch = 0.16667 inches Thread: 1 3/8 - 6 UNC 2A/2B EXTERNAL THREAD Maximum Major Dia. = 1.3726 inches Minimum Major Dia. = 1.3544 inches Maximum Pitch Dia. = 1.2643 inches Minimum Pitch Dia. = 1.2563 inches Maximum Minor Dia. = 1.1922 inches Minimum Minor Dia. = 1.1480 inches Material: SAE Grade 8 (Diameter range 1/4" to 1 - 1/2") Minimum Tensile Strength = 150000.0 Lbf/in² Maximum Tensile Strength = 179200.0 Lbf/in² Ratio of the shear to tensile strength = 0.580 Minimum Shear Strength = 87000.0 Lbf/in² A chamfer is present on the end of the thread. Length of Chamfer = 0.1667 inches INTERNAL THREAD Minimum Major Dia. = 1.3750 inches Maximum Pitch Dia. = 1.2771 inches Minimum Pitch Dia. = 1.2667 inches Maximum Minor Dia. = 1.2250 inches Minimum Minor Dia. = 1.1950 inches Note: The maximum size of the Minor Diameter has been used to determine the shear area of the internal thread rather than the Tapping Drill Dia. Thread Engagement Length = 1.375 inches Bellmouthing Ratio = 1.03 inches Length of Bellmouthing = 0.688 inches Material: Steel Minimum Tensile Strength = 150000.00 Lbf/in² Ratio of the shear to tensile strength = 0.600 Minimum Shear Strength = 90000.00 Lbf/in² The hole is countersunk on one side only. Countersink Diameter = 1.4850 inches Countersink angle = 90.00 degrees Thread Friction Details
Appalachian Transportation Institute ANEXOS 108

APPENDIX
Black oxide steel external thread, no finish on steel internal thread, no lubricant. Thread Friction Value = 0.150 DERIVED INFORMATION ___________________ Basic Pitch Dia. d2 = 1.2667 inches Basic Minor Dia. d1 = 1.1946 inches Nominal Minor Dia. d3 = 1.1705 inches Stress Diameter of the Thread = 1.2126 inches Theoretical Stress Area - External Thread = 1.1549 inches² Minimum Stress Area - External Thread = 1.1350 inches² Maximum Stress Area - External Thread = 1.1849 inches² Nominal Root Area of the External Thread = 1.0541 inches² RESULTS ________ Effective Length of Thread Engagement = 1.1880 inches Shear Area of the Internal Thread per inch = 3.2668 inches² Shear Area of the Internal Thread = 3.8810 inches² Shear Area of the External Thread per inch = 2.3415 inches² Shear Area of the External Thread = 2.6349 inches² Internal to External Thread Strength ratio = 1.47292 Boss/Nut Dilation Factor C1 = 1.00000 External Thread Bending Factor C2 = 1.09365 Internal Thread Bending Factor C3 = 0.89700 Direct Forces to fail the Fastener: Minimum Tensile Force to fail the Fastener = 170254.4462 Lbf Maximum Tensile Force to fail the Fastener = 212325.1467 Lbf Fastener Failure Forces Allowing for Combined Tension-Torsion Loading: Minimum Tension-Torsion Failure Load = 146709.5748 Lbf Maximum Tension-Torsion Failure Load = 183960.6800 Lbf When the bolt/screw is being tightened it experiences both tension and torsion. The effect of this is that the bolt/screw will fail at a lower force then if only a directly applied force is applied. Higher the thread friction value, higher will be the induced torsion and lower
Appalachian Transportation Institute ANEXOS 109

APPENDIX
will be the direct force that results in fastener failure. Thread Stripping Forces: Minimum External Thread Stripping Force = 250703.0678 Lbf Minimum Internal Thread Stripping Force = 313313.0242 Lbf Relative to Torque Tightening: Factor of Safety - External Thread = 1.363 Factor of Safety - Internal Thread = 1.703 Critical Length of Thread Engagement = 1.059 inches NOTE Because the upper limit of the force to cause tensile fracture of the fastener of 212325 Lbf is smaller than the external thread stripping force of 250703 Lbf and the internal thread stripping force of 313313 Lbf; the fastener will fail by tensile fracture before either the internal or external thread will strip. If bolt breaks on tightening, it is obvious that a replacement is required. Thread stripping tends to be gradual in nature. If the thread stripping mode can occur, assemblies may enter into service which are partially failed, this may have disastrous consequences. Hence, the potential of thread stripping of both the internal and external threads must be avoided if a reliable design is to be achieved.
Appalachian Transportation Institute ANEXOS 110

APPENDIX
APPENDIX IV: Torksense results
Appalachian Transportation Institute ANEXOS 111

APPENDIX
Data Entered Nominal Thread Diameter: 1.375 inches Thread Pitch: 0.16667 inches Bolt Yield Strength: 130000 Lbf/in² Percentage of Yield Used: 75 % Nut Factor Used: 0.179 Results Torque Value 2309.4907 Lbf-ft Preload Value 112600.8695 Lbf Additional Information Basic Thread Pitch Diameter 1.2667 inches Basic Thread Minor Diameter 1.1585 inches Stress Diameter of Thread 1.2126 inches Stress Area of Thread 1.1549 in² Force required to Yield Bolt 150134.4926 Lbf Torque Value Conversions Torque Value 2309.4907 Lbf-ft Torque Value 27713.8890 Lbf-in Torque Value 443422.2239 Oz-in Torque Value 3131.2491 Nm Torque Value 3131249.1290 Nmm Torque Value 319.1895 Kg-m Preload Value Conversions Preload Value 112600.8695 Lbf Preload Value 500873.4395 N Preload Value 51057.4342 Kgf
Appalachian Transportation Institute ANEXOS 112

APPENDIX
Appalachian Transportation Institute ANEXOS 113
APPENDIX V.
Bolt chemical composition. Inspection Report from United Steel and Fasteners, Inc