Embed Size (px)
Citation preview

American Political Science Review Vo1. 94, No. 1 March 2000
Improving Quantitative Studies of International Conflict: A Conjecture NATHANIEL BECK University of California, San Diego GARY KING Harvard University LANGCHE ZENG Haward University and the George Washington University
W e address a well-known but inffequently discussed problem in the quantitative study of international conpict: Despite immense data collections, prestigious journals, and sophisticated analyses, empirical findings in the literature on international conflict are often unsatisfying. Many
statistical results change ffom article to article and specijication to specijication. Accurate forecasts are nonexistent. In this article we offer a conjecture about one source of this problem: The causes of conflict, theorized to be important but often found to be small or ephemeral, are indeed tiny for the vast majority of dyads, but they are large, stable, and replicable wherever the ex ante probability of conflict is large. This simple idea has an unexpectedly rich array of observable implications, all consistent with the literature. We directly test our conjecture by formulating a statistical model that includes its critical features. Our approach, a version of a "neural network" model, uncovers some interesting structural features of international conflict and, as one evaluative measure, forecasts substantially better than any previous effort. Moreover, this im~rovement comes at little cost, and it is easv to evaluate whether the model is a statistical improvement over the simpler models commonly used.
D espite immense data collections, prestigious journals, and sophisticated analyses, empirical findings in the quantitative literature on inter-
national conflict are frequently unsatisfying. Statistical results appear to change from article to article and specification to specification. Any relationships usually are statistically weak, with wide confidence intervals, and they vary considerably with small changes in specification, index construction, and choice of data frame.l
Instead of uncovering new, durable, systematic pat- terns, as is the case in most other quantitative subfields of political science (and public health, of which this field is also a part [King and Murray 2000]), students of international conflict are left wrestling with their data to eke out something they can label a finding. As a consequence, those with deep qualitative knowledge of
Nathaniel Beck is Professor of Political Science, University of California, San Diego, La Jolla, C A 92093 ([email protected]). Gary King is Professor of Government, Harvard University, Cambridge, M A 02138 ([email protected], http://gking.harvard.edu). Langche Zeng is Associate Professor of Political Science, the George Wash- ington University, Washington, DC 20052, on leave at the Center for Basic Research in the Social Sciences, Harvard University.
W e thank Richard Tucker for providing us with the data set, as well as for many helpful discussions; we also thank Jim A t , Scott Bennett, Kristian Gleditsch, Simon Jackrnan, Lisa Martin, Phil Schrodt, and David Singer for helpful comments. An earlier version of this article was presented at the 1998 annual meeting of the Society for Political Methodology, La Jolla, CA. Research support was provided by the National Science Foundation (SBR-9753126 and SBR-9729884), the Centers for Disease Control and Prevention (Division of Diabetes Translation), the World Health Organization, and the National Institutes of Aging.
It is not our intention to provide a literature review. Examples of the fragility of findings and sensitivity of exact specification may be found in Thompson and Tucker's (1997) exchange with Farber and Gowa (1997) and Mansfield and Snyder (1997) on the role of democracy in preventing conflict, or in Oneal and Russett (1997), Barbieri (1996), and Beck, Katz, and Tucker (1998) on the role of trade in preventing conflict. W e stress that our examples involve current best practice, so the problems we mention are not the result of data errors or simple methodological mistakes.
the subject are rarely persuaded by conclusions from quantitative works (see Bueno de Mesquita 1981; Geller and Singer 1998; Levy 1989; Rosenau 1976; Vasquez 1993). The field has a number of important successes to its credit, such as the democratic peace, and many important and very promising research pro- grams, but the discontinuity between the beliefs of most experts and many quantitative results remains.
A symptom of the fragility of the various models is their poor forecasting performance. To our knowledge, no legitimate statistical model (using annual data) has ever forecast an international conflict with greater than 0.50 probability, and certainly none has done so while also being correct. Political scientists have long es- chewed forecasting in favor of an emphasis on causal explanation, and it is clear that any proposed new method must allow for causal interpretation as well as improved forecasting. But causal theories are consid- erably harder to verify than forecasts, and forecasts have the advantage of being observable implications of the same theories as the causal hypotheses. This means that accurate forecasts can be used at least in part to verify claims about causal structure. In particular, a claim to have found a causal explanation that is a structural feature of the world but changes unpredict- ably over time (and so is of no help in forecasting) is of dubious validity and marginal value.
Although political scientists are less likely to evalu- ate models by their forecasting properties than are, say, economists, forecasting properties underlie all evalua- tions of the performance of statistical models. For example, all likelihood or goodness-of-fit assessment procedures merely ask whether one specification has superior in-sample "forecasting" properties. Yet, all statistical analysts must be concerned about whether they are taking advantage of some idiosyncratic fea- tures of the data to improve fit at the expense of detecting structure and hence out-of-sample perfor- mance. To guard against this problem, which is more of a worry with powerful statistical models, out-of-sample
Improving Quantitative Studies of International Conflict: A Conjecture March 2000
forecast accuracy is generally considered the gold standard for model assessment. Even if we have no interest in prediction per se, the poor forecasting performance of standard models indicates that we can improve on them to provide better knowledge of real-world causal relationships. Forecasting is thus of critical, albeit indirect, interest as a key test of whether we have really found causal structure.=
The scholarly attacks on this problem have come from every angle. The most venerable tradition has been to improve the data and measures of interna- tional conflict and its correlates (Jones, Bremer, and Singer 1996). Others have modified existing statistical models to accommodate some of the special features of conflict data (Beck and Tucker 1998; King 1989; King and Zeng 1999). Yet others have attempted to derive statistical models from formally stated rational choice theories based on the motivations of states, political leaders, or other domestic actors (Signorino 1999; Smith 1998). We believe progress will ultimately re- quire advances on all three fronts as well as a conver- gence in theoretical and statistical models and data.
Our approach is based on the belief that a portion of the problem lies in a somewhat overlooked but key substantive issue that is reflected in the mismatch between available data and the set of statistical meth- ods commonly applied. International conflict is a rare event, and the processes that drive it where it is more common are likely to be very different from those elsewhere. As a result, many qualitative researchers expect the relationships to be highly nonlinear, mas- sively interactive, and heavily context dependent or contingent. Because these characteristics would be missed with standard statistical approaches, particu- larly the typical linear-normal models imported from studies of American politics, we adopt a form of the highly flexible "neural network model." This type of model is well suited to data with complex, nonlinear, and contingent relationships. It is not a panacea or always appropriate, but it provides an immensely useful tool that has not been sufficiently exploited in this field to date.
As an analogy, consider the use of survey data to assess the consequences of lifestyle on the onset of a relatively rare disease. A supposedly healthful lifestyle may be helpful in warding off the disease for everyone, but a simple logit of disease on lifestyle (and other explanatory variables) would, at best, show a weak relationship, since most survey respondents are un- likely to get the disease in any event. Thus, the logit analysis of disease, like a logit of conflict, will average many small effects with a few large ones. If we could
Of course, accurate forecasts of international conflict would be of tremendous practical value, as a large portion of the foreign policy bureaucracy in many countries is devoted to this task. A quantitative "expert system" to help guide policymakers could be of considerable use. Forecasts of political conflict also would be of interest to political-business risk analysts, public health researchers, and many others. In informal discussions, several former U.S. policymakers indicated that, aside from occasional commissioned studies, no such quantitative expert system is presently in use. To our surprise, they also indicated that even annual forecasts would be of considerable use in policymaking.
predict that behavioral changes would have a major effect on avoiding disease for those who are at greater risk for it, this would be a great accomplishment. Similarly, if we could show that autocracy dramatically increases the likelihood of conflict for dyads at risk of conflict, this also would be important. In short, we conjecture that many quantitative international conflict studies lack robustness because they look only for the effects of variables averaged over all dyads, whereas in reality the effects vary enormously over dyads and are only substantively large for those already at relatively high risk of conflict.
We find that our models are able to predict interna- tional conflict to a degree. Whereas all previous models are unable to predict the occurrence of any conflict, our out-of-sample forecasts pick up about 17% of these disputes. There is still a long way to go to produce highly accurate forecasts of all these rare and unusual events, if that is ever even possible, but our analyses confirm that there is structure in these data. As for causal interpretation of the underlying structure, our more appropriate techniques find hints of robust and replicable patterns.
In the next section, we propose a simple conjecture that seeks to remedy some of the problems found in the quantitative analysis of conflict. We believe the idea may explain some of the anomalies and nonfindings in the literature and why our model is able to forecast reasonably well. It also highlights the features that an appropriate method would need to uncover stable patterns in this field. We then discuss appropriate methods, apply them to real data, and offer conclu- sions. The Appendix contains some technical details on Bayesian neural network models.
THE PROBLEM WITH CONFLICT STUDIES
A Conjecture Our conjecture about conflict studies is quite simple, and aspects of it are implied in much of the literature. The idea is that the effects of most explanatory vari- ables are undetectably small for the vast majority of dyads, but they are large, stable, and replicable when the ex ante probability of conflict is large. For example, Swaziland and St. Lucia have essentially no chance of going to war today. Should either become slightly less democratic, conceivably the probability of war would increase a bit, but the increase would be so small that it would be undetectable and unimportant. In contrast, if Iran and Iraq were to become slightly more demo- cratic, then the probability that they would go to war might drop dramatically. If our conjecture is right, then the effects of the causes of conflict differ by dyad, with trivially small effects for the vast majority and larger effects for a few. That is, it is the effects of the explanatory variables, not merely the levels of the variables, that vary.
To be clear, this conjecture addresses the large literature on country-year dyads. Different processes and theories might apply to data based on daily events series or other more finely grained data collections. We

American Political Science Review Vol. 94, No. 1
do believe that our simple conjecture may help explain diverse features of the quantitative literature on the causes of international conflict. At the least, it appears to be consistent with several observable implications.
First, most scholars use statistical procedures that assume the effects of their explanatory variables are nearly the same for all dyads. (Some use interaction effects that allow more variation over the dyads, but the degree of variation represented is still quite limited.) The estimates these analyses produce are roughly the average of essentially zero effects for the vast majority of observations and larger effects for a tiny fraction of the cases. Unless the effect is enormous in the small set of dyads with a high ex ante probability of war, estimates from most analyses will appear very small or resemble random noise. Indeed, small to nonexistent and highly variable effects are dominant in the litera- ture.
Second, when effects are huge in the dyads with high ex ante probability of war, the average over all the dyads is large enough to be detected reliably with most methods. (Nonetheless, the estimated effect would be too large for most dyads and far too small for a few.) Some uncontroversial variables in this at-risk subset of dyads include contiguity and time since the last war; indeed, these are among the few variables that often give reasonably robust results across specifications.
Third, if only a few observations have large effects, then small changes in the set of dyads included in a statistical analysis will sometimes have disproportion- ate effects on the results. This also appears true and may account for some of the apparent instability of results in the literature from article to article.
Fourth, a similar observable implication results from the strong priors most scholars derive from their considerable qualitative knowledge about the field. What can we expect to find when strong priors are combined with statistical methods that assume causal effects are the same for all dyads and when data have a low signal-to-noise ratio? We expect researchers to push their data analyses extremely hard in search of effects they believe are there but are difficult to find. Unfortunately, this would make the results differ from investigator to investigator, just as they seem to, since answers will depend very sensitively on otherwise mi- nor coding decisions.
Fifth, some scholars make coding decisions that seem consistent with our conjecture when they discard all dyads but those deemed "politically relevant" or "at risk," in other words, those with a high ex ante proba- bility of war.3 If our hypothesis is correct, then these coding decisions are problematic methodologically. Such problems are often recognized by the authors, who have little choice but to put some restrictions on an otherwise endless data collection. The difficulty is that coding rules amount to dropping many cases without war and a few with war, which in some instances may generate two types of selection bias. (1) Intentional selection may bias the effect upward if the
See Bremer 1992 for this argument in its modern statistical guise and Richardson 1960 for some early intuition.
relevant population to which one is inferring is all dyads and otherwise may correctly increase the effect. (2) Except when the definition of "politically relevant" is clearly based on one of the explanatory variables (e.g., Maoz 1996), these rules also select on the depen- dent variable, which biases estimates of the probability of conflict. Whatever the goal of the inference, studies that address the problem by selecting cases in this way may give answers that are too small or too noisy, which appears to be the case throughout the literature. The results from these selection rules will be somewhat stronger than when using the entire data set but not as large as qualitative experts expect. Indeed, this seems to fit the literature.
Finally, if our conjecture is right, then the applica- tion of an appropriate statistical technique will confirm the existence of sizable and robust effects in the high ex ante probability of war dyads and tiny effects else- where. For many variables at least, the direction, magnitude, and nature of the large effects should not be wildly inconsistent with our qualitative knowledge of international relations, unless there is a clear reason. If this method indeed finds real features of the in- ternational system, rather than some idiosyncratic sam- ple characteristics that result from our specification choices or coding rules, then out-of-sample forecasts ought to predict similar patterns in the next data set.
The first five of these observable implications of our conjecture are consistent with observations from the literature. Testing the sixth will occupy most of the rest of this article.
According to our idea, international conflict data differ from other rare events data sets in two ways. The effect of any single explanatory variable changes mark- edly as a function of changes in the other explanatory variables (that is, there are strong and complicated interactions), and the dependent variables are, in prin- ciple, powerful enough to predict whether conflict occurs if the appropriate model is used. Some other rare events data, such as in epidemiological studies of disease, may fit this description, but only if all these characteristics apply.4
STATISTICAL MODELS OF INTERNATIONAL CONFLICT Relative to other types of data and processes studied in political science, international conflict data have some unusual characteristics. They are based on thousands of dyads (combinations of countries taken pairwise) or directed dyads (the actions of A toward B and of B toward A are separate observations in the same data set). Whether the universe of dyads should include only originators of conflict, all nations, or some group in between is by no means clear. Most outcome variables
The leading alternative explanation for the problems in this field is that the data are so bad that it is impossible to discover patterns. Data problems clearly exist (e.g., Vasquez 1993), and may be more severe than in other fields, but they are not unique to international relations.

Im~roving Ouantitative Studies of International Conflict: A Coniecture March 2000
are dichotomous. The data often concern rare events, with hundreds of times more 0's (peace) than 1's (conflict). Often the explanatory variables are neither dichotomous nor quite continuous, with distributions that are asymmetric or with multiple mass points (such as at the end or midpoint). The indices often are necessarily complicated combinations of diverse mea- sures. In addition, assuming our conjecture is correct, very small parts of very large data sets contain most of the interesting information.
The statistical method we introduce here is a version of a neural network model, first introduced to political scientists by Schrodt (1995) and Zeng (1999, 2000).5 There is an immense literature supporting this tech- nique in engineering, computer science, statistics, psy- chology, linguistics, neuroscience, medicine, finance, and other fields. Neural network analysts have adopted an extensive and essentially unique terminology. The language is useful because it helps emphasize the rough analogies between these statistical models and some theoretical models of the way human brains may work. Using this language to describe concepts known to political scientists by other names can be counter- productive. Therefore, we introduce these models as straightfonvard generalizations of logistic models, which are the most commonly used statistical models of international conflict.
In the following subsections, we make the transition from logit to our neural network models. We examine various issues related to estimation, interpretation, and inference with our model, and we introduce the main ideas of Bayesian methods for neural networks adopted here. We also discuss several potential objec- tions to neural networks.
From Logit to Neural Networks Our dependent variable, Yi, takes on a value of 1 if dyad i (i = 1, . . . , N) is engaged in an international conflict, 0 if it is at peace. If conflict and peace are coded as mutually exclusive and exhaustive (which we make true by definition), then a Bernoulli distribution fully describes this variable. The only parameter of a Bernoulli distribution is ni, the probability of an international conflict. Let a vector of a constant term and k explanatory variables be denoted Xi = (1, XIi, XZi, 0 . . 7 Xki).
The next step is to specify the relationship between ni and Xi. The simplest possibility is a linear function, which results in what is known as the linear probability model:
5 General references on neural networks include Rumelhart et al. (1986), Muller and Reinhardt (1990), and Hertz, Krogh, and Palmer (1991). Detailed discussion of neural networks as statistical models can be found in, for example, Bishop (1995), Cheng and Titterington (1994), Kuan and White (1994), Ripley (1996), and White (1992). A recent application in political science is Eisinga, Franses, and Van Dijk (1998), who estimate a constrained neural network model similar to a generalized additive model. While this application is completely different from our conjecture, it does show the great flexibility of neural nets and their applicability to many complicated data problems.
where XJ.3 is merely a matrix expression for the linear relationship between ni and Xi,
and the (k + 1) x 1 vector p includes a constant term and k weights (or coefficients) on each of the k explanatory variables. The problem with the linear probability model is that it can generate impossible values of ni (greater than 1 or less than 0), so even values within the correct range near the boundaries are questionable. Moreover, the full posterior distribution for n i generated by the linear probability model never makes sense in any application because at least some density always falls outside the unit interval. These problems were known long ago, and the linear model was almost entirely supplanted by logit models when these became computationally feasible.
The logit model is similar to the linear probability model except for the functional form:
The logit model maps the linear functional form XiP, which can take on any value, into the [0,1] interval required for n i by applying the logit function. The vast majority of analyses in conflict studies use some form of this method. For our purposes, it is important to recognize that the second line of equation 2 specifies the underlying probability of conflict, ni, as a logit function of a linear function of Xi,
The logit is thus a generalization of the linear proba- bility model, created by adding an extra level of hierarchy. Our neural network model will generalize the logit by adding an additional level of hierarchy.
The logistic model in equation 2 improves on simple linear probability models by avoiding impossible prob- ability values and assuming a more plausible relation- ship between the explanatory variables and the proba- bility of an outcome. The effect of each explanatory variable varies across observations, however, and de- pends on the values of other explanatory variables only slightly more than does the linear model. These effects also depend only trivially on the ex ante probability of conflict (see Nagler 1991). One way to look at changes in the effects of explanatory variables is to examine the derivative of the probability n i with respect to one of the explanatory variables, say, XIi. For linear models this derivative is p,, which is obviously constant. For logit models, the derivative is n i ( l - ni)p1, which is better. But since mi is within a small range above zero for all but a few observations (and, given the logit model's inflexibility, virtually all observations in prac- tice), this is a highly restrictive and nearly constant

American Political Science Review Vol. 94, No. 1
specification. To avoid this weakness, two different types of generalizations might be considered, either of which would be an improvement, but neither of which is sufficient.
First, we might specify a random effects model. Instead of leaving P fixed at one set of values, as in equation 2, we could let it vary randomly over the observations in some form, such as pi = P* + q. Although some assumption about randomness may be better than logit's more restrictive assumption of con- stant effects, our conjecture is not that the coefficients vary randomly across dyads; rather, they vary system- atically with the ex ante probability of conflict as a function of complicated conjunctions of all the explan- atory variables.
Second, standard interaction effects can be applied. For example, we might let the effect Pd of democracy Xdi be a function of whether the states in the dyad are contiguous Xci, by specifying, say, Pdi = yo + yJci. Substituting this expression back into the second line of equation 2 produces an interaction effect that is easy to estimate: Merely include XdiXci as an additional vari- able in Xi and use any standard logit package. This strategy will work in some cases, but it requires a good deal of prior knowledge of the types of interactions to specify. If one does not have sufficiently detailed knowledge, then the number of interactions one would include generally would not be precisely estimable with available data. In fact, too many interaction terms can result in severe problems of numerical instability due to colinearity. In conflict data, massive interaction effects are suspected, most of which are concentrated in tiny areas of the parameter space. Standard interac- tion-based logit models are too restrictive, require too many interactive terms, and do not address the ex- pected degree of nonlinearity.
Our preference for an approach to this problem is the massively interactive and highly nonlinear neural network model, in particular, the single hidden layer feed-forward perceptron. This biological language sounds complicated, but it can be expressed as a statistical model that is a straightforward generaliza- tion of the logit model.
Logit models use an "S-shaped" curve to approxi- mate the relationship between the probability, ni, and the explanatory variables, Xi. Imagine how much better the approximation could be if more than one such curve were used simultaneously, each with a different curvature and orientation; roughly speaking, that is what neural network models allow. In order to approx- imate the relationship between ni andx i with a set of M logit curves, we use a neural network model with the same distribution as but a different functional form from the logit and linear probability models:
This neural network model is a type of discrete choice model that differs from the logit only in the shape of
the curve. It is easiest to compare this relationship with the standard logit in the special case when M = 1, since the second and third lines of equation 3 are then just a logit function of a linear function of a logit function of a linear function:
The larger the value chosen for M (known in the literature as the number of "hidden neurons," but of course nothing is hidden), the more logit curves are used at the third level of generalization and, as a result, the larger variety of shapes the entire expression can approximate.
To be more specific, P in the logit model in equation 2 is a (k + 1) X 1 vector of effect parameters (corresponding to a constant term and the weights on the k explanatory variables). After the p's are multi- plied by their respective Xi's and summed up, logit (XiP) is then one number, which we also label IT,. In contrast, the p(,), . . . , P(M) parameters in the second and third lines of equation 3 are each (k + 1) X 1 vectors, so that each expresses a different weighting of the k explanatory variables. Then the logit function is applied to each of the different weighting schemes XiP(l), . . . , XiP(M to yield a set of M numbers: logit(XiPi1)), . . . , logit(xiP(,,). A weighted sum of these M numbers is taken (with the y's as adjustable weights in this linear expression), and the logit is taken one final time to make sure that the entire expression yields a number for n i that is between 0 and 1. The result is, as we shall see below, a remarkably flexible functional form.
Neural networks meet the needs of conflict research because they allow the effect of each explanatory variable to differ markedly over the dyads, as required by our conjecture about international conflict. As in the case of linear probability and logit models, this can be made clear by examining the partial derivatives of n i with respect to the independent variables. After some straightforward calculus, this yields
where h indexes explanatory variable h in Xi and element h in pj. From this expression, it is clear that our neural network model allows much more range in the marginal effects of independent variables across dyads than do the linear probability or logit models: The effect varies not only with n i across dyads but also withxi and all the logit curves. Although each element in the summation is limited in size, the combination of all the terms can produce wide differences.
More generally, what makes neural network models attractive as statistical models is that they provide a class of functional forms that can approximate any hypothetical relationship between ni and Xi, given a large enough choice for the number of logit functions

Improving Quantitative Studies of International Conflict: A Conjecture March 2000
M (Hornik 1990; White 1992, 12-28).'j Although the functional form in equation 3 has a fair number of adjustable parameters (M(k + 2) + I), in comparison to other flexible functions that also have general ap- proximation capabilities, such as those based on poly- nomial spline or trigonometric functions (e.g., Gallant 1981), neural networks normally require far fewer parameters to model the same level of complexity (Barron 1993). They are often described as occupying a middle range between standard parametric models, with a small number of parameters, and nonparametric models, with almost infinite flexibility (Ripley 1996). Neural networks allow for a wide variability of mar- ginal effects, and their flexibility and general approxi- mation capabilities far outperform standard logit- based interaction models.
Is there a middle ground between the simple logit model and the more complicated neural network ap- proach? One possibility is generalized additive models (GAMs), which are more flexible than logit because they permit nonmonotonicities in the probability of a conflict, but they do not allow relationships as rich as neural networks because most interactions are disal- lowed (Beck and Jackrnan 1998). Our extensive exper- iments with these and other approaches caused us to conclude that only neural network models capture the full nature of the substantive relationships in these data. Of course, one could go even farther, toward more flexible relationships, such as through the use of nonparametric methods. Perhaps future researchers will find some of these techniques appropriate, but to date we have not found that the additional flexibility is warranted. Finally, we do not believe that neural network models should in all cases replace logit models in quantitative studies of international conflict, but our results seem to indicate they have a place in the toolkit of international relations researchers. Further work is needed to build theories based on the structure uncov- ered, and other research may indeed discover more parsimonious methods.
Issues in Neural Network Modeling
The use of neural networks involves the same issues of model selection, estimation, interpretation, and infer- ence as for any other statistical model. Some of these issues are more common in models with flexible func- tional forms, like ours, and so demand special atten- tion. For example, in equation 3, how do we choose the size of M? How do we compare results from the different models? For a given model, how are the parameter values determined? How are they inter-
The large variety of neural network models includes many that are even more general than equation 3, as they allow additional levels of hierarchy, stacking functions within functions, and feed-backward effects (as in the so-called recurrent neural networks [Holland 19981, which are appropriate for modeling time series data). In addition, one can choose functions other than logit or even mix several different functions in the same analysis. Neural network models also can be used with stochastic components other than Bernoulli to model different types of dependent variables.
preted? How does statistical inference proceed, and how do we handle uncertainty?
Recent developments in Bayesian methods for neu- ral networks allow disciplined treatment of each of these questions. We adopt the Bayesian framework with normal approximation (MacKay 1992a, 1992b, 1992c, 1994), which is discussed in the Appendix. Here we highlight some of its basic ideas in connection with the questions raised above.
The central feature of the Bayesian approach is to treat everything as probabilistic. Hence, instead of estimating the "true" values of some fixed parameters, we look for their posterior distributions given the data. Model building and inference is then a process of updating our beliefs about the world using the infor- mation we receive from empirical data. In the normal approximation framework for neural networks, we assume normal prior distributions for the parameters P and y that are centered on zero; that is, we believe it more likely that the parameters take smaller values than larger ones. This prior merely reflects the com- mon belief that a certain degree of "smoothness" in the underlying data-generating function is likely (smaller parameter values result in smoother functions, since the logit transformation is flattened as the parameter values decrease). We then apply Bayes's theorem to evaluate the posterior distribution of the parameters used to evaluate the predictive distribution of the dependent variable (by integrating out the parame- ters). For complex functions like neural networks, there are no analytical solutions for the integration, and Monte Carlo methods of sampling the distribution are computationally very burdensome. Hence, we fol- low MacKay (1994) and approximate various interme- diate distributions with normals, since they are analyt- ically easy to treat and simple to sample (see the Appendix). This enables us to arrive at the posterior probability of n,, given our data.
How to Select M and Avoid Overfitting. In conventional (non-Bayesian) neural networks, selection of M, the number of logit curves, is an important issue, as too large M can cause "overfitting." Overfitting is a danger with any statistical model, but especially so for very flexible forms. A model that is too flexible picks up idiosyncrasies unique to a particular data set rather than the structural features of the world that pertain to out-of-sample data. The danger is always real, and many attempts have been made to develop procedures that protect against it. Of course, "underfitting" (or missing relationships of interest) is a danger as well, so there is good reason to think that M > 1.
In the Bayesian framework, the presence of smooth priors for the parameters significantly alleviates the problem of overfitting. Instead of searching for the set of parameter values that maximize the model perfor- mance on the training data, we look instead for solu- tions that at the same time punish model complexity. More important (in principle at least), in the Bayesian paradigm no single model is the correct one. Rather, because each alternative is correct with some probabil- ity, different models can be compared by examining the
American Political Science Review Vol. 94. No. 1
measures of evidence for them.7 In practice, however, there is a fairly straightforward test of whether one is finding structure or overfitting ephemera. The proce- dure is to set aside a portion of the data as a "test set," fit the model to the remaining data (the "training set"), and see whether the forecasts hold up.8 Because there is always the tendency to iterate back and forth be- tween fitting models to the training set and verifying the model in the test set, we set aside two test sets, the second of which we did not consult until all exploratory work was completed. This second test set was used only to compare the performance of the chosen neural network specification and the corresponding logit spec- ification.
Interpretation. The neural network literature is con- cerned almost exclusively with pattern recognition and forecasting, and the issue of interpreting the effect of the explanatory variables on ni has not received much attention. In political science research, however, inter- pretation of causal effects is equally critical. The prob- lem is that the functional form is so flexible, and the estimated relationships between ni and Xi can be so complicated, that the parameters (P(,), . . . , P(,) and yo, . . . , yM) are almost impossible to interpret di- rectly. We have created a graphical device that enables us to produce highly interpretable results. For example, we can plot the expected value of (and confidence intervals for) the probability of conflict by one or two explanatory variables, while holding the remainder constant at chosen values. Of course, since neural networks allow estimation of different effects for dif- ferent observations, the values held constant are criti- cal features of interpretation. The identical methods can be used with regression models but are not needed because the effect parameters are constant, and so the whole functional relationship can be easily summarized with a single number. We elaborate on these methods of interpretation later.
Of course, in practice, interpretation is a problem for any statistical model beyond the very simple linear additive setup. That is why we introduce several graph- ical procedures for interpreting the results of neural networks.
Possible Objections to Neural Networks
Neural networks come with considerable baggage; some criticism is deserved, some not. Before going into
There are theoretical results that can help with overfitting. For example, Neal (1996) proves that a Bayesian neural network can use an infinite number of logit curves without causing improper behavior in the output function, provided that the prior variances are properly scaled. He suggests one should choose the most complicated model that is computationally feasible (the largest possible M) and scale the variance of the priors so that it is related to model complexity. This way, one has a model capable of extracting as much information as possible, but the data are taxed to the same degree. Unfortunately, this requires use of extremely time-consuming computational algo- rithms, as discussed in the Appendix.
Validation with training and test sets can be improved in theory with such techniques as cross-validation, which breaks the data set into all possible splits. In practice, most users keep a single test set aside.
a detailed analysis using neural nets in the study of conflict, it would be helpful to put to rest a few issues that may come to mind when the term "neural net- works" is used.
First, neural networks are sometimes treated as a black box for classifying very complex data patterns in the absence of theory (e.g., handwriting recognition). In contrast, we hypothesize that for international con- flict data there are massive nonlinear interactive ef- fects, and only the confluence of many causal factors leads to a nontrivial increase in the probability of war. This allows us to interpret the output of the model in a way that is useful for the international relations scholar, not simply as a black box that does a good job of classifying which observations are more or less likely to be conflictual.
Second, why neural networks? Would simpler and more well-known interactive methods work better? The answer is no. Linear or logit models can include multiplicative interactions, but these have not worked well in practice. Even bivariate multiplicative interac- tions have not performed well because of multicolin- earity. Our evidence indicates that interactions in international conflict are considerably complicated. We need a method that can deal with massively nonadditive interactions, not one that can be grudg- ingly "tricked" into allowing for a few simple interac- tions.
Third, early research in neural networks stressed nonstatistical pattern recognition, but we rely on more recent work that puts neural networks on a firm statistical foundation. We use more complex variants of well-known statistical models, and they come with all the standard apparatus for validating and comparing models and avoiding unnecessarily complex specifica- tions. If our conjecture is false, and simple logit performs as well as complex neural net models, then the in-sample and especially the out-of-sample fore- casts will clearly indicate this. The statistical basis of our work means we need not fear that neural nets are just very good at picking up in-sample idiosyncrasies in the data.9
Fourth, we guard against overfitting by relying ex- tensively on out-of-sample forecasts to validate our models. If neural nets do not detect "real" properties of conflict data, merely idiosyncratic patterns, then they will yield good in-sample but poor out-of-sample forecasts. Many of the problems associated with early nonstatistical neural network models can be avoided by using only models with a firm statistical basis and then evaluating the performance of all models with out-of- sample forecasts.
In brief, neural nets have a venerable history with
9 The simple logit is not formally nested within the neural nets we use, but in the data analysis presented below, the forecasting performance of the neural network is so overwhelmingly superior that any criteria for discriminating between nonnested alternatives would clearly choose it over the logit. This does not imply the choice of neural network specification, or any other statistical specification, is a purely mechanical task. Art is involved in any model choice, and no less so in the choice of a particular neural net specification. But the out-of-sample forecast test guards against being "too artful."

Improving Quantitative Studies of International Conflict: A Conjecture March 2000
numerous success stories. Many criticisms apply to the early nonstatistical variants. Modern neural nets are as firm a part of statistics as are its simpler variants, starting with the logit. As long. as we use techniques that allow empirical work to discern whether the additional complexity is both necessary and useful, there should be no reason to fear and much to gain from the newer, more sophisticated, methods.
FORECASTING AND EXPLAINING POSTWAR CONFLICT In this section we discuss the data and model, forecast- ing performance, and causal structure in the model results.
Data and Model In order to test our conjecture, we use the standard dyad-year design, with the same data and variables employed repeatedly in the scholarly literature. This eliminates the possibility that the improved perfor- mance of our model is due to better data. For similar reasons, we limit ourselves to politically relevant dyads (PRDs), that is, pairs of essentially contiguous states or with at least one major power, on the grounds that non-PRDs are unlikely to engage in militarized con- flict. We thus focus on the harder test of finding variable effects among this more selected homoge- neous set of dyads.
Specifically, we use data compiled by Richard Tucker (1997) from a variety of sources.lO The set contains 23,529 dyad-years between 1947 and 1989. The dependent variable is coded one for dyad-years with a new "militarized interstate dispute" (MID), zero otherwise (Gochman and Maoz 1984; Jones, Bremer, and Singer 1996), with years of MID after onset dropped. MIDs are rare, occurring in only 976 (4.1%) of dyad-years.
The explanatory variables include dummies for whether the dyad contains geographically contiguous countries (Contiguous) and is allied in defense pacts, neutrality pacts, or ententes (Ally). The similarity of state preferences between two partners (Similarity) is measured, as usual, by the resemblance in their alliance portfolios. The similarity data we use here are from Tucker (1999) and are based on a measure developed by Signorino and Ritter (1999); the measure runs from -1 to 1, where 1 indicates maximal alliance portfolio similarity. The imbalance of power within the dyad (Asymmetry) is measured by the Ray and Singer (1973) index of relative capabilities of the dyadic partners. It is continuous, ranging from 0 to 1; 1 indicates that all military capability is held by one partner, whereas 0 indicates an exact division between the two.
The key variable in many conflict studies is the degree of democratization of the dyad. We use a slightly updated measure from the Polity I11 (Jaggers and Gurr 1996) data set. As is common, we measure
lo The measures are more fully described in the Appendix. The data set is archived on the APSR web site.
each partner's democracy by the difference between its "democracy~' and "autocracy" scores. This differenced measure ranges from -10 (extreme autocracy) to +I0 (maximal democracy). Conflict scholars have debated about the proper way to construct a single dyadic democracy index from the two measured democracy scores, but it is easy enough to enter both (Dem a and Dem b) into the analysis.ll
Finally, we use the number of years since the last conflict (Peace Years) as a measure of temporal depen- dence (Beck, Katz, and Tucker 1998). This variable controls for the possibility that conflict is more likely to erupt after previous disputes than after a long period of peace. As Beck, Katz, and Tucker show, the addition of this variable turns an ordinary logit analysis into a grouped proportional hazard model.12
We divided the data into an in-sample training set, 1947-85, which we use to fit the model, and a test/ validation set, 1986-89, which was used only once to evaluate the forecasts. We fit the neural network model in equation 3 to the training set. Without looking at the test set, we experimented with setting M to various values. We did this by putting aside different portions of the 1947-85 data and trying different values of M (in the spirit of cross-validation). Only after we completed this testing did we look at the 1986-89 data.13 We also fit a standard logit model to the training set for comparison.
We found that an M set around 25 provided about the right level of flexibility and predictability for our data (see the Appendix). This seemingly large value is counterbalanced by our priors, which favor small val- ues for all parameters. This means the model in total is a very flexible functional form that heavily favors smooth curves with few bends. Deviations from this smoothness only occur when the data provide clear evidence to the contrary. That is, unlike logit models and other low-dimensional parametric forms, when the data speak loudly enough, the fit responds.
l1 For each observation, we randomly assign A to one dyadic partner and B to the other, which is consistent with the hypothesized symmetric effect (and confirmed by our empirical analyses). The traditional approach of creating a single index similarly treats the two countries as symmetric and exchangeable. For simplicity of presen- tation, we chose not to do this for asymmetry as well, although it would be a reasonable approach to explore. l2 For most complicated maximum likelihood models, such as for duration or count data, neural nets can be used to replace the simple specification that the underlying mean is a linear function of the data with one that the mean is a massively interactive function of the data. As of now, no off-the-shelf software can do this, but programming these more complicated models is straightfonvard if nontrivial. We focus here only on the binary outcome case. l3 The 1947-85 data were randomly divided into training and test sets of equal size. The random split was possible because the peace years variable induced conditional temporal independence. As a further check on the choice of M, the pre-1986 data were split again, and the choice of M was rechecked and validated with the new test set. We chose to do final validation on the data split temporally, that is, the last four years of the data set, to provide a tougher test for the neural net forecasts. The use of this hold-out set also makes our validation look more like a true forecasting exercise.

American Political Science Review Vol. 94, No. 1
TABLE 1. Logit and Neural Network Forecasting Performance Conflict: % Correct Number Peace: % Correct Number
Year Loait N N of 1s Loait N N of 0s 1947-85 0 25.3 892 100 99.58 20,155 1986 0 18.5 27 100 99.83 584 1987 0 14.3 28 100 98.98 587 1988 0 23.1 13 100 99.34 609 1989 0 12.5 16 100 99.51 61 8 1986-89 0 16.7 84 100 99.42 2,398 Total 0 24.6 976 100 99.57 22,553
Forecasts
Table 1 gives one view of the comparative forecasting performance of the logit and neural network (NN) models. In the table, we divide the forecasts into conflict (1) and peace (0). The left-hand portion reports success at forecasting conflict when it occurred, and the right- hand portion gives success at forecasting no conflict when there was none. As is clear, since the logit model never forecasts that a conflict will occur in any one dyad (i.e., the probability never reaches 0.50), it forecasts incorrectly for all the cases of conflict and correctly for all the cases of peace.14 This is no great success, of course, since the optimistic claim that conflict will never occur is correct 96% of the time!
The table indicates that the neural network model performs substantially better than the logit, using the identical set of explanatory variables. It is nearly as good as the logit at predicting peace, with all probabilities exceeding 99% correct. More important, when military conflict occurs, the neural network model makes a successful forecast 16.7% of the time. This is not high in an absolute sense, but it is much better than the logit success rate of zero. Given the high costs of military conflict and the tremendous benefits of knowing ahead of time when a war will occur, this improved forecasting performance could be of significant policy value. More significant, from our perspective, is that the model's forecasting performance confirms a durable causal struc- ture. The relatively high percentage of successful predic- tions is within a reasonably narrow range, from 12.5% to 23.1%, for each of the four out-of-sample years, which further confirms the overall result with separate, al- though not independent, observable implications. Fur- thermore, most of these figures are lower than their fit to the training set, which is as it should be if we expect not only structure but also change in the real world. The model predicts 25.3% of conflicts correctly in-sample but only 16.7% correctly out-of-sample, which indicates ei-
l4 If the costs of misclassifying wars versus peace differ, then decision theory indicates that one should merely change the threshold of prediction from the 0.50 that is used here and in virtually all the literature. But that would merely increase the predictions of 1 and correspondingly decrease the predictions of 0 with no other changes in the statistical model and/or interpretation, so we retain the traditional 0.50 cutoff. Figure 1, below, demonstrates that the neural net, but not the logit, fits well for any chosen threshold. The 0.50 threshold seems the most appropriate to us, but none of our comparisons depend on it, and there is no choice of threshold that would make the logit's performance close to the performance of the neural net.
ther slight overfitting (the difference is just outside the 95% confidence interval) or change in the real world after 1985.15
Table 1 demonstrates that the neural network model discriminates far better than the logit model by assigning very different probabilities of international conflict to the available dyads. It does not indicate whether either model's probability values are correct except for above and below the 0.50 mark. For example, if we observe 1,000 dyads with a 0.10 probability of going to war, none of these individual pairs would be predicted to fight, but we would expect to see 100 wars from somewhere in the set. We now evaluate the extent to which the two model's predic- tions have this desirable characteristic.
We begin by computing predicted probabilities for each dyad from the logit and neural network models. We then sort these into bins of 0.1 width: [O, 0.1), [0.1, 0.2), . . . , [0.9, 11. Within each bin, we compute the mean predicted probability (which presumably will be near its respective midpoint) as well as the observed fraction of 1s in each bin. We compare the two to check the fit of the model in the training set and to evaluate the forecasts in the test set. Figure 1 plots these numbers for both statistical models.
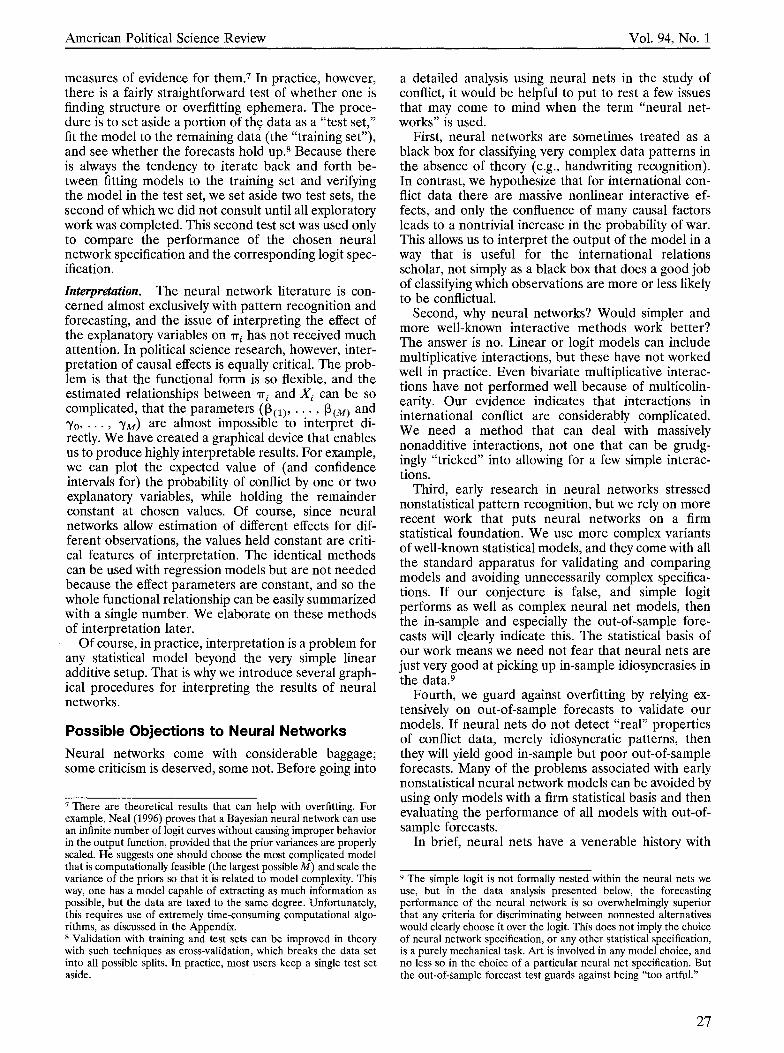
The in-sample graph in Figure 1 shows that the predicted probabilities and observed fraction of con- flict match fairly closely for the neural network model. The logit model is reasonably close as well when the mean probability is 0.25 or less, but it does much worse for higher (i.e., more interesting) pre- dicted probabilities. This is especially important from our perspective: The logit model not only predicts peace breaking out all over but also becomes more inaccurate as the probability of conflict increases, even though these cases are very rare.16 In contrast,
l5 The logit model is the standard in international relations, but it is interesting to compare our results to that of a GAM. Using identical explanatory variables, the GAM forecast slightly better than logit but much worse than a neural network. Using the same comparisons as in Table 1, the GAM correctly predicted 5.6% of all in-sample disputes (and 99.9% of all nondisputes). Similarly, the GAM equivalent of Figure 1 showed performance that was slightly better than the logit but much worse than the neural network.
The one possible exception is the last mean probability bin for the logit, which has very few observations, so the fraction of conflicts has much higher sampling variability. (We chose not to add error bars for each point so that the graphs are easier to read; the precision with which each point is estimated is higher at the left than the right of the graph.)
Improving Quantitative Studies of International Conflict: A Conjecture March 2000
FIGURE 1. Logit and Neural Network (NN) Probabilities versus Actual Outcomes
In-Sample (1 947-85) 1
Forecast (1 986-89) 1
Mean Prob(y = 1)
Note: Probabilities from each model are sorted into bins 0.1 wide (0, 0.1: 0.1, 0.2, . . . ) and averaged. These averages are plotted horizontally and the actual fraction of ones in the bin are plotted vertically. A line for a model that fits the data will differ from the (dotted) 45 degree line only by random chance. In both the in-sample graph (on the left) and the forecast out-of-sample graph (on the right), the fit is better for NN than logit, and, in addition, NN predictions exist for much higher probability bins than logit predictions.
when the neural network model gives a probability, it is a reasonably accurate assessment of the odds of a conflict occurring within the sample. Of course, an equally important difference between the two models is the much more acute discriminatory power of the neural network model, which we can see because the logit never yields any predicted probability of conflict above 0.50.
Whereas the in-sample graph in Figure 1 evaluates the fit of the two models to the same data, the out-of-sample graph uses the same technique to evaluate forecasting success. Again, there is a reasonably close correspon- dence between the estimated probabilities and observed fraction of conflict for both models. They track each other very well for the lower probability bins, indicating the same high level of success. (The fact that the logit model did not fit well to the last two points in-sample but did fit the out-of-sample plot seems to be a lucky coincidence.) More interesting is that whereas the logit model has no forecasts in the high-probability region, the neural network model tracks the observed fractions reasonably well even for the sparsely populated high probability bins. One possible problem is the noticeable overestimation of conflict for the neural network model in this high-probability region (which indicates that our forecasts could be improved), but the observed numbers are both fairly small and not that far off.
We believe these forecasts are quite solid, and al- though many uncertainties remain, they seem to be far better than any previously produced. They are also more accurate than many scholars thought would be possible. This clearly indicates that the neural net model we use is superior to the logit model in our data.
Causal Structure We believe our model reveals clear evidence of structure in international conflict data. This evidence is consistent with that predicted by our conjecture about models of conflict.
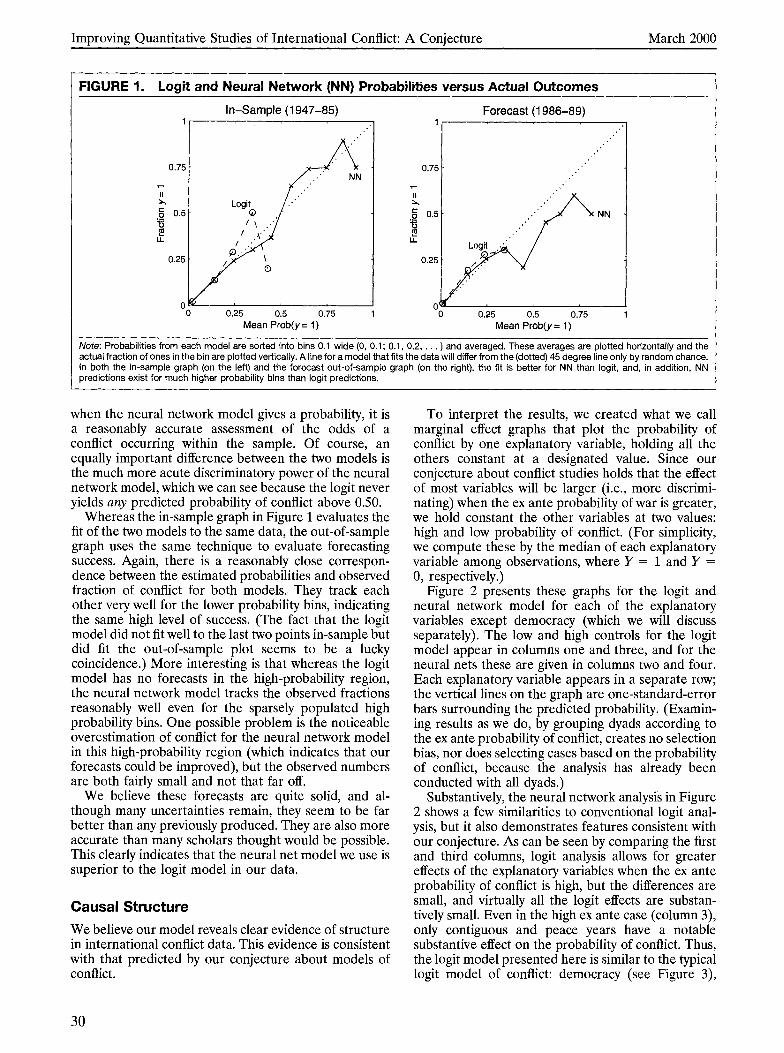
To interpret the results, we created what we call marginal effect graphs that plot the probability of conflict by one explanatory variable, holding all the others constant at a designated value. Since our conjecture about conflict studies holds that the effect of most variables will be larger (i.e., more discrimi- nating) when the ex ante probability of war is greater, we hold constant the other variables at two values: high and low probability of conflict. (For simplicity, we compute these by the median of each explanatory variable among observations, where Y = 1 and Y = 0, respectively.)
Figure 2 presents these graphs for the logit and neural network model for each of the explanatory variables except democracy (which we will discuss separately). The low and high controls for the logit model appear in columns one and three, and for the neural nets these are given in columns two and four. Each explanatory variable appears in a separate row; the vertical lines on the graph are one-standard-error bars surrounding the predicted probability. (Examin- ing results as we do, by grouping dyads according to the ex ante probability of conflict, creates no selection bias, nor does selecting cases based on the probability of conflict, because the analysis has already been conducted with all dyads.)
Substantively, the neural network analysis in Figure 2 shows a few similarities to conventional logit anal- ysis, but it also demonstrates features consistent with our conjecture. As can be seen by comparing the first and third columns, logit analysis allows for greater effects of the explanatory variables when the ex ante probability of conflict is high, but the differences are small, and virtually all the logit effects are substan- tively small. Even in the high ex ante case (column 3), only contiguous and peace years have a notable substantive effect on the probability of conflict. Thus, the logit model presented here is similar to the typical logit model of conflict: democracy (see Figure 3),

American Political Science Review Vol. 94, No. 1
FIGURE 2. Marginal Effects of Explanatory Variables, 1947-85
Logit-Low . Neural Net-Low Logit-High
0.4
0.2 :I_ / 0.5
Neural Net-High
0 0.5 1
Contiguous Contiguous Contiguous Contiguous
0 0.5 1
Ally 0 0.5 1
Ally Ally Ally
0.6
0.4
0.2
2 ~,i -1 4.5 Similarity 0 0.5 1
I
0.8
0.6
0.4
0.2
0 -1 -0.5 0 0.5 1
Similarity Similarity Similarity
0 0.5 1
Asymmetry Asymmeby Asymmetry Asymmetry
0 10 20 30 40
Peace Years Peace Years Peace Years Peace Years
Vote: Each graph gives the probability of a military conflict (vertically) by a single variable horizontally, with other variables not represented in each graph ield constant at designated values that govern high or low ex ante probabilities of conflict. Note how the effects are much larger for the neural network :han logit columns, and especially large for high ex ante probability of conflict dyads under neural networks.
contiguity, and peace years have statistically significant, though substantively small, effects on conflict, whereas the other variables have statistically insignificant (or marginally significant) and very small substantive influ- ence.
In contrast, the neural network model produces much larger changes in the effect of any variable as we move from a low to a high ex ante probability of conflict (compare the second and fourth columns). This is
particularly obvious for some of what normally might be considered "control" variables. For example, con- tiguity has a strong effect on the probability of a dispute in the logit analysis, but this effect is more than doubled for the high-probability case in the neural network analysis. The effect of contiguity is so strong that it is not hidden by the logit analysis, but allowing for complex interactions shows that it has the extremely strong influence that we would expect but

Improving Quantitative Studies of International Conflict: A Coniecture March 2000
that previous researchers were unable to demonstrate. The neural network analysis also reveals the impor-
tance of duration dependence (peace years) when the ex ante probability of a dispute is high. Although the logit analysis finds some evidence of this dependence, it is quite modest. For high ex ante probability of war situations, with a conflict occurred last year, the prob- ability of another under logit analysis is less than 0.25, compared to almost 0.80 under neural network analy- sis. It takes about a decade for this probability to recede to nearly zero. Clearly, both analyses give a similar pattern of decay, but the more flexible NN gives a much higher maximum probability of a dispute. The effect of the duration of peace on the probability of a dispute is clearly underestimated in the logit analysis. Duration dependence is sufficiently strong to emerge in the logit analysis to some degree, but the lack of interactions in that model does not allow us to discern how critical time is in forecasting future disputes.
NN also reveals that two important determinants of disputes, similarity and asymmetry, have a very strong but nonmonotonic effect on probability. The logit analysis assumes that all effects are monotonic and so cannot detect these kinds of relationships. The NN analysis reveals a stronger and more complex associa- tion between these variables and conflict.l7
Our findings of nonmonotonic effects are consistent with the more game-theoretic studies of Bueno de Mesquita and Lalman (1992) and Signorino (1999). Both similarity and asymmetry are the two standard measures of the benefits and costs of conflict. For example, these theories assume that as one side ac- quires comparatively more military capability, the probability of conflict will rise and then fall, but no logit model in the literature or here supports this claim for either asymmetry or similarity, or even indicates that either has results of any kind of important size. In contrast, the NN results reveal both are very important in high ex ante probability dyads in just the manner predicted by theory. Indeed, in the high ex ante prob- ability dyads, a large change in either similarity or asymmetry can increase or decrease the probability of conflict by more than 50 points.
Finally, NN models show a clear influence of dyadic democracy on the probability of conflict. The logit analysis, which averages effects over all dyads, shows a small but significant pacific effect of democracy. The linear nature of the logit model requires that the effects of each partner's democracy scores be additive. The
l7 AS a diagnostic, we also applied generalized additive models to the data. GAMs reveal nonmonotonic effects for these two variables, but their influence, which is averaged over all cases, is substantively much smaller than the effects found by the neural net for the high ex ante probability cases. Furthermore, the GAM effects, which are the "average" of the NN effects over all combinations of the other independent variables, are dissimilar to the NN effects shown. This must be the case if the NN effects at the differing combinations of the independent variables are different; the GAM cannot accommodate this. Of course, logit models can be "tricked" into allowing for nonmonotonicities, although these must be specified in advance. As with linear regression, in practice it is hard to get good logit estimates of nonmonotonic effects because of multicolinearity and the arbi- trariness of nonmonotonic specifications.
contour plots implied by the NN model, given in Figure 3, show that the pacific effect of democracy is nil when the ex ante probability of conflict is low but is strong when the probability is high. In the latter case, the maximal influence of a movement on the democracy scale is about 40 points, much larger than any effect found in the logit analysis. The nonmonotonicity and nonadditivity allowed by the NN model reveals that the pacific effects are strongest when both partners score high on the democracy scale and are much smaller substantively in the rest of the plot. Interestingly, the most quarrelsome dyads are those in which both part- ners have a middling democracy score.18
Dyads containing an extreme autocracy are more likely to fight than are very democratic dyads, but they are less likely to fight than dyads with middling democ- racy. This effect is found only in the NN analysis, which both allows for massive interactions and nonmonotonic effects of individual variables. In other words, democ- racy does have pacific effects, but only among dyads that are otherwise likely to be conflictual and only among the most democratic nations. A portion of that effect is strong enough to emerge even in the logit model, which averages small and large effects, but its substantial influence is seen only in the NN analysis. Thus, democratic peace theorists such as Maoz and Russett (1994) appear to be right, although they heavily underestimate the pacific effect when democ- racy is important and overestimate it in cases in which democracy matters little.
The simple plots we provide here cannot, of course, demonstrate the full structure of the neural network or its power. That is more clearly shown in its ability to forecast disputes much better than any linear or addi- tive analysis. Yet, these plots do show that our results are stronger than those found by more standard meth- ods and that neural nets can find contingent causal structures missed by the simpler, uncontingent, logit model.
CONCLUDING REMARKS
We have proposed a simple conjecture that appears to explain a significant and well-known problem with international conflict studies. The conjecture is consis- tent with a variety of implications we can observe from the literature. It also suggests a set of specific problems with the most common statistical model used in the field. To evaluate our conjecture, we adapted a statis- tical model that better matches the features of our conjecture and, as a consequence, the substantive concerns of quantitative and qualitative researchers. The result is a superior statistical model of interna- tional conflict. It appears to be the only large-N statistical model that estimates the probability of any international conflict at some level higher than 0.50
1s In the postwar data there are relatively few dyads in the interior of the plot. Therefore, the confidence intervals, which would be difficult to show in this type of graph, are much wider in the middle region. Since the confidence intervals for Figure 3 are a function of several model parameters, they would be most easily computed using the simulation technique described in King, Tomz, and Wittenberg 2000.

American Political Science Review Vol. 94, No. 1
FIGURE 3. Marginal Effects of Democracy: 1947-85
Logit-Low Neural Net-Low
0 Dem a
Logit-High
-1 0 -5 0 5 10 Dem a
Dem a
Neural Net-High
Dem a
(ours exceeds 0.90 for some cases). We are able to predict about 17% of conflicts from data on the years prior to the conflict.
This forecasting result can only be driven by an underlying structure of international politics that stays relatively stable over time. Confirming the existence of and understanding this structure has been a holy grail in quantitative conflict studies, and we believe our neural network approach represents progress toward this goal. Along with the graphical tools we introduce, these models may have the potential to uncover struc- ture in other areas.
Neural networks are computationally and intellectu- ally complex, but they are no more than extensions of standard interactive models. While early neural net- work research often seemed to overfit the data, new Bayesian analysis can surmount much of that problem. It seems unlikely that the effect of any variable com- monly used in the field is completely independent of the levels of other variables, as standard approaches
assume. Neural networks are designed to unlock such complicated structures. There is no question that they do a wonderful job of recognizing patterns in other disciplines, but they also can find complicated struc- tural regularities in standard international relations conflict data.
APPENDIX: BAYESIAN METHODS FOR NEURAL NETWORK MODELS
The Model The basic neural network model we estimate is given in equation 3. To it we add a standard Bayesian setup to shrink the parameter space.19 We do this by adding two levels of hierarchy. First, we assume independent normal distributions N(0, l/a,) for each group of the parameters (and hence the
l9 The explanatory variables are normalized before being input to the neural net to improve computational accuracy. All interpretations in this articIe are based on the original, unnormalized measures.

Improving Quantitative Studies of International Conflict: A Conjecture March 2000
index h) , with one for the constant terms p,, one for each element of p other than p,, and one for the set of elements of y. In addition, for each of the a, elements, which control how strongly any parameter is influenced by its prior to be small, we assume an (uninformative) improper uniform prior distribution (which is one way of expressing a degree of igno- rance or uncertainty about which values are more or less likely).
As discussed in the text, we select M in the model by comparing the test set performance of models with different M's. M should be large enough for the model to be ade- quately complex and is theoretically unrestricted in mag- nitude in the Bayesian setting. In the interest of model parsimony and computational efficiencylfeasibility, we follow the general practice of searching for the smallest possible M that gives satisfactory performance and restricting the total number of parameters in the resulting model (M(k + 2) + 1, where k is the number of independent variables) to not exceed n/10. To this end we experimented with M set at 5,10, 15, 20, 25, 30, 35, 40, 50.20 Since the testhalidation set performance of models with M around 25 was obviously better than around 20, and an M larger than 25 did not yield significant improvement, we set M at 25.21
The Posterior Distribution of the Parameters By Bayes's theorem, the posterior distribution is, of course, the product of the prior distributions and the likelihood function:
where IT^, the probability of conflict, is defined in the second and third lines of equation 3.22
Ideally, we would be able to draw random samples of y, P, and a directly from this posterior distribution to compute quantities of interest. Indeed, this has been accomplished with a hybrid version of Markov Chain Monte Carlo (MCMC) methods (Neal 1996). Yet, runs that provide exact draws from the posterior with MCMC methods take an inordinately long time to complete. The method also has all the usual problems caused by a lack of agreement on how to assess stochastic convergence in MCMC algorithms.
After trying Neal's approach, we felt that more time to experiment with different specifications to understand the data was necessary, so we adopted the normal approximation
20 Estimation was via the EM algorithm that alternates the error function minimization with respect to y and P given or, and the value updating of or,, given y and P. Optimization used conjugate gradients, with initial weights randomized and all training data (no noise added to inputs) presented in a batch. The cutoff criterion for the training process was an error tolerance of 0.00001. 21 Given our large sample size, this seemingly large M actually yields a ratio of parameters to data points that is smaller than typical and considerably smaller once we take into account the prior. 22 Note that the model is technically unidentified, although in an inconsequential manner. Switching y, with y, and &,)with P(, yields identical values for mi. This causes no problems for our computation of the various marginal effects of the independent variables. It could cause problems in applying standard optimization algorithms, but computationally efficient techniques that have been developed to evaluate the gradient work well despite this problem (Bishop 1995, 141).
approach (MacKay 1992a, 1992b, 1992c, 1994).23 It approx- imates the posterior distribution of the model parameters as multivariate normal, which makes analytic solutions possible. As in standard maximum likelihood estimation, the variance matrix of the parameter estimates is found by inverting the He~sian. '~
Posterior Probabilities of Conflict One of our goals is to generate forecasts of international conflict. The other is to see how these forecasts would change in accord with various configurations of the explanatory variables,Xi. For both goals, we need to specify the posterior probability of the forecasts.
Conceptually, computing the forecast posterior is simple and in principle can be accomplished by the usual simulation methods that apply to virtually every other statistical model (see King, Tomz, and Wittenberg 2000). That is, draw random samples of P, y, and a from their posterior distribu- tion in equation 4 (or their asymptotic normal approxima- tion), insert them into the functional form in the second and third lines of equation 3 to compute T,, and take a random draw from a Bernoulli distribution with this parameter (the first line of equation 3). In practice, we use MacKay7s (1994) faster analytical approximations to accomplish the same task.
The Data The data set used here was provided by Richard Tucker (1997), and corresponds to the data used in Beck and Tucker (1998). The data set consists of observations on PRDs from 1947-89 (or a shorter period if earlier data was either not available or the dyad became a PRD after 1947, usually because one partner became independent later than 1947). The peace years variable until the first dispute was coded as the time since a dyad became a PRD, that is, the first year a dyad was at risk of a dispute was the year it became a PRD. Dyads that involved a major power in a region in which it had little or no interest (e.g., China in Latin America) were excluded; operational rules for this exclusion are in Tucker (1997). Note that excluding these dyads affects the affinity measure. These coding rules yielded 23,529 dyad-years. Both alliance data (for the similarity measure) and national capa- bilities data (for the asymmetry measure) were taken from data sets created by the Correlates of War project; this project also defined the domain of nation states which were used to construct the PRDs. The actual alliance data were provided by J. David Singer; the capabilities data were from Singer and Small 1993 and the system membership data were taken from the Peace Science Society (International) web site (http://pss.la.psu.edu/DATARES.HTM).
23 The software we used to estimate the model ("Bigback5" by David MacKay) is available at http://wol.ra.phy.cam.ac.uk/mackay/bigback/ bigback5.tar.g~. 24 In view of current computational limitations, we feel that the normal approximation approach to Bayesian neural nets provides good performance and is, at present, more useful than the MCMC approach. But, of course, new computational breakthroughs may change matters, and users are encouraged to explore alternative methods as they become feasible.
REFERENCES Barbieri, Katherine. 1996. "Economic Interdependence-A Path to
Peace or a Source of Interstate Conflict." Journal of Peace Research 33 (1): 29-49.
Barron, A. ,R. 1993. "Universal Approximation Bounds for Superpo-

American Political Science Review Vol. 94, No. 1
sitions of a Sigrnoid Function." IEEE Transactions on Information Theory 39: 930-45.
Beck, Nathaniel, and Simon Jackrnan. 1998. "Beyond Linearity by Default: Generalized Additive Models." American Journal of Political Science 42 (2): 596-627.
Beck, Nathaniel, Jonathan Katz, and Richard Tucker. 1998. "Taking Time Seriously: Time-Series-Cross-Section Analysis with a Binary Dependent Variable." American Journal of Political Science 42 (4): 1260-88.
Beck, Nathaniel, and Richard Tucker. 1998. "Democracy and Peace: General Law or Limited Phenomenon?" Paper presented at the annual meeting of the Midwest Political Science Association, Chicago, April.
Bishop, C. M. 1995. Neural Networks for Pattern Recognition. Oxford: Oxford University Press.
Bremer, Stuart. 1992. "Dangerous Dyads: Conditions Affecting the Likelihood of Interstate War, 1816-1965." Journal of Conflict Resolution 36 (June): 309-41.
Bueno de Mesquita, Bruce. 1981. The War Trap. New Haven, (=T: Yale University Press.
Bueno de Mesquita, Bruce, and David Lalman. 1992. War and Reason: Domestic and International Imperatives. New Haven, CT: Yale Uni- versity Press.
Cheng, B., and D. M. Titterington. 1994. "Neural Networks: A Re- view from a Statistical Perspective." Statistical Science 9 (1): 2-54.
Eisinga, Rob, Philip Hans Franses, and Dick Van Dijk. 1998. "Timing of Vote Decisions in First and Second Order Dutch Elections 1978-1995: Evidence from Artificial Neural Networks." Political Analysis 7: 117-42.
Farber, Henry, and Joanne Gowa. 1998. "Building Bridges Abroad." Journal of Conflict Resolution 41 (3): 455-6.
Gallant, A. Ronald. 1981. "On the Bias in Flexible Functional Forms and an Essentially Unbiased Form: The Fourier Flexible Form." Journal of Economebics 15 (2): 211-45.
Geller, Daniel S., and J. David Singer. 1998. Nations at War: A Scientific Study of International Conflict. New York: Cambridge University Press.
Gochman, Charles S., and Zeev Maoz. 1984. "Militarized Interstate Disputes 1816-1976." Journal of Conflct Resolution 28 (4): 585-615.
Hertz, John, Anders Krogh, and Richard Palmer. 1991. Introduction to the Theory of Neural Computation. Reading, MA: Addison- Wesley.
Holland, John. 1998. Emergence: From Chaos to Order. Reading, IvlA: Addison-Wesley.
Hornik, Kurt. 1990. "Approximation Capabilities of Multilayer Feed- forward Networks." Neural Networks 4 (2): 251-7.
Jaggers, Keith, and Ted Robert Gurr. 1996. Polity 111: Regime Change and Political Authority, 1800-1994 (computer file) (Study #6695). 2d ICPSR version. Boulder, CO: Keith JaggerdCollege Park, MD: Ted Robert Gurr [producers], 1995. Ann Arbor, MI: Inter- university Consortium for Political and Social Research [distrib- utor].
Jones, Daniel M., Stuart Bremer, and J. David Singer. 1996. "Mili- tarized Interstate Disputes, 1816-1992: Rationale, Coding Rules, and Empirical Patterns." Conflict Management and Peace Science 15 (2): 163-213.
King, Gary. 1989. "Event Count Models for International Relations: Generalizations and Applications." International Studies Quarterly 33 (2): 123-47.
King, Gary, and Christopher Murray. 2000. "Rethinking Human Security." Harvard University. Typescript.
King, Gary, Michael T o m , and Jason Wittenberg. 2000. "Making the Most of Statistical Analysis: Improving Interpretation and Presen- tation." American Journal of Political Science 44 (April): 341-55.
King, Gary, and Langche Zeng. 1999. "Logistic Regression in Rare Events Data." Paper presented at the annual meeting of the American Political Science Association, Atlanta, September. (http://GKing.Harvard.edu.)
Kuan, C. M., and Halbert White. 1994. "Artificial Neural Networks: An Econometric Perspective." Econometric Reviews 13 (1): 1-91.
Levy, Jack S. 1989. "The Causes of War: A Review of Theories and Evidence." In Behavior, Society, and Nuclear War, vol. 1, ed. Phillip E. Tetlock, Jo L. Husbands, Robert Jervis, Paul C. Stern, and Charles Tilly. New York and Oxford: Oxford University Press. Pp. 2120-333.
MacKay, D. J. C. 1992a. "Bayesian Interpolation." Neural Computa- tion 4 (3): 415-47.
MacKay, D. J. C. 1992b. "A Practical Bayesian Framework for Backprop Networks." Neural Computation 4 (3): 448-72.
MacKay, D. J. C. 1992c. "The Evidence Framework Applied to Classification Networks." Neural Computation 4 (5): 698-714.
MacKay, D. J. C. 1994. "Bayesian Methods for Backpropagation Networks." In Models of Neural Networks, vol. 111, chap. 6, ed. Etan Domany, J. L. van Hemmen, and Klaus Schulten. New York: Springer-Verlag. Pp. 211-54.
Mansfield, Edward D., and James Snyder. 1997. "A Tale of Two Democratic Peace Critiques: A Reply to Thompson and Tucker." Journal of Conflict Resolution 41 (3): 457-61.
Maoz, Zeev. 1996. Domestic Sources of Global Change. Ann Arbor: University of Michigan Press.
Maoz, Zeev, and Bruce Russett. 1993. "Normative and Structural Causes of Democratic Peace: 1946-1986." American Political Science Review 87 (September): 639-56.
Muller, Berndt, and Joachim Reinhardt. 1990. Neural Networks: An Introduction. Berlin: Springer-Verlag.
Nagler, Jonathan. 1991. "The Effect of Registration Laws and Education on U.S. Voter Turnout." American Political Science Review 85 (December): 1393-1405.
Neal, R. M. 1996. Bayesian Learning for Neural Networks. Berlin: Springer-Verlag.
Oneal, John R., and Bruce Russett. 1997. "The Classical Liberals Were Right: Democracy Interdependence, and Conflict, 1950- 1985." International Studies Quarterly 41 (2): 267-94.
Ray, James Lee, and J. David Singer. 1973. "Measuring the Concen- tration of Power in the International System." Sociological Meth- ods and Research 1 (4): 403-37.
Richardson, Lewis Fry. 1960. Statistics of Deadly Quarrels, ed. Quincy Wright and C. C. Lienau. Pittsburgh: Boxwood.
Ripley, Brian D. 1996. Pattern Recognition and Neural Networks. New York: Cambridge University Press.
Rosenau, James N., ed. 1976. In Search of Global Patterns. New York: Free Press.
Rumelhart, D. E., James L. McClelland, and the PDP Research Group. 1986. Parallel Distributed Processing: Explorations in the Microstructure of Cognition. Cambridge, MA: MIT Press.
Schrodt, Philip. 1995. "Patterns, Rules and Learning: Computational Models of International Behavior." Unpublished manuscript avail- able at http://polmeth.calpoly.edu.
Signorino, Curtis. 1999. "Strategic Interaction and the Statistical Analysis of International Conflict." American Political Science Review 93 (June): 279-98.
Signorino, Curtis, and J. M. Ritter. 1999. "Tau-b or Not Tau-b: Measuring the Similarity of Foreign Policy Positions." Interna- tional Studies Quarterly 43 (1): 115-44.
Singer, J. David, and Melvin Small. 1993. National Material Capabil- ities Data, 1816-1985 (computer file) (Study #9903). Ann Arbor, MI: J. David Singer, University of Michigan, and Melvin Small, Detroit, MI: Wayne State University [producers], 1990. Ann Arbor, MI: Inter-University Consortium for Political and Social Research [distributor].
Smith, Alastair. 1998. "A Summary of Political Selection: The Effect of Strategic Choice on the Escalation of International Crises." American Journal of Political Science 42 (2): 698-701.
Thompson, William R., and Richard M. Tucker. 1997. "A Tale of Two Democratic Peace Critiques." Journal of Conflict Resolution 41 (3): 428-54.
Tucker, Richard. 1997. "Dyad-Hard: The Interstate Dyad-Year Dataset Creator." Political Methodologist 8 (1): 28-9.
Tucker, Richard. 1999. "The Similarity of Alliance Portfolios." http://www.vanderbilt.edu/-rtucker/data/affinity/alliance/similar/.
Vasquez, John A. 1993. The War Puzzle. Cambridge and New York: Cambridge University Press.
White, Halbert. 1992. Artificial Neural Networks, Approximation and Learning Theory. Oxford, UK, and Cambridge, MA: Blackwell.
Zeng, Langche. 1999. "Prediction and Classification with Neural Network Models." Sociological Methods and Research 27 (4): 499-524.
Zeng, Langche. 2000. "Neural Network Models and Political Data Analysis," In Political Complexity: Nonlinear Models of Politics, ed. Diana Richards. Ann Arbor: University of Michigan Press. Pp. 239-68: