Embed Size (px)
Citation preview

Research Report
Agreement T2695, Task 68 Camber Prediction
Improving Predictions for Camber in Precast, Prestressed Concrete Bridge Girders
by
Michael A. Rosa John F. Stanton Marc O. Eberhard Bridge Engineer Professor Professor Department of Civil and Environmental Engineering University of Washington, Box 352700 Seattle, Washington 98195
Washington State Transportation Center (TRAC) University of Washington, Box 354802
University District Building 1107 NE 45th Street, Suite 535
Seattle, Washington 98105-4631
Washington State Department of Transportation Technical Monitor
Bijan Khaleghi Bridge Design Engineer
Prepared for
Washington State Transportation Commission Department of Transportation
and in cooperation with U.S. Department of Transportation
Federal Highway Administration
March 2007

TECHNICAL REPORT STANDARD TITLE PAGE
1. REPORT NO. 2. GOVERNMENT ACCESSION NO. 3. RECIPIENT'S CATALOG NO.
WA-RD 669.1
4. TITLE AND SUBTITLE 5. REPORT DATE
IMPROVING PREDICTIONS FOR CAMBER IN PRECAST, March 2007 PRESTRESSED CONCRETE BRIDGE GIRDERS 6. PERFORMING ORGANIZATION CODE
7. AUTHOR(S) 8. PERFORMING ORGANIZATION REPORT NO.
Michael A. Rosa, John F. Stanton, Marc O. Eberhard 9. PERFORMING ORGANIZATION NAME AND ADDRESS 10. WORK UNIT NO.
Washington State Transportation Center (TRAC)
University of Washington, Box 354802 11. CONTRACT OR GRANT NO.
University District Building; 1107 NE 45th Street, Suite 535 Agreement T2695, Task 68 Seattle, Washington 98105-4631 12. SPONSORING AGENCY NAME AND ADDRESS 13. TYPE OF REPORT AND PERIOD COVERED
Research Office Washington State Department of Transportation Transportation Building, MS 47372
Final Research Report
Olympia, Washington 98504-7372 14. SPONSORING AGENCY CODE
Kim Willoughby, Project Manager, 360-705-7978 15. SUPPLEMENTARY NOTES
This study was conducted in cooperation with the U.S. Department of Transportation and Federal Highway Administration. 16. ABSTRACT
This research was conducted to develop improved methods of predicting camber in prestressed concrete girders. A computer program was written to calculate camber as a function of time. It takes into account instantaneous and time-dependent behavior of the concrete and steel and performs the calculations in a series of time steps. It was calibrated by comparing its predictions with the camber from 146 girders, measured in the fabricators yard both after release and at a later time. Its long-term predictions were then compared with the responses of 91 girders that were monitored during construction at the Keys Road Bridge site.
The results showed that the response was sensitive to the predicted prestress losses, and that the 2006 AASHTO values for prestress loss provided much better estimates than did the 2004 provisions. In addition, the camber was found to depend on the elastic modulus of the concrete, its creep coefficient, and the use of the prestress losses in the calculation of the creep camber. To achieve the best match with the measured cambers, the AASHTO-recommended values for the elastic modulus and the creep coefficient had to be multiplied by adjustment factors and the prestress losses had to be taken into account when computing the creep component of camber.
17. KEY WORDS 18. DISTRIBUTION STATEMENT
Camber, deflection, girder, prestressed concrete, precast concrete, creep, shrinkage, elastic modulus
No restrictions. This document is available to the public through the National Technical Information Service, Springfield, VA 22616
19. SECURITY CLASSIF. (of this report) 20. SECURITY CLASSIF. (of this page) 21. NO. OF PAGES 22. PRICE
None None 134

DISCLAIMER
The contents of this report reflect the views of the authors, who are responsible
for the facts and the accuracy of the data presented herein. The contents do not
necessarily reflect the official views or policies of the Washington State Transportation
Commission, Washington State Department of Transportation, or Federal Highway
Administration. This report does not constitute a standard, specification, or regulation.
iii

iv

TABLE OF CONTENTS Chapter Page EXECUTIVE SUMMARY ..................................................................................... xi CHAPTER 1.INTRODUCTION............................................................................ 1 1.1 Context..................................................................................................... 1 1.2 Camber Prediction Challenges to WSDOT ............................................. 2 1.3 Research Objectives................................................................................. 2 1.4 Organization of Report ............................................................................ 3 CHAPTER 2. CAMBER PREDICTION METHODS ......................................... 5 2.1 Introduction.............................................................................................. 5 2.2 Concrete Compressive Strength............................................................... 5 2.3 Elastic Modulus ....................................................................................... 6 2.3.1 AASHTO LRFD Method................................................................ 6 2.3.2 ACI Committee 363 Method .......................................................... 6 2.3.3 NCHRP Report 496 Method........................................................... 7 2.3.4 CEB-FIP Method ............................................................................ 8 2.4 Shrinkage ................................................................................................. 8 2.5 Creep ........................................................................................................ 9 2.5.1 AASHTO LRFD Method................................................................ 10 2.5.2 Rate of Creep Theory...................................................................... 10 2.5.3 Branson Model................................................................................ 11 2.6 Prestress Losses ....................................................................................... 11 2.6.1 Elastic Shortening Loss................................................................... 13 2.6.2 Shrinkage Loss................................................................................ 15 2.6.3 Creep Loss ...................................................................................... 17 2.6.4 Relaxation Loss............................................................................... 18 2.7 Camber Calculations................................................................................ 19 2.7.1 Self-Weight Deflection ................................................................... 19 2.7.2 Prestress Deflection ........................................................................ 21 2.7.3 Uniform Dead Load Deflection ...................................................... 22 2.8 WSDOT Practice for Camber Prediction................................................. 22 CHAPTER 3. CAMBER PREDICTION PROGRAM......................................... 26 3.1 Introduction.............................................................................................. 26 3.2 Input ......................................................................................................... 26 3.3 Calculation Methods ................................................................................ 29 3.3.1 Concrete Compressive Strength...................................................... 29 3.3.2 Elastic Modulus .............................................................................. 29 3.3.3 Prestress Losses/Force .................................................................... 31 3.3.4 Deflections ...................................................................................... 32 3.4 Program Output........................................................................................ 34
v

CHAPTER 4. DETAILED CAMBER MONITORING—SNAKE LAKE GIRDERS ................................................................................................................. 37 4.1 Purpose..................................................................................................... 37 4.2 Girder Properties...................................................................................... 37 4.3 Data Collection Procedure ....................................................................... 38 4.4 Observed Behavior................................................................................... 40 CHAPTER 5. MATERIALS TESTING................................................................ 43 5.1 Purpose..................................................................................................... 43 5.2 Cylinder Transportation and Curing Procedures ..................................... 43 5.3 Concrete Compressive Strength............................................................... 45 5.4 Elastic Modulus ....................................................................................... 48 5.5 Shrinkage and Creep ................................................................................ 51 5.5.1 Shrinkage and Creep Preparation Protocol ..................................... 51 5.5.2 Creep Loading Procedure ............................................................... 53 5.5.3 Observed Shrinkage Behavior ........................................................ 56 5.5.4 Observed Creep Behavior ............................................................... 58 CHAPTER 6. FIELD CAMBER MONITORING—KEYS ROAD GIRDERS 63 6.1 Purpose..................................................................................................... 63 6.2 Girder Properties...................................................................................... 63 6.3 Data Collection Procedure ....................................................................... 66 6.4 Errors and Data Processing...................................................................... 70 6.5 Observed Behavior................................................................................... 73 6.5.1 Effect of Actual Concrete Strength................................................. 75 6.5.2 Camber Changes at Release of Temporary Strands........................ 76 6.5.3 Camber Changes Due to Casting of the Deck ................................ 77 6.5.4 Camber Changes after Deck Placement.......................................... 78 6.5.5 Structural Model for Calculating Camber Changes........................ 79 CHAPTER 7. END RESTRAINT/ROLLER TESTING ..................................... 83 7.1 Purpose..................................................................................................... 83 7.2 Girder Properties...................................................................................... 83 7.3 Roller Test Procedure .............................................................................. 84 7.4 Observed Behavior................................................................................... 85 CHAPTER 8. EVALUATION OF FABRICATOR DATA ................................. 87 8.1 Introduction.............................................................................................. 87 8.2 Data Collection Procedure ....................................................................... 87 8.3 Description of Data Set............................................................................ 88 8.3.1 Data Collection from Concrete Technology Corporation............... 88 8.3.2 Data Collection from Central Pre-Mix Prestressing Corporation... 89 8.3.3 Sections ........................................................................................... 89 8.3.4 Age at Release................................................................................. 91 8.3.5 Seasonal Variations......................................................................... 92 8.4 Observed Trends ...................................................................................... 93
vi

8.4.1 Effects of Concrete Maturity at Release ......................................... 93 8.4.2 Influence of Compressive Strength on Release Camber................. 95 8.4.3 Long-Term Camber ........................................................................ 96 CHAPTER 9. CALIBRATION OF CAMBER MODEL..................................... 98 9.1 Introduction.............................................................................................. 98 9.2 Evaluation of Current Procedure ............................................................. 98 9.3 Effect of Using Measured Concrete Compressive Strength .................... 102 9.4 Prestress Loss Deflection Adjustment ..................................................... 106 9.5 Calibration of the Camber Prediction Model........................................... 108 9.5.1 Elastic Modulus Calibration ........................................................... 109 9.5.2 Creep Calibration............................................................................ 111 9.5.3 Calibration of Prestress Losses Due to Creep................................. 115 9.6 Summary .................................................................................................. 119 CHAPTER 10. SUMMARY AND CONCLUSIONS............................................ 122 10.1 Summary ................................................................................................ 122 10.2 Conclusions............................................................................................ 123 10.3 Recommendations.................................................................................. 128 10.3.1 Recommendations for Practice ..................................................... 128 10.3.2 Recommendations for Future Research ........................................ 129 NOTATION.............................................................................................................. 130 REFERENCES......................................................................................................... 133 ACKNOWEDGMENTS.......................................................................................... 134 APPENDIX A: FABRICATOR DATA COLLECTION ..................................... A-1 APPENDIX B: SNAKE LAKE CAMBER MEASUREMENTS......................... B-1 APPENDIX C: SNAKE LAKE MATERIALS TEST DATA.............................. C-1 APPENDIX D: SNAKE LAKE CREEP TEST DATA ........................................ D-1 APPENDIX E: SNAKE LAKE SHRINKAGE TEST DATA.............................. E-1 APPENDIX F: KEYS ROAD YARD MEASUREMENTS.................................. F-1 APPENDIX G: KEYS ROAD CAMBER MEASUREMENTS........................... G-1
vii

FIGURES Figure Page 2.1 Effect of Overhang on Girder Deflection ................................................... 21 2.2 WSDOT Camber History Model ................................................................ 23 3.1 Camber Prediction Program Input Fields ................................................... 27 3.2 Camber Prediction Program Method Selection .......................................... 28 3.3 Camber Prediction Program Time Mesh Selections................................... 28 3.4 Camber Prediction Program Compressive Strength Plot............................ 29 3.5 Camber Prediction Program Elastic Modulus Plot ..................................... 30 3.6 Camber Prediction Program Prestress Force Plot....................................... 32 3.7 Camber Prediction Program Deflection Plot .............................................. 33 3.8 Camber Program Plotter ............................................................................. 35 3.9 Example Girder Set Plot Using Camber Program ...................................... 36 4.1 Camber Measuring Template...................................................................... 39 4.2 CTC and UW Release Camber Measurements........................................... 40 4.3 Snake Lake Bridge Girders Measured Camber Data.................................. 41 4.4 Snake Lake Girders Creep vs. Age at Release............................................ 42 5.1 Snake Lake Bridge Project Concrete Compressive Strengths a) Accelerated-
Cured b) Moist-Cured ................................................................................ 47 5.2 Snake Lake Bridge Elastic Modulus Test Results ...................................... 49 5.3 Snake Lake Bridge Elastic Modulus vs. Concrete Compressive Strength . 50 5.4 Creep and Shrinkage Stack Configuration.................................................. 53 5.5 Creep Rig Detail ......................................................................................... 54 5.6 Creep Rig Assembly ................................................................................... 55 5.7 Snake Lake Bridge Accelerated-Cured Shrinkage History ........................ 57 5.8 Snake Lake Bridge Moist-Cured Shrinkage History .................................. 57 5.9 Snake Lake Bridge Accelerated-Cured Strain History ............................... 59 5.10 Snake Lake Bridge Moist-Cured Strain History......................................... 59 5.11 Snake Lake Bridge Accelerated-Cured Creep Coefficient ......................... 61 5.12 Snake Lake Bridge Moist-Cured Creep Coefficient................................... 61 6.1 Typical Girder Layout................................................................................. 64 6.2 Embedment of Girder End in Partial-Height Diaphragms.......................... 65 6.3 Keys Road Bridge: Support Conditions for All Spans ............................... 66 6.4 Typical Set of Camber Measurements........................................................ 68 6.5 Girder Target Locations per Section........................................................... 69 6.6 Girder Target Locations over Span Length ................................................ 69 6.7 Elastomeric Support Restraint Model......................................................... 81 7.1 Roller Diagram............................................................................................ 85 7.2 Roller Test Camber Results ........................................................................ 86
viii

8.1 WSDOT Girder Section Dimensions.......................................................... 90 8.2 Number of Girders for Each Section .......................................................... 91 8.3 Number of Girders Released Each Day After Casting ............................... 92 8.4 Number of Girders Cast in Each Month ..................................................... 93 8.5 Influence of Maturity on Concrete Compressive Strength ......................... 94 8.6 Effect of Maturity on Release Camber ....................................................... 95 8.7 Black Lake Bridge Project Release Camber vs. Compressive Strength..... 96 8.8 Black Lake Bridge Project – Long-Term Midspan Cambers vs. 28-Day
Compressive Strength ................................................................................. 97 9.1 Camber Prediction Error Resulting from the Use of the WSDOT Method
a) At release b) At second measurement..................................................... 100 9.2 Measured Camber vs. Length/Radius of Gyration Ratio............................ 101 9.3 Effect of Changes in Concrete Compressive Strength (Example W74G) .. 103 9.4 Camber Prediction Error Using Measured Concrete Compressive
Strength a) At release b) At second measurement ...................................... 105 9.5 WSDOT vs. Modified WSDOT Prestress Deflection (Example W74G) ... 107 9.6 Camber Prediction Error Resulting from Inclusion of the Prestress Loss
in Camber Calculations............................................................................... 108 9.7 Calibration of Elastic Modulus at Release.................................................. 110 9.8 Error in Prediction of Camber at Release Resulting from Use of the
Modified Elastic Modulus (Ec Factor = 1.15)............................................. 111 9.9 Effect of Variations in Elastic Modulus Factor and Creep Coefficient
Factor for CTC Girders............................................................................... 112 9.10 Effect of Variations in Elastic Modulus Factor and Creep Coefficient
Factor for CPM Girders .............................................................................. 112 9.11 Camber Prediction Error Resulting from Use of the Calibrated Elastic
Modulus and Creep Coefficient for a) CTC girders b) CPM girders ......... 114 9.12 Effect of Variations in Creep Coefficient Factor and Prestress Losses Due
to Creep for CTC Girders ........................................................................... 117 9.13 Effect of Variations in Creep Coefficient Factor and Prestress Losses Due
to Creep for CPM Girders........................................................................... 117 9.14 Camber Prediction Error Resulting from Use of the Calibrated Elastic
Modulus, Creep Coefficient, and Prestress Loss Due to Creep for a) CTC girders b) CPM girders................................................................................ 118
9.15 Camber Prediction Error Resulting from Use of the Ec Factor = 1.15, Cc Factor = 1.4, ΔfCR Factor = 1.0 for All Girders a) At release b) At second measurement.......................................................................... 120
ix

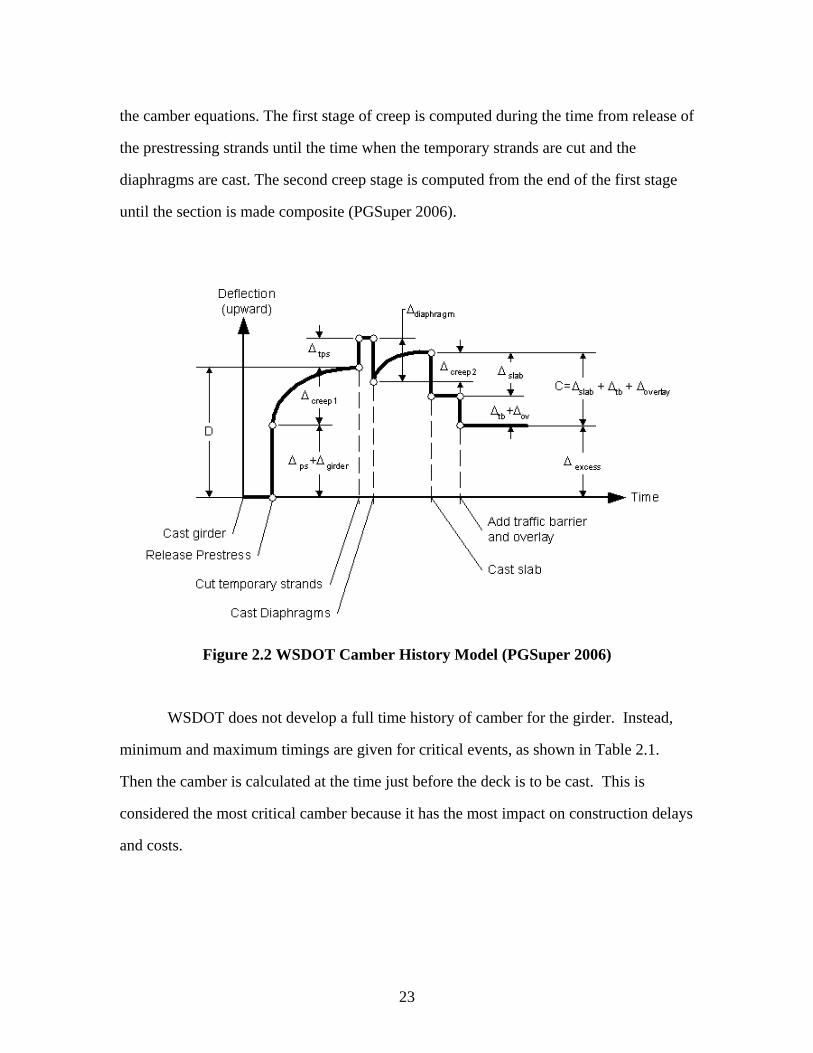
TABLES Table Page 2.1 WSDOT Timeline for Construction............................................................ 24 4.1 Snake Lake Bridge Girder Properties ......................................................... 38 5.1 Concrete Compressive Strength Modeling Coefficients............................. 45 5.2 Creep Test Elastic Modulus at Initial Loading – G1D ............................... 51 5.3 Creep Calculation G1D Stack Loaded at Release....................................... 60 6.1 Keys Road Bridge Girder Properties .......................................................... 66 6.2 Camber Measurement Schedule ................................................................. 67 6.3 Design and Measured Concrete Compressive Strengths (ksi) .................... 70 6.4 Difference Between Camber Measured on Top and Bottom of Girder ...... 71 6.5 Measured and Calculated Cambers............................................................. 74 6.6 Measured and Calculated Changes in Camber ........................................... 75 7.1 Age and Prestressing of Girders Used in Roller Test ................................. 84 7.2 Release and 28-Day Compressive Strengths .............................................. 84 9.1 Average Errors in Camber Prediction (in.) ................................................. 99 9.2 Girder Properties......................................................................................... 101 9.3 Summary of Errors for Various Predictive Methods .................................. 102 9.4 Average Ratio of Measured to Design Concrete Compressive Strength.... 103 9.5 Summary of Errors for Various Coefficients on Elastic Modulus, Creep,
and Prestress Loss Due to Creep................................................................. 113 9.6 Reductions in Errors Resulting from Use of the Various Predictive
Methods....................................................................................................... 121 10.1 Camber Errors (in.) Resulting from Use of Original WSDOT Method ..... 124 10.2 Camber Errors (in.) Resulting from Use of the Optimized Model ............. 125
x

EXECUTIVE SUMMARY
This research was conducted to develop improved methods of predicting camber
in prestressed concrete girders. A computer program was written to calculate camber as a
function of time. It takes into account instantaneous and time-dependent behavior of the
concrete and steel and performs the calculations in a series of time steps. It was
calibrated by comparing its predictions with the camber from 146 girders, measured in
the fabricator’s yard both after release and at a later time. The program’s long-term
predictions were then compared with the responses of 91 girders that were monitored
during construction at the Keys Road Bridge site. The measured deflections due to
temporary strand release and deck casting were compared to calculated values by using
variations in pier continuity. Long-term creep deflections were also monitored after deck
placement.
The results showed that the response was sensitive to the predicted prestress
losses and that the 2006 AASHTO values for prestress loss provided much better
estimates than did the 2004 provisions. In addition, the camber was found to depend on
the elastic modulus of the concrete, its creep coefficient, and the use of the prestress
losses in the calculation of creep camber. Predicted cambers were compared to the
measured cambers to calculate a predicted error. To achieve the best match with the
measured cambers, the AASHTO-recommended values for the elastic modulus and the
creep coefficient had to be multiplied by adjustment factors. The adjustment factor for
the elastic modulus was found by minimizing the predicted error on the camber
immediately after release, resulting in a factor of 1.15. The adjustment factor for the
creep coefficient was found by minimizing the predicted error on the second camber
measurement, resulting in an adjustment factor of 1.4. The prestress losses had to be
taken into account when computing the creep component of camber.
xi

The cambers measured after placement of the girders in their final locations were
compared with predicted values to evaluate the influence of the support conditions. The
supports provided partial restraint to longitudinal movement of the girder’s bottom flange
and clearly affected the camber. However, significant scatter in the recorded data made
trends difficult to see and reinforced the need for further measurement and analysis of the
issue. As an indication of the importance of the end conditions, it may be noted that, in
the evaluation of the changes in camber due to release of the temporary strands and
placement of the deck, the girders that were seated on oak blocks at both ends were 41
percent to 46 percent stiffer than those seated on elastomeric bearings,
After placement of the deck, some downward creep deflection was observed.
This is contradictory to the current assumption that the composite section “locks” the
deck system. However, the magnitude of the creep deflection was small in comparison to
the various other components of camber.
xii

CHAPTER 1
INTRODUCTION
1.1 Context
Prestressing can be defined as “the deliberate creation of permanent internal
stresses in a structure or system in order to improve its performance” (Naaman 2004).
Since concrete is strong in compression and comparatively weak in tension, prestressing
produces compression stresses in areas that will counteract tensile stresses. The
prestressing allows for more economical structures, with a reduction in cross-sectional
dimensions and consequent weight savings.
Prestressed concrete has made significant contributions to the precast
manufacturing and construction industry. Prestressed concrete has been used in a variety
of structural applications, ranging from bridges to nuclear power vessels, from buildings
to ships, and smaller products, such as ties and piles to offshore drilling platforms
(Naaman 2004).
The Washington State Department of Transportation (WSDOT) has been using
precast prestressed concrete girders in bridge applications for many years. These girders
have allowed for longer spans, provided economical design, and accelerated construction
times by allowing precast fabricators to deliver ready-made products at the contractor’s
convenience. The girders are often built with an upward camber after initial stressing.
However, because of material and environmental properties, this initial camber at release
can change over time.
WSDOT typically uses standard designs for prestressed concrete girder cross
sections. These sections were designed in collaboration with precast fabricators to
provide economical fabrication in conjunction with increased span capabilities. WSDOT
will typically design a bridge by using design programs, such as PGSuper (PGSuper
2006), and provide the contractor with detailed plans and specifications to fabricate the
1

girders. The fabricator will then build the girder according to the details provided and
deliver the girder to the contractor on site.
1.2 Camber Prediction Challenges to WSDOT
Most of the bridges built in Washington State today are constructed with precast,
prestressed concrete girders. However, the uncertainty of the predicted camber in
precast, prestressed girders can lead to problems during construction. Excessive camber
leads to interference between the top of the girder and the deck reinforcement.
Insufficient camber leads to an increase in the concrete required to meet the bottom of the
deck slab, resulting in additional weight to the superstructure. Both are undesirable
conditions that can lead to construction delays, as well as increased material and labor
costs.
1.3 Research Objectives
The primary objective of this research was to improve the methods of predicting
camber in precast, prestressed concrete girders. The research focused on evaluating
current methods of predicting camber, collecting fabricator camber data to calibrate a
model based on current methods, and implementing the methods. Specific objectives
included the following:
• Evaluating current camber prediction methods.
• Developing a model to predict the camber history for a girder.
• Collecting girder design information and measured camber data for
projects fabricated in Washington State.
• Evaluating the camber data collected in comparison with behavior
predicted by current camber models.
• Providing recommendations to improve current camber prediction
methods.
2

1.4 Organization of Report
This report is organized as follows:
• Chapter 2 describes current methods used to predict several of the
characteristics that influence camber. These include the concrete
compressive strength, elastic modulus, shrinkage, creep, and prestress
losses. Also included are the equations used to calculate deflection due to
the individual components of self-weight, prestress, and dead load.
• Chapter 3 describes the camber prediction program that was developed to
model the camber history for a girder and compare the prediction errors
for a set of girders.
• Chapter 4 describes the camber monitoring of eight girders from the Snake
Lake Bridge project at Concrete Technology Corporation in Tacoma,
Washington.
• Chapter 5 describes the corresponding materials tests for six of the eight
girders from the Snake Lake Bridge project. These test included concrete
compressive strength, elastic modulus, shrinkage, and creep.
• Chapter 6 describes the camber monitoring of 91 girders from the Keys
Road Bridge project in Yakima, Washington, to measure the effects on
camber the of removal of temporary strands and deck placement.
• Chapter 7 describes tests performed to evaluate the influence on camber of
support conditions that restrict the girder axially from shrinking and
creeping. This restraint can impose an additional moment in the girder
and change the observed camber.
• Chapter 8 describes data collected from two precast fabricators in
Washington State. The data are categorized by girder section type, age of
concrete at release, and seasonal variations. Also described are the data
collection procedure and the observed influences on camber of the
3

concrete maturity, compressive strength at release, and compressive
strength at 28 days,
• Chapter 9 presents the calibration of the model developed by minimizing
the predicted error. The chapter also investigates several changes to the
current method used by the WSDOT to more accurately predict camber in
precast, prestressed concrete girders.
• Chapter 10 summarizes the research and its conclusions. It also provides
recommendations for practice and for future research.
4

CHAPTER 2
CAMBER PREDICTION METHODS
2.1 Introduction
This chapter discusses several methods available for calculating camber in
prestressed concrete girders. Methods are available for each of the following properties:
concrete compressive strength (Section 2.2), elastic modulus (Section 2.3), shrinkage
(Section 2.4), creep (Section 2.5), and prestress loss (Section 2.6). Section 2.7 discusses
the deflection calculations for each of the loading conditions, while Section 2.8 discusses
the method that WSDOT currently uses to predict camber.
2.2 Concrete Compressive Strength
The 28-day compressive strength is often used as a reference parameter, but
concrete strength actually varies over time and depends on many variables, including the
type of cement and curing history. The prediction of the time dependence of concrete
properties for prestressed concrete girders is important because the prestress is usually
released when the girder is young and the strength is changing quickly. If the actual
release and 28-day compressive strength tests are known, then Equation 2.1 (Naaman
2004) can be easily calibrated.
( ) ( )str
strcc ctb
tftf
+= 28''
2.1
where:
tstr = time after concrete starts to gain strength
b = constant that changes the rate of increase
c = constant that changes the ultimate value
f’c(28) = 28-day concrete compressive strength
f’c(t) = concrete compressive strength
5

It is important to note that if the 28-day compressive strength test differs from the
design 28-day strength, the actual camber can be influenced. Often, the fabricator will
use a higher-strength mix design to achieve the required release strengths within the first
24 hours. As a result, the ultimate strength is often higher than the strength used to
estimate the camber.
2.3 Elastic Modulus
The elastic modulus of concrete is traditionally estimated on the basis of the
concrete compressive strength. Two methods are discussed in this section. The
AASHTO LRFD equation is used for normal-weight concrete. However, ACI
Committee 363 recommends a different equation for high-strength concrete. The
recommended equations are time dependent because the compressive strength is a
function of time.
2.3.1 AASHTO LRFD Method
The AASHTO LRFD method for calculating the elastic modulus is shown in
Equation 2.2 (AASHTO 2006). This equation is recommended by AASHTO for concrete
with a unit weight of between 0.090 kcf and 0.155 kcf.
( ) ( )tftE cc '000,33 5.1γ= (ksi) 2.2
where:
γ = unit weight of concrete (kcf)
f’c(t) = concrete compressive strength (ksi)
2.3.2 ACI Committee 363 Method
The ACI Committee 363 recommends using Equation 2.3 to predict the elastic
modulus because the AASHTO LRFD method tends to overestimate the value of
concrete that has a compressive strength higher that 6,000 psi (ACI 1992). The equation
6

is more complex but is still only a function of the unit weight and the compressive
strength of the concrete.
( ) ( )( )tftE cc '12651000145.0
5.1
+⎟⎠⎞
⎜⎝⎛=
γ (ksi) 2.3
2.3.3 NCHRP Report 496 Method
The ASHTO LRFD and ACI-363 methods do not account for material properties
other that the unit weight and compressive strength of concrete. Tadros et al. (2003)
evaluated the effect of the coarse aggregate used. The proposed formula is shown in
Equation 2.4.
( ) ( ) ( )tftf
KKtE cc
c '1000
'140.0000,33
5.1
21 ⎟⎠⎞
⎜⎝⎛ += (ksi)
2.4
where:
K1 = factor representing the difference between national average and local
average
K2 = factor representing whether an upper-bound or lower-bound value is
desired in the calculations
For Washington, Tadros et al. (2003) recommended using K1 = 1.154. K2 = 1.0
should be used to represent the mean of the data. However K2 can be modified to
represent the 90th percentile upper-bound (K2 = 1.182) or 10th percentile lower-bound
(K2 = 0.817) value.
The equation also removes the unit weight dependence from the calculation. The
research observed a relationship between the unit weight and compressive strength of the
concrete. However, the equation is only recommended for concrete with a unit weight of
less than 0.155 kcf.
7

2.3.4 CEB-FIP Method
The CEB-FIP Model Code 1990 recommends using Equation 2.5 to predict the
elastic modulus (CEB-FIP 1993). This equation is only a function of the concrete
compressive strength.
( )3/1
10)('
21500 ⎟⎠⎞
⎜⎝⎛=
tftE c
Ec α (MPa) 2.5
where:
αE = aggregate correction coefficient (use 1.1 for Washington State
aggregates)
f’c (t) = concrete compressive strength (MPa)
Like the NCHRP method, this equation is independent of the unit weight of the
concrete.
2.4 Shrinkage
It is important to predict the shrinkage strain that the girder will experience.
Shrinkage itself does not affect camber, but because the prestressing steel will experience
the same change in axial strain, shrinkage reduces the prestress force and the camber over
time.
Equation 2.6 estimates axial free shrinkage strain as a function of time and is used
to provide the time dependence needed for predicting the prestress losses (AASHTO
2006). This equation does not include the resistance of shrinkage by the steel
reinforcement. Prestress losses due to shrinkage are discussed in Section 2.6.1.2.
( ) 31048.0 −×−= tdfhsvssh kkkktε 2.6
where:
kvs = factor for the effect of the volume-to-surface ratio
0.113.045.1 ≥⎟⎠⎞
⎜⎝⎛−=
SV
8

khs = humidity factor for shrinkage
H014.000.2 −=
kf = factor for the effect of concrete strength
⎟⎟⎠
⎞⎜⎜⎝
⎛+
=cif '1
5
ktd = time development factor
⎟⎟⎠
⎞⎜⎜⎝
⎛+−
=tf
t
ci'461
V/S = volume-to-surface ratio (in.)
H = relative humidity (%)
= 80% for Western Washington
= 70% for Eastern Washington
f’ci = compressive strength at the time of prestressing (ksi)
t = age of the concrete between time of loading for creep calculations, or
end of curing for shrinkage calculations, and the time being
considered for analysis for creep or shrinkage effect (days)
The total shrinkage is a contribution of two components, the autogenous and
drying shrinkage. Autogenous shrinkage is the change in volume due to the hydration of
the cement paste. Drying shrinkage is due to evaporation of free water from within the
concrete. As the concrete dries, it shrinks in volume (Nilson 2004).
2.5 Creep
When a girder is loaded, the concrete will initially deform elastically. With time,
the girder will continue to deform. The total deformation is only partially recoverable
once the load has been removed. This continued deformation is called creep. Creep
deflection depends on many of the same factors that govern shrinkage. However, creep
also depends on the age and magnitude of the load.
9

Three methods for predicting the amount of creep are discussed in this section,
including the AASHTO LRFD Method, Rate of Creep Theory, and the Branson Method.
All three methods characterize creep as a coefficient that, when multiplied by the elastic
deformation, gives the creep deformation.
2.5.1 AASHTO LRFD Method
The AASHTO LRFD Method uses a time dependent function that is multiplied by
factors that represent material and environmental influences, as shown in Equation 2.7
(AASHTO 2006). This equation not only provides a time dependent relation but is also
influenced by the age of the concrete at the time of loading, ta.
( ) 118.09.1, −= atdfhcvsa tkkkkttψ 2.7
where:
khc = humidity factor for creep
H008.056.1 −=
ta = age of concrete when load is initially applied (day). One day of
accelerated-cure is equivalent to seven days of moist-cure
All other factors are as defined in Section 2.4.1.
2.5.2 Rate of Creep Theory
The Rate of Creep Theory is composed of two parts as shown in Equation 2.8.
The first is a function of the age of loading, and the second is a function of time after
loading. Both these parts are given a coefficient to change their behavior. β1 controls the
rate of creep, while β2 controls the ultimate creep as it relates to the concrete age (Stanton
2004).
( ) ( )( )aa tttcua eeCtt −−− −= 12 1, ββψ 2.8
where:
Ccu = ultimate creep coefficient
10

β1 = coefficient controlling creep rate
β2 = coefficient controlling the effect of the age of loading
The Rate of Creep Theory does not have explicit coefficients for environmental
and material properties. Variations on the properties that affect creep require calibration
to determine the β1 and β2 coefficients (Stanton 2004).
2.5.3 Branson Model
The Branson Model is similar to the AASHTO approach, using multipliers to
control the rate and magnitude of the creep coefficient. However, it has different
equations that are influenced by the material and environmental variables. Equation 2.9
has coefficients for relative humidity, age of loading, and the size and shape of the girder.
The Branson Model does not factor in the influence of the concrete compressive strength
(Naaman 2004).
( ) ( )( ) 6.0
6.0
10,
a
aCSCACHcua tt
ttKKKCtt−+
−=ψ
2.9
where:
KCH = humidity factor
H0067.027.1 −=
KCA = age at loading factor
095.013.1 −= at
KCS = shape and size factor
SV09.014.1 −=
2.6 Prestress Losses
The reduction in the prestressing force during the life of a girder is called the
prestress loss. The total losses are the cumulative result of many components and are
11

important to predict because they can affect the observed camber in the prestressed
member. The components that AASHTO considers are discussed in this section.
The AASHTO Refined Method for estimating prestress losses estimates the
amount of prestress loss in a girder by summing the losses from different components.
The losses are divided into two main categories: instantaneous losses and time dependent
losses. The instantaneous losses are those provided by the elastic shortening of the
member as a result of the prestressing force. The time dependent losses are a
combination of losses associated with creep and shrinkage of the concrete and relaxation
of the prestressing strands. Each time dependent component is estimated during two time
intervals. These are defined as the time between release of the prestressing and deck
casting and the time between deck casting and a final time.
Equation 2.10 estimates the prestress losses from the time that the girder is
released (AASHTO 2006).
pTLpESpT fff Δ+Δ=Δ 2.10
where:
ΔfpES = sum of all losses or gains due to elastic shortening or elongation at
the time of application of prestress and/or external loads
ΔfpTL = prestress losses due to long-term shrinkage and creep of the
concrete, and relaxation of the steel
( ) +Δ+Δ+Δ=ΔidpRpCRpSRpTL ffff 1 ( )
dfpSSpRpCDpSD ffff Δ+Δ+Δ+Δ 2 2.11
ΔfpSR = prestress loss due to shrinkage of the girder concrete between
transfer and deck placement
ΔfpCR = prestress loss due to creep of the girder concrete between transfer
and deck placement
12

ΔfpR1 = prestress loss due to relaxation of the prestressing strands between
time of transfer and deck placement
ΔfpSD = prestress loss due to shrinkage of the girder concrete between time
of deck placement and final time
ΔfpCD = prestress loss due to creep of the girder concrete between time of
deck placement and final time
ΔfpR2 = prestress loss due to relaxation of the prestressing strands in the
composite section between time of deck placement and final time
ΔfpSS = prestress loss due to shrinkage of the deck composite section
2.6.1 Elastic Shortening Loss
At transfer of the prestress, the force is applied to the girder, and elastic bending
and shortening occurs. Because the prestressing is bonded to the concrete, the strands
shorten as well, reducing the strain and tension stress. Equation 2.12 is an estimate of the
elastic prestress loss that can occur as a result of elastic shortening (AASHTO 2006).
This is a loss that occurs only when the load is applied and is not time dependent.
cgpci
ppES f
EE
f =Δ 2.12
where:
Ep = modulus of elasticity of the prestressing strand
Eci = modulus of elasticity of the concrete at release
fcgp = concrete stress at the center of gravity of the prestressing strands due
to the prestressing force and self-weight of the member directly
after transfer
g
pgg
g
pgi
g
i
IeM
IeP
AP
−+=2
Pi = initial prestress force directly after transfer (positive)
13

pups fA 7.0=
Ag = gross –cross-sectional area of the girder
epg = eccentricity of strands with respect to the center of the girder
Ig = gross section moment of inertia of the girder
Mg = self-weight moment of girder (positive)
8
2LSWω=
fpu = ultimate strength of the prestress strands
Aps = total are of the prestress strands
ωSW = self-weight linearly distributed
L = girder length
In this calculation, the initial prestress force is needed, but fcgp is not known until
after release. The initial prestress force can instead be calculated through equilibrium of
forces and strain compatibility. (See Equation 2.13.) This requires an accurate estimate
of the elastic modulus of the concrete at release.
⎟⎟⎠
⎞⎜⎜⎝
⎛++
+=
g
cp
ppswji
IA
en
nAeMPP
211 ρ
2.13
where:
Pj = prestress force just before release
n = modular ratio
c
p
EE
=
ρ = reinforcement ratio
c
ps
AA
=
14
2.6.2 Shrinkage Loss
AASHTO estimates the total prestress loss due to shrinkage in two stages. The
first is an estimate of loss between the time of transfer and deck placement, and the
second is an estimate of loss between deck placement and a final time. Equations 2.14
and 2.15 estimate these losses, respectively (AASHTO 2006).
• Time of transfer to time of deck placement:
idpbidpSH KEf ε=Δ 2.14
where:
εbid = concrete shrinkage strain of the girder between the time of transfer
and deck placement (see Equation 2.6)
Ep = modulus of elasticity of the prestressing tendons
Kid = transformed section coefficient that accounts for the time-dependent
interaction between the concrete and bonded steel in the section
being considered for the time period between transfer and deck
placement.
( )[ ]ifbg
pgg
g
ps
ci
p ttIeA
AA
EE
,7.0111
12
ψ+⎟⎟⎠
⎞⎜⎜⎝
⎛++
=
ψb(tf, ti) = creep coefficient at a final time due to loading introduced at
transfer
• Time of deck placement to final time
dfpbdfpSD KEf ε=Δ 2.15
where:
εbdf = concrete shrinkage strain of the girder between the time of deck
placement and a final time (see Equation 2.6)
15

Kdf = transformed section coefficient that accounts for the time-dependent
interaction between the concrete and bonded steel in the section
being considered for the time period between deck placement and a
final time
( )[ ]ifbc
pcc
c
ps
ci
p ttIeA
AA
EE
,7.0111
12
ψ+⎟⎟⎠
⎞⎜⎜⎝
⎛++
=
Ac = area of section calculated by using the net concrete section properties
of the girder and the deck and the deck-to-girder modular ratio
epc =eccentricity of strands with respect to the centroid of the composite
section
Ic = moment of inertia of the section calculated by using the net concrete
section properties of the girder and the deck and the deck-to-girder
modular ratio at service
The third shrinkage component is calculated for the same time period; however, it
is due to the shrinkage of the deck concrete between deck placement and a final time.
This is estimated in Equation 2.16 (AASHTO 2006).
( )[ ]dfbdfcdpc
ppSS ttKf
EE
f ,7.01 ψ+=Δ 2.16
where:
Δfcdf = change in concrete stress at the centroid of the prestressing strands
due to shrinkage of the deck concrete
( )[ ] ⎟⎟⎠
⎞⎜⎜⎝
⎛+
+=
c
dpc
cdfd
cddddf
Iee
AttEA 1
,7.01 ψε
The shrinkage losses calculated for the time periods are then time rated on the
ultimate free shrinkage strain, as calculated in Equation 2.17, by using a ratio of the
16

present value to the ultimate. The time-dependency of the shrinkage strain is given in
Section 2.4
( ) ( )( )∞
Δ=Δsr
srpSRpSR
tftfεε
2.17
2.6.3 Creep Loss
AASHTO estimates the total prestress loss due to creep similarly to the way it
estimates shrinkage. Two time periods are used. One is an estimate of loss between the
time of transfer and deck placement, and the other is an estimate of loss between deck
placement and the final time. Equations 2.18 and 2.19 estimate these losses, respectively
(AASHTO 2006).
• Time of transfer to time of deck placement:
( ) ididbcgpci
ppCR Kttf
EE
f ,ψ=Δ 2.18
where:
ψb(td,ti) = girder creep coefficient at the time of deck placement due to
loading introduced at transfer (see Equation 2.9)
td = age at deck placement
• Time of deck placement to the final time:
( ) ( )[ ] +−=Δ ididbifbcgpci
ppCD Kttttf
EE
f ,, ψψ ( ) 0.0, ≥Δ dfdfbcdci
p KttfEE
ψ 2.19
where:
ψb(tf,ti) = girder creep coefficient at the time of deck placement due to
loading introduced at transfer (see Equation 2.9)
17

Δfcd = change in concrete stress at the centroid of the prestressing strands
due to long-term losses between transfer and deck placement,
combined with deck weight and superimposed loads
The creep losses calculated for each time period are time rated on the ultimate
creep coefficient, as calculated in Equation 2.20, by using a ratio of the present value to
the ultimate. The time dependency for creep is given in Section 2.5.
( ) ( ) ( )( )∞
Δ=Δψψ ttftf pCRpCR
2.20
2.6.4 Relaxation Loss
AASHTO estimates the losses due to relaxation of the prestressing steel in two
time intervals, similarly to the way it estimates creep and shrinkage (AASHTO 2006).
Equations 2.21 and 2.22 calculate the losses during the indicated time periods.
• Time of transfer to time of deck placement:
⎟⎟⎠
⎞⎜⎜⎝
⎛−=Δ 55.01
py
pt
L
ptpR f
fKf
f 2.21
where:
fpt = stress in the prestressing strands immediately after transfer, taken as
not less than 0.55fpy
fpy = yield strength of the prestressing steel
KL = factor accounting for the type of steel, taken as 30 for low relaxation
strands and 7 for other prestressing steel, unless more accurate
manufacturer’s data are available
• Time of deck placement to final time
12 pRpR ff Δ=Δ 2.22
18

The time function of the relaxation component is derived from the time-
dependency of the shrinkage and creep components.
Losses due to relaxation are typically much smaller than those due to shrinkage,
creep, and elastic shortening.
2.7 Camber Calculations
Deflection at midspan of the girder relative to the ends is called camber. Camber
is calculated by summing the individual loading components that cause changes in
deflection, including self-weight, prestress, and additional dead loads.
2.7.1 Self-Weight Deflection
Self-weight deflection is calculated by using a uniformly distributed load over the
length of the girder. Because the supports of the girder are typically not located at the
ends, the equation for a simply supported beam does not apply. Therefore, Equation 2.23
is used to calculate the total camber from the end of the girder to the midspan. Positive
camber is considered to be upward deflection.
MIDSPANOVERHANGSW Δ+Δ=Δ 2.23
where:
ΔOVERHANG = the deflection of the overhang relative to the support
( )[ ]32 2324 nncc
gc
csw LLLLIE
L−+=
ω
ΔMISDPAN = the deflection at midspan relative to the support
[ ]222
245384 cn
gc
nsw LLIE
L−=
ω
ωsw = self-weight per unit length
gAγ=
Ln = distance between supports
19

Lc = length of overhang
Ec = modulus of elasticity of the concrete when the load is applied
These two components are summed to give the total elastic deflection at midspan
relative to the ends of the girder. Self-weight is applied at the time of prestressing, and
the girder is lifted from the casting bed. The deflection due to self-weight will change if
the support conditions change. Casting of the diaphragms and slab is considered to be a
separate loading component, as discussed in Section 2.7.3.
Including the overhang in the calculation of deflection due to self-weight is more
accurate but more complicated than treating the span as simply supported at its ends.
For a girder of total length L, supported on rollers a distance αL from each end, Equation
2.23 can be expressed as
( )αf0Δ=Δ (2.24)
where
gc
swsw
IEL 4
0 3845 ωω
=Δ (2.25)
is the deflection for the girder supported at its ends, and
( ) ( ) ( 22 8.04121 αααα −−−=f ) (2.26)
The function f(α),is plotted against α in Figure 2.1. The initial slope of the curve is -8, so
an overhang of 1% of the total length causes the mid-span deflection due to self weight
to be multiplied by a factor of approximately (1-8*0.01) = 0.92. The overhang reduces
the mid-span deflection in two ways; it shortens the central span, thereby reducing the
deflection, and it causes an end moment, which further reduces the mid-span deflection.
In most girders, the final overhang beyond the centerline of the bearing will be
very small, but the support conditions between release and final bearing can vary
significantly. Since most of the cambers for this study were measured in the storage
yard, the overhang was accounted for in calculating the self-weight deflection. In this
way modeling errors were minimized and the camber model was calibrated as accurately
20

as possible. However, for computing the camber of girders in their final locations in the
field, use of Equation 2.25 is expected to be sufficiently accurate for practical purposes.
0.3
0.4
0.5
0.6
0.7
0.8
0.9
1
1.1
0 0.02 0.04 0.06 0.08 0.1
α = L.cant/L.tot
Δ. tr
ue/ Δ
. ss
D/D0
Figure 2.1 Effect of Overhang on Girder Deflection.
2.7.2 Prestress Deflection
The deflection due to the prestress force is given by Equation 2.27. The effective
eccentricity is used at the end and midspan to include all the strands that contribute to that
deflection component. Often the deflections caused by the permanent (straight and
harped) and temporary strands are calculated separately.
( ) ⎥⎦
⎤⎢⎣
⎡−+=Δ 2
22
34
8 Laeee
IEPL
midendmidgc
ps
2.27
where:
Pi = initial prestress force directly after transfer
L = girder length
Ec = elastic modulus of the concrete
Ig = gross-cross sectional moment of inertia
21

a = distance from the end of the girder to the harping point
emid = eccentricity of the prestressing at the end of the girder
eend = eccentricity of the prestressing at midspan of the girder
2.7.3 Uniform Dead Load Deflection
The self-weight of the diaphragms and deck is applied as a separate load at a time
after permanent placement of the girders. This load is assumed to be uniformly
distributed over the length of the girder.
gc
DLDL IE
L3845 4ω
=Δ
2.28
where:
ωDL = dead load linearly distributed over the length of the girder
2.8 WSDOT Practice for Camber Prediction
The WSDOT uses the method recommended by the AASHTO LRFD (WSDOT
2006). Until recently, the 2004 edition was used. However, the 2006 Interim updates to
the AASHTO LRFD Specifications were adopted for the WSDOT Bridge Design Manual
(BDM).
PGSuper is a design and analysis program for the AASHTO LRFD Bridge Design
Specifications and is a product of the WSDOT Bridge and Structures Office (PGSuper
2006). PGSuper uses the AASHTO methods described in this chapter to calculate the
effects of shrinkage and creep and to estimate deflection.
The camber model shown in Figure 2.2 illustrates the components of camber that
WSDOT calculates to approximate the camber changes during the life of a girder
(PGSuper 2006).
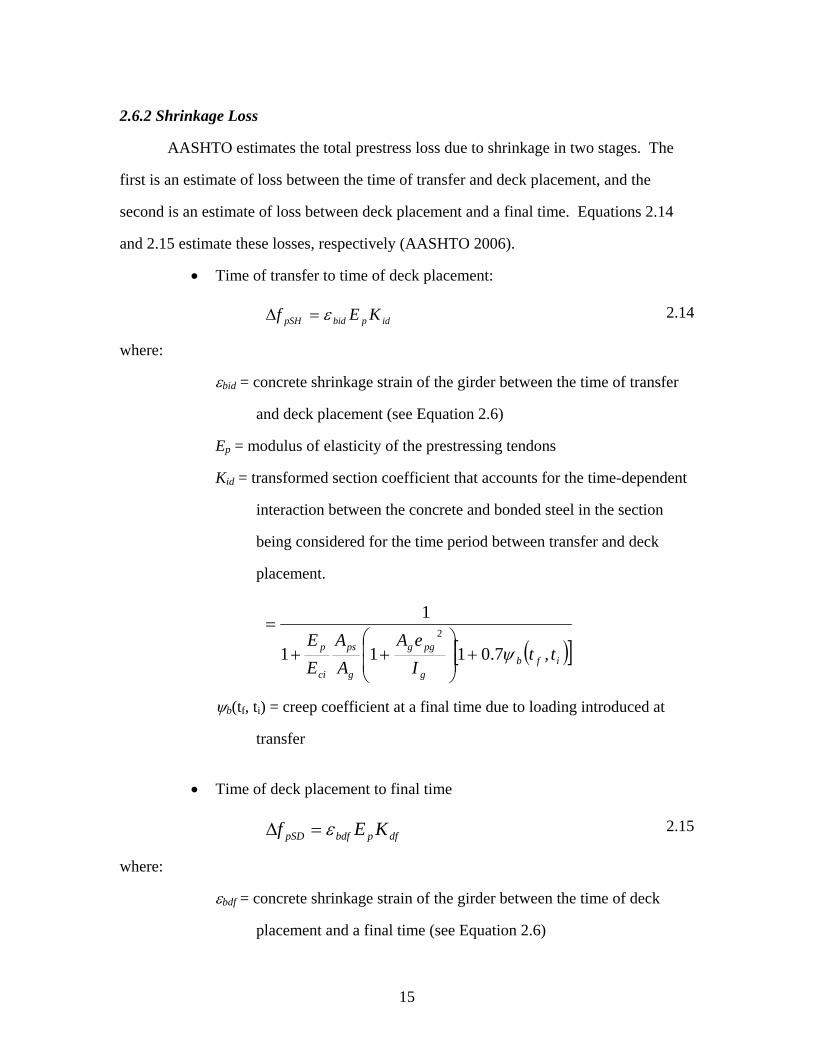
All of the deflections calculated are elastic except for two creep deflections
indicated by Δcreep1 and Δcreep2. In PGSuper, creep is computed in two stages to facilitate
22
the camber equations. The first stage of creep is computed during the time from release of
the prestressing strands until the time when the temporary strands are cut and the
diaphragms are cast. The second creep stage is computed from the end of the first stage
until the section is made composite (PGSuper 2006).
Figure 2.2 WSDOT Camber History Model (PGSuper 2006)
WSDOT does not develop a full time history of camber for the girder. Instead,
minimum and maximum timings are given for critical events, as shown in Table 2.1.
Then the camber is calculated at the time just before the deck is to be cast. This is
considered the most critical camber because it has the most impact on construction delays
and costs.
23

Table 2.1 WSDOT Timeline for Construction
*Timeline (days)
Construction Type 1 2 3
Minimum Timing 7 30 40
Maximum Timing 7 90 120
1 – Release Strands
2 – Cut Temporary Strands and Cast Diaphragms 3 – Composite System
* Normal Cure. One day of accelerated curing is taken as equal to seven days of normal curing (AASHTO 2006).
Creep coefficients are then calculated as recommended by the AASHTO LRFD
for the following elastic loads:
• Permanent Strands – from release until the time of deck casting
• Temporary Strands – from release until removal
• Diaphragms – from the time cast until the time of deck casting.
The creep deflection is calculated by multiplying the creep coefficients by the
corresponding elastic deflections. Time dependent changes in prestress are not
considered in the prestress deflection at any time after release. The total estimated
camber before the deck has been cast is considered the “D” dimension and is the sum of
the component elastic deflections and the creep deflection.
PGSuper also makes several important assumptions that are documented in the
program notes. The design length of the girder is defined as the length from the
centerline of the final bearing at both ends. All deflection calculations are based on the
span length using a simply supported model. The procedures of Concrete Technology
and Central Pre-Mix Prestress for supporting the girders at release and storage were
observed by the researchers to be different than those assumed by WSDOT. At release,
the girder is typically supported by lifting loops that vary in distance from the ends.
When placed in the storage yard before shipping, the girder is supported on bunks
24

anywhere from 2 to 3 feet in from the ends. Because creep deflection is proportional to
the elastic deflection, small variations in elastic deflection caused by different support
conditions carry over to the creep deflection.
PGSuper assumes that once the deck has been cast, the stiffness of the
superstructure increases because the composite action and the effects of creep will not be
significant. However, by then, the camber of the girders is generally not considered to be
a problem
25

CHAPTER 3
CAMBER PREDICTION PROGRAM
3.1 Introduction
A camber prediction program was written to combine various methods of
predicting compressive strength, elastic modulus, creep, shrinkage, prestress loss, and
deflection. Because several methods exist for each characteristic, the program was
developed to be able to easily select the desired method and run an analysis on one or
multiple girders. Section 3.2 discusses the program interface developed to enter input
data. Section 3.3 gives a detailed description of the calculation steps used by the program
to predict the time history of camber. Section 3.4 discusses the output the program offers
to evaluate a girder or set of girders.
3.2 Input
To begin a time history analysis of camber for a girder, the user must first enter
all the information that the program needs to run. The variable setup page includes input
fields for casting date and time, shipping and placement times, girder geometry, concrete
properties, and prestressing properties (see Figure 3.1).
Multiple girders may be entered into a single analysis by adding new girders to
the list or copying a girder that was already created. The list can then be saved to a file
for access at a later time.
The user has the option to select which method of calculation. All of the methods
discussed in Chapter 2 were included in the program model. If the WSDOT Camber
Method is chosen, the program automatically selects the current methods that WSDOT
uses to calculate the elastic modulus and deflection (see Figure 3.2). The Modified
WSDOT Method recognizes that the deflection due to the prestressing force is influenced
by prestress losses.
26

Figure 3.1 Camber Prediction Program Input Fields
The time series is customizable on the basis of the girders to be evaluated.
Because the program calculates the prestress deflection on the basis of the incremental
changes in prestress loss, it is best to use a time series with a fine mesh. Although
increasing the number of time steps increases the program run time, that increase is only
substantial with large sets of girders. Figure 3.3 shows the three time series that are
available.
The first time series is called the Geospace Series. The user specifies the ending
time, number of time steps, and progression ratio. The program then constructs a time
series with the number of time steps specified, but each time step is larger than the
previous time step by the ratio specified. This type gives the user control of the rate at
which the mesh changes over time.
27

Figure 3.2 Camber Prediction Program Method Selection
Figure 3.3 Camber Prediction Program Time Mesh Selections
The second time series uses time steps the lengths of which form a Fibonacci
Series. By selecting the starting time step and specifying the approximate ending time,
the program will construct the time series and end on the first full time step beyond the
ending time specified. This time series creates a mesh that is very fine at the beginning,
and becomes coarser as time increases. In that sense it is similar, but not identical, to the
Geospace series.
The third time series is defined by the user. The history is divided into four
intervals, in each of which the user defines the length of the interval and the number of
increments in each.
28

3.3 Calculation Methods
3.3.1 Concrete Compressive Strength
The concrete compressive strengths at release and at 28-days are defined by the
user. The program can use either the design strength or the actual measured strength of
the concrete, and it calculates the time history of the compressive strength by using
Equation 2.1. The constants are found by using the two points to create a concrete
compressive strength curve. See Figure 3.4 for an example of a concrete compressive
strength plot from the camber program. The curve passes through the release and 28-day
cylinder strengths.
Figure 3.4 Camber Prediction Program Compressive Strength Plot
3.3.2 Elastic Modulus
Several methods are available for establishing the curve that relates the elastic
modulus to time. They are discussed in Section 2.3. At each time interval, an elastic
modulus is calculated from the instantaneous concrete compressive strength, using the
29

methods described in Section 3.3.1. The time-dependence of the elastic modulus curve is
therefore directly related to the time-dependence of the concrete compressive strength
curve.
The WSDOT Model in the program uses this method to calculate an elastic
modulus curve. However, WSDOT does not use a time history of the elastic modulus.
Instead, the Eci and Ec are calculated from the release and 28-day concrete compressive
strengths, respectively. For the purpose of this analysis, all loads applied after release
(i.e., temporary strand removal and dead load) are not applied until ultimate concrete
strength is reached. Therefore, the Ec used by WSDOT and the Ec calculated from the
concrete compressive strength curve will be equivalent values. See Figure 3.5 for an
example of an elastic modulus plot from the camber program.
Figure 3.5 Camber Prediction Program Elastic Modulus Plot
30

3.3.3 Prestress Losses/Force
Prestress losses are calculated according to the equations discussed in Section 2.6.
However, the equations are applied to the permanent and temporary strands separately.
At the harping point and at the end of the girder, an effective eccentricity of the
permanent strands is calculated by using a combination of the straight and harped strands.
The strands are treated as an effective load by using the profile of the tendon and the total
force in it.
The elastic prestress loss is calculated by determining the prestress force after
release by using equilibrium and strain compatibility. With the total prestress force
(permanent and temporary strands) applied at an effective eccentricity, the changes in
concrete stress at the locations of the permanent and temporary strands are estimated
separately. Then the elastic shortening of the prestress can be calculated from those
stress changes.
Prestress losses due to creep, shrinkage, and relaxation are determined for the
permanent and temporary strands separately, and the prestress forces for them are
obtained. See Figure 3.6 for an example prestress force plot from the camber program.
The plot shows the prestress force that the girder sees after release.
The changes in girder curvature due to loads applied after release (e.g., temporary
strand removal and dead load) were initially included as “secondary” effects on the
prestress force of the permanent strands. The change in bending and or axial stresses
would cause a change in prestress. However, this change was considered to be minimal
in comparison to the total stress in the strands and was therefore removed from the
camber program.
31

Figure 3.6 Camber Prediction Program Prestress Force Plot
3.3.4 Deflections
The camber program calculates deflections due to the individual components of
loading. The components are superimposed to create the total camber history of the
girder. See Figure 3.7 for an example plot of the deflection history predicted by the
camber program.
32

Figure 3.7 Camber Prediction Program Deflection Plot
3.3.4.1 Self-Weight Deflection
The self-weight component of the total deflection is calculated from the elastic
deflection multiplied by the creep coefficient at the time of evaluation. The program
offers the ability to change the support conditions of the girder in four stages. Therefore,
the self-weight deflection curve may not be smooth but may have jumps due to changes
in the support locations. The support conditions considered are the following:
• Release / Lifting Loops
• Storage Yard
• Shipping
• Final Bearing
The program models the change in support conditions by adding the change in
elastic deflection and creates a creep curve associated with the new load.
33

3.3.4.2 Prestress Deflection
Deflections caused by prestress are modeled similarly to those of the self-weight.
The effects of the permanent and temporary strands are calculated separately and added
together to find the total prestress deflection. However, the program offers two methods
to calculate the deflection.
The method WSDOT uses multiplies the elastic prestress deflection by the creep
coefficient to find the deflection due to creep at any time. However, this method does not
account for the reduction in prestress force due to prestress losses.
Because the prestress load is not a constant force on the girder, but rather changes
with time as a result of prestress losses, the Modified WSDOT Method was created. To
model the prestress losses, the program uses incremental changes in the prestress force to
calculate incremental elastic changes in prestress deflection over time. Each elastic
change in deflection is considered a new load and has its own creep deflection.
3.3.4.3 Dead Load Deflection
The Dead Load deflection allows users to enter a distributed load at a specified
time. This loading could represent the casting of the diaphragms, casting of the deck, or
construction loading. The dead load of the diaphragms must be converted to an
equivalent distributed load. The load is considered to be constant for the life of the
girder.
3.4 Program Output
The camber program offers multiple plots to evaluate the time history of a single
girder or to compare the measured and calculated results for a set of girders. The
program interfaces with a MatLab Command Window when the analysis is complete, and
the user can choose which plot is needed and export the data to the MatLab plotter.
Figure 3.8 shows the interface where the user selects the type of plot to export.
34

Figure 3.8 Camber Program Plotter
The time history plot type allows the following options to be plotted against time:
• Deflection (total, self-weight, prestress, dead load)
• Prestress Force (permanent strands, temporary strands)
• Prestress Losses (permanent strands, temporary strands)
• Concrete Compressive Strength
• Concrete Elastic Modulus.
The girder set comparison plot allows the user to select the x and y axis data from
the following choices:
• X Data
Maturity at Release
Age at the Release Camber Measurement
Age at the Second Camber Measurement
Measured Concrete Compressive Strength at Release
Measured Concrete Compressive Strength at Release / f’ci Design
Measured Concrete Compressive Strength at 28 Days / f’c Design
35

Prestress Force at Release / Cross-Sectional Area
Length
Length / Depth
Month of Casting
• Y Data
Absolute Deflection Error at Release Camber
Absolute Deflection Error at Second Measured Camber
Relative Deflection Error at Release Camber
Relative Deflection Error at Second Measured Camber
A threshold variable can also be selected for plotting the deflection error in the
girder set. For example, it could be used to identify the girders with a concrete
compressive strength at release of less than 6000 psi. Figure 3.9 indicates by triangles
those girders that have an age at release of greater than or equal to two days. Not
surprisingly, those girders have some of the highest strengths of the whole set.
Figure 3.9 Example Girder Set Plot using Camber Program
36

CHAPTER 4
DETAILED CAMBER MONITORING – SNAKE LAKE GIRDERS
4.1 Purpose
In general, the data collected for each girder included camber measurements at
release and a second time before shipping. This information was useful for calibrating a
model for predicting elastic and creep behavior. However, a detailed camber study was
desired to closely study the camber history of a girder set. Eight girders were monitored
at Concrete Technology Co. (CTC) from August 29, 2005, until October 28, 2005.
Section 4.2 discusses the girder properties that were monitored, Section 4.3 discusses the
procedure used to measure the camber, and Section 4.4 provides the observed results.
4.2 Girder Properties
A detailed camber history study was conducted on the Snake Lake Bridge project
at CTC’s fabrication yard in Tacoma. All of the girders had W74G sections and were
135 feet long.
Table 4.1 shows the number of prestressing strands and girder age at release for
each of the girders monitored. The numbers of straight and temporary strands were the
same for all the girders: 26 and 6, respectively. However, the number of harped stands
varied from 11 to 17. This variation was a result of the placement location of each girder.
In the Snake Lake Bridge project, a two-span bridge was widened. The temporary
strands were used to match the camber of the new girders to the profile of the existing
bridge.
The “A” and “D” in the mark number indicate the span, while the G1 and G4
girders were exterior, and the G2 and G3 girders were interior, adjacent to the existing
superstructure.
37

Table 4.1 Snake Lake Bridge Girder Properties
Cast Date Mark No.
Number of Straight Strands
Number of Harped Strands
Number of Temporary Top
Strands Release Age
(days)
8/29/2005 G4A 26 17 6 0.9
8/31/2005 G3A 26 15 6 0.6
9/1/2005 G2A 26 11 6 0.6
9/2/2005 G1A 26 11 6 3.5
9/6/2005 G4D 26 18 6 1.5
9/8/2005 G3D 26 15 6 0.5
9/9/2005 G2D 26 11 6 2.6
9/12/2005 G1D 26 12 6 0.6
Girders G1A and G2D were cast on Fridays and considered “weekend” girders.
However, G1A matured over the Labor Day weekend, resulting in 3.5 days of curing
before release. The remaining girders were cast and released in less than one day except
for G4D. For this girder, the required release strength was not reached after one day of
accelerated curing, so the prestress release was delayed until the second day.
4.3 Data Collection Procedure
After the prestress had been released, the girder was moved to the finishing yard
and placed on timber supports. A camber reading was then taken by the University of
Washington (UW) researchers on both faces of the girder. After girder camber had been
measured on both sides of the girder, gross errors in measurement could be detected by
comparing the readings from the two sides.
A self-leveling laser level was used to measure the girder elevation and the
support locations and midspan. The level was set up near one end of the girder to obtain
a single line of sight down the side of the girder and minimize the rotation of the level
between readings. A wooden template cut to fit the section of a W74G between the web
and bottom flange had a scale fixed on the side (see Figure 4.1). The template was
38

placed vertically against the web and lowered to the bottom flange. The template was
then in contact with both the web and flange. The template worked under the assumption
that the bottom flange thickness was constant over the length of the girder.
Measurements were taken at the support locations and midspan. The camber was then
calculated by averaging the end elevations and subtracting them from the midspan
elevation.
Girder CL
Scale
Sight Level
Figure 4.1 Camber Measuring Template
Camber measurements were taken only in the morning to minimize the effects of
temperature differentials over the height of the girder caused by the sun. Measurements
were taken between 6:00 AM and 10:00 AM.
39

Camber readings were taken daily after release to monitor the early effects of
creep. The measurements were then taken at longer intervals as the rate of camber
change decreased.
4.4 Observed Behavior
The release camber measurement recorded by the UW researchers was compared
with the release measurements taken by CTC immediately after release, as shown in
Figure 4.2.
0.0
0.5
1.0
1.5
2.0
2.5
Mid
span
Cam
ber
(in.)
UW Release 2.36 1.92 1.68 1.13 1.80 1.78 1.04 1.58
CTC Release 2.16 1.80 1.68 1.08 2.04 1.92 1.08 1.80
G4A G3A G2A G1A G4D G3D G2D G1D
Figure 4.2 CTC and UW Release Camber Measurements
The UW measurements were all within ¼ inch of CTC’s measurements. This
discrepancy is probably attributable to errors in measurement. CTC measures camber
with a tape measure as the girder is hanging by the lifting loops above the casting bed.
Measurements are taken at the ends and midspan. The accuracy of this measurement is
expected to be within ¼ inch.
40

All of the girders showed an increase in camber during the duration monitored.
Figure 4.3 shows the average camber measurement between the two faces for all eight
girders.
0
1
2
3
8/30
/05
9/14
/05
9/29
/05
10/1
4/05
10/2
9/05
Date Measured
Mid
span
Cam
ber (
in.)
G4A G3AG2A G1AG4D G3DG2D G1D
Figure 4.3 Snake Lake Bridge Girders Measured Camber Data
The camber history did not produce as smooth a curve as would be expected by
the creep equations discussed in Section 2.5. Variations in the curve might be partially
attributed to measurement inaccuracies. Temperature variations might also have
contributed to the camber variations. In particular, heating the tops of the girders creates
a temperature gradient over the height. To minimize this effect, camber measurements
were taken only in the morning, before the ambient air temperature changed.
41

Figure 4.4 shows the observed “effective” creep coefficient plotted against the
release age of the girders. This does not represent the value of the creep coefficient but
rather the change in camber 45 to 60 days after release divided by the initial camber.
However, it would still be expected that the “effective” creep coefficient would decrease
as the age of loading increased.
0.00
0.25
0.50
0.75
1.00
0 1 2 3 4Age at Release (days)
"Effe
ctiv
e" C
reep
Coe
ffici
ent
G4A (Mix130) G3A (Mix140)G2A (Mix130) G1A (Mix130)G4D (Mix140) G3D (Mix190)G2D (Mix130) G1D (Mix130)
Figure 4.4 Snake Lake Girders Creep vs. Age at Release
The apparent trend may be misleading because of the small sample of girders and
measurement errors of up to 1/8 inch. According to the AASHTO LRFD method, the
factors that influence the creep coefficient are the age at loading, the age after loading,
relative humidity, volume-to-surface ratio, and the concrete strength at loading.
42

CHAPTER 5
MATERIALS TESTING
5.1 Purpose
Material tests were performed on concrete for six of the eight girders cast at
Concrete Technology Corporation (CTC) for the Snake Lake Bridge project. The
materials tests were conducted to evaluate the compressive strength, elastic modulus,
shrinkage, and creep properties of the concrete and to compare them with the cambers
observed for the girders. The detailed camber history study that was conducted on these
girders is discussed in Chapter 4.
Section 5.2 discusses the procedure followed to transport the cylinders from
CTC’s fabrication plant in Tacoma, Washington, to the materials lab at the University of
Washington (UW) in Seattle, Washington. Sections 5.3 and 5.4 describe the concrete
compressive strength and elastic modulus tests. Creep and shrinkage tests were also
performed one on the girders and are discussed in Section 5.5. Testing was limited by the
number of accelerated-cured and moist-cured cylinders that CTC was able to provide.
All cylinders were 4 in. by 8 in. Both moist-cured and accelerated-cured cylinders were
tested to compare the differences in curing methods and the influences on the material
properties.
5.2 Cylinder Transportation and Curing Procedures
Two procedures were followed for transporting and curing the cylinders received
from CTC. One method was used for girders on which only concrete compressive
strength tests and elastic modulus tests were performed. A second method was used for
the girders on which creep and shrinkage tests had been performed, in addition to the
compressive strength and elastic modulus tests.
The accelerated-cured cylinders collected from CTC girders G4A, G2A, G4D,
and G3D were used for compressive strength and elastic modulus testing only. These
43

cylinders were cured by CTC at the same temperature as the girders by using matched
cure molds. After the concrete compressive strength was high enough to allow prestress
release, the UW researchers removed the cylinders from the cure molds and immediately
covered them in plastic bags to prevent moisture loss before testing. The cylinders were
then insulated by wrapping them in newspaper and placing them in an insulated box (a
food cooler) for transportation to approximate the temperature history of the girder. The
ambient air temperature during the week that the cylinders were transported from Tacoma
to Seattle (first week of September, 2004) ranged from 55 to 60°F.
After the required concrete compressive strength had been reached, CTC released
the strands. The time taken for release was approximately the same as the time it took to
transport the cylinders from CTC to the UW materials lab. The drive time was between
45 and 75 minutes, depending on the traffic congestion. After arrival at the UW, two
cylinders were removed from the cooler and unwrapped. Concrete compressive strength
and elastic modulus tests were conducted at approximately the same time as the girder
prestress was being released. After the release testing, the cylinders were kept in the
insulated box for 24 hours and then placed in a fog room for storage at approximately
70°F.
The second procedure was intended for girders G2D and G1D. However, CTC
did not supply moist-cured cylinders for girder G2D, so accelerated-cured cylinders were
used to test the procedure for creating the creep and shrinkage stacks discussed in Section
5.5.1. Accelerated-cured and moist-cured cylinders from girder G1D were collected from
CTC. These cylinders were used for creep and shrinkage tests in addition to compressive
strength and elastic modulus tests. Once CTC obtained the required strength for prestress
release, the cylinders were covered in plastic bags to prevent additional moisture loss
before testing. However, to reduce the effects of temperature changes on the creep and
shrinkage results, these cylinders were not insulated in newspaper or placed in a cooler.
Instead they were secured in a bin that was open to the air during transportation. The
44

intent was to bring the cylinder temperature down to the ambient temperature before
testing. When the cylinders arrived at the UW lab, all the cylinders were removed from
the plastic bags and prepared for the creep and shrinkage testing. The cylinders used for
the compressive strength and elastic modulus tests were stored unwrapped in the same
area as the creep and shrinkage tests to cure at the same temperature and relative
humidity.
5.3 Concrete Compressive Strength
Concrete compressive strength tests were performed on all the girders at release
and at multiple subsequent times, depending on the quantity of cylinders available.
These tests were performed to observe the strength curve with maturity of the concrete.
Accelerated-cured cylinders were taken of mix #130 from girder G4A, G2A, G2D and
G1D. Girder G4D used mix #140, and G3D used mix #190.
Figure 5.1 shows the results of the UW and CTC concrete compressive strength
tests for the accelerated-cured cylinders for mix #130. Figure 5.2 shows the UW concrete
compressive strength tests for the moist-cured cylinders collected from girder G1D. CTC
did not test any moist-cured cylinders. Equation 2.1 was used to model the concrete
compressive strength over time and calibrated to fit the test data. Table 5.1 shows the
coefficients that are recommended by Naaman (Naaman 2004).
Table 5.1 Concrete Compressive Strength Modeling Coefficients
Recommended
(Naaman, 2004) Best Fit
b = 0.3 0.15 Accelerated-Cured c = 0.98 1.06
b = 2.3 0.8 Moist-Cured
c = 0.99 0.99
45

However, to better model the behavior of the specific mix, the “best fit”
coefficients were found by minimizing the error between the predicted and measured
values. Still, the model did not predict well the concrete compressive strength of the
accelerated-cured cylinders for the tests that were performed between two and ten days.
The difficulty in fitting the data throughout the 28-day period may have been a
consequence of the fact that the cylinders were subjected to two curing environments
(before and after release). Two equations may have been necessary to model this
behavior. The AASHTO LRFD method suggests that one day of moist-cure is equivalent
to seven days of accelerated-cure. Figure 5.1a shows an average concrete compressive
strength of 8500 ksi at one day for the accelerated-cured cylinders, and Figure 5.1b shows
a concrete compressive strength of 10,375 ksi at seven days for the moist-cured cylinders.
46

a) Snake Lake Bridge - Mix 130, Accelerated-Cured
0
4
8
12
0 10 20 3Time (days)
f c (k
si)
0
Eq. 2.1 (b = 0.3, c = 0.98) Naaman RecommendedUW TestsCTC TestsEq. 2.1 (b = 0.15, c = 1.06)
b) Snake Lake Bridge - Mix 130, Moist-Cured
0
4
8
12
0 10 20Time (days)
f c (k
si)
30
Eq. 2.1 (b = 2.3, c = 0.92) Naaman Recommended UW TestsEq. 2.1 (b = 0.8, c = 0.99)
Figure 5.1 Snake Lake Bridge Project Concrete Compressive Strengths a) Accelerated-Cured b) Moist-Cured
47

5.4 Elastic Modulus
Elastic modulus tests were performed on all girders at release and at multiple
subsequent times, depending on the quantity of cylinders provided by CTC. Each
cylinder used for a concrete compressive strength test had a corresponding elastic
modulus test. To obtain additional points along the elastic modulus curve, elastic
modulus tests were performed between scheduled breaks on a separate cylinder. This
cylinder was then used for the 28-day compressive strength test. All elastic modulus tests
were conducted on accelerated-cured cylinders except for several tests on the cylinders
from G1D.
The only available elastic modulus testing apparatus was designed for 6-in. by 12-
in. cylinders. However, it was adapted for use with 4-in. by 8-in. cylinders. Several of
the elastic modulus tests provided nonlinear stress-strain data and were removed from the
evaluation. The nonlinearity was attributed to shortcomings of the test rig. Mixes #130,
#140, and #190 were all included in the comparison.
Figure 5.2 plots the elastic modulus test values against the age of the concrete
cylinders. During the first few days, the elastic modulus tended to increase with
increasing age. The moist-cured (MC) cylinders for Girder G1D of mix #130 had a
smaller elastic modulus value at release, as would be expected because of a lower
concrete compressive strength at release. However, as the moist-cured cylinders
matured, the elastic modulus of these cylinders approached the magnitude of the
accelerated-cured cylinders. After four days, there was considerable scatter in the data
(see Figure 5.2). For all the cylinders, the changes with time were masked by the scatter.
More data are needed to determine a reliable trend.
48

0
2000
4000
6000
8000
0 10 20Time (days)
Elas
tic M
odul
us (k
si)
30
G4A Mix#130 G2A Mix#130G4D Mix#140 G3D Mix#190G2D Mix#130 G1D Mix#130G1D(MC) Mix#130
Figure 5.2 Snake Lake Bridge Elastic Modulus Test Results
All methods for predicting the elastic modulus are functions of the concrete
compressive strength, as discussed in Section 2.3. Figure 5.3 compares the measured and
predicted elastic modulus as functions of the concrete compressive strength. The CEB-
FIP equation was the best predictor of the elastic modulus. The equation proposed by
Tadros et al., with K2 = 1.0, was slightly higher than the mean of the measured data. The
equations recommended by the AASHTO LRFD and ACI underestimated nearly all the
measured data. This was consistent with the predicted camber data collected at release,
as discussed in Chapter 4. On average, the measured elastic modulus was 8 percent
higher than the value predicted by the AASHTO LRFD method.
49

0
2000
4000
6000
8000
0 4 8
Concrete Compressive Strength (ksi)
Elas
tic M
odul
us (k
si)
12
G4A Mix#130 G2A Mix#130G4D Mix#140 G3D Mix#190G2D Mix#130 G1D Mix#130G1D(MC) Mix#130 AASHTO LRFDAC I363 NCHRP (K1 = 1.154, K2 = 0.817)NCHRP (K1 = 1.154, K2 = 1.182) NCHRP (K1 = 1.154, K2 = 1.000)CEB FIP (a = 1.1)
Figure 5.3 Snake Lake Bridge Elastic Modulus vs. Concrete Compressive Strength
For girder G1D, the elastic modulus was also calculated from the creep tests.
Cylinders were loaded in the creep rigs at ages of one, three, and seven days. For each
cylinder, the shortening due to the initial loading was measured and the elastic modulus
was calculated as the change in strain divided by the change in stress. These tests are
discussed further in Section 5.5. Table 5.2 shows the elastic modulus calculated for the
sealed and unsealed cylinders in the same stack for both the moist-cured and accelerated-
cured cylinders.
50
Table 5.2 Creep Test Elastic Modulus at Initial Loading – G1D
Nominal Loading Age 1-Day 3-Day 7-Day
Accelerated-Cured
Age (days) 0.68 2.93 6.90
Compressive Stress (psi) 3855 3868 3868
E. Mod – Sealed (ksi) 4715 5643 5311
E. Mod – Unsealed (ksi) 4695 5825 4333
Moist-Cured
Age (days) 0.97 2.88 6.87
Compressive Stress (psi) 2437 2365 2365
E. Mod – Sealed (ksi) 3547 4266 4623
E. Mod – Unsealed (ksi) 3493 4528 4133
The elastic modulus calculated from the creep cylinders at the time of loading was
smaller than the values obtained from the elastic modulus test specimens. This could
have been caused to slight errors in the calibration of the ram used to load the creep rig.
5.5 Shrinkage and Creep
Shrinkage and creep tests were performed on accelerated and moist-cured
cylinders. These tests were performed on the concrete mix that was used for the Snake
Lake Bridge project girder G1D, mix #130. Eight stacks consisting of two cylinders each
were prepared. Moist-cured cylinders were used for four of the stacks, and accelerated
cured-cylinders were used for the remaining four. One stack of each cure type was
loaded after one day of curing (same time as release of prestress), three days of curing,
and seven days of curing. The remaining stacks (one of each cure type) were not loaded
but were monitored to determine the effects of shrinkage.
5.5.1 Shrinkage and Creep Preparation Protocol
After all of the accelerated and moist-cured cylinders arrived at the UW materials
lab, four accelerated-cured cylinders were removed immediately. Two of these were
51

prepared for a shrinkage specimen, and two were prepared for a long-term creep
specimen. All specimens were prepared by the same method described here.
Each of the two cylinders in a cylinder stack was capped with sulfur on one end.
One cylinder was then wrapped in furnace tape to minimize changes in strain due to
drying. A 6-inch steel spacer was used to create a stack by using quick-set epoxy
between the steel and uncapped ends of the concrete cylinders, because the cylinders
were 8 inches long but the available Whittemore (mechanical) strain gauge had a gauge
length of 10 inches. The stack was then marked with N, S, E and W faces and identified
by the cure type and loading designation. Targets were fastened at three locations along
the length of the specimen on each quarter. The locations included the center of the steel
spacer and 1 inch from each end of the stack on the concrete cylinders. This allowed for
10-inch spacing between the targets along the length to accommodate the 10-inch length
of the Whitemore gauge used to monitor the changes in strain. Figure 5.4 shows a
completed stack.
52

Figure 5.4 Creep and Shrinkage Stack Configuration
5.5.2 Creep Loading Procedure
One accelerated-cured stack and one moist-cured stack were loaded at one, three
and seven days. The loading procedure was the same for all six specimens. A
Whitemore demountable mechanical strain gauge was used to measure the change in
distance between the targets mounted in the middle of the steel spacer and the target
mounted on the concrete cylinders. Initial gauge readings were measured around the
specimen before it was loaded. These values were treated as the base values and were
subtracted from all subsequent measurements to find the change in strain at any time.
A lower plate was mounted under the table and coupled to the four threaded rods.
A hydraulic ram was placed on the lower plate so it could push on the bottom of the table
and pull the rods through the table. As the rods pulled down on the top plate above the
53

specimen, they squeezed the specimen between the top plate and the plate supported by
the springs. Therefore, when the rods were secured by bolts on the bottom of the table
and the ram was removed, the springs carried all of the force applied to the stack. The
nuts on the rod above the plate supported by the springs were left loose. They were
threaded to within ¼ inch of the plate to prevent the top plate from falling if the specimen
broke. See Figure 5.5 for a detail of the creep rig. Figure 5.6 shows the creep rig with a
loaded specimen.
Figure 5.5 Creep Rig Detail (Barr et al. 2000)
54

Figure 5.6 Creep Rig Assembly
The original creep rig design was configured with ten springs to accommodate a
stack of five 6-in. by 12-in. cylinders. Five smaller springs were placed within five larger
springs to provide stiffer force capacity. For these creep tests (on 4-in. by 8-in.
cylinders), only four of the larger springs were used to reduce the stiffness of the rig. By
reducing the stiffness, small deflections in the springs due to creep of the specimen would
result in small changes in spring force.
The maximum concrete stress allowed for prestressed concrete at release is
0.60f’ci (AASHTO 2006). Because the concrete strength was different for the
accelerated-cured and moist-cured cylinders at initial loading, different loads were
55

applied to each and determined from the release concrete compressive strength tests. The
accelerated-cured cylinders were loaded to 3868 psi, and the moist-cured cylinders were
loaded to 2365 psi.
Gauge readings were taken daily during the early stages of the test to closely
monitor changes. Later, the readings were taken at longer intervals.
5.5.3 Observed Shrinkage Behavior
The observed behaviors of the accelerated-cured and moist-cured shrinkage
specimens are shown in figures 5.7 and 5.8, respectively. Surprisingly, only the
unsealed, moist-cured cylinder consistently shortened with cylinder age (i.e., negative
strain). The other cylinders elongated or changed little in length. This elongation was
not expected and introduced a complication that had not been anticipated.
The quality of the data collected could have been influenced by any of the
following. Small changes in the gauge readings were noticed during the early stages of
the monitoring as a result of slight bumps to the gauge that shifted the dial. The standard
rod was used between each measured cylinder to detect these shifts and adjust the gauge
reading. Because the assembly of the stacks was time sensitive, the targets may have
been hastily applied. Not all of the targets were perfectly aligned vertically and may
have shifted or sagged while the epoxy was setting.
Further material testing is necessary to better understand the behavior of the
concrete’s shrinkage behavior. Therefore, the shrinkage strain was not subtracted from
the total to determine the strain due to creep alone.
56

Accelerated-Cured Cylinders - Shrinkage
-0.45
-0.30
-0.15
0.00
0.15
0.30
0.45
0.60
0 45 90Age (days)
Stra
in (i
n./in
. * 1
000)
135
AC-Sealed G1D 3-Day AC-Unsealed G1D 3-DayAC-Sealed G1D 7-Day AC-UnSealed G1D 7-DayAC-Sealed G1D Shrinkage AC-Unsealed G1D Shrinkage
Figure 5.7 Snake Lake Bridge Accelerated-Cured Shrinkage History
Moist-Cured Cylinders - Shrinkage
-0.45
-0.30
-0.15
0.00
0.15
0.30
0.45
0.60
0 45 90Age (days)
Stra
in (i
n./in
. * 1
000)
135
MC-Sealed G1D 3-Day MC-Unsealed G1D 3-DayMC-Sealed G1D 7-Day MC-UnSealed G1D 7-DayMC-Sealed G1D Shrinkage MC-Unsealed G1D Shrinkage
Figure 5.8 Snake Lake Bridge Moist-Cured Shrinkage History
57

5.5.4 Observed Creep Behavior
Creep tests monitored the cylinder strain over time after the initial load had been
applied. Note that, because of difficulties in interpreting the shrinkage data, the strain
results shown include strain changes due to shrinkage and are considered the total strain.
Figure 5.9 shows the total change in concrete strain for the accelerated-cured cylinders,
and Figure 5.10 shows results for the moist-cured cylinders. Each cylinder is designated
by the age of the cylinder at loading and whether it was sealed on unsealed.
The sealed and unsealed cylinders were intended to simulate large (sealed) and
small (unsealed) volume-to-surface ratios. For both the accelerated-cured and moist-
cured cylinders, the sealed cylinders crept more than the cylinders that were not sealed.
This might have been the result of drying shrinkage occurring in the unsealed cylinder
while the sealed cylinders retained their moisture. Another explanation could be the
result of free moisture being squeezed out of the unsealed cylinder, causing additional
strain.
The moist-cured cylinders showed a wider range in strain with respect to the age
of loading and sealed conditions. However, the sealed moist-cured cylinders had less
concrete strain than the sealed accelerated-cured cylinders because of less load applied.
If the sealed cylinders were assumed to be completely devoid of shrinkage strain due to
loss of free water, then differences between the two might be attributed to different
quantities of creep strain or different quantities of shrinkage strain due to chemical
hydration.
The data showed that the concrete strain increased and the rate of deformation
decreased as time increased.
58

Accelerated-Cured
-2.0
-1.5
-1.0
-0.5
0.0
0 40 80 120Time (days)
Tota
l Stra
in (i
n./in
.*100
0)G1D-AC-Release(Sealed) G1D-AC-Release(UnSealed)G1D-AC-3Day(Sealed) G1D-AC-3Day(UnSealed)G1D-AC-7Day(Sealed) G1D-AC-7Day(UnSealed)
Figure 5.9 Snake Lake Bridge Accelerated-Cured Strain History
Moist-Cured
-2.0
-1.5
-1.0
-0.5
0.0
0 40 80 120Time (days)
Tota
l Stra
in (i
n./in
.*100
0)
G1D-MC-Release(Sealed) G1D-MC-Release(UnSealed)G1D-MC-3Day(Sealed) G1D-MC-3Day(UnSealed)G1D-MC-7Day(Sealed) G1D-MC-7Day(UnSealed)
Figure 5.10 Snake Lake Bridge Moist-Cured Strain History
59

Table 5.3 shows a sample calculation of the total, basic and drying creep. These
calculations were based on the accelerated-cured and moist-cured stacks that were loaded
at one day and measured at 121 days after casting. The strain values in Table 5.3 come
from the creep and shrinkage strain plots. The calculated drying creep was positive. This
behavior corresponds to a negative drying component of the creep coefficient and must
be considered improbable.
Table 5.3 Creep Calculation G1D Stack Loaded at Release
(με) AC MC *AC/MC
Concrete Age (days) 121 121
Compressive Stress (psi) 3868 2364 1.636
Total Shrinkage -330 -430 Autogenous Shrinkage 180 90
Drying Shrinkage -510 -510
Total -1530 -1720
Elastic -820 -700
Shrinkage -330 -430
Uns
eale
d
Total Creep -370 -590 -965
Total -1460 -1270
Elastic -810 -690
Shrinkage 180 80 Seal
ed
Basic Creep -830 -660 -1080
Drying Creep 460 70 115
*Multiplies the ratio of the stresses and the MC creep values to compare with the AC creep values.
Figures 5.11 and 5.12 show the calculated creep coefficient of each cylinder stack
based on the total strain observed, including the shrinkage strain. The creep coefficient
shown here is the total observed time-dependent strain divided by the initial elastic strain.
This value is extremely sensitive to the value of the measured elastic strain.
60

Accelerated-Cured
0.0
0.5
1.0
1.5
2.0
0 40 80Time (days)
Cre
ep C
oeffi
cien
t
120
G1D-AC-Release(Sealed) G1D-AC-Release(UnSealed)G1D-AC-3Day(Sealed) G1D-AC-3Day(UnSealed)G1D-AC-7Day(Sealed) G1D-AC-7Day(UnSealed)
Figure 5.11 Snake Lake Bridge Accelerated-Cured Creep Coefficient
Moist-Cured
0.0
0.5
1.0
1.5
2.0
0 40 80 120Time (days)
Cre
ep C
oeffi
cien
t
G1D-MC-Release(Sealed) G1D-MC-Release(UnSealed)G1D-MC-3Day(Sealed) G1D-MC-3Day(UnSealed)G1D-MC-7Day(Sealed) G1D-MC-7Day(UnSealed)
Figure 5.12 Snake Lake Bridge Moist-Cured Creep Coefficient
61

Most of the accelerated-cured cylinders had creep coefficients that lay between
0.7 and 1.1 at the end of the measuring period. However, cylinder G1D-AC-3Day had a
creep coefficient of 1.6. For the moist-cured cylinders, the final creep coefficients were
more evenly distributed over a larger range of 0.9 to 1.7. For both cure types, the
cylinders that were unsealed showed higher creep coefficients than those that were
sealed.
62

CHAPTER 6
FIELD CAMBER MONITORING – KEYS ROAD GIRDERS
6.1 Purpose
The camber monitoring data for the Snake Lake girders described in Chapter 4
did not show the expected effects of the release of temporary strands and deck placement.
To evaluate the effects of these operations further, a detailed camber study was conducted
on 91 girders for the Keys Road Bridge project in Yakima, Washington. Cambers were
measured before and after the release of the temporary strands; before and after the cast-
in-place deck pour; and at monthly intervals after these events. As many as nine and as
few as four sets of camber measurements were taken on each of seven spans from
November 30, 2005, to November 13, 2006. Section 6.2 summarizes the properties of
the girders that were monitored. Section 6.3 discusses the measurement procedure.
Section 6.4 discusses possible errors in the collected data and the data processing
procedure, and Section 6.5 presents the measured results.
6.2 Girder Properties
The effects of the release of temporary strands and deck placement were
measured on the Keys Road Bridge. All of the girders measured had W83G sections and
were approximately 178 ft long.
The bridge had nine spans of 13 girders each. Spans 1 and 2 were inaccessible
and not monitored. In this chapter, the middle seven girders (D-J) will be referred to as
the interior girders, whereas the three on each side (A-C and K-M) will be referred to as
the exterior girders (Figure 6.1). The girder schedule in the contract plans shows that the
amounts of prestressing steel and the concrete strengths differed slightly between these
two types of girders.
63

A
B
C
D
E
F
G
H
I
J
K
L
M
Exterior
Exterior
Interior
Figure 6.1 Typical Girder Layout
The end conditions varied among the spans. In spans 4, 5, 6, and 8 the construction procedure
caused the piers to provide some restraint to the girder end rotation. Therefore, those spans
behaved as partially restrained at both ends. Specifically, the girders in them were placed on
oak blocks, braced laterally, and the temporary strands were released. The bottom flange was
then embedded 7 in. into the pier, with an 18-in.-deep concrete step covering the bottom
flange, as shown in Figure 6.2. The diaphragms were cast, the deck was placed, and the pier
closure pour was cast. In each of the remaining spans (3, 7, and 9), one end of the girder was
cast continuously, as described above, and the other end was placed on an elastomeric bearing
pad to allow some rotation and displacement. The support conditions for all spans are shown
in Figure 6.3. Table 6.1 summarizes the differences between the interior and exterior girders
for each span and identifies the spans in which one end was placed on an elastomeric bearing
pad.
64

Figure 6.2 Embedment of Girder End in Partial-Height Diaphragm.
65

Figure 6.3 Keys Road Bridge: Support Conditions for All Spans
Table 6.1 Keys Road Bridge Girder Properties
Span
Plan Length
(ft) Interior/ Exterior
Number of Straight
Strands
Number of Harped
Strands
Number of Temporary
Strands
Design f’c at
Release
Design f’c at
28-Days
3* 178.50 Ext. 46 23 6 7.7 9.0
3* 178.50 Int. 46 22 6 7.5 9.0
4 178.00 Ext. 46 22 6 7.6 9.0
4 178.00 Int. 44 23 6 7.4 9.0
5 178.00 Ext. 46 22 6 7.6 9.0
5 178.00 Int. 44 23 6 7.4 9.0
6 178.00 Ext. 46 22 6 7.6 9.0
6 178.00 Int. 44 23 6 7.4 9.0
7* 178.50 Ext. 46 24 6 7.9 9.0
7* 178.50 Int. 44 24 6 7.5 9.0
8 177.95 Ext. 46 24 6 7.9 9.0
8 177.95 Int. 46 22 6 7.5 9.0
9* 176.09 Ext. 46 24 6 7.5 9.0
9* 176.09 Int. 44 24 6 7.2 9.0
* One end of the span was placed on an elastomeric bearing.
6.3 Data Collection Procedure
The girders were cast in Pasco, Washington, by the Central Premix Prestress Co.
(CPM) and shipped to the project site in Yakima, Washington. All camber
measurements were recorded by the WSDOT project office survey crew.
66

For all the girders in spans 3 through 8, camber measurements were recorded
before and after the temporary strands were released. After the bottom flange had been
cast into the pier cap, camber measurements were recorded monthly until the deck was
cast. Measurements were then taken before, and one day after, deck placement. The
girders in spans 3, 4, and 5 were not monitored after deck placement because these
girders spanned over water, so the surveyors could not easily measure the elevation of the
bottom flange of the girders. Monthly readings were recorded after deck placement for
spans 6 through 9. Table 6.2 shows the camber measurement schedule for each span.
Table 6.2 Camber Measurement Schedule
Span
Before and After Temporary Strand
Release
Additional Monthly
Measurements
Before and After Deck
Placement
Additional Monthly
Measurements
3 Yes 5 No 0
4 Yes 6 No 0
5 Yes 6 No 0
6 Yes 2 Yes 2
7 Yes 3 Yes 1
8 Yes 1 Yes 2
9 No 1 Yes 1
The monitoring positions were marked on the top and bottom flanges at mid-
width of the girders at both the ends and midspan before the girders were erected.
(Details are shown in figures 6.5 and 6.6.) Before the deck placement, camber
measurements were taken at the top of the girder. After the deck placement, the top of
the girder was no longer accessible, so the measurements were taken on the underside of
the bottom flange.
The top girder targets were marked approximately 1 ft from the end of the girder,
near the centerline of the bearing. The targets on the bottoms of the girders were marked
67

at the face of the pier cap or abutment wall, about 1 ft inside the bearing centerline.
Figure 6.4 shows a typical set of camber measurements for interior and exterior, with one
and two ends of continuity. The target locations are shown in figures 6.5 and 6.6.
0.0
2.0
4.0
6.0
8.0
4/1/
06
5/31
/06
7/30
/06
9/28
/06
11/2
7/06
Date
Mea
sure
dCam
ber (
in.)
Exterior, Two Ends ContinuousInterior, Two Ends ContinuousExterior, One End ContinuousInterior, One End Continuous
Figure 6.4 Typical Set of Camber Measurements
Measurements were recorded with a Leica Automatic Level and rod. Benchmarks
were established at both ends of the bridge and back-sighted at a distance of
approximately 150 feet with a reported accuracy of 1:20,000. Intermediate set-ups were
established at bearing locations at a maximum distance of 300 feet apart. On the tops of
the girders, the points of measurement were located between the stirrups, where the
amplitude of the irregularities due to the roughened surface was reported to be up to ¾ in.
On the bottoms of the girders, measurements were taken by extending the rod as much as
30 feet to the target location. This could only be done over land. The surveyor’s accuracy
on each closure was reported to be within 1:5,000.
68

Target
Target
Stirrup
Roughened Surface
Figure 6.5 Girder Target Locations per Section
Pier Cap Abutment
Wall
CL Brg.
CL Brg.
Top Measurement
Approx. 1’ (Typ.)
0’-9” to 1’-0” 1’-8”
Bottom Measurement
Mid-Span
Figure 6.6 Girder Target Locations over Span Length
Central Premix Prestress Co. provided the concrete compressive strengths at
release and at 28 days for all of the monitored girders except for those in Span 9.
69

Therefore, the average increase in concrete compressive strength from the design value in
spans 3 through 8 was applied to Span 9 to estimate the actual strength (see Table 6.3).
The measured strengths all exceeded the design values. On average, the measured
concrete strength at release exceeded the design strength by 11 percent. The measured
strength at 28 days exceeded the design strength by an average of 17 percent.
Table 6.3 Design and Measured Concrete Compressive Strengths (ksi)
Release 28-Day Span Group Design Actual Design Actual
3 Ext. 7.7 8.5 9.0 10.8 3 Int. 7.5 8.4 9.0 10.8 4 Ext. 7.6 8.1 9.0 10.0 4 Int. 7.4 8.3 9.0 10.5 5 Ext. 7.6 8.5 9.0 10.9 5 Int. 7.4 8.5 9.0 10.3 6 Ext. 7.6 8.4 9.0 11.6 6 Int. 7.4 8.4 9.0 11.2 7 Ext. 7.9 8.5 9.0 10.4 7 Int. 7.5 8.2 9.0 10.0 8 Ext. 7.9 8.4 9.0 10.0 8 Int. 7.5 8.3 9.0 9.5 9 Ext. 7.5 8.3* 9.0 10.5* 9 Int. 7.2 8.0* 9.0 10.5* All All 7.6 8.4 9.0 10.5 Actual/Design 1.11 1.17
*Estimate of the actual concrete compressive strength from increasing the design value by the average ratio of actual/design.
6.4 Errors and Data Processing
Several factors may have contributed to errors in the camber measurements. The
first factor was the accuracy of the measuring instrument. With a reported instrument
accuracy of 1:20,000, the resultant error for a 180-foot length would be 1/10 in. The
accuracy of the measurements in the interior spans was reported to be less than that
achieved at the benchmarks. The closure error was reported to be better than 1:5,000.
This could have resulted in an average error of 7/16 in. over 180 feet.
70

The girder elevations for spans 6, 7, and 8 were measured on both the top and
bottom of the girders before deck placement. The goal was to minimize errors caused by
the change in the target used before and after deck casting. It would be reasonable to
assume that these two sets of measurements would produce the same cambers, but the
data showed that the camber measured on the top of the girder was over ½ in. larger on
average, and that the trend was consistent over all three spans and for both interior and
exterior girders. Table 6.4 shows the difference between the cambers obtained from the
top and bottom measurements for the three spans, and for interior and exterior girders
separately. The interior and exterior girders showed nearly equal trends, so the effect
appears unrelated to girder location.
Table 6.4 Difference Between Camber Measured on Top and Bottom of Girder
Span Ave. Top
Camber (in.) Ave. Bottom Camber (in.)
(Top – Bottom) (in.)
6 Ext. 3.87 3.43 0.44
6 Int. 3.71 3.63 0.08
7 Ext. 4.09 3.42 0.67
7 Int. 4.40 3.54 0.86
8 Ext. 5.08 4.39 0.70
8 Int. 4.53 3.90 0.62
All Exterior 4.35 3.75 0.60
All Interior 4.21 3.69 0.52
All Girders 4.28 3.72 0.56
Measurement errors would be expected to be random, so they are unlikely to
explain the phenomenon. For example, readings on the bottom of the girder were taken
with the rod extended up to 30 feet. Longer rod lengths can decrease the accuracy of the
reading by not achieving a plumb status with the target and through slip in the extension
joints of the rod. If the bottom of a 30-ft. rod were 18 in. out of plumb with the top, the
71

camber measurement error would be 0.45 in. This is the same order of magnitude as the
observed discrepancies, but the measurement error would have had to be made
consistently on all girders, which appears improbable.
As explained in Section 6.3, the upper and lower targets were located at different
distances from the end of the girder. This placement leads to an error in camber that can
be approximated by the product of the end slope of the girder and the difference in end
distances of the targets. If the cambered shape due to both prestressing and self-weight is
taken to be the same as that due to a uniform load, the camber error is
⎟⎠⎞
⎜⎝⎛Δ⎟
⎠⎞
⎜⎝⎛ Δ=Δ
22.3 L
Lxend
error
6.1
where
errorΔ = difference in camber obtained from the two targets
endxΔ = difference in horizontal locations of the two targets
⎟⎠⎞
⎜⎝⎛Δ
2L = camber at mid-span
L = span, measured to target nearest the girder end
For a mid-span camber of 4 in. and a span of 197 ft., the expected camber error
caused by moving the end target by 1 ft would be 0.068 in. This is much smaller than the
observed error shown in Table 6.4 and so cannot be the cause.
Other, less probable, causes for the error must therefore be sought. One is that the
girders were slightly deeper at mid-span than at the ends. This could have been the result
of the roughened surface on top of the girder. With the surface having an irregular
texture, the bottom of the rod could have rested on a higher surface than the mean top
elevation. However, it is improbable that this would have been consistently true for all
girders. It is also possible that the form was not prismatic. (The contractor confirmed
72

that all of the girders were made for a single form) But again, this appears improbable
because the forms are made of steel to precise tolerances.
The reason for the difference remains unknown. To account approximately for
the discrepancy, the average difference (0.58 in.) was subtracted from the top-of-girder
camber measurements in the calculation of short-term deflections due to deck placement.
The cambers used in the subsequent calculations were thus less than the measured values.
6.5 Observed Behavior
The measured cambers were compared to calculated values to identify trends in
field measurements and to verify the design assumptions. For each span, the girders were
grouped into interior and exterior girders, as described in Section 6.2, and the average of
each group was compared with the calculated value for that group. For each set of
girders, the cast dates were averaged to compute the time-dependent creep deflection
after deck placement. Table 6.5 provides the average measured and calculated camber
changes. Deflections were calculated by using equations defined in Section 2.7 assuming
that each girder was simply supported. The elastic modulus was calculated by using the
AASHTO LRFD method (Equation 2.2) with the average measured concrete strength for
that group and included the 15 percent increase in elastic modulus, as recommended in
Chapter 9.
73
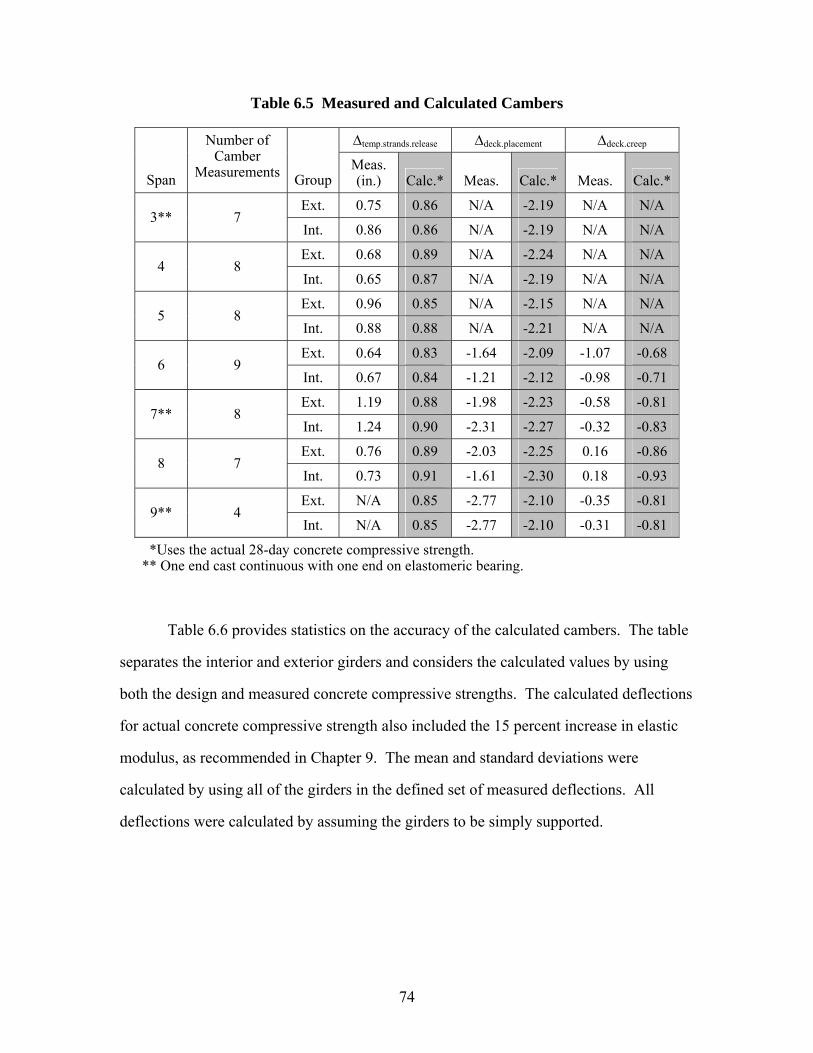
Table 6.5 Measured and Calculated Cambers
Δtemp.strands.release Δdeck.placement Δdeck.creep
Span
Number of Camber
Measurements GroupMeas. (in.) Calc.* Meas. Calc.* Meas. Calc.*
Ext. 0.75 0.86 N/A -2.19 N/A N/A 3** 7
Int. 0.86 0.86 N/A -2.19 N/A N/A
Ext. 0.68 0.89 N/A -2.24 N/A N/A 4 8
Int. 0.65 0.87 N/A -2.19 N/A N/A
Ext. 0.96 0.85 N/A -2.15 N/A N/A 5 8
Int. 0.88 0.88 N/A -2.21 N/A N/A
Ext. 0.64 0.83 -1.64 -2.09 -1.07 -0.68 6 9
Int. 0.67 0.84 -1.21 -2.12 -0.98 -0.71
Ext. 1.19 0.88 -1.98 -2.23 -0.58 -0.81 7** 8
Int. 1.24 0.90 -2.31 -2.27 -0.32 -0.83
Ext. 0.76 0.89 -2.03 -2.25 0.16 -0.86 8 7
Int. 0.73 0.91 -1.61 -2.30 0.18 -0.93
Ext. N/A 0.85 -2.77 -2.10 -0.35 -0.81 9** 4
Int. N/A 0.85 -2.77 -2.10 -0.31 -0.81
*Uses the actual 28-day concrete compressive strength. ** One end cast continuous with one end on elastomeric bearing.
Table 6.6 provides statistics on the accuracy of the calculated cambers. The table
separates the interior and exterior girders and considers the calculated values by using
both the design and measured concrete compressive strengths. The calculated deflections
for actual concrete compressive strength also included the 15 percent increase in elastic
modulus, as recommended in Chapter 9. The mean and standard deviations were
calculated by using all of the girders in the defined set of measured deflections. All
deflections were calculated by assuming the girders to be simply supported.
74

Table 6.6 Measured and Calculated Changes in Camber
2 Ends Continuous 1 End Continuous (μ ± σ) Exterior Interior Exterior Interior
Δm (in.) 0.76 ± 0.16 0.73 ± 0.19 1.05 ± 0.28 1.05 ± 0.27 Δm/Δc(Design f'c) 0.70 ± 0.15 0.68 ± 0.18 0.98 ± 0.26 0.98 ± 0.25 Δm/Δc(Actual f'c) 0.88 ± 0.19 0.84 ± 0.22 1.22 ± 0.31 1.21 ± 0.29
Tem
pora
ry
Stra
nds R
el.
Δm (μ ± σ) (in.) -1.54 ± 0.41 -1.13 ± 0.47 -1.79 ± 0.81 -1.96 ± 0.64
Δm/Δc(Design f'c) 0.57 ± 0.15 0.41 ± 0.17 0.66 ± 0.32 0.72 ± 0.25 Δm/Δc(Actual f'c) 0.71 ± 0.20 0.51 ± 0.21 0.82 ± 0.39 0.90 ± 0.56 D
eck
Plac
emen
t
Δm (μ ± σ) (in.) -0.46 ± 0.70 -0.40 ± 0.70 -0.46 ± 0.49 -0.32 ± 0.56
Δm/Δc(Design f'c) 0.40 ± 0.63 0.35 ± 0.62 0.42 ± 0.44 0.29 ± 0.51 Δm/Δc(Actual f'c) 0.53 ± 0.86 0.45 ± 0.81 0.54 ± 0.56 0.36 ± 0.56 D
eck
C
reep
*
Δm (μ ± σ) (in.) -0.46 ± 0.70 -0.40 ± 0.70 -0.46 ± 0.49 -0.32 ± 0.56
Δm/Δc(Design f’c) 0.72 ± 1.11 0.62 ± 1.11 0.74 ± 0.78 0.51 ± 0.90 Δm/Δc(Actual f’c) 0.94 ± 1.52 0.79 ± 1.43 0.95 ± 0.99 0.64 ± 1.16 D
eck
C
reep
**
m = measured, c = calculated * Using girder section properties only. ** Using composite section properties (1.6*Ig).
6.5.1 Effect of Actual Concrete Strength
According to Table 6.6, the measured cambers (on average) were smaller than the
calculated ones when the design concrete strength was used. This was true for exterior
and interior girders, for one-end and two-end continuous spans, and for all three loading
conditions (strand release, deck placement and deck creep). The accuracy increased and
the calculated cambers decreased significantly when the actual (rather than the design)
concrete strength was used. This trend was expected because the actual stiffness of the
concrete was greater than the value assumed in design. This resulted in smaller values of
estimated deflection. The use of the actual concrete strength thus improves the prediction
accuracy.
75
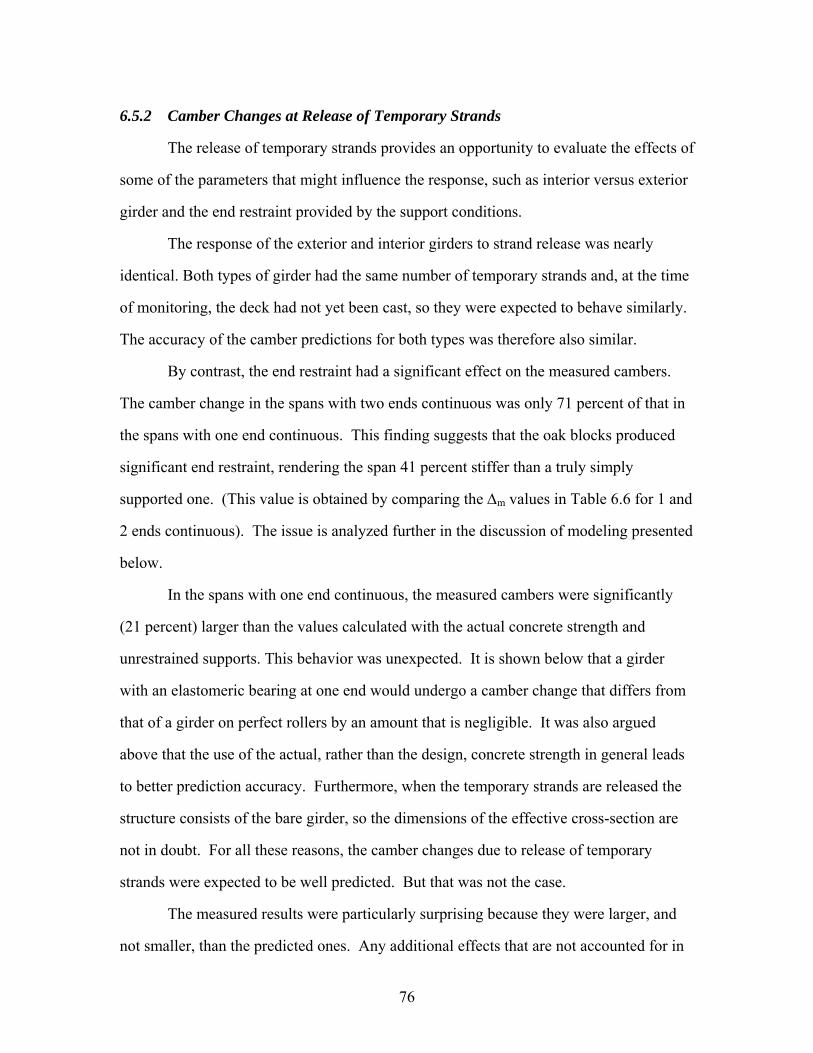
6.5.2 Camber Changes at Release of Temporary Strands
The release of temporary strands provides an opportunity to evaluate the effects of
some of the parameters that might influence the response, such as interior versus exterior
girder and the end restraint provided by the support conditions.
The response of the exterior and interior girders to strand release was nearly
identical. Both types of girder had the same number of temporary strands and, at the time
of monitoring, the deck had not yet been cast, so they were expected to behave similarly.
The accuracy of the camber predictions for both types was therefore also similar.
By contrast, the end restraint had a significant effect on the measured cambers.
The camber change in the spans with two ends continuous was only 71 percent of that in
the spans with one end continuous. This finding suggests that the oak blocks produced
significant end restraint, rendering the span 41 percent stiffer than a truly simply
supported one. (This value is obtained by comparing the Δm values in Table 6.6 for 1 and
2 ends continuous). The issue is analyzed further in the discussion of modeling presented
below.
In the spans with one end continuous, the measured cambers were significantly
(21 percent) larger than the values calculated with the actual concrete strength and
unrestrained supports. This behavior was unexpected. It is shown below that a girder
with an elastomeric bearing at one end would undergo a camber change that differs from
that of a girder on perfect rollers by an amount that is negligible. It was also argued
above that the use of the actual, rather than the design, concrete strength in general leads
to better prediction accuracy. Furthermore, when the temporary strands are released the
structure consists of the bare girder, so the dimensions of the effective cross-section are
not in doubt. For all these reasons, the camber changes due to release of temporary
strands were expected to be well predicted. But that was not the case.
The measured results were particularly surprising because they were larger, and
not smaller, than the predicted ones. Any additional effects that are not accounted for in
76

the calculations are likely to provide restraint, rather than adding flexibility, and would
therefore stiffen the system and reduce the camber change. The only exception is
cracking. However, the load on the girders prior to release of temporary strands is so
small that cracking is most improbable. Therefore, the results are regarded as anomalous,
and the reasons for them remain unknown.
6.5.3 Camber Changes Due to Casting of the Deck
After the temporary strands had been cut, the bottom flanges were embedded into
the pier cap at the plan locations as described in Section 6.2. The deck was then cast,
leaving the pier closure pour open. The midspan deflection caused by deck casting was
calculated by assuming a uniform load over a simply supported span. Table 6.6 shows
that the observed deflections were consistently less than the calculated deflections for all
the spans, particularly for the spans with restraint at both ends, which suggests that the
pier cap embedment provided some restraint.
On average, the spans with two ends restrained were 46 percent stiffer than those
with only one end restrained. (The interior and exterior girder showed rather different
deflection ratios of 1.155 and 1.764 respectively, but the average was 1.46). This may be
compared with the 41 percent additional stiffness observed for the temporary strand
release. At strand release, only oak blocks restrained girder end movement, whereas at
deck casting the pier cap embedment was also in place. The similarity in stiffness
increase suggests that both systems prevented relative displacement between the girder
and pier cap almost completely, and that almost all of the flexibility present was provided
by deformations of the piers, which are assumed to have been the same on both
occasions.
Some inconsistencies are apparent in the measured data, but they may have been
caused by the relatively large scatter in the cambers for different girders. (The average
coefficient of variation was 36 percent). For example, in the spans with two ends
77

continuous, the exterior girders deflected more than the interior ones, but the opposite
was true for the spans with only one end continuous. The differences are partially
attributed to effects that were not included in the calculations. For example, the deck
concrete starts to set up during the day. In the later stages of the pour, some of the
concrete cast at the start may have set up sufficiently to provide some composite action
with the girder, thereby stiffening the system.
6.5.4 Camber Changes after Deck Placement
The deflection measurements after the deck placement had significant amounts of
scatter, with an average coefficient of variation of 152 percent. Approximately 0.4 in. of
additional deflection (downward) was observed on average over the monitored time
period for all the girders, while the standard deviation was as high as 0.70 in. This
relatively large scatter is attributed to the fact that the creep deflections were quite small
(relative to the initial camber) and that the deflections due to other loadings, such as
thermal effects, differential shrinkage and changes in construction loading, were not
considered but were undoubtedly present.
Span 8 girders consistently deflected upwards, whereas spans 6, 7, and 9 all
deflected downwards. The reason for the difference remains unknown. Deflections after
the deck pour were not available for spans 3, 4, and 5.
The calculated creep deflection was initially based on the elastic deck placement
deflection, which was computed with the properties of the bare girder. To include the
influence of the deck properly would require a time history of the compressive strength,
elastic modulus, shrinkage and creep of the deck concrete, but these data were not
available. Therefore, differential shrinkage was ignored and an upper bound on the time-
dependent deflection was obtained by multiplying the elastic deflection by the creep
coefficient. On average, the measured time-dependent camber change was only half of
that computed with the actual concrete strength and the bare girder section. Note that the
78

composite moment of inertia was about 1.77 times that of the bare girder, assuming the
deck concrete had a compressive strength of 4 ksi and that the girder spacing was 6.875-
ft, as specified in the contract plans. Thus, use of the composite inertia led to a better
estimate of the time-dependent camber change (see Table 6.6).
Calculation of the creep deflection is clearly affected by many potential sources of
error. Fortunately, the creep deflection is small relative to other components of the total
camber (an average of 0.4 in. in this case), and it also occurs at a time that makes errors
in its prediction relatively unimportant. Camber errors that occur before the deck has
been cast may cause problems with placing the formwork and reinforcement, which in
turn may lead to delays and contractual disputes. Those that occur after deck placement
primarily affect the grade, and the consequences of an error in grade on the order of ¼ in.
are unlikely to prove serious
6.5.5 Structural Model for Calculating Camber Changes
The calculated camber changes due to release of temporary strands and deck
placement were influenced most strongly by the selection of the Ec value and the effects
of end restraint. The Ec value has already been discussed. Use of the value
corresponding to the actual, or expected, f’c rather than the design one is recommended.
Section 5.14.1.4 of AASHTO LRFD is based on the assumption that transient
and/or permanent loads are applied to a fully continuous girder (AASHTO 2006). .This
implies that the cast-in-place closure joint at the pier has been completed. However, the
deflections measured for this research were recorded before the closure pour was made
and, therefore, the structure was modeled using simply supported.
Some end restraint did exist before the closure joint pour had been completed,
generated by shear forces in the bearings that restrained the movement of the bottom
flange of the girder. It affected the cambers, so finding some way of accounting for it in
the model would be beneficial. The data from this bridge alone do not constitute a
79

sufficiently rich set to allow reliable identification of a good method; nonetheless, two
possible approaches are described here.
The simplest approach is to define a “continuity index”, ωc, which varies from 0
to 1.0 and indicates the level of end restraint available. A uniform load applied to a
simple span would then cause a mid-span deflection of
EIwLc
4
38445
⎟⎠⎞
⎜⎝⎛ −
=Δω
6.2
For a simple span, ωc = 0, and the deflection coefficient is 5/384. For full
continuity, ωc = 1.0, and the deflection coefficient is 1/384. In this case the deflections
due to deck placement were, on average, 1/1.45 or 0.69, times the simple span
deflections. Therefore
39.08.069.01
=−
=cω
6.3
so the spans were, according to this definition, 39 percent continuous.
This definition of continuity has the appeal of simplicity, but it breaks down when
applied to the end moments caused by releasing the temporary strands because an end
moment applied to a fixed-ended beam produces no deflection at all.
An alternative is to model the end restraint explicitly as a spring at the bottom of
the girder end, as shown in Figure 6.7. When an elastomeric bearing supports the girder,
the spring constant can be derived from its properties. When an oak block supplies the
support, it may be quite rigid in shear, and the majority of the flexibility may come from
deflection of the piers. Analysis using the model of Figure 6.7 shows that the end
rotation of the girder, and the mid-span deflection, due to release of the temporary strands
are reduced by a factor of (1+α), where
EILKc end
21=α
6.4
80

Here:
c1 = the distance from (composite) cgc to the bottom of the girder
Kend = stiffness of the end restraint (e.g., the bearing)
L = span length
EI = flexural rigidity of the girder
An infinitely stiff end restraint then leads to zero deflection, as it should. (In the model,
the girder is treated as having an infinite axial stiffness, and only bending deformations
are considered). In the case of an elastomeric bearing typical of the sort used for W83G
prestressed girders, Kend ≈ 32 kips/in. and α = 0.02. The camber change due to release of
the strands is thus reduced by a factor 1.02. This change is smaller than the probable
errors in measurement and is therefore considered negligible
Δ
u
θc
u
MTS
kbrg
Figure 6.7 Elastomeric Support Restraint Model
For a uniform load, the model shows that the simple span deflection is reduced by
a factor of (1+α)/(1+0.2α). In that case an infinitely stiff restraint does not lead to zero
displacement because the downward deflection due to the load is only partly offset by the
upward deflection due to the induced end moment.
The measured deflections in the spans with continuity at both ends were smaller
than the spans with continuity at one end by factors of 1.41 for strand release and 1.45 for
deck casting. These observations lead to computed α values of 0.41 and 0.63,
respectively, for which the implied restraint stiffnesses are 618 and 950 kips/inch per
girder. It is logical that the stiffness at strand release should be less than that at deck
81

placement because of the additional restraint supplied by the pier cap embedment in the
latter case. However, the absolute values of the stiffnesses appear high, if indeed they
represent the stiffness of the piers against longitudinal displacement.
Note that the spans were connected longitudinally in groups of three. The central
span in each group (e.g. spans 5 and 8) therefore experienced resistance to longitudinal
displacement not only from the piers that supported them directly but also from those
supporting the adjacent spans. According to the model presented, they might be expected
to deflect less under load than the girders in the end spans of the group (spans 4 and 6, 7
and 9). In practice, if that trend was present, it was masked by scatter in the results.
Therefore, while the model provides a plausible basis for estimating the effects of end
restraint, further development and verification are clearly necessary before it can be used
with confidence.
82

CHAPTER 7
END RESTRAINT/ROLLER TESTING
7.1 Purpose
The camber of a girder may be restrained by the build-up of axial force when the
support restrains shrinkage and creep. The horizontal force acts at the bottom flange
level, which induces an end moment that leads to downward deflection. Release of those
forces by lifting the girder might be expected to cause the restrained camber to rebound.
Tests were conducted to observe the magnitude of the camber rebound in a girder
when one end was lifted off its support and placed on a roller. The tests were conducted
on five W83G girders from the Keys Road Bridge project at the Central Pre-Mix
Prestress plant in Pasco, Washington, on December 21, 2005.
7.2 Girder Properties
All five of the girders tested were W83G sections and were 178 ft long. They
were placed on timber bunks located between 20 and 30 inches from the girder end. The
bunks were approximately 12-in. by 12-in. in cross-section and lay directly on the
ground. The soil was a loosely compacted mixture of gravel and sand, which might
allow for rotation in the support if the girder were to shrink. Table 7.1 shows the number
of prestressing strands and age of the girders. While all girders were identical with
respect to prestress force, section, and length, the girders cast on November 12th and
November 18th were released after approximately two days’ curing, whereas the others
were released after approximately one day.
83

Table7.1 Age and Prestressing of Girders Used in Roller Test
Cast Date
Age at Release (days)
Age at Test
(days)
Number of Temporary Top Strands
Number of Straight Strands
Number of Harped Strands
11/8/05 0.9 43 6 44 24
11/10/05 0.9 41 6 44 24
11/12/05 1.9 39 6 44 24
11/15/05 1.0 36 6 44 24
11/18/05 2.9 33 6 44 24
The same concrete mix was used on all of the Keys Road Bridge girders. Table
7.2 shows the release and 28-day compressive strength results for all the girders tested.
The average release strength of the 1-day cure girders was 8,014 psi, while the average
release strength of the 2-day cure girders was 9,463 psi.
The 28-day compressive strength result was not available for the girder cast on
November 12th, so it was taken as the average of the strengths of the other girders. The
average 28-day compressive strength was 11,681 psi.
Table 7.2 Release and 28-Day Compressive Strengths
Cast Date f’ci (psi) f’c28 (psi)
11/8/05 8205 11730
11/10/05 7900 11510
11/12/05 8585 N/A
11/15/05 7938 11148
11/18/05 10340 12334
7.3 Roller Test Procedure
Before lifting, the camber of each girder was measured on both sides. One end of
the girder was then lifted at the lifting loop by the traveling crane and was set down again
on the roller. Lifting was conducted gently, to avoid any potential for cracking.
84

Figure 7.1 shows the roller. It consisted of a 2.5-in.-diameter steel bar between
two 0.5-in.-thick steel plates. The plates provided a smooth, clean surface to allow
longitudinal movement when the weight of the girder was set on the roller. To keep the
top plate from rolling or sliding off the bar while the girder was being lowered, a timber
2-by-4 was placed on each side, and wedges were used to balance the top plate. After the
girder had been placed on top of the roller, the wedges were knocked out, and the 2-by-4s
were removed. The system was then free to roll.
Figure 7.1 Roller Diagram
The camber was measured on each side of the girder and compared to the values
obtained before lifting. The girder was then lifted, the steel bar and plates were removed,
and the girder was placed back on the timber supports.
7.4 Observed Behavior
All five girders showed an increase in midspan camber after they had been placed
on the rollers. Figure 7.2 shows the camber changes. The average increase was
85

0.165 inches. The consistent increase in camber suggests that the supports had been
preventing some girder shortening due to creep and shrinkage.
End Restraint/Roller Test
0.0
2.0
4.0
6.0
Cast Date
Mid
span
Cam
ber (
in.)
Before 3.926 4.120 4.039 4.184 3.684
After 4.055 4.217 4.217 4.459 3.829
Change 0.129 0.097 0.178 0.275 0.145
11/8/05 11/10/05 11/12/05 11/15/05 11/18/05
Figure 7.2 Roller Test Camber Results
When girders are shipped, any stresses caused by shrinkage restraint are released.
The camber after shipping and erection should therefore be expected to be larger than that
in storage. The final camber is of interest. Any method for predicting final camber that
is calibrated with data that do not account for the effects of shrinkage restraint in the
storage area is therefore likely to contain this modest error.
86

CHAPTER 8
EVALUATION OF FABRICATOR DATA
8.1 Introduction
This chapter describes the broad-based data that were collected to complement the
detailed data on girder camber and materials testing described in chapters 4 and 5. The
discussion is organized in three sections. Section 8.2 discusses the procedures for
collecting the data, Section 8.3 describes the data set, and Section 8.4 shows the trends
that were observed in the data. The data collected from each girder were used to calibrate
the camber prediction model, which is discussed in Chapter 8.
8.2 Data Collection Procedure
The two largest fabricators of prestressed concrete girders in the state of
Washington are Concrete Technology Corporation, located in Tacoma, and Central Pre-
Mix Prestress, based in Spokane with an additional prestressing plant in Pasco. To obtain
data on a broad range of girders used in WSDOT bridges, site visits were made to those
two companies, and data were collected from a total of 146 girders. Because of the range
in size and length of the girders used in WSDOT bridges, an effort was made to collect
data that varied in cross-section, length, and the amount of prestressing used. The
information gathered included camber at release and at one subsequent time, girder
geometry, material data, level of prestressing, and curing information. The data collected
differed from the data described in Chapter 4 in that they were less detailed (with fewer
camber readings per girder), but they described a larger number of girders.
Most of the information obtained from the fabricator was related to the girder
cross-section, length, and prestressing strand size and quantity. Those properties were
taken from the fabrication drawing plans. Quality control records were also reviewed.
These records documented the fabrication history, including the time and date of casting,
87

time and date of the release of prestress, concrete cylinder strengths at release and 28
days after casting, and all camber measurements.
8.3 Description of Dataset
The data set included girders fabricated by two fabricators under a number of
conditions. This section describes the distribution of girders with respect to a number of
properties.
8.3.1 Data Collection from Concrete Technology Corporation
The data set from Concrete Technology Corporation contained 103 girders from
four projects and included the eight girders monitored for a detailed time history of
camber and materials testing (see chapters 4 and 5).
The set of girders from the Black Lake Bridge project was the largest collected.
This project included 66 W74G girders that ranged in length from 65 feet to 131 feet.
The bridge had five spans, for each of which the span length and number of prestressing
strands differed.
The 277th St Bridge project consisted of 16 girders with a W50G section that were
all 96 feet long and had the same prestressing force. The girders in this data set varied
only in the age of the concrete at the time of release.
The Snake Lake Bridge project was used for the detailed camber study and
materials testing discussed in chapters 4 and 5. This girder set consisted of eight girders
with a W74G section. All these girders were 135 feet long. However, different amounts
of prestressing were used, and three slightly different concrete mixes were used to meet
the required strengths at release.
The Cedar River Bridge project included 13 girders with a WF74G section, with
five girders each spanning 95, 120, and 128 feet.
88

8.3.2 Data Collection from Central Pre-Mix Prestressing Corporation
One trip was made to the Spokane prestressing plant, where 41 girders from four
projects were collected from Central Pre-Mix’s quality control records. However, many
of the girders did not have a camber near the time of release and were not used in the
evaluation. Additional trips were made to the Pasco plant to field measure and collect the
quality control records for 31 addition girders. Three of those girders were removed from
the evaluation because release cambers and/or concrete compressive strength results were
not available. A total of 43 girders from Central Pre-Mix’s records were used in the
evaluation.
The Yakima River Bridge project included eight W83G girders, all 171 feet long.
The Keys Road Bridge project included 28 W83G girders, all 178 feet long and
prestressed with various amounts of prestressing force. The roller test that was
performed on five girders to determine the effects of restraint by temporary bunks is
discussed in Chapter 6. Eight of these girders were measured in the field by UW
researchers to obtain a second camber measurement with the same method that was used
to measure the Snake Lake Bridge girders at Concrete Technology Corporation (see
Chapter 4).
8.3.3 Sections
The girder cross-sectional properties varied over only a limited range because the
state uses only its own standard girder sizes. Data were gathered from girders with a
range of cross-sections, including the four most common sections (W50G, W74G,
WF74G and W83G). Their cross-sections are shown in Figure 8.1, and Figure 8.2 shows
the population distribution for girder length and section type.
89

Figure 8.1 WSDOT Girder Section Dimensions
90

0
10
20
30
40
50
60
60 to
80
80 to
100
100
to 1
20
120
to 1
40
140
to 1
60
160
to 1
80
Girder length (ft)
# of
Gird
ers
W83G
WF74GW74G
W50G
Figure 8.2 Number of Girders for Each Section
8.3.4 Age at Release
The age of the concrete at release influences the girder stiffness because the
elastic modulus changes over time and with maturity. To optimize productivity,
fabricators often strive to produce one girder in a 24-hour cycle, thereby maintaining
consistent working schedules for the various specialist crews. Prestressing fabricators
typically do not work on weekends and holidays, and as a result, girders that are cast on a
Friday or before a holiday will continue to cure, and the concrete will gain strength and
maturity. Therefore, while most girders will be released between 12 and 24 hours of
casting, some girders will cure for between 48 and 96 hours prior to release.
Figure 8.3 shows the number of girders released on each day after the casting.
Note that the increase in maturity for “Friday girders” may be less than first expected
because the fabricator may choose to use a less aggressive heating program during the
cure time, knowing that the cure time will be longer than usual.
91

6
25
3
112
0
40
80
120
1 2 3 4
Age at Release (days)
# of
Gird
ers
Figure 8.3 Number of Girders Released Each Day After Casting
8.3.5 Seasonal Variations
Temperature during casting and curing is known to influence material properties
and may affect prestress loss. The two girder fabricators are located in areas that exhibit
very different annual temperature and humidity cycles. Central Pre-Mix uses outdoor
casting beds. It covers the girders with thermal blankets and, if necessary, raises the
concrete’s temperature by releasing steam adjacent to the form, under the blanket. In the
winter months, the temperature in Eastern Washington frequently drops below freezing,
so special measures are needed to achieve proper concrete curing. In the summer
months, the climate is typified by high temperatures and low humidity, both of which
might be expected to promote shrinkage and creep.
Concrete Technology in Tacoma has a covered casting bed and heats the girders
with electric elements inside insulated forms, even though the climate in Western
Washington is much milder. Girders made at both plants are susceptible to some thermal
92

effects during casting and curing, but the seasonal differences suggest that the effects
might be larger in girders cast by Central Pre-Mix Prestress.
To illustrate the potential for seasonal effects on the data set, Figure 8.4 shows the
number of girders that were cast in each month of the year.
0
5
10
15
20
25
Janu
ary
Febr
uary
Mar
ch
Apr
il
May
June July
Augu
st
Sep
tem
ber
Oct
ober
Nov
embe
r
Dec
embe
r
Month of Casting
# of
Gird
ers
Concrete Technology Corp.
Central Pre-Mix Prestress
Figure 8.4 Number of Girders Cast in Each Month
8.4 Observed Trends
The trends observed in the behavior of the girders are discussed in this section.
The measured cambers, compressive strengths, and maturities helped to identify key
variables that influence the observed camber.
8.4.1 Effects of Concrete Maturity at Release
Uncertainty in predicting release camber is affected most strongly by the elastic
modulus of the concrete, since other quantities used in the camber estimate, such as the
moment of inertia of the section, can be estimated reliably. Unfortunately, elastic
93

modulus at release is not routinely measured, so it usually has to be inferred from
strength data by using relationships such as those proposed by ACI 318, AASHTO, ACI
363, and others. (See Section 2.3.) If detailed records of strength versus time are not
available, approximate relationships between strength and maturity may be used to
estimate strength gain with time.
Figure 8.5 shows measured strengths and maturities from the 277th St Bridge and
Cedar River projects. It shows that the concrete gained strength as it matured by curing
over a weekend or holiday. Because the heat of hydration raised the temperature above
ambient for an extended time, it was possible for the fabricator to reduce energy
consumption by turning off the external heat earlier than usual while still maintaining the
maturity required to achieve the desired strength. Despite the early cut-off of external
heat, the maturities were much higher and the strengths were slightly higher (on average
15 percent) than those of the girders released after one day.
0
4
8
12
0 2000 4000 6000 8000 10000
Maturity (degrees F * hrs)
Con
cret
e C
ompr
essi
ve S
tren
gth
(ksi
)
277th St BridgeCedar River Bridge
Figure 8.5 Influence of Maturity on Concrete Compressive Strength
94

Figure 8.6 shows the effect of maturity on camber at release. As the maturity
increased, the concrete strength increased, the girder became stiffer and the release
camber dropped. The effect is perceptible, but not great. This is explained by the data in
Figure 8.5, which show that a large increase in maturity beyond that achieved in the first
sixteen hours of curing led to only a small increase in strength.
0
1
2
3
4
0 2000 4000 6000 8000 10000
Maturity (degrees F * hrs)
Rele
ase
Cam
ber (
in.)
277th St BridgeCedar River Bridge
Figure 8.6 Effect of Maturity on Release Camber
8.4.2 Influence of Compressive Strength on Release Camber
The compressive strength at release can influence the release camber by changing
the stiffness of the girder. Figure 8.7 illustrates this trend for the Black Lake Bridge
project. This project had five spans and prestressing quantities, but all were W74G
sections. As the compressive strength of the concrete increased at the time of release, the
initial camber decreased. However, this trend was not observed in the girders with low
cambers. This may be attributable to error in measurement. If the tolerance of
measurement by the fabricator in the field is to the nearest ¼ in., then this will increase
the percentage of error in camber measurements as they get smaller. The Black Lake
95

Bridge project spans that were 126 ft and 132 ft showed this trend best because they had
larger initial cambers.
0
1
2
3
5 6 7 8
Concrete Compressive Compressive Strength (ksi)
Mid
span
Cam
ber (
in.)
9
L = 65.9 ftL = 86.9 ftL = 106.8 ftL = 125.8 ftL = 131.5 ft
Figure 8.7 Black Lake Bridge Project Release Camber vs. Compressive Strength
8.4.3 Long-Term Camber
The long-term trends were more difficult to distinguish. The quantities that
fabricators measure after the release measurements are 28-day compressive strengths and
an additional camber measurement. This additional camber measurement was not taken
at a consistent time after casting because WSDOT requires only that one additional
measurement be taken prior to shipping. Shipping dates vary, and often change, in
accordance with the contractor’s schedule. This leads to a significant scatter in the age of
the girder at the second camber measurement. The effects of creep and shrinkage will
also vary with time, material properties, environmental conditions, and even girder
support conditions in the yard, so larger scatter must be expected in this second camber
measurement.
96

Figure 8.8 illustrates the camber measurements taken for the Black Lake Bridge
project. These camber measurements were taken between 100 and 300 days after casting
and were most representative of long-term camber. Overall, there is little correlation
between long-term camber and 28-day strength. However, the longer spans of 126 ft and
132 ft showed a weak trend of lower long-term cambers with higher strength. This
tendency is rational, in that the higher strength implies higher elastic modulus and lower
creep coefficient. The long-span data also showed that the girders released after more
than one day exhibited less long-term camber than girders released at less than one day.
The shorter spans did not show this trend, probably as a result of measuring errors, since
the total camber is of the same order of magnitude as the accuracy of the measurement.
Black Lake Bridge Project Long Term Camber vs. 28-Day Comp. Strength
0
1
2
3
4
5
8 9 10 11 12
28-Day Concrete Compressive Compressive Strength (ksi)
Mid
span
Cam
ber
(in.)
L = 65.9 ftL = 86.9 ftL = 106.8 ftL = 125.8 ftL = 131.5 ftRelease > 1 Day
Figure 8.8 Black Lake Bridge Project – Long-Term Midspan Cambers vs. 28-Day Compressive Strength
97

CHAPTER 9
CALIBRATION OF CAMBER MODEL
9.1 Introduction
This chapter discusses calibration of the camber model with field data. Those data
consisted of readings from girders that were fabricated by the two major manufacturers in
the state of Washington and placed in six different bridges. In all cases, one reading was
taken at release and another at some later time. The data therefore reflected largely the
performance of the bare girders and excluded the effects of the end restraint caused by
attachment to the bridge piers.
Section 9.2 evaluates the accuracy of the current camber prediction methodology.
Section 9.3 shows the effect of using the measured concrete compressive strength instead
of the design strength. Section 9.4 demonstrates the effect on predicted camber when the
model accounts for the change in prestress force over time due to prestress losses.
Section 9.5 calibrates the model by applying factors, with optimal values, to the elastic
modulus, creep coefficient, and prestress loss due to creep.
9.2 Evaluation of Current Procedure
In the first phase of this project, the WSDOT prediction method was evaluated for
prestress losses according to the AASHTO LRFD 2004 provisions because that was the
method WSDOT used at the time. For the 146-girder set, the average errors in the
prediction of camber at release and the second measurement are given in Table 9.1. Both
the average error and the average absolute error are provided. Here the camber is treated
as upwards positive, and the error is defined as the measured value minus the predicted
one. Thus a negative error indicates that the predicted upward camber is larger than the
measured, and that the real girder is flatter than the calculations suggest. This was the
outcome in most cases when the standard WSDOT method of calculation was used.
98

Table 9.1 Average Errors in Camber Prediction (in.)
Release Second
Average -0.42 -0.73
Average abs. 0.47 0.75
The current WSDOT practice for camber prediction was implemented in the
camber prediction program discussed in Section 2.8. The program used the AASHTO
LRFD 2006 equations for predicting the elastic modulus, shrinkage, creep, and prestress
loss. This method also used the design concrete compressive strengths at release and 28
days. Figure 9.1 shows the camber error of the calculated values compared with the
measured cambers at release and at a later time.
The errors in the cambers at release tended to become more negative with
increasing girder length. The WSDOT method over-predicted the camber in almost all
girders shown that were over 100 feet long. The range of error also varied for each
project and length. The girder properties and spans for each project are shown in Table
9.2. In general, the girders with the largest span/radius of gyration ratios exhibited the
greatest relative camber (i.e., camber/span), as shown in Figure 9.2.
The second measurements were taken at various times ranging from eight to 427
days after casting. For nearly all girders longer than 70 feet, the predicted cambers were
larger than the measured ones, but for the 70- to 140-ft range the error was significantly
larger for the second reading than at release. However, for the Keys Road (178 ft) and
Yakima River (171 ft) projects, the errors at the two times were nearly the same. Those
two girder sets differed in two ways from all the others. They were the only ones built by
Central Premix Prestress Co. (CPM) with materials from Eastern Washington, and they
were the only W83G sections on very long spans. Table 9.3 shows the errors at release
and the second measurement that resulted from use of the current WSDOT method.
99

Figure 9.1 Camber Prediction Error Resulting from Use of the WSDOT Method a) At release b) At second measurement
100

Table 9.2 Girder Properties
Project Section Lave (ft) Lave/r Black Lake W74G 66 29.29 Black Lake W74G 87 38.61 Black Lake W74G 107 47.49 Black Lake W74G 126 55.92 Black Lake W74G 131 58.14 277th Street W50G 96 65.01 Snake Lake W74G 135 59.91 Cedar River WF74G 95 41.02 Cedar River WF74G 124 53.54 Yakima River W83G 171 65.43 Keys Road W83G 178 68.11 r = radius of gyration = √(I/A)
0.0E+00
1.5E-03
3.0E-03
4.5E-03
0 20 40 60 8
Length / Radius of Gyration (in./in.)
Cam
ber /
Len
gth
(in./i
n.)
0
Release Measurement2nd Measurement
Figure 9.2 Measured Camber vs. Length/Radius of Gyration Ratio
101

Table 9.3 Summary of Errors for Various Predictive Methods
Factors Release Measurement (in.) 2nd Measurement (in.) Variations on
Predictive Method Ec Cc ΔfpCR
Average Error
Average Absolute
Error Standard Deviation
Average Error
Average Absolute
Error Standard Deviation
Design Concrete Compressive Strength WSDOT Method (Section 9.2)
All 1.00 1.0 1.0 -0.42 0.47 0.37 -0.73 0.75 0.52 CTC 1.00 1.0 1.0 -0.31 0.39 0.34 -0.81 0.89 0.53 CPM 1.00 1.0 1.0 -0.68 0.69 0.29 -0.55 0.58 0.45
WSDOT Method w/ Prestress Loss All 1.00 1.0 1.0 -0.42 0.47 0.37 -0.18 0.39 0.48
CTC 1.00 1.0 1.0 -0.31 0.39 0.34 0.36 0.41 0.39 CPM 1.00 1.0 1.0 -0.68 0.69 0.29 0.26 0.35 0.37
Mod. WSDOT Method w/ Factors All 1.15 1.4 1.0 -0.14 0.29 0.33 -0.22 0.44 0.50
CTC 1.15 1.3 1.0 -0.10 0.27 0.33 -0.34 0.40 0.38 CPM 1.15 1.7 1.0 -0.25 0.31 0.29 0.04 0.29 0.38
Actual Concrete Compressive Strength WSDOT Method (Section 9.3)
All 1.00 1.0 1.0 -0.29 0.38 0.36 -0.41 0.46 0.39 CTC 1.00 1.0 1.0 -0.18 0.30 0.32 -0.41 0.45 0.38 CPM 1.00 1.0 1.0 -0.56 0.57 0.30 -0.42 0.48 0.43
WSDOT Method WSDOT Method w/ Prestress Loss (Section 9.4) All 1.00 1.0 1.0 -0.29 0.38 0.36 0.02 0.30 0.39
CTC 1.00 1.0 1.0 -0.18 0.30 0.32 -0.10 0.27 0.34 CPM 1.00 1.0 1.0 -0.56 0.57 0.30 0.30 0.36 0.35
Mod. WSDOT Method w/ Factors (Section 9.5) All 1.15 1.4 1.0 -0.03 0.24 0.33 -0.01 0.30 0.39
CTC 1.15 1.3 1.0 0.02 0.02 0.33 -0.07 0.26 0.33 CPM 1.15 1.7 1.0 -0.14 0.25 0.30 0.07 0.29 0.37 Increased Design Concrete Compressive Strengths (110% at release, 125% at 28-Days)
Mod. WSDOT Method w/ Factors (Section 9.5) All 1.15 1.4 1.0 -0.06 0.25 0.33 -0.08 0.36 0.46
9.3 Effect of Using Measured Concrete Compressive Strength
The design plans for a prestressed concrete girders specify concrete compressive
strength requirements at two times: at release and at 28 days. The concrete design
compressive strengths at release (f’ci) and at 28 days (f’c) are typically selected on the
basis of the maximum compressive stresses expected in the girder at various stages of its
life.
102
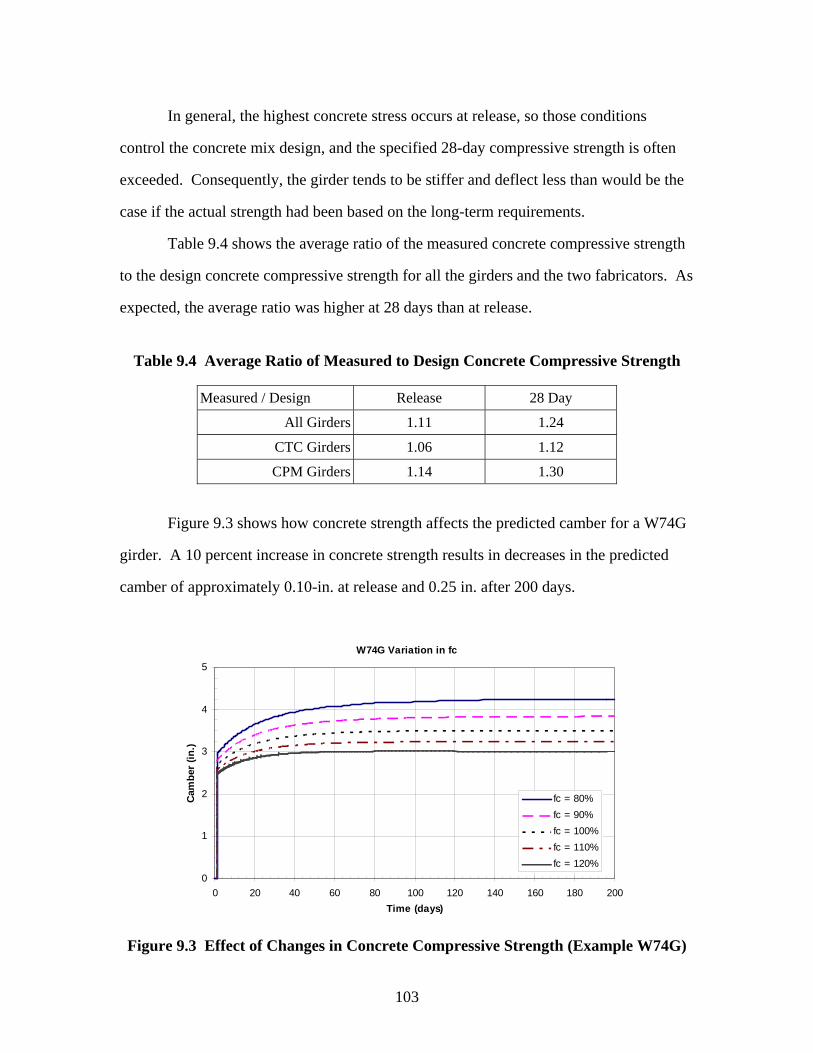
In general, the highest concrete stress occurs at release, so those conditions
control the concrete mix design, and the specified 28-day compressive strength is often
exceeded. Consequently, the girder tends to be stiffer and deflect less than would be the
case if the actual strength had been based on the long-term requirements.
Table 9.4 shows the average ratio of the measured concrete compressive strength
to the design concrete compressive strength for all the girders and the two fabricators. As
expected, the average ratio was higher at 28 days than at release.
Table 9.4 Average Ratio of Measured to Design Concrete Compressive Strength
Measured / Design Release 28 Day
All Girders 1.11 1.24
CTC Girders 1.06 1.12
CPM Girders 1.14 1.30
Figure 9.3 shows how concrete strength affects the predicted camber for a W74G
girder. A 10 percent increase in concrete strength results in decreases in the predicted
camber of approximately 0.10-in. at release and 0.25 in. after 200 days.
W74G Variation in fc
0
1
2
3
4
5
0 20 40 60 80 100 120 140 160 180 200Time (days)
Cam
ber (
in.)
fc = 80%fc = 90%fc = 100%fc = 110%fc = 120%
Figure 9.3 Effect of Changes in Concrete Compressive Strength (Example W74G)
103

Figure 9.4 shows the camber errors for all the girders when cambers were
calculated with the measured concrete compressive strengths. The improvement in
camber prediction can be seen by comparing the results shown in Figure 9.1 with those of
Figure 9.4. The prediction errors decreased, as implied by the lower average values
shown in Table 9.3.
Because actual values of concrete strength are not known at the time of design,
camber must be calculated by using an estimate of the actual strengths. This can be
achieved by increasing the design strengths by 10 percent at release and 25 percent at 28
days, which is the average ratio of actual to measured concrete compressive strengths
from Table 9.4. The errors are shown in Table 9.3.
104

Figure 9.4 Camber Prediction Error Using Measured Concrete Compressive Strength a) At release b) At second measurement
105

9.4 Prestress Loss Deflection Adjustment
Creep in the concrete affects the magnitude of the prestressing force over time,
and thus the camber due to prestressing, in two ways. First, if the prestressing force were
to remain constant, creep of the concrete would increase the camber because the effective
modulus of the concrete would decrease. This effect is taken into account as the “creep
deflection” in the WSDOT method (Section 9.2). However, creep also causes a gradual
reduction in prestress force over time. This, in turn, causes a reduction in camber due to
prestressing, including both the elastic and creep components. The second effect
represents an interaction between the prestressing and creep effects and is not accounted
for in the WSDOT method.
According to the AASHTO LRFD method, the time-dependent components are
losses due to shrinkage and creep of the concrete and relaxation of the prestressing
strands (Section 2.6). In the WSDOT method, the creep deflection due to the prestressing
is calculated on the basis of the initial elastic prestress deflection alone. This approach
over-estimates the camber due to prestressing. The most accurate method would be to
conduct a time-dependent evaluation in which the forces and deformations changed at
every time-step, but this would be complex and time-consuming. The modified method
uses the prestress losses as calculated by the AASHTO LRFD method to determine the
deflection due to prestressing. This is discussed further in Section 3.3.4.2. Figure 9.5
shows the variation in predicted prestress deflection between the WSDOT and the
modified method for an example W74G girder. The reduction in prestress force in the
modified method reduces the predicted deflection after release.
106

Figure 9.5 WSDOT vs. Modified WSDOT Prestress Deflection (Example W74G)
There are no time-dependent losses at release of the prestress. Therefore, use of
the modified procedure does not change the elastic deflection at release.
Figure 9.6 shows the error in prediction for the second camber measurement when
the modified prediction method was used. This modification reduced the mean error of
all the data, as shown in the figure. For the longer span girders, over 140 ft, the change
was enough to cause the camber error to just become positive.
By using the actual concrete compressive strength and including the effects of
prestress loss on deflection, the error in the prediction was reduced as shown in Table 9.3.
107

Figure 9.6 Camber Prediction Error Resulting from Inclusion of the Prestress Loss in Camber Calculations
9.5 Calibration of the Camber Prediction Model
Further improvements in camber prediction, beyond those available from
incorporating the two foregoing effects, were sought. They were achieved by applying
factors to three of the components of the camber and optimizing their values to minimize
the camber error. Modification factors were applied to the elastic deflection caused by
the self-weight and the release of the prestressing strands, the additional deflection due to
creep, and the amount of prestress loss that is included in the long-term camber
calculations.
Creep deflection is affected by the elastic modulus, but the converse is not true.
Therefore the calibration was conducted in steps, the first of which was to determine the
elastic modulus from the (elastic) release cambers (see Section 9.5.1). Then the elastic
modulus was held constant while the creep coefficient was adjusted to achieve the best fit
between predicted and measured camber at the second camber measurement (see Section
108

9.5.2). This process ignored the time dependent prestress losses. Finally, the time
dependent prestress losses were included and the creep coefficient, and the prestress loss
due to creep was modified simultaneously to minimize the predicted error at the second
camber measurement.
The optimal values of the model parameters were obtained by minimizing the sum
of the squares of camber errors, as shown in Equation 9.1.
N
errorerror
N
ii
ave
∑== 1
2
9.1
where:
errori = difference between the measured and calculated cambers
N = number of girders
This definition of error uses absolute, rather than relative, errors. It is therefore
most strongly influenced by girders with large cambers, which are typically longer
girders.
9.5.1 Elastic Modulus Calibration
Figure 9.7 shows separate calibrations of the elastic modulus for all the girders,
girders fabricated at CTC, and girders fabricated at CPM. The basic elastic modulus was
computed with the AASHTO LRFD 2006 method because that is the one WSDOT now
uses.
The procedure involved selecting a value for the modification factor and
computing the predicted release camber for all the girders. In this process, the prestress
losses due to relaxation before transfer and elastic shortening were computed according
to the AASHTO LRFD 2006 method.
109

Variation of Ec to Optimize the Release Camber Measurement Error
0.00
0.50
1.00
1.50
2.00
0.75 1.00 1.25 1.50
Calibration Factor for Elastic Modulus
Ave
rage
Abs
olur
e C
ambe
r Er
ror p
er
Equa
tion
9.1
(in.)
All GirdersCTC GirdersCPM Girders
Figure 9.7 Calibration of Elastic Modulus at Release
The factors that minimized the average elastic deflection error at release were
1.15 for all girders, 1.10 for CTC girders, and 1.20 for CPM girders.
Figure 9.8 shows the predicted camber error at release when the calculated elastic
modulus was multiplied by the calibration factor of 1.15 for all the girders. With the
exception of the W50G girders from the 227th St Bridge project, most of the predicted
cambers were within +/- 0.5 inches of the measured values. The average absolute error
was 0.24 in.
110
Figure 9.8 Error in Prediction of Camber at Release Resulting from Use of the Modified Elastic Modulus (Ec Factor = 1.15)
9.5.2 Creep Calibration
Using the calibrated elastic modulus from Section 9.5.1, the creep coefficient was
calibrated to minimize the average absolute camber error for the second camber
measurement. The 2004 AASHTO LRFD method did not link changes in the creep
coefficient to changes in prestress due to creep. However, as pointed out by the NCHRP
Report 496 Committee, prestress losses are directly influenced by the creep coefficient.
Figures 9.9 and 9.10 show the variation in the elastic modulus and the creep coefficient
that minimized the average absolute error for both the CTC and CPM girders,
respectively, while using the actual concrete compressive strength.
111

CTC Girders - 2nd Camber Measurement Error
0.30
0.40
0.50
0.60
0.70
0.80
0.90
1.00
0.90 1.00 1.10 1.20 1.30Calibration Factor for Elastic Modulus
Ave
rage
Abs
olut
e C
ambe
r Err
or p
erEq
uatio
n 9.
1 (in
.)0.7 Cc 0.8 Cc 0.9 Cc 1.0 Cc 1.1 Cc
1.2 Cc 1.3 Cc 1.4 Cc 1.5 Cc 1.6 Cc
Figure 9.9 Effect of Variations in Elastic Modulus Factor and Creep Coefficient Factor for CTC Girders
CPM Girders - 2nd Camber Measurement Error1.00
0.30
0.40
0.50
0.60
0.70
0.80
0.90
0.90 1.00 1.10 1.20 1.30Calibration Factor for Elastic Modulus
Ave
rage
Abs
olut
e C
ambe
r Er
ror
per
Equa
tion
9.1
(in.)
1.0 Cc 1.1 Cc 1.2 Cc 1.3 Cc 1.4 Cc
1.5 Cc 1.6 Cc 1.7 Cc 1.8 Cc 1.9 Cc
Figure 9.10 Effect of Variations in Elastic Modulus Factor and Creep Coefficient Factor for CPM Girders
112

Figures 9.9 and 9.10 show that numerous combinations of factors for the elastic
modulus and creep coefficient were used to minimize the average error. Each
combination was about as good as the next. This observation allows the factors for
elastic modulus and creep to be established independently. Therefore, the elastic modulus
factor selected in Section 9.5.1 was accepted, and the creep coefficient factor was chosen
to minimize the average absolute camber error. Table 9.5 shows the creep coefficient
factors and the average absolute camber errors for the calibration of all the girders, as
well as girders fabricated at CTC and CPM. Because the factors for the calibrated creep
coefficient that minimized the predicted error differed between the two fabricators, the
camber errors were calculated separately for each fabricator. Figure 9.11 shows the
camber error for the girders cast at CTC and CPM.
Table 9.5 Summary of Errors for Various Coefficients on Elastic Modulus, Creep, and Prestress Loss Due to Creep
Factors Release Measurement (in.) 2nd Measurement (in.) Variations in Ec, Cc, and Δfps* Ec Cc ΔfpCR
Average Error
Average Absolute
Error Standard Deviation
Average Error
Average Absolute
Error Standard Deviation
None (Section 9.4) All 1.00 1.0 1.0 -0.29 0.38 0.36 0.02 0.30 0.39
CTC 1.00 1.0 1.0 -0.18 0.30 0.32 -0.10 0.27 0.34 CPM 1.00 1.0 1.0 -0.56 0.57 0.30 0.30 0.36 0.35
Ec (Section 9.5.1) All 1.15 1.0 1.0 -0.03 0.24 0.33 0.30 0.41 0.42
CTC 1.10 1.0 1.0 -0.04 0.25 0.32 0.08 0.28 0.36 CPM 1.20 1.0 1.0 -0.02 0.22 0.30 0.74 0.74 0.34
Ec, Cc (Section 9.5.2) All 1.15 1.4 1.0 -0.03 0.24 0.33 -0.01 0.30 0.39
CTC 1.15 1.3 1.0 0.02 0.24 0.33 -0.07 0.26 0.33 CPM 1.15 1.7 1.0 -0.14 0.25 0.30 0.07 0.29 0.37
Ec, Cc, Δfps (Section 9.5.3) All 1.15 1.5 1.0 -0.03 0.24 0.33 -0.09 0.32 0.39
CTC 1.15 1.3 1.2 0.02 0.24 0.33 -0.03 0.26 0.33 CPM 1.15 1.7 1.0 -0.14 0.25 0.30 0.07 0.29 0.37
* using actual concrete strengths
113

Figure 9.11 Camber Prediction Error Resulting from Use of the Calibrated Elastic
Modulus and Creep Coefficient for a) CTC girders b) CPM girders
114

If two criteria, such as matching release and long-term camber, are to be satisfied,
two adjustable variables are generally needed. In this case they are the factors on elastic
modulus and creep coefficient. Figures 9.9 and 9.10 show that setting both factors to 1.0
(i.e., not modifying either quantity) led to a nearly optimal solution for the camber error
at the second reading. However, the camber error at release was then not optimal.
Values different from 1.0 were needed for both factors to give an overall optimal
solution.
Because the elastic modulus factors were all greater than 1.0, they caused all the
cambers to decrease. Consequently, the creep coefficient factors also had to be greater
than 1.0 to increase the predicted long-term camber again to match the measured values.
The CPM girders required the largest factor.
9.5.3 Calibration of Prestress Losses Due to Creep
The Washington State girders listed in the NCHRP Report 496 showed the W83G
girders total prestress loss to be approximately 40 ksi (Tadros et al. 2003). However,
according to the AASHTO 2004 equations, the prestress loss for creep alone in the
W83G girders of the Yakima River and Keys Road girders was near 60 ksi. This
indicates that the AASHTO LRFD 2004 prestress loss equation significantly over-
predicted the real prestress losses for creep. Because the time-dependent losses due to
concrete shrinkage and strand relaxation are relatively small, a third factor to calibrate the
camber prediction model was used to adjust the amount of prestress loss due to creep.
After the initial optimization had been completed in this project with the AASHTO
LRFD 2004 equation, AASHTO adopted the recommendation in NCHRP Report 496,
which generally predicts lower losses. WSDOT has since adopted the AASHTO 2006
“Refined Methods of Time-Dependant Losses”. The optimization was therefore re-done
with the AASHTO LRFD 2006 equations for creep, shrinkage and prestress loss. The
115

new optimization affects only the conditions at the second camber reading because the
elastic modulus factor was left unchanged.
The modification factor was applied to the prestress loss calculated with Equation
2.18 from the AASHTO LRFD equation for predicting the amount of prestress loss due
to creep. Because no superimposed dead load was used in the analysis, the change in
concrete stress due to the dead load was zero.
Figures 9.12 and 9.13 show the average absolute camber error caused by
variations in the modification factors for the creep coefficient and the prestress loss due
to creep. For any prestress loss factor, the camber can be minimized by adjusting the
creep factor appropriately, but the value of the predicted camber is almost the same for all
optimal combinations. The optimal values are given in the last three rows of Table 9.3.
Figure 9.14 shows the predicted camber error for the CTC and CPM girders with
their modification factors for creep, shrinkage, and prestress loss due to creep.
Table 9.5 shows the errors in predicted camber generated by progressing through
the different stages of the optimization, in each of which an additional factor was
introduced. Errors are shown at both the release measurement and second camber
measurement, and for each fabricator and the total set of girders. This table summarizes
the modification of the model discussed in Section 9.5.
Modification of the prestress loss due to creep did not significantly reduce the
calculated error. Therefore, the researchers decided to use the least possible change to
the prestress loss because that behavior had been subjected to extensive recent study
(Tadros et al. 2003) and should be regarded as reliable (i.e., ΔfpCR Factor = 1.0).
116

CTC Girders - 2nd Camber Measurement Error
0.30
0.40
0.50
0.60
1.00 1.10 1.20 1.30 1.40 1.50
Calibration Factor for Creep Coefficient
Aver
age
Abs
olut
e C
ambe
r Err
or p
er
Equa
tion
9.1
(in.)
0.6 fpCP 0.7 fpCP 0.8 fpCP0.9 fpCP 1.0 fpCP 1.1 fpCP1.2 fpCP 1.3 fpCP 1.4 fpCP
Figure 9.12 Effect of Variations in Creep Coefficient Factor and Prestress Losses Due to Creep for CTC Girders
CPM Girders - 2nd Camber Measurement Error
0.30
0.40
0.50
0.60
0.70
0.80
1.40 1.50 1.60 1.70 1.80 1.90Calibration Factor for Creep Coefficient
Ave
rage
Abs
olut
e C
ambe
r Err
or
per E
quat
ion
9.1
(in.)
0.6 fpCP 0.7 fpCP 0.8 fpCP0.9 fpCP 1.0 fpCP 1.1 fpCP1.2 fpCP 1.3 fpCP 1.4 fpCP
Figure 9.13 Effect of Variations in Creep Coefficient Factor and Prestress Losses Due to Creep for CPM Girders
117

Figure 9.14 Camber Prediction Error Resulting from Use of the Calibrated Elastic Modulus, Creep Coefficient, and Prestress Loss Due to Creep for
a) CTC girders b) CPM girders
118

9.6 Summary
The reduction of error when the optimized factor was used on prestress loss due to
creep was not significant. Therefore, the recommended combination uses factors of 1.0
on prestress losses and 1.4 on the creep coefficient (Section 9.5.2). Figure 9.15 shows the
camber error for all the girders for the recommended modification factors listed in Table
9.3.
Table 9.6 shows the change in error resulting from the introduction of each
modification procedure. The largest reduction in error occurred when all the modification
procedures were used together. In addition, the basic WSDOT method using the design
concrete compressive strength was replaced by the modified method with all the
modification factors and the actual concrete compressive strength.
The table shows that the average error measures diminished significantly when
the various corrections were used, but the standard deviations changed much less.
Further improvement in the predictions can only be achieved if this scatter can be
reduced. Such a reduction is likely to require better monitoring or control of phenomena
that are not accounted for fully in the present methods, such as relative humidity, girder
shape (including volume/surface ratio), and more detailed material properties.
Accounting for these phenomena would require much more detailed reporting of
materials properties than is done in present practice, in which measurements are seldom
taken of elastic modulus and creep coefficient, much less of more advanced properties.
Furthermore, production plants would have to record temperature and relative humidity,
and sophisticated algorithms would need to be developed to account for parameters such
as the volume /surface ratio. The need for camber predictions more accurate than those
described here would therefore have to be evaluated carefully before such an effort were
to be undertaken.
119

Figure 9.15 Camber Prediction Error Resulting from Use of the Ec Factor = 1.15, Cc Factor = 1.4, ΔfCR Factor = 1.0 for All Girders a) At release b) At second
measurement
120

Table 9.6 Reductions in Errors Resulting from Use of the Various Predictive Methods
Release Measurement (in.) 2nd Measurement (in.) Percent Error Reduction for Method Comparisons Average
Error
Average Absolute
Error Standard Deviation
Average Error
Average Absolute
Error Standard Deviation
WSDOT (DCS) to WSDOT (ACS) All -30% -19% -2% -43% -39% -25%
CTC -43% -22% -6% -49% -45% -29% CPM -17% -16% 6% -24% -17% -5%
WSDOT (ACS) to Modified WSDOT (ACS) All 0% 0% 0% -104% -35% -1%
CTC 0% 0% 0% -75% -39% -10% CPM 0% 0% 0% -172% -25% -18%
Modified WSDOT (ACS) to Mod. WSDOT w/ Factors (ACS) All -90% -37% -8% -180% 2% 1%
CTC -110% -92% 4% -36% -6% -3% CPM -76% -57% -1% -78% -19% 6%
WSDOT (DCS) to Mod. WSDOT w/ Factors (ACS) All -93% -49% -10% -98% -60% -25%
CTC -106% -94% -2% -92% -69% -38% CPM -80% -64% 5% -112% -50% -17%
DCS = Design Concrete Strength ACS = Actual Concrete Strength
121

CHAPTER 10
SUMMARY AND CONCLUSIONS
10.1 Summary
The goal of the research described in this report was to improve the methods of
predicting camber in precast, prestressed concrete girders. To achieve this goal, a
numerical model of a girder was developed that allowed various constitutive models to be
used to estimate the major aspects of material behavior. These included elastic modulus,
creep, shrinkage and prestress loss. The individual constitutive models were drawn from
the AASHTO LRFD Specifications (AASHTO 2006), NCHRP report no. 496 (Tadros et
al. 2003), ACI Committee 363 (ACI 1992), and CEB-FIB (CEB-FIP 1993). Three sets of
measured data from isolated girders in the casting yard were then gathered and were used
to calibrate the constants in the numerical model. A fourth set of measured data from
girders erected in the field was used to verify the model’s predictions for long term
behavior.
The first set of measured data consisted of a detailed set of measurements on eight
W74G girders for the Snake Lake Bridge project, fabricated by Concrete Technology
Corporation (CTC) in Tacoma, Washington. Frequent camber measurements were taken,
starting at release and continuing for two months. Nine or more measurements were taken
on each girder. Preliminary materials measurements for that concrete, consisting of
strength, elastic modulus, shrinkage, and creep properties, were also made at the
University of Washington. Some of the results (e.g., negative shrinkage) were
unexpected, so a confirmatory series of tests was conducted later, as described by
Huphauf (2006).
The second set of measured data, which was less detailed, consisted of camber
measurements taken on W83G girders fabricated at Central Premix Prestress Co. (CPM),
in Pasco, Washington. Cambers were recorded for 28 girders in the yard on two
122

occasions. Only strength data were available for the materials. For five of these girders,
the effect of end restraint on camber was measured by replacing the supports with low-
resistance roller assemblies.
The third set of data consisted of camber readings made by CPM and CTC on 110
girders from various projects fabricated during the last 11 years. These data were
gathered from the companies’ files. The camber readings were taken at release (or
shortly thereafter) and at one subsequent time, as required by the state. Concrete strength
at release and at 28 days constituted the only materials data available for these girders.
The values of the constants in the model were then calibrated by adjusting them to
minimize the error between the predicted and measured cambers for all three sets,
comprising 146 girders.
An additional 91 girders from the Keys Road Project in Yakima, Washington,
were measured in situ to observe the change in camber due to the release of temporary
prestressing strands, deck placement, and time-dependent deflection after deck
placement. The observed changes in camber were compared with the calculated values to
establish trends in the behavior of the material.
10.2 Conclusions
A number of factors influence the camber of a prestressed concrete girder. The
findings associated with the broad study of 146 girders from six bridges, based on camber
measurements taken at the production facilities, are as follows:
1) Use of 2004 AASHTO LRFD. When the project started, the WSDOT camber
prediction method used prestress losses calculated according to the AASHTO
LRFD 2004 provisions. For the 146-girder set, that procedure led to the
camber prediction errors shown in Table 10.1
123

Table 10.1 Camber Errors (in.) Resulting from Use of Original WSDOT Method.
Release 2nd measurement
Average -0.42 0.73
Average abs. 0.47 0.75
Min/max -2.20/+0.80
2) Use of 2006 AASHTO LRFD. The current WSDOT procedure uses the
AASHTO LRFD 2006 provisions. However, because WSDOT does not
include prestress losses in the time-dependant camber calculations, the
magnitude of the time-dependent losses does not affect the predicted camber,
and the average error and average absolute error remain the same as in Table
10.1. This is true regardless of the prestress loss prediction method used.
3) Calibration of model coefficients. The numerical model was calibrated by
minimizing the error between the predicted and measured cambers for the set
of 146 girders. The coefficients for concrete strength, Young’s modulus, creep
coefficient and prestress loss due to creep were adjusted to achieve the best
fit. The primary findings with respect to those factors are
a) Concrete strength. On average, the measured concrete compressive
strength exceeded the specified strength by 10 percent at release and 25
percent at 28 days. The excess strength at release was particularly large
when the girder was cured for more than one day, as often happens over
weekends.
b) Elastic Modulus. For a given concrete strength at release, the value of the
elastic modulus, Eci, derived from the release camber measurements was,
on average, higher than that predicted by the AASHTO LRFD code
equations by approximately 15 percent. The value of Eci obtained from
124
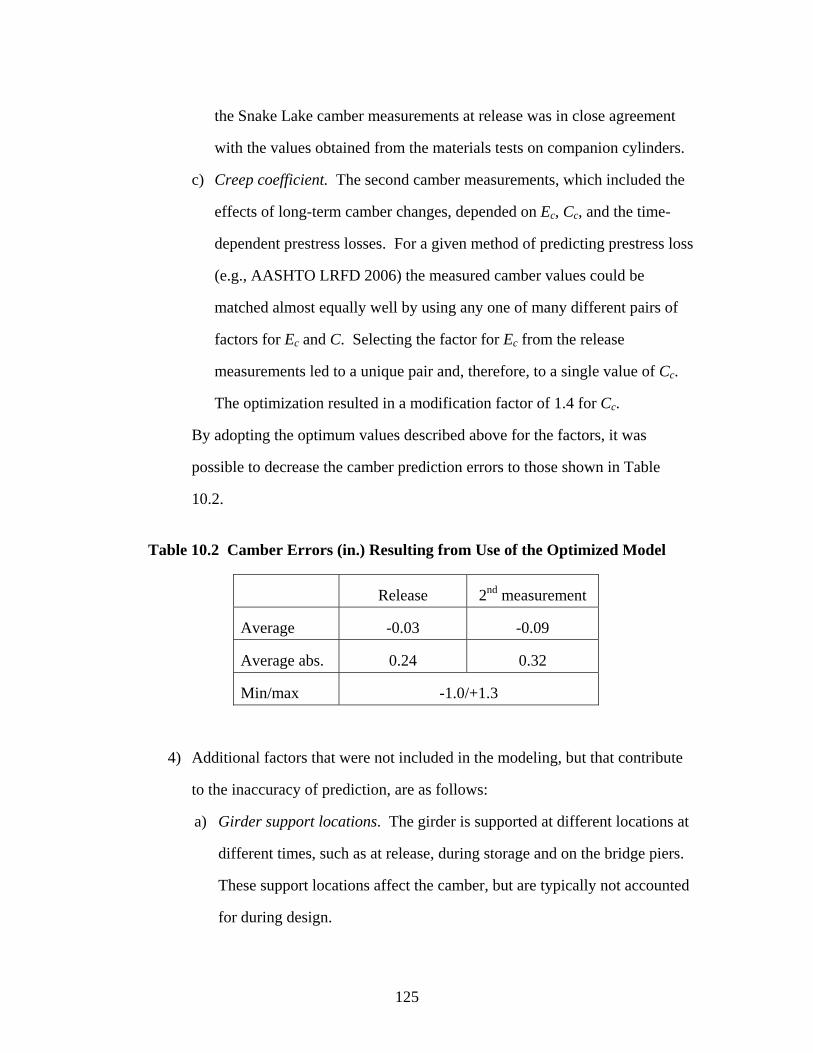
the Snake Lake camber measurements at release was in close agreement
with the values obtained from the materials tests on companion cylinders.
c) Creep coefficient. The second camber measurements, which included the
effects of long-term camber changes, depended on Ec, Cc, and the time-
dependent prestress losses. For a given method of predicting prestress loss
(e.g., AASHTO LRFD 2006) the measured camber values could be
matched almost equally well by using any one of many different pairs of
factors for Ec and C. Selecting the factor for Ec from the release
measurements led to a unique pair and, therefore, to a single value of Cc.
The optimization resulted in a modification factor of 1.4 for Cc.
By adopting the optimum values described above for the factors, it was
possible to decrease the camber prediction errors to those shown in Table
10.2.
Table 10.2 Camber Errors (in.) Resulting from Use of the Optimized Model
Release 2nd measurement
Average -0.03 -0.09
Average abs. 0.24 0.32
Min/max -1.0/+1.3
4) Additional factors that were not included in the modeling, but that contribute
to the inaccuracy of prediction, are as follows:
a) Girder support locations. The girder is supported at different locations at
different times, such as at release, during storage and on the bridge piers.
These support locations affect the camber, but are typically not accounted
for during design.
125

b) Restraint by support. Placement of a girder on a fixed support creates
some restraint to the longitudinal shortening of the bottom flange. Lifting
and reseating a girder in the storage yard released that restraint and caused
an increase in camber that averaged 0.15 in.
c) Measurement errors. Camber measurements after release were taken by
CTC (with a tape measure in the casting bed) and by the UW researchers
(with a laser level shortly after in the finishing yard). A comparison of
the results suggests that measurement errors of less than 0.25 in. are
achievable consistently.
d) Environmental conditions. Ambient air temperature, relative humidity,
and temperature gradient in the girder could affect measured cambers but
were not included in this research.
At the Keys Road Bridge site, girder cambers were measured at several times
during construction. Seven spans, with 13 girders per span, or 91 girders in all, were
monitored. Cambers were predicted using the numerical model and the optimum factors
described above. The following observations were made from the site measurements.
1) Effect of support conditions. Some girder ends were supported on oak blocks
and then built in to partial-height diaphragms, while others were seated on
elastomeric bearings. Girders supported on oak blocks at both ends deflected
less than those that were supported on an elastomeric bearing at one end. This
was true both when the temporary strands were released (prior to the girder’s
embedment in the partial diaphragm) and when the deck was cast (after
embedment). The lower deflections were attributed to fact that the bottom
flange of the girder was partially restrained against longitudinal movement.
The restrained girders behaved as if they were 41 percent to 46 percent stiffer
than those seated on elastomeric bearings.
126

2) Changes in camber due to changes in loading. A simple analytical model
showed that the girders with one end on an elastomeric bearing would behave
almost like a simple span, with essentially no end restraint. Therefore a simple
span model was used to predict camber change for the spans with one end on
an elastomeric bearing. However, when the temporary strands were released
the measured camber change was 21 percent larger than predicted, but when
the deck was cast the change was 14 percent less than predicted. The former
result suggests an end restraint with a negative stiffness and is anomalous. By
contrast, the spans that were restrained at both ends in all cases suffered
camber changes that were less than those predicted by using a simple span
model. This is consistent with the existence of partial end restraint. Attempts
to model the end restraint rationally showed that improbably large pier
stiffnesses were needed to match the measured camber changes. More
detailed site data and more sophisticated analytical modeling than was
possible here are needed to resolve the discrepancies.
3) The time-dependent deflection after deck placement was approximately 0.4
in., on average. However, a large amount of scatter was observed in the data,
with a coefficient of variation of 150 percent. Some results were unexpected.
For example, of the interior girders, those with two ends restrained deflected
more than those with only one end restrained. Choosing a simple but rational
model to compute the deflection is not easy because the elastic deflection is
controlled by the bare girder properties, but the girder is composite by the
time that the creep occurs. The best prediction was obtained by using the
composite section to compute a (fictitious) elastic deflection and multiplying
that by the creep coefficient to give the creep deflection.
127

4) Interior versus exterior girders. In a given span, the girders labeled as
exterior and interior deflected by almost identical mounts when the temporary
strands were cut. The same was true when the deck was cast.
10.3 Recommendations
10.3.1 Recommendations for Practice
The following recommendations are made for practice:
1) Concrete strength
For deflection calculations, increase the specified concrete strengths by 10
percent at release and 25 percent at 28 days.
2) Elastic modulus
Use 1.15 times the AASHTO LRFD 2006 equation for predicting the concrete
elastic modulus (Ec) for a given concrete strength. An alternative would be to
adopt the methods recommended by NCHRP or CEB-FIP.
3) Time-dependent effects
Account for the changes in long-term camber due to prestress losses from
the effects of creep, shrinkage, and relaxation.
Continue to use the AASHTO LRFD 2006 provisions for shrinkage and
prestress loss.
Use 1.4 times the value given by the AASHTO LRFD 2006 equation for
predicting the creep coefficient (Cc).
4) Effects of end restraint.
For temporary strand removal, use 1.2 times the elastic deflection of a
simply supported girder when one end is placed on an elastomeric bearing
pad, and multiply this amount by 0.7 when both ends are placed on oak
blocks.
128

For deck casting, use 0.9 times the elastic deflection of a simply supported
girder when one end is placed on an elastomeric bearing pad, and multiply
this amount by 0.7 when both ends are placed on oak blocks.
By following these recommendations, maximum errors were -0.9/+1.3 at release
and -1.0/+1.1 for subsequent measurements. Comparison with the values in Table 10.1
illustrates the improvement provided by the calibrated model.
10.3.2 Recommendations for Future Research
The following recommendations are made for further research.
A model should be developed in which the time-dependent concrete behavior
can be defined in terms of a potential function that can be differentiated with
respect to time and stress. The use of such a model would avoid the need to
track separately the response to each load component at each time step.
Additional field camber measurements should be made on simply supported
spans to compare the prediction model of a simply supported beam and the
effects of the bearing pad resistance to lateral deformation.
129

NOTATION
a = distance from the end of the girder to the harping point
Ag = gross-cross sectional area of girder
Ac = cross sectional area of concrete
Aps = total are of prestress strands
b = constant that changes the rate of increase
c = constant that changes the ultimate value
Ccu = ultimate creep coefficient
Ec = modulus of elasticity of concrete
Eci = modulus of elasticity of the concrete at release
eend = eccentricity of the prestressing at midspan of the girder
emid = eccentricity of the prestressing at the end of the girder
ep = eccentricity of center of gravity of prestressing steel
Ep = modulus of elasticity of the prestressing strand
f'c = concrete compressive strength (ksi)
fcgp = concrete stress at the center of gravity of prestressing strands due to the
prestressing force and self weight of the member directly after transfer
f’ci = compressive strength at the time of prestressing (ksi)
fpj = initial stress in the tendon directly after stressing (ksi)
fpu = ultimate strength of prestress strands
fpy = yield strength of the prestressing strands (ksi)
H = relative humidity (%)
Ig = gross section moment of inertia of girder
KCA = age at loading factor
KCH = humidity factor
KCS = shape and size factor
kf = factor for the effect of concrete strength
130

khc = humidity factor for creep
khs = humidity factor for shrinkage
ktd = time development factor
kvs = factor for the effect of the volume-to-surface ratio
L = girder length
Lc = length of overhang
Ln = distance between supports
Mg = self-weight moment of girder
n = modular ratio
Pi = initial prestress force directly after transfer
Pj = prestress force just before release.
t = maturity of concrete (days), defined as the age of the concrete between time of
loading for creep calculations, or end of curing for shrinkage calculations, and
the time being considered for analysis for creep or shrinkage effect.
ta = age of concrete when load is initially applied (day)
tp = time from strand stressing to release (days)
tstr = time after concrete starts to gain strength (day)
V/S = volume-to-surface ratio (in.)
β1 = coefficient controlling creep rate
β2 = coefficient controlling the effect of the age of loading
Δfcdp = change in concrete stress at the center of gravity of prestressing steel due
to permanent loads, with exception of the load acting at the time the
prestressing force is applied
ΔfpCR = prestress loss due to creep of concrete
ΔfpES = prestress loss due to elastic shortening
ΔfpR1 = prestress loss due to relaxation of steel before transfer
ΔfpR2 = prestress loss due to relaxation of steel after transfer
131

ΔfpSR = prestress loss due to shrinkage
ΔfpT = total prestress loss
ΔMISDPAN = the deflection at midspan relative to the support
ΔOVERHANG = the deflection of the overhang relative to the support
ΔDL = midspan deflection due to dead load
ΔPS = midspan deflection due to prestressing strands
ΔSW = midspan deflection due to self-weight
εsr = axial strain due to shrinkage
γ = unit weight of concrete (kcf)
ρ = reinforcement ratio
ωDL = dead load linearly distributed over the length of the girder
ωSW = self weight linearly distributed
ψ = creep coefficient
132

REFERENCES
ACI Committee 363. “State of the Art Report on High-Strength Concrete,” American Concrete Institute, Detroit, MI, 1992. American Association of State Highway and Transportation Officials (AASHTO). AASHTO LRFD Bridge Design Specifications”, 3rd edition – 2006 Interim Revisions, Washington, D.C., 2006. Barr, P.J., Elizabeth Fekete, John Stanton, Marc Eberhard. “High Strength Performance Concrete in Washington State SR18/SR516 Overcrossing: Final Report on Materials Tests.” Washington State Department of Transportation Bridge and Structures Office, report, Olympia, Washington, 2000. Comité Euro-International du Beton-Fédération Internationale de la Précontrainte, “CEB-FIP Model Code 1990 (CEB-FIP MC90),” Buletin D’Information No. 213/214, Lausanne, Switzlerland, May 1993. Hupauf, Tony. Internal Report. University of Washington, 2006. Naaman, Antoine E. Prestress Concrete Analysis and Design: Fundamentals. Second Edition. Techno Press 3000, Ann Arbor MI, 2004. Nilson, Arthur H, David Darwin and Charles W. Dolan. Design of Concrete Structures. Thirteenth Edition. New York: McGraw-Hill, 2004. PGSuper, Prestressed Girder SUPERstructure design and analysis software, V1.8.0. Washington State Department of Transportation, BridgeSight Software, 2006. Stanton, John F. “CE 511 Advanced Reinforced Concrete: Class Notes”, University of Washington, Seattle, 2004. Tadros, Maher K., Nabil Al-Omaishi, Stephen J. Seguirant, James G. Gallt. “Prestress Losses in High-Strength Concrete Bridge Girders.” National Cooperative Highway Research Program (NCHRP) Report 496, Transportation Research Board, Washington D.C., 2003. Washington State Department of Transportation. “Bridge and Structures Office.” Bridge Design Manual. http://www.wsdot.wa.gov/fasc/EngineeringPublications/ BDMSections.htm. (accessed March 6, 2006).
133

ACKNOWEDGMENTS
Funding for this project was provided by the Washington State Department of
Transportation, whose financial support is gratefully acknowledged.
Bijan Khaleghi and Jugesh Kapur of the Washington State Department of
Transportation Bridge and Structures Office were the technical contacts. Their
thoughtfulness and insights proved invaluable in guiding the project. Thanks are also due
to Mohammad Sheikhizadeh of the WSDOT Construction Office and Brian Bell of the
WSDOT Eastern Region for providing extensive and detailed field measurements on the
Keys Rd Bridge in Yakima, Washington.
Data collected from Washington State precast fabricators made significant
contributions to this research. Steve Seguirant and David Chapman of Concrete
Technology Corporation as well as Chuck Prussack and Jeff Jones of Central Pre-Mix
Prestress Co. graciously allowed the researchers access to their records and provided
assistance with moving girders in the yard and measuring cambers at difficult times.
Professor Greg Miller of University of Washington provided help and guidance
with developing the computer program for predicting camber. His wisdom and endless
patience are much appreciated.
134

APPENDIX A
FABRICATOR DATA COLLECTION

GeometryGroup Mk# CastDate Section Length (ft) Ag (in2) Ig (in4)
1 277th_St_Bridge G3 05/24/2004 W50G 96.10 526 1654612 277th_St_Bridge G3 05/25/2004 W50G 96.10 526 1654613 277th_St_Bridge G3 05/26/2004 W50G 96.10 526 1654614 277th_St_Bridge G3 05/27/2004 W50G 96.10 526 1654615 277th_St_Bridge G3 05/28/2004 W50G 96.10 526 1654616 277th_St_Bridge G3 06/01/2004 W50G 96.10 526 1654617 277th_St_Bridge G4 06/03/2004 W50G 96.10 526 1654618 277th_St_Bridge G4 06/04/2004 W50G 96.10 526 1654619 277th_St_Bridge G4 06/07/2004 W50G 96.10 526 165461
10 277th_St_Bridge G4 06/08/2004 W50G 96.10 526 16546111 277th_St_Bridge G4 06/09/2004 W50G 96.10 526 16546112 277th_St_Bridge G4 06/10/2004 W50G 96.10 526 16546113 277th_St_Bridge G2 06/11/2004 W50G 96.10 526 16546114 277th_St_Bridge G2 06/14/2004 W50G 96.10 526 16546115 277th_St_Bridge G1 06/15/2004 W50G 96.10 526 16546116 277th_St_Bridge G1 06/16/2004 W50G 96.10 526 16546117 Black_Lake_Blvd G12 01/18/1994 W74G 65.94 747 54753318 Black_Lake_Blvd G12 01/19/1994 W74G 65.94 747 54753319 Black_Lake_Blvd G12 01/20/1994 W74G 65.94 747 54753320 Black_Lake_Blvd G11 01/21/1994 W74G 65.94 747 54753321 Black_Lake_Blvd G13 01/24/1994 W74G 65.94 747 54753322 Black_Lake_Blvd G12 04/01/1994 W74G 65.94 747 54753323 Black_Lake_Blvd G12 04/04/1994 W74G 65.94 747 54753324 Black_Lake_Blvd G12 04/05/1994 W74G 65.94 747 54753325 Black_Lake_Blvd G12 04/06/1994 W74G 65.94 747 54753326 Black_Lake_Blvd G14 04/07/1994 W74G 65.94 747 54753327 Black_Lake_Blvd G15 04/08/1994 W74G 65.94 747 54753328 Black_Lake_Blvd G22 01/25/1994 W74G 86.90 747 54753329 Black_Lake_Blvd G22 01/26/1994 W74G 86.90 747 54753330 Black_Lake_Blvd G22 01/27/1994 W74G 86.90 747 54753331 Black_Lake_Blvd G21 01/28/1994 W74G 86.90 747 54753332 Black_Lake_Blvd G23 01/31/1994 W74G 86.90 747 54753333 Black_Lake_Blvd G22 02/01/1994 W74G 86.90 747 54753334 Black_Lake_Blvd G22 02/02/1994 W74G 86.90 747 54753335 Black_Lake_Blvd G22 02/03/1994 W74G 86.90 747 54753336 Black_Lake_Blvd G22 02/04/1994 W74G 86.90 747 54753337 Black_Lake_Blvd G24 02/07/1994 W74G 86.90 747 54753338 Black_Lake_Blvd G25 02/08/1994 W74G 86.90 747 54753339 Black_Lake_Blvd G2 02/11/1994 W74G 106.75 747 54753340 Black_Lake_Blvd G2 02/14/1994 W74G 106.75 747 54753341 Black_Lake_Blvd G2 02/15/1994 W74G 106.75 747 54753342 Black_Lake_Blvd G2 02/16/1994 W74G 106.75 747 54753343 Black_Lake_Blvd G2 02/17/1994 W74G 106.75 747 54753344 Black_Lake_Blvd G2 02/18/1994 W74G 106.75 747 54753345 Black_Lake_Blvd G2 02/21/1994 W74G 106.75 747 54753346 Black_Lake_Blvd G4 02/22/1994 W74G 106.75 747 54753347 Black_Lake_Blvd G3 02/23/1994 W74G 106.75 747 54753348 Black_Lake_Blvd G1 02/24/1994 W74G 106.75 747 54753349 Black_Lake_Blvd G5 02/25/1994 W74G 106.75 747 54753350 Black_Lake_Blvd G20 03/01/1994 W74G 125.75 747 54753351 Black_Lake_Blvd G16 03/02/1994 W74G 125.75 747 54753352 Black_Lake_Blvd G18 03/03/1994 W74G 125.75 747 54753353 Black_Lake_Blvd G19 03/04/1994 W74G 125.75 747 54753354 Black_Lake_Blvd G17 03/07/1994 W74G 125.75 747 54753355 Black_Lake_Blvd G17 03/08/1994 W74G 125.75 747 54753356 Black_Lake_Blvd G17 03/09/1994 W74G 125.75 747 54753357 Black_Lake_Blvd G17 03/10/1994 W74G 125.75 747 54753358 Black_Lake_Blvd G17 03/11/1994 W74G 125.75 747 54753359 Black_Lake_Blvd G17 03/14/1994 W74G 125.75 747 54753360 Black_Lake_Blvd G17 03/15/1994 W74G 125.75 747 54753361 Black_Lake_Blvd G7 01/04/1994 W74G 131.49 747 54753362 Black_Lake_Blvd G7 01/05/1994 W74G 131.49 747 547533
A - 1

GeometryGroup Mk# CastDate Section Length (ft) Ag (in2) Ig (in4)
63 Black_Lake_Blvd G7 01/06/1994 W74G 131.49 747 54753364 Black_Lake_Blvd G7 01/07/1994 W74G 131.49 747 54753365 Black_Lake_Blvd G7 01/10/1994 W74G 131.49 747 54753366 Black_Lake_Blvd G7 01/11/1994 W74G 131.49 747 54753367 Black_Lake_Blvd G8 01/12/1994 W74G 131.49 747 54753368 Black_Lake_Blvd G9 01/13/1994 W74G 131.49 747 54753369 Black_Lake_Blvd G6 01/14/1994 W74G 131.49 747 54753370 Black_Lake_Blvd G10 01/17/1994 W74G 131.49 747 54753371 Black_Lake_Blvd G7 03/16/1994 W74G 131.49 747 54753372 Black_Lake_Blvd G7 03/17/1994 W74G 131.49 747 54753373 Black_Lake_Blvd G7 03/18/1994 W74G 131.49 747 54753374 Black_Lake_Blvd G7 03/21/1994 W74G 131.49 747 54753375 Black_Lake_Blvd G7 03/22/1994 W74G 131.49 747 54753376 Black_Lake_Blvd G7 03/23/1994 W74G 131.49 747 54753377 Black_Lake_Blvd G7 03/24/1994 W74G 131.49 747 54753378 Black_Lake_Blvd G7 03/25/1994 W74G 131.49 747 54753379 Black_Lake_Blvd G8 03/28/1994 W74G 131.49 747 54753380 Black_Lake_Blvd G9 03/29/1994 W74G 131.49 747 54753381 Black_Lake_Blvd G10 03/30/1994 W74G 131.49 747 54753382 Black_Lake_Blvd G6 03/31/1994 W74G 131.49 747 54753383 Cedar_River_Bridge G17 04/20/2005 WF74G 94.42 918 70949184 Cedar_River_Bridge G17 04/21/2005 WF74G 94.42 918 70949185 Cedar_River_Bridge G17 04/22/2005 WF74G 94.42 918 70949186 Cedar_River_Bridge G16 04/27/2005 WF74G 94.42 918 70949187 Cedar_River_Bridge G14 04/04/2005 WF74G 120.25 918 70949188 Cedar_River_Bridge G14 04/05/2005 WF74G 120.25 918 70949189 Cedar_River_Bridge G14 04/06/2005 WF74G 120.25 918 70949190 Cedar_River_Bridge G15 04/07/2005 WF74G 120.25 918 70949191 Cedar_River_Bridge G12 04/12/2005 WF74G 127.58 918 70949192 Cedar_River_Bridge G10 04/13/2005 WF74G 127.58 918 70949193 Cedar_River_Bridge G11 04/14/2005 WF74G 127.58 918 70949194 Cedar_River_Bridge G11 04/15/2005 WF74G 127.58 918 70949195 Cedar_River_Bridge G11 04/18/2005 WF74G 127.58 918 70949196 Keys_Rd_Bridge MK6 09/24/2005 W83G 178.00 972 95663997 Keys_Rd_Bridge MK6 09/27/2005 W83G 178.00 972 95663998 Keys_Rd_Bridge MK6 09/29/2005 W83G 178.00 972 95663999 Keys_Rd_Bridge MK7C 10/04/2005 W83G 178.00 972 956639
100 Keys_Rd_Bridge MK7C 10/07/2005 W83G 178.00 972 956639101 Keys_Rd_Bridge MK7C 10/11/2005 W83G 178.00 972 956639102 Keys_Rd_Bridge MK7C 10/13/2005 W83G 178.00 972 956639103 Keys_Rd_Bridge MK7D 10/15/2005 W83G 178.00 972 956639104 Keys_Rd_Bridge MK7E 10/19/2005 W83G 178.00 972 956639105 Keys_Rd_Bridge MK7F 12/02/2005 W83G 178.00 972 956639106 Keys_Rd_Bridge MK7F 12/06/2005 W83G 178.00 972 956639107 Keys_Rd_Bridge MK7F 12/08/2005 W83G 178.00 972 956639108 Keys_Rd_Bridge MK7F 12/13/2005 W83G 178.00 972 956639109 Keys_Rd_Bridge MK8A 10/21/2005 W83G 178.00 972 956639110 Keys_Rd_Bridge MK8A 10/23/2005 W83G 178.00 972 956639111 Keys_Rd_Bridge MK8A 10/25/2005 W83G 178.00 972 956639112 Keys_Rd_Bridge MK8A 10/27/2005 W83G 178.00 972 956639113 Keys_Rd_Bridge MK8A 10/29/2005 W83G 178.00 972 956639114 Keys_Rd_Bridge MK8B 11/04/2005 W83G 178.00 972 956639115 Keys_Rd_Bridge MK8B 11/08/2005 W83G 178.00 972 956639116 Keys_Rd_Bridge MK8B 11/10/2005 W83G 178.00 972 956639117 Keys_Rd_Bridge MK8B 11/15/2005 W83G 178.00 972 956639118 Keys_Rd_Bridge MK8B 11/18/2005 W83G 178.00 972 956639119 Keys_Rd_Bridge MK8B 11/22/2005 W83G 178.00 972 956639120 Keys_Rd_Bridge MK8B 11/29/2005 W83G 178.00 972 956639121 Keys_Rd_Bridge MK5 08/30/2005 W83G 178.00 972 956639122 Keys_Rd_Bridge MK5 09/01/2005 W83G 178.00 972 956639123 Keys_Rd_Bridge MK5A 09/06/2005 W83G 178.00 972 956639124 Snake_Lake_Bridge G1A 09/02/2005 W74G 134.94 747 547533
A - 2

GeometryGroup Mk# CastDate Section Length (ft) Ag (in2) Ig (in4)
125 Snake_Lake_Bridge G2A 09/01/2005 W74G 134.96 747 547533126 Snake_Lake_Bridge G2D 09/09/2005 W74G 135.02 747 547533127 Snake_Lake_Bridge G1D 09/12/2005 W74G 135.04 747 547533128 Snake_Lake_Bridge G3D 09/08/2005 W74G 134.96 747 547533129 Snake_Lake_Bridge G3A 08/31/2005 W74G 135.00 747 547533130 Snake_Lake_Bridge G4A 08/29/2005 W74G 135.02 747 547533131 Snake_Lake_Bridge G4D 09/06/2005 W74G 134.96 747 547533132 Yakima_River_Bridge MK2 10/07/2003 W83G 170.67 972 956639133 Yakima_River_Bridge MK2 10/09/2003 W83G 170.67 972 956639134 Yakima_River_Bridge MK2 10/13/2003 W83G 170.67 972 956639135 Yakima_River_Bridge MK2 10/17/2003 W83G 170.67 972 956639136 Yakima_River_Bridge MK2 10/21/2003 W83G 170.67 972 956639137 Yakima_River_Bridge MK2B 10/23/2003 W83G 170.67 972 956639138 Yakima_River_Bridge MK2A 10/27/2003 W83G 170.67 972 956639139 Yakima_River_Bridge MK1A 10/29/2003 W83G 173.17 972 956639140 Yakima_River_Bridge MK1B 10/31/2003 W83G 173.17 972 956639141 Yakima_River_Bridge MK1 11/04/2003 W83G 173.17 972 956639142 Yakima_River_Bridge MK1 11/06/2003 W83G 173.17 972 956639143 Yakima_River_Bridge MK1 11/10/2003 W83G 173.17 972 956639144 Yakima_River_Bridge MK1 11/12/2003 W83G 173.17 972 956639145 Yakima_River_Bridge MK1 11/14/2003 W83G 173.17 972 956639146 Yakima_River_Bridge MK1 11/18/2003 W83G 173.17 972 956639
A - 3

123456789
1011121314151617181920212223242526272829303132333435363738394041424344454647484950515253545556575859606162
Release 2nd 3rdDepth (in) V/S (in) c1 (in.) c2 (in.) Ln (ft) Ln (ft) Ln (ft)
50.00 3.13 22.77 27.23 92.60 92.10 90.1050.00 3.13 22.77 27.23 92.60 92.10 90.1050.00 3.13 22.77 27.23 92.60 92.10 90.1050.00 3.13 22.77 27.23 92.60 92.10 90.1050.00 3.13 22.77 27.23 92.60 92.10 90.1050.00 3.13 22.77 27.23 92.60 92.10 90.1050.00 3.13 22.77 27.23 92.60 92.10 90.1050.00 3.13 22.77 27.23 92.60 92.10 90.1050.00 3.13 22.77 27.23 92.60 92.10 90.1050.00 3.13 22.77 27.23 92.60 92.10 90.1050.00 3.13 22.77 27.23 92.60 92.10 90.1050.00 3.13 22.77 27.23 92.60 92.10 90.1050.00 3.13 22.77 27.23 92.60 92.10 90.1050.00 3.13 22.77 27.23 92.60 92.10 90.1050.00 3.13 22.77 27.23 92.60 92.10 90.1050.00 3.13 22.77 27.23 92.60 92.10 90.1073.50 2.90 38.03 35.47 62.94 62.94 55.9473.50 2.90 38.03 35.47 62.94 62.94 55.9473.50 2.90 38.03 35.47 62.94 62.94 55.9473.50 2.90 38.03 35.47 62.94 62.94 55.9473.50 2.90 38.03 35.47 62.94 62.94 55.9473.50 2.90 38.03 35.47 62.94 62.94 55.9473.50 2.90 38.03 35.47 62.94 62.94 55.9473.50 2.90 38.03 35.47 62.94 62.94 55.9473.50 2.90 38.03 35.47 62.94 62.94 55.9473.50 2.90 38.03 35.47 62.94 62.94 55.9473.50 2.90 38.03 35.47 62.94 62.94 55.9473.50 2.90 38.03 35.47 83.90 83.98 76.9873.50 2.90 38.03 35.47 83.90 83.98 76.9873.50 2.90 38.03 35.47 83.90 83.98 76.9873.50 2.90 38.03 35.47 83.90 83.98 76.9873.50 2.90 38.03 35.47 83.90 83.98 76.9873.50 2.90 38.03 35.47 83.90 83.98 76.9873.50 2.90 38.03 35.47 83.90 83.98 76.9873.50 2.90 38.03 35.47 83.90 83.98 76.9873.50 2.90 38.03 35.47 83.90 83.98 76.9873.50 2.90 38.03 35.47 83.90 83.98 76.9873.50 2.90 38.03 35.47 83.90 83.98 76.9873.50 2.90 38.03 35.47 103.75 103.88 96.8873.50 2.90 38.03 35.47 103.75 103.88 96.8873.50 2.90 38.03 35.47 103.75 103.88 96.8873.50 2.90 38.03 35.47 103.75 103.88 96.8873.50 2.90 38.03 35.47 103.75 103.88 96.8873.50 2.90 38.03 35.47 103.75 103.88 96.8873.50 2.90 38.03 35.47 103.75 103.88 96.8873.50 2.90 38.03 35.47 103.75 103.88 96.8873.50 2.90 38.03 35.47 103.75 103.88 96.8873.50 2.90 38.03 35.47 103.75 103.88 96.8873.50 2.90 38.03 35.47 103.75 103.88 96.8873.50 2.90 38.03 35.47 122.75 122.94 115.9473.50 2.90 38.03 35.47 122.75 122.94 115.9473.50 2.90 38.03 35.47 122.75 122.94 115.9473.50 2.90 38.03 35.47 122.75 122.94 115.9473.50 2.90 38.03 35.47 122.75 122.94 115.9473.50 2.90 38.03 35.47 122.75 122.94 115.9473.50 2.90 38.03 35.47 122.75 122.94 115.9473.50 2.90 38.03 35.47 122.75 122.94 115.9473.50 2.90 38.03 35.47 122.75 122.94 115.9473.50 2.90 38.03 35.47 122.75 122.94 115.9473.50 2.90 38.03 35.47 122.75 122.94 115.9473.50 2.90 38.03 35.47 127.49 128.71 121.7173.50 2.90 38.03 35.47 127.49 128.71 121.71
A - 4

163646566676869707172737475767778798081828384858687888990919293949596979899
100101102103104105106107108109110111112113114115116117118119120121122123124
Release 2nd 3rdDepth (in) V/S (in) c1 (in.) c2 (in.) Ln (ft) Ln (ft) Ln (ft)
73.50 2.90 38.03 35.47 127.49 128.71 121.7173.50 2.90 38.03 35.47 127.49 128.71 121.7173.50 2.90 38.03 35.47 127.49 128.71 121.7173.50 2.90 38.03 35.47 127.49 128.71 121.7173.50 2.90 38.03 35.47 127.49 128.71 121.7173.50 2.90 38.03 35.47 127.49 128.71 121.7173.50 2.90 38.03 35.47 127.49 128.71 121.7173.50 2.90 38.03 35.47 127.49 128.71 121.7173.50 2.90 38.03 35.47 127.49 128.71 121.7173.50 2.90 38.03 35.47 127.49 128.71 121.7173.50 2.90 38.03 35.47 127.49 128.71 121.7173.50 2.90 38.03 35.47 127.49 128.71 121.7173.50 2.90 38.03 35.47 127.49 128.71 121.7173.50 2.90 38.03 35.47 127.49 128.71 121.7173.50 2.90 38.03 35.47 127.49 128.71 121.7173.50 2.90 38.03 35.47 127.49 128.71 121.7173.50 2.90 38.03 35.47 127.49 128.71 121.7173.50 2.90 38.03 35.47 127.49 128.71 121.7173.50 2.90 38.03 35.47 127.49 128.71 121.7173.50 2.90 38.03 35.47 127.49 128.71 121.7172.88 3.20 35.08 37.80 86.42 90.42 84.4272.88 3.20 35.08 37.80 86.42 90.42 84.4272.88 3.20 35.08 37.80 86.42 90.42 84.4272.88 3.20 35.08 37.80 86.42 90.42 84.4272.88 3.20 35.08 37.80 112.25 116.25 110.2572.88 3.20 35.08 37.80 112.25 116.25 110.2572.88 3.20 35.08 37.80 112.25 116.25 110.2572.88 3.20 35.08 37.80 112.25 116.25 110.2572.88 3.20 35.08 37.80 119.58 123.58 117.5872.88 3.20 35.08 37.80 119.58 123.58 117.5872.88 3.20 35.08 37.80 119.58 123.58 117.5872.88 3.20 35.08 37.80 119.58 123.58 117.5872.88 3.20 35.08 37.80 119.58 123.58 117.5882.68 3.17 39.66 43.02 158.00 174.00 158.0082.68 3.17 39.66 43.02 158.00 174.00 158.0082.68 3.17 39.66 43.02 158.00 174.00 158.0082.68 3.17 39.66 43.02 158.00 174.00 158.0082.68 3.17 39.66 43.02 158.00 174.00 158.0082.68 3.17 39.66 43.02 158.00 174.00 158.0082.68 3.17 39.66 43.02 158.00 174.00 158.0082.68 3.17 39.66 43.02 158.00 174.00 158.0082.68 3.17 39.66 43.02 158.00 174.00 158.0082.68 3.17 39.66 43.02 158.00 174.00 158.0082.68 3.17 39.66 43.02 158.00 174.00 158.0082.68 3.17 39.66 43.02 158.00 174.00 158.0082.68 3.17 39.66 43.02 158.00 174.00 158.0082.68 3.17 39.66 43.02 158.00 174.00 158.0082.68 3.17 39.66 43.02 158.00 174.00 158.0082.68 3.17 39.66 43.02 158.00 174.00 158.0082.68 3.17 39.66 43.02 158.00 174.00 158.0082.68 3.17 39.66 43.02 158.00 174.00 158.0082.68 3.17 39.66 43.02 158.00 174.00 158.0082.68 3.17 39.66 43.02 158.00 174.00 158.0082.68 3.17 39.66 43.02 158.00 174.00 158.0082.68 3.17 39.66 43.02 158.00 174.00 158.0082.68 3.17 39.66 43.02 158.00 174.00 158.0082.68 3.17 39.66 43.02 158.00 174.00 158.0082.68 3.17 39.66 43.02 158.00 174.00 158.0082.68 3.17 39.66 43.02 158.00 174.00 158.0082.68 3.17 39.66 43.02 158.00 174.00 158.0082.68 3.17 39.66 43.02 158.00 174.00 158.0073.50 2.90 38.03 35.47 129.00 129.50 129.50
A - 5

1125126127128129130131132133134135136137138139140141142143144145146
Release 2nd 3rdDepth (in) V/S (in) c1 (in.) c2 (in.) Ln (ft) Ln (ft) Ln (ft)
73.50 2.90 38.03 35.47 129.00 129.50 129.5073.50 2.90 38.03 35.47 129.00 129.50 129.5073.50 2.90 38.03 35.47 129.00 129.50 129.5073.50 2.90 38.03 35.47 129.00 129.50 129.5073.50 2.90 38.03 35.47 129.00 129.50 129.5073.50 2.90 38.03 35.47 129.00 129.50 129.5073.50 2.90 38.03 35.47 129.00 129.50 129.5082.68 3.17 39.66 43.02 150.67 166.67 150.6782.68 3.17 39.66 43.02 150.67 166.67 150.6782.68 3.17 39.66 43.02 150.67 166.67 150.6782.68 3.17 39.66 43.02 150.67 166.67 150.6782.68 3.17 39.66 43.02 150.67 166.67 150.6782.68 3.17 39.66 43.02 150.67 166.67 150.6782.68 3.17 39.66 43.02 150.67 166.67 150.6782.68 3.17 39.66 43.02 153.17 166.67 150.6782.68 3.17 39.66 43.02 153.17 166.67 150.6782.68 3.17 39.66 43.02 153.17 166.67 150.6782.68 3.17 39.66 43.02 153.17 166.67 150.6782.68 3.17 39.66 43.02 153.17 166.67 150.6782.68 3.17 39.66 43.02 153.17 166.67 150.6782.68 3.17 39.66 43.02 153.17 166.67 150.6782.68 3.17 39.66 43.02 153.17 166.67 150.67
A - 6

123456789
1011121314151617181920212223242526272829303132333435363738394041424344454647484950515253545556575859606162
4th PrestressLn (ft) H (%) Straight estraight Harped emid,harped eend,harped a (in.)94.81 80 24 19.29 7 13.75 -20.64 414.4094.81 80 24 19.29 7 13.75 -20.64 414.4094.81 80 24 19.29 7 13.75 -20.64 414.4094.81 80 24 19.29 7 13.75 -20.64 414.4094.81 80 24 19.29 7 13.75 -20.64 414.4094.81 80 24 19.29 7 13.75 -20.64 414.4094.81 80 24 19.29 7 13.75 -20.64 414.4094.81 80 24 19.29 7 13.75 -20.64 414.4094.81 80 24 19.29 7 13.75 -20.64 414.4094.81 80 24 19.29 7 13.75 -20.64 414.4094.81 80 24 19.29 7 13.75 -20.64 414.4094.81 80 24 19.29 7 13.75 -20.64 414.4094.81 80 24 19.29 7 13.75 -20.64 414.4094.81 80 24 19.29 7 13.75 -20.64 414.4094.81 80 24 19.29 7 13.75 -20.64 414.4094.81 80 24 19.29 7 13.75 -20.64 414.4064.78 80 6 36.16 6 35.03 -9.47 317.6464.78 80 6 36.16 6 35.03 -9.47 317.6464.78 80 6 36.16 6 35.03 -9.47 317.6464.78 80 6 36.16 6 35.03 -9.47 317.6464.78 80 6 36.16 6 35.03 -9.47 317.6464.78 80 6 36.16 6 35.03 -9.47 317.6464.78 80 6 36.16 6 35.03 -9.47 317.6464.78 80 6 36.16 6 35.03 -9.47 317.6464.78 80 6 36.16 6 35.03 -9.47 317.6464.78 80 6 36.16 6 35.03 -9.47 317.6464.78 80 6 36.16 6 35.03 -9.47 317.6485.39 80 12 38.82 9 35.03 -24.40 418.8885.39 80 12 38.82 9 35.03 -24.40 418.8885.39 80 12 38.82 9 35.03 -24.40 418.8885.39 80 12 38.82 9 35.03 -24.40 418.8885.39 80 12 38.82 9 35.03 -24.40 418.8885.39 80 12 38.82 9 35.03 -24.40 418.8885.39 80 12 38.82 9 35.03 -24.40 418.8885.39 80 12 38.82 9 35.03 -24.40 418.8885.39 80 12 38.82 9 35.03 -24.40 418.8885.39 80 12 38.82 9 35.03 -24.40 418.8885.39 80 12 38.82 9 35.03 -24.40 418.88105.22 80 22 34.70 10 35.03 -29.47 514.25105.22 80 22 34.70 10 35.03 -29.47 514.25105.22 80 22 34.70 10 35.03 -29.47 514.25105.22 80 22 34.70 10 35.03 -29.47 514.25105.22 80 22 34.70 10 35.03 -29.47 514.25105.22 80 22 34.70 10 35.03 -29.47 514.25105.22 80 22 34.70 10 35.03 -29.47 514.25105.22 80 22 34.70 10 35.03 -29.47 514.25105.22 80 22 34.70 10 35.03 -29.47 514.25105.22 80 22 34.70 10 35.03 -29.47 514.25105.22 80 22 34.70 10 35.03 -29.47 514.25124.87 80 26 34.46 17 34.15 -17.32 317.64124.87 80 26 34.46 17 34.15 -17.32 317.64124.87 80 26 34.46 17 34.15 -17.32 317.64124.87 80 26 34.46 17 34.15 -17.32 317.64124.87 80 26 34.46 17 34.15 -17.32 317.64124.87 80 26 34.46 17 34.15 -17.32 317.64124.87 80 26 34.46 17 34.15 -17.32 317.64124.87 80 26 34.46 17 34.15 -17.32 317.64124.87 80 26 34.46 17 34.15 -17.32 317.64124.87 80 26 34.46 17 34.15 -17.32 317.64124.87 80 26 34.46 17 34.15 -17.32 317.64131.71 80 26 34.46 22 33.67 -8.35 632.26131.71 80 26 34.46 22 33.67 -8.35 632.26
A - 7

163646566676869707172737475767778798081828384858687888990919293949596979899
100101102103104105106107108109110111112113114115116117118119120121122123124
4th PrestressLn (ft) H (%) Straight estraight Harped emid,harped eend,harped a (in.)131.71 80 26 34.46 22 33.67 -8.35 632.26131.71 80 26 34.46 22 33.67 -8.35 632.26131.71 80 26 34.46 22 33.67 -8.35 632.26131.71 80 26 34.46 22 33.67 -8.35 632.26131.71 80 26 34.46 22 33.67 -8.35 632.26131.71 80 26 34.46 22 33.67 -8.35 632.26131.71 80 26 34.46 22 33.67 -8.35 632.26131.71 80 26 34.46 22 33.67 -8.35 632.26131.71 80 26 34.46 22 33.67 -8.35 632.26131.71 80 26 34.46 22 33.67 -8.35 632.26131.71 80 26 34.46 22 33.67 -8.35 632.26131.71 80 26 34.46 22 33.67 -8.35 632.26131.71 80 26 34.46 22 33.67 -8.35 632.26131.71 80 26 34.46 22 33.67 -8.35 632.26131.71 80 26 34.46 22 33.67 -8.35 632.26131.71 80 26 34.46 22 33.67 -8.35 632.26131.71 80 26 34.46 22 33.67 -8.35 632.26131.71 80 26 34.46 22 33.67 -8.35 632.26131.71 80 26 34.46 22 33.67 -8.35 632.26131.71 80 26 34.46 22 33.67 -8.35 632.2692.42 80 16 33.08 9 32.08 -24.24 446.5292.42 80 16 33.08 9 32.08 -24.24 446.5292.42 80 16 33.08 9 32.08 -24.24 446.5292.42 80 16 33.08 9 32.08 -24.24 446.52118.25 80 26 32.31 14 31.66 -27.80 577.50118.25 80 26 32.31 14 31.66 -27.80 577.50118.25 80 26 32.31 14 31.66 -27.80 577.50118.25 80 26 32.31 14 31.66 -27.80 577.50125.58 80 30 32.15 16 31.31 -26.80 609.48125.58 80 30 32.15 16 31.31 -26.80 609.48125.58 80 30 32.15 16 31.31 -26.80 609.48125.58 80 30 32.15 16 31.31 -26.80 609.48125.58 80 30 32.15 16 31.31 -26.80 609.48176.00 70 46 35.54 22 35.29 -29.08 852.00176.00 70 46 35.54 22 35.29 -29.08 852.00176.00 70 46 35.54 22 35.29 -29.08 852.00176.00 70 46 35.54 22 35.29 -29.08 852.00176.00 70 46 35.54 22 35.29 -29.08 852.00176.00 70 46 35.54 22 35.29 -29.08 852.00176.00 70 46 35.54 22 35.29 -29.08 852.00176.00 70 46 35.54 22 35.29 -29.08 852.00176.00 70 46 35.54 22 35.29 -29.08 852.00176.00 70 46 35.54 22 35.29 -29.08 852.00176.00 70 46 35.54 22 35.29 -29.08 852.00176.00 70 46 35.54 22 35.29 -29.08 852.00176.00 70 46 35.54 22 35.29 -29.08 852.00176.00 70 44 36.35 24 35.16 -28.02 852.00176.00 70 44 36.35 24 35.16 -28.02 852.00176.00 70 44 36.35 24 35.16 -28.02 852.00176.00 70 44 36.35 24 35.16 -28.02 852.00176.00 70 44 36.35 24 35.16 -28.02 852.00176.00 70 44 36.35 24 35.16 -28.02 852.00176.00 70 44 36.35 24 35.16 -28.02 852.00176.00 70 44 36.35 24 35.16 -28.02 852.00176.00 70 44 36.35 24 35.16 -28.02 852.00176.00 70 44 36.35 24 35.16 -28.02 852.00176.00 70 44 36.35 24 35.16 -28.02 852.00176.00 70 44 36.35 24 35.16 -28.02 852.00176.00 70 46 35.54 24 35.16 -28.02 852.00176.00 70 46 35.54 24 35.16 -28.02 852.00176.00 70 46 35.54 24 35.16 -28.02 852.00129.50 80 26 34.33 11 35.08 -26.97 647.70
A - 8

1125126127128129130131132133134135136137138139140141142143144145146
4th PrestressLn (ft) H (%) Straight estraight Harped emid,harped eend,harped a (in.)129.50 80 26 34.33 11 35.08 -26.97 647.80129.50 80 26 34.33 11 35.08 -26.97 648.10129.50 80 26 34.33 12 35.08 -26.47 648.20129.50 80 26 34.33 15 34.46 -24.97 647.80129.50 80 26 34.33 15 34.46 -24.97 648.00129.50 80 26 34.33 17 34.20 -23.97 648.10129.50 80 26 34.33 18 34.08 -23.47 647.80168.67 70 46 35.54 22 35.29 -29.02 819.22168.67 70 46 35.54 22 35.29 -29.02 819.22168.67 70 46 35.54 22 35.29 -29.02 819.22168.67 70 46 35.54 22 35.29 -29.02 819.22168.67 70 46 35.54 22 35.29 -29.02 819.22168.67 70 46 35.54 22 35.29 -29.02 819.22168.67 70 46 35.54 22 35.29 -29.02 819.22168.67 70 46 35.54 24 35.22 -27.97 831.22168.67 70 46 35.54 24 35.22 -27.97 831.22168.67 70 46 35.54 24 35.22 -27.97 831.22168.67 70 46 35.54 24 35.22 -27.97 831.22168.67 70 46 35.54 24 35.22 -27.97 831.22168.67 70 46 35.54 24 35.22 -27.97 831.22168.67 70 46 35.54 24 35.22 -27.97 831.22168.67 70 46 35.54 24 35.22 -27.97 831.22
A - 9

123456789
1011121314151617181920212223242526272829303132333435363738394041424344454647484950515253545556575859606162
Strand StrandTemporary emid,tempt eend,tempt Dia. (in) Ap (in2) Ep (ksi) fpu (ksi) fpy (ksi)
0 0.00 0.00 0.60 0.217 28500 270 2430 0.00 0.00 0.60 0.217 28500 270 2430 0.00 0.00 0.60 0.217 28500 270 2430 0.00 0.00 0.60 0.217 28500 270 2430 0.00 0.00 0.60 0.217 28500 270 2430 0.00 0.00 0.60 0.217 28500 270 2430 0.00 0.00 0.60 0.217 28500 270 2430 0.00 0.00 0.60 0.217 28500 270 2430 0.00 0.00 0.60 0.217 28500 270 2430 0.00 0.00 0.60 0.217 28500 270 2430 0.00 0.00 0.60 0.217 28500 270 2430 0.00 0.00 0.60 0.217 28500 270 2430 0.00 0.00 0.60 0.217 28500 270 2430 0.00 0.00 0.60 0.217 28500 270 2430 0.00 0.00 0.60 0.217 28500 270 2430 0.00 0.00 0.60 0.217 28500 270 2430 0.00 0.00 0.50 0.153 28500 270 2430 0.00 0.00 0.50 0.153 28500 270 2430 0.00 0.00 0.50 0.153 28500 270 2430 0.00 0.00 0.50 0.153 28500 270 2430 0.00 0.00 0.50 0.153 28500 270 2430 0.00 0.00 0.50 0.153 28500 270 2430 0.00 0.00 0.50 0.153 28500 270 2430 0.00 0.00 0.50 0.153 28500 270 2430 0.00 0.00 0.50 0.153 28500 270 2430 0.00 0.00 0.50 0.153 28500 270 2430 0.00 0.00 0.50 0.153 28500 270 2430 0.00 0.00 0.50 0.153 28500 270 2430 0.00 0.00 0.50 0.153 28500 270 2430 0.00 0.00 0.50 0.153 28500 270 2430 0.00 0.00 0.50 0.153 28500 270 2430 0.00 0.00 0.50 0.153 28500 270 2430 0.00 0.00 0.50 0.153 28500 270 2430 0.00 0.00 0.50 0.153 28500 270 2430 0.00 0.00 0.50 0.153 28500 270 2430 0.00 0.00 0.50 0.153 28500 270 2430 0.00 0.00 0.50 0.153 28500 270 2430 0.00 0.00 0.50 0.153 28500 270 2430 0.00 0.00 0.50 0.153 28500 270 2430 0.00 0.00 0.50 0.153 28500 270 2430 0.00 0.00 0.50 0.153 28500 270 2430 0.00 0.00 0.50 0.153 28500 270 2430 0.00 0.00 0.50 0.153 28500 270 2430 0.00 0.00 0.50 0.153 28500 270 2430 0.00 0.00 0.50 0.153 28500 270 2430 0.00 0.00 0.50 0.153 28500 270 2430 0.00 0.00 0.50 0.153 28500 270 2430 0.00 0.00 0.50 0.153 28500 270 2430 0.00 0.00 0.50 0.153 28500 270 2430 0.00 0.00 0.50 0.153 28500 270 2430 0.00 0.00 0.50 0.153 28500 270 2430 0.00 0.00 0.50 0.153 28500 270 2430 0.00 0.00 0.50 0.153 28500 270 2430 0.00 0.00 0.50 0.153 28500 270 2430 0.00 0.00 0.50 0.153 28500 270 2430 0.00 0.00 0.50 0.153 28500 270 2430 0.00 0.00 0.50 0.153 28500 270 2430 0.00 0.00 0.50 0.153 28500 270 2430 0.00 0.00 0.50 0.153 28500 270 2430 0.00 0.00 0.50 0.153 28500 270 2430 0.00 0.00 0.50 0.153 28500 270 2430 0.00 0.00 0.50 0.153 28500 270 243
A - 10

163646566676869707172737475767778798081828384858687888990919293949596979899
100101102103104105106107108109110111112113114115116117118119120121122123124
Strand StrandTemporary emid,tempt eend,tempt Dia. (in) Ap (in2) Ep (ksi) fpu (ksi) fpy (ksi)
0 0.00 0.00 0.50 0.153 28500 270 2430 0.00 0.00 0.50 0.153 28500 270 2430 0.00 0.00 0.50 0.153 28500 270 2430 0.00 0.00 0.50 0.153 28500 270 2430 0.00 0.00 0.50 0.153 28500 270 2430 0.00 0.00 0.50 0.153 28500 270 2430 0.00 0.00 0.50 0.153 28500 270 2430 0.00 0.00 0.50 0.153 28500 270 2430 0.00 0.00 0.50 0.153 28500 270 2430 0.00 0.00 0.50 0.153 28500 270 2430 0.00 0.00 0.50 0.153 28500 270 2430 0.00 0.00 0.50 0.153 28500 270 2430 0.00 0.00 0.50 0.153 28500 270 2430 0.00 0.00 0.50 0.153 28500 270 2430 0.00 0.00 0.50 0.153 28500 270 2430 0.00 0.00 0.50 0.153 28500 270 2430 0.00 0.00 0.50 0.153 28500 270 2430 0.00 0.00 0.50 0.153 28500 270 2430 0.00 0.00 0.50 0.153 28500 270 2430 0.00 0.00 0.50 0.153 28500 270 2432 -35.80 -35.80 0.60 0.217 28500 270 2432 -35.80 -35.80 0.60 0.217 28500 270 2432 -35.80 -35.80 0.60 0.217 28500 270 2432 -35.80 -35.80 0.60 0.217 28500 270 2432 -35.80 -35.80 0.60 0.217 28500 270 2432 -35.80 -35.80 0.60 0.217 28500 270 2432 -35.80 -35.80 0.60 0.217 28500 270 2432 -35.80 -35.80 0.60 0.217 28500 270 2436 -35.80 -35.80 0.60 0.217 28500 270 2436 -35.80 -35.80 0.60 0.217 28500 270 2436 -35.80 -35.80 0.60 0.217 28500 270 2436 -35.80 -35.80 0.60 0.217 28500 270 2436 -35.80 -35.80 0.60 0.217 28500 270 2436 -41.02 -41.02 0.60 0.217 28500 270 2436 -41.02 -41.02 0.60 0.217 28500 270 2436 -41.02 -41.02 0.60 0.217 28500 270 2436 -41.02 -41.02 0.60 0.217 28500 270 2436 -41.02 -41.02 0.60 0.217 28500 270 2436 -41.02 -41.02 0.60 0.217 28500 270 2436 -41.02 -41.02 0.60 0.217 28500 270 2436 -41.02 -41.02 0.60 0.217 28500 270 2436 -41.02 -41.02 0.60 0.217 28500 270 2436 -41.02 -41.02 0.60 0.217 28500 270 2436 -41.02 -41.02 0.60 0.217 28500 270 2436 -41.02 -41.02 0.60 0.217 28500 270 2436 -41.02 -41.02 0.60 0.217 28500 270 2436 -41.02 -41.02 0.60 0.217 28500 270 2436 -41.02 -41.02 0.60 0.217 28500 270 2436 -41.02 -41.02 0.60 0.217 28500 270 2436 -41.02 -41.02 0.60 0.217 28500 270 2436 -41.02 -41.02 0.60 0.217 28500 270 2436 -41.02 -41.02 0.60 0.217 28500 270 2436 -41.02 -41.02 0.60 0.217 28500 270 2436 -41.02 -41.02 0.60 0.217 28500 270 2436 -41.02 -41.02 0.60 0.217 28500 270 2436 -41.02 -41.02 0.60 0.217 28500 270 2436 -41.02 -41.02 0.60 0.217 28500 270 2436 -41.02 -41.02 0.60 0.217 28500 270 2436 -41.02 -41.02 0.60 0.217 28500 270 2436 -41.02 -41.02 0.60 0.217 28500 270 2436 -41.02 -41.02 0.60 0.217 28500 270 2436 -32.47 -32.47 0.60 0.217 28500 270 243
A - 11

1125126127128129130131132133134135136137138139140141142143144145146
Strand StrandTemporary emid,tempt eend,tempt Dia. (in) Ap (in2) Ep (ksi) fpu (ksi) fpy (ksi)
6 -32.47 -32.47 0.60 0.217 28500 270 2436 -32.47 -32.47 0.60 0.217 28500 270 2436 -32.47 -32.47 0.60 0.217 28500 270 2436 -32.47 -32.47 0.60 0.217 28500 270 2436 -32.47 -32.47 0.60 0.217 28500 270 2436 -32.47 -32.47 0.60 0.217 28500 270 2436 -32.47 -32.47 0.60 0.217 28500 270 2436 -41.02 -41.02 0.60 0.217 28500 270 2436 -41.02 -41.02 0.60 0.217 28500 270 2436 -41.02 -41.02 0.60 0.217 28500 270 2436 -41.02 -41.02 0.60 0.217 28500 270 2436 -41.02 -41.02 0.60 0.217 28500 270 2436 -41.02 -41.02 0.60 0.217 28500 270 2436 -41.02 -41.02 0.60 0.217 28500 270 2436 -41.02 -41.02 0.60 0.217 28500 270 2436 -41.02 -41.02 0.60 0.217 28500 270 2436 -41.02 -41.02 0.60 0.217 28500 270 2436 -41.02 -41.02 0.60 0.217 28500 270 2436 -41.02 -41.02 0.60 0.217 28500 270 2436 -41.02 -41.02 0.60 0.217 28500 270 2436 -41.02 -41.02 0.60 0.217 28500 270 2436 -41.02 -41.02 0.60 0.217 28500 270 243
A - 12

123456789
1011121314151617181920212223242526272829303132333435363738394041424344454647484950515253545556575859606162
Concrete Cylinders Design Designtp (days) fpj (ksi) ti (days) Mix γc(kcf) γG(kcf) f'ci (ksi f'c (ksi) ti (days)
0.7 203 0.6 57 0.155 0.160 7.500 8.500 0.50.7 203 0.6 57 0.155 0.160 7.500 8.500 0.50.8 203 0.6 57 0.155 0.160 7.500 8.500 0.60.8 203 0.6 57 0.155 0.160 7.500 8.500 0.63.7 203 3.5 57 0.155 0.160 7.500 8.500 3.50.9 203 0.7 57 0.155 0.160 7.500 8.500 0.70.7 203 0.6 57 0.155 0.160 7.500 8.500 0.52.7 203 2.5 57 0.155 0.160 7.500 8.500 2.50.8 203 0.6 57 0.155 0.160 7.500 8.500 0.60.7 203 0.5 57 0.155 0.160 7.500 8.500 0.50.7 203 0.6 57 0.155 0.160 7.500 8.500 0.50.8 203 0.6 57 0.155 0.160 7.500 8.500 0.62.6 203 2.5 61 0.155 0.160 7.500 8.500 2.40.8 203 0.6 57 0.155 0.160 7.500 8.500 0.60.7 203 0.6 57 0.155 0.160 7.500 8.500 0.50.8 203 0.6 57 0.155 0.160 7.500 8.500 0.60.8 203 0.7 10 0.155 0.160 6.000 7.000 0.60.8 203 0.6 10 0.155 0.160 6.000 7.000 0.60.8 203 0.6 10 0.155 0.160 6.000 7.000 0.62.8 203 2.6 11 0.155 0.160 6.000 7.000 2.50.8 203 0.6 10 0.155 0.160 6.000 7.000 0.62.8 203 2.6 11 0.155 0.160 6.000 7.000 2.50.8 203 0.7 10 0.155 0.160 6.000 7.000 0.60.8 203 0.7 10 0.155 0.160 6.000 7.000 0.60.8 203 0.7 10 0.155 0.160 6.000 7.000 0.60.8 203 0.6 10 0.155 0.160 6.000 7.000 0.62.8 203 2.7 11 0.155 0.160 6.000 7.000 2.60.8 203 0.6 10 0.155 0.160 6.000 7.000 0.60.8 203 0.8 10 0.155 0.160 6.000 7.000 0.70.8 203 0.7 10 0.155 0.160 6.000 7.000 0.62.8 203 2.5 10 0.155 0.160 6.000 7.000 2.50.8 203 0.7 10 0.155 0.160 6.000 7.000 0.70.8 203 0.6 10 0.155 0.160 6.000 7.000 0.60.8 203 0.7 10 0.155 0.160 6.000 7.000 0.60.8 203 0.7 10 0.155 0.160 6.000 7.000 0.62.8 203 2.5 10 0.155 0.160 6.000 7.000 2.50.8 203 0.7 10 0.155 0.160 6.000 7.000 0.60.8 203 0.7 10 0.155 0.160 6.000 7.000 0.62.8 203 2.6 10 0.155 0.160 6.000 7.000 2.50.8 203 0.6 10 0.155 0.160 6.000 7.000 0.60.8 203 0.6 10 0.155 0.160 6.000 7.000 0.60.8 203 0.6 10 0.155 0.160 6.000 7.000 0.60.8 203 0.6 10 0.155 0.160 6.000 7.000 0.62.8 203 2.6 10 0.155 0.160 6.000 7.000 2.60.8 203 0.7 10 0.155 0.160 6.000 7.000 0.60.8 203 0.6 10 0.155 0.160 6.000 7.000 0.60.8 203 0.7 10 0.155 0.160 6.000 7.000 0.60.8 203 0.6 10 0.155 0.160 6.000 7.000 0.62.8 203 2.6 11 0.155 0.160 6.000 7.000 2.60.8 203 0.7 10 0.155 0.160 6.000 7.000 0.60.8 203 0.6 10 0.155 0.160 6.000 7.000 0.60.8 203 0.6 10 0.155 0.160 6.000 7.000 0.62.8 203 2.6 10 0.155 0.160 6.000 7.000 2.50.8 203 0.6 10 0.155 0.160 6.000 7.000 0.60.8 203 0.6 10 0.155 0.160 6.000 7.000 0.60.8 203 0.6 10 0.155 0.160 6.000 7.000 0.60.8 203 0.6 10 0.155 0.160 6.000 7.000 0.62.8 203 2.6 10 0.155 0.160 6.000 7.000 2.50.8 203 0.6 10 0.155 0.160 6.000 7.000 0.60.8 203 0.6 10 0.155 0.160 6.000 7.000 0.60.8 203 0.6 10 0.155 0.160 6.020 7.000 0.60.8 203 0.6 10 0.155 0.160 6.020 7.000 0.6
A - 13

163646566676869707172737475767778798081828384858687888990919293949596979899
100101102103104105106107108109110111112113114115116117118119120121122123124
Concrete Cylinders Design Designtp (days) fpj (ksi) ti (days) Mix γc(kcf) γG(kcf) f'ci (ksi f'c (ksi) ti (days)
0.8 203 0.6 10 0.155 0.160 6.020 7.000 0.62.8 203 2.5 11 0.155 0.160 6.020 7.000 2.50.8 203 0.6 10 0.155 0.160 6.020 7.000 0.60.8 203 0.6 10 0.155 0.160 6.020 7.000 0.60.8 203 0.6 10 0.155 0.160 6.020 7.000 0.60.8 203 0.6 10 0.155 0.160 6.020 7.000 0.62.8 203 2.6 11 0.155 0.160 6.020 7.000 2.50.8 203 0.6 10 0.155 0.160 6.020 7.000 0.60.8 203 0.6 10 0.155 0.160 6.020 7.000 0.50.8 203 0.6 10 0.155 0.160 6.020 7.000 0.62.8 203 2.6 10 0.155 0.160 6.020 7.000 2.50.8 203 0.7 10 0.155 0.160 6.020 7.000 0.70.8 203 0.6 10 0.155 0.160 6.020 7.000 0.60.8 203 0.6 10 0.155 0.160 6.020 7.000 0.60.8 203 0.6 10 0.155 0.160 6.020 7.000 0.62.8 203 2.5 10 0.155 0.160 6.020 7.000 2.50.8 203 0.7 10 0.155 0.160 6.020 7.000 0.60.8 203 0.6 10 0.155 0.160 6.020 7.000 0.60.8 203 0.6 10 0.155 0.160 6.020 7.000 0.60.8 203 0.6 10 0.155 0.160 6.020 7.000 0.61.0 203 0.6 110 0.155 0.160 5.000 8.000 0.61.0 203 0.6 110 0.155 0.160 5.000 8.000 0.63.0 203 2.6 110 0.155 0.160 5.000 8.000 2.61.0 203 0.6 110 0.155 0.160 5.000 8.000 0.60.9 203 0.5 130 0.155 0.160 7.000 8.000 0.50.9 203 0.6 130 0.155 0.160 7.000 8.000 0.60.9 203 0.6 130 0.155 0.160 7.000 8.000 0.50.9 203 0.6 130 0.155 0.160 7.000 8.000 0.51.0 203 0.6 130 0.155 0.160 6.800 8.000 0.61.0 203 0.7 130 0.155 0.160 6.800 8.000 0.60.9 203 0.6 130 0.155 0.160 6.800 8.000 0.63.0 203 2.7 130 0.155 0.160 6.800 8.000 2.60.9 203 0.6 130 0.155 0.160 6.800 8.000 0.62.3 203 1.9 860 0.155 0.160 7.950 10.000 1.91.3 203 1.0 860 0.155 0.160 7.950 10.000 1.04.1 203 3.8 860 0.155 0.160 7.950 10.000 3.82.1 203 1.7 860 0.155 0.160 7.950 10.000 1.73.2 203 2.8 860 0.155 0.160 7.950 10.000 2.81.4 203 1.1 860 0.155 0.160 7.950 10.000 1.01.4 203 1.1 860 0.155 0.160 7.950 10.000 1.12.4 203 2.1 860 0.155 0.160 7.950 10.000 2.00.9 203 0.6 860 0.155 0.160 7.950 10.000 0.53.3 203 3.0 860 0.155 0.160 7.950 10.000 2.91.3 203 1.0 860 0.155 0.160 7.950 10.000 1.01.3 203 0.9 860 0.155 0.160 7.950 10.000 0.91.3 203 1.0 860 0.155 0.160 7.950 10.000 0.91.3 203 1.0 860 0.155 0.160 8.000 10.000 1.01.3 203 1.0 860 0.155 0.160 8.000 10.000 1.01.3 203 1.0 860 0.155 0.160 8.000 10.000 0.91.3 203 1.0 860 0.155 0.160 8.000 10.000 0.92.3 203 1.9 860 0.155 0.160 8.000 10.000 1.93.0 203 2.7 860 0.155 0.160 8.000 10.000 2.71.2 203 0.9 860 0.155 0.160 8.000 10.000 0.91.3 203 0.9 860 0.155 0.160 8.000 10.000 0.91.4 203 1.0 860 0.155 0.160 8.000 10.000 1.03.2 203 2.9 860 0.155 0.160 8.000 10.000 2.91.3 203 1.0 860 0.155 0.160 8.000 10.000 1.01.4 203 1.0 860 0.155 0.160 8.000 10.000 1.01.3 203 0.9 860 0.155 0.160 8.050 10.000 0.94.4 203 4.1 860 0.155 0.160 8.050 10.000 4.01.3 203 0.9 860 0.155 0.160 8.050 10.000 0.94.0 203 3.5 130 0.155 0.160 7.000 8.000 3.5
A - 14

1125126127128129130131132133134135136137138139140141142143144145146
Concrete Cylinders Design Designtp (days) fpj (ksi) ti (days) Mix γc(kcf) γG(kcf) f'ci (ksi f'c (ksi) ti (days)
1.0 203 0.6 130 0.155 0.160 7.000 8.000 0.62.9 203 2.6 130 0.155 0.160 7.000 8.000 2.60.9 203 0.6 130 0.155 0.160 7.000 8.000 0.61.3 203 0.5 190 0.155 0.160 7.500 8.500 0.51.0 203 0.6 140 0.155 0.160 7.500 8.500 0.61.5 203 0.9 130 0.155 0.160 7.500 8.500 0.91.8 203 1.5 140 0.155 0.160 7.500 8.500 1.51.3 203 1.0 345860 0.155 0.160 7.700 9.000 0.91.2 203 0.8 345860 0.155 0.160 7.700 9.000 0.81.1 203 0.8 345860 0.155 0.160 7.700 9.000 0.73.1 203 2.7 345860 0.155 0.160 7.700 9.000 2.71.2 203 0.9 345860 0.155 0.160 7.700 9.000 0.81.2 203 0.9 345860 0.155 0.160 7.700 9.000 0.91.1 203 0.8 345860 0.155 0.160 7.700 9.000 0.81.2 203 0.8 345860 0.155 0.160 7.800 9.000 0.83.5 203 3.1 345860 0.155 0.160 7.800 9.000 3.11.2 203 0.9 345860 0.155 0.160 7.800 9.000 0.91.1 203 0.8 345860 0.155 0.160 7.800 9.000 0.81.2 203 0.9 345860 0.155 0.160 7.800 9.000 0.91.1 203 0.8 345860 0.155 0.160 7.800 9.000 0.73.0 203 2.6 345860 0.155 0.160 7.800 9.000 2.61.3 203 0.9 345860 0.155 0.160 7.800 9.000 0.9
A - 15

123456789
1011121314151617181920212223242526272829303132333435363738394041424344454647484950515253545556575859606162
Measured CamberMaturity(%) fci (ksi) t2 (days) fc2 (ksi) t3 (days) fc3 (ksi) ti (days) Δi (in) t2 (days) Δ2 (in)
1529.1 9.050 7 11.270 28 12.580 0.6 2.52 156 3.721462.3 8.515 7 10.835 28 12.310 0.6 3.36 155 4.561679.1 8.915 7 10.640 28 12.405 0.7 2.76 154 3.721628.2 8.800 7 10.355 28 11.920 0.7 2.88 153 3.847302.0 10.395 7 10.855 28 12.930 3.5 2.28 152 3.241759.2 8.665 0 0.000 28 11.650 0.8 2.16 148 3.241567.5 7.755 7 9.420 28 10.995 0.6 2.88 146 3.728779.4 9.060 7 9.085 28 10.935 2.5 1.92 145 3.121628.9 8.515 7 9.930 28 11.720 0.7 2.76 142 3.481367.2 7.975 7 9.800 28 11.380 0.6 2.76 141 4.201492.5 8.000 7 9.565 28 11.430 0.6 3.00 140 3.961757.5 8.635 7 9.630 28 11.220 0.7 2.76 139 3.728728.6 8.765 7 8.820 28 9.945 2.5 2.16 138 3.241719.5 8.355 7 10.280 28 11.185 0.7 2.76 135 3.721469.4 7.670 7 10.015 28 11.325 0.6 3.12 134 3.961759.2 8.055 7 9.720 28 11.380 0.7 2.76 133 3.601928.0 7.445 0 0.000 28 10.860 0.7 0.12 115 0.241806.0 7.145 0 0.000 28 11.050 0.7 0.12 114 0.241792.0 6.765 0 0.000 28 10.760 0.7 0.12 113 0.487221.0 8.590 0 0.000 28 10.390 2.6 0.12 112 0.361659.0 6.475 0 0.000 28 10.470 0.7 0.24 109 0.367364.0 7.195 0 0.000 28 10.050 2.6 0.12 367 0.242057.0 6.840 0 0.000 28 10.656 0.7 0.12 364 0.602055.0 6.885 0 0.000 28 10.520 0.7 0.48 363 0.482022.0 6.160 0 0.000 28 10.235 0.7 0.12 362 0.362025.0 6.695 0 0.000 28 10.915 0.7 0.24 361 0.367528.0 7.275 0 0.000 28 9.985 2.7 0.12 360 0.481808.0 6.770 0 0.000 28 11.435 0.7 0.36 108 0.602041.0 6.085 0 0.000 28 9.430 0.8 0.36 107 0.841604.0 6.145 0 0.000 28 9.340 0.7 0.48 106 0.967144.0 7.550 0 0.000 28 9.410 2.6 0.36 105 0.962055.0 6.230 0 0.000 28 8.970 0.8 0.48 102 0.841816.0 6.785 0 0.000 28 10.790 0.7 0.36 427 0.481985.0 7.480 0 0.000 28 11.530 0.7 0.36 426 0.961884.0 6.445 0 0.000 28 10.070 0.7 0.24 425 1.087142.0 8.455 0 0.000 28 10.575 2.6 0.24 424 0.841938.0 7.220 0 0.000 28 10.830 0.7 0.48 421 0.841639.0 6.320 0 0.000 28 10.035 0.7 0.36 420 0.847292.0 7.980 0 0.000 28 10.195 2.6 0.84 417 1.561959.0 6.675 0 0.000 28 10.535 0.7 0.84 414 1.681964.0 6.685 0 0.000 28 10.525 0.7 0.84 413 2.041810.0 6.890 0 0.000 28 10.040 0.6 1.08 86 1.561927.0 6.820 0 0.000 28 11.005 0.7 0.84 85 1.927431.0 8.265 0 0.000 28 10.570 2.7 0.84 84 1.322018.0 7.145 0 0.000 28 11.175 0.7 0.84 407 1.681785.0 6.125 0 0.000 28 10.235 0.6 0.48 406 1.921939.0 6.710 0 0.000 28 10.610 0.7 0.96 79 1.561930.0 6.500 0 0.000 28 10.370 0.7 1.08 78 1.807367.0 7.150 0 0.000 28 9.105 2.6 0.96 403 1.801848.0 6.610 0 0.000 28 10.765 0.7 1.92 399 3.241978.0 6.425 0 0.000 28 10.365 0.7 2.04 72 3.241965.0 6.405 0 0.000 28 10.275 0.7 1.92 71 3.007324.0 8.065 0 0.000 28 10.290 2.6 1.68 396 2.762006.0 6.515 0 0.000 28 10.510 0.7 2.16 67 3.001989.0 7.035 0 0.000 28 10.425 0.7 1.92 66 3.121906.0 6.395 0 0.000 28 10.580 0.7 2.16 390 3.961982.0 6.485 0 0.000 28 10.320 0.7 2.04 389 4.207269.0 7.770 0 0.000 28 10.540 2.6 1.80 388 3.241980.0 6.600 0 0.000 28 10.525 0.7 1.80 385 3.842021.0 6.630 0 0.000 28 10.660 0.7 1.80 59 3.241862.0 6.570 0 0.000 28 10.455 0.6 2.28 129 3.722003.0 6.665 0 0.000 28 10.530 0.7 2.40 128 3.60
A - 16

163646566676869707172737475767778798081828384858687888990919293949596979899
100101102103104105106107108109110111112113114115116117118119120121122123124
Measured CamberMaturity(%) fci (ksi) t2 (days) fc2 (ksi) t3 (days) fc3 (ksi) ti (days) Δi (in) t2 (days) Δ2 (in)
1930.0 7.900 0 0.000 28 11.260 0.7 2.28 127 3.367256.0 8.435 0 0.000 28 10.555 2.6 2.04 126 3.121969.0 7.045 0 0.000 28 11.260 0.7 2.16 123 3.361878.0 7.345 0 0.000 28 10.955 0.7 2.16 122 3.481979.0 7.345 0 0.000 28 10.910 0.7 1.80 121 3.842010.0 7.295 0 0.000 28 10.935 0.7 1.92 120 3.247353.0 8.200 0 0.000 28 10.290 2.6 2.04 119 2.642028.0 7.025 0 0.000 28 10.995 0.7 2.16 116 3.361733.0 6.590 0 0.000 28 10.240 0.6 2.76 384 4.201856.0 6.515 0 0.000 28 10.405 0.7 2.76 383 4.567344.0 7.865 0 0.000 28 10.130 2.6 2.04 382 3.361928.0 6.445 0 0.000 28 10.360 0.8 2.40 379 4.201982.0 6.295 0 0.000 28 10.405 0.7 2.52 378 4.321959.0 6.555 0 0.000 28 9.965 0.7 2.40 377 4.201963.0 6.430 0 0.000 28 10.665 0.7 2.64 376 4.447285.0 8.020 0 0.000 28 10.720 2.6 2.04 375 3.242031.0 7.015 0 0.000 28 11.025 0.7 2.40 372 3.841984.0 6.830 0 0.000 28 10.580 0.7 2.16 371 4.081899.0 6.820 0 0.000 28 11.060 0.7 2.40 370 4.081978.0 6.445 0 0.000 28 10.760 0.7 2.64 369 4.081706.7 5.440 14 7.510 28 8.325 0.7 0.75 58 1.001754.3 6.835 14 8.185 28 9.415 0.7 0.69 57 1.007165.7 9.190 14 9.385 28 9.725 2.7 0.75 56 1.001708.6 7.765 14 9.950 28 10.220 0.7 0.75 58 1.001617.8 8.755 14 10.540 28 10.980 0.6 1.50 60 1.631658.3 8.170 14 10.090 28 11.180 0.7 1.25 59 1.631631.9 8.070 14 9.860 28 10.760 0.6 1.00 58 1.501628.0 7.975 14 10.105 28 11.015 0.6 1.38 57 1.811608.2 7.445 14 9.410 28 10.475 0.7 1.50 60 1.631759.2 8.225 14 9.555 28 10.470 0.7 1.19 56 1.501659.7 7.070 0 0.000 28 10.185 0.6 1.50 59 1.506469.3 9.275 14 9.705 28 9.660 2.7 1.13 57 1.311613.4 7.885 14 10.000 28 10.775 0.6 1.38 60 1.75
0.0 8.422 0 0.000 28 10.666 2.0 3.12 32 4.000.0 8.233 0 0.000 28 10.433 1.0 3.44 29 4.120.0 8.233 0 0.000 28 10.854 3.8 3.88 83 4.670.0 9.498 0 0.000 28 11.797 1.8 3.82 38 4.370.0 8.680 0 0.000 28 10.535 2.9 3.31 25 3.870.0 8.010 0 0.000 28 11.806 1.1 3.12 23 4.000.0 8.015 0 0.000 28 10.113 1.2 4.07 21 4.500.0 8.726 0 0.000 28 11.135 2.1 3.94 27 4.250.0 8.097 0 0.000 28 11.313 0.6 3.63 23 4.120.0 8.596 0 0.000 28 10.999 3.0 3.44 19 3.930.0 8.423 0 0.000 28 11.209 1.0 3.38 15 3.780.0 8.350 0 0.000 28 10.830 1.0 3.38 13 3.720.0 8.357 0 0.000 28 11.100 1.0 2.75 8 3.510.0 8.458 0 0.000 28 10.759 1.0 3.50 28 4.120.0 8.158 0 0.000 28 11.096 1.0 3.00 23 3.750.0 7.998 0 0.000 28 10.181 1.0 3.12 22 3.870.0 8.725 0 0.000 28 10.308 1.0 3.50 20 4.120.0 9.380 0 0.000 28 10.162 2.0 3.38 18 4.000.0 8.784 0 0.000 28 10.240 2.8 3.56 12 4.250.0 8.205 0 0.000 28 11.730 0.9 3.62 43 3.930.0 7.900 0 0.000 28 11.510 1.0 3.65 41 4.120.0 7.938 0 0.000 28 11.148 1.1 3.56 36 4.180.0 10.340 0 0.000 28 12.334 2.9 3.25 33 3.680.0 7.965 0 0.000 28 10.445 1.0 3.12 29 3.760.0 8.192 0 0.000 28 10.133 1.1 3.63 22 4.360.0 8.275 0 0.000 28 10.505 1.0 3.25 57 3.750.0 8.120 0 0.000 28 11.271 4.1 3.69 55 4.120.0 8.322 0 0.000 28 10.549 1.0 4.38 50 4.50
7156.7 9.090 14 10.370 28 10.650 3.6 1.13 56 1.87
A - 17

1125126127128129130131132133134135136137138139140141142143144145146
Measured CamberMaturity(%) fci (ksi) t2 (days) fc2 (ksi) t3 (days) fc3 (ksi) ti (days) Δi (in) t2 (days) Δ2 (in)
1780.6 7.520 14 9.450 28 9.849 0.7 1.68 57 2.157063.2 8.295 14 9.295 28 9.825 2.7 1.04 49 1.571625.5 8.645 14 10.110 28 10.810 0.7 1.58 46 2.221531.5 8.540 14 10.605 28 11.310 0.6 1.78 50 2.151795.4 7.610 14 9.025 28 9.795 0.7 1.92 58 2.512628.8 8.855 14 9.260 28 10.250 1.0 2.36 60 2.952470.3 8.615 14 8.350 28 9.875 1.6 1.80 52 2.56
0.0 8.328 0 0.000 28 11.170 1.0 3.62 147 5.000.0 8.049 0 0.000 28 10.654 0.9 3.50 145 5.500.0 8.496 0 0.000 28 11.045 0.8 3.50 141 4.620.0 9.425 0 0.000 28 11.102 2.8 3.50 137 4.250.0 8.235 0 0.000 28 10.365 0.9 3.37 133 4.750.0 8.551 0 0.000 28 10.617 0.9 3.25 131 5.250.0 8.120 0 0.000 28 11.167 0.9 3.50 127 4.750.0 7.912 0 0.000 28 11.538 0.9 3.75 125 5.250.0 8.962 0 0.000 28 11.684 3.2 3.57 123 4.320.0 7.961 0 0.000 28 9.880 0.9 3.62 119 5.120.0 8.168 0 0.000 28 10.178 0.9 3.32 117 4.370.0 8.145 0 0.000 28 10.644 0.9 3.26 113 4.370.0 7.930 0 0.000 28 11.661 0.8 3.50 111 4.870.0 9.167 0 0.000 28 10.054 2.7 3.75 109 4.250.0 8.101 0 0.000 28 9.886 1.0 3.75 105 5.12
A - 18

123456789
1011121314151617181920212223242526272829303132333435363738394041424344454647484950515253545556575859606162
tConc (days) tShr (days) t2 (days) t3 (days) t4 (days) t5 (days) t6 (days) DL (klf)0.208 0.208 0.7 163.0 164.0 0.0 600.0 0.0000.208 0.208 0.7 162.0 163.0 0.0 600.0 0.0000.208 0.208 0.7 161.0 162.0 0.0 600.0 0.0000.208 0.208 0.7 160.0 161.0 0.0 600.0 0.0000.208 0.208 3.6 159.0 160.0 0.0 600.0 0.0000.208 0.208 0.8 155.0 156.0 0.0 600.0 0.0000.208 0.208 0.7 153.0 154.0 0.0 600.0 0.0000.208 0.208 2.6 152.0 153.0 0.0 600.0 0.0000.208 0.208 0.7 149.0 150.0 0.0 600.0 0.0000.208 0.208 0.6 148.0 149.0 0.0 600.0 0.0000.208 0.208 0.6 147.0 148.0 0.0 600.0 0.0000.208 0.208 0.7 146.0 147.0 0.0 600.0 0.0000.208 0.208 2.5 145.0 146.0 0.0 600.0 0.0000.208 0.208 0.7 142.0 143.0 0.0 600.0 0.0000.208 0.208 0.6 141.0 142.0 0.0 600.0 0.0000.208 0.208 0.7 140.0 141.0 0.0 600.0 0.0000.208 0.208 0.7 122.0 123.0 0.0 600.0 0.0000.208 0.208 0.7 121.0 122.0 0.0 600.0 0.0000.208 0.208 0.7 120.0 121.0 0.0 600.0 0.0000.208 0.208 2.6 119.0 120.0 0.0 600.0 0.0000.208 0.208 0.7 116.0 117.0 0.0 600.0 0.0000.208 0.208 2.6 374.0 375.0 0.0 600.0 0.0000.208 0.208 0.7 371.0 372.0 0.0 600.0 0.0000.208 0.208 0.7 370.0 371.0 0.0 600.0 0.0000.208 0.208 0.7 369.0 370.0 0.0 600.0 0.0000.208 0.208 0.7 368.0 369.0 0.0 600.0 0.0000.208 0.208 2.7 367.0 368.0 0.0 600.0 0.0000.208 0.208 0.7 115.0 116.0 0.0 600.0 0.0000.208 0.208 0.8 114.0 115.0 0.0 600.0 0.0000.208 0.208 0.8 113.0 114.0 0.0 600.0 0.0000.208 0.208 2.6 112.0 113.0 0.0 600.0 0.0000.208 0.208 0.8 109.0 110.0 0.0 600.0 0.0000.208 0.208 0.7 434.0 435.0 0.0 600.0 0.0000.208 0.208 0.7 433.0 434.0 0.0 600.0 0.0000.208 0.208 0.7 432.0 433.0 0.0 600.0 0.0000.208 0.208 2.6 431.0 432.0 0.0 600.0 0.0000.208 0.208 0.7 428.0 429.0 0.0 600.0 0.0000.208 0.208 0.7 427.0 428.0 0.0 600.0 0.0000.208 0.208 2.6 424.0 425.0 0.0 600.0 0.0000.208 0.208 0.7 421.0 422.0 0.0 600.0 0.0000.208 0.208 0.7 420.0 421.0 0.0 600.0 0.0000.208 0.208 0.7 93.0 94.0 0.0 600.0 0.0000.208 0.208 0.7 92.0 93.0 0.0 600.0 0.0000.208 0.208 2.7 91.0 92.0 0.0 600.0 0.0000.208 0.208 0.7 414.0 415.0 0.0 600.0 0.0000.208 0.208 0.7 413.0 414.0 0.0 600.0 0.0000.208 0.208 0.7 86.0 87.0 0.0 600.0 0.0000.208 0.208 0.7 85.0 86.0 0.0 600.0 0.0000.208 0.208 2.7 410.0 411.0 0.0 600.0 0.0000.208 0.208 0.7 406.0 407.0 0.0 600.0 0.0000.208 0.208 0.7 79.0 80.0 0.0 600.0 0.0000.208 0.208 0.7 78.0 79.0 0.0 600.0 0.0000.208 0.208 2.7 403.0 404.0 0.0 600.0 0.0000.208 0.208 0.7 74.0 75.0 0.0 600.0 0.0000.208 0.208 0.7 73.0 74.0 0.0 600.0 0.0000.208 0.208 0.7 397.0 398.0 0.0 600.0 0.0000.208 0.208 0.7 396.0 397.0 0.0 600.0 0.0000.208 0.208 2.6 395.0 396.0 0.0 600.0 0.0000.208 0.208 0.7 392.0 393.0 0.0 600.0 0.0000.208 0.208 0.7 66.0 67.0 0.0 600.0 0.0000.208 0.208 0.7 136.0 137.0 0.0 600.0 0.0000.208 0.208 0.7 135.0 136.0 0.0 600.0 0.000
A - 19

163646566676869707172737475767778798081828384858687888990919293949596979899
100101102103104105106107108109110111112113114115116117118119120121122123124
tConc (days) tShr (days) t2 (days) t3 (days) t4 (days) t5 (days) t6 (days) DL (klf)0.208 0.208 0.7 134.0 135.0 0.0 600.0 0.0000.208 0.208 2.6 133.0 134.0 0.0 600.0 0.0000.208 0.208 0.7 130.0 131.0 0.0 600.0 0.0000.208 0.208 0.7 129.0 130.0 0.0 600.0 0.0000.208 0.208 0.7 128.0 129.0 0.0 600.0 0.0000.208 0.208 0.7 127.0 128.0 0.0 600.0 0.0000.208 0.208 2.6 126.0 127.0 0.0 600.0 0.0000.208 0.208 0.7 123.0 124.0 0.0 600.0 0.0000.208 0.208 0.7 391.0 392.0 0.0 600.0 0.0000.208 0.208 0.7 390.0 391.0 0.0 600.0 0.0000.208 0.208 2.7 389.0 390.0 0.0 600.0 0.0000.208 0.208 0.8 386.0 387.0 0.0 600.0 0.0000.208 0.208 0.7 385.0 386.0 0.0 600.0 0.0000.208 0.208 0.7 384.0 385.0 0.0 600.0 0.0000.208 0.208 0.7 383.0 384.0 0.0 600.0 0.0000.208 0.208 2.6 382.0 383.0 0.0 600.0 0.0000.208 0.208 0.7 379.0 380.0 0.0 600.0 0.0000.208 0.208 0.7 378.0 379.0 0.0 600.0 0.0000.208 0.208 0.7 377.0 378.0 0.0 600.0 0.0000.208 0.208 0.7 376.0 377.0 0.0 600.0 0.0000.208 0.208 0.7 65.0 66.0 67.0 600.0 0.0000.208 0.208 0.7 64.0 65.0 66.0 600.0 0.0000.208 0.208 2.7 63.0 64.0 65.0 600.0 0.0000.208 0.208 0.7 65.0 66.0 67.0 600.0 0.0000.208 0.208 0.6 67.0 68.0 69.0 600.0 0.0000.208 0.208 0.7 66.0 67.0 68.0 600.0 0.0000.208 0.208 0.7 65.0 66.0 67.0 600.0 0.0000.208 0.208 0.7 64.0 65.0 66.0 600.0 0.0000.208 0.208 0.7 67.0 68.0 69.0 600.0 0.0000.208 0.208 0.7 63.0 64.0 65.0 600.0 0.0000.208 0.208 0.7 66.0 67.0 68.0 600.0 0.0000.208 0.208 2.7 64.0 65.0 66.0 600.0 0.0000.208 0.208 0.7 67.0 68.0 69.0 600.0 0.0000.208 0.208 2.0 40.0 41.0 42.0 600.0 0.0000.208 0.208 1.1 40.0 41.0 42.0 600.0 0.0000.208 0.208 3.9 90.2 91.2 92.2 600.0 0.0000.208 0.208 1.8 40.0 41.0 42.0 600.0 0.0000.208 0.208 2.9 40.0 41.0 42.0 600.0 0.0000.208 0.208 1.1 40.0 41.0 42.0 600.0 0.0000.208 0.208 1.2 40.0 41.0 42.0 600.0 0.0000.208 0.208 2.2 40.0 41.0 42.0 600.0 0.0000.208 0.208 0.6 40.0 41.0 42.0 600.0 0.0000.208 0.208 3.0 40.0 41.0 42.0 600.0 0.0000.208 0.208 1.1 40.0 41.0 42.0 600.0 0.0000.208 0.208 1.0 40.0 41.0 42.0 600.0 0.0000.208 0.208 1.1 40.0 41.0 42.0 600.0 0.0000.208 0.208 1.1 40.0 41.0 42.0 600.0 0.0000.208 0.208 1.1 40.0 41.0 42.0 600.0 0.0000.208 0.208 1.1 40.0 41.0 42.0 600.0 0.0000.208 0.208 1.1 40.0 41.0 42.0 600.0 0.0000.208 0.208 2.0 40.0 41.0 42.0 600.0 0.0000.208 0.208 2.8 40.0 41.0 42.0 600.0 0.0000.208 0.208 1.0 50.0 51.0 52.0 600.0 0.0000.208 0.208 1.0 48.0 49.0 50.0 600.0 0.0000.208 0.208 1.1 40.0 41.0 42.0 600.0 0.0000.208 0.208 3.0 40.0 41.0 42.0 600.0 0.0000.208 0.208 1.1 40.0 41.0 42.0 600.0 0.0000.208 0.208 1.1 40.0 41.0 42.0 600.0 0.0000.208 0.208 1.0 64.0 65.0 66.0 600.0 0.0000.208 0.208 4.2 62.0 63.0 64.0 600.0 0.0000.208 0.208 1.0 57.0 58.0 59.0 600.0 0.0000.208 0.208 3.6 62.8 63.8 64.8 600.0 0.000
A - 20

1125126127128129130131132133134135136137138139140141142143144145146
tConc (days) tShr (days) t2 (days) t3 (days) t4 (days) t5 (days) t6 (days) DL (klf)0.208 0.208 0.7 63.8 64.8 65.8 600.0 0.0000.208 0.208 2.7 55.9 56.9 57.9 600.0 0.0000.208 0.208 0.7 52.8 53.8 54.8 600.0 0.0000.208 0.208 0.6 56.8 57.8 58.8 600.0 0.0000.208 0.208 0.7 64.8 65.8 66.8 600.0 0.0000.208 0.208 1.0 66.8 67.8 68.8 600.0 0.0000.208 0.208 1.6 58.8 59.8 60.8 600.0 0.0000.208 0.208 1.0 154.0 155.0 156.0 600.0 0.0000.208 0.208 0.9 152.0 153.0 154.0 600.0 0.0000.208 0.208 0.9 148.0 149.0 150.0 600.0 0.0000.208 0.208 2.8 144.0 145.0 146.0 600.0 0.0000.208 0.208 1.0 140.0 141.0 142.0 600.0 0.0000.208 0.208 1.0 138.0 139.0 140.0 600.0 0.0000.208 0.208 0.9 134.0 135.0 136.0 600.0 0.0000.208 0.208 0.9 132.0 133.0 134.0 600.0 0.0000.208 0.208 3.2 130.0 131.0 132.0 600.0 0.0000.208 0.208 1.0 126.0 127.0 128.0 600.0 0.0000.208 0.208 0.9 124.0 125.0 126.0 600.0 0.0000.208 0.208 1.0 120.0 121.0 122.0 600.0 0.0000.208 0.208 0.9 118.0 119.0 120.0 600.0 0.0000.208 0.208 2.7 116.0 117.0 118.0 600.0 0.0000.208 0.208 1.0 112.0 113.0 114.0 600.0 0.000
A - 21

123456789
1011121314151617181920212223242526272829303132333435363738394041424344454647484950515253545556575859606162
Comments00000000000000000000000000000000000000000000000000000000000000
A - 22

163646566676869707172737475767778798081828384858687888990919293949596979899
100101102103104105106107108109110111112113114115116117118119120121122123124
Comments00000000000000000000000000000000000000000000000Shipping Cylinder strengths only provided. Do not know when shipping was. Assumed 28 daysShipping Cylinder strengths only provided. Do not know when shipping was. Assumed 28 daysShipping Cylinder strengths only provided. Do not know when shipping was. Assumed 28 daysShipping Cylinder strengths only provided. Do not know when shipping was. Assumed 28 days00000000000
A - 23

1125126127128129130131132133134135136137138139140141142143144145146
Comments0000000000000000000000
A - 24

APPENDIX B
SNAKE LAKE CAMBER MEASUREMENTS

Cast Date = 8/29/05 2:30 PM G4ARelease Date = 8/30/05 11:00 AM
North Face (in.) (in.) (in.) (days) (in.) (in.) 1.077Date Time East Elev West Elev Midspan Age E-W Ave Camber *Camber
8/30/05 #N/A 0.000 #N/A #N/A8/31/05 8:00 AM 35 1/4 33 3/4 32 1/2 1.7 34.500 2.000 2.1549/1/05 5:11 AM 30 3/4 29 1/4 27 3/4 2.6 30.000 2.250 2.4239/2/05 7:10 AM 34 3/16 32 7/16 31 1/16 3.7 33.313 2.250 2.4239/3/05 8:00 AM 28 9/16 27 1/8 25 5/16 4.7 27.844 2.531 2.7269/4/05 7:20 AM 29 1/8 27 1/2 26 1/8 5.7 28.313 2.188 2.3569/5/05 7:05 AM 30 7/8 29 1/4 27 13/16 6.7 30.063 2.250 2.4239/6/05 6:00 AM 21 13/16 19 7/8 18 3/8 7.6 20.844 2.469 2.6599/7/05 6:05 AM 32 30 5/8 28 15/16 8.6 31.313 2.375 2.5589/8/05 5:35 AM 34 3/8 32 11/16 31 5/16 9.6 33.531 2.219 2.3909/9/05 6:15 AM 34 5/16 32 9/16 31 1/8 10.7 33.438 2.313 2.4919/10/05 8:30 AM 24 29/32 23 15/32 21 13/16 11.8 24.188 2.375 2.5589/12/05 6:15 AM 34 13/16 33 5/16 31 11/16 13.7 34.063 2.375 2.5589/13/05 6:00 AM 30 11/16 29 1/4 27 1/2 14.6 29.969 2.469 2.6599/14/05 7:40 AM 24 13/16 23 1/8 22 1/16 15.7 23.969 2.469 2.6599/15/05 8:00 AM 27 25 5/16 23 11/16 16.7 26.156 2.469 2.6599/16/05 9:21 AM 22 3/16 20 3/8 18 13/16 17.8 21.281 2.469 2.6599/18/05 7:12 AM 27 15/16 26 1/2 24 3/4 19.7 27.219 2.469 2.6599/19/05 8:31 AM 24 1/8 22 7/16 20 13/16 20.8 23.281 2.469 2.6599/29/05 7:10 AM 34 3/8 32 7/16 30 7/8 30.7 33.406 2.531 2.726
10/11/05 9:15 AM 19 9/16 17 13/16 16 42.8 18.688 2.688 2.89410/28/05 10:17 AM 29 7/16 27 11/16 25 7/8 59.8 28.563 2.688 2.894South Face (in.) (in.) (in.) (days) (in.) (in.)
Date Time East Elev West Elev Midspan Age E-W Ave Camber *Camber8/30/05 12:00 PM 26 5/16 25 1/16 23 1/2 0.9 25.688 2.188 2.3568/31/05 8:15 AM 31 3/4 30 1/2 29 1.7 31.125 2.125 2.2899/1/05 5:11 AM 30 3/8 29 1/8 27 3/8 2.6 29.750 2.375 2.5589/2/05 7:05 AM 33 3/4 31 15/16 30 3/8 3.7 32.844 2.469 2.6599/3/05 8:00 AM 20 9/32 19 1/16 17 3/8 4.7 19.672 2.297 2.4749/4/05 7:10 AM 30 11/16 29 3/8 27 3/4 5.7 30.031 2.281 2.4579/5/05 7:00 AM 31 11/16 30 1/4 28 5/8 6.7 30.969 2.344 2.5249/6/05 5:38 AM 20 7/8 19 1/4 17 7/8 7.6 20.063 2.188 2.3569/7/05 6:00 AM 32 1/2 31 29 9/16 8.6 31.750 2.188 2.3569/8/05 5:27 AM 34 3/16 32 3/4 31 3/16 9.6 33.469 2.281 2.4579/9/05 6:10 AM 35 5/16 33 7/8 32 3/16 10.7 34.594 2.406 2.5929/10/05 8:30 AM 24 11/16 23 1/2 21 11/16 11.8 24.094 2.406 2.5929/12/05 5:15 AM 29 5/8 28 5/16 26 7/16 13.6 28.969 2.531 2.7269/13/05 5:50 AM 32 1/16 30 3/4 28 15/16 14.6 31.406 2.469 2.6599/14/05 7:30 AM 24 1/8 23 21 1/8 15.7 23.563 2.438 2.6259/15/05 8:00 AM 28 9/16 27 25 5/16 16.7 27.781 2.469 2.6599/16/05 9:11 AM 23 21 9/16 19 3/4 17.8 22.281 2.531 2.7269/18/05 7:08 AM 27 1/2 26 3/16 24 5/16 19.7 26.844 2.531 2.7269/19/05 8:26 AM 22 13/16 21 5/16 19 9/16 20.7 22.063 2.500 2.6939/29/05 7:07 AM 34 1/8 32 13/16 30 15/16 30.7 33.469 2.531 2.726
10/11/05 9:18 AM 18 1/2 16 7/8 15 42.8 17.688 2.688 2.89410/28/05 10:13 AM 29 11/16 28 1/8 26 1/8 59.8 28.906 2.781 2.995CTC Camber Measurements Initial Camber (in.) = 2.356
(ft) (in.) (days) Age at Release (days) = 0.9Date Time Camber Camber Age Ultimate Camber (in.) = 2.945
8/30/05 11:13 AM 0.18 2.16 0.9 Creep Camber (in.) = 0.588Creep Coef. = 0.25
B - 1

G4A Cast 8/29/05
0.00
0.50
1.00
1.50
2.00
2.50
3.00
3.50
0.0 10.0 20.0 30.0 40.0 50.0 60.0Days After Casting
Def
lect
ion
(in)
North Face
South Face
CTC
N-S Average
Adjusted 9/13 South Face from 31 3/4 to 30 3/4.
For the camber on 9/14 north face, took the average of the previous and next day due to a measuring error.
Camber mesurements were taken at the support locations. Multiplied camber by 1.077 to reflect total camber relative to ends of girder.
B - 2
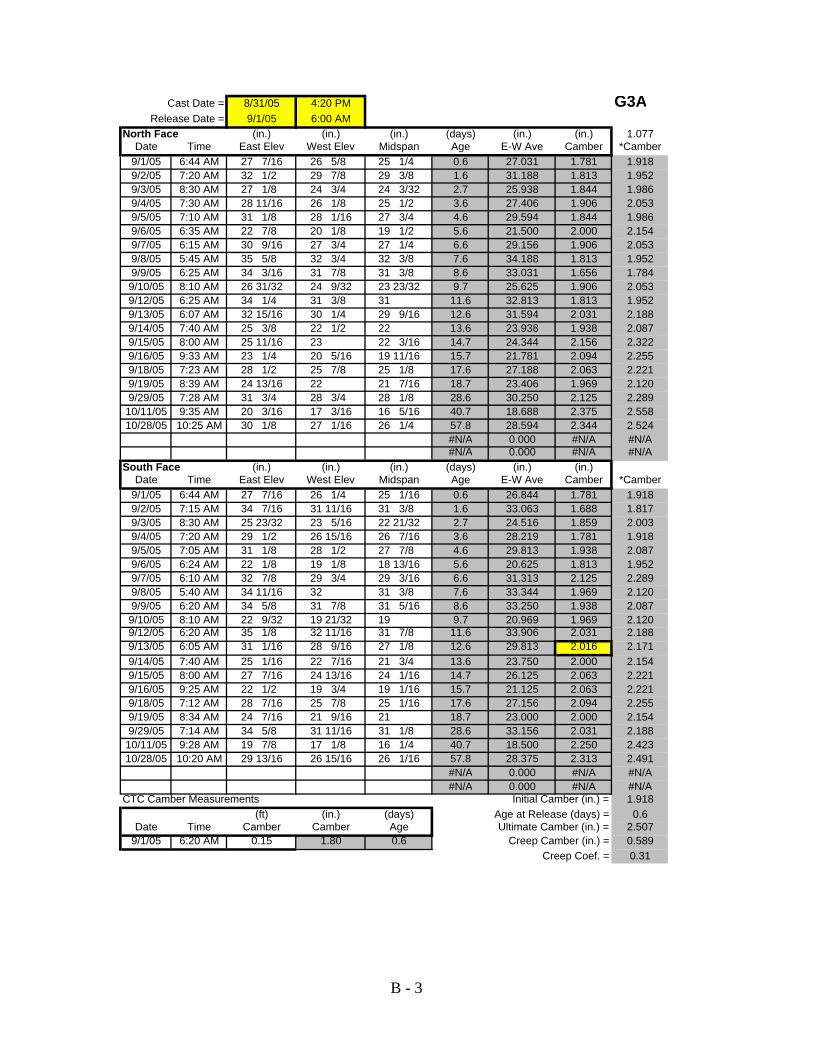
Cast Date = 8/31/05 4:20 PM G3ARelease Date = 9/1/05 6:00 AM
North Face (in.) (in.) (in.) (days) (in.) (in.) 1.077Date Time East Elev West Elev Midspan Age E-W Ave Camber *Camber
9/1/05 6:44 AM 27 7/16 26 5/8 25 1/4 0.6 27.031 1.781 1.9189/2/05 7:20 AM 32 1/2 29 7/8 29 3/8 1.6 31.188 1.813 1.9529/3/05 8:30 AM 27 1/8 24 3/4 24 3/32 2.7 25.938 1.844 1.9869/4/05 7:30 AM 28 11/16 26 1/8 25 1/2 3.6 27.406 1.906 2.0539/5/05 7:10 AM 31 1/8 28 1/16 27 3/4 4.6 29.594 1.844 1.9869/6/05 6:35 AM 22 7/8 20 1/8 19 1/2 5.6 21.500 2.000 2.1549/7/05 6:15 AM 30 9/16 27 3/4 27 1/4 6.6 29.156 1.906 2.0539/8/05 5:45 AM 35 5/8 32 3/4 32 3/8 7.6 34.188 1.813 1.9529/9/05 6:25 AM 34 3/16 31 7/8 31 3/8 8.6 33.031 1.656 1.7849/10/05 8:10 AM 26 31/32 24 9/32 23 23/32 9.7 25.625 1.906 2.0539/12/05 6:25 AM 34 1/4 31 3/8 31 11.6 32.813 1.813 1.9529/13/05 6:07 AM 32 15/16 30 1/4 29 9/16 12.6 31.594 2.031 2.1889/14/05 7:40 AM 25 3/8 22 1/2 22 13.6 23.938 1.938 2.0879/15/05 8:00 AM 25 11/16 23 22 3/16 14.7 24.344 2.156 2.3229/16/05 9:33 AM 23 1/4 20 5/16 19 11/16 15.7 21.781 2.094 2.2559/18/05 7:23 AM 28 1/2 25 7/8 25 1/8 17.6 27.188 2.063 2.2219/19/05 8:39 AM 24 13/16 22 21 7/16 18.7 23.406 1.969 2.1209/29/05 7:28 AM 31 3/4 28 3/4 28 1/8 28.6 30.250 2.125 2.289
10/11/05 9:35 AM 20 3/16 17 3/16 16 5/16 40.7 18.688 2.375 2.55810/28/05 10:25 AM 30 1/8 27 1/16 26 1/4 57.8 28.594 2.344 2.524
#N/A 0.000 #N/A #N/A#N/A 0.000 #N/A #N/A
South Face (in.) (in.) (in.) (days) (in.) (in.)Date Time East Elev West Elev Midspan Age E-W Ave Camber *Camber
9/1/05 6:44 AM 27 7/16 26 1/4 25 1/16 0.6 26.844 1.781 1.9189/2/05 7:15 AM 34 7/16 31 11/16 31 3/8 1.6 33.063 1.688 1.8179/3/05 8:30 AM 25 23/32 23 5/16 22 21/32 2.7 24.516 1.859 2.0039/4/05 7:20 AM 29 1/2 26 15/16 26 7/16 3.6 28.219 1.781 1.9189/5/05 7:05 AM 31 1/8 28 1/2 27 7/8 4.6 29.813 1.938 2.0879/6/05 6:24 AM 22 1/8 19 1/8 18 13/16 5.6 20.625 1.813 1.9529/7/05 6:10 AM 32 7/8 29 3/4 29 3/16 6.6 31.313 2.125 2.2899/8/05 5:40 AM 34 11/16 32 31 3/8 7.6 33.344 1.969 2.1209/9/05 6:20 AM 34 5/8 31 7/8 31 5/16 8.6 33.250 1.938 2.0879/10/05 8:10 AM 22 9/32 19 21/32 19 9.7 20.969 1.969 2.1209/12/05 6:20 AM 35 1/8 32 11/16 31 7/8 11.6 33.906 2.031 2.1889/13/05 6:05 AM 31 1/16 28 9/16 27 1/8 12.6 29.813 2.016 2.1719/14/05 7:40 AM 25 1/16 22 7/16 21 3/4 13.6 23.750 2.000 2.1549/15/05 8:00 AM 27 7/16 24 13/16 24 1/16 14.7 26.125 2.063 2.2219/16/05 9:25 AM 22 1/2 19 3/4 19 1/16 15.7 21.125 2.063 2.2219/18/05 7:12 AM 28 7/16 25 7/8 25 1/16 17.6 27.156 2.094 2.2559/19/05 8:34 AM 24 7/16 21 9/16 21 18.7 23.000 2.000 2.1549/29/05 7:14 AM 34 5/8 31 11/16 31 1/8 28.6 33.156 2.031 2.188
10/11/05 9:28 AM 19 7/8 17 1/8 16 1/4 40.7 18.500 2.250 2.42310/28/05 10:20 AM 29 13/16 26 15/16 26 1/16 57.8 28.375 2.313 2.491
#N/A 0.000 #N/A #N/A#N/A 0.000 #N/A #N/A
CTC Camber Measurements Initial Camber (in.) = 1.918(ft) (in.) (days) Age at Release (days) = 0.6
Date Time Camber Camber Age Ultimate Camber (in.) = 2.5079/1/05 6:20 AM 0.15 1.80 0.6 Creep Camber (in.) = 0.589
Creep Coef. = 0.31
B - 3

G3A Cast 8/31/05
0.00
0.50
1.00
1.50
2.00
2.50
3.00
3.50
0.0 10.0 20.0 30.0 40.0 50.0 60.0
Days After Casting
Def
lect
ion
(in)
North Face
South Face
CTC
N-S Average
Measurements are taken at midspan and the supports. A factor of 1.07 is used to convert the camber relative to the end.
Camber mesurements were taken at the support locations. Multiplied camber by 1.077 to reflect total camber relative to ends of girder.
B - 4

Cast Date = 9/1/05 2:50 PM G2ARelease Date = 9/2/05 4:50 AM
North Face (in.) (in.) (in.) (days) (in.) (in.) 1.077Date Time East Elev West Elev Midspan Age E-W Ave Camber *Camber
9/2/05 6:00 AM 26 1/8 27 1/4 25 1/4 0.6 26.688 1.438 1.5489/3/05 9:00 AM 28 3/4 18 5/32 21 3/4 1.8 23.454 1.704 1.8359/4/05 7:50 AM 31 3/8 20 7/16 24 1/4 2.7 25.906 1.656 1.7849/5/05 7:30 AM 36 25 28 3/4 3.7 30.500 1.750 1.8859/6/05 6:45 AM 22 18 3/8 18 1/2 4.7 20.188 1.688 1.8179/7/05 6:25 AM 28 1/8 24 7/16 24 11/16 5.6 26.281 1.594 1.7169/8/05 6:02 AM 35 1/2 32 32 3/8 6.6 33.750 1.375 1.4819/9/05 6:35 AM 34 7/8 31 3/8 31 3/8 7.7 33.125 1.750 1.8859/10/05 7:50 AM 24 15/32 21 3/32 21 7/64 8.7 22.781 1.672 1.8019/12/05 6:35 AM 36 5/8 33 33 10.7 34.813 1.813 1.9529/13/05 6:12 AM 31 5/16 28 27 7/8 11.6 29.656 1.781 1.9189/14/05 7:53 AM 26 22 7/16 22 7/16 12.7 24.219 1.781 1.9189/15/05 8:00 AM 26 5/8 23 1/8 23 1/8 13.7 24.875 1.750 1.8859/16/05 9:49 AM 23 1/2 20 1/16 20 14.8 21.781 1.781 1.9189/18/05 7:30 AM 29 1/2 26 1/16 26 16.7 27.781 1.781 1.9189/19/05 8:48 AM 24 11/16 21 1/16 21 1/8 17.7 22.875 1.750 1.8859/29/05 7:36 AM 31 7/16 27 3/4 27 13/16 27.7 29.594 1.781 1.918
10/11/05 9:46 AM 20 15/16 17 5/8 17 1/4 39.8 19.281 2.031 2.18810/28/05 10:31 AM 31 27 5/16 27 1/8 56.8 29.156 2.031 2.188
#N/A 0.000 #N/A #N/A#N/A 0.000 #N/A #N/A#N/A 0.000 #N/A #N/A
South Face (in.) (in.) (in.) (days) (in.) (in.)Date Time East Elev West Elev Midspan Age E-W Ave Camber *Camber
9/2/05 6:15 AM 27 1/8 28 1/4 26 0.6 27.688 1.688 1.8179/3/05 9:00 AM 25 1/2 15 1/32 18 19/32 1.8 20.266 1.672 1.8019/4/05 7:40 AM 30 1/16 19 1/4 22 15/16 2.7 24.656 1.719 1.8519/5/05 7:30 AM 32 13/16 22 3/16 25 3/4 3.7 27.500 1.750 1.8859/6/05 6:40 AM 22 3/4 19 1/4 19 7/16 4.7 21.000 1.563 1.6839/7/05 6:20 AM 30 3/8 27 1/16 27 1/8 5.6 28.719 1.594 1.7169/8/05 5:59 AM 35 1/2 32 1/8 32 3/16 6.6 33.813 1.625 1.7509/9/05 6:30 AM 34 9/16 31 3/16 31 3/16 7.7 32.875 1.688 1.8179/10/05 7:50 AM 23 23/32 20 35/64 20 13/32 8.7 22.133 1.727 1.8609/12/05 6:30 AM 34 1/8 30 7/8 30 3/4 10.7 32.500 1.750 1.8859/13/05 6:10 AM 32 13/16 29 9/16 29 3/8 11.6 31.188 1.813 1.9529/14/05 7:47 AM 25 1/8 21 3/4 21 3/4 12.7 23.438 1.688 1.8179/15/05 8:00 AM 25 9/16 22 5/16 22 3/16 13.7 23.938 1.750 1.8859/16/05 9:35 AM 22 15/16 19 5/8 19 1/2 14.8 21.281 1.781 1.9189/18/05 7:32 AM 28 5/16 25 1/4 25 1/16 16.7 26.781 1.719 1.8519/19/05 8:42 AM 24 3/4 21 3/8 21 3/8 17.7 23.063 1.688 1.8179/29/05 7:34 AM 31 1/2 28 1/16 28 27.7 29.781 1.781 1.918
10/11/05 9:37 AM 20 16 5/8 16 5/16 39.8 18.313 2.000 2.15410/28/05 10:27 AM 29 15/16 26 3/8 26 3/16 56.8 28.156 1.969 2.120
#N/A 0.000 #N/A #N/A#N/A 17.688 #N/A #N/A#N/A 0.000 #N/A #N/A
CTC Camber Measurements Initial Camber (in.) = 1.683(ft) (in.) (days) Age at Release (days) = 0.6
Date Time Camber Camber Age Ultimate Camber (in.) = 2.1719/2/05 5:22 AM 0.14 1.68 0.6 Creep Camber (in.) = 0.488
Creep Coef. = 0.29
B - 5

G2A Cast 9/1/05
0.00
0.50
1.00
1.50
2.00
2.50
3.00
3.50
0.0 10.0 20.0 30.0 40.0 50.0 60.0
Days After Casting
Def
lect
ion
(in)
North Face
South Face
CTC
N-S Average
Camber mesurements were taken at the support locations. Multiplied camber by 1.077 to reflect total camber relative to ends of girder.
B - 6

Cast Date = 9/2/05 4:15 PM G1ARelease Date = 9/6/05 4:45 AM
North Face (in.) (in.) (in.) (days) (in.) (in.) 1.077Date Time East Elev West Elev Midspan Age E-W Ave Camber *Camber
9/6/05 7:30 AM 14 1/16 17 3/4 15 3.6 15.906 0.906 0.9769/7/05 6:30 AM 29 11/16 25 1/16 26 5/16 4.6 27.375 1.063 1.1449/8/05 6:20 AM 35 7/8 31 5/8 32 3/4 5.6 33.750 1.000 1.0779/9/05 6:45 AM 32 15/16 28 1/2 29 7/16 6.6 30.719 1.281 1.3809/10/05 7:30 AM 20 13/16 16 21/32 17 15/32 7.6 18.734 1.266 1.3639/12/05 6:45 AM 32 1/8 27 15/16 28 5/8 9.6 30.031 1.406 1.5159/13/05 6:20 AM 30 15/16 26 7/8 27 1/2 10.6 28.906 1.406 1.5159/14/05 8:00 AM 27 22 7/16 23 5/16 11.7 24.719 1.406 1.5159/15/05 8:00 AM 28 3/8 24 24 3/4 12.7 26.188 1.438 1.5489/16/05 10:02 AM 23 3/4 19 3/8 20 3/16 13.7 21.563 1.375 1.4819/18/05 7:36 AM 29 9/16 25 1/16 25 15/16 15.6 27.313 1.375 1.4819/19/05 8:58 AM 25 3/8 20 7/8 21 11/16 16.7 23.125 1.438 1.5489/29/05 7:44 AM 31 1/8 26 5/8 27 3/8 26.6 28.875 1.500 1.616
10/11/05 9:55 AM 20 1/2 16 1/8 16 11/16 38.7 18.313 1.625 1.75010/28/05 10:37 AM 30 1/16 25 11/16 26 3/16 55.8 27.875 1.688 1.817
#N/A 0.000 #N/A #N/A#N/A 0.000 #N/A #N/A#N/A 0.000 #N/A #N/A#N/A 0.000 #N/A #N/A#N/A 0.000 #N/A #N/A#N/A 0.000 #N/A #N/A#N/A 0.000 #N/A #N/A
South Face (in.) (in.) (in.) (days) (in.) (in.)Date Time East Elev West Elev Midspan Age E-W Ave Camber *Camber
9/6/05 7:40 AM 11 1/8 15 1/8 11 15/16 3.6 13.125 1.188 1.2799/7/05 6:25 AM 27 1/2 23 1/16 24 4.6 25.281 1.281 1.3809/8/05 6:06 AM 34 7/8 30 5/8 31 5/8 5.6 32.750 1.125 1.2129/9/05 6:40 AM 34 5/16 29 7/8 30 13/16 6.6 32.094 1.281 1.3809/10/05 7:30 AM 25 5/8 21 1/2 22 1/4 7.6 23.563 1.313 1.4149/12/05 6:40 AM 36 1/16 31 3/4 32 1/2 9.6 33.906 1.406 1.5159/13/05 6:20 AM 30 11/16 26 11/16 27 3/8 10.6 28.688 1.313 1.4149/14/05 7:53 AM 25 1/2 21 1/8 21 7/8 11.7 23.313 1.438 1.5489/15/05 8:00 AM 26 3/8 21 15/16 22 9/16 12.7 24.156 1.594 1.7169/16/05 9:52 AM 22 15/16 18 5/8 19 3/8 13.7 20.781 1.406 1.5159/18/05 7:30 AM 29 24 3/4 25 1/2 15.6 26.875 1.375 1.4819/19/05 8:51 AM 24 19 11/16 20 1/2 16.7 21.844 1.344 1.4479/29/05 7:40 AM 30 7/8 26 7/16 27 3/16 26.6 28.656 1.469 1.582
10/11/05 9:48 AM 20 3/8 16 1/16 16 1/2 38.7 18.219 1.719 1.85110/28/05 10:35 AM 30 3/8 26 1/16 26 7/16 55.8 28.219 1.781 1.918
#N/A 0.000 #N/A #N/A#N/A 0.000 #N/A #N/A#N/A 0.000 #N/A #N/A#N/A 0.000 #N/A #N/A#N/A 0.000 #N/A #N/A#N/A 17.688 #N/A #N/A#N/A 0.000 #N/A #N/A
CTC Camber Measurements Initial Camber (in.) = 1.127(ft) (in.) (days) Age at Release (days) = 3.5
Date Time Camber Camber Age Ultimate Camber (in.) = 1.8689/6/05 5:16 AM 0.09 1.08 3.5 Creep Camber (in.) = 0.740
Creep Coef. = 0.66
B - 7

G1A Cast 9/2/05
0.00
0.50
1.00
1.50
2.00
2.50
3.00
3.50
0.0 10.0 20.0 30.0 40.0 50.0 60.0
Days After Casting
Def
lect
ion
(in)
North Face
South Face
CTC
N-S Average
WE Release (4-Days, Labor Day Weekend)Camber mesurements were taken at the support locations. Multiplied camber by 1.077 to reflect total camber relative to ends of girder.
B - 8

Cast Date = 9/6/05 4:00 PM G4DRelease Date = 9/8/05 5:00 AM
North Face (in.) (in.) (in.) (days) (in.) (in.) 1.077Date Time East Elev West Elev Midspan Age E-W Ave Camber *Camber
9/8/05 6:50 AM 23 5/8 28 1/8 24 3/16 1.6 25.875 1.688 1.8179/9/05 7:05 AM 31 1/16 33 30 1/4 2.6 32.031 1.781 1.9189/10/05 9:10 AM 30 5/8 32 23/32 29 3/4 3.7 31.672 1.922 2.0709/12/05 6:55 AM 26 5/8 28 9/16 25 13/16 5.6 27.594 1.781 1.9189/13/05 6:34 AM 26 1/16 28 1/16 25 3/16 6.6 27.063 1.875 2.0199/14/05 8:10 AM 23 5/16 25 1/4 22 5/16 7.7 24.281 1.969 2.1209/15/05 8:00 AM 29 1/16 31 3/16 28 3/16 8.7 30.125 1.938 2.0879/16/05 10:49 AM 18 19 15/16 16 15/16 9.8 18.969 2.031 2.1889/18/05 8:04 AM 22 15/16 24 1/2 22 11.7 23.719 1.719 1.8519/19/05 9:12 AM 17 13/16 19 7/8 16 15/16 12.7 18.844 1.906 2.0539/29/05 8:00 AM 29 3/8 31 3/16 28 1/4 22.7 30.281 2.031 2.188
10/11/05 10:15 AM 15 17 13 11/16 34.8 16.000 2.313 2.49110/28/05 10:53 AM 25 3/8 27 7/16 24 51.8 26.406 2.406 2.592
#N/A 0.000 #N/A #N/A#N/A 0.000 #N/A #N/A#N/A 0.000 #N/A #N/A#N/A 0.000 #N/A #N/A#N/A 0.000 #N/A #N/A#N/A 0.000 #N/A #N/A#N/A 0.000 #N/A #N/A#N/A 0.000 #N/A #N/A#N/A 0.000 #N/A #N/A
South Face (in.) (in.) (in.) (days) (in.) (in.)Date Time East Elev West Elev Midspan Age E-W Ave Camber *Camber
9/8/05 7:02 AM 22 13/16 27 1/2 23 1/2 1.6 25.156 1.656 1.7849/9/05 7:00 AM 32 5/16 34 5/16 31 9/16 2.6 33.313 1.750 1.8859/10/05 9:10 AM 28 5/16 30 5/8 27 5/8 3.7 29.469 1.844 1.9869/12/05 6:50 AM 24 1/16 26 1/4 23 1/4 5.6 25.156 1.906 2.0539/13/05 6:30 AM 29 3/16 31 3/8 28 3/8 6.6 30.281 1.906 2.0539/14/05 8:10 AM 26 28 25 1/8 7.7 27.000 1.875 2.0199/15/05 8:00 AM 30 5/16 32 7/16 29 7/16 8.7 31.375 1.938 2.0879/16/05 10:40 AM 17 3/8 19 5/16 16 7/16 9.8 18.344 1.906 2.0539/18/05 8:19 AM 23 3/4 25 9/16 22 11/16 11.7 24.656 1.969 2.1209/19/05 9:08 AM 18 5/8 20 1/2 17 3/4 12.7 19.563 1.813 1.9529/29/05 7:57 AM 29 13/16 31 9/16 28 5/8 22.7 30.688 2.063 2.221
10/11/05 10:09 AM 16 1/16 18 1/16 14 13/16 34.8 17.063 2.250 2.42310/28/05 10:49 AM 25 1/16 27 3/8 23 7/8 51.8 26.219 2.344 2.524
#N/A 0.000 #N/A #N/A#N/A 0.000 #N/A #N/A#N/A 0.000 #N/A #N/A#N/A 0.000 #N/A #N/A#N/A 0.000 #N/A #N/A#N/A 0.000 #N/A #N/A#N/A 0.000 #N/A #N/A#N/A 17.688 #N/A #N/A#N/A 0.000 #N/A #N/A
CTC Camber Measurements Initial Camber (in.) = 1.801(ft) (in.) (days) Age at Release (days) = 1.5
Date Time Camber Camber Age Ultimate Camber (in.) = 2.5589/8/05 5:20 AM 0.17 2.04 1.6 Creep Camber (in.) = 0.757
Creep Coef. = 0.42
B - 9

G4D Cast 9/6/05
0.00
0.50
1.00
1.50
2.00
2.50
3.00
3.50
0.0 10.0 20.0 30.0 40.0 50.0 60.0Days After Casting
Def
lect
ion
(in)
North Face
South Face
CTC
N-S Average
2-Day Release, Did not get strength on the first day.
Camber mesurements were taken at the support locations. Multiplied camber by 1.077 to reflect total camber relative to ends of girder.
B - 10

Cast Date = 9/8/05 4:00 PM G3DRelease Date = 9/9/05 5:00 AM
North Face (in.) (in.) (in.) (days) (in.) (in.) 1.077Date Time East Elev West Elev Midspan Age E-W Ave Camber *Camber
9/9/05 5:40 AM 22 3/4 27 5/8 23 1/2 0.6 25.188 1.688 1.8179/10/05 9:00 AM 31 21/32 33 3/16 30 29/32 1.7 32.422 1.516 1.6329/12/05 7:00 AM 25 15/16 27 3/8 25 1/16 3.6 26.656 1.594 1.7169/13/05 6:39 AM 25 15/16 27 3/8 25 3/16 4.6 26.656 1.469 1.5829/14/05 8:20 AM 25 26 9/16 24 1/16 5.7 25.781 1.719 1.8519/15/05 8:00 AM 28 1/8 29 5/8 27 3/8 6.7 28.875 1.500 1.6169/16/05 11:00 AM 18 1/4 19 7/16 17 1/8 7.8 18.844 1.719 1.8519/18/05 7:56 AM 21 3/16 22 7/16 20 1/16 9.7 21.813 1.750 1.8859/19/05 9:20 AM 18 3/8 19 11/16 17 3/8 10.7 19.031 1.656 1.7849/29/05 8:06 AM 27 1/8 28 5/8 26 1/16 20.7 27.875 1.813 1.952
10/11/05 10:25 AM 15 11/16 17 5/16 14 11/16 32.8 16.500 1.813 1.95210/28/05 11:05 AM 25 9/16 27 1/4 24 3/8 49.8 26.406 2.031 2.188
#N/A 0.000 #N/A #N/A#N/A 0.000 #N/A #N/A#N/A 0.000 #N/A #N/A#N/A 0.000 #N/A #N/A#N/A 0.000 #N/A #N/A#N/A 0.000 #N/A #N/A#N/A 0.000 #N/A #N/A#N/A 0.000 #N/A #N/A#N/A 0.000 #N/A #N/A#N/A 0.000 #N/A #N/A
South Face (in.) (in.) (in.) (days) (in.) (in.)Date Time East Elev West Elev Midspan Age E-W Ave Camber *Camber
9/9/05 5:50 AM 20 11/16 25 15/16 21 11/16 0.6 23.313 1.625 1.7509/10/05 9:00 AM 27 27/32 29 5/8 27 3/16 1.7 28.734 1.547 1.6669/12/05 7:00 AM 26 15/16 28 1/2 26 1/8 3.6 27.719 1.594 1.7169/13/05 6:35 AM 26 7/16 28 1/8 25 3/4 4.6 27.281 1.531 1.6499/14/05 8:20 AM 23 5/8 25 1/8 22 3/4 5.7 24.375 1.625 1.7509/15/05 8:00 AM 29 7/16 31 1/4 28 5/8 6.7 30.344 1.719 1.8519/16/05 10:52 AM 18 3/8 19 11/16 17 5/16 7.8 19.031 1.719 1.8519/18/05 8:04 AM 22 5/8 24 3/8 21 5/8 9.7 23.500 1.875 2.0199/19/05 9:15 AM 18 3/16 19 11/16 17 5/16 10.7 18.938 1.625 1.7509/29/05 8:03 AM 29 11/16 31 1/8 28 11/16 20.7 30.406 1.719 1.851
10/11/05 10:17 AM 15 7/16 17 14 5/16 32.8 16.219 1.906 2.05310/28/05 10:56 AM 25 11/16 27 1/2 24 5/8 49.8 26.594 1.969 2.120
#N/A 0.000 #N/A #N/A#N/A 0.000 #N/A #N/A#N/A 0.000 #N/A #N/A#N/A 0.000 #N/A #N/A#N/A 0.000 #N/A #N/A#N/A 0.000 #N/A #N/A#N/A 0.000 #N/A #N/A#N/A 0.000 #N/A #N/A#N/A 17.688 #N/A #N/A#N/A 0.000 #N/A #N/A
CTC Camber Measurements Initial Camber (in.) = 1.784(ft) (in.) (days) Age at Release (days) = 0.5
Date Time Camber Camber Age Ultimate Camber (in.) = 2.1549/9/05 5:20 AM 0.16 1.92 0.6 Creep Camber (in.) = 0.370
Creep Coef. = 0.21
B - 11

G3D Cast 9/8/05
0.00
0.50
1.00
1.50
2.00
2.50
3.00
3.50
0.0 10.0 20.0 30.0 40.0 50.0 60.0Days After Casting
Def
lect
ion
(in)
North Face
South Face
CTC
N-S Average
Camber mesurements were taken at the support locations. Multiplied camber by 1.077 to reflect total camber relative to ends of girder.
B - 12
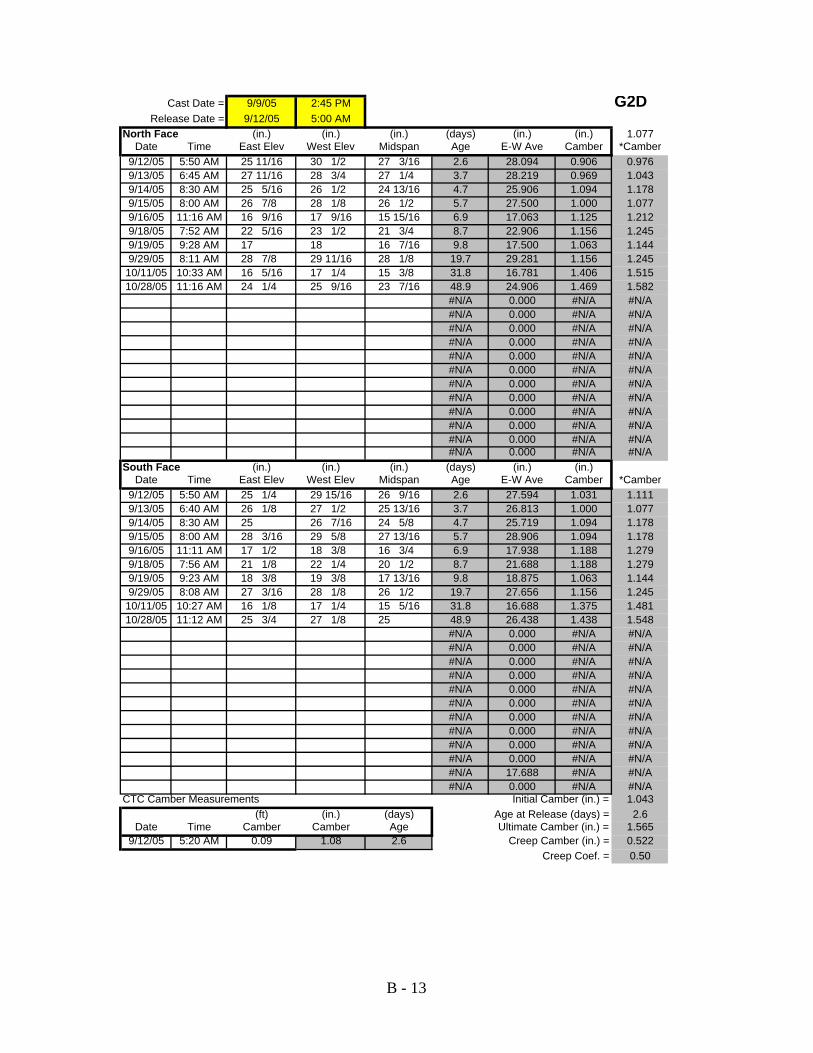
Cast Date = 9/9/05 2:45 PM G2DRelease Date = 9/12/05 5:00 AM
North Face (in.) (in.) (in.) (days) (in.) (in.) 1.077Date Time East Elev West Elev Midspan Age E-W Ave Camber *Camber
9/12/05 5:50 AM 25 11/16 30 1/2 27 3/16 2.6 28.094 0.906 0.9769/13/05 6:45 AM 27 11/16 28 3/4 27 1/4 3.7 28.219 0.969 1.0439/14/05 8:30 AM 25 5/16 26 1/2 24 13/16 4.7 25.906 1.094 1.1789/15/05 8:00 AM 26 7/8 28 1/8 26 1/2 5.7 27.500 1.000 1.0779/16/05 11:16 AM 16 9/16 17 9/16 15 15/16 6.9 17.063 1.125 1.2129/18/05 7:52 AM 22 5/16 23 1/2 21 3/4 8.7 22.906 1.156 1.2459/19/05 9:28 AM 17 18 16 7/16 9.8 17.500 1.063 1.1449/29/05 8:11 AM 28 7/8 29 11/16 28 1/8 19.7 29.281 1.156 1.245
10/11/05 10:33 AM 16 5/16 17 1/4 15 3/8 31.8 16.781 1.406 1.51510/28/05 11:16 AM 24 1/4 25 9/16 23 7/16 48.9 24.906 1.469 1.582
#N/A 0.000 #N/A #N/A#N/A 0.000 #N/A #N/A#N/A 0.000 #N/A #N/A#N/A 0.000 #N/A #N/A#N/A 0.000 #N/A #N/A#N/A 0.000 #N/A #N/A#N/A 0.000 #N/A #N/A#N/A 0.000 #N/A #N/A#N/A 0.000 #N/A #N/A#N/A 0.000 #N/A #N/A#N/A 0.000 #N/A #N/A#N/A 0.000 #N/A #N/A
South Face (in.) (in.) (in.) (days) (in.) (in.)Date Time East Elev West Elev Midspan Age E-W Ave Camber *Camber
9/12/05 5:50 AM 25 1/4 29 15/16 26 9/16 2.6 27.594 1.031 1.1119/13/05 6:40 AM 26 1/8 27 1/2 25 13/16 3.7 26.813 1.000 1.0779/14/05 8:30 AM 25 26 7/16 24 5/8 4.7 25.719 1.094 1.1789/15/05 8:00 AM 28 3/16 29 5/8 27 13/16 5.7 28.906 1.094 1.1789/16/05 11:11 AM 17 1/2 18 3/8 16 3/4 6.9 17.938 1.188 1.2799/18/05 7:56 AM 21 1/8 22 1/4 20 1/2 8.7 21.688 1.188 1.2799/19/05 9:23 AM 18 3/8 19 3/8 17 13/16 9.8 18.875 1.063 1.1449/29/05 8:08 AM 27 3/16 28 1/8 26 1/2 19.7 27.656 1.156 1.245
10/11/05 10:27 AM 16 1/8 17 1/4 15 5/16 31.8 16.688 1.375 1.48110/28/05 11:12 AM 25 3/4 27 1/8 25 48.9 26.438 1.438 1.548
#N/A 0.000 #N/A #N/A#N/A 0.000 #N/A #N/A#N/A 0.000 #N/A #N/A#N/A 0.000 #N/A #N/A#N/A 0.000 #N/A #N/A#N/A 0.000 #N/A #N/A#N/A 0.000 #N/A #N/A#N/A 0.000 #N/A #N/A#N/A 0.000 #N/A #N/A#N/A 0.000 #N/A #N/A#N/A 17.688 #N/A #N/A#N/A 0.000 #N/A #N/A
CTC Camber Measurements Initial Camber (in.) = 1.043(ft) (in.) (days) Age at Release (days) = 2.6
Date Time Camber Camber Age Ultimate Camber (in.) = 1.5659/12/05 5:20 AM 0.09 1.08 2.6 Creep Camber (in.) = 0.522
Creep Coef. = 0.50
B - 13

G2D Cast 9/9/05
0.00
0.50
1.00
1.50
2.00
2.50
3.00
3.50
0.0 10.0 20.0 30.0 40.0 50.0 60.0
Days After Casting
Def
lect
ion
(in)
North Face
South Face
CTC
N-S Average
WE Release (3-Days)
Camber mesurements were taken at the support locations. Multiplied camber by 1.077 to reflect total camber relative to ends of girder.
B - 14

Cast Date = 9/12/05 3:45 PM G1DRelease Date = 9/13/05 5:00 AM
North Face (in.) (in.) (in.) (days) (in.) (in.) 1.077Date Time East Elev West Elev Midspan Age E-W Ave Camber *Camber
9/13/05 7:05 AM 28 1/16 32 9/16 28 7/8 0.6 30.313 1.438 1.5489/14/05 8:50 AM 24 3/16 29 24 13/16 1.7 26.594 1.781 1.9189/15/05 8:00 AM 22 3/8 27 23 1/8 2.7 24.688 1.563 1.6839/16/05 11:30 AM 12 1/16 16 3/4 12 1/2 3.8 14.406 1.906 2.0539/18/05 8:45 AM 23 5/8 28 1/16 24 1/16 5.7 25.844 1.781 1.9189/19/05 9:35 AM 19 3/8 20 9/16 18 3/8 6.7 19.969 1.594 1.7169/29/05 8:17 AM 30 7/16 31 3/16 29 1/16 16.7 30.813 1.750 1.885
10/11/05 10:40 AM 18 1/8 19 1/8 16 5/8 28.8 18.625 2.000 2.15410/28/05 11:25 AM 24 7/16 25 9/16 22 15/16 45.8 25.000 2.063 2.221
#N/A 0.000 #N/A #N/A#N/A 0.000 #N/A #N/A#N/A 0.000 #N/A #N/A#N/A 0.000 #N/A #N/A#N/A 0.000 #N/A #N/A#N/A 0.000 #N/A #N/A#N/A 0.000 #N/A #N/A#N/A 0.000 #N/A #N/A#N/A 0.000 #N/A #N/A#N/A 0.000 #N/A #N/A#N/A 0.000 #N/A #N/A#N/A 0.000 #N/A #N/A#N/A 0.000 #N/A #N/A
South Face (in.) (in.) (in.) (days) (in.) (in.)Date Time East Elev West Elev Midspan Age E-W Ave Camber *Camber
9/13/05 7:00 AM 19 7/8 24 7/8 20 7/8 0.6 22.375 1.500 1.6169/14/05 8:40 AM 25 29 3/4 25 13/16 1.7 27.375 1.563 1.6839/15/05 8:00 AM 21 7/8 26 3/4 22 9/16 2.7 24.313 1.750 1.8859/16/05 11:42 AM 12 15/16 17 3/4 13 9/16 3.8 15.344 1.781 1.9189/18/05 8:45 AM 19 1/2 24 1/2 20 3/16 5.7 22.000 1.813 1.9529/19/05 9:31 AM 18 3/4 19 13/16 17 1/2 6.7 19.281 1.781 1.9189/29/05 8:14 AM 30 5/8 31 3/8 29 1/4 16.7 31.000 1.750 1.885
10/11/05 10:35 AM 18 1/8 19 1/8 16 5/8 28.8 18.625 2.000 2.15410/28/05 11:20 AM 26 3/16 27 5/16 24 11/16 45.8 26.750 2.063 2.221
#N/A 0.000 #N/A #N/A#N/A 0.000 #N/A #N/A#N/A 0.000 #N/A #N/A#N/A 0.000 #N/A #N/A#N/A 0.000 #N/A #N/A#N/A 0.000 #N/A #N/A#N/A 0.000 #N/A #N/A#N/A 0.000 #N/A #N/A#N/A 0.000 #N/A #N/A#N/A 0.000 #N/A #N/A#N/A 0.000 #N/A #N/A#N/A 17.688 #N/A #N/A#N/A 0.000 #N/A #N/A
CTC Camber Measurements Initial Camber (in.) = 1.582(ft) (in.) (days) Age at Release (days) = 0.6
Date Time Camber Camber Age Ultimate Camber (in.) = 2.2219/13/05 5:38 AM 0.15 1.80 0.6 Creep Camber (in.) = 0.639
Creep Coef. = 0.40
B - 15
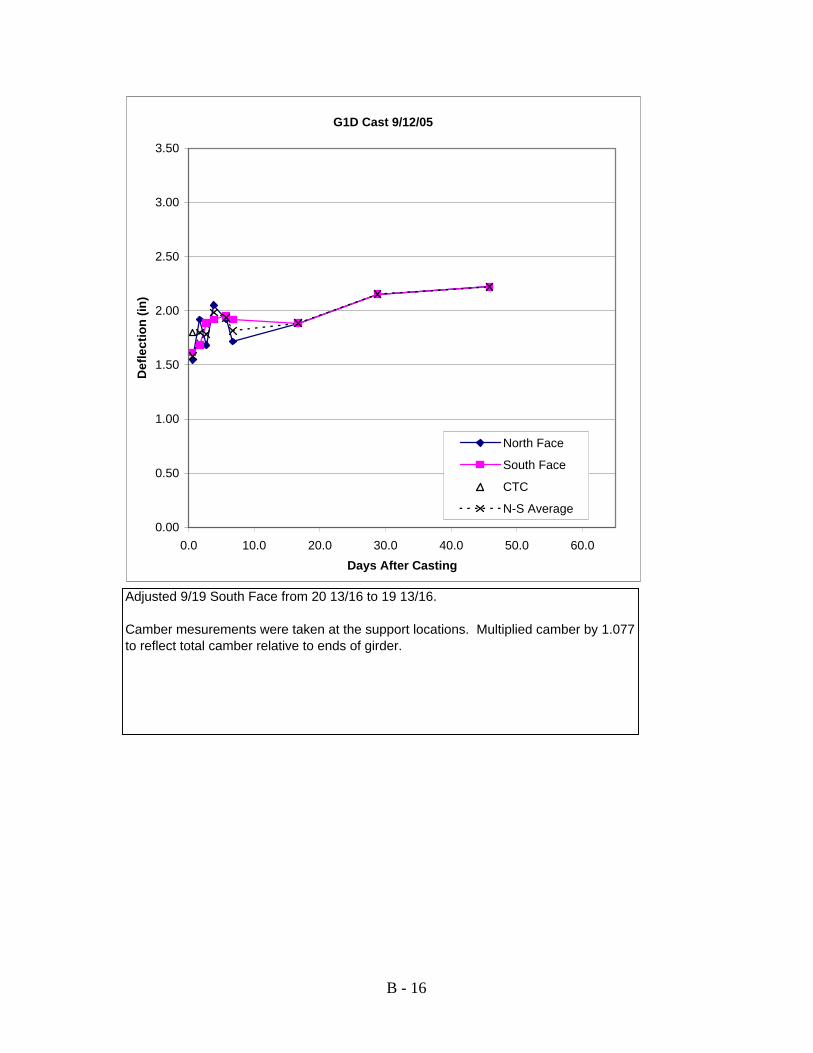
G1D Cast 9/12/05
0.00
0.50
1.00
1.50
2.00
2.50
3.00
3.50
0.0 10.0 20.0 30.0 40.0 50.0 60.0Days After Casting
Def
lect
ion
(in)
North Face
South Face
CTC
N-S Average
Adjusted 9/19 South Face from 20 13/16 to 19 13/16.
Camber mesurements were taken at the support locations. Multiplied camber by 1.077 to reflect total camber relative to ends of girder.
B - 16

APPENDIX C
SNAKE LAKE MATERIALS TEST DATA
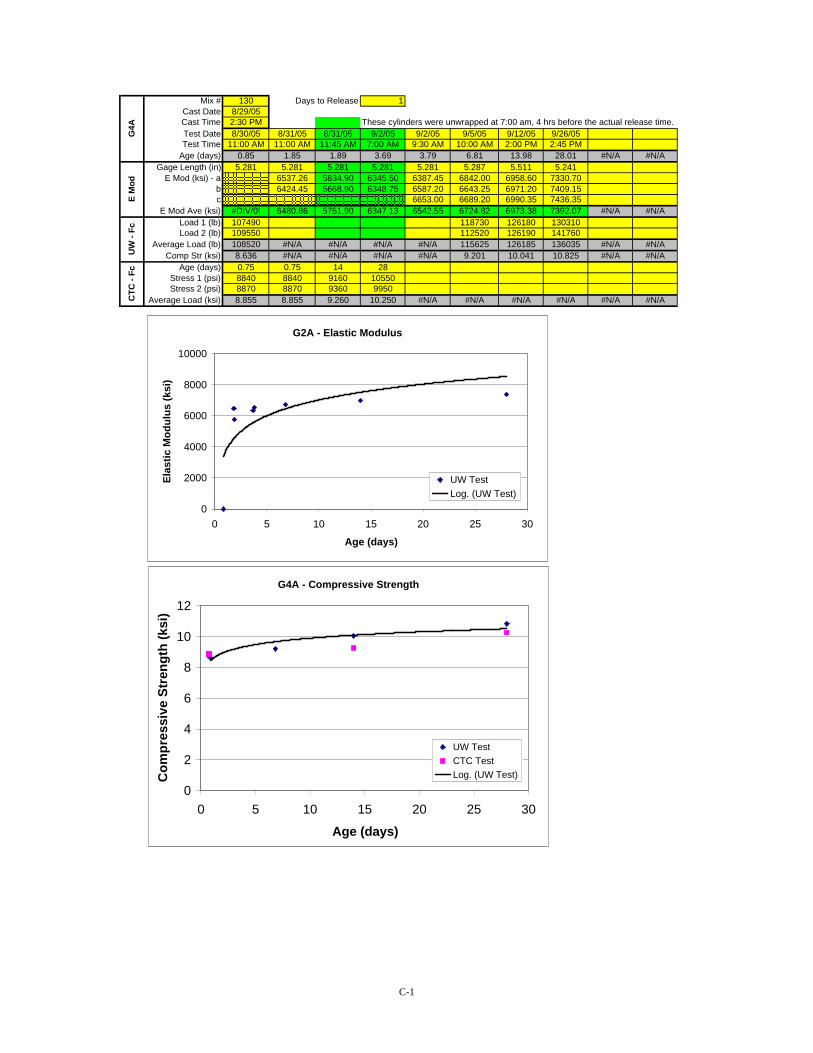
Mix # 130 Days to Release 1Cast Date 8/29/05Cast Time 2:30 PM These cylinders were unwrapped at 7:00 am, 4 hrs before the actual release time.Test Date 8/30/05 8/31/05 8/31/05 9/2/05 9/2/05 9/5/05 9/12/05 9/26/05Test Time 11:00 AM 11:00 AM 11:45 AM 7:00 AM 9:30 AM 10:00 AM 2:00 PM 2:45 PM
Age (days) 0.85 1.85 1.89 3.69 3.79 6.81 13.98 28.01 #N/A #N/AGage Length (in) 5.281 5.281 5.281 5.281 5.281 5.287 5.511 5.241
E Mod (ksi) - a 6537.26 5834.90 6345.50 6387.45 6842.00 6958.60 7330.70b 6424.45 5668.90 6348.75 6587.20 6643.25 6971.20 7409.15c 6653.00 6689.20 6990.35 7436.35
E Mod Ave (ksi) #DIV/0! 6480.86 5751.90 6347.13 6542.55 6724.82 6973.38 7392.07 #N/A #N/ALoad 1 (lb) 107490 118730 126180 130310Load 2 (lb) 109550 112520 126190 141760
Average Load (lb) 108520 #N/A #N/A #N/A #N/A 115625 126185 136035 #N/A #N/AComp Str (ksi) 8.636 #N/A #N/A #N/A #N/A 9.201 10.041 10.825 #N/A #N/A
Age (days) 0.75 0.75 14 28Stress 1 (psi) 8840 8840 9160 10550Stress 2 (psi) 8870 8870 9360 9950
Average Load (ksi) 8.855 8.855 9.260 10.250 #N/A #N/A #N/A #N/A #N/A #N/A
E M
odU
W -
FcC
TC -
FcG
4A
G4A - Compressive Strength
0
2
4
6
8
10
12
0 5 10 15 20 25 30
Age (days)
Com
pres
sive
Str
engt
h (k
si)
UW TestCTC TestLog. (UW Test)
G2A - Elastic Modulus
0
2000
4000
6000
8000
10000
0 5 10 15 20 25 30
Age (days)
Elas
tic M
odul
us (k
si)
UW TestLog. (UW Test)
C-1

Mix # 130 Days to Release 1Cast Date 9/1/05Cast Time 2:50 PMTest Date 9/3/05 9/5/05 9/8/05 9/15/05 9/29/05Test Time 5:00 AM 8:45 AM 8:15 AM 11:00 AM 9:30 AM
Age (days) 1.59 3.75 6.73 13.84 27.78 #N/A #N/A #N/A #N/A #N/AGage Length (in) 5.242 5.288 5.255 5.253 5.228
E Mod (ksi) - a 5858.90 5854.95 6018.30b 5967.40 5694.00 5943.55 6057.60c 5926.90 5691.10 5953.25 6076.90
E Mod Ave (ksi) 5917.73 5746.68 #N/A 5948.40 6050.93 #N/A #N/A #N/A #N/A #N/ALoad 1 (lb) 110800 102750 103620 120590 130200Load 2 (lb) 107850 100510 111030 126930 129680
Average Load (lb) 109325 101630 107325 123760 129940 #N/A #N/A #N/A #N/A #N/AComp Str (ksi) 8.700 8.087 8.541 9.849 10.340 #N/A #N/A #N/A #N/A #N/A
Age (days) 0.5 14 28Stress 1 (psi) 7340 9620 10020Stress 2 (psi) 7700 9280 10450
Average Load (ksi) 7.520 9.450 10.235 #N/A #N/A #N/A #N/A #N/A #N/A #N/A
E M
odU
W -
FcC
TC -
FcG
2A
G2A - Elastic Modulus
0
2000
4000
6000
8000
10000
0 5 10 15 20 25 30
Age (days)
Elas
tic M
odul
us (k
si)
UW Test
G2A - Compressive Strength
0
2
4
6
8
10
12
0 5 10 15 20 25 30
Age (days)
Com
pres
sive
Str
engt
h (k
si)
UW TestCTC TestLog. (UW Test)
C-2

Mix # 140 Days to Release 2Cast Date 9/6/05Cast Time 4:00 PMTest Date 9/8/05 9/9/05 9/10/05 9/13/05 9/20/05 10/4/05Test Time 6:00 AM 7:15 AM 9:00 AM 9:30 AM 7:30 AM 8:45 AM
Age (days) 1.58 2.64 3.71 6.73 13.65 27.70 #N/A #N/A #N/A #N/AGage Length (in) 5.281 5.281 5.245 5.262 5.300 5.252
E Mod (ksi) - a 5812.50 6846.65 6326.10 6220.35 6263.55 6334.50b 5887.50 6742.90 6070.65 6198.10 6163.55 6266.95c 5992.70 6719.30 6173.35 6237.50 6166.15 6206.30
E Mod Ave (ksi) 5897.57 6769.62 6190.03 6218.65 6197.75 6269.25 #N/A #N/A #N/A #N/ALoad 1 (lb) 118350 111900 97769 117360 136820 136230Load 2 (lb) 99371 112620 118830 118050 128990 136680
Average Load (lb) 108861 112260 108300 117705 132905 136455 #N/A #N/A #N/A #N/AComp Str (ksi) 8.663 8.933 8.618 9.367 10.576 10.859 #N/A #N/A #N/A #N/A
Age (days) 1.5 14 28Stress 1 (psi) 8640 8460 9960Stress 2 (psi) 8590 8240 9790
Average Load (ksi) 8.615 8.350 9.875 #N/A #N/A #N/A #N/A #N/A #N/A #N/A
E M
odU
W -
FcC
TC -
FcG
4D
G4D - Elastic Modulus
0
2000
4000
6000
8000
10000
0 5 10 15 20 25 30
Age (days)
Elas
tic M
odul
us (k
si)
UW Test
G4D - Compressive Strength
0
2
4
6
8
10
12
0 5 10 15 20 25 30
Age (days)
Com
pres
sive
Str
engt
h (k
si)
UW TestCTC TestLog. (UW Test)
C-3

Mix # 190 Days to Release 1Cast Date 9/8/05Cast Time 4:00 PMTest Date 9/9/05 9/10/05 9/12/05 9/15/05 9/22/05 10/6/05Test Time 5:30 AM 8:00 AM 2:45 PM 11:45 AM 9:45 AM 9:30 AM
Age (days) 0.56 1.67 3.95 6.82 13.74 27.73 #N/A #N/A #N/A #N/AGage Length (in) 5.242 5.256 5.261 5.278 5.278 5.437
E Mod (ksi) - a 5303.55 5942.50 6224.15 5899.45 6105.40 6165.40b 5253.90 5915.00 6243.80 5787.20 5996.55 6154.95c 5197.10 5944.75 6216.20 5799.70 6136.25 6129.25
E Mod Ave (ksi) 5251.52 5934.08 6228.05 5828.78 6079.40 6149.87 #N/A #N/A #N/A #N/ALoad 1 (lb) 105500 115560 123570 131030 136820 142060Load 2 (lb) 113000 124660 123270 128200
Average Load (lb) 109250 120110 123420 129615 136820 142060 #N/A #N/A #N/A #N/AComp Str (ksi) 8.694 9.558 9.821 10.314 10.888 11.305 #N/A #N/A #N/A #N/A
Age (days) 0.5 14 28Stress 1 (psi) 8980 10800 11610Stress 2 (psi) 8100 10410 11380
Average Load (ksi) 8.540 10.605 11.495 #N/A #N/A #N/A #N/A #N/A #N/A #N/A
E M
odU
W -
FcC
TC -
FcG
3D
G3D - Elastic Modulus
0
2000
4000
6000
8000
10000
0 5 10 15 20 25 30
Age (days)
Elas
tic M
odul
us (k
si)
UW TestLog. (UW Test)
G3D - Compressive Strength
0
2
4
6
8
10
12
0 5 10 15 20 25 30
Age (days)
Com
pres
sive
Str
engt
h (k
si)
UW TestCTC TestLog. (UW Test)
C-4

Mix # 130 Days to Release 3Cast Date 9/9/05Cast Time 2:45 PMTest Date 9/12/05 9/15/05 9/19/05Test Time 9:15 AM 12:30 PM 8:00 AM
Age (days) 2.77 5.91 9.72 #N/A #N/A #N/A #N/A #N/A #N/A #N/AGage Length (in) 4.818 5.286 5.268
E Mod (ksi) - a 5904.10 5635.40b 5822.10 5787.60c 5848.15 5729.10
E Mod Ave (ksi) 5858.12 #N/A 5717.37 #N/A #N/A #N/A #N/A #N/A #N/A #N/ALoad 1 (lb) 110200Load 2 (lb)
Average Load (lb) 110200 #N/A #N/A #N/A #N/A #N/A #N/A #N/A #N/A #N/AComp Str (ksi) 8.769 #N/A #N/A #N/A #N/A #N/A #N/A #N/A #N/A #N/A
Age (days) 2.5 14 28Stress 1 (psi) 8310 9460 9780Stress 2 (psi) 8280 9130 9870
Average Load (ksi) 8.295 9.295 9.825 #N/A #N/A #N/A #N/A #N/A #N/A #N/A
E M
odU
W -
FcC
TC -
FcG
2D
G2D - Elastic Modulus
0
2000
4000
6000
8000
10000
0 5 10 15 20 25 30
Age (days)
Elas
tic M
odul
us (k
si)
UW Test
G2D - Compressive Strength
0
2
4
6
8
10
12
0 5 10 15 20 25 30
Age (days)
Com
pres
sive
Str
engt
h (k
si)
UW TestCTC TestLog. (CTC Test)
C-5
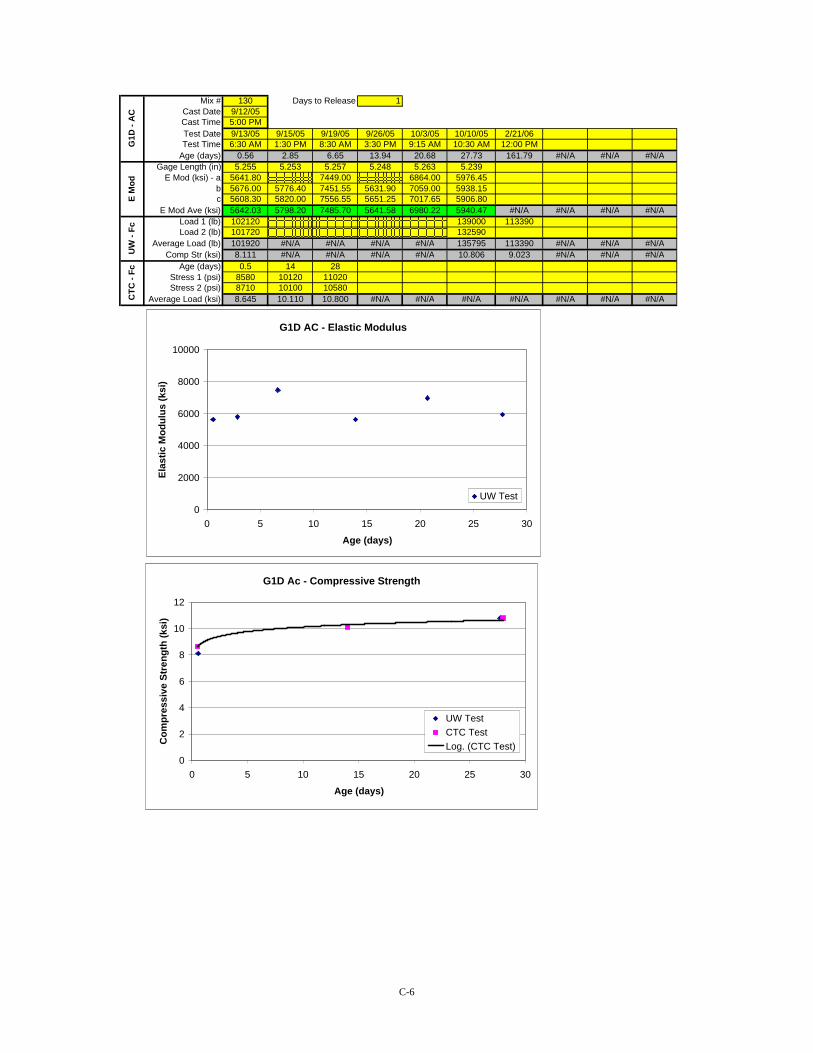
Mix # 130 Days to Release 1Cast Date 9/12/05Cast Time 5:00 PMTest Date 9/13/05 9/15/05 9/19/05 9/26/05 10/3/05 10/10/05 2/21/06Test Time 6:30 AM 1:30 PM 8:30 AM 3:30 PM 9:15 AM 10:30 AM 12:00 PM
Age (days) 0.56 2.85 6.65 13.94 20.68 27.73 161.79 #N/A #N/A #N/AGage Length (in) 5.255 5.253 5.257 5.248 5.263 5.239
E Mod (ksi) - a 5641.80 7449.00 6864.00 5976.45b 5676.00 5776.40 7451.55 5631.90 7059.00 5938.15c 5608.30 5820.00 7556.55 5651.25 7017.65 5906.80
E Mod Ave (ksi) 5642.03 5798.20 7485.70 5641.58 6980.22 5940.47 #N/A #N/A #N/A #N/ALoad 1 (lb) 102120 139000 113390Load 2 (lb) 101720 132590
Average Load (lb) 101920 #N/A #N/A #N/A #N/A 135795 113390 #N/A #N/A #N/AComp Str (ksi) 8.111 #N/A #N/A #N/A #N/A 10.806 9.023 #N/A #N/A #N/A
Age (days) 0.5 14 28Stress 1 (psi) 8580 10120 11020Stress 2 (psi) 8710 10100 10580
Average Load (ksi) 8.645 10.110 10.800 #N/A #N/A #N/A #N/A #N/A #N/A #N/A
E M
odU
W -
FcC
TC -
FcG
1D -
AC
G1D AC - Elastic Modulus
0
2000
4000
6000
8000
10000
0 5 10 15 20 25 30
Age (days)
Elas
tic M
odul
us (k
si)
UW Test
G1D Ac - Compressive Strength
0
2
4
6
8
10
12
0 5 10 15 20 25 30
Age (days)
Com
pres
sive
Str
engt
h (k
si)
UW TestCTC TestLog. (CTC Test)
C-6

Mix # 130 Days to Release 1Cast Date 9/12/05Cast Time 5:00 PMTest Date 9/13/05 9/14/05 9/15/05 9/19/05 9/26/05 10/3/05 10/10/05 2/21/06Test Time 10:15 AM 1:00 PM 1:00 PM 9:45 AM 3:45 PM 10:00 AM 11:00 AM 12:00 PM
Age (days) 0.72 1.83 2.83 6.70 13.95 20.71 27.75 161.79 #N/A #N/AGage Length (in) 5.211 5.151 5.287 5.283 5.244 5.257 5.248
E Mod (ksi) - a 4212.65 5561.45 5968.40 5878.80b 4238.96 5565.40 5865.15 5914.60 6074.60 5825.75c 4167.30 5517.75 5980.95 5932.30 6098.05 5841.95
E Mod Ave (ksi) 4206.30 5548.20 5923.05 #N/A 5938.43 6086.33 5848.83 #N/A #N/A #N/ALoad 1 (lb) 59187 95099 113310 130370 146470 143660Load 2 (lb) 62193 98283 147500
Average Load (lb) 60690 96691 113310 130370 #N/A #N/A 146985 143660 #N/A #N/AComp Str (ksi) 4.830 7.694 9.017 10.375 #N/A #N/A 11.697 11.432 #N/A #N/A
Age (days)Stress 1 (psi)Stress 2 (psi)
Average Load (ksi) #N/A #N/A #N/A #N/A #N/A #N/A #N/A #N/A #N/A #N/A
E M
odU
W -
FcC
TC -
FcG
1D -
MC
G1D MC - Elastic Modulus
0
2000
4000
6000
8000
10000
0 5 10 15 20 25 30
Age (days)
Elas
tic M
odul
us (k
si)
UW TestLog. (UW Test)
G1D MC - Compressive Strength
0
2
4
6
8
10
12
0 5 10 15 20 25 30
Age (days)
Com
pres
sive
Str
engt
h (k
si)
UW TestCTC TestLog. (UW Test)
C-7

APPENDIX D
SNAKE LAKE CREEP TEST DATA

G2D-AC-Release Initial Loading:Sealed 0% 100% 0% 100%
Girder Name: G2D Date 09/12/05 09/12/05 09/12/05 09/12/05Cast Date: 09/09/05 Time 12:16 PM 12:20 PM 12:30 PM 12:40 PMCast Time: 5:00 PM Ambient Temp (°F) 64Release date: 09/12/05 Cyl. Surf. Temp(°F) 68
Cylinder Loading: Release Gauge Load (psi) 0 7300 0 7300Cylinder Cure: AC Stress (ksi) 0 3.656 0 3.656
(10,000 in) N 160 63 152 69Prep Work: Sealed UnSealed S 274 252 276 252
Ambient Temp (°F) 73 73 E 310 272 310 255Unwrap Time 8:15 AM 8:15 AM W 300 244 301 238
Cyl. Surf. Temp(°F) 65 65 Age (days) 2.80 2.81 2.81 2.82Humidity (%) Gauge Correction 7 7 7 7
Rod Temp (°F) 68 68 68 68Loading: ADJ - N 167 70 159 76
Ave E Mod = 5143 ksi ADJ - S 281 259 283 259Sustained Pressure = 3.656 ksi ADJ - E 317 279 317 262
ADJ - W 307 251 308 245 Δ Average N-S -60 -54
Δ Average E-W -47 -59Δ Ave-Ave (in) -53 -56
Concrete Strain -0.000784 -0.000827Ec (ksi) 4663 4421
Comments:
UnSealedDate 09/12/05 09/12/05 09/12/05 09/12/05Time 12:16 PM 12:20 PM 12:30 PM 12:40 PM
Ambient Temp (°F) 64Cyl. Surf. Temp(°F) 68
Gauge Load (psi) 0 7300 0 7300Stress (ksi) 0 3.656 0 3.656
(10,000 in) N 422 362 415 371S 357 307 349 310
E 428 385 423 389W 356 300 352 301
Age (days) 2.80 2.81 2.81 2.82
Gauge Correction 7 7 7 7Rod Temp (°F) 68 68 68 68
ADJ - N 429 369 422 378ADJ - S 364 314 356 317
ADJ - E 435 392 430 396ADJ - W 363 307 359 308
Δ Average N-S -55 -42 Δ Average E-W -50 -43
Δ Ave-Ave (in) -52 -42Concrete Strain -0.000770 -0.000623
Ec (ksi) 4749 5864
Loading proceedure:Pump to gauge pressure of 7300 psi. Maintain pressure with jack while taking readings. Hand tighten nuts until snug.
D-1

Un-Loading: Creep Monitoring:Sealed 100% 0% Sealed 0% 100%
Date 01/11/06 01/11/06 Date 09/12/05 09/12/05 09/14/05Time 1:17 PM 1:58 PM Time 12:30 PM 12:40 PM 1:33 PM
Ambient Temp (°F) 50 49 Ambient Temp (°F)Cyl. Surf. Temp(°F) Cyl. Surf. Temp(°F) 66
Gauge Load (psi) 7300 0 (10,000 in) N 152 69 145Stress (ksi) 3.656 0 S 276 252 405
(10,000 in) N 23 94 E 310 255 415S 298 324 W 301 238 479
E 315 359 Age (days) 2.81 2.82 4.86W 256 315 Gauge Correction 7 7 -153
Age (days) 123.85 123.87 Rod Temp (°F) 68 68 68Gauge Correction -67 -73 ADJ - N 159 76 -8
Rod Temp (°F) 54 54 ADJ - S 283 259 252ADJ - N -44 21 ADJ - E 317 262 262ADJ - S 231 251 ADJ - W 308 245 326ADJ - E 248 286 Δ Average N-S 0 -54 -99
ADJ - W 189 242 Δ Average E-W 0 -59 -19 Δ Average N-S 43 Δ Ave-Ave 0 -56 -59
Δ Average E-W 46 Stress (ksi) 0 3.656 3.656Δ Ave-Ave (in) 44 Concrete Strain 0 -0.000827 -0.000863
Concrete Strain 0.000605 Ec Effective (ksi) 0 4421 4238Ec (ksi) 6041 Cc(t) 0 0 0.0431862
UnSealed UnSealedDate 01/11/06 01/11/06 Date 09/12/05 09/12/05 09/14/05Time 1:19 PM 2:00 PM Time 12:30 PM 12:40 PM 1:39 PM
Ambient Temp (°F) 50 49 Ambient Temp (°F)Cyl. Surf. Temp(°F) Cyl. Surf. Temp(°F) 65
Gauge Load (psi) 7300 0 (10,000 in) N 415 371 490Stress (ksi) 3.656 0 S 349 310 466
(10,000 in) N 372 419 E 423 389 474S 231 286 W 352 301 434
E 352 396 Age (days) 2.81 2.82 4.86W 304 365 Gauge Correction 7 7 -153
Age (days) 123.85 123.88 Rod Temp (°F) 68 68 68
Gauge Correction -67 -73 ADJ - N 422 378 337Rod Temp (°F) 54 54 ADJ - S 356 317 313
ADJ - N 305 346 ADJ - E 430 396 321ADJ - S 164 213 ADJ - W 359 308 281
ADJ - E 285 323 Δ Average N-S 0 -42 -64ADJ - W 237 292 Δ Average E-W 0 -43 -94
Δ Average N-S 45 Δ Ave-Ave 0 -42 -79 Δ Average E-W 47 Stress (ksi) 0 3.656 3.656
Δ Ave-Ave (in) 46 Concrete Strain 0 -0.000623 -0.001148Concrete Strain 0.000654 Ec Effective (ksi) 0 5864 3184
Ec (ksi) 5594 Cc(t) 0 0 0.8421386
D-2

09/15/05 09/16/05 09/17/05 09/18/05 09/19/05 09/20/05 09/21/05 09/22/05 09/23/05 09/25/053:45 PM 11:27 AM 10:06 AM 7:02 PM 3:23 PM 11:02 AM 10:51 AM 7:40 PM 11:44 AM 1:08 PM
66 62 60 68 68 68 66 66 65 6665 64 63 69 71 76 66 66 65 69
570 568 558 556 560 555 556 551 552 550825 823 822 808 809 818 808 805 803 804840 838 800 823 824 825 826 827 823 823780 885 760 797 798 791 788 788 784 783
5.95 6.77 7.71 9.08 9.93 10.75 11.74 13.11 13.78 15.84-578 -571 -562 -570 -568 -569 -563 -562 -560 -56266 59 64 70 68 68 66 68 64 70-8 -3 -4 -14 -8 -14 -7 -11 -8 -12
247 252 260 238 241 249 245 243 243 242262 267 238 253 256 256 263 265 263 261202 314 198 227 230 222 225 226 224 221-102 -97 -93 -109 -105 -104 -102 -105 -104 -106-81 -22 -95 -73 -70 -74 -69 -67 -69 -72-91 -59 -94 -91 -87 -89 -85 -86 -86 -89
3.656 3.656 3.656 3.656 3.656 3.656 3.656 3.656 3.656 3.656-0.001323 -0.000870 -0.001363 -0.001320 -0.001266 -0.001288 -0.001241 -0.001252 -0.001256 -0.001291
2763 4203 2683 2770 2887 2839 2945 2920 2912 28310.6002878 0.0518234 0.6477926 0.5959692 0.5311899 0.5571017 0.5009596 0.5139155 0.5182341 0.5614203
09/15/05 09/16/05 09/17/05 09/18/05 09/19/05 09/20/05 09/21/05 09/22/05 09/23/05 09/25/053:48 PM 11:31 AM 10:08 AM 7:04 PM 3:25 PM 11:04 AM 10:53 AM 7:43 PM 11:45 AM 1:10 PM
66 62 60 68 68 68 66 66 65 6669 64 62 68 67 71 64 66 63 66
916 912 901 904 897 895 894 898 894 894787 778 777 772 772 768 769 763 761 759
901 890 888 884 886 882 879 878 875 874855 850 850 842 844 840 836 834 833 830
5.95 6.77 7.71 9.09 9.93 10.75 11.75 13.11 13.78 15.84-578 -571 -562 -570 -568 -569 -563 -562 -560 -56266 59 63 70 70 68 66 68 64 70
338 341 339 334 329 326 331 336 334 332209 207 215 202 204 199 206 201 201 197
323 319 326 314 318 313 316 316 315 312277 279 288 272 276 271 273 272 273 268
-116 -115 -112 -121 -123 -127 -121 -121 -122 -125-95 -96 -88 -102 -98 -103 -100 -101 -101 -105-105 -105 -100 -111 -110 -115 -110 -111 -111 -115
3.656 3.656 3.656 3.656 3.656 3.656 3.656 3.656 3.656 3.656-0.001523 -0.001527 -0.001448 -0.001613 -0.001595 -0.001659 -0.001598 -0.001602 -0.001609 -0.001659
2400 2394 2524 2267 2292 2204 2287 2282 2272 22041.4436662 1.449395 1.3233607 1.5868871 1.5582429 1.6613619 1.5639717 1.5697006 1.5811582 1.6613619
D-3

09/26/05 09/27/05 10/04/05 10/17/05 11/11/05 12/09/05 01/11/067:10 PM 3:18 PM 3:37 PM 12:54 PM 2:54 PM 2:58 PM 1:17 PM
69 74 65 66 52 57 4969 71 65 68 55
550 561 555 547 539 108 23801 816 817 813 804 377 298826 838 832 832 826 399 315784 799 788 786 770 340 256
17.09 17.93 24.94 37.83 62.91 90.92 123.85-563 -578 -574 -575 -570 -149 -6772 73 66 68 57 63 54-13 -17 -19 -28 -31 -41 -44238 238 243 238 234 228 231263 260 258 257 256 250 248221 221 214 211 200 191 189-109 -111 -109 -116 -120 -128 -128-71 -72 -77 -79 -85 -92 -94-90 -91 -93 -97 -102 -110 -111
3.656 3.656 3.656 3.656 3.656 3.656 3.656-0.001302 -0.001327 -0.001348 -0.001413 -0.001481 -0.001591 -0.001606
2808 2755 2711 2588 2469 2298 22770.5743761 0.6046064 0.6305182 0.7082533 0.790307 0.9241841 0.9414586
09/26/05 09/27/05 10/04/05 10/17/05 11/11/05 12/09/05 01/11/067:11 PM 3:19 PM 3:58 PM 12:56 PM 2:55 PM 3:00 PM 1:19 PM
69 74 65 66 52 57 4969 68 63 65 55
897 909 902 900 888 454 372760 774 767 763 747 317 231
875 888 881 878 875 435 352833 846 839 836 822 388 304
17.09 17.93 24.96 37.83 62.91 90.92 123.85-563 -578 -577 -575 -570 -149 -6772 73 68 68 57 63 54
334 331 325 325 318 305 305197 196 190 188 177 168 164
312 310 304 303 305 286 285270 268 262 261 252 239 237
-124 -126 -132 -133 -142 -153 -155-104 -106 -112 -113 -116 -132 -134-114 -116 -122 -123 -129 -142 -144
3.656 3.656 3.656 3.656 3.656 3.656 3.656-0.001645 -0.001673 -0.001759 -0.001773 -0.001863 -0.002056 -0.002081
2223 2185 2078 2062 1963 1779 17571.6384466 1.6842772 1.8217693 1.8446846 1.9879054 2.2972625 2.3373643
D-4

Gage Value - Sealed Cylinder
-100
-50
0
50
100
150
200
250
300
350
0 20 40 60 80 100 120 140
Age (days)
Adj
uste
d G
auge
Val
ue (1
/10,
000
in)
ADJ - NADJ - SADJ - EADJ - W
Gauge Value - UnSealed Cylinder
0
50
100
150
200
250
300
350
400
450
500
0 20 40 60 80 100 120 140
Age (days)
Adj
uste
d G
uage
Val
ue (1
/10,
000
in)
ADJ - NADJ - SADJ - EADJ - W
D-5
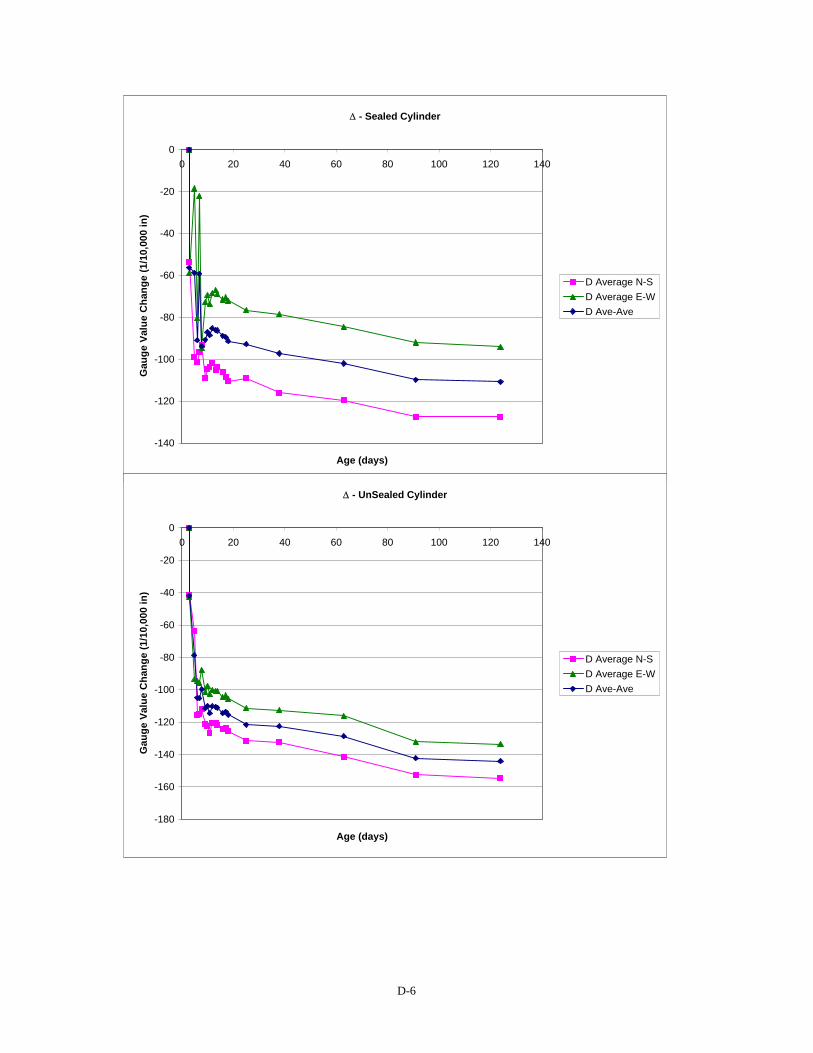
Δ - Sealed Cylinder
-140
-120
-100
-80
-60
-40
-20
00 20 40 60 80 100 120 140
Age (days)
Gau
ge V
alue
Cha
nge
(1/1
0,00
0 in
)
D Average N-SD Average E-WD Ave-Ave
Δ - UnSealed Cylinder
-180
-160
-140
-120
-100
-80
-60
-40
-20
00 20 40 60 80 100 120 140
Age (days)
Gau
ge V
alue
Cha
nge
(1/1
0,00
0 in
)
D Average N-SD Average E-WD Ave-Ave
D-6

Effective Elastic Modulus - Sealed
0
500
1000
1500
2000
2500
3000
3500
4000
4500
5000
0 20 40 60 80 100 120 140
Age (days)
Elas
tic M
od E
ff (k
si)
Ec Effective (ksi)
Effective Elastic Modulus - Unsealed
0
1000
2000
3000
4000
5000
6000
7000
0 20 40 60 80 100 120 140
Age (days)
Elas
tic M
od E
ff (k
si)
Ec Effective (ksi)
D-7

Creep Coefficient - Sealed
0
0.2
0.4
0.6
0.8
1
1.2
1.4
1.6
1.8
2
0 20 40 60 80 100 120 140
Age (days)
Cre
ep C
oeffi
cien
t
Cc(t)
Creep Coefficient - Unsealed
0
0.2
0.4
0.6
0.8
1
1.2
1.4
1.6
1.8
2
0 20 40 60 80 100 120 140
Age (days)
Cre
ep C
oeffi
cien
t
Cc(t)
D-8

G1D-AC-Release Initial Loading:Sealed 0% 100% 0% 100%
Girder Name: G1D Date 09/13/05 09/13/05 09/13/05 09/13/05Cast Date: 09/12/05 Time 8:36 AM 8:45 AM 9:00 AM 9:15 AMCast Time: 5:00 PM Ambient Temp (°F) 72 72 72 72Release date: 09/13/05 Cyl. Surf. Temp(°F) 64
Cylinder Loading: Release Gauge Load (psi) 0 7300 0 7300Cylinder Cure: AC Stress (ksi) 0 3.855 0 3.855
(10,000 in) N 327 294 355 305Prep Work: Sealed UnSealed S 367 304 356 296
Ambient Temp (°F) 72 72 E 363 311 356 307Unwrap Time 10:25 AM 10:25 AM W 325 253 319 256
Cyl. Surf. Temp(°F) Age (days) 0.65 0.66 0.67 0.68Humidity (%) Gauge Correction 15 -14 -14 -14
Rod Temp (°F) 64 64 64 64Loading: ADJ - N 342 280 341 291
Ave E Mod = 4705 ksi ADJ - S 382 290 342 282Sustained Pressure = 3.855 ksi ADJ - E 378 297 342 293
ADJ - W 340 239 305 242 Δ Average N-S -77 -55
Δ Average E-W -91 -56Δ Ave-Ave (in) -84 -56
Concrete Strain -0.001225 -0.000818Ec (ksi) 3148 4715
Comments:
UnSealedDate 09/13/05 09/13/05 09/13/05 09/13/05Time 8:39 AM 8:45 AM 9:00 AM 9:15 AM
Ambient Temp (°F) 72 72 72 72Cyl. Surf. Temp(°F) 76
Gauge Load (psi) 0 7300 0 7300Stress (ksi) 0 3.855 0 3.855
(10,000 in) N 362 294 360 304S 392 331 387 323
E 345 293 336 283W 389 326 381 331
Age (days) 0.65 0.66 0.67 0.68
Gauge Correction 15 -14 -14 -14Rod Temp (°F) 64 64 64 64
ADJ - N 377 280 346 290ADJ - S 407 317 373 309
ADJ - E 360 279 322 269ADJ - W 404 312 367 317
Δ Average N-S -94 -60 Δ Average E-W -87 -52
Δ Ave-Ave (in) -90 -56Concrete Strain -0.001310 -0.000821
Ec (ksi) 2942 4695
Loading Procedure:Pump to gauge pressure of 7300 psi. Hand tighten nuts to snug. Add additional 1/4 turn of nuts with wrench. Take Reading.
D-9

Un-Loading: Creep Monitoring:Sealed 100% 0% Sealed 0% 100%
Date 01/11/06 01/11/06 Date 09/13/05 09/13/05 09/13/05Time 1:28 PM 2:50 PM Time 9:00 AM 9:15 AM 2:00 PM
Ambient Temp (°F) 49 49 Ambient Temp (°F) 72 72Cyl. Surf. Temp(°F) Cyl. Surf. Temp(°F) 77
Gauge Load (psi) 7300 0 (10,000 in) N 355 305 291Stress (ksi) 3.855 0 S 356 296 283
(10,000 in) N 308 361 E 356 307 294S 310 361 W 319 256 242
E 324 367 Age (days) 0.67 0.68 0.88W 278 329 Gauge Correction -14 -14 -13
Age (days) 120.85 120.91 Rod Temp (°F) 64 64 75Gauge Correction -73 -73 ADJ - N 341 291 278
Rod Temp (°F) 54 52 ADJ - S 342 282 270ADJ - N 235 288 ADJ - E 342 293 281ADJ - S 237 288 ADJ - W 305 242 229ADJ - E 251 294 Δ Average N-S 0 -55 -68
ADJ - W 205 256 Δ Average E-W 0 -56 -69 Δ Average N-S 52 Δ Ave-Ave 0 -56 -68
Δ Average E-W 47 Stress (ksi) 0 3.855 3.855Δ Ave-Ave (in) 50 Concrete Strain 0 -0.000818 -0.000996
Concrete Strain 0.000682 Ec Effective (ksi) 0 4715 3870Ec (ksi) 5649 Cc(t) 0 0 0.2184242
UnSealed UnSealedDate 01/11/06 01/11/06 Date 09/13/05 09/13/05 09/13/05Time 1:30 PM 2:52 PM Time 9:00 AM 9:15 AM 2:00 PM
Ambient Temp (°F) 49 49 Ambient Temp (°F) 72 72Cyl. Surf. Temp(°F) Cyl. Surf. Temp(°F) 73
Gauge Load (psi) 7300 0 (10,000 in) N 360 304 293Stress (ksi) 3.855 0 S 387 323 309
(10,000 in) N 315 363 E 336 283 277S 333 392 W 381 331 311
E 287 335 Age (days) 0.67 0.68 0.88W 346 395 Gauge Correction -14 -14 -13
Age (days) 120.85 120.91 Rod Temp (°F) 64 64 75
Gauge Correction -73 -73 ADJ - N 346 290 280Rod Temp (°F) 54 52 ADJ - S 373 309 296
ADJ - N 242 290 ADJ - E 322 269 264ADJ - S 260 319 ADJ - W 367 317 298
ADJ - E 214 262 Δ Average N-S 0 -60 -72ADJ - W 273 322 Δ Average E-W 0 -52 -64
Δ Average N-S 54 Δ Ave-Ave 0 -56 -68 Δ Average E-W 49 Stress (ksi) 0 3.855 3.855
Δ Ave-Ave (in) 51 Concrete Strain 0 -0.000821 -0.000989Concrete Strain 0.000704 Ec Effective (ksi) 0 4695 3898
Ec (ksi) 5477 Cc(t) 0 0 0.2044257
D-10

09/13/05 09/14/05 09/15/05 09/16/05 09/17/05 09/18/05 09/19/05 09/20/05 09/21/05 09/22/054:21 PM 11:58 AM 3:30 PM 11:10 AM 9:53 AM 6:52 PM 3:30 PM 10:47 AM 11:02 AM 7:55 PM
66 62 61 68 68 68 66 6477 65 68 65 63 71 69 67 65
442 435 685 842 830 834 841 837 836 834440 435 690 843 832 837 843 841 833 832442 447 680 840 832 844 841 840 842 840400 396 653 810 803 798 801 798 796 790
0.97 1.79 2.94 3.76 4.70 6.08 6.94 7.74 8.75 10.12-161 -161 -417 -571 -564 -569 -568 -567 -563 -56275 75 66 59 64 72 70 66 68 68
281 274 268 271 266 265 273 270 273 272279 274 273 272 268 268 275 274 270 270281 286 263 269 268 275 273 273 279 278239 235 236 239 239 229 233 231 233 228-62 -68 -71 -70 -75 -75 -68 -70 -70 -71-64 -63 -74 -70 -70 -72 -71 -72 -68 -71-63 -65 -73 -70 -72 -73 -69 -71 -69 -71
3.855 3.855 3.855 3.855 3.855 3.855 3.855 3.855 3.855 3.855-0.000918 -0.000957 -0.001060 -0.001021 -0.001057 -0.001071 -0.001010 -0.001032 -0.001007 -0.001032
4201 4029 3635 3775 3648 3599 3815 3736 3829 37360.1223175 0.1703708 0.2970568 0.2490035 0.2926884 0.3101623 0.2358981 0.262109 0.2315296 0.262109
09/13/05 09/14/05 09/15/05 09/16/05 09/17/05 09/18/05 09/19/05 09/20/05 09/21/05 09/22/054:21 PM 11:58 AM 3:32 PM 11:14 AM 9:30 AM 6:54 PM 3:33 PM 10:49 AM 11:04 AM 11:58 PM
66 62 61 68 68 68 66 6477 64 66 64 61 69 67 65 66
441 438 682 860 855 851 854 841 841 843463 455 709 865 857 862 868 860 858 857
419 408 668 822 811 816 819 811 807 807473 468 732 890 878 880 879 871 877 870
0.97 1.79 2.94 3.76 4.69 6.08 6.94 7.74 8.75 10.29-161 -161 -417 -571 -562 -569 -568 -567 -563 -56075 75 66 59 64 72 70 66 68 68
280 277 265 289 293 282 286 274 278 283302 294 292 294 295 293 300 293 295 297
258 247 251 251 249 247 251 244 244 247312 307 315 319 316 311 311 304 314 310
-69 -74 -81 -68 -66 -72 -67 -76 -73 -70-60 -68 -62 -60 -62 -66 -64 -71 -66 -66-64 -71 -71 -64 -64 -69 -65 -73 -69 -68
3.855 3.855 3.855 3.855 3.855 3.855 3.855 3.855 3.855 3.855-0.000939 -0.001035 -0.001043 -0.000935 -0.000935 -0.001007 -0.000953 -0.001071 -0.001014 -0.000993
4106 3723 3698 4121 4121 3829 4044 3599 3802 38840.1435329 0.2609689 0.2696679 0.1391834 0.1391834 0.2261731 0.1609308 0.3044638 0.2348721 0.2087752
D-11
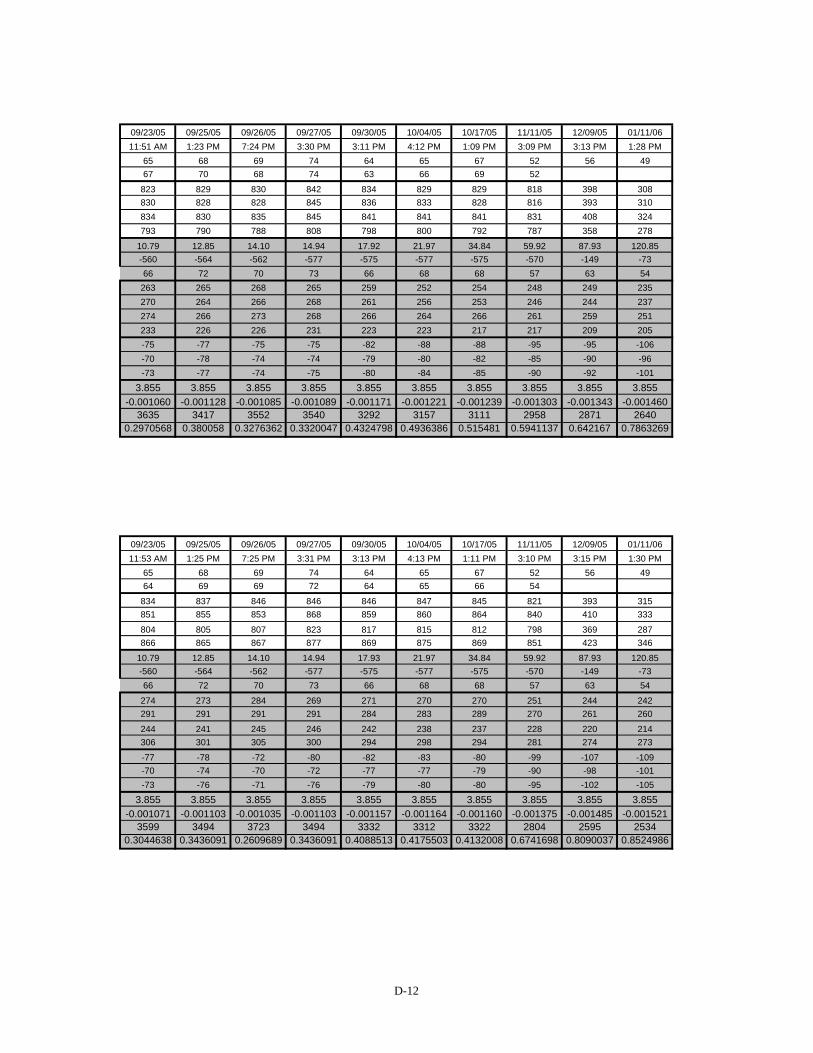
09/23/05 09/25/05 09/26/05 09/27/05 09/30/05 10/04/05 10/17/05 11/11/05 12/09/05 01/11/0611:51 AM 1:23 PM 7:24 PM 3:30 PM 3:11 PM 4:12 PM 1:09 PM 3:09 PM 3:13 PM 1:28 PM
65 68 69 74 64 65 67 52 56 4967 70 68 74 63 66 69 52
823 829 830 842 834 829 829 818 398 308830 828 828 845 836 833 828 816 393 310834 830 835 845 841 841 841 831 408 324793 790 788 808 798 800 792 787 358 278
10.79 12.85 14.10 14.94 17.92 21.97 34.84 59.92 87.93 120.85-560 -564 -562 -577 -575 -577 -575 -570 -149 -7366 72 70 73 66 68 68 57 63 54
263 265 268 265 259 252 254 248 249 235270 264 266 268 261 256 253 246 244 237274 266 273 268 266 264 266 261 259 251233 226 226 231 223 223 217 217 209 205-75 -77 -75 -75 -82 -88 -88 -95 -95 -106-70 -78 -74 -74 -79 -80 -82 -85 -90 -96-73 -77 -74 -75 -80 -84 -85 -90 -92 -101
3.855 3.855 3.855 3.855 3.855 3.855 3.855 3.855 3.855 3.855-0.001060 -0.001128 -0.001085 -0.001089 -0.001171 -0.001221 -0.001239 -0.001303 -0.001343 -0.001460
3635 3417 3552 3540 3292 3157 3111 2958 2871 26400.2970568 0.380058 0.3276362 0.3320047 0.4324798 0.4936386 0.515481 0.5941137 0.642167 0.7863269
09/23/05 09/25/05 09/26/05 09/27/05 09/30/05 10/04/05 10/17/05 11/11/05 12/09/05 01/11/0611:53 AM 1:25 PM 7:25 PM 3:31 PM 3:13 PM 4:13 PM 1:11 PM 3:10 PM 3:15 PM 1:30 PM
65 68 69 74 64 65 67 52 56 4964 69 69 72 64 65 66 54
834 837 846 846 846 847 845 821 393 315851 855 853 868 859 860 864 840 410 333
804 805 807 823 817 815 812 798 369 287866 865 867 877 869 875 869 851 423 346
10.79 12.85 14.10 14.94 17.93 21.97 34.84 59.92 87.93 120.85-560 -564 -562 -577 -575 -577 -575 -570 -149 -7366 72 70 73 66 68 68 57 63 54
274 273 284 269 271 270 270 251 244 242291 291 291 291 284 283 289 270 261 260
244 241 245 246 242 238 237 228 220 214306 301 305 300 294 298 294 281 274 273
-77 -78 -72 -80 -82 -83 -80 -99 -107 -109-70 -74 -70 -72 -77 -77 -79 -90 -98 -101-73 -76 -71 -76 -79 -80 -80 -95 -102 -105
3.855 3.855 3.855 3.855 3.855 3.855 3.855 3.855 3.855 3.855-0.001071 -0.001103 -0.001035 -0.001103 -0.001157 -0.001164 -0.001160 -0.001375 -0.001485 -0.001521
3599 3494 3723 3494 3332 3312 3322 2804 2595 25340.3044638 0.3436091 0.2609689 0.3436091 0.4088513 0.4175503 0.4132008 0.6741698 0.8090037 0.8524986
D-12

Gage Value - Sealed Cylinder
0
50
100
150
200
250
300
350
400
0 20 40 60 80 100 120 140
Age (days)
Adj
uste
d G
auge
Val
ue (1
/10,
000
in)
ADJ - NADJ - SADJ - EADJ - W
Gauge Value - UnSealed Cylinder
0
50
100
150
200
250
300
350
400
0 20 40 60 80 100 120 140
Age (days)
Adj
uste
d G
uage
Val
ue (1
/10,
000
in)
ADJ - NADJ - SADJ - EADJ - W
D-13

Δ - Sealed Cylinder
-120
-100
-80
-60
-40
-20
00 20 40 60 80 100 120 140
Age (days)
Gau
ge V
alue
Cha
nge
(1/1
0,00
0 in
)
D Average N-SD Average E-WD Ave-Ave
Δ - UnSealed Cylinder
-120
-100
-80
-60
-40
-20
00 20 40 60 80 100 120 140
Age (days)
Gau
ge V
alue
Cha
nge
(1/1
0,00
0 in
)
D Average N-SD Average E-WD Ave-Ave
D-14

Effective Elastic Modulus - Sealed
0
500
1000
1500
2000
2500
3000
3500
4000
4500
5000
0 20 40 60 80 100 120 140
Age (days)
Elas
tic M
od E
ff (k
si)
Ec Effective (ksi)
Effective Elastic Modulus - Unsealed
0
500
1000
1500
2000
2500
3000
3500
4000
4500
5000
0 20 40 60 80 100 120 140
Age (days)
Elas
tic M
od E
ff (k
si)
Ec Effective (ksi)
D-15

Creep Coefficient - Sealed
0
0.2
0.4
0.6
0.8
1
1.2
1.4
0 20 40 60 80 100 120 140
Age (days)
Cre
ep C
oeffi
cien
t
Cc(t)
Creep Coefficient - Unsealed
0
0.2
0.4
0.6
0.8
1
1.2
1.4
0 20 40 60 80 100 120 140
Age (days)
Cre
ep C
oeffi
cien
t
Cc(t)
D-16

G1D-MC-Release Initial Loading:Sealed 0% 100% 0% 100%
Girder Name: G1D Date 09/13/05 09/13/05 09/13/05 09/13/05Cast Date: 09/12/05 Time 3:40 PM 3:48 PM 3:58 PM 4:00 PMCast Time: 5:00 PM Ambient Temp (°F) 74 74 74 74Release date: 09/13/05 Cyl. Surf. Temp(°F) 73 73 73 73
Cylinder Loading: Release Gauge Load (psi) 0 4380 0 4380Cylinder Cure: MC Stress (ksi) 0 2.437 0 2.437
(10,000 in) N 490 392 480 378Prep Work: Sealed UnSealed S 505 450 505 440
Ambient Temp (°F) 70 70 E 489 427 484 424Unwrap Time 9:34 AM 9:34 AM W 655 550 645 540
Cyl. Surf. Temp(°F) 77 77 Age (days) 0.94 0.95 0.96 0.96Humidity (%) Gauge Correction -148 -148 -151 -148
Rod Temp (°F) 75 75 75 75Loading: ADJ - N 342 244 329 230
Ave E Mod = 3520 ksi ADJ - S 357 302 354 292Sustained Pressure = 2.437 ksi ADJ - E 341 279 333 276
ADJ - W 507 402 494 392 Δ Average N-S -77 -81
Δ Average E-W -84 -80Δ Ave-Ave (in) -80 -80
Concrete Strain -0.001158 -0.001158Ec (ksi) 2104 2104
Comments:
UnSealedDate 09/13/05 09/13/05 09/13/05 09/13/05Time 3:45 PM 3:48 PM 3:59 PM 4:00 PM
Ambient Temp (°F) 74 74 74 74Cyl. Surf. Temp(°F) 73 73 73 73
Gauge Load (psi) 0 4380 0 4380Stress (ksi) 0 2.437 0 2.437
(10,000 in) N 512 424 495 413S 397 308 392 298
E 473 399 468 389W 375 285 360 285
Age (days) 0.95 0.95 0.96 0.96
Gauge Correction -148 -148 -151 -148Rod Temp (°F) 75 75 75 75
ADJ - N 364 276 344 265ADJ - S 249 160 241 150
ADJ - E 325 251 317 241ADJ - W 227 137 209 137
Δ Average N-S -89 -85 Δ Average E-W -82 -74
Δ Ave-Ave (in) -85 -80Concrete Strain -0.001233 -0.001151
Ec (ksi) 1976 2117
Loading Procedure:Pump to gauge pressure of 4380 psi. Hand tighten nuts to snug. Addadditional 1/4 turn of nuts with wrench. Take reading.
D-17

Un-Loading:0% 100% Sealed 100% 0%
09/13/05 09/13/05 Date 01/11/06 01/11/064:10 PM 4:19 PM Time 1:24 PM 2:32 PM
Ambient Temp (°F) 50 49Cyl. Surf. Temp(°F)
0 4380 Gauge Load (psi) 4380 00 2.437 Stress (ksi) 2.437 0
484 430 (10,000 in) N 293 318518 479 S 349 376
496 465 E 338 361645 585 W 451 4810.97 0.97 Age (days) 120.85 120.90-163 -164 Gauge Correction -73 -7375 75 Rod Temp (°F) 54 54
321 266 ADJ - N 220 245355 315 ADJ - S 276 303333 301 ADJ - E 265 288482 421 ADJ - W 378 408
-48 Δ Average N-S 26
-47 Δ Average E-W 27-47 Δ Ave-Ave (in) 26
-0.000687 Concrete Strain 0.0003593547 Ec (ksi) 6781
UnSealed09/13/05 09/13/05 Date 01/11/06 01/11/064:10 PM 4:10 PM Time 1:26 PM 2:34 PM
Ambient Temp (°F) 50 49Cyl. Surf. Temp(°F)
0 4380 Gauge Load (psi) 4380 00 2.437 Stress (ksi) 2.437 0
500 456 (10,000 in) N 297 326402 348 S 177 212
475 433 E 287 313365 314 W 144 1780.97 0.97 Age (days) 120.85 120.90
-163 -163 Gauge Correction -73 -7375 75 Rod Temp (°F) 54 52
337 293 ADJ - N 224 253239 185 ADJ - S 104 139
312 270 ADJ - E 214 240202 151 ADJ - W 71 105
-49 Δ Average N-S 32
-47 Δ Average E-W 30-48 Δ Ave-Ave (in) 31
-0.000698 Concrete Strain 0.0004273493 Ec (ksi) 5704
D-18

Creep Monitoring:Sealed 0% 100%
Date 09/13/05 09/13/05 09/14/05 03/15/05 09/16/05 09/17/05 09/18/05 09/19/05Time 4:10 PM 4:19 PM 12:32 PM 3:37 PM 11:19 AM 10:02 AM 6:58 PM 3:36 PM
Ambient Temp (°F) 66 62 60 68 68Cyl. Surf. Temp(°F) 69 69 64 64 69 71
(10,000 in) N 484 430 408 832 823 804 816 805S 518 479 454 873 868 856 856 855E 496 465 452 865 864 850 853 852
W 645 585 558 955 962 944 949 961
Age (days) 0.97 0.97 1.81 -181.06 3.76 4.71 6.08 6.94Gauge Correction -163 -164 -158 #N/A -571 -562 -570 -572
Rod Temp (°F) 75 75 66 #N/A 59 64 70 70ADJ - N 321 266 250 #N/A 252 242 246 233ADJ - S 355 315 296 #N/A 297 294 286 283ADJ - E 333 301 294 #N/A 293 288 283 280
ADJ - W 482 421 400 #N/A 391 382 379 389Δ Average N-S 0 -48 -65 #N/A -64 -70 -72 -80
Δ Average E-W 0 -47 -61 #N/A -66 -73 -77 -73Δ Ave-Ave 0 -47 -63 #N/A -65 -71 -74 -77
Stress (ksi) 0 2.437 2.437 2.437 2.437 2.437 2.437 2.437Concrete Strain 0 -0.000687 -0.000912 #N/A -0.000937 -0.001033 -0.001076 -0.001108
Ec Effective (ksi) 0 3547 2672 #N/A 2601 2358 2264 2199Cc(t) 0 0 0.3274942 #N/A 0.3638825 0.5042372 0.566617 0.6134019
UnSealedDate 09/13/05 09/13/05 09/14/05 09/15/05 09/16/05 09/17/05 09/18/05 09/19/05Time 4:10 PM 4:10 PM 12:35 PM 3:39 PM 11:22 AM 10:02 AM 6:59 PM 3:38 PM
Ambient Temp (°F) 66 62 60 68 68Cyl. Surf. Temp(°F) 67 67 64 62 69 69
(10,000 in) N 500 456 425 850 837 825 834 829S 402 348 316 740 730 739 719 721
E 475 433 416 832 819 814 814 814W 365 314 274 702 691 681 681 681
Age (days) 0.97 0.97 1.82 2.94 3.77 4.71 6.08 6.94Gauge Correction -163 -163 -158 -577 -571 -562 -570 -572
Rod Temp (°F) 75 75 66 66 59 64 70 70
ADJ - N 337 293 267 273 266 263 264 257ADJ - S 239 185 158 163 159 177 149 149
ADJ - E 312 270 258 255 248 252 244 242ADJ - W 202 151 116 125 120 119 111 109
Δ Average N-S 0 -49 -76 -70 -76 -68 -82 -85Δ Average E-W 0 -47 -70 -67 -73 -72 -80 -82
Δ Ave-Ave 0 -48 -73 -69 -74 -70 -81 -83
Stress (ksi) 0 2.437 2.437 2.437 2.437 2.437 2.437 2.437Concrete Strain 0 -0.000698 -0.001055 -0.000994 -0.001076 -0.001012 -0.001166 -0.001205
Ec Effective (ksi) 0 3493 2310 2451 2264 2408 2091 2023Cc(t) 0 0 0.5118499 0.4248354 0.5425608 0.4504279 0.6705233 0.7268268
D-19

09/20/05 09/21/05 09/22/05 09/23/05 09/25/05 09/26/05 09/27/05 09/30/05 10/04/05 10/17/0510:52 AM 11:06 AM 8:02 PM 11:55 AM 1:19 PM 7:20 PM 3:28 PM 3:07 PM 4:07 PM 1:05 PM
67 66 64 64 68 69 74 64 64 6768 69 66 67 69 70 73 65 66 69
800 801 799 795 797 800 815 808 806 805852 853 853 849 851 851 865 858 860 856848 845 846 842 843 842 861 854 853 852946 950 937 943 942 932 955 940 931 945
7.74 8.75 10.13 10.79 12.85 14.10 14.94 17.92 21.96 34.84-568 -563 -561 -560 -563 -562 -577 -575 -578 -57668 68 68 66 70 70 73 66 68 68
232 238 238 235 234 238 238 233 228 229284 290 292 289 288 289 288 283 282 280280 282 285 282 280 280 284 279 275 276378 387 376 383 379 370 378 365 353 369-80 -74 -73 -76 -77 -75 -75 -80 -83 -84-79 -73 -77 -75 -78 -83 -77 -86 -94 -85-79 -74 -75 -76 -78 -79 -76 -83 -88 -84
2.437 2.437 2.437 2.437 2.437 2.437 2.437 2.437 2.437 2.437-0.001148 -0.001066 -0.001087 -0.001094 -0.001123 -0.001137 -0.001098 -0.001198 -0.001276 -0.001219
2123 2287 2242 2227 2171 2143 2220 2035 1909 19990.6705835 0.5510221 0.582212 0.5926086 0.6341952 0.6549885 0.597807 0.74336 0.857723 0.7745499
09/20/05 09/21/05 09/22/05 09/23/05 09/25/05 09/26/05 09/27/05 09/30/05 10/04/05 10/17/0510:54 AM 11:08 AM 8:04 PM 8:16 PM 1:21 PM 7:21 PM 3:29 PM 3:10 PM 4:08 PM 1:07 PM
67 66 64 64 68 69 74 64 64 6767 66 66 64 68 70 72 64 65 67
825 822 818 817 817 817 832 824 824 823707 708 707 704 701 701 716 706 708 704
808 805 802 801 801 801 815 810 810 808676 670 667 663 663 664 677 671 669 665
7.75 8.76 10.13 11.14 12.85 14.10 14.94 17.92 21.96 34.84-568 -563 -561 -560 -563 -562 -577 -575 -578 -57668 68 68 66 70 70 73 66 68 68
257 259 257 257 254 255 255 249 246 247139 145 146 144 138 139 139 131 130 128
240 242 241 241 238 239 238 235 232 232108 107 106 103 100 102 100 96 91 89
-90 -86 -87 -88 -92 -91 -91 -98 -100 -101-83 -83 -84 -85 -88 -87 -88 -92 -96 -97-87 -84 -85 -86 -90 -89 -90 -95 -98 -99
2.437 2.437 2.437 2.437 2.437 2.437 2.437 2.437 2.437 2.437-0.001251 -0.001219 -0.001230 -0.001248 -0.001301 -0.001283 -0.001294 -0.001369 -0.001412 -0.001423
1948 1999 1981 1953 1873 1899 1883 1780 1726 17130.7933673 0.7473008 0.7626563 0.7882488 0.8650263 0.8394338 0.8547893 0.9622777 1.0236997 1.0390552
D-20
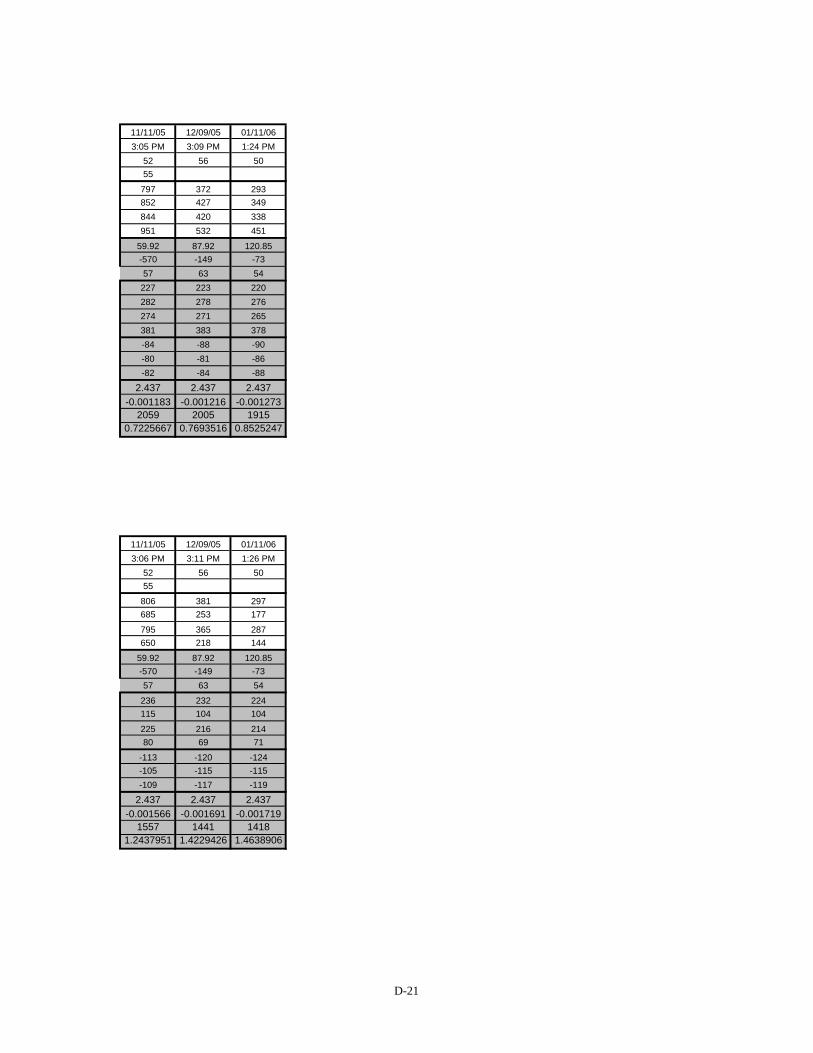
11/11/05 12/09/05 01/11/063:05 PM 3:09 PM 1:24 PM
52 56 5055
797 372 293852 427 349844 420 338951 532 451
59.92 87.92 120.85-570 -149 -7357 63 54
227 223 220282 278 276274 271 265381 383 378-84 -88 -90-80 -81 -86-82 -84 -88
2.437 2.437 2.437-0.001183 -0.001216 -0.001273
2059 2005 19150.7225667 0.7693516 0.8525247
11/11/05 12/09/05 01/11/063:06 PM 3:11 PM 1:26 PM
52 56 5055
806 381 297685 253 177
795 365 287650 218 144
59.92 87.92 120.85-570 -149 -7357 63 54
236 232 224115 104 104
225 216 21480 69 71
-113 -120 -124-105 -115 -115-109 -117 -119
2.437 2.437 2.437-0.001566 -0.001691 -0.001719
1557 1441 14181.2437951 1.4229426 1.4638906
D-21

Gage Value - Sealed Cylinder
0
50
100
150
200
250
300
350
400
450
0 20 40 60 80 100 120 140
Age (days)
Adj
uste
d G
auge
Val
ue (1
/10,
000
in)
ADJ - NADJ - SADJ - EADJ - W
Gauge Value - UnSealed Cylinder
0
50
100
150
200
250
300
350
400
0 20 40 60 80 100 120 140
Age (days)
Adj
uste
d G
uage
Val
ue (1
/10,
000
in)
ADJ - NADJ - SADJ - EADJ - W
D-22

Δ - Sealed Cylinder
-100
-90
-80
-70
-60
-50
-40
-30
-20
-10
00 20 40 60 80 100 120 140
Age (days)
Gau
ge V
alue
Cha
nge
(1/1
0,00
0 in
)
D Average N-SD Average E-WD Ave-Ave
Δ - UnSealed Cylinder
-140
-120
-100
-80
-60
-40
-20
00 20 40 60 80 100 120 140
Age (days)
Gau
ge V
alue
Cha
nge
(1/1
0,00
0 in
)
D Average N-SD Average E-WD Ave-Ave
D-23

Effective Elastic Modulus - Sealed
0
500
1000
1500
2000
2500
3000
3500
4000
0 20 40 60 80 100 120 140
Age (days)
Elas
tic M
od E
ff (k
si)
Ec Effective (ksi)
Effective Elastic Modulus - Unsealed
0
500
1000
1500
2000
2500
3000
3500
4000
0 20 40 60 80 100 120 140
Age (days)
Elas
tic M
od E
ff (k
si)
Ec Effective (ksi)
D-24

Creep Coefficient - Sealed
0
0.2
0.4
0.6
0.8
1
1.2
1.4
0 20 40 60 80 100 120 140
Age (days)
Cre
ep C
oeffi
cien
t
Cc(t)
Creep Coefficient - Unsealed
0
0.2
0.4
0.6
0.8
1
1.2
1.4
0 20 40 60 80 100 120 140
Age (days)
Cre
ep C
oeffi
cien
t
Cc(t)
D-25

G1D-AC-3Day Initial Loading:Sealed 0% 100% 0% 100%
Girder Name: G1D Date 09/15/05 09/15/05 09/15/05 09/15/05Cast Date: 09/12/05 Time 2:58 PM 3:04 PM 3:08 PM 3:16 PMCast Time: 5:00 PM Ambient Temp (°F) 66 66 66 66Release date: 09/13/05 Cyl. Surf. Temp(°F) 67 67 67 67
Cylinder Loading: 3Day Gauge Load (psi) 0 7700 0 7700Cylinder Cure: AC Stress (ksi) 0 3.868 0 3.868
(10,000 in) N 652 594 652 557Prep Work: Sealed UnSealed S 727 689 722 652
Ambient Temp (°F) E 649 604 643 566Unwrap Time 6:40 AM W 658 604 656 569
Cyl. Surf. Temp(°F) Age (days) 2.92 2.92 2.92 2.93Humidity (%) Gauge Correction -306 -306 -305 -269
Rod Temp (°F) 66 66 66 66Loading: ADJ - N 346 288 347 288
Ave E Mod = 5734 ksi ADJ - S 421 383 417 383Sustained Pressure = 3.868 ksi ADJ - E 343 298 338 297
ADJ - W 352 298 351 300 Δ Average N-S -48 -47
Δ Average E-W -50 -46Δ Ave-Ave (in) -49 -46
Concrete Strain -0.000721 -0.000685Ec (ksi) 5363 5643
Comments:
UnSealedDate 09/15/05 09/15/05 09/15/05 09/15/05Time 2:59 PM 3:05 PM 3:10 PM 3:17 PM
Ambient Temp (°F) 66 66 66 66Cyl. Surf. Temp(°F) 67 67 67 67
Gauge Load (psi) 0 7700 0 7700Stress (ksi) 0 3.868 0 3.868
(10,000 in) N 678 647 681 615S 668 587 648 555
E 676 616 671 584W 662 612 662 585
Age (days) 2.92 2.92 2.92 2.93
Gauge Correction -306 -306 -305 -269Rod Temp (°F) 66 66 66 66
ADJ - N 372 341 376 346ADJ - S 362 281 343 286
ADJ - E 370 310 366 315ADJ - W 356 306 357 316
Δ Average N-S -56 -44 Δ Average E-W -55 -46
Δ Ave-Ave (in) -56 -45Concrete Strain -0.000818 -0.000664
Ec (ksi) 4731 5825
Loading Procedure:Pump to gauge pressure of 7700 psi. Hand tighten nuts as snug as possible. Take redings.
After a Load Cell calibration, it was noticed that the load cell was reading approximately 4kips lower that the pump reading of 50k. It was also concluded that 1/4 turn of the nut with the wrench would induce 2.5kips of force into the Load Cell. By hand tightening the nuts, the pressure applied to the cylinders after the pump was released was closer to the applied pressure. The settling of the nut was minor incomparison to the force applied. Therefore adjustments need to be made to the actual applied force in the release cylinders o the calculation represent what was applied.
D-26
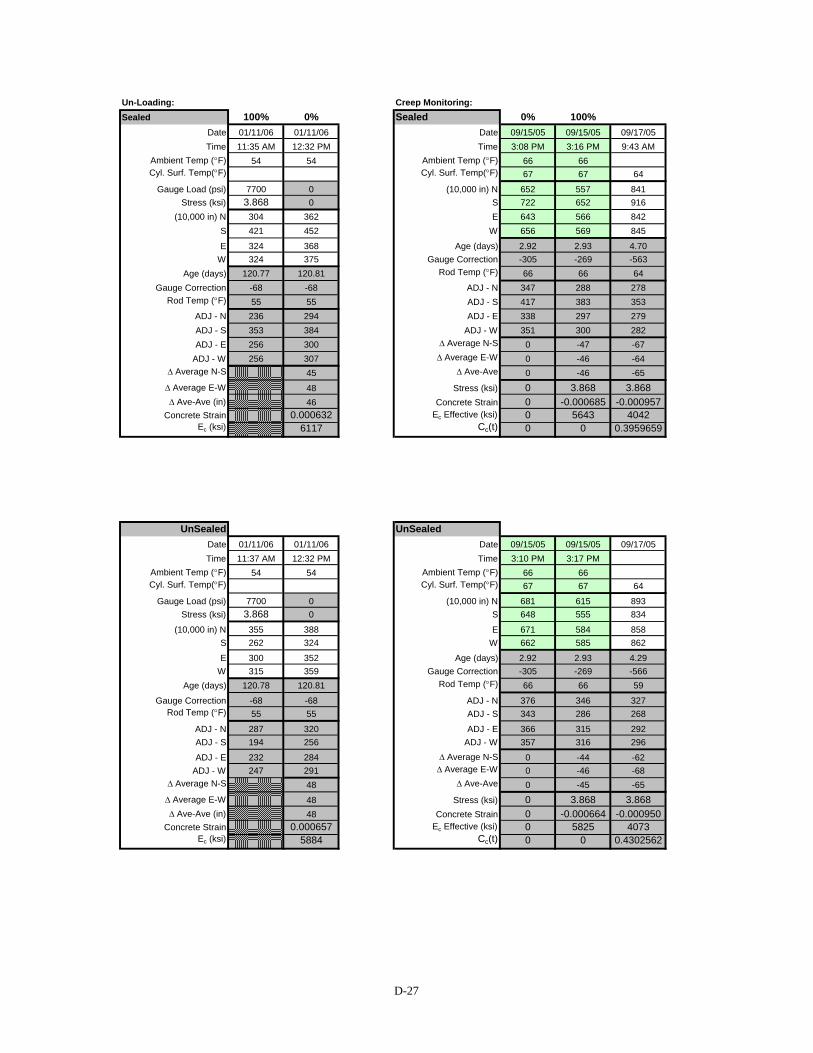
Un-Loading: Creep Monitoring:Sealed 100% 0% Sealed 0% 100%
Date 01/11/06 01/11/06 Date 09/15/05 09/15/05 09/17/05Time 11:35 AM 12:32 PM Time 3:08 PM 3:16 PM 9:43 AM
Ambient Temp (°F) 54 54 Ambient Temp (°F) 66 66Cyl. Surf. Temp(°F) Cyl. Surf. Temp(°F) 67 67 64
Gauge Load (psi) 7700 0 (10,000 in) N 652 557 841Stress (ksi) 3.868 0 S 722 652 916
(10,000 in) N 304 362 E 643 566 842S 421 452 W 656 569 845
E 324 368 Age (days) 2.92 2.93 4.70W 324 375 Gauge Correction -305 -269 -563
Age (days) 120.77 120.81 Rod Temp (°F) 66 66 64Gauge Correction -68 -68 ADJ - N 347 288 278
Rod Temp (°F) 55 55 ADJ - S 417 383 353ADJ - N 236 294 ADJ - E 338 297 279ADJ - S 353 384 ADJ - W 351 300 282ADJ - E 256 300 Δ Average N-S 0 -47 -67
ADJ - W 256 307 Δ Average E-W 0 -46 -64 Δ Average N-S 45 Δ Ave-Ave 0 -46 -65
Δ Average E-W 48 Stress (ksi) 0 3.868 3.868Δ Ave-Ave (in) 46 Concrete Strain 0 -0.000685 -0.000957
Concrete Strain 0.000632 Ec Effective (ksi) 0 5643 4042Ec (ksi) 6117 Cc(t) 0 0 0.3959659
UnSealed UnSealedDate 01/11/06 01/11/06 Date 09/15/05 09/15/05 09/17/05Time 11:37 AM 12:32 PM Time 3:10 PM 3:17 PM
Ambient Temp (°F) 54 54 Ambient Temp (°F) 66 66Cyl. Surf. Temp(°F) Cyl. Surf. Temp(°F) 67 67 64
Gauge Load (psi) 7700 0 (10,000 in) N 681 615 893Stress (ksi) 3.868 0 S 648 555 834
(10,000 in) N 355 388 E 671 584 858S 262 324 W 662 585 862
E 300 352 Age (days) 2.92 2.93 4.29W 315 359 Gauge Correction -305 -269 -566
Age (days) 120.78 120.81 Rod Temp (°F) 66 66 59
Gauge Correction -68 -68 ADJ - N 376 346 327Rod Temp (°F) 55 55 ADJ - S 343 286 268
ADJ - N 287 320 ADJ - E 366 315 292ADJ - S 194 256 ADJ - W 357 316 296
ADJ - E 232 284 Δ Average N-S 0 -44 -62ADJ - W 247 291 Δ Average E-W 0 -46 -68
Δ Average N-S 48 Δ Ave-Ave 0 -45 -65 Δ Average E-W 48 Stress (ksi) 0 3.868 3.868
Δ Ave-Ave (in) 48 Concrete Strain 0 -0.000664 -0.000950Concrete Strain 0.000657 Ec Effective (ksi) 0 5825 4073
Ec (ksi) 5884 Cc(t) 0 0 0.4302562
D-27

09/18/05 09/19/05 09/20/05 09/21/05 09/22/05 09/23/05 09/25/05 09/26/05 09/27/05 09/30/057:16 PM 3:44 PM 11:12 AM 10:37 AM 7:22 PM 11:38 AM 12:51 PM 6:56 PM 3:11 PM 2:51 PM
67 68 68 64 66 63 67 70 75 6470 68 69 66 67 65 67 71 73 67
843 830 827 829 828 823 823 825 822 833935 937 932 934 931 932 928 931 928 941849 856 849 846 841 842 838 843 841 849856 856 848 849 844 843 842 846 847 857
6.09 6.95 7.76 8.73 10.10 10.78 12.83 14.08 14.92 17.91-570 -571 -569 -561 -561 -559 -561 -561 -563 -57370 72 68 66 66 64 68 72 72 64
273 259 258 268 267 264 262 264 259 260365 366 363 373 370 373 367 370 365 368279 285 280 285 280 283 277 282 278 276286 285 279 288 283 284 281 285 284 284-63 -70 -72 -62 -64 -64 -68 -65 -70 -68-62 -60 -65 -58 -63 -61 -66 -61 -64 -65-63 -65 -68 -60 -63 -62 -67 -63 -67 -66
3.868 3.868 3.868 3.868 3.868 3.868 3.868 3.868 3.868 3.868-0.000918 -0.000946 -0.001000 -0.000878 -0.000928 -0.000914 -0.000975 -0.000925 -0.000978 -0.000971
4215 4088 3869 4404 4167 4232 3968 4183 3954 39830.338655 0.3803357 0.4584868 0.2813442 0.3542853 0.333445 0.4220163 0.3490752 0.4272264 0.4168062
09/18/05 09/19/05 09/20/05 09/21/05 09/22/05 09/23/05 09/25/05 09/26/05 09/27/05 09/30/057:17 PM 3:46 PM 11:14 AM 10:40 AM 7:26 PM 11:39 AM 12:53 PM 6:57 PM 3:12 PM 2:52 PM
67 68 68 64 66 63 67 70 75 6469 69 66 63 67 62 64 70 69 65
892 892 889 884 882 878 877 879 879 888833 827 820 817 815 811 809 809 812 816
856 856 849 849 843 841 838 839 838 847866 860 856 851 852 846 846 849 845 857
6.10 6.95 7.76 8.74 10.10 10.78 12.83 14.08 14.92 17.91-570 -571 -569 -561 -561 -559 -561 -561 -563 -57370 72 68 66 66 64 68 72 72 64
322 321 320 323 321 319 316 318 316 315263 256 251 256 254 252 248 248 249 243
286 285 280 288 282 282 277 278 275 274296 289 287 290 291 287 285 288 282 284
-67 -71 -74 -70 -72 -74 -78 -77 -77 -81-71 -75 -78 -73 -75 -77 -81 -79 -83 -83-69 -73 -76 -71 -74 -76 -79 -78 -80 -82
3.868 3.868 3.868 3.868 3.868 3.868 3.868 3.868 3.868 3.868-0.001007 -0.001064 -0.001110 -0.001043 -0.001075 -0.001103 -0.001153 -0.001132 -0.001168 -0.001189
3841 3635 3483 3710 3599 3506 3354 3417 3313 32530.5163075 0.6023587 0.6722753 0.5700895 0.6184933 0.6615189 0.7368138 0.7045445 0.7583266 0.7905958
D-28

10/04/05 10/17/05 11/11/05 12/09/05 01/11/063:46 PM 12:44 PM 2:44 PM 2:35 PM 11:35 AM
65 65 54 59 5468 67 56
832 828 819 392 304941 943 936 504 421851 853 842 413 324856 852 839 412 324
21.95 34.82 59.91 87.90 120.77 #N/A #N/A-576 -575 -571 -149 -68 #N/A #N/A68 66 57 63 55 #N/A #N/A
256 253 248 243 236 #N/A #N/A365 368 365 355 353 #N/A #N/A275 278 271 264 256 #N/A #N/A280 277 268 263 256 #N/A #N/A-72 -72 -76 -83 -88 #N/A #N/A-67 -67 -75 -81 -89 #N/A #N/A-69 -69 -75 -82 -88 #N/A #N/A
3.868 3.868 3.868 3.868 3.868 3.868 3.868-0.001014 -0.001014 -0.001100 -0.001196 -0.001282 #N/A #N/A
3814 3814 3517 3234 3017 #N/A #N/A0.4793271 0.4793271 0.604369 0.7450411 0.8700829 #N/A #N/A
10/04/05 10/17/05 11/11/05 12/09/05 01/11/063:47 PM 12:46 PM 2:45 PM 2:36 PM 11:37 AM
65 65 54 59 5464 65 57
887 882 868 438 355812 805 783 349 262
843 836 820 387 300852 849 836 401 315
21.95 34.82 59.91 87.90 120.78 #N/A #N/A-576 -575 -571 -149 -68 #N/A #N/A68 66 57 63 55 #N/A #N/A
311 307 297 289 287 #N/A #N/A236 230 212 200 194 #N/A #N/A
267 261 249 238 232 #N/A #N/A276 274 265 252 247 #N/A #N/A
-86 -91 -105 -115 -119 #N/A #N/A-90 -94 -105 -117 -122 #N/A #N/A-88 -93 -105 -116 -121 #N/A #N/A
3.868 3.868 3.868 3.868 3.868 3.868 3.868-0.001282 -0.001346 -0.001521 -0.001678 -0.001746 #N/A #N/A
3017 2873 2543 2305 2215 #N/A #N/A0.9304291 1.0272367 1.2907686 1.5274095 1.6295954 #N/A #N/A
D-29

Gage Value - Sealed Cylinder
0
50
100
150
200
250
300
350
400
450
0 20 40 60 80 100 120 140
Age (days)
Adj
uste
d G
auge
Val
ue (1
/10,
000
in)
ADJ - NADJ - SADJ - EADJ - W
Gauge Value - UnSealed Cylinder
0
50
100
150
200
250
300
350
400
0 20 40 60 80 100 120 140
Age (days)
Adj
uste
d G
uage
Val
ue (1
/10,
000
in)
ADJ - NADJ - SADJ - EADJ - W
D-30

Δ - Sealed Cylinder
-100
-90
-80
-70
-60
-50
-40
-30
-20
-10
00 20 40 60 80 100 120 140
Age (days)
Gau
ge V
alue
Cha
nge
(1/1
0,00
0 in
)
D Average N-SD Average E-WD Ave-Ave
Δ - UnSealed Cylinder
-140
-120
-100
-80
-60
-40
-20
00 20 40 60 80 100 120 140
Age (days)
Gau
ge V
alue
Cha
nge
(1/1
0,00
0 in
)
D Average N-SD Average E-WD Ave-Ave
D-31

Effective Elastic Modulus - Sealed
0
1000
2000
3000
4000
5000
6000
0 20 40 60 80 100 120 140
Age (days)
Elas
tic M
od E
ff (k
si)
Ec Effective (ksi)
Effective Elastic Modulus - Unsealed
0
1000
2000
3000
4000
5000
6000
7000
0 20 40 60 80 100 120 140
Age (days)
Elas
tic M
od E
ff (k
si)
Ec Effective (ksi)
D-32

Creep Coefficient - Sealed
0
0.2
0.4
0.6
0.8
1
1.2
1.4
1.6
1.8
2
0 20 40 60 80 100 120 140
Age (days)
Cre
ep C
oeffi
cien
t
Cc(t)
Creep Coefficient - Unsealed
0
0.2
0.4
0.6
0.8
1
1.2
1.4
1.6
1.8
2
0 20 40 60 80 100 120 140
Age (days)
Cre
ep C
oeffi
cien
t
Cc(t)
D-33

G1D-MC-3Day Initial Loading:Sealed 0% 100% 0% 100%
Girder Name: G1D Date 09/15/05 09/15/05 09/15/05 09/15/05Cast Date: 09/12/05 Time 1:55 PM 1:59 PM 2:08 PM 2:13 PMCast Time: 5:00 PM Ambient Temp (°F) 66 66 66 66Release date: 09/13/05 Cyl. Surf. Temp(°F) 66 66 66 66
Cylinder Loading: 3Day Gauge Load (psi) 0 4620 0 4620Cylinder Cure: MC Stress (ksi) 0 2.365 0 2.365
(10,000 in) N 560 520 558 517Prep Work: Sealed UnSealed S 559 529 559 526
Ambient Temp (°F) 70 70 E 545 519 542 513Unwrap Time 9:34 AM 9:34 AM W 523 479 523 475
Cyl. Surf. Temp(°F) 77 77 Age (days) 2.87 2.87 2.88 2.88Humidity (%) Gauge Correction -150 -150 -150 -150
Rod Temp (°F) 68 68 66 66Loading: ADJ - N 410 370 408 367
Ave E Mod = 4397 ksi ADJ - S 409 379 409 376Sustained Pressure = 2.365 ksi ADJ - E 395 369 392 363
ADJ - W 373 329 373 325 Δ Average N-S -35 -37
Δ Average E-W -35 -39Δ Ave-Ave (in) -35 -38
Concrete Strain -0.000515 -0.000554Ec (ksi) 4591 4266
Comments:
UnSealedDate 09/15/05 09/15/05 09/15/05 09/15/05Time 1:57 PM 2:01 PM 2:09 PM 2:14 PM
Ambient Temp (°F) 66 66 66 66Cyl. Surf. Temp(°F) 65 66 66 66
Gauge Load (psi) 0 4620 0 4620Stress (ksi) 0 2.365 0 2.365
(10,000 in) N 557 526 557 526S 558 512 561 524
E 514 471 512 468W 503 470 505 475
Age (days) 2.87 2.88 2.88 2.88
Gauge Correction -150 -150 -150 -150Rod Temp (°F) 68 68 66 66
ADJ - N 407 376 407 376ADJ - S 408 362 411 374
ADJ - E 364 321 362 318ADJ - W 353 320 355 325
Δ Average N-S -39 -34 Δ Average E-W -38 -37
Δ Ave-Ave (in) -38 -36Concrete Strain -0.000562 -0.000522
Ec (ksi) 4211 4528
Loading Procedure:Pump to guge pressure of 7700 psi. Hand tighten nuts to snug. Take reading.
D-34

Un-Loading: Creep Monitoring:Sealed 100% 0% Sealed 0% 100%
Date 01/11/06 01/11/06 Date 09/15/05 09/15/05 09/15/05Time 11:39 AM 11:59 AM Time 2:08 PM 2:13 PM 2:53 PM
Ambient Temp (°F) 54 54 Ambient Temp (°F) 66 66 66Cyl. Surf. Temp(°F) Cyl. Surf. Temp(°F) 66 66 67
Gauge Load (psi) 4620 0 (10,000 in) N 558 517 670Stress (ksi) 2.365 0 S 559 526 683
(10,000 in) N 396 425 E 542 513 672S 411 435 W 523 475 627
E 391 411 Age (days) 2.88 2.88 2.91W 347 381 Gauge Correction -150 -150 -306
Age (days) 120.78 120.79 Rod Temp (°F) 66 66 66Gauge Correction -68 -68 ADJ - N 408 367 364
Rod Temp (°F) 55 55 ADJ - S 409 376 377ADJ - N 328 357 ADJ - E 392 363 366ADJ - S 343 367 ADJ - W 373 325 321ADJ - E 323 343 Δ Average N-S 0 -37 -38
ADJ - W 279 313 Δ Average E-W 0 -39 -39 Δ Average N-S 27 Δ Ave-Ave 0 -38 -39
Δ Average E-W 27 Stress (ksi) 0 2.365 2.365Δ Ave-Ave (in) 27 Concrete Strain 0 -0.000554 -0.000565
Concrete Strain 0.000367 Ec Effective (ksi) 0 4266 4185Ec (ksi) 6444 Cc(t) 0 0 0.0193248
UnSealed UnSealedDate 01/11/06 01/11/06 Date 09/15/05 09/15/05 09/15/05Time 11:41 AM 12:01 PM Time 2:09 PM 2:14 PM 2:54 PM
Ambient Temp (°F) 54 54 Ambient Temp (°F) 66 66 66Cyl. Surf. Temp(°F) Cyl. Surf. Temp(°F) 66 66 67
Gauge Load (psi) 4320 0 (10,000 in) N 557 526 681Stress (ksi) 2.365 0 S 561 524 669
(10,000 in) N 386 411 E 512 468 624S 358 398 W 505 475 625
E 311 349 Age (days) 2.88 2.88 2.91W 333 361 Gauge Correction -150 -150 -306
Age (days) 120.78 120.79 Rod Temp (°F) 66 66 66
Gauge Correction -68 -68 ADJ - N 407 376 375Rod Temp (°F) 55 55 ADJ - S 411 374 363
ADJ - N 318 343 ADJ - E 362 318 318ADJ - S 290 330 ADJ - W 355 325 319
ADJ - E 243 281 Δ Average N-S 0 -34 -40ADJ - W 265 293 Δ Average E-W 0 -37 -40
Δ Average N-S 33 Δ Ave-Ave 0 -36 -40 Δ Average E-W 33 Stress (ksi) 0 2.365 2.365
Δ Ave-Ave (in) 33 Concrete Strain 0 -0.000522 -0.000587Concrete Strain 0.000453 Ec Effective (ksi) 0 4528 4032
Ec (ksi) 5224 Cc(t) 0 0 0.1230848
D-35

09/17/05 09/18/05 09/19/05 09/20/05 09/21/05 09/22/05 09/23/05 09/25/05 09/26/05 09/27/0510:47 AM 7:10 PM 3:41 PM 11:08 AM 10:44 AM 7:29 PM 11:41 AM 12:56 PM 6:59 PM 3:14 PM
67 68 70 64 66 63 67 70 7564 69 71 71 65 67 65 67 70 7000
916 915 916 908 912 908 907 905 902 916928 928 928 923 925 920 923 917 924 933912 921 920 917 914 908 908 904 912 925862 876 875 872 869 867 863 863 862 876
4.74 6.09 6.95 7.76 8.74 10.10 10.78 12.83 14.08 14.93-562 -570 -572 -569 -562 -562 -559 -562 -562 -57763 70 70 68 66 68 64 68 72 73
354 345 344 339 350 346 348 343 340 339366 358 356 354 363 358 364 355 362 356350 351 348 348 352 346 349 342 350 348300 306 303 303 307 305 304 301 300 299-49 -57 -59 -62 -52 -57 -53 -60 -58 -61-58 -54 -57 -57 -53 -57 -56 -61 -58 -59-53 -56 -58 -60 -53 -57 -54 -60 -58 -60
2.365 2.365 2.365 2.365 2.365 2.365 2.365 2.365 2.365 2.365-0.000772 -0.000808 -0.000840 -0.000865 -0.000765 -0.000826 -0.000790 -0.000876 -0.000837 -0.000872
3062 2927 2815 2734 3091 2864 2993 2700 2827 27110.3929382 0.4573543 0.5153288 0.5604201 0.380055 0.4895624 0.4251463 0.5797449 0.5088872 0.5733033
09/17/05 09/18/05 09/19/05 09/20/05 09/21/05 09/22/05 09/23/05 09/25/05 09/26/05 09/27/0510:49 AM 7:12 PM 3:43 PM 11:09 PM 10:48 AM 7:31 PM 11:42 AM 12:58 PM 6:59 PM 3:15 PM
67 68 70 64 66 63 67 70 7563 69 68 67 63 67 63 65 70 69
929 923 921 917 913 910 909 904 908 920907 905 903 899 898 892 887 883 886 897
862 860 860 852 847 846 841 839 843 852873 873 871 865 862 860 854 855 857 866
4.74 6.09 6.95 8.26 8.74 10.10 10.78 12.83 14.08 14.93-562 -570 -572 -569 -562 -562 -559 -562 -562 -57763 70 70 70 66 68 64 68 72 73
367 353 349 348 351 348 350 342 346 343345 335 331 330 336 330 328 321 324 320
300 290 288 283 285 284 282 277 281 275311 303 299 296 300 298 295 293 295 289
-53 -65 -69 -70 -66 -70 -70 -78 -74 -78-53 -62 -65 -69 -66 -68 -70 -74 -71 -77-53 -64 -67 -70 -66 -69 -70 -76 -72 -77
2.365 2.365 2.365 2.365 2.365 2.365 2.365 2.365 2.365 2.365-0.000772 -0.000922 -0.000972 -0.001008 -0.000954 -0.000997 -0.001015 -0.001094 -0.001047 -0.001115
3062 2564 2432 2346 2478 2371 2330 2162 2258 21210.478663 0.7658607 0.8615933 0.9299737 0.8274031 0.9094596 0.9436498 1.0940867 1.0051922 1.135115
D-36

09/30/05 10/04/05 10/17/05 11/11/05 12/09/05 01/11/062:53 PM 3:50 PM 12:47 PM 2:47 PM 2:38 PM 11:39 AM
64 65 65 54 59 5467 68 68 57
912 910 909 904 478 396932 931 929 922 494 411919 914 908 895 474 391874 870 867 858 432 347
17.91 21.95 34.82 59.91 87.90 120.78 #N/A-573 -577 -575 -570 -149 -68 #N/A64 68 68 57 63 55 #N/A
339 333 334 334 329 328 #N/A359 354 354 352 345 343 #N/A346 337 333 325 325 323 #N/A301 293 292 288 283 279 #N/A-60 -65 -65 -66 -72 -73 #N/A-59 -68 -70 -76 -79 -82 #N/A-59 -66 -67 -71 -75 -77 #N/A
2.365 2.365 2.365 2.365 2.365 2.365 2.365-0.000862 -0.000962 -0.000976 -0.001026 -0.001087 -0.001119 #N/A
2745 2460 2424 2305 2177 2114 #N/A0.5539785 0.7343436 0.76011 0.8502925 0.9597999 1.0177744 #N/A
09/30/05 10/04/05 10/17/05 11/11/05 12/09/05 01/11/062:52 PM 3:52 PM 12:49 PM 2:48 PM 2:40 PM 11:41 AM
64 65 65 54 60 5465 63 64 56
915 912 909 896 465 386891 889 884 872 442 358
847 844 841 826 393 311864 863 859 847 416 333
17.91 21.95 34.83 59.91 87.90 120.78 #N/A-573 -577 -575 -570 -149 -68 #N/A64 68 68 57 63 55 #N/A
342 335 334 326 316 318 #N/A318 312 309 302 293 290 #N/A
274 267 266 256 244 243 #N/A291 286 284 277 267 265 #N/A
-79 -86 -88 -95 -105 -105 #N/A-76 -82 -84 -92 -103 -105 #N/A-78 -84 -86 -94 -104 -105 #N/A
2.365 2.365 2.365 2.365 2.365 2.365 2.365-0.001122 -0.001212 -0.001237 -0.001351 -0.001497 -0.001512 #N/A
2107 1952 1913 1751 1580 1565 #N/A1.1487911 1.3197421 1.3676084 1.5864258 1.8667855 1.8941377 #N/A
D-37

Gage Value - Sealed Cylinder
0
50
100
150
200
250
300
350
400
450
0 20 40 60 80 100 120 140
Age (days)
Adj
uste
d G
auge
Val
ue (1
/10,
000
in)
ADJ - NADJ - SADJ - EADJ - W
Gauge Value - UnSealed Cylinder
0
50
100
150
200
250
300
350
400
450
0 20 40 60 80 100 120 140
Age (days)
Adj
uste
d G
uage
Val
ue (1
/10,
000
in)
ADJ - NADJ - SADJ - EADJ - W
D-38

Δ - Sealed Cylinder
-90
-80
-70
-60
-50
-40
-30
-20
-10
00 20 40 60 80 100 120 140
Age (days)
Gau
ge V
alue
Cha
nge
(1/1
0,00
0 in
)
D Average N-SD Average E-WD Ave-Ave
Δ - UnSealed Cylinder
-120
-100
-80
-60
-40
-20
00 20 40 60 80 100 120 140
Age (days)
Gau
ge V
alue
Cha
nge
(1/1
0,00
0 in
)
D Average N-SD Average E-WD Ave-Ave
D-39

Effective Elastic Modulus - Sealed
0
500
1000
1500
2000
2500
3000
3500
4000
4500
0 20 40 60 80 100 120 140
Age (days)
Elas
tic M
od E
ff (k
si)
Ec Effective (ksi)
Effective Elastic Modulus - Unsealed
0
500
1000
1500
2000
2500
3000
3500
4000
4500
5000
0 20 40 60 80 100 120 140
Age (days)
Elas
tic M
od E
ff (k
si)
Ec Effective (ksi)
D-40

Creep Coefficient - Sealed
0
0.2
0.4
0.6
0.8
1
1.2
1.4
1.6
1.8
2
0 20 40 60 80 100 120 140
Age (days)
Cre
ep C
oeffi
cien
t
Cc(t)
Creep Coefficient - Unsealed
0
0.2
0.4
0.6
0.8
1
1.2
1.4
1.6
1.8
2
0 20 40 60 80 100 120 140
Age (days)
Cre
ep C
oeffi
cien
t
Cc(t)
D-41

G1D-AC-7Day Initial Loading:Sealed 0% 100% 0% 100%
Girder Name: G1D Date 09/19/05 09/19/05 09/19/05 09/19/05Cast Date: 09/12/05 Time 2:16 PM 2:23 PM 2:28 PM 2:35 PMCast Time: 5:00 PM Ambient Temp (°F) 68 68 68 68Release date: 09/13/05 Cyl. Surf. Temp(°F) 71 71 71 71
Cylinder Loading: 7Day Gauge Load (psi) 0 7700 0 7700Cylinder Cure: AC Stress (ksi) 0 3.868 0 3.868
(10,000 in) N 961 922 959 926Prep Work: Sealed UnSealed S 996 928 992 923
Ambient Temp (°F) E 1021 974 1018 975Unwrap Time W 915 859 910 858
Cyl. Surf. Temp(°F) Age (days) 6.89 6.89 6.89 6.90Humidity (%) Gauge Correction -568 -569 -569 -569
Rod Temp (°F) 68 68 68 68Loading: ADJ - N 393 353 390 357
Ave E Mod = 4822 ksi ADJ - S 428 359 423 354Sustained Pressure = 3.868 ksi ADJ - E 453 405 449 406
ADJ - W 347 290 341 289 Δ Average N-S -55 -51
Δ Average E-W -53 -48Δ Ave-Ave (in) -54 -49
Concrete Strain -0.000789 -0.000728Ec (ksi) 4902 5311
Comments:
UnSealedDate 09/19/05 09/19/05 09/19/05 09/19/05Time 2:18 PM 2:25 PM 2:30 PM 2:37 PM
Ambient Temp (°F) 68 68 68 68Cyl. Surf. Temp(°F) 67 67 67 67
Gauge Load (psi) 0 7700 0 7700Stress (ksi) 0 3.868 0 3.868
(10,000 in) N 999 946 993 952S 847 772 851 770
E 756 726 757 724W 928 834 921 833
Age (days) 6.89 6.89 6.90 6.90
Gauge Correction -568 -569 -569 -569Rod Temp (°F) 68 68 68 68
ADJ - N 431 377 424 383ADJ - S 279 203 282 201
ADJ - E 188 157 188 155ADJ - W 360 265 352 264
Δ Average N-S -65 -61 Δ Average E-W -63 -61
Δ Ave-Ave (in) -64 -61Concrete Strain -0.000939 -0.000893
Ec (ksi) 4119 4333
Loading Procedure:Pump to gauge pressure of 7700psi. Hand tight nuts to snug. Take reading.
D-42

Un-Loading: Creep Monitoring:Sealed 100% 0% Sealed 0% 100%
Date 01/11/06 01/11/06 Date 09/19/05 09/19/05 09/20/05Time 1:13 PM 1:40 PM Time 2:28 PM 2:35 PM 10:56 AM
Ambient Temp (°F) 54 54 Ambient Temp (°F) 68 68 68Cyl. Surf. Temp(°F) Cyl. Surf. Temp(°F) 71 71 82
Gauge Load (psi) 7700 0 (10,000 in) N 959 926 920Stress (ksi) 3.868 0 S 992 923 913
(10,000 in) N 392 432 E 1018 975 977S 380 440 W 910 858 846
E 439 490 Age (days) 6.89 6.90 7.75W 318 375 Gauge Correction -569 -569 -567
Age (days) 120.84 120.86 Rod Temp (°F) 68 68 68Gauge Correction -68 -73 ADJ - N 390 357 353
Rod Temp (°F) 55 54 ADJ - S 423 354 346ADJ - N 324 359 ADJ - E 449 406 410ADJ - S 312 367 ADJ - W 341 289 279ADJ - E 371 417 Δ Average N-S 0 -51 -57
ADJ - W 250 302 Δ Average E-W 0 -48 -51 Δ Average N-S 45 Δ Ave-Ave 0 -49 -54
Δ Average E-W 49 Stress (ksi) 0 3.868 3.868Δ Ave-Ave (in) 47 Concrete Strain 0 -0.000728 -0.000793
Concrete Strain 0.000647 Ec Effective (ksi) 0 5311 4880Ec (ksi) 5982 Cc(t) 0 0 0.0882631
UnSealed UnSealedDate 01/11/06 01/11/06 Date 09/19/05 09/19/05 09/20/05Time 1:15 PM 1:42 PM Time 2:30 PM 2:37 PM 10:59 AM
Ambient Temp (°F) 54 54 Ambient Temp (°F) 68 68 68Cyl. Surf. Temp(°F) Cyl. Surf. Temp(°F) 67 67 78
Gauge Load (psi) 7700 0 (10,000 in) N 993 952 941Stress (ksi) 3.868 0 S 851 770 757
(10,000 in) N 391 441 E 757 724 717S 201 262 W 921 833 815
E 171 210 Age (days) 6.90 6.90 7.75W 248 323 Gauge Correction -569 -569 -567
Age (days) 120.84 120.86 Rod Temp (°F) 68 68 68
Gauge Correction -68 -73 ADJ - N 424 383 374Rod Temp (°F) 55 54 ADJ - S 282 201 190
ADJ - N 323 368 ADJ - E 188 155 150ADJ - S 133 189 ADJ - W 352 264 248
ADJ - E 103 137 Δ Average N-S 0 -61 -71ADJ - W 180 250 Δ Average E-W 0 -61 -71
Δ Average N-S 51 Δ Ave-Ave 0 -61 -71 Δ Average E-W 52 Stress (ksi) 0 3.868 3.868
Δ Ave-Ave (in) 51 Concrete Strain 0 -0.000893 -0.001039Concrete Strain 0.000707 Ec Effective (ksi) 0 4333 3723
Ec (ksi) 5468 Cc(t) 0 0 0.1640422
D-43

09/21/05 09/22/05 09/23/05 09/25/05 09/26/05 09/27/05 09/30/05 10/04/05 10/17/05 11/11/0510:57 AM 7:47 PM 11:48 AM 1:14 PM 7:15 PM 3:22 PM 3:04 PM 4:02 PM 12:59 PM 3:01 PM
66 64 65 68 69 74 64 65 67 5267 65 66 70 68 72 66 65 67 54
#N/A 914 911 908 907 916 915 916 907 898908 904 902 898 901 915 910 907 901 890976 964 960 953 960 970 967 966 963 953845 843 838 833 837 851 845 842 842 829
8.75 10.12 10.78 12.84 14.09 14.93 17.92 21.96 34.83 59.92-564 -562 -560 -563 -562 -577 -575 -577 -576 -57066 68 64 70 70 73 66 68 68 57
#N/A 352 351 345 345 339 340 339 331 328344 342 342 335 339 338 335 330 325 320412 402 400 390 398 393 392 389 387 383281 281 278 270 275 274 270 265 266 259#N/A -60 -60 -67 -65 -68 -69 -72 -79 -83-49 -54 -56 -65 -59 -62 -64 -68 -69 -74
#N/A -57 -58 -66 -62 -65 -67 -70 -74 -78
3.868 3.868 3.868 3.868 3.868 3.868 3.868 3.868 3.868 3.868#N/A -0.000832 -0.000853 -0.000964 -0.000903 -0.000950 -0.000975 -0.001025 -0.001075 -0.001143#N/A 4650 4533 4012 4282 4073 3968 3775 3599 3385#N/A 0.1422017 0.1716227 0.3236314 0.2402718 0.3040174 0.3383419 0.406991 0.4756401 0.5688067
09/21/05 09/22/05 09/23/05 09/25/05 09/26/05 09/27/05 09/30/05 10/04/05 10/17/05 11/11/0510:59 AM 7:50 PM 11:49 AM 1:17 PM 7:16 PM 3:23 PM 3:05 PM 4:03 PM 1:01 PM 3:02 PM
66 64 65 68 69 74 64 65 67 5265 66 63 67 69 70 67 64 65 55
934 934 929 927 927 938 936 924 923 907750 746 742 741 741 753 746 743 738 720
711 707 706 702 703 718 711 707 703 688808 802 802 797 796 811 801 798 791 769
8.75 10.12 10.78 12.85 14.09 14.93 17.92 21.96 34.83 59.92-564 -562 -560 -563 -562 -577 -575 -577 -576 -57066 68 64 70 70 73 66 68 68 57
370 372 369 364 365 361 361 347 347 337186 184 182 178 179 176 171 166 162 150
147 145 146 139 141 141 136 130 127 118244 240 242 234 234 234 226 221 215 199
-75 -75 -78 -82 -81 -85 -87 -97 -99 -110-75 -78 -76 -84 -83 -83 -89 -95 -99 -112-75 -76 -77 -83 -82 -84 -88 -96 -99 -111
3.868 3.868 3.868 3.868 3.868 3.868 3.868 3.868 3.868 3.868-0.001093 -0.001114 -0.001121 -0.001207 -0.001193 -0.001218 -0.001282 -0.001389 -0.001435 -0.001603
3540 3472 3450 3205 3243 3177 3017 2785 2695 24120.2240576 0.2480638 0.2560658 0.3520905 0.3360864 0.3640936 0.4361121 0.556143 0.6081564 0.7962047
D-44

12/09/05 01/11/063:05 PM 1:13 PM
57 54
473 392462 380527 439405 318
87.92 120.84 #N/A #N/A #N/A #N/A #N/A-149 -68 #N/A #N/A #N/A #N/A #N/A63 55 #N/A #N/A #N/A #N/A #N/A
324 324 #N/A #N/A #N/A #N/A #N/A313 312 #N/A #N/A #N/A #N/A #N/A378 371 #N/A #N/A #N/A #N/A #N/A256 250 #N/A #N/A #N/A #N/A #N/A-88 -89 #N/A #N/A #N/A #N/A #N/A-78 -85 #N/A #N/A #N/A #N/A #N/A-83 -87 #N/A #N/A #N/A #N/A #N/A
3.868 3.868 3.868 3.868 3.868 3.868 3.868-0.001210 -0.001260 #N/A #N/A #N/A #N/A #N/A
3195 3069 #N/A #N/A #N/A #N/A #N/A0.6619733 0.7306224 #N/A #N/A #N/A #N/A #N/A
12/09/05 01/11/063:07 PM 1:15 PM
57 54
476 391286 201
255 171333 248
87.92 120.84 #N/A #N/A #N/A #N/A #N/A-149 -68 #N/A #N/A #N/A #N/A #N/A63 55 #N/A #N/A #N/A #N/A #N/A
327 323 #N/A #N/A #N/A #N/A #N/A137 133 #N/A #N/A #N/A #N/A #N/A
106 103 #N/A #N/A #N/A #N/A #N/A184 180 #N/A #N/A #N/A #N/A #N/A
-121 -125 #N/A #N/A #N/A #N/A #N/A-125 -129 #N/A #N/A #N/A #N/A #N/A-123 -127 #N/A #N/A #N/A #N/A #N/A
3.868 3.868 3.868 3.868 3.868 3.868 3.868-0.001782 -0.001835 #N/A #N/A #N/A #N/A #N/A
2171 2107 #N/A #N/A #N/A #N/A #N/A0.9962561 1.0562716 #N/A #N/A #N/A #N/A #N/A
D-45

Gage Value - Sealed Cylinder
0
50
100
150
200
250
300
350
400
450
500
0 20 40 60 80 100 120 140
Age (days)
Adj
uste
d G
auge
Val
ue (1
/10,
000
in)
ADJ - NADJ - SADJ - EADJ - W
Gauge Value - UnSealed Cylinder
0
50
100
150
200
250
300
350
400
450
0 20 40 60 80 100 120 140
Age (days)
Adj
uste
d G
uage
Val
ue (1
/10,
000
in)
ADJ - NADJ - SADJ - EADJ - W
D-46

Δ - Sealed Cylinder
-100
-90
-80
-70
-60
-50
-40
-30
-20
-10
00 20 40 60 80 100 120 140
Age (days)
Gau
ge V
alue
Cha
nge
(1/1
0,00
0 in
)
D Average N-SD Average E-WD Ave-Ave
Δ - UnSealed Cylinder
-140
-120
-100
-80
-60
-40
-20
00 20 40 60 80 100 120 140
Age (days)
Gau
ge V
alue
Cha
nge
(1/1
0,00
0 in
)
D Average N-SD Average E-WD Ave-Ave
D-47

Effective Elastic Modulus - Sealed
0
1000
2000
3000
4000
5000
6000
0 20 40 60 80 100 120 140
Age (days)
Elas
tic M
od E
ff (k
si)
Ec Effective (ksi)
Effective Elastic Modulus - Unsealed
0
500
1000
1500
2000
2500
3000
3500
4000
4500
5000
0 20 40 60 80 100 120 140
Age (days)
Elas
tic M
od E
ff (k
si)
Ec Effective (ksi)
D-48

Creep Coefficient - Sealed
0
0.2
0.4
0.6
0.8
1
1.2
1.4
0 20 40 60 80 100 120 140
Age (days)
Cre
ep C
oeffi
cien
t
Cc(t)
Creep Coefficient - Unsealed
0
0.2
0.4
0.6
0.8
1
1.2
1.4
0 20 40 60 80 100 120 140
Age (days)
Cre
ep C
oeffi
cien
t
Cc(t)
D-49

G1D-MC-7Day Initial Loading:Sealed 0% 100% 0% 100%
Girder Name: G1D Date 09/19/05 09/19/05 09/19/05 09/19/05Cast Date: 09/12/05 Time 1:32 PM 1:39 PM 1:47 PM 1:52 PMCast Time: 5:00 PM Ambient Temp (°F) 66 66 66 66Release date: 09/13/05 Cyl. Surf. Temp(°F) 68 68 68 69
Cylinder Loading: 7Day Gauge Load (psi) 0 4620 0 4620Cylinder Cure: MC Stress (ksi) 0 2.365 0 2.365
(10,000 in) N 969 932 965 928Prep Work: Sealed UnSealed S 949 921 947 918
Ambient Temp (°F) 76 76 E 1010 970 1008 969Unwrap Time 11:20 AM 11:20 AM W 952 928 953 923
Cyl. Surf. Temp(°F) 76 76 Age (days) 6.86 6.86 6.87 6.87Humidity (%) Gauge Correction -568 -567 -567 -568
Rod Temp (°F) 66 66 66 68Loading: ADJ - N 401 365 398 360
Ave E Mod = 4378 ksi ADJ - S 381 354 380 350Sustained Pressure = 2.365 ksi ADJ - E 442 403 441 401
ADJ - W 384 361 386 355 Δ Average N-S -32 -34
Δ Average E-W -31 -36Δ Ave-Ave (in) -31 -35
Concrete Strain -0.000462 -0.000512Ec (ksi) 5124 4623
Comments:
UnSealedDate 09/19/05 09/19/05 09/19/05 09/19/05Time 1:35 PM 1:39 PM 1:48 PM 1:52 PM
Ambient Temp (°F) 66 66 66 66Cyl. Surf. Temp(°F) 65 66 66 66
Gauge Load (psi) 0 4620 0 4620Stress (ksi) 0 2.365 0 2.365
(10,000 in) N 884 848 883 851S 822 776 821 775
E 842 797 838 795W 811 781 812 781
Age (days) 6.86 6.86 6.87 6.87
Gauge Correction -567 -567 -567 -568Rod Temp (°F) 66 66 66 68
ADJ - N 317 281 316 283ADJ - S 255 209 254 207
ADJ - E 275 230 271 227ADJ - W 244 214 245 213
Δ Average N-S -41 -40 Δ Average E-W -38 -38
Δ Ave-Ave (in) -39 -39Concrete Strain -0.000576 -0.000572
Ec (ksi) 4107 4133
Loading Procedure:Pump to gauge pressure of 7700psi. Hand tight nuts to snug. Take reading.
D-50

Un-Loading: Creep Monitoring:Sealed 100% 0% Sealed 0% 100%
Date 01/11/06 01/11/06 Date 09/19/05 09/19/05 09/20/05Time 11:31 AM 12:52 PM Time 1:47 PM 1:52 PM 11:16 AM
Ambient Temp (°F) 54 54 Ambient Temp (°F) 66 66 68Cyl. Surf. Temp(°F) Cyl. Surf. Temp(°F) 68 69 69
Gauge Load (psi) 4620 0 (10,000 in) N 965 928 919Stress (ksi) 2.365 0 S 947 918 911
(10,000 in) N 398 428 E 1008 969 956S 384 406 W 953 923 920
E 429 464 Age (days) 6.87 6.87 7.76W 401 423 Gauge Correction -567 -568 -570
Age (days) 120.77 120.83 Rod Temp (°F) 66 68 70Gauge Correction -68 -68 ADJ - N 398 360 349
Rod Temp (°F) 55 55 ADJ - S 380 350 341ADJ - N 330 360 ADJ - E 441 401 386ADJ - S 316 338 ADJ - W 386 355 350ADJ - E 361 396 Δ Average N-S 0 -34 -44
ADJ - W 333 355 Δ Average E-W 0 -36 -46 Δ Average N-S 26 Δ Ave-Ave 0 -35 -45
Δ Average E-W 29 Stress (ksi) 0 2.365 2.365Δ Ave-Ave (in) 27 Concrete Strain 0 -0.000512 -0.000654
Concrete Strain 0.000374 Ec Effective (ksi) 0 4623 3614Ec (ksi) 6321 Cc(t) 0 -0.052993 0.2114584
UnSealed UnSealedDate 01/11/06 01/11/06 Date 09/19/05 09/19/05 09/20/05Time 11:32 AM 12:54 PM Time 1:48 PM 1:52 PM 11:18 AM
Ambient Temp (°F) 54 54 Ambient Temp (°F) 66 66 68Cyl. Surf. Temp(°F) Cyl. Surf. Temp(°F) 66 66 66
Gauge Load (psi) 4620 0 (10,000 in) N 883 851 844Stress (ksi) 2.365 0 S 821 775 761
(10,000 in) N 310 333 E 838 795 784S 209 256 W 812 781 770
E 243 279 Age (days) 6.87 6.87 7.76W 222 254 Gauge Correction -567 -568 -570
Age (days) 120.77 120.83 Rod Temp (°F) 66 68 70
Gauge Correction -68 -68 ADJ - N 316 283 274Rod Temp (°F) 55 55 ADJ - S 254 207 191
ADJ - N 242 265 ADJ - E 271 227 214ADJ - S 141 188 ADJ - W 245 213 200
ADJ - E 175 211 Δ Average N-S 0 -40 -53ADJ - W 154 186 Δ Average E-W 0 -38 -51
Δ Average N-S 35 Δ Ave-Ave 0 -39 -52 Δ Average E-W 34 Stress (ksi) 0 2.365 2.365
Δ Ave-Ave (in) 35 Concrete Strain 0 -0.000572 -0.000754Concrete Strain 0.000478 Ec Effective (ksi) 0 4133 3135
Ec (ksi) 4951 Cc(t) 0 0.0593986 0.3965747
D-51

09/21/05 09/22/05 09/23/05 09/25/05 09/26/05 09/27/05 09/30/05 10/04/05 10/17/05 11/11/0510:31 AM 7:16 PM 11:35 AM 12:45 PM 6:52 PM 3:08 PM 2:48 PM 3:40 PM 12:39 PM 2:39 PM
64 66 64 67 70 75 64 65 65 5465 67 65 71 72 74 65 68 67 57
917 916 911 908 910 911 920 919 915 905906 906 906 895 889 903 910 910 910 901953 949 941 945 950 945 956 955 948 944914 917 912 911 913 908 920 920 917 909
8.73 10.09 10.77 12.82 14.08 14.92 17.91 21.94 34.82 59.90-562 -561 -558 -561 -563 -563 -573 -574 -576 -56966 66 64 68 72 72 64 66 66 57
355 355 353 347 347 348 347 345 339 336344 345 348 334 326 340 337 336 334 332391 388 383 384 387 382 383 381 372 375352 356 354 350 350 345 347 346 341 340-40 -39 -39 -49 -53 -45 -47 -49 -53 -55-42 -42 -45 -47 -45 -50 -49 -50 -57 -56-41 -40 -42 -48 -49 -48 -48 -49 -55 -56
2.365 2.365 2.365 2.365 2.365 2.365 2.365 2.365 2.365 2.365-0.000597 -0.000590 -0.000612 -0.000694 -0.000712 -0.000694 -0.000697 -0.000719 -0.000797 -0.000808
3960 4007 3867 3409 3324 3409 3392 3291 2966 29270.1056776 0.0924551 0.1321228 0.2841826 0.3172391 0.2841826 0.2907939 0.3304617 0.4759102 0.4957441
09/21/05 09/22/05 09/23/05 09/25/05 09/26/05 09/27/05 09/30/05 10/04/05 10/17/05 11/11/0510:33 AM 7:19 PM 11:37 AM 12:48 PM 6:53 PM 3:09 PM 2:49 AM 3:42 PM 12:41 PM 2:40 PM
64 66 64 67 70 75 64 65 65 5463 67 63 66 72 71 65 64 64 56
834 835 833 830 831 828 838 829 829 821754 751 745 743 750 745 757 746 741 727
777 775 771 769 771 768 778 774 770 758762 759 757 753 757 757 766 760 758 745
8.73 10.10 10.78 12.82 14.08 14.92 17.41 21.95 34.82 59.90-562 -561 -558 -561 -563 -563 -578 -574 -576 -56966 66 64 68 72 72 73 66 66 57
272 274 275 269 268 265 260 255 253 252192 190 187 182 187 182 179 172 165 158
215 214 213 208 208 205 200 200 194 189200 198 199 192 194 194 188 186 182 176
-53 -53 -54 -60 -58 -62 -66 -72 -76 -80-51 -52 -52 -58 -57 -59 -64 -65 -70 -76-52 -53 -53 -59 -57 -60 -65 -68 -73 -78
2.365 2.365 2.365 2.365 2.365 2.365 2.365 2.365 2.365 2.365-0.000754 -0.000765 -0.000772 -0.000854 -0.000833 -0.000872 -0.000940 -0.000990 -0.001058 -0.001126
3135 3091 3062 2768 2839 2711 2516 2389 2235 21010.3965747 0.4164085 0.4296311 0.5816909 0.5420232 0.6147474 0.740362 0.8329202 0.9585348 1.0841494
D-52
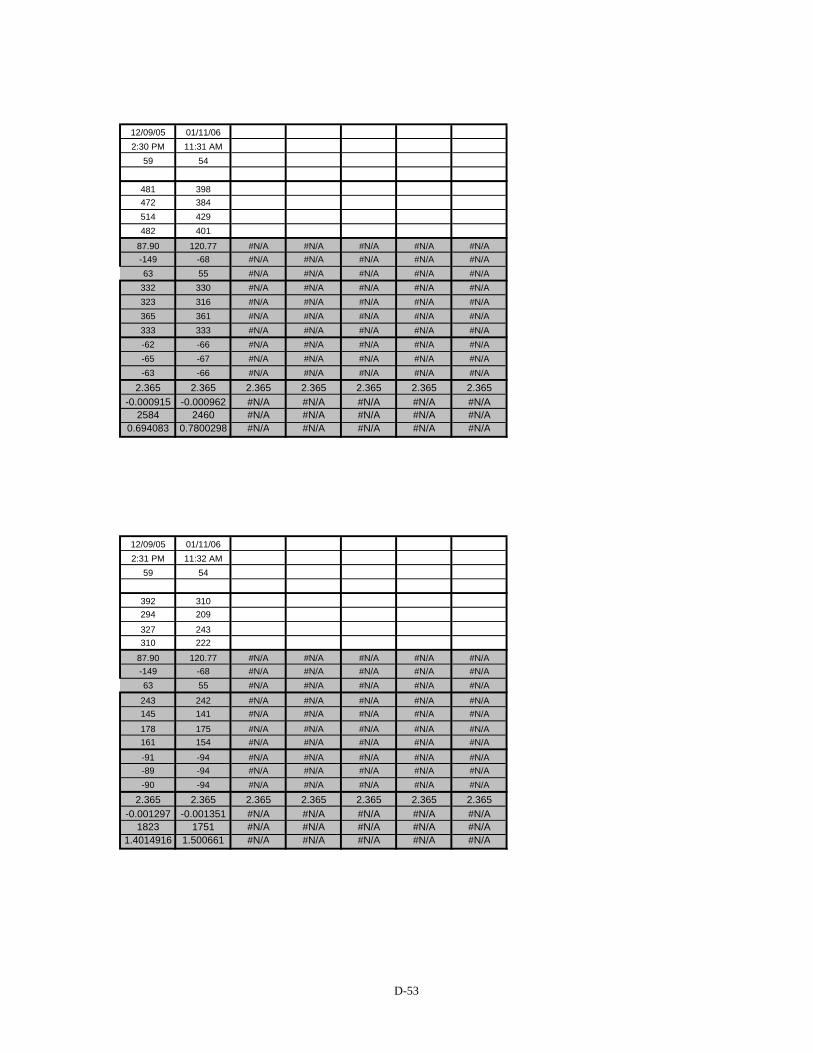
12/09/05 01/11/062:30 PM 11:31 AM
59 54
481 398472 384514 429482 401
87.90 120.77 #N/A #N/A #N/A #N/A #N/A-149 -68 #N/A #N/A #N/A #N/A #N/A63 55 #N/A #N/A #N/A #N/A #N/A
332 330 #N/A #N/A #N/A #N/A #N/A323 316 #N/A #N/A #N/A #N/A #N/A365 361 #N/A #N/A #N/A #N/A #N/A333 333 #N/A #N/A #N/A #N/A #N/A-62 -66 #N/A #N/A #N/A #N/A #N/A-65 -67 #N/A #N/A #N/A #N/A #N/A-63 -66 #N/A #N/A #N/A #N/A #N/A
2.365 2.365 2.365 2.365 2.365 2.365 2.365-0.000915 -0.000962 #N/A #N/A #N/A #N/A #N/A
2584 2460 #N/A #N/A #N/A #N/A #N/A0.694083 0.7800298 #N/A #N/A #N/A #N/A #N/A
12/09/05 01/11/062:31 PM 11:32 AM
59 54
392 310294 209
327 243310 222
87.90 120.77 #N/A #N/A #N/A #N/A #N/A-149 -68 #N/A #N/A #N/A #N/A #N/A63 55 #N/A #N/A #N/A #N/A #N/A
243 242 #N/A #N/A #N/A #N/A #N/A145 141 #N/A #N/A #N/A #N/A #N/A
178 175 #N/A #N/A #N/A #N/A #N/A161 154 #N/A #N/A #N/A #N/A #N/A
-91 -94 #N/A #N/A #N/A #N/A #N/A-89 -94 #N/A #N/A #N/A #N/A #N/A-90 -94 #N/A #N/A #N/A #N/A #N/A
2.365 2.365 2.365 2.365 2.365 2.365 2.365-0.001297 -0.001351 #N/A #N/A #N/A #N/A #N/A
1823 1751 #N/A #N/A #N/A #N/A #N/A1.4014916 1.500661 #N/A #N/A #N/A #N/A #N/A
D-53

Gage Value - Sealed Cylinder
0
50
100
150
200
250
300
350
400
450
500
0 20 40 60 80 100 120 140
Age (days)
Adj
uste
d G
auge
Val
ue (1
/10,
000
in)
ADJ - NADJ - SADJ - EADJ - W
Gauge Value - UnSealed Cylinder
0
50
100
150
200
250
300
350
0 20 40 60 80 100 120 140
Age (days)
Adj
uste
d G
uage
Val
ue (1
/10,
000
in)
ADJ - NADJ - SADJ - EADJ - W
D-54

Δ - Sealed Cylinder
-70
-60
-50
-40
-30
-20
-10
00 20 40 60 80 100 120 140
Age (days)
Gau
ge V
alue
Cha
nge
(1/1
0,00
0 in
)
D Average N-SD Average E-WD Ave-Ave
Δ - UnSealed Cylinder
-100
-90
-80
-70
-60
-50
-40
-30
-20
-10
00 20 40 60 80 100 120 140
Age (days)
Gau
ge V
alue
Cha
nge(
1/10
,000
in)
D Average N-SD Average E-WD Ave-Ave
D-55

Effective Elastic Modulus - Sealed
0
500
1000
1500
2000
2500
3000
3500
4000
4500
5000
0 20 40 60 80 100 120 140
Age (days)
Elas
tic M
od E
ff (k
si)
Ec Effective (ksi)
Effective Elastic Modulus - Unsealed
0
500
1000
1500
2000
2500
3000
3500
4000
4500
0 20 40 60 80 100 120 140
Age (days)
Elas
tic M
od E
ff (k
si)
Ec Effective (ksi)
D-56

Creep Coefficient - Sealed
0
0.2
0.4
0.6
0.8
1
1.2
1.4
0 20 40 60 80 100 120 140
Age (days)
Cre
ep C
oeffi
cien
t
Cc(t)
Creep Coefficient - Unsealed
0
0.2
0.4
0.6
0.8
1
1.2
1.4
0 20 40 60 80 100 120 140
Age (days)
Cre
ep C
oeffi
cien
t
Cc(t)
D-57

APPENDIX E
SNAKE LAKE SHRINKAGE TEST DATA

G2D-AC-ShComments:
Girder Name: G2DCast Date: 09/09/05Cast Time: 5:00 PMRelease date: 09/12/05Cylinder Loading: ShCylinder Cure: ACPrep Work: Sealed UnSealedAmbient Temp (°F) 74 74Unwrap Time 8:22 AM 8:22 AMCyl. Surf. Temp(°F) 66 66Humidity (%)
Shrinkage:Sealed
Date 09/12/05 09/12/05 09/13/05 09/13/05 09/14/05 09/15/05 09/16/05 09/17/05Time 11:00 AM 12:16 PM 1:55 PM 5:00 PM 2:16 PM 4:13 PM 10:41 AM 9:22 AM
Ambient Temp (°F) 64 64 66 66 66Cyl. Surf. Temp(°F) 68 68 74 69 69 64 65
(10,000 in) N 332 335 340 501 485 919 912 909S OS OS OS OS OS OS OS OSE 338 345 354 511 OS OS 912 924
W OS OS OS OS 494 425 422 414Age (days) 2.75 2.80 3.87 4.00 4.89 5.97 6.74 7.68
Gauge Correction 0 7 -13 -161 -154 -575 -572 -563Rod Temp (°F) 75 68 75 75 68 66 59 64
ADJ - N 332 342 327 340 331 344 340 346ADJ - S #N/A #N/A #N/A #N/A #N/A #N/A #N/A #N/AADJ - E 338 352 341 350 #N/A #N/A 340 361
ADJ - W #N/A #N/A #N/A #N/A 340 -150 -150 -149Δ N 0 10 -5 8 -1 12 8 14Δ S #N/A #N/A #N/A #N/A #N/A #N/A #N/A #N/AΔ E 0 14 3 12 #N/A #N/A 2 23
Δ W #N/A #N/A #N/A #N/A #N/A #N/A #N/A #N/A
UnSealedDate 09/12/05 09/12/05 09/13/05 09/13/05 09/14/05 09/15/05 09/16/05 09/17/05Time 11:00 AM 12:16 PM 1:55 PM 5:00 PM 2:19 PM 4:15 PM 10:13 AM 9:24 AM
Ambient Temp (°F) 64 64 66 66 66Cyl. Surf. Temp(°F) 70 70 70 77 67 67 64 63
(10,000 in) N OS OS OS OS OS OS OS OSS 380 377 391 543 538 963 960 953E 387 390 393 547 542 968 967 960
W 353 355 375 537 529 956 955 948Age (days) 2.75 2.80 3.87 4.00 4.89 5.97 6.72 7.68
Gauge Correction 0 7 -13 -161 -154 -575 -574 -563Rod Temp (°F) 75 68 75 75 68 66 66 64
ADJ - N #N/A #N/A #N/A #N/A #N/A #N/A #N/A #N/AADJ - S 380 384 378 382 384 388 386 390ADJ - E 387 397 380 386 388 393 393 397
ADJ - W 353 362 362 376 375 381 381 385Δ N #N/A #N/A #N/A #N/A #N/A #N/A #N/A #N/AΔ S 0 4 -2 2 4 8 6 10Δ E 0 10 -7 -1 1 6 6 10
Δ W 0 9 9 23 22 28 28 32
Cylinders arrived to UW Lab at 8:00am. Only 6 AC cylinders delivered (2 SH, 2 CR, 2 Materials). Placed Sulfer Caps 8:40-8:50am. Created stacks 8:55-9:25am. Placed Target 9:25-10:00am.
Area = 12.566 in2. Cylinder Strength = 110200 lb / Area = 8770 psi. required strength on girder. 6500psi, 6800psi. -> 6500*0.6*A = 49k, 6800*0.6*A = 51k -> Use 50k. (7300psi or 50k on pump)
E-1

09/18/05 09/19/05 09/20/05 09/21/05 09/22/05 09/23/05 09/25/05 09/26/05 09/27/057:34 PM 3:50 PM 11:27 AM 10:12 AM 7:11 PM 11:26 AM 12:30 PM 6:42 PM 3:05 PM
68 70 67 62 66 64 67 70 7469 71 70 64 67 64 68 72 75
903 901 901 898 900 894 898 898 901OS OS OS OS OS OS OS OS OS902 896 890 890 898 900 902 905 900415 416 415 409 410 407 408 411 4129.11 9.95 10.77 11.72 13.09 13.77 15.81 17.07 17.92-569 -572 -569 -560 -561 -556 -559 -562 -56370 72 70 63 66 63 66 72 72
334 329 332 338 339 338 339 336 338#N/A #N/A #N/A #N/A #N/A #N/A #N/A #N/A #N/A333 324 321 330 337 344 343 343 337-154 -156 -154 -151 -151 -149 -151 -151 -151
2 -3 0 6 7 6 7 4 6#N/A #N/A #N/A #N/A #N/A #N/A #N/A #N/A #N/A
-5 -14 -17 -8 -1 6 5 5 -1#N/A #N/A #N/A #N/A #N/A #N/A #N/A #N/A #N/A
09/18/05 09/19/05 09/20/05 09/21/05 09/22/05 09/23/05 09/25/05 09/26/05 09/27/057:37 PM 3:53 PM 11:29 AM 10:15 AM 7:14 PM 11:27 AM 12:32 PM 6:44 PM 3:06 PM
68 70 67 62 66 64 67 70 7470 71 67 62 68 63 66 72 72OS OS OS OS OS OS OS OS OS961 966 964 962 967 963 969 977 975967 966 966 963 966 961 963 966 950948 951 949 943 946 943 947 952 9539.11 9.95 10.77 11.72 13.09 13.77 15.81 17.07 17.92-569 -572 -569 -560 -561 -556 -559 -562 -56370 72 70 63 66 63 66 72 72
#N/A #N/A #N/A #N/A #N/A #N/A #N/A #N/A #N/A392 394 395 402 406 407 410 415 412398 394 397 403 405 405 404 404 387379 379 380 383 385 387 388 390 390
#N/A #N/A #N/A #N/A #N/A #N/A #N/A #N/A #N/A12 14 15 22 26 27 30 35 3211 7 10 16 18 18 17 17 026 26 27 30 32 34 35 37 37
E-2

09/30/05 10/04/05 10/17/05 11/11/05 12/09/05 01/11/062:41 PM 3:31 PM 12:33 PM 2:26 PM 2:02 PM 11:14 AM
63 67 65 54 60 5365 70 67 57
914 912 910 909 486 479OS OS OS OS OS OS908 913 913 911 483 477422 421 424 418 OS OS
20.90 24.94 37.81 62.89 90.88 123.76-572 -574 -576 -569 -149 -14864 66 66 57 63 55
342 338 334 340 337 331#N/A #N/A #N/A #N/A #N/A #N/A336 339 337 342 334 329-150 -153 -152 -151 #N/A #N/A10 6 2 8 5 -1
#N/A #N/A #N/A #N/A #N/A #N/A-2 1 -1 4 -4 -9
#N/A #N/A #N/A #N/A #N/A #N/A
09/30/05 10/04/05 10/17/05 11/11/05 12/09/05 01/11/062:42 PM 3:32 PM 12:35 PM 2:27 PM 2:04 PM 11:16 AM
63 67 65 54 60 5364 67 65 57OS OS OS OS OS OS988 988 981 960 529 520971 968 961 947 517 512970 970 967 946 515 507
20.90 24.94 37.82 62.89 90.88 123.76-572 -574 -576 -569 -149 -14864 66 66 57 63 55
#N/A #N/A #N/A #N/A #N/A #N/A416 414 405 391 380 372399 394 385 378 368 364398 396 391 377 366 359
#N/A #N/A #N/A #N/A #N/A #N/A36 34 25 11 0 -812 7 -2 -9 -19 -2345 43 38 24 13 6
E-3

Gage Value - Sealed Cylinder
-200
-100
0
100
200
300
400
0 20 40 60 80 100 120 140
Age (days)
Adj
uste
d G
auge
Val
ue (1
/10,
000
in)
ADJ - NADJ - SADJ - EADJ - W
Gauge Value - UnSealed Cylinder
0
50
100
150
200
250
300
350
400
450
0 20 40 60 80 100 120 140
Age (days)
Adj
uste
d G
uage
Val
ue (1
/10,
000
in)
ADJ - NADJ - SADJ - EADJ - W
E-4

Sealed Cylinder
-50
-40
-30
-20
-10
0
10
20
30
40
50
0 20 40 60 80 100 120 140
Age (days)
Gau
ge V
alue
Cha
nge
(1/1
0,00
0 in
)
D ND SD ED W
UnSealed Cylinder
-50
-40
-30
-20
-10
0
10
20
30
40
50
0 20 40 60 80 100 120 140
Age (days)
Gau
ge V
alue
Cha
nge
(1/1
0,00
0 in
)
D ND SD ED W
E-5

Temperature
0
10
20
30
40
50
60
70
80
90
0 20 40 60 80 100 120 140Age (days)
Cyl
inde
r Tem
p (d
egre
es(F
)
SealedUnSealedRod Temp
E-6

G1D-AC-ShComments:
Girder Name: G1DCast Date: 09/12/05Cast Time: 5:00 PMRelease date: 09/13/05Cylinder Loading: ShCylinder Cure: ACPrep Work: Sealed UnSealedAmbient Temp (°F) 75 75Unwrap Time 10:25 AM 10:25 AMCyl. Surf. Temp(°F) 78 78Humidity (%)
Shrinkage:Sealed
Date 09/13/05 09/13/05 09/14/05 09/15/05 09/16/05 09/17/05 09/18/05 09/19/05Time 1:10 PM 4:45 PM 2:37 PM 3:56 PM 10:55 AM 9:21 AM 7:25 PM 3:55 PM
Ambient Temp (°F) 72 71 67 66 62 62 68 70Cyl. Surf. Temp(°F) 74 69 68 64 65 70 73
(10,000 in) N 357 506 502 920 920 915 905 902S 430 584 574 982 1004 1004 990 996E 462 612 603 1025 995 1015 1015 1023
W 403 557 553 980 983 977 982 986Age (days) 0.84 0.99 1.90 2.96 3.75 4.68 6.10 6.95
Gauge Correction -14 -161 -155 -574 -571 -563 -569 -569Rod Temp (°F) 66 75 68 66 59 64 70 72
ADJ - N 343 345 347 346 349 352 336 333ADJ - S 416 423 419 408 433 441 421 427ADJ - E 448 451 448 451 424 452 446 454
ADJ - W 389 396 398 406 412 414 413 417Δ N 0 2 4 3 6 9 -7 -10Δ S 0 7 3 -8 17 25 5 11Δ E 0 3 0 3 -24 4 -2 6
Δ W 0 7 9 17 23 25 24 28
UnSealedDate 09/13/05 09/13/05 09/14/05 09/15/05 09/16/05 09/17/05 09/18/05 09/19/05Time 1:10 PM 4:45 PM 2:39 PM 3:56 PM 10:58 AM 9:19 AM 7:27 PM 3:56 PM
Ambient Temp (°F) 72 71 67 66 62 62 68 70Cyl. Surf. Temp(°F) 74 77 67 67 64 64 70 71
(10,000 in) N 295 450 438 863 882 855 856 857S 308 432 450 878 877 870 871 878E 360 495 472 904 908 905 897 904
W 280 422 404 832 829 823 823 825Age (days) 0.84 0.99 1.90 2.96 3.75 4.68 6.10 6.96
Gauge Correction -14 -161 -155 -574 -571 -563 -569 -569Rod Temp (°F) 66 75 68 66 59 64 70 72
ADJ - N 281 289 283 289 311 292 287 288ADJ - S 294 271 295 304 306 307 302 309ADJ - E 346 334 317 330 337 342 328 335
ADJ - W 266 261 249 258 258 260 254 256Δ N 0 8 2 8 30 11 6 7Δ S 0 -23 1 10 12 13 8 15Δ E 0 -12 -29 -16 -9 -4 -18 -11
Δ W 0 -5 -17 -8 -8 -6 -12 -10
E-7

09/20/05 09/21/05 09/22/05 09/23/05 09/25/05 09/26/05 09/27/05 09/30/05 10/04/0511:24 AM 10:25 AM 7:00 PM 11:22 AM 12:40 PM 6:38 PM 3:01 PM 2:43 PM 3:26 PM
67 64 66 64 67 70 74 63 6770 66 67 66 71 71 75 66 69
905 904 902 908 905 902 894 900 910998 990 999 992 997 1003 995 1000 10111017 1012 1016 1014 1017 1010 1019 1030 1035986 985 990 989 990 995 993 985 10077.77 8.73 10.08 10.77 12.82 14.07 14.92 17.90 21.93-570 -562 -561 -560 -561 -562 -562 -572 -57370 66 66 68 68 70 72 64 64
335 342 341 348 344 340 332 328 337428 428 438 432 436 441 433 428 438447 450 455 454 456 448 457 458 462416 423 429 429 429 433 431 413 434-8 -1 -2 5 1 -3 -11 -15 -612 12 22 16 20 25 17 12 22-1 2 7 6 8 0 9 10 1427 34 40 40 40 44 42 24 45
09/20/05 09/21/05 09/22/05 09/23/05 09/25/05 09/26/05 09/27/05 09/30/05 10/04/0511:25 AM 10:27 AM 7:03 PM 11:33 AM 12:42 PM 6:39 PM 3:03 PM 2:45 PM 3:26 PM
67 64 66 64 67 70 74 63 6767 64 68 63 67 72 72 65 67
854 849 853 847 850 854 850 861 862873 870 871 868 870 872 865 881 879906 897 901 899 898 904 885 904 904827 818 821 820 821 827 821 835 8337.77 8.73 10.09 10.77 12.82 14.07 14.92 17.91 21.93-570 -562 -561 -558 -561 -562 -562 -572 -57370 66 66 64 68 70 72 64 64
284 287 292 289 289 292 288 289 289303 308 310 310 309 310 303 309 306336 335 340 341 337 342 323 332 331257 256 260 262 260 265 259 263 2603 6 11 8 8 11 7 8 89 14 16 16 15 16 9 15 12
-10 -11 -6 -5 -9 -4 -23 -14 -15-9 -10 -6 -4 -6 -1 -7 -3 -6
E-8

10/17/05 11/11/05 12/09/05 01/11/0612:29 PM 2:30 PM 2:12 PM 11:27 AM
65 54 60 5467 55
907 921 499 4111012 1004 582 4971031 1030 607 5281002 996 561 48134.81 59.90 87.88 120.77 #N/A-574 -569 -149 -68 #N/A66 57 63 55 #N/A
333 352 350 343 #N/A438 435 433 429 #N/A457 461 458 460 #N/A428 427 412 413 #N/A-10 9 7 0 #N/A22 19 17 13 #N/A9 13 10 12 #N/A39 38 23 24 #N/A
10/17/05 11/11/05 12/09/05 01/11/0612:31 PM 2:31 PM 2:14 PM 11:29 AM
65 54 60 5465 57
859 846 419 337873 858 429 346900 889 457 376831 818 392 307
34.81 59.90 87.88 120.77 #N/A-574 -569 -149 -68 #N/A66 57 63 55 #N/A
285 277 270 269 #N/A299 289 280 278 #N/A326 320 308 308 #N/A257 249 243 239 #N/A4 -4 -11 -12 #N/A5 -5 -14 -16 #N/A
-20 -26 -38 -38 #N/A-9 -17 -23 -27 #N/A
E-9

Gage Value - Sealed Cylinder
0
50
100
150
200
250
300
350
400
450
500
0 20 40 60 80 100 120 140
Age (days)
Adj
uste
d G
auge
Val
ue (1
/10,
000
in)
ADJ - NADJ - SADJ - EADJ - W
Gauge Value - UnSealed Cylinder
0
50
100
150
200
250
300
350
400
0 20 40 60 80 100 120 140
Age (days)
Adj
uste
d G
uage
Val
ue (1
/10,
000
in)
ADJ - NADJ - SADJ - EADJ - W
E-10

Sealed Cylinder
-50
-40
-30
-20
-10
0
10
20
30
40
50
0 20 40 60 80 100 120 140
Age (days)
Gau
ge V
alue
Cha
nge
(1/1
0,00
0 in
)
D ND SD ED W
UnSealed Cylinder
-50
-40
-30
-20
-10
0
10
20
30
40
50
0 20 40 60 80 100 120 140
Age (days)
Gau
ge V
alue
Cha
nge
(1/1
0,00
0 in
)
D ND SD ED W
E-11

Temperature
0
10
20
30
40
50
60
70
80
90
0 20 40 60 80 100 120 140Age (days)
Cyl
inde
r Tem
p (d
egre
es(F
)
SealedUnSealedRod Temp
E-12

G1D-MC-ShComments:
Girder Name: G1DCast Date: 09/12/05Cast Time: 5:00 PMRelease date: 09/13/05Cylinder Loading: ShCylinder Cure: MCPrep Work: Sealed UnSealedAmbient Temp (°F) 75 75Unwrap Time 10:25 AM 10:25 AMCyl. Surf. Temp(°F) 78 78Humidity (%)
Shrinkage:Sealed
Date 09/13/05 09/13/05 09/14/05 09/15/05 09/16/05 09/17/05 09/18/05 09/19/05Time 1:37 PM 4:55 PM 2:08 PM 4:18 PM 10:33 AM 9:31 AM 7:40 PM 3:58 PM
Ambient Temp (°F) 75 76 66 66 66 62 68 70Cyl. Surf. Temp(°F) 77 68 64 66 70 73
(10,000 in) N 421 600 595 1028 1029 1018 1018 1015S 397 562 556 985 990 970 969 965E bad 584 593 1015 1014 1003 1005 1003
W 485 640 625 1055 1055 1045 1042 1039Age (days) 0.86 1.00 1.88 2.97 3.73 4.69 6.11 6.96
Gauge Correction -14 -161 -153 -575 -571 -562 -569 -571Rod Temp (°F) 66 75 66 66 59 64 70 72
ADJ - N 407 439 442 453 458 456 449 444ADJ - S 383 401 403 410 419 408 400 394ADJ - E #N/A 423 440 440 443 441 436 432
ADJ - W 471 479 472 480 484 483 473 468Δ N 0 0 3 14 19 17 10 5Δ S 0 0 2 9 18 7 -1 -7Δ E #N/A 0 17 17 20 18 13 9
Δ W 0 0 -7 1 5 4 -6 -11
UnSealedDate 09/13/05 09/13/05 09/14/05 09/15/05 09/16/05 09/17/05 09/18/05 09/19/05Time 1:37 PM 4:55 PM 2:11 PM 4:19 PM 10:35 AM 9:30 AM 7:41 PM 4:00 PM
Ambient Temp (°F) 75 76 66 66 66 62 68 70Cyl. Surf. Temp(°F) 77 77 67 64 64 70 71
(10,000 in) N 250 382 360 788 782 761 782 776S 274 403 390 810 805 797 798 799E 327 471 458 878 876 866 870 866
W bad 518 499 922 920 920 913 916Age (days) 0.86 1.00 1.88 2.97 3.73 4.69 6.11 6.96
Gauge Correction -14 -161 -153 -575 -571 -562 -569 -571Rod Temp (°F) 66 75 66 66 59 64 70 72
ADJ - N 236 221 207 213 211 199 213 205ADJ - S 260 242 237 235 234 235 229 228ADJ - E 313 310 305 303 305 304 301 295
ADJ - W #N/A 357 346 347 349 358 344 345Δ N 0 0 -14 -8 -10 -22 -8 -16Δ S 0 0 -5 -7 -8 -7 -13 -14Δ E 0 0 -5 -7 -5 -6 -9 -15
Δ W #N/A 0 -11 -10 -8 1 -13 -12
E-13

09/20/05 09/21/05 09/22/05 09/23/05 09/25/05 09/26/05 09/27/05 09/30/05 10/04/0511:20 AM 10:19 AM 7:06 PM 11:29 AM 12:35 PM 6:47 PM 2:57 PM 2:38 PM 3:35 PM
68 63 66 64 67 70 75 64 6669 64 68 65 68 72 74 63 70
1016 1011 1015 1012 1011 1015 1014 1024 1027967 964 967 962 963 967 967 975 9781002 1000 1001 1001 1001 1003 1000 1012 10131042 1035 1043 1038 1038 1043 1043 1052 10547.76 8.72 10.09 10.77 12.82 14.07 14.91 17.90 21.94-570 -560 -561 -558 -561 -562 -562 -572 -57468 64 66 64 66 72 70 64 66
446 451 454 454 450 453 452 452 453397 404 406 404 402 405 405 403 404432 440 440 443 440 441 438 440 439472 475 482 480 477 481 481 480 4807 12 15 15 11 14 13 13 14-4 3 5 3 1 4 4 2 39 17 17 20 17 18 15 17 16-7 -4 3 1 -2 2 2 1 1
09/20/05 09/21/05 09/22/05 09/23/05 09/25/05 09/26/05 09/27/05 09/30/05 10/04/0511:22 AM 10:21 AM 7:08 PM 11:31 AM 12:36 PM 6:48 PM 3:00 PM 2:39 PM 3:37 PM
68 63 66 64 67 70 75 63 6667 63 68 63 66 73 73 65 66
776 771 772 769 771 776 775 783 781794 790 790 785 786 789 788 797 796863 859 858 856 858 861 859 869 868912 906 907 903 902 907 904 916 9157.77 8.72 10.09 10.77 12.82 14.07 14.92 17.90 21.94-570 -560 -561 -558 -561 -562 -562 -572 -57468 64 66 64 66 72 70 64 66
206 211 211 211 210 214 213 211 207224 230 229 227 225 227 226 225 222293 299 297 298 297 299 297 297 294342 346 346 345 341 345 342 344 341-15 -10 -10 -10 -11 -7 -8 -10 -14-18 -12 -13 -15 -17 -15 -16 -17 -20-17 -11 -13 -12 -13 -11 -13 -13 -16-15 -11 -11 -12 -16 -12 -15 -13 -16
E-14

10/17/05 11/11/05 12/09/05 01/11/0612:25 PM 2:36 PM 2:19 PM 11:19 AM
65 54 60 5466 56
1026 1024 603 600977 973 550 5431016 1009 589 5881053 1052 630 62634.81 59.90 87.89 120.76 #N/A-574 -569 -149 -148 #N/A66 57 63 55 #N/A
452 455 454 452 #N/A403 404 401 395 #N/A442 440 440 440 #N/A479 483 481 478 #N/A13 16 15 13 #N/A2 3 0 -6 #N/A19 17 17 17 #N/A0 4 2 -1 #N/A
10/17/05 11/11/05 12/09/05 01/11/0612:37 PM 2:37 PM 2:21 PM 11:21 AM
65 54 60 5465 57
780 768 339 338796 784 355 356866 856 428 429913 903 478 478
34.82 59.90 87.89 120.76 #N/A-576 -569 -149 -148 #N/A66 57 63 55 #N/A
204 199 190 190 #N/A220 215 206 208 #N/A290 287 279 281 #N/A337 334 329 330 #N/A-17 -22 -31 -31 #N/A-22 -27 -36 -34 #N/A-20 -23 -31 -29 #N/A-20 -23 -28 -27 #N/A
E-15

Gage Value - Sealed Cylinder
0
100
200
300
400
500
600
0 20 40 60 80 100 120 140
Age (days)
Adj
uste
d G
auge
Val
ue (1
/10,
000
in)
ADJ - NADJ - SADJ - EADJ - W
Gauge Value - UnSealed Cylinder
0
50
100
150
200
250
300
350
400
0 20 40 60 80 100 120 140
Age (days)
Adj
uste
d G
uage
Val
ue (1
/10,
000
in)
ADJ - NADJ - SADJ - EADJ - W
E-16

Sealed Cylinder
-50
-40
-30
-20
-10
0
10
20
30
40
50
0 20 40 60 80 100 120 140
Age (days)
Gau
ge V
alue
Cha
nge
(1/1
0,00
0 in
)
D ND SD ED W
UnSealed Cylinder
-50
-40
-30
-20
-10
0
10
20
30
40
50
0 20 40 60 80 100 120 140
Age (days)
Gau
ge V
alue
Cha
nge
(1/1
0,00
0 in
)
D ND SD ED W
E-17

Temperature
0
10
20
30
40
50
60
70
80
90
0 20 40 60 80 100 120 140Age (days)
Cyl
inde
r Tem
p (d
egre
es(F
)
SealedUnSealedRod Temp
E-18

G1D-AC-3DayComments:
Girder Name: G1DCast Date: 09/12/05Cast Time: 5:00 PMRelease date: 09/13/05Cylinder Loading: 3DayCylinder Cure: ACPrep Work: Sealed UnSealedAmbient Temp (°F)Unwrap Time 6:40 AMCyl. Surf. Temp(°F)Humidity (%)
Shrinkage:Sealed
Date 09/13/05 09/13/05 09/13/05 09/14/05 09/15/05Time 8:41 AM 1:15 PM 4:40 PM 2:42 PM 2:58 PM
Ambient Temp (°F) 60 73 71 66 66Cyl. Surf. Temp(°F) 63 75 67
(10,000 in) N 358 352 503 497 652S 435 420 580 573 727E 351 345 494 492 649
W 361 353 500 499 658Age (days) 0.65 0.84 0.99 1.90 2.92 #N/A #N/A #N/A #N/A
Gauge Correction -14 -14 -161 -155 -306 #N/A #N/A #N/A #N/ARod Temp (°F) 64 66 75 68 66 #N/A #N/A #N/A #N/A
ADJ - N 344 338 342 342 346 #N/A #N/A #N/A #N/AADJ - S 421 406 419 418 421 #N/A #N/A #N/A #N/AADJ - E 337 331 333 337 343 #N/A #N/A #N/A #N/A
ADJ - W 347 339 339 344 352 #N/A #N/A #N/A #N/AΔ N 0 -6 -2 -2 2 #N/A #N/A #N/A #N/AΔ S 0 -15 -2 -3 0 #N/A #N/A #N/A #N/AΔ E 0 -6 -4 0 6 #N/A #N/A #N/A #N/A
Δ W 0 -8 -8 -3 5 #N/A #N/A #N/A #N/A
UnSealedDate 09/13/05 09/13/05 09/13/05 09/14/05 09/15/05Time 8:41 AM 1:16 PM 4:41 PM 2:44 PM 2:59 PM
Ambient Temp (°F) 60 73 71 66 66Cyl. Surf. Temp(°F) 73 73 77 67
(10,000 in) N 391 374 529 520 678S 382 367 521 510 668E 396 380 532 523 676
W 371 359 520 508 662Age (days) 0.65 0.84 0.99 1.91 2.92 #N/A #N/A #N/A #N/A
Gauge Correction -14 -14 -161 -155 -306 #N/A #N/A #N/A #N/ARod Temp (°F) 64 66 75 68 66 #N/A #N/A #N/A #N/A
ADJ - N 377 360 368 365 372 #N/A #N/A #N/A #N/AADJ - S 368 353 360 355 362 #N/A #N/A #N/A #N/AADJ - E 382 366 371 368 370 #N/A #N/A #N/A #N/A
ADJ - W 357 345 359 353 356 #N/A #N/A #N/A #N/AΔ N 0 -17 -9 -12 -5 #N/A #N/A #N/A #N/AΔ S 0 -15 -8 -13 -6 #N/A #N/A #N/A #N/AΔ E 0 -16 -11 -14 -12 #N/A #N/A #N/A #N/A
Δ W 0 -12 2 -4 -1 #N/A #N/A #N/A #N/A
E-19

Gage Value - Sealed Cylinder
0
50
100
150
200
250
300
350
400
450
0 5 10 15 20 25
Age (days)
Adj
uste
d G
auge
Val
ue (1
/10,
000
in)
ADJ - NADJ - SADJ - EADJ - W
Gauge Value - UnSealed Cylinder
340
345
350
355
360
365
370
375
380
385
0 5 10 15 20 25
Age (days)
Adj
uste
d G
uage
Val
ue (1
/10,
000
in)
ADJ - NADJ - SADJ - EADJ - W
E-20

Sealed Cylinder
-50
-40
-30
-20
-10
0
10
20
30
40
50
0 5 10 15 20 25
Age (days)
Gau
ge V
alue
Cha
nge
(1/1
0,00
0 in
)
D ND SD ED W
UnSealed Cylinder
-50
-40
-30
-20
-10
0
10
20
30
40
50
0 5 10 15 20 25
Age (days)
Gau
ge V
alue
Cha
nge
(1/1
0,00
0 in
)
D ND SD ED W
E-21
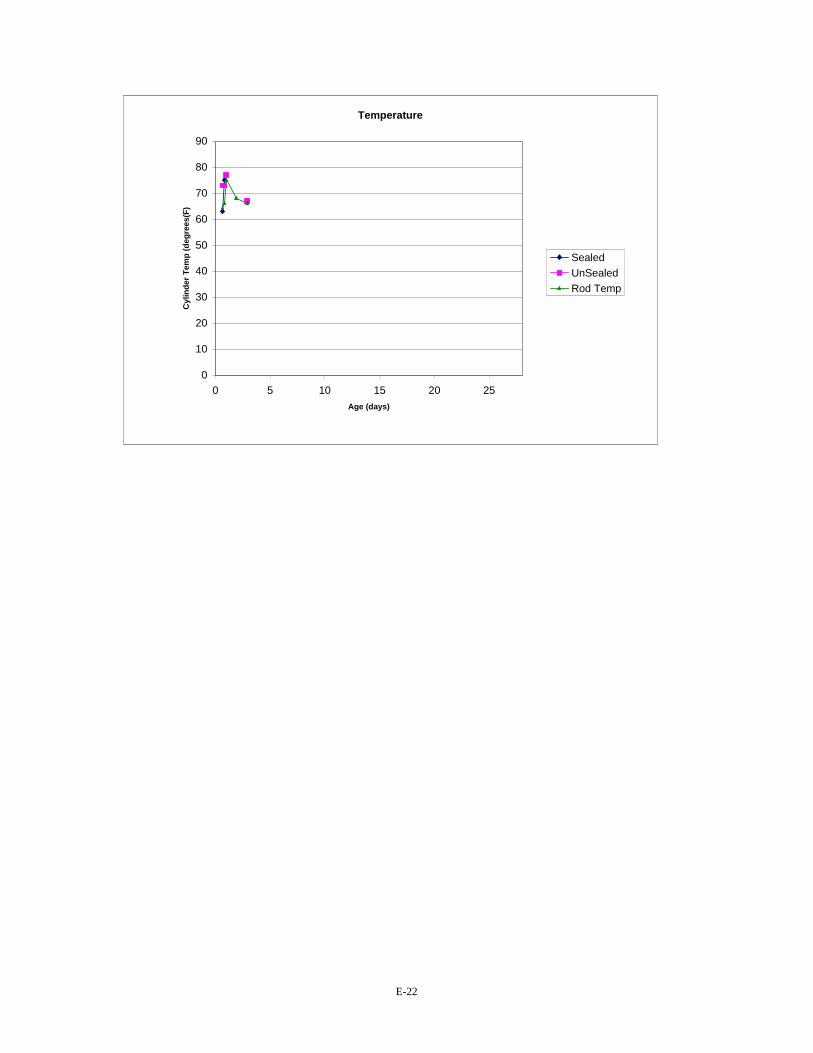
Temperature
0
10
20
30
40
50
60
70
80
90
0 5 10 15 20 25Age (days)
Cyl
inde
r Tem
p (d
egre
es(F
)
SealedUnSealedRod Temp
E-22

G1D-MC-3DayComments:
Girder Name: G1DCast Date: 09/12/05Cast Time: 5:00 PMRelease date: 09/13/05Cylinder Loading: 3DayCylinder Cure: MCPrep Work: Sealed UnSealedAmbient Temp (°F) 70 70Unwrap Time 9:34 AM 9:34 AMCyl. Surf. Temp(°F) 77 77Humidity (%)
Shrinkage:Sealed
Date 09/13/05 09/13/05 09/14/05 09/15/05Time 1:25 PM 5:05 PM 1:58 PM 1:55 PM
Ambient Temp (°F) 73 66 66Cyl. Surf. Temp(°F) 78 70 66
(10,000 in) N 420 577 561 560S 423 579 562 559E 396 553 539 545
W 385 538 519 523Age (days) 0.85 1.00 1.87 2.87 #N/A #N/A #N/A #N/A #N/A
Gauge Correction -14 -161 -155 -150 #N/A #N/A #N/A #N/A #N/ARod Temp (°F) 66 75 66 68 #N/A #N/A #N/A #N/A #N/A
ADJ - N 406 416 406 410 #N/A #N/A #N/A #N/A #N/AADJ - S 409 418 407 409 #N/A #N/A #N/A #N/A #N/AADJ - E 382 392 384 395 #N/A #N/A #N/A #N/A #N/A
ADJ - W 371 377 364 373 #N/A #N/A #N/A #N/A #N/AΔ N 0 10 0 4 #N/A #N/A #N/A #N/A #N/AΔ S 0 9 -2 0 #N/A #N/A #N/A #N/A #N/AΔ E 0 10 2 13 #N/A #N/A #N/A #N/A #N/A
Δ W 0 6 -7 2 #N/A #N/A #N/A #N/A #N/A
UnSealedDate 09/13/05 09/13/05 09/14/05 09/15/05Time 1:25 PM 5:05 PM 1:58 PM 1:57 PM
Ambient Temp (°F) 73 66 66Cyl. Surf. Temp(°F) 73 68 65
(10,000 in) N 432 573 560 557S 434 573 565 558E 396 532 518 514
W 377 521 510 503Age (days) 0.85 1.00 1.87 2.87 #N/A #N/A #N/A #N/A #N/A
Gauge Correction -14 -161 -155 -150 #N/A #N/A #N/A #N/A #N/ARod Temp (°F) 66 75 66 68 #N/A #N/A #N/A #N/A #N/A
ADJ - N 418 412 405 407 #N/A #N/A #N/A #N/A #N/AADJ - S 420 412 410 408 #N/A #N/A #N/A #N/A #N/AADJ - E 382 371 363 364 #N/A #N/A #N/A #N/A #N/A
ADJ - W 363 360 355 353 #N/A #N/A #N/A #N/A #N/AΔ N 0 -6 -13 -11 #N/A #N/A #N/A #N/A #N/AΔ S 0 -8 -10 -12 #N/A #N/A #N/A #N/A #N/AΔ E 0 -11 -19 -18 #N/A #N/A #N/A #N/A #N/A
Δ W 0 -3 -8 -10 #N/A #N/A #N/A #N/A #N/A
E-23

Gage Value - Sealed Cylinder
360
370
380
390
400
410
420
430
0 5 10 15 20 25
Age (days)
Adj
uste
d G
auge
Val
ue (1
/10,
000
in)
ADJ - NADJ - SADJ - EADJ - W
Gauge Value - UnSealed Cylinder
340
350
360
370
380
390
400
410
420
430
0 5 10 15 20 25
Age (days)
Adj
uste
d G
uage
Val
ue (1
/10,
000
in)
ADJ - NADJ - SADJ - EADJ - W
E-24

Sealed Cylinder
-50
-40
-30
-20
-10
0
10
20
30
40
50
0 5 10 15 20 25
Age (days)
Gau
ge V
alue
Cha
nge
(1/1
0,00
0 in
)
D ND SD ED W
UnSealed Cylinder
-50
-40
-30
-20
-10
0
10
20
30
40
50
0 5 10 15 20 25
Age (days)
Gau
ge V
alue
Cha
nge
(1/1
0,00
0 in
)
D ND SD ED W
E-25

Temperature
64
66
68
70
72
74
76
78
80
0 5 10 15 20 25Age (days)
Cyl
inde
r Tem
p (d
egre
es(F
)
SealedUnSealedRod Temp
E-26

G1D-AC-7DayComments:
Girder Name: G1DCast Date: 09/12/05Cast Time: 5:00 PMRelease date: 09/13/05Cylinder Loading: 7DayCylinder Cure: ACPrep Work: Sealed UnSealedAmbient Temp (°F)Unwrap TimeCyl. Surf. Temp(°F)Humidity (%)
Shrinkage:Sealed
Date 09/13/05 09/13/05 09/14/05 09/15/05 09/16/05 09/17/05 09/18/05 09/19/05Time 1:20 PM 4:50 PM 2:25 PM 4:09 PM 11:02 AM 9:14 AM 7:20 PM 2:16 PM
Ambient Temp (°F) 74 72 66 66 62 63 68 68Cyl. Surf. Temp(°F) 76 66 69 64 64 70 71
(10,000 in) N 397 560 549 983 978 963 962 961S 430 583 571 998 995 992 991 996E 463 619 608 1039 1035 1030 1024 1021
W 359 510 499 928 923 913 911 915Age (days) 0.85 0.99 1.89 2.96 3.75 4.68 6.10 6.89 #N/A
Gauge Correction -14 -161 -154 -575 -571 -563 -570 -568 #N/ARod Temp (°F) 66 75 68 66 59 64 70 68 #N/A
ADJ - N 383 399 395 408 407 400 392 393 #N/AADJ - S 416 422 417 423 424 429 421 428 #N/AADJ - E 449 458 454 464 464 467 454 453 #N/A
ADJ - W 345 349 345 353 352 350 341 347 #N/AΔ N 0 16 12 25 24 17 9 10 #N/AΔ S 0 6 1 7 8 13 5 12 #N/AΔ E 0 9 5 15 15 18 5 4 #N/A
Δ W 0 4 0 8 7 5 -4 2 #N/A
UnSealedDate 09/13/05 09/13/05 09/14/05 09/15/05 09/16/05 09/17/05 09/18/05 09/19/05Time 1:20 PM 4:55 PM 2:27 PM 4:11 PM 11:04 AM 9:14 AM 7:22 PM 2:18 PM
Ambient Temp (°F) 74 72 66 66 62 63 68 68Cyl. Surf. Temp(°F) 77 69 66 64 64 70 67
(10,000 in) N 453 595 587 1010 1006 996 1003 999S 288 440 435 858 855 838 846 847E 209 355 348 776 770 760 762 756
W 354 506 502 933 929 919 926 928Age (days) 0.85 1.00 1.89 2.97 3.75 4.68 6.10 6.89 #N/A
Gauge Correction -14 -161 -154 -575 -571 -563 -570 -568 #N/ARod Temp (°F) 66 75 68 66 59 64 70 68 #N/A
ADJ - N 439 434 433 435 435 433 433 431 #N/AADJ - S 274 279 281 283 284 275 276 279 #N/AADJ - E 195 194 194 201 199 197 192 188 #N/A
ADJ - W 340 345 348 358 358 356 356 360 #N/AΔ N 0 -5 -6 -4 -4 -6 -6 -8 #N/AΔ S 0 5 7 9 10 1 2 5 #N/AΔ E 0 -1 -1 6 4 2 -3 -7 #N/A
Δ W 0 5 8 18 18 16 16 20 #N/A
E-27

Gage Value - Sealed Cylinder
0
50
100
150
200
250
300
350
400
450
500
0 5 10 15 20 25
Age (days)
Adj
uste
d G
auge
Val
ue (1
/10,
000
in)
ADJ - NADJ - SADJ - EADJ - W
Gauge Value - UnSealed Cylinder
0
50
100
150
200
250
300
350
400
450
500
0 5 10 15 20 25
Age (days)
Adj
uste
d G
uage
Val
ue (1
/10,
000
in)
ADJ - NADJ - SADJ - EADJ - W
E-28

Sealed Cylinder
-50
-40
-30
-20
-10
0
10
20
30
40
50
0 5 10 15 20 25
Age (days)
Gau
ge V
alue
Cha
nge
(1/1
0,00
0 in
)
D ND SD ED W
UnSealed Cylinder
-50
-40
-30
-20
-10
0
10
20
30
40
50
0 5 10 15 20 25
Age (days)
Gau
ge V
alue
Cha
nge
(1/1
0,00
0 in
)
D ND SD ED W
E-29

Temperature
0
10
20
30
40
50
60
70
80
90
0 5 10 15 20 25Age (days)
Cyl
inde
r Tem
p (d
egre
es(F
)
SealedUnSealedRod Temp
E-30
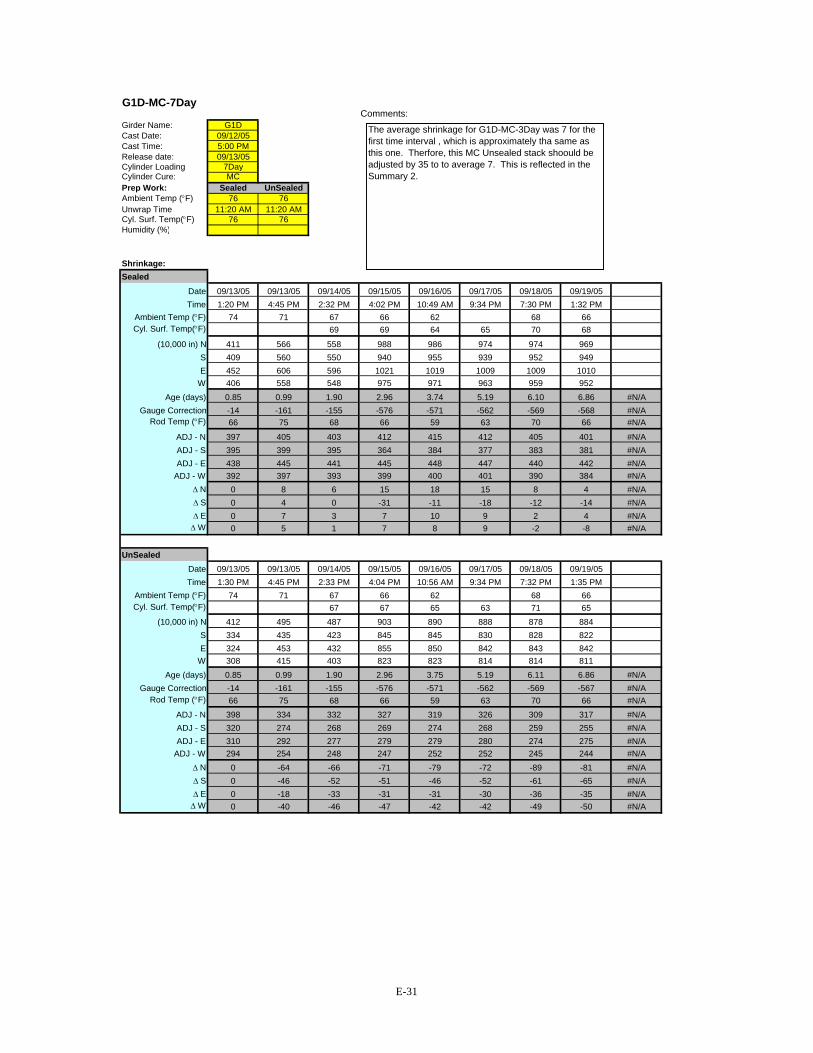
G1D-MC-7DayComments:
Girder Name: G1DCast Date: 09/12/05Cast Time: 5:00 PMRelease date: 09/13/05Cylinder Loading: 7DayCylinder Cure: MCPrep Work: Sealed UnSealedAmbient Temp (°F) 76 76Unwrap Time 11:20 AM 11:20 AMCyl. Surf. Temp(°F) 76 76Humidity (%)
Shrinkage:Sealed
Date 09/13/05 09/13/05 09/14/05 09/15/05 09/16/05 09/17/05 09/18/05 09/19/05Time 1:20 PM 4:45 PM 2:32 PM 4:02 PM 10:49 AM 9:34 PM 7:30 PM 1:32 PM
Ambient Temp (°F) 74 71 67 66 62 68 66Cyl. Surf. Temp(°F) 69 69 64 65 70 68
(10,000 in) N 411 566 558 988 986 974 974 969S 409 560 550 940 955 939 952 949E 452 606 596 1021 1019 1009 1009 1010
W 406 558 548 975 971 963 959 952Age (days) 0.85 0.99 1.90 2.96 3.74 5.19 6.10 6.86 #N/A
Gauge Correction -14 -161 -155 -576 -571 -562 -569 -568 #N/ARod Temp (°F) 66 75 68 66 59 63 70 66 #N/A
ADJ - N 397 405 403 412 415 412 405 401 #N/AADJ - S 395 399 395 364 384 377 383 381 #N/AADJ - E 438 445 441 445 448 447 440 442 #N/A
ADJ - W 392 397 393 399 400 401 390 384 #N/AΔ N 0 8 6 15 18 15 8 4 #N/AΔ S 0 4 0 -31 -11 -18 -12 -14 #N/AΔ E 0 7 3 7 10 9 2 4 #N/A
Δ W 0 5 1 7 8 9 -2 -8 #N/A
UnSealedDate 09/13/05 09/13/05 09/14/05 09/15/05 09/16/05 09/17/05 09/18/05 09/19/05Time 1:30 PM 4:45 PM 2:33 PM 4:04 PM 10:56 AM 9:34 PM 7:32 PM 1:35 PM
Ambient Temp (°F) 74 71 67 66 62 68 66Cyl. Surf. Temp(°F) 67 67 65 63 71 65
(10,000 in) N 412 495 487 903 890 888 878 884S 334 435 423 845 845 830 828 822E 324 453 432 855 850 842 843 842
W 308 415 403 823 823 814 814 811Age (days) 0.85 0.99 1.90 2.96 3.75 5.19 6.11 6.86 #N/A
Gauge Correction -14 -161 -155 -576 -571 -562 -569 -567 #N/ARod Temp (°F) 66 75 68 66 59 63 70 66 #N/A
ADJ - N 398 334 332 327 319 326 309 317 #N/AADJ - S 320 274 268 269 274 268 259 255 #N/AADJ - E 310 292 277 279 279 280 274 275 #N/A
ADJ - W 294 254 248 247 252 252 245 244 #N/AΔ N 0 -64 -66 -71 -79 -72 -89 -81 #N/AΔ S 0 -46 -52 -51 -46 -52 -61 -65 #N/AΔ E 0 -18 -33 -31 -31 -30 -36 -35 #N/A
Δ W 0 -40 -46 -47 -42 -42 -49 -50 #N/A
The average shrinkage for G1D-MC-3Day was 7 for the first time interval , which is approximately tha same as this one. Therfore, this MC Unsealed stack shoould be adjusted by 35 to to average 7. This is reflected in the Summary 2.
E-31

Gage Value - Sealed Cylinder
0
50
100
150
200
250
300
350
400
450
500
0 5 10 15 20 25
Age (days)
Adj
uste
d G
auge
Val
ue (1
/10,
000
in)
ADJ - NADJ - SADJ - EADJ - W
Gauge Value - UnSealed Cylinder
0
50
100
150
200
250
300
350
400
450
0 5 10 15 20 25
Age (days)
Adj
uste
d G
uage
Val
ue (1
/10,
000
in)
ADJ - NADJ - SADJ - EADJ - W
E-32

Sealed Cylinder
-50
-40
-30
-20
-10
0
10
20
30
40
50
0 5 10 15 20 25
Age (days)
Gau
ge V
alue
Cha
nge
(1/1
0,00
0 in
)
D ND SD ED W
UnSealed Cylinder
-100
-90
-80
-70
-60
-50
-40
-30
-20
-10
00 5 10 15 20 25
Age (days)
Gau
ge V
alue
Cha
nge
(1/1
0,00
0 in
)
D ND SD ED W
E-33

Temperature
0
10
20
30
40
50
60
70
80
0 5 10 15 20 25Age (days)
Cyl
inde
r Tem
p (d
egre
es(F
)
SealedUnSealedRod Temp
E-34

APPENDIX F
KEYS ROAD YARD MEASUREMENTS

Camber MeasurementsGirders CPM - Release UW Measurement
days in.Cast Date Time Mk # Date Time Age Camber Date Time
9/29/05 9:55 AM 6 10/3/05 4:00 AM 3.8 3.88 12/21/05 2:05 PM12/21/05 2:10 PM
11/8/05 9:15 AM 8B 11/9/05 6:00 AM 0.9 3.62 12/21/05 8:35 AM12/21/05 8:40 AM
11/10/05 9:15 AM 8B(Q) 11/11/05 7:00 AM 0.9 3.65 12/21/05 8:26 AM12/21/05 8:30 AM
11/12/05 9:00 AM 8B 11/14/05 6:00 AM 1.9 3.5 12/21/05 8:20 AM12/21/05 8:23 AM
11/15/05 12:00 PM 8B 11/16/05 12:00 PM 1.0 3.56 12/21/05 8:10 AM12/21/05 8:15 AM
11/18/05 8:15 AM 8B 11/21/05 5:00 AM 2.9 3.25 12/21/05 7:55 AM12/21/05 8:05 AM
11/22/05 8:00 AM 8B 11/23/05 7:00 AM 1.0 3.12 12/21/05 11:45 AM12/21/05 11:50 AM
11/29/05 11:00 AM 8B 11/30/05 10:30 AM 1.0 3.63 12/21/05 11:33 AM12/21/05 11:35 AM
12/2/05 10:00 AM 7F 12/5/05 8:00 AM 2.9 3.44 12/21/05 11:25 AM12/21/05 11:28 AM
12/6/05 10:00 AM 7F 12/7/05 9:00 AM 1.0 3.38 12/21/05 11:20 AM12/21/05 11:22 AM
12/8/05 9:45 AM 7F 12/9/05 7:00 AM 0.9 3.38 12/21/05 11:10 AM12/21/05 11:15 AM
12/13/05 10:15 AM 7F 12/14/05 9:00 AM 0.9 2.75 12/21/05 10:50 AM12/21/05 10:55 AM
12/15/05 12:15 PM 7F 12/16/05 7:00 AM 0.8 2.87 12/21/05 11:00 AM12/21/05 11:05 AM
F-1

Girders
Cast Date9/29/05
11/8/05
11/10/05
11/12/05
11/15/05
11/18/05
11/22/05
11/29/05
12/2/05
12/6/05
12/8/05
12/13/05
12/15/05
Face North Mid South Age Camber *CamberE 13 9/16 10 11/16 16 11/16 83.2 4.438 4.588W 10 15/16 7 13/16 13 7/8 4.594 4.750E 35 3/8 19 5/16 10 1/2 43.0 3.625 3.748W 34 7/16 18 1/16 9 5/8 3.969 4.104E 33 13/16 17 1/4 8 3/8 41.0 3.844 3.974W 35 5/16 18 7/16 9 13/16 4.125 4.265E 30 13 15/16 5 1/4 39.0 3.688 3.813W 33 3/16 16 11/16 8 7/16 4.125 4.265E 35 9/16 19 15/16 11 15/16 35.8 3.813 3.942W 34 9/16 18 7/16 10 7/8 4.281 4.427E 41 26 3/16 18 5/16 33.0 3.469 3.587W 35 7/16 20 5/16 12 1/2 3.656 3.781E 35 15/16 17 1/2 5 7/8 29.2 3.406 3.522W 35 5/16 16 1/4 4 15/16 3.875 4.007E 34 7/16 12 9/16 -1 1/8 22.0 4.094 4.233W 36 13 7/8 7/16 4.344 4.491E 35 1/8 17 9/16 7 5/16 19.1 3.656 3.781W 33 1/4 15 5/16 5 1/4 3.938 4.071E 32 5/8 15 7/8 6 1/4 15.1 3.563 3.684W 33 5/8 16 5/8 7 1/8 3.750 3.878E 34 13/16 18 1/8 8 7/16 13.1 3.500 3.619W 31 11/16 14 13/16 5 5/16 3.688 3.813E 30 9/16 17 7/16 10 13/16 8.0 3.250 3.361W 30 11/16 17 3/8 11 1/8 3.531 3.651E 30 1/4 17 3/4 11 3/16 5.9 2.969 3.070W 29 1/2 16 9/16 10 1/4 3.313 3.425
F-2

Girders
Cast Date9/29/05
11/8/05
11/10/05
11/12/05
11/15/05
11/18/05
11/22/05
11/29/05
12/2/05
12/6/05
12/8/05
12/13/05
12/15/05
1.034 = *Camber adjustment to end from bunk CompareisonAverage Diff Average Δ ΔCamber E-W N-S N-S N-S Camber Age
-3.1254.669 -0.156 -2.938 0.188 -3.031 0.789 79.4
24.8753.926 -0.344 24.813 -0.063 24.844 0.306 42.1
25.4384.120 -0.281 25.500 0.063 25.469 0.470 40.1
24.7504.039 -0.438 24.750 0.000 24.750 0.539 37.1
23.6254.184 -0.469 23.688 0.063 23.656 0.624 34.8
22.6883.684 -0.188 22.938 0.250 22.813 0.434 30.1
30.0633.764 -0.469 30.375 0.313 30.219 0.644 28.2
35.5634.362 -0.250 35.563 0.000 35.563 0.732 21.0
27.8133.926 -0.281 28.000 0.188 27.906 0.486 16.1
26.3753.781 -0.188 26.500 0.125 26.438 0.401 14.1
26.3753.716 -0.188 26.375 0.000 26.375 0.336 12.2
19.7503.506 -0.281 19.563 -0.188 19.656 0.756 7.1
19.0633.247 -0.344 19.250 0.188 19.156 0.377 5.2
F-3

Bottom Flange MeasurementsCast Mk Face Dist from Flange D Flenge DDate # (E/W) North End BOF TOF TOF-W @ End @ Web
11/15/05 8B E 89 20 25 1/4 3 13/16 5 1/4 9 3/16E 84 20 25 3/16 3 15/16 5 3/16 9 1/16E 79 20 25 1/8 4 5 1/8 9E 74 20 25 1/8 3 15/16 5 1/8 9 1/16E 69 20 25 1/8 3 15/16 5 1/8 9 1/16E 49 20 25 1/8 3 13/16 5 1/8 9 3/16E 29 20 25 3/16 3 3/4 5 3/16 9 1/4E 9 20 25 3/16 3 13/16 5 3/16 9 3/16E 0 20 25 3/16 3 13/16 5 3/16 9 3/16E 94 20 25 1/8 4 5 1/8 9E 99 20 25 3/16 3 15/16 5 3/16 9 1/16E 104 20 25 3/16 3 15/16 5 3/16 9 1/16E 109 20 25 3/16 3 7/8 5 3/16 9 1/8E 129 20 25 3/16 3 13/16 5 3/16 9 3/16E 149 20 25 1/8 3 7/8 5 1/8 9 1/8E 169 20 25 1/8 3 7/8 5 1/8 9 1/8E 178 20 25 3/8 3 1/4 5 3/8 9 3/4
11/18/05 8B E 178 20 25 1/4 3 7/8 5 1/4 9 1/8E 89 20 25 3/16 3 7/8 5 3/16 9 1/8E 0 20 25 3/16 3 3/4 5 3/16 9 1/4W 0 20 25 1/4 3 13/16 5 1/4 9 3/16W 89 20 25 3/16 3 3/4 5 3/16 9 1/4W 178 20 25 3/16 3 13/16 5 3/16 9 3/16
11/12/05 8B E 178 20 25 3/16 3 3/4 5 3/16 9 1/4E 89 20 25 3/16 3 7/8 5 3/16 9 1/8E 0 20 25 3/16 3 13/16 5 3/16 9 3/16W 0 20 25 1/4 3 13/16 5 1/4 9 3/16W 89 20 25 1/4 3 11/16 5 1/4 9 5/16W 178 20 25 3/16 3 13/16 5 3/16 9 3/16
11/10/05 8B E 178 20 25 3/16 3 3/4 5 3/16 9 1/4E 89 20 25 5/16 3 3/4 5 5/16 9 1/4E 20 3 11/16 9 5/16
Average = 5.194 9.182
Notes:BOF = Botom of BlangeTOF = Top of Flange at EdgeTOF-W = Top of Flange at Web
y = 0.0004x + 9.1445R2 = 0.0274
y = 6E-05x + 5.1879R2 = 0.00434
5
6
7
8
9
10
0 50 100 150 200Distance from north end (ft)
(in.)
Top of Flange at EdgeTop of Flange at WebLinear (Top of Flange at Web)Linear (Top of Flange at Edge)
F-4

Roller Test MeasurementsGirders UW Measurement
Cast InitialDate Camber Ave Date Time Face North Mid South
11/8/05 3.748 12/21/05 1:55 PM E 34 7/16 16 9/16 6 1/44.104 3.926 12/21/05 W 34 7/16 16 3/8 6 7/16
11/10/05 3.974 12/21/05 1:40 PM E 30 3/8 11 15/16 1 7/164.265 4.120 12/21/05 W 34 3/8 15 3/4 5 1/2
11/12/05 3.813 12/21/05 12:35 PM E 36 7/16 18 1/4 8 1/164.265 4.039 12/21/05 W 36 3/4 18 1/2 8 9/16
11/15/05 3.942 12/21/05 12:20 PM E 35 1/16 17 3/8 84.427 4.184 12/21/05 W 35 15/16 17 15/16 8 7/8
11/18/05 3.587 12/21/05 12:05 PM E 34 17 1/4 7 11/163.781 3.684 12/21/05 W 35 18 8 5/8
Cast Adj to end Ave ΔDate Camber *Camber Camber E-W Camber Average
11/8/05 3.781 3.910 0.1624.063 4.201 4.055 -0.281 0.097 0.129
11/10/05 3.969 4.104 0.1294.188 4.330 4.217 -0.219 0.065 0.097
11/12/05 4.000 4.136 0.3234.156 4.298 4.217 -0.156 0.032 0.178
11/15/05 4.156 4.298 0.3554.469 4.621 4.459 -0.313 0.194 0.275
11/18/05 3.594 3.716 0.1293.813 3.942 3.829 -0.219 0.162 0.145
* Adjustment to end camber from bunk = 1.034 Average (in.) = 0.165
F-5

APPENDIX G
KEYS ROAD CAMBER MEASUREMENTS

Date Temp (°F)11/30/2005 2612/5/2005 261/5/2006 33
2/10/2006 303/7/2006 55
4/13/2006 504/14/2006 504/27/2006 605/8/2006 55
5/14/2006 705/15/2006 706/10/2006 706/13/2006 706/14/2006 707/11/2006 857/17/2006 857/19/2006 808/16/2006 858/18/2006 858/21/2006 858/30/2006 8510/4/2006 7011/13/2006 40
Process Prior to setting, the monitoring positions were marked on the girder (top and bottom). Initial camber was measured prior to temporary strand cutting. Measurement was performed using a Leica Autolevel and rod. Measurements were taken on a monthly basis on top of the girders. Prior to the deck pour, the girders were measured on both the top and bottom to correlate the camber measurements. The bottom measurements were performed on the viaduct portion of the bridge only(spans 6-9). Monitoring continued from 24 hours after deck pour until mid November 2006. The data was checked daily for closure. The loop closed better than 1/5000.
NOTES:3-8, show before and after temp strand release.9, starts after temp strand release.
6, before and after deck pour on bottom.7-9, before deck pour top, after bottom.
several dates showing 1/5/2005 should be 1/5/2006.
potential errors in measurement. span 5, girder H, 1/5/2006 (1.91 in.) span 8, girder D, 8/16/2006 (6.58 in.)
G-1

Span 3Date
SurveyedTemp
(F) GirderWest Pier
ElevMidspan
ElevEast Pier
ElevCamber
(in) Comment
12/5/2005 26 A 1016.29 1017.22 1017.23 5.47Pre Strand Release (Top of Girder)
12/5/2005 26 A 1016.29 1017.22 1017.23 5.52After Temp Strands are Released (Top of Girder)
1/5/2006 33 A 1016.28 1017.23 1017.22 5.76Monthly Monitoring (Top of Girder)
2/10/2006 30 A 1016.30 1017.23 1017.24 5.52Monthly Monitoring (Top of Girder)
3/7/2006 55 A 1016.29 1017.24 1017.24 5.70Monthly Monitoring (Top of Girder)
4/27/2006 60 A 1016.27 1017.23 1017.22 5.82Monthly Monitoring (Top of Girder)
5/8/2006 55 A 1016.30 1017.21 1017.22 5.40Monthly Monitoring (Top of Girder)
12/5/2005 26 B 1016.42 1017.24 1017.32 4.44Pre Strand Release (Top of Girder)
12/5/2005 26 B 1016.42 1017.31 1017.32 5.28After Temp Strands are Released (Top of Girder)
1/5/2006 33 B 1016.42 1017.32 1017.34 5.28Monthly Monitoring (Top of Girder)
2/10/2006 30 B 1016.43 1017.31 1017.36 4.98Monthly Monitoring (Top of Girder)
3/7/2006 55 B 1016.43 1017.33 1017.36 5.22Monthly Monitoring (Top of Girder)
4/27/2006 60 B 1016.41 1017.32 1017.33 5.40Monthly Monitoring (Top of Girder)
5/8/2006 55 B 1016.43 1017.29 1017.34 4.86Monthly Monitoring (Top of Girder)
12/5/2005 26 C 1016.60 1017.35 1017.45 3.90Pre Strand Release (Top of Girder)
12/5/2005 26 C 1016.60 1017.42 1017.45 4.74After Temp Strands are Released (Top of Girder)
1/5/2006 50 C 1016.60 1017.42 1017.45 4.74Monthly Monitoring (Top of Girder)
2/10/2006 30 C 1016.62 1017.42 1017.47 4.50Monthly Monitoring (Top of Girder)
3/7/2006 55 C 1016.61 1017.43 1017.51 4.44Monthly Monitoring (Top of Girder)
4/27/2006 60 C 1016.59 1017.44 1017.47 4.92Monthly Monitoring (Top of Girder)
5/8/2006 55 C 1016.61 1017.40 1017.51 4.08Monthly Monitoring (Top of Girder)
G-2

Span 3Date
SurveyedTemp
(F) GirderWest Pier
ElevMidspan
ElevEast Pier
ElevCamber
(in) Comment
12/5/2005 26 D 1016.72 1017.56 1017.62 4.68Pre Strand Release (Top of Girder)
12/5/2005 26 D 1016.72 1017.63 1017.62 5.52After Temp Strands are Released (Top of Girder)
1/5/2006 50 D 1016.72 1017.63 1017.61 5.58Monthly Monitoring (Top of Girder)
2/10/2006 30 D 1016.72 1017.63 1017.62 5.52Monthly Monitoring (Top of Girder)
3/7/2006 55 D 1016.77 1017.65 1017.63 5.40Monthly Monitoring (Top of Girder)
4/27/2006 60 D 1016.72 1017.68 1017.61 6.18Monthly Monitoring (Top of Girder)
5/8/2006 55 D 1016.72 1017.61 1017.61 5.34Monthly Monitoring (Top of Girder)
12/5/2005 26 E 1016.88 1017.64 1017.78 3.72Pre Strand Release (Top of Girder)
12/5/2005 26 E 1016.88 1017.72 1017.78 4.68After Temp Strands are Released (Top of Girder)
1/5/2006 50 E 1016.88 1017.72 1017.78 4.68Monthly Monitoring (Top of Girder)
2/10/2006 30 E 1016.88 1017.72 1017.80 4.56Monthly Monitoring (Top of Girder)
3/7/2006 55 E 1016.89 1017.75 1017.84 4.62Monthly Monitoring (Top of Girder)
4/27/2006 60 E 1016.86 1017.74 1017.78 5.04Monthly Monitoring (Top of Girder)
5/8/2006 55 E 1016.88 1017.70 1017.78 4.44Monthly Monitoring (Top of Girder)
12/5/2005 26 F 1016.96 1017.76 1017.86 4.20Pre Strand Release (Top of Girder)
12/5/2005 26 F 1016.96 1017.83 1017.86 5.04After Temp Strands are Released (Top of Girder)
1/5/2006 50 F 1016.95 1017.82 1017.86 4.98Monthly Monitoring (Top of Girder)
2/10/2006 30 F 1016.96 1017.83 1017.87 4.98Monthly Monitoring (Top of Girder)
3/7/2006 55 F 1016.96 1017.85 1017.88 5.16Monthly Monitoring (Top of Girder)
4/27/2006 60 F 1016.94 1017.85 1017.87 5.34Monthly Monitoring (Top of Girder)
5/8/2006 55 F 1016.98 1017.81 1017.87 4.62Monthly Monitoring (Top of Girder)
G-3

Span 3Date
SurveyedTemp
(F) GirderWest Pier
ElevMidspan
ElevEast Pier
ElevCamber
(in) Comment
12/5/2005 26 G 1017.15 1017.89 1018.05 3.48Pre Strand Release (Top of Girder)
12/5/2005 26 G 1017.15 1017.96 1018.05 4.32After Temp Strands are Released (Top of Girder)
1/5/2006 50 G 1017.14 1017.95 1018.04 4.32Monthly Monitoring (Top of Girder)
2/10/2006 30 G 1017.15 1017.95 1018.06 4.14Monthly Monitoring (Top of Girder)
3/7/2006 55 G 1017.15 1017.97 1018.07 4.32Monthly Monitoring (Top of Girder)
4/27/2006 60 G 1017.13 1017.97 1018.05 4.56Monthly Monitoring (Top of Girder)
5/8/2006 55 G 1017.15 1017.93 1018.05 3.96Monthly Monitoring (Top of Girder)
12/5/2005 26 H 1017.21 1017.95 1018.10 3.54Pre Strand Release (Top of Girder)
12/5/2005 26 H 1017.21 1018.03 1018.10 4.50After Temp Strands are Released (Top of Girder)
1/5/2006 33 H 1017.21 1018.01 1018.09 4.32Monthly Monitoring (Top of Girder)
2/10/2006 30 H 1017.22 1018.02 1018.11 4.26Monthly Monitoring (Top of Girder)
3/7/2006 55 H 1017.22 1018.04 1018.11 4.50Monthly Monitoring (Top of Girder)
4/27/2006 60 H 1017.20 1018.05 1018.10 4.80Monthly Monitoring (Top of Girder)
5/8/2006 55 H 1017.21 1018.01 1018.10 4.26Monthly Monitoring (Top of Girder)
12/5/2005 26 I 1017.08 1017.90 1017.99 4.38Pre Strand Release (Top of Girder)
12/5/2005 26 I 1017.08 1017.97 1017.99 5.22After Temp Strands are Released (Top of Girder)
1/5/2006 33 I 1017.07 1017.96 1017.98 5.22Monthly Monitoring (Top of Girder)
2/10/2006 30 I 1017.08 1017.97 1017.99 5.22Monthly Monitoring (Top of Girder)
3/7/2006 55 I 1017.08 1017.99 1018.00 5.40Monthly Monitoring (Top of Girder)
4/27/2006 60 I 1017.06 1018.00 1017.97 5.82Monthly Monitoring (Top of Girder)
5/8/2006 55 I 1017.08 1017.95 1017.98 5.04Monthly Monitoring (Top of Girder)
G-4

Span 3Date
SurveyedTemp
(F) GirderWest Pier
ElevMidspan
ElevEast Pier
ElevCamber
(in) Comment
12/5/2005 26 J 1016.93 1017.73 1017.85 4.08Pre Strand Release (Top of Girder)
12/5/2005 26 J 1016.93 1017.79 1017.85 4.80After Temp Strands are Released (Top of Girder)
1/5/2006 33 J 1016.93 1017.79 1017.84 4.86Monthly Monitoring (Top of Girder)
2/10/2006 30 J 1016.94 1017.78 1017.86 4.56Monthly Monitoring (Top of Girder)
3/7/2006 55 J 1016.94 1017.81 1017.86 4.92Monthly Monitoring (Top of Girder)
4/27/2006 60 J 1016.92 1017.82 1017.84 5.28Monthly Monitoring (Top of Girder)
5/8/2006 55 J 1016.94 1017.78 1017.85 4.62Monthly Monitoring (Top of Girder)
12/5/2005 26 K 1016.87 1017.59 1017.72 3.54Pre Strand Release (Top of Girder)
12/5/2005 26 K 1016.87 1017.68 1017.72 4.62After Temp Strands are Released (Top of Girder)
1/5/2006 33 K 1016.85 1017.66 1017.71 4.56Monthly Monitoring (Top of Girder)
2/10/2006 30 K 1016.87 1017.66 1017.73 4.32Monthly Monitoring (Top of Girder)
3/7/2006 55 K 1016.87 1017.69 1017.74 4.62Monthly Monitoring (Top of Girder)
4/27/2006 60 K 1016.85 1017.69 1017.72 4.86Monthly Monitoring (Top of Girder)
5/8/2006 55 K 1016.86 1017.66 1017.72 4.44Monthly Monitoring (Top of Girder)
12/5/2005 26 L 1016.66 1017.49 1017.59 4.38Pre Strand Release (Top of Girder)
12/5/2005 26 L 1016.66 1017.56 1017.59 5.22After Temp Strands are Released (Top of Girder)
1/5/2006 50 L 1016.66 1017.56 1017.58 5.28Monthly Monitoring (Top of Girder)
2/10/2006 30 L 1016.67 1017.55 1017.59 5.04Monthly Monitoring (Top of Girder)
3/7/2006 55 L 1016.67 1017.58 1017.60 5.34Monthly Monitoring (Top of Girder)
4/27/2006 60 L 1016.65 1017.58 1017.58 5.58Monthly Monitoring (Top of Girder)
5/8/2006 55 L 1016.67 1017.55 1017.59 5.04Monthly Monitoring (Top of Girder)
G-5

Span 3Date
SurveyedTemp
(F) GirderWest Pier
ElevMidspan
ElevEast Pier
ElevCamber
(in) Comment
12/5/2005 26 M 1016.56 1017.30 1017.46 3.48Pre Strand Release (Top of Girder)
12/5/2005 26 M 1016.56 1017.37 1017.46 4.32After Temp Strands are Released (Top of Girder)
1/5/2006 50 M 1016.55 1017.37 1017.47 4.32Monthly Monitoring (Top of Girder)
2/10/2006 30 M 1016.56 1017.36 1017.47 4.14Monthly Monitoring (Top of Girder)
3/7/2006 55 M 1016.56 1017.38 1017.48 4.32Monthly Monitoring (Top of Girder)
4/27/2006 60 M 1016.53 1017.37 1017.44 4.62Monthly Monitoring (Top of Girder)
5/8/2006 55 M 1016.55 1017.34 1017.45 4.08Monthly Monitoring (Top of Girder)
G-6

Span 4Date
SurveyedTemp
(F) GirderWest Pier
ElevMidspan
ElevEast Pier
ElevCamber
(in) Comment
11/30/2005 26 A 1017.28 1017.85 1017.74 4.02Pre Strand Release (Top of Girder)
12/5/2005 26 A 1017.28 1017.91 1017.74 4.75After Temp Strands are Released (Top of Girder)
1/5/2006 33 A 1017.30 1017.93 1017.73 4.96 Monthly Monitoring (Top of Girder)
2/10/2006 30 A 1017.30 1017.93 1017.75 4.86 Monthly Monitoring (Top of Girder)
3/7/2006 55 A 1017.30 1017.91 1017.74 4.62 Monthly Monitoring (Top of Girder)
4/27/2006 60 A 1017.29 1017.93 1017.73 4.98 Monthly Monitoring (Top of Girder)
5/8/2006 55 A 1017.27 1017.88 1017.72 4.56 Monthly Monitoring (Top of Girder)
6/13/2006 70 A 1017.27 1017.89 1017.73 4.62 Monthly Monitoring (Top of Girder)
11/30/2005 26 B 1017.41 1018.00 1017.83 4.52Pre Strand Release (Top of Girder)
12/5/2005 26 B 1017.41 1018.05 1017.83 5.18After Temp Strands are Released (Top of Girder)
1/5/2006 33 B 1017.42 1018.06 1017.83 5.27 Monthly Monitoring (Top of Girder)
2/10/2006 30 B 1017.42 1018.10 1017.84 5.64 Monthly Monitoring (Top of Girder)
3/7/2006 55 B 1017.43 1018.06 1017.83 5.09 Monthly Monitoring (Top of Girder)
4/27/2006 60 B 1017.44 1018.09 1017.83 5.52 Monthly Monitoring (Top of Girder)
5/8/2006 55 B 1017.43 1018.04 1017.82 4.95 Monthly Monitoring (Top of Girder)
6/13/2006 70 B 1017.42 1018.05 1017.82 5.19 Monthly Monitoring (Top of Girder)
G-7

Span 4Date
SurveyedTemp
(F) GirderWest Pier
ElevMidspan
ElevEast Pier
ElevCamber
(in) Comment
11/30/2005 26 C 1017.54 1018.19 1017.92 5.47Pre Strand Release (Top of Girder)
12/5/2005 26 C 1017.54 1018.25 1017.92 6.25After Temp Strands are Released (Top of Girder)
1/5/2006 50 C 1017.55 1018.26 1018.02 5.75 Monthly Monitoring (Top of Girder)
2/10/2006 30 C 1017.55 1018.27 1018.02 5.82 Monthly Monitoring (Top of Girder)
3/7/2006 55 C 1017.57 1018.25 1018.01 5.57 Monthly Monitoring (Top of Girder)
4/27/2006 60 C 1017.56 1018.29 1018.02 6.00 Monthly Monitoring (Top of Girder)
5/8/2006 55 C 1017.56 1018.23 1018.01 5.31 Monthly Monitoring (Top of Girder)
6/13/2006 70 C 1017.53 1018.27 1018.03 5.85 Monthly Monitoring (Top of Girder)
11/30/2005 26 D 1017.69 1018.18 1018.11 3.32Pre Strand Release (Top of Girder)
12/5/2005 26 D 1017.69 1018.23 1018.11 3.98After Temp Strands are Released (Top of Girder)
1/5/2006 50 D 1017.69 1018.24 1018.10 4.04 Monthly Monitoring (Top of Girder)
2/10/2006 30 D 1017.70 1018.26 1018.12 4.20 Monthly Monitoring (Top of Girder)
3/7/2006 55 D 1017.70 1018.24 1018.10 3.99 Monthly Monitoring (Top of Girder)
4/27/2006 60 D 1017.70 1018.27 1018.10 4.44 Monthly Monitoring (Top of Girder)
5/8/2006 55 D 1017.68 1018.21 1018.10 3.87 Monthly Monitoring (Top of Girder)
6/13/2006 70 D 1017.69 1018.23 1018.10 4.08 Monthly Monitoring (Top of Girder)
G-8

Span 4Date
SurveyedTemp
(F) GirderWest Pier
ElevMidspan
ElevEast Pier
ElevCamber
(in) Comment
11/30/2005 26 E 1017.81 1018.40 1018.28 4.23Pre Strand Release (Top of Girder)
12/5/2005 26 E 1017.81 1018.44 1018.28 4.77After Temp Strands are Released (Top of Girder)
1/5/2006 50 E 1017.81 1018.46 1018.27 5.03 Monthly Monitoring (Top of Girder)
2/10/2006 30 E 1017.82 1018.48 1018.29 5.10 Monthly Monitoring (Top of Girder)
3/7/2006 55 E 1017.82 1018.45 1018.27 4.88 Monthly Monitoring (Top of Girder)
4/27/2006 60 E 1017.82 1018.49 1018.27 5.34 Monthly Monitoring (Top of Girder)
5/8/2006 55 E 1017.80 1018.43 1018.27 4.80 Monthly Monitoring (Top of Girder)
6/13/2006 70 E 1017.80 1018.45 1018.27 4.98 Monthly Monitoring (Top of Girder)
11/30/2005 26 F 1017.98 1018.50 1018.42 3.54Pre Strand Release (Top of Girder)
12/5/2005 26 F 1017.98 1018.56 1018.42 4.32After Temp Strands are Released (Top of Girder)
1/5/2006 50 F 1017.99 1018.59 1018.42 4.67 Monthly Monitoring (Top of Girder)
2/10/2006 30 F 1018.00 1018.59 1018.42 4.56 Monthly Monitoring (Top of Girder)
3/7/2006 55 F 1018.01 1018.57 1018.41 4.28 Monthly Monitoring (Top of Girder)
4/27/2006 60 F 1018.01 1018.60 1018.43 4.62 Monthly Monitoring (Top of Girder)
5/8/2006 55 F 1017.98 1018.54 1018.42 4.14 Monthly Monitoring (Top of Girder)
6/13/2006 70 F 1017.97 1018.55 1018.41 4.32 Monthly Monitoring (Top of Girder)
G-9

Span 4Date
SurveyedTemp
(F) GirderWest Pier
ElevMidspan
ElevEast Pier
ElevCamber
(in) Comment
11/30/2005 26 G 1018.09 1018.65 1018.53 4.02Pre Strand Release (Top of Girder)
12/5/2005 26 G 1018.09 1018.70 1018.53 4.68After Temp Strands are Released (Top of Girder)
1/5/2006 50 G 1018.07 1018.71 1018.53 4.87 Monthly Monitoring (Top of Girder)
2/10/2006 30 G 1018.10 1018.72 1018.55 4.74 Monthly Monitoring (Top of Girder)
3/7/2006 55 G 1018.10 1018.71 1018.53 4.74 Monthly Monitoring (Top of Girder)
4/27/2006 60 G 1018.09 1018.75 1018.53 5.28 Monthly Monitoring (Top of Girder)
5/8/2006 55 G 1018.08 1018.69 1018.53 4.65 Monthly Monitoring (Top of Girder)
6/13/2006 70 G 1018.08 1018.70 1018.53 4.74 Monthly Monitoring (Top of Girder)
G-10

Span 4Date
SurveyedTemp
(F) GirderWest Pier
ElevMidspan
ElevEast Pier
ElevCamber
(in) Comment
11/30/2005 26 H 1018.21 1018.77 1018.67 3.93Pre Strand Release (Top of Girder)
12/5/2005 26 H 1018.21 1018.82 1018.67 4.53After Temp Strands are Released (Top of Girder)
1/5/2006 33 H 1018.21 1018.82 1018.67 4.54 Monthly Monitoring (Top of Girder)
2/10/2006 30 H 1018.22 1018.83 1018.71 4.38 Monthly Monitoring (Top of Girder)
3/7/2006 55 H 1018.23 1018.81 1018.67 4.33 Monthly Monitoring (Top of Girder)
4/27/2006 60 H 1018.22 1018.85 1018.71 4.65 Monthly Monitoring (Top of Girder)
5/8/2006 55 H 1018.20 1018.80 1018.70 4.17 Monthly Monitoring (Top of Girder)
6/13/2006 70 H 1018.21 1018.82 1018.70 4.38 Monthly Monitoring (Top of Girder)
11/30/2005 26 I 1018.03 1018.59 1018.49 3.93Pre Strand Release (Top of Girder)
12/5/2005 26 I 1018.03 1018.63 1018.49 4.47After Temp Strands are Released (Top of Girder)
1/5/2006 33 I 1018.04 1018.71 1018.49 5.36 Monthly Monitoring (Top of Girder)
2/10/2006 30 I 1018.05 1018.65 1018.50 4.50 Monthly Monitoring (Top of Girder)
3/7/2006 55 I 1018.05 1018.65 1018.49 4.57 Monthly Monitoring (Top of Girder)
4/27/2006 60 I 1018.05 1018.70 1018.49 5.13 Monthly Monitoring (Top of Girder)
5/8/2006 55 I 1018.03 1018.64 1018.48 4.65 Monthly Monitoring (Top of Girder)
6/13/2006 70 I 1018.03 1018.64 1018.49 4.56 Monthly Monitoring (Top of Girder)
G-11

Span 4Date
SurveyedTemp
(F) GirderWest Pier
ElevMidspan
ElevEast Pier
ElevCamber
(in) Comment
11/30/2005 26 J 1017.95 1018.48 1018.37 3.78Pre Strand Release (Top of Girder)
12/5/2005 26 J 1017.95 1018.54 1018.37 4.56After Temp Strands are Released (Top of Girder)
1/5/2006 33 J 1017.95 1018.55 1018.37 4.76 Monthly Monitoring (Top of Girder)
2/10/2006 30 J 1017.96 1018.56 1018.38 4.68 Monthly Monitoring (Top of Girder)
3/7/2006 55 J 1017.96 1018.55 1018.37 4.60 Monthly Monitoring (Top of Girder)
4/27/2006 60 J 1017.96 1018.60 1018.36 5.22 Monthly Monitoring (Top of Girder)
5/8/2006 55 J 1017.94 1018.54 1018.36 4.65 Monthly Monitoring (Top of Girder)
6/13/2006 70 J 1017.94 1018.55 1018.36 4.80 Monthly Monitoring (Top of Girder)
11/30/2005 26 K 1017.77 1018.37 1018.23 4.38Pre Strand Release (Top of Girder)
12/5/2005 26 K 1017.77 1018.42 1018.23 4.98After Temp Strands are Released (Top of Girder)
1/5/2006 33 K 1017.77 1018.43 1018.23 5.11 Monthly Monitoring (Top of Girder)
2/10/2006 30 K 1017.79 1018.45 1018.25 5.16 Monthly Monitoring (Top of Girder)
3/7/2006 55 K 1017.80 1018.43 1018.24 4.93 Monthly Monitoring (Top of Girder)
4/27/2006 60 K 1017.79 1018.47 1018.23 5.49 Monthly Monitoring (Top of Girder)
5/8/2006 55 K 1017.77 1018.43 1018.23 5.16 Monthly Monitoring (Top of Girder)
6/13/2006 70 K 1017.77 1018.44 1018.22 5.31 Monthly Monitoring (Top of Girder)
G-12

Span 4Date
SurveyedTemp
(F) GirderWest Pier
ElevMidspan
ElevEast Pier
ElevCamber
(in) Comment
11/30/2005 26 L 1017.63 1018.15 1018.12 3.24Pre Strand Release (Top of Girder)
12/5/2005 26 L 1017.63 1018.21 1018.12 4.02After Temp Strands are Released (Top of Girder)
1/5/2006 50 L 1017.63 1018.23 1018.13 4.18 Monthly Monitoring (Top of Girder)
2/10/2006 30 L 1017.64 1018.21 1018.13 3.90 Monthly Monitoring (Top of Girder)
3/7/2006 55 L 1017.65 1018.21 1018.13 3.85 Monthly Monitoring (Top of Girder)
4/27/2006 60 L 1017.64 1018.25 1018.12 4.44 Monthly Monitoring (Top of Girder)
5/8/2006 55 L 1017.62 1018.21 1018.12 4.05 Monthly Monitoring (Top of Girder)
6/13/2006 70 L 1017.62 1018.21 1018.12 4.14 Monthly Monitoring (Top of Girder)
11/30/2005 26 M 1017.53 1018.13 1017.94 4.68Pre Strand Release (Top of Girder)
12/5/2005 26 M 1017.53 1018.17 1017.94 5.22After Temp Strands are Released (Top of Girder)
1/5/2006 50 M 1017.53 1018.18 1017.94 5.30 Monthly Monitoring (Top of Girder)
2/10/2006 30 M 1017.54 1018.18 1017.94 5.28 Monthly Monitoring (Top of Girder)
3/7/2006 55 M 1017.55 1018.19 1017.94 5.37 Monthly Monitoring (Top of Girder)
4/27/2006 60 M 1017.55 1018.19 1017.93 5.40 Monthly Monitoring (Top of Girder)
5/8/2006 55 M 1017.54 1018.15 1017.92 4.98 Monthly Monitoring (Top of Girder)
6/13/2006 70 M 1017.53 1018.16 1017.93 5.19 Monthly Monitoring (Top of Girder)
G-13

Span 5Date
SurveyedTemp
(F) GirderWest Pier
ElevMidspan
ElevEast Pier
ElevCamber
(in) Comment
11/30/2005 26 A 1017.75 1018.00 1017.66 3.52Pre Strand Release (Top of Girder)
12/5/2005 26 A 1017.75 1018.09 1017.66 4.64After Temp Strands are Released (Top of Girder)
1/5/2006 33 A 1017.75 1018.08 1017.66 4.52Monthly Monitoring (Top of Girder)
2/10/2006 30 A 1017.74 1018.09 1017.68 4.56Monthly Monitoring (Top of Girder)
3/7/2006 55 A 1017.73 1018.08 1017.68 4.46Monthly Monitoring (Top of Girder)
4/27/2006 60 A 1017.74 1018.10 1017.65 4.89Monthly Monitoring (Top of Girder)
5/8/2006 55 A 1017.74 1018.07 1017.66 4.50Monthly Monitoring (Top of Girder)
6/13/2006 70 A 1017.72 1018.07 1017.65 4.62Monthly Monitoring (Top of Girder)
11/30/2005 26 B 1017.86 1018.16 1017.82 3.81Pre Strand Release (Top of Girder)
12/5/2005 26 B 1017.86 1018.23 1017.82 4.70After Temp Strands are Released (Top of Girder)
1/5/2006 33 B 1017.86 1018.24 1017.82 4.79Monthly Monitoring (Top of Girder)
2/10/2006 30 B 1017.85 1018.22 1017.82 4.62Monthly Monitoring (Top of Girder)
3/7/2006 55 B 1017.86 1018.20 1017.82 4.36Monthly Monitoring (Top of Girder)
4/27/2006 60 B 1017.86 1018.23 1017.80 4.77Monthly Monitoring (Top of Girder)
5/8/2006 55 B 1017.86 1018.22 1017.80 4.65Monthly Monitoring (Top of Girder)
6/13/2006 70 B 1017.86 1018.20 1017.80 4.50Monthly Monitoring (Top of Girder)
G-14

Span 5Date
SurveyedTemp
(F) GirderWest Pier
ElevMidspan
ElevEast Pier
ElevCamber
(in) Comment
11/30/2005 26 C 1018.00 1018.31 1017.93 4.13Pre Strand Release (Top of Girder)
12/5/2005 26 C 1018.00 1018.38 1017.93 5.05After Temp Strands are Released (Top of Girder)
1/5/2006 33 C 1018.00 1018.39 1017.93 5.12Monthly Monitoring (Top of Girder)
2/10/2006 30 C 1018.00 1018.37 1017.93 4.86Monthly Monitoring (Top of Girder)
3/7/2006 55 C 1017.99 1018.36 1017.93 4.77Monthly Monitoring (Top of Girder)
4/27/2006 60 C 1018.00 1018.39 1017.91 5.19Monthly Monitoring (Top of Girder)
5/8/2006 55 C 1017.99 1018.37 1017.91 5.01Monthly Monitoring (Top of Girder)
6/13/2006 70 C 1017.98 1018.36 1017.91 4.92Monthly Monitoring (Top of Girder)
11/30/2005 26 D 1018.17 1018.46 1018.09 3.99Pre Strand Release (Top of Girder)
12/5/2005 26 D 1018.17 1018.53 1018.09 4.88After Temp Strands are Released (Top of Girder)
1/5/2006 33 D 1018.17 1018.54 1018.08 4.99Monthly Monitoring (Top of Girder)
2/10/2006 30 D 1018.18 1018.52 1018.08 4.68Monthly Monitoring (Top of Girder)
3/7/2006 55 D 1018.17 1018.51 1018.09 4.63Monthly Monitoring (Top of Girder)
4/27/2006 60 D 1018.17 1018.53 1018.09 4.86Monthly Monitoring (Top of Girder)
5/8/2006 55 D 1018.17 1018.52 1018.07 4.80Monthly Monitoring (Top of Girder)
6/13/2006 70 D 1018.16 1018.50 1018.07 4.65Monthly Monitoring (Top of Girder)
G-15

Span 5Date
SurveyedTemp
(F) GirderWest Pier
ElevMidspan
ElevEast Pier
ElevCamber
(in) Comment
11/30/2005 26 E 1018.31 1018.55 1018.22 3.37Pre Strand Release (Top of Girder)
12/5/2005 26 E 1018.31 1018.62 1018.22 4.23After Temp Strands are Released (Top of Girder)
1/5/2006 33 E 1018.31 1018.63 1018.22 4.43Monthly Monitoring (Top of Girder)
2/10/2006 30 E 1018.32 1018.60 1018.22 3.96Monthly Monitoring (Top of Girder)
3/7/2006 55 E 1018.31 1018.60 1018.22 3.99Monthly Monitoring (Top of Girder)
4/27/2006 60 E 1018.32 1018.63 1018.20 4.44Monthly Monitoring (Top of Girder)
5/8/2006 55 E 1018.31 1018.62 1018.20 4.32Monthly Monitoring (Top of Girder)
6/13/2006 70 E 1018.31 1018.58 1018.20 3.93Monthly Monitoring (Top of Girder)
11/30/2005 26 F 1018.45 1018.73 1018.35 3.95Pre Strand Release (Top of Girder)
12/5/2005 26 F 1018.45 1018.80 1018.35 4.74After Temp Strands are Released (Top of Girder)
1/5/2006 33 F 1018.44 1018.82 1018.35 5.06Monthly Monitoring (Top of Girder)
2/10/2006 30 F 1018.45 1018.79 1018.35 4.68Monthly Monitoring (Top of Girder)
3/7/2006 55 F 1018.44 1018.77 1018.35 4.46Monthly Monitoring (Top of Girder)
4/27/2006 60 F 1018.44 1018.79 1018.36 4.71Monthly Monitoring (Top of Girder)
5/8/2006 55 F 1018.44 1018.78 1018.34 4.65Monthly Monitoring (Top of Girder)
6/13/2006 70 F 1018.41 1018.75 1018.35 4.44Monthly Monitoring (Top of Girder)
G-16

Span 5Date
SurveyedTemp
(F) GirderWest Pier
ElevMidspan
ElevEast Pier
ElevCamber
(in) Comment
11/30/2005 26 G 1018.59 1018.85 1018.47 3.80Pre Strand Release (Top of Girder)
12/5/2005 26 G 1018.59 1018.93 1018.47 4.76After Temp Strands are Released (Top of Girder)
1/5/2006 33 G 1018.58 1018.93 1018.47 4.88Monthly Monitoring (Top of Girder)
2/10/2006 30 G 1018.62 1018.91 1018.47 4.38Monthly Monitoring (Top of Girder)
3/7/2006 55 G 1018.58 1018.89 1018.47 4.43Monthly Monitoring (Top of Girder)
4/27/2006 60 G 1018.58 1018.92 1018.45 4.80Monthly Monitoring (Top of Girder)
5/8/2006 55 G 1018.58 1018.90 1018.45 4.65Monthly Monitoring (Top of Girder)
6/13/2006 70 G 1018.58 1018.89 1018.45 4.50Monthly Monitoring (Top of Girder)
11/30/2005 26 H 1018.71 1018.91 1018.59 3.11Pre Strand Release (Top of Girder)
12/5/2005 26 H 1018.71 1018.99 1018.59 4.08After Temp Strands are Released (Top of Girder)
1/5/2006 33 H 1018.70 1018.99 1018.97 #N/AMonthly Monitoring (Top of Girder)
2/10/2006 30 H 1018.69 1018.96 1018.59 3.84Monthly Monitoring (Top of Girder)
3/7/2006 55 H 1018.70 1018.96 1018.60 3.72Monthly Monitoring (Top of Girder)
4/27/2006 60 H 1018.70 1018.99 1018.57 4.20Monthly Monitoring (Top of Girder)
5/8/2006 55 H 1018.71 1018.97 1018.57 3.93Monthly Monitoring (Top of Girder)
6/13/2006 70 H 1018.68 1018.95 1018.57 3.90Monthly Monitoring (Top of Girder)
G-17

Span 5Date
SurveyedTemp
(F) GirderWest Pier
ElevMidspan
ElevEast Pier
ElevCamber
(in) Comment
11/30/2005 26 I 1018.53 1018.77 1018.43 3.50Pre Strand Release (Top of Girder)
12/5/2005 26 I 1018.53 1018.84 1018.43 4.32After Temp Strands are Released (Top of Girder)
1/5/2006 33 I 1018.53 1018.86 1018.43 4.57Monthly Monitoring (Top of Girder)
2/10/2006 30 I 1018.54 1018.84 1018.43 4.26Monthly Monitoring (Top of Girder)
3/7/2006 55 I 1018.53 1018.83 1018.43 4.16Monthly Monitoring (Top of Girder)
4/27/2006 60 I 1018.52 1018.86 1018.42 4.65Monthly Monitoring (Top of Girder)
5/8/2006 55 I 1018.54 1018.85 1018.42 4.44Monthly Monitoring (Top of Girder)
6/13/2006 70 I 1018.52 1018.82 1018.41 4.29Monthly Monitoring (Top of Girder)
11/30/2005 26 J 1018.38 1018.62 1018.31 3.25Pre Strand Release (Top of Girder)
12/5/2005 26 J 1018.38 1018.69 1018.31 4.14After Temp Strands are Released (Top of Girder)
1/5/2006 33 J 1018.38 1018.70 1018.30 4.37Monthly Monitoring (Top of Girder)
2/10/2006 30 J 1018.39 1018.69 1018.31 4.08Monthly Monitoring (Top of Girder)
3/7/2006 55 J 1018.38 1018.68 1018.30 4.07Monthly Monitoring (Top of Girder)
4/27/2006 60 J 1018.38 1018.71 1018.28 4.53Monthly Monitoring (Top of Girder)
5/8/2006 55 J 1018.38 1018.70 1018.29 4.35Monthly Monitoring (Top of Girder)
6/13/2006 70 J 1018.36 1018.68 1018.29 4.20Monthly Monitoring (Top of Girder)
G-18
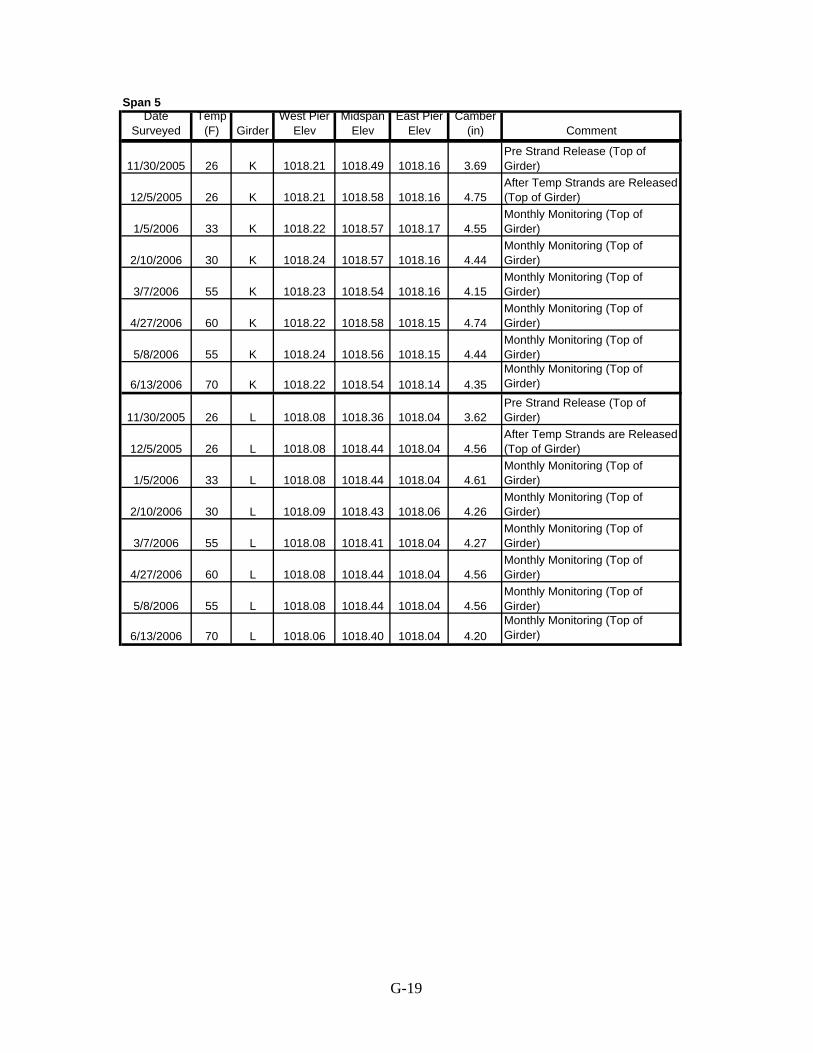
Span 5Date
SurveyedTemp
(F) GirderWest Pier
ElevMidspan
ElevEast Pier
ElevCamber
(in) Comment
11/30/2005 26 K 1018.21 1018.49 1018.16 3.69Pre Strand Release (Top of Girder)
12/5/2005 26 K 1018.21 1018.58 1018.16 4.75After Temp Strands are Released (Top of Girder)
1/5/2006 33 K 1018.22 1018.57 1018.17 4.55Monthly Monitoring (Top of Girder)
2/10/2006 30 K 1018.24 1018.57 1018.16 4.44Monthly Monitoring (Top of Girder)
3/7/2006 55 K 1018.23 1018.54 1018.16 4.15Monthly Monitoring (Top of Girder)
4/27/2006 60 K 1018.22 1018.58 1018.15 4.74Monthly Monitoring (Top of Girder)
5/8/2006 55 K 1018.24 1018.56 1018.15 4.44Monthly Monitoring (Top of Girder)
6/13/2006 70 K 1018.22 1018.54 1018.14 4.35Monthly Monitoring (Top of Girder)
11/30/2005 26 L 1018.08 1018.36 1018.04 3.62Pre Strand Release (Top of Girder)
12/5/2005 26 L 1018.08 1018.44 1018.04 4.56After Temp Strands are Released (Top of Girder)
1/5/2006 33 L 1018.08 1018.44 1018.04 4.61Monthly Monitoring (Top of Girder)
2/10/2006 30 L 1018.09 1018.43 1018.06 4.26Monthly Monitoring (Top of Girder)
3/7/2006 55 L 1018.08 1018.41 1018.04 4.27Monthly Monitoring (Top of Girder)
4/27/2006 60 L 1018.08 1018.44 1018.04 4.56Monthly Monitoring (Top of Girder)
5/8/2006 55 L 1018.08 1018.44 1018.04 4.56Monthly Monitoring (Top of Girder)
6/13/2006 70 L 1018.06 1018.40 1018.04 4.20Monthly Monitoring (Top of Girder)
G-19

Span 5Date
SurveyedTemp
(F) GirderWest Pier
ElevMidspan
ElevEast Pier
ElevCamber
(in) Comment
11/30/2005 26 M 1017.99 1018.33 1017.91 4.50Pre Strand Release (Top of Girder)
12/5/2005 26 M 1017.99 1018.40 1017.91 5.36After Temp Strands are Released (Top of Girder)
1/5/2006 33 M 1017.97 1018.42 1017.91 5.82Monthly Monitoring (Top of Girder)
2/10/2006 30 M 1017.97 1018.39 1017.92 5.34Monthly Monitoring (Top of Girder)
3/7/2006 55 M 1017.97 1018.38 1017.91 5.29Monthly Monitoring (Top of Girder)
4/27/2006 60 M 1017.98 1018.39 1017.89 5.49Monthly Monitoring (Top of Girder)
5/8/2006 55 M 1017.98 1018.38 1017.89 5.31Monthly Monitoring (Top of Girder)
6/13/2006 70 M 1017.96 1018.35 1017.90 5.07Monthly Monitoring (Top of Girder)
G-20

Span 6Date
SurveyedTemp
(F) GirderWest Pier
ElevMidspan
ElevEast Pier
ElevCamber
(in) Comment
4/13/2006 50 A 1017.65 1017.69 1017.09 3.78 Pre Strand Release (Top of Girder)
4/14/2006 50 A 1017.65 1017.73 1017.09 4.32After Temp Strands are Released (Top of Girder)
5/8/2006 50 A 1017.68 1017.78 1017.12 4.50 Monthly Monitoring (Top of Girder)
6/13/2006 70 A 1017.70 1017.78 1017.14 4.35 Monthly Monitoring (Top of Girder)
7/11/2006 85 A 1017.70 1017.68 1017.17 2.94Monthly Monitoring (Top of Girder) and Before Deck Pour
7/11/2006 85 A 1010.77 1010.72 1010.21 2.73 Before Deck Pour (Bottom of Girder)
7/19/2006 80 A 1010.77 1010.59 1010.22 1.081 Day After Deck Pour (Bottom of Girder)
8/18/2006 85 A 1010.76 1010.51 1010.21 0.24 Monthly Monitoring (Bottom of Girder)
11/13/2006 40 A 1010.77 1010.49 1010.20 0.09 Monthly Monitoring (Bottom of Girder)
4/13/2006 50 B 1017.74 1017.87 1017.24 4.53 Pre Strand Release (Top of Girder)
4/14/2006 50 B 1017.74 1017.92 1017.24 5.19After Temp Strands are Released (Top of Girder)
5/8/2006 50 B 1017.77 1017.96 1017.26 5.28 Monthly Monitoring (Top of Girder)
6/13/2006 70 B 1017.79 1017.96 1017.26 5.25 Monthly Monitoring (Top of Girder)
7/11/2006 85 B 1017.80 1017.88 1017.32 3.84Monthly Monitoring (Top of Girder) and Before Deck Pour
7/11/2006 85 B 1010.89 1010.89 1010.36 3.18 Before Deck Pour (Bottom of Girder)
7/19/2006 80 B 1010.88 1010.77 1010.37 1.741 Day After Deck Pour (Bottom of Girder)
8/18/2006 85 B 1010.87 1010.68 1010.35 0.84 Monthly Monitoring (Bottom of Girder)
11/13/2006 40 B 1010.87 1010.68 1010.32 0.99 Monthly Monitoring (Bottom of Girder)
G-21

Span 6Date
SurveyedTemp
(F) GirderWest Pier
ElevMidspan
ElevEast Pier
ElevCamber
(in) Comment
4/13/2006 50 C 1017.90 1018.07 1017.37 5.22 Pre Strand Release (Top of Girder)
4/14/2006 50 C 1017.90 1018.12 1017.37 5.82After Temp Strands are Released (Top of Girder)
5/8/2006 50 C 1017.92 1018.16 1017.40 6.00 Monthly Monitoring (Top of Girder)
6/13/2006 70 C 1017.93 1018.16 1017.44 5.67 Monthly Monitoring (Top of Girder)
7/11/2006 85 C 1018.01 1018.09 1017.46 4.26Monthly Monitoring (Top of Girder) and Before Deck Pour
7/11/2006 85 C 1011.03 1011.08 1010.52 3.72 Before Deck Pour (Bottom of Girder)
7/19/2006 80 C 1011.03 1010.98 1010.53 2.461 Day After Deck Pour (Bottom of Girder)
8/18/2006 85 C 1011.02 1010.89 1010.51 1.50 Monthly Monitoring (Bottom of Girder)
11/13/2006 40 C 1011.02 1010.89 1010.49 1.68 Monthly Monitoring (Bottom of Girder)
4/13/2006 50 D 1018.04 1018.11 1017.52 3.96 Pre Strand Release (Top of Girder)
4/14/2006 50 D 1018.04 1018.17 1017.52 4.68After Temp Strands are Released (Top of Girder)
5/8/2006 50 D 1018.08 1018.22 1017.56 4.80 Monthly Monitoring (Top of Girder)
6/13/2006 70 D 1018.09 1018.21 1017.56 4.62 Monthly Monitoring (Top of Girder)
7/11/2006 85 D 1018.10 1018.13 1017.61 3.30Monthly Monitoring (Top of Girder) and Before Deck Pour
7/11/2006 85 D 1011.16 1011.17 1010.65 3.15 Before Deck Pour (Bottom of Girder)
7/19/2006 80 D 1011.16 1011.06 1010.64 1.921 Day After Deck Pour (Bottom of Girder)
8/18/2006 85 D 1011.16 1010.97 1010.63 0.93 Monthly Monitoring (Bottom of Girder)
11/13/2006 40 D 1011.15 1010.97 1010.62 1.05 Monthly Monitoring (Bottom of Girder)
G-22

Span 6Date
SurveyedTemp
(F) GirderWest Pier
ElevMidspan
ElevEast Pier
ElevCamber
(in) Comment
4/13/2006 50 E 1018.13 1018.29 1017.67 4.68 Pre Strand Release (Top of Girder)
4/14/2006 50 E 1018.13 1018.35 1017.67 5.34After Temp Strands are Released (Top of Girder)
5/8/2006 50 E 1018.16 1018.38 1017.70 5.43 Monthly Monitoring (Top of Girder)
6/13/2006 70 E 1018.19 1018.37 1017.72 4.98 Monthly Monitoring (Top of Girder)
7/11/2006 85 E 1018.21 1018.32 1017.75 4.08Monthly Monitoring (Top of Girder) and Before Deck Pour
7/11/2006 85 E 1011.29 1011.37 1010.80 3.90 Before Deck Pour (Bottom of Girder)
7/19/2006 80 E 1011.29 1011.27 1010.80 2.671 Day After Deck Pour (Bottom of Girder)
8/18/2006 85 E 1011.28 1011.17 1010.78 1.68 Monthly Monitoring (Bottom of Girder)
11/13/2006 40 E 1011.28 1011.17 1010.77 1.71 Monthly Monitoring (Bottom of Girder)
4/13/2006 50 F 1018.33 1018.39 1017.75 4.20 Pre Strand Release (Top of Girder)
4/14/2006 50 F 1018.33 1018.44 1017.75 4.86After Temp Strands are Released (Top of Girder)
5/8/2006 50 F 1018.36 1018.48 1017.77 4.95 Monthly Monitoring (Top of Girder)
6/13/2006 70 F 1018.37 1018.45 1017.80 4.41 Monthly Monitoring (Top of Girder)
7/11/2006 85 F#N/A #N/A #N/A #N/A Monthly Monitoring (Top of Girder)
and Before Deck Pour
7/11/2006 85 F 1011.43 1011.44 1010.89 3.33 Before Deck Pour (Bottom of Girder)
7/19/2006 80 F 1011.43 1011.34 1010.89 2.191 Day After Deck Pour (Bottom of Girder)
8/18/2006 85 F 1011.42 1011.25 1010.88 1.20 Monthly Monitoring (Bottom of Girder)
11/13/2006 40 F 1011.42 1011.25 1010.88 1.26 Monthly Monitoring (Bottom of Girder)
G-23

Span 6Date
SurveyedTemp
(F) GirderWest Pier
ElevMidspan
ElevEast Pier
ElevCamber
(in) Comment
4/13/2006 50 G 1018.48 1018.53 1017.90 4.05 Pre Strand Release (Top of Girder)
4/14/2006 50 G 1018.48 1018.57 1017.90 4.59After Temp Strands are Released (Top of Girder)
5/8/2006 50 G 1018.51 1018.61 1017.93 4.68 Monthly Monitoring (Top of Girder)
6/13/2006 70 G 1018.52 1018.60 1017.95 4.38 Monthly Monitoring (Top of Girder)
7/11/2006 85 G 1018.52 1018.55 1017.98 3.60Monthly Monitoring (Top of Girder) and Before Deck Pour
7/11/2006 85 G 1011.59 1011.60 1011.05 3.33 Before Deck Pour (Bottom of Girder)
7/19/2006 80 G 1011.59 1011.51 1011.06 2.251 Day After Deck Pour (Bottom of Girder)
8/18/2006 85 G 1011.58 1011.41 1011.04 1.14 Monthly Monitoring (Bottom of Girder)
11/13/2006 40 G 1011.59 1011.41 1011.03 1.17 Monthly Monitoring (Bottom of Girder)
4/13/2006 50 H 1018.53 1018.68 1018.08 4.50 Pre Strand Release (Top of Girder)
4/14/2006 50 H 1018.53 1018.73 1018.08 5.10After Temp Strands are Released (Top of Girder)
5/8/2006 50 H 1018.56 1018.77 1018.11 5.22 Monthly Monitoring (Top of Girder)
6/13/2006 70 H 1018.59 1018.78 1018.13 5.04 Monthly Monitoring (Top of Girder)
7/11/2006 85 H 1018.60 1018.71 1018.16 3.96Monthly Monitoring (Top of Girder) and Before Deck Pour
7/11/2006 85 H 1011.65 1011.76 1011.20 3.99 Before Deck Pour (Bottom of Girder)
7/19/2006 80 H 1011.65 1011.65 1011.20 2.701 Day After Deck Pour (Bottom of Girder)
8/18/2006 85 H 1011.64 1011.56 1011.20 1.68 Monthly Monitoring (Bottom of Girder)
11/13/2006 40 H 1011.65 1011.56 1011.17 1.80 Monthly Monitoring (Bottom of Girder)
G-24

Span 6Date
SurveyedTemp
(F) GirderWest Pier
ElevMidspan
ElevEast Pier
ElevCamber
(in) Comment
4/13/2006 50 I 1018.41 1018.68 1018.28 3.99 Pre Strand Release (Top of Girder)
4/14/2006 50 I 1018.41 1018.74 1018.28 4.77After Temp Strands are Released (Top of Girder)
5/8/2006 50 I 1018.44 1018.78 1018.30 4.92 Monthly Monitoring (Top of Girder)
6/13/2006 70 I 1018.45 1018.77 1018.33 4.56 Monthly Monitoring (Top of Girder)
7/11/2006 85 I#N/A #N/A #N/A #N/A Monthly Monitoring (Top of Girder)
and Before Deck Pour
7/11/2006 85 I 1011.52 1011.75 1011.33 3.90 Before Deck Pour (Bottom of Girder)
7/19/2006 80 I 1011.52 1011.65 1011.33 2.731 Day After Deck Pour (Bottom of Girder)
8/18/2006 85 I 1011.51 1011.55 1011.32 1.62 Monthly Monitoring (Bottom of Girder)
11/13/2006 40 I 1011.51 1011.55 1011.30 1.71 Monthly Monitoring (Bottom of Girder)
4/13/2006 50 J 1018.29 1018.67 1018.35 4.20 Pre Strand Release (Top of Girder)
4/14/2006 50 J 1018.29 1018.73 1018.35 4.92After Temp Strands are Released (Top of Girder)
5/8/2006 50 J 1018.32 1018.78 1018.38 5.10 Monthly Monitoring (Top of Girder)
6/13/2006 70 J 1018.33 1018.78 1018.41 4.92 Monthly Monitoring (Top of Girder)
7/11/2006 85 J 1018.39 1018.71 1018.43 3.60Monthly Monitoring (Top of Girder) and Before Deck Pour
7/11/2006 85 J 1011.40 1011.74 1011.46 3.78 Before Deck Pour (Bottom of Girder)
7/19/2006 80 J 1011.40 1011.63 1011.46 2.431 Day After Deck Pour (Bottom of Girder)
8/18/2006 85 J 1011.39 1011.53 1011.45 1.32 Monthly Monitoring (Bottom of Girder)
11/13/2006 40 J 1011.39 1011.51 1011.42 1.32 Monthly Monitoring (Bottom of Girder)
G-25

Span 6Date
SurveyedTemp
(F) GirderWest Pier
ElevMidspan
ElevEast Pier
ElevCamber
(in) Comment
4/13/2006 50 K 1018.14 1018.66 1018.45 4.44 Pre Strand Release (Top of Girder)
4/14/2006 50 K 1018.14 1018.72 1018.45 5.16After Temp Strands are Released (Top of Girder)
5/8/2006 50 K 1018.13 1018.78 1018.47 5.76 Monthly Monitoring (Top of Girder)
6/13/2006 70 K 1018.14 1018.76 1018.49 5.34 Monthly Monitoring (Top of Girder)
7/11/2006 85 K 1018.22 1018.74 1018.52 4.44Monthly Monitoring (Top of Girder) and Before Deck Pour
7/11/2006 85 K 1011.25 1011.76 1011.58 4.11 Before Deck Pour (Bottom of Girder)
7/19/2006 80 K 1011.26 1011.64 1011.59 2.611 Day After Deck Pour (Bottom of Girder)
8/18/2006 85 K 1011.25 1011.54 1011.58 1.50 Monthly Monitoring (Bottom of Girder)
11/13/2006 40 K 1011.25 1011.52 1011.57 1.32 Monthly Monitoring (Bottom of Girder)
4/13/2006 50 L 1017.98 1018.66 1018.60 4.44 Pre Strand Release (Top of Girder)
4/14/2006 50 L 1017.98 1018.72 1018.60 5.16After Temp Strands are Released (Top of Girder)
5/8/2006 50 L 1018.01 1018.76 1018.63 5.25 Monthly Monitoring (Top of Girder)
6/13/2006 70 L 1018.03 1018.77 1018.65 5.13 Monthly Monitoring (Top of Girder)
7/11/2006 85 L#N/A #N/A #N/A #N/A Monthly Monitoring (Top of Girder)
and Before Deck Pour
7/11/2006 85 L 1011.06 1011.74 1011.70 4.29 Before Deck Pour (Bottom of Girder)
7/19/2006 80 L 1011.13 1011.61 1011.71 2.281 Day After Deck Pour (Bottom of Girder)
8/18/2006 85 L 1011.12 1011.51 1011.71 1.17 Monthly Monitoring (Bottom of Girder)
11/13/2006 40 L 1011.12 1011.49 1011.69 1.02 Monthly Monitoring (Bottom of Girder)
G-26

Span 6Date
SurveyedTemp
(F) GirderWest Pier
ElevMidspan
ElevEast Pier
ElevCamber
(in) Comment
4/13/2006 50 M 1017.85 1018.59 1018.78 3.27 Pre Strand Release (Top of Girder)
4/14/2006 50 M 1017.85 1018.64 1018.78 3.87After Temp Strands are Released (Top of Girder)
5/8/2006 50 M 1017.88 1018.69 1018.80 4.14 Monthly Monitoring (Top of Girder)
6/13/2006 70 M 1017.90 1018.70 1018.81 4.17 Monthly Monitoring (Top of Girder)
7/11/2006 85 M#N/A #N/A #N/A #N/A Monthly Monitoring (Top of Girder)
and Before Deck Pour
7/11/2006 85 M 1011.01 1011.70 1011.84 3.26 Before Deck Pour (Bottom of Girder)
7/19/2006 80 M 1011.01 1011.53 1011.85 1.261 Day After Deck Pour (Bottom of Girder)
8/18/2006 85 M 1011.01 1011.44 1011.84 0.18 Monthly Monitoring (Bottom of Girder)
11/13/2006 40 M 1010.97 1011.40 1011.84 -0.10 Monthly Monitoring (Bottom of Girder)
G-27

Span 7Date
SurveyedTemp
(F) GirderWest Pier
ElevMidspan
ElevEast Pier
ElevCamber
(in) Comment
5/14/2006 70 A 1017.01 1016.20 1014.80 3.54 Pre Strand Release (Top of Girder)
5/15/2006 70 A 1017.01 1016.28 1014.80 4.50After Temp Strands are Released (Top of Girder)
6/13/2006 70 A#N/A #N/A #N/A #N/A
Monthly Monitoring (Top of Girder)
7/11/2006 85 A 1017.08 1016.26 1014.84 3.60 Monthly Monitoring (Top of Girder)
7/11/2006 85 A 1010.10 1009.21 1007.94 2.34Monthly Monitoring (Bottom of Girder)
8/16/2006 85 A 1017.03 1016.26 1014.86 3.78 Before Deck Pour (Top of Girder)
8/18/2006 85 A 1010.10 1009.08 1007.93 0.781 Day After Deck Pour (Bottom of Girder)
11/13/2006 40 A 1010.08 1009.07 1007.90 0.96Monthly Monitoring (Bottom of Girder)
5/14/2006 70 B 1017.14 1016.35 1014.94 3.72 Pre Strand Release (Top of Girder)
5/15/2006 70 B 1017.14 1016.44 1014.94 4.80After Temp Strands are Released (Top of Girder)
6/13/2006 70 B#N/A #N/A #N/A #N/A
Monthly Monitoring (Top of Girder)
7/11/2006 85 B 1017.18 1016.41 1014.98 3.96 Monthly Monitoring (Top of Girder)
7/11/2006 85 B 1010.24 1009.39 1008.07 2.82Monthly Monitoring (Bottom of Girder)
8/16/2006 85 B 1017.17 1016.40 1015.03 3.66 Before Deck Pour (Top of Girder)
8/18/2006 85 B 1010.24 1009.29 1008.06 1.651 Day After Deck Pour (Bottom of Girder)
11/13/2006 40 B 1010.23 1009.27 1008.06 1.50Monthly Monitoring (Bottom of Girder)
G-28

Span 7Date
SurveyedTemp
(F) GirderWest Pier
ElevMidspan
ElevEast Pier
ElevCamber
(in) Comment
5/14/2006 70 C 1017.28 1016.62 1015.26 4.23 Pre Strand Release (Top of Girder)
5/15/2006 70 C 1017.28 1016.69 1015.26 5.07After Temp Strands are Released (Top of Girder)
6/13/2006 70 C 1017.33 1016.75 1015.29 5.25 Monthly Monitoring (Top of Girder)
7/11/2006 85 C 1017.36 1016.68 1015.30 4.20 Monthly Monitoring (Top of Girder)
7/11/2006 85 C 1010.37 1009.63 1008.40 2.91Monthly Monitoring (Bottom of Girder)
8/16/2006 85 C 1017.32 1016.68 1015.31 4.38 Before Deck Pour (Top of Girder)
8/18/2006 85 C 1010.37 1009.57 1008.39 2.281 Day After Deck Pour (Bottom of Girder)
11/13/2006 40 C 1010.36 1009.53 1008.38 1.95Monthly Monitoring (Bottom of Girder)
5/14/2006 70 D 1017.39 1016.90 1015.64 4.59 Pre Strand Release (Top of Girder)
5/15/2006 70 D 1017.39 1016.98 1015.64 5.61After Temp Strands are Released (Top of Girder)
6/13/2006 70 D#N/A #N/A #N/A #N/A
Monthly Monitoring (Top of Girder)
7/11/2006 85 D 1017.47 1016.92 1015.68 4.14 Monthly Monitoring (Top of Girder)
7/11/2006 85 D 1010.51 1009.91 1008.76 3.36Monthly Monitoring (Bottom of Girder)
8/16/2006 85 D 1017.42 1016.94 1015.71 4.47 Before Deck Pour (Top of Girder)
8/18/2006 85 D 1010.56 1009.82 1008.76 1.861 Day After Deck Pour (Bottom of Girder)
11/13/2006 40 D 1010.49 1009.81 1008.75 2.28Monthly Monitoring (Bottom of Girder)
G-29

Span 7Date
SurveyedTemp
(F) GirderWest Pier
ElevMidspan
ElevEast Pier
ElevCamber
(in) Comment
5/14/2006 70 E 1017.55 1017.09 1015.92 4.26 Pre Strand Release (Top of Girder)
5/15/2006 70 E 1017.55 1017.17 1015.92 5.16After Temp Strands are Released (Top of Girder)
6/13/2006 70 E#N/A #N/A #N/A #N/A
Monthly Monitoring (Top of Girder)
7/11/2006 85 E 1017.63 1017.18 1015.95 4.68 Monthly Monitoring (Top of Girder)
7/11/2006 85 E 1010.65 1010.07 1009.08 2.49Monthly Monitoring (Bottom of Girder)
8/16/2006 85 E 1017.58 1017.12 1016.03 3.81 Before Deck Pour (Top of Girder)
8/18/2006 85 E 1010.68 1009.98 1009.08 1.231 Day After Deck Pour (Bottom of Girder)
11/13/2006 40 E 1010.64 1009.95 1009.17 0.57Monthly Monitoring (Bottom of Girder)
5/14/2006 70 F 1017.79 1017.32 1016.32 3.15 Pre Strand Release (Top of Girder)
5/15/2006 70 F 1017.79 1017.41 1016.32 4.29After Temp Strands are Released (Top of Girder)
6/13/2006 70 F 1017.72 1017.43 1016.34 4.80 Monthly Monitoring (Top of Girder)
7/11/2006 85 F 1017.79 1017.37 1016.35 3.60 Monthly Monitoring (Top of Girder)
7/11/2006 85 F 1010.80 1010.38 1009.43 3.15Monthly Monitoring (Bottom of Girder)
8/16/2006 85 F 1017.73 1017.35 1016.37 3.60 Before Deck Pour (Top of Girder)
8/18/2006 85 F 1010.88 1010.29 1009.43 1.621 Day After Deck Pour (Bottom of Girder)
11/13/2006 40 F 1010.79 1010.23 1009.40 1.59Monthly Monitoring (Bottom of Girder)
G-30

Span 7Date
SurveyedTemp
(F) GirderWest Pier
ElevMidspan
ElevEast Pier
ElevCamber
(in) Comment
5/14/2006 70 G 1017.82 1017.54 1016.62 3.87 Pre Strand Release (Top of Girder)
5/15/2006 70 G 1017.82 1017.65 1016.62 5.13After Temp Strands are Released (Top of Girder)
6/13/2006 70 G 1017.86 1017.67 1016.65 4.92 Monthly Monitoring (Top of Girder)
7/11/2006 85 G 1017.88 1017.60 1016.66 3.96 Monthly Monitoring (Top of Girder)
7/11/2006 85 G 1010.63 1010.59 1009.77 4.74Monthly Monitoring (Bottom of Girder)
8/16/2006 85 G 1017.84 1017.59 1016.66 4.11 Before Deck Pour (Top of Girder)
8/18/2006 85 G 1010.94 1010.49 1009.75 1.741 Day After Deck Pour (Bottom of Girder)
11/13/2006 40 G 1010.92 1010.43 1009.74 1.23Monthly Monitoring (Bottom of Girder)
5/14/2006 70 H 1017.97 1017.82 1016.97 4.23 Pre Strand Release (Top of Girder)
5/15/2006 70 H 1017.97 1017.93 1016.97 5.55After Temp Strands are Released (Top of Girder)
6/13/2006 70 H 1018.01 1017.96 1017.00 5.46 Monthly Monitoring (Top of Girder)
7/11/2006 85 H 1018.04 1017.90 1017.01 4.50 Monthly Monitoring (Top of Girder)
7/11/2006 85 H 1011.10 1010.90 1010.11 3.60Monthly Monitoring (Bottom of Girder)
8/16/2006 85 H 1017.99 1017.88 1017.03 4.44 Before Deck Pour (Top of Girder)
8/18/2006 85 H 1011.11 1010.74 1010.10 1.621 Day After Deck Pour (Bottom of Girder)
11/13/2006 40 H 1011.08 1010.72 1010.08 1.68Monthly Monitoring (Bottom of Girder)
G-31

Span 7Date
SurveyedTemp
(F) GirderWest Pier
ElevMidspan
ElevEast Pier
ElevCamber
(in) Comment
5/14/2006 70 I 1018.10 1018.12 1017.32 4.95 Pre Strand Release (Top of Girder)
5/15/2006 70 I 1018.10 1018.24 1017.32 6.39After Temp Strands are Released (Top of Girder)
6/13/2006 70 I 1018.15 1018.27 1017.36 6.18 Monthly Monitoring (Top of Girder)
7/11/2006 85 I 1018.17 1018.20 1017.37 5.16 Monthly Monitoring (Top of Girder)
7/11/2006 85 I 1011.21 1011.13 1010.44 3.63Monthly Monitoring (Bottom of Girder)
8/16/2006 85 I 1018.13 1018.12 1017.36 4.44 Before Deck Pour (Top of Girder)
8/18/2006 85 I 1011.22 1011.02 1010.42 2.401 Day After Deck Pour (Bottom of Girder)
11/13/2006 40 I 1011.20 1010.96 1010.42 1.83Monthly Monitoring (Bottom of Girder)
5/14/2006 70 J 1018.22 1018.26 1017.58 4.29 Pre Strand Release (Top of Girder)
5/15/2006 70 J 1018.22 1018.39 1017.58 5.91After Temp Strands are Released (Top of Girder)
6/13/2006 70 J 1018.26 1018.40 1017.60 5.64 Monthly Monitoring (Top of Girder)
7/11/2006 85 J 1018.31 1018.35 1017.60 4.74 Monthly Monitoring (Top of Girder)
7/11/2006 85 J 1011.34 1011.33 1010.69 3.78Monthly Monitoring (Bottom of Girder)
8/16/2006 85 J 1018.26 1018.33 1017.65 4.56 Before Deck Pour (Top of Girder)
8/18/2006 85 J 1011.35 1011.26 1010.70 2.821 Day After Deck Pour (Bottom of Girder)
11/13/2006 40 J 1011.32 1011.16 1010.69 1.86Monthly Monitoring (Bottom of Girder)
G-32
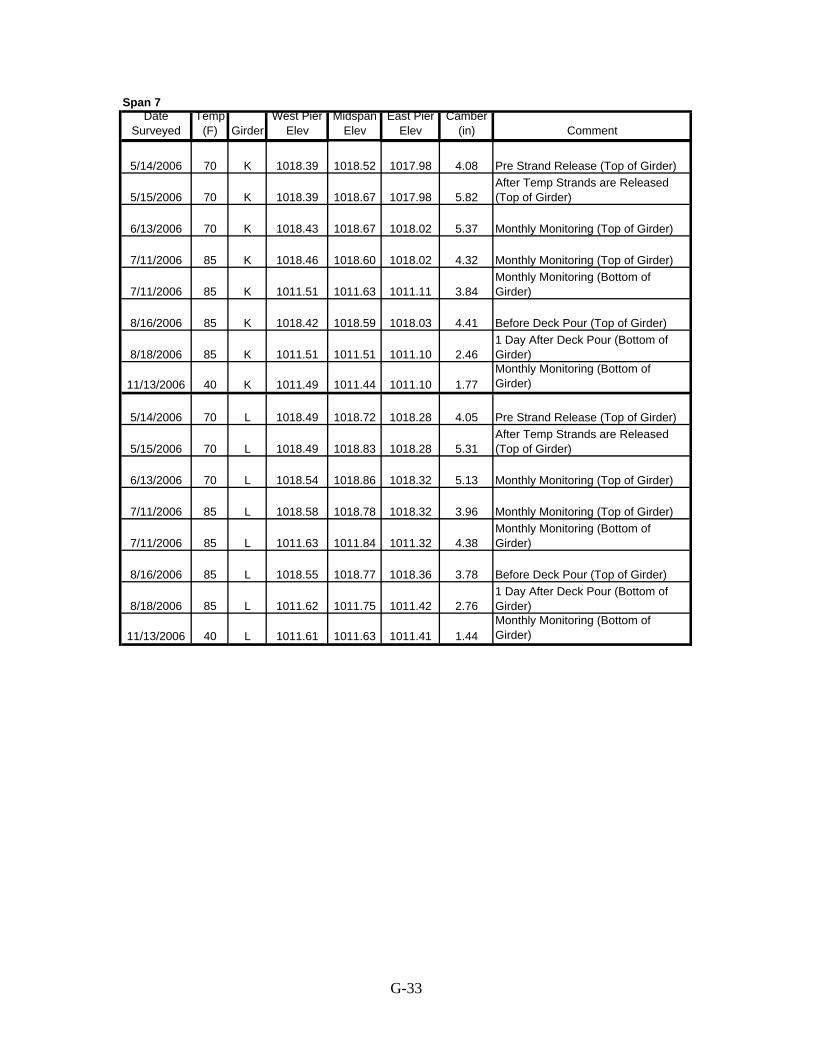
Span 7Date
SurveyedTemp
(F) GirderWest Pier
ElevMidspan
ElevEast Pier
ElevCamber
(in) Comment
5/14/2006 70 K 1018.39 1018.52 1017.98 4.08 Pre Strand Release (Top of Girder)
5/15/2006 70 K 1018.39 1018.67 1017.98 5.82After Temp Strands are Released (Top of Girder)
6/13/2006 70 K 1018.43 1018.67 1018.02 5.37 Monthly Monitoring (Top of Girder)
7/11/2006 85 K 1018.46 1018.60 1018.02 4.32 Monthly Monitoring (Top of Girder)
7/11/2006 85 K 1011.51 1011.63 1011.11 3.84Monthly Monitoring (Bottom of Girder)
8/16/2006 85 K 1018.42 1018.59 1018.03 4.41 Before Deck Pour (Top of Girder)
8/18/2006 85 K 1011.51 1011.51 1011.10 2.461 Day After Deck Pour (Bottom of Girder)
11/13/2006 40 K 1011.49 1011.44 1011.10 1.77Monthly Monitoring (Bottom of Girder)
5/14/2006 70 L 1018.49 1018.72 1018.28 4.05 Pre Strand Release (Top of Girder)
5/15/2006 70 L 1018.49 1018.83 1018.28 5.31After Temp Strands are Released (Top of Girder)
6/13/2006 70 L 1018.54 1018.86 1018.32 5.13 Monthly Monitoring (Top of Girder)
7/11/2006 85 L 1018.58 1018.78 1018.32 3.96 Monthly Monitoring (Top of Girder)
7/11/2006 85 L 1011.63 1011.84 1011.32 4.38Monthly Monitoring (Bottom of Girder)
8/16/2006 85 L 1018.55 1018.77 1018.36 3.78 Before Deck Pour (Top of Girder)
8/18/2006 85 L 1011.62 1011.75 1011.42 2.761 Day After Deck Pour (Bottom of Girder)
11/13/2006 40 L 1011.61 1011.63 1011.41 1.44Monthly Monitoring (Bottom of Girder)
G-33

Span 7Date
SurveyedTemp
(F) GirderWest Pier
ElevMidspan
ElevEast Pier
ElevCamber
(in) Comment
5/14/2006 70 M 1018.67 1019.03 1018.69 4.26 Pre Strand Release (Top of Girder)
5/15/2006 70 M 1018.67 1019.14 1018.69 5.52After Temp Strands are Released (Top of Girder)
6/13/2006 70 M#N/A #N/A #N/A #N/A
Monthly Monitoring (Top of Girder)
7/11/2006 85 M 1018.73 1019.10 1018.72 4.50 Monthly Monitoring (Top of Girder)
7/11/2006 85 M 1011.78 1012.13 1011.78 4.26Monthly Monitoring (Bottom of Girder)
8/16/2006 85 M 1018.70 1019.10 1018.76 4.47 Before Deck Pour (Top of Girder)
8/18/2006 85 M 1011.79 1012.01 1011.77 2.701 Day After Deck Pour (Bottom of Girder)
11/13/2006 40 M 1011.77 1011.90 1011.77 1.56Monthly Monitoring (Bottom of Girder)
G-34

Span 8Date
SurveyedTemp
(F) GirderWest Pier
ElevMidspan
ElevEast Pier
ElevCamber
(in) Comment
6/10/2006 70 A 1014.83 1014.39 1013.43 3.09 Pre Strand Release (Top of Girder)
6/14/2006 70 A 1014.83 1014.43 1013.43 3.57After Temp Strands are Released (Top of Girder)
7/11/2006 85 A#N/A #N/A #N/A #N/A Monthly Monitoring (Bottom of
Girder)
8/16/2006 85 A 1014.81 1014.39 1013.22 4.56 Before Deck Pour (Top of Girder)
8/18/2006 85 A 1007.87 1007.26 1006.31 2.07One Day After Deck Pour (Bottom of Girder)
10/4/2006 70 A 1007.88 1007.23 1006.32 1.59Monthly Monitoring (Bottom of Girder)
11/13/2006 40 A 1007.87 1007.29 1006.28 2.55Monthly Monitoring (Bottom of Girder)
6/10/2006 70 B 1014.97 1014.54 1013.39 4.32 Pre Strand Release (Top of Girder)
6/14/2006 70 B 1014.97 1014.60 1013.39 5.04After Temp Strands are Released (Top of Girder)
7/11/2006 85 B#N/A #N/A #N/A #N/A Monthly Monitoring (Bottom of
Girder)
8/16/2006 85 B 1014.97 1014.56 1013.39 4.62 Before Deck Pour (Top of Girder)
8/18/2006 85 B 1008.02 1007.47 1006.49 2.61One Day After Deck Pour (Bottom of Girder)
10/4/2006 70 B 1008.02 1007.42 1006.49 1.95Monthly Monitoring (Bottom of Girder)
11/13/2006 40 B 1008.00 1007.50 1006.48 3.06Monthly Monitoring (Bottom of Girder)
6/10/2006 70 C 1015.29 1014.91 1013.75 4.68 Pre Strand Release (Top of Girder)
6/14/2006 70 C 1015.29 1014.99 1013.75 5.58After Temp Strands are Released (Top of Girder)
7/11/2006 85 C 1008.33 1007.94 1006.85 4.26Monthly Monitoring (Bottom of Girder)
8/16/2006 85 C 1015.34 1014.93 1013.78 4.41 Before Deck Pour (Top of Girder)
8/18/2006 85 C 1008.32 1007.87 1006.88 3.24One Day After Deck Pour (Bottom of Girder)
10/4/2006 70 C 1008.32 1007.78 1006.84 2.40Monthly Monitoring (Bottom of Girder)
11/13/2006 40 C 1008.31 1007.85 1006.84 3.27Monthly Monitoring (Bottom of Girder)
G-35

Span 8Date
SurveyedTemp
(F) GirderWest Pier
ElevMidspan
ElevEast Pier
ElevCamber
(in) Comment
6/10/2006 70 D 1015.77 1015.28 1014.05 4.41 Pre Strand Release (Top of Girder)
6/14/2006 70 D 1015.77 1015.32 1014.05 4.89After Temp Strands are Released (Top of Girder)
7/11/2006 85 D 1008.83 1008.30 1007.14 3.78Monthly Monitoring (Bottom of Girder)
8/16/2006 85 D 1015.47 1015.32 1014.03 #N/A Before Deck Pour (Top of Girder)
8/18/2006 85 D 1008.89 1008.22 1007.16 2.34One Day After Deck Pour (Bottom of Girder)
10/4/2006 70 D 1008.82 1008.14 1007.13 1.92Monthly Monitoring (Bottom of Girder)
11/13/2006 40 D 1008.81 1008.22 1007.12 3.12Monthly Monitoring (Bottom of Girder)
6/10/2006 70 E 1015.91 1015.49 1014.39 4.08 Pre Strand Release (Top of Girder)
6/14/2006 70 E 1015.91 1015.55 1014.39 4.86After Temp Strands are Released (Top of Girder)
7/11/2006 85 E 1009.02 1008.56 1007.50 3.57Monthly Monitoring (Bottom of Girder)
8/16/2006 85 E 1015.91 1015.50 1014.39 4.17 Before Deck Pour (Top of Girder)
8/18/2006 85 E 1009.09 1008.49 1007.49 2.40One Day After Deck Pour (Bottom of Girder)
10/4/2006 70 E 1009.01 1008.39 1007.49 1.68Monthly Monitoring (Bottom of Girder)
11/13/2006 40 E 1009.00 1008.47 1007.48 2.73Monthly Monitoring (Bottom of Girder)
6/10/2006 70 F 1016.28 1015.87 1014.71 4.47 Pre Strand Release (Top of Girder)
6/14/2006 70 F 1016.28 1015.92 1014.71 5.07After Temp Strands are Released (Top of Girder)
7/11/2006 85 F 1009.36 1008.87 1007.83 3.33Monthly Monitoring (Bottom of Girder)
8/16/2006 85 F 1016.27 1015.85 1014.74 4.20 Before Deck Pour (Top of Girder)
8/18/2006 85 F 1009.40 1008.81 1007.83 2.34One Day After Deck Pour (Bottom of Girder)
10/4/2006 70 F 1009.34 1008.70 1007.81 1.50Monthly Monitoring (Bottom of Girder)
11/13/2006 40 F 1009.33 1008.78 1007.80 2.52Monthly Monitoring (Bottom of Girder)
G-36

Span 8Date
SurveyedTemp
(F) GirderWest Pier
ElevMidspan
ElevEast Pier
ElevCamber
(in) Comment
6/10/2006 70 G 1016.59 1016.23 1015.11 4.53 Pre Strand Release (Top of Girder)
6/14/2006 70 G 1016.59 1016.31 1015.11 5.49After Temp Strands are Released (Top of Girder)
7/11/2006 85 G 1009.71 1009.28 1008.21 3.87Monthly Monitoring (Bottom of Girder)
8/16/2006 85 G 1016.63 1016.25 1015.12 4.53 Before Deck Pour (Top of Girder)
8/18/2006 85 G 1009.70 1009.26 1008.20 3.72One Day After Deck Pour (Bottom of Girder)
10/4/2006 70 G 1009.70 1009.11 1008.20 1.92Monthly Monitoring (Bottom of Girder)
11/13/2006 40 G 1009.70 1009.18 1008.19 2.82Monthly Monitoring (Bottom of Girder)
6/10/2006 70 H 1016.98 1016.56 1015.44 4.20 Pre Strand Release (Top of Girder)
6/14/2006 70 H 1016.98 1016.63 1015.44 5.04After Temp Strands are Released (Top of Girder)
7/11/2006 85 H 1010.05 1009.65 1008.53 4.29Monthly Monitoring (Bottom of Girder)
8/16/2006 85 H 1016.97 1016.59 1015.44 4.65 Before Deck Pour (Top of Girder)
8/18/2006 85 H 1010.05 1009.59 1008.53 3.60One Day After Deck Pour (Bottom of Girder)
10/4/2006 70 H 1010.03 1009.47 1008.52 2.37Monthly Monitoring (Bottom of Girder)
11/13/2006 40 H 1010.03 1009.55 1008.50 3.42Monthly Monitoring (Bottom of Girder)
6/10/2006 70 I 1017.32 1016.95 1015.80 4.68 Pre Strand Release (Top of Girder)
6/14/2006 70 I 1017.32 1017.01 1015.80 5.40After Temp Strands are Released (Top of Girder)
7/11/2006 85 I 1010.38 1010.00 1008.90 4.29Monthly Monitoring (Bottom of Girder)
8/16/2006 85 I 1017.27 1016.97 1015.82 5.10 Before Deck Pour (Top of Girder)
8/18/2006 85 I 1010.48 1009.92 1008.87 2.91One Day After Deck Pour (Bottom of Girder)
10/4/2006 70 I 1010.37 1009.82 1008.87 2.34Monthly Monitoring (Bottom of Girder)
11/13/2006 40 I 1010.36 1009.89 1008.83 3.54Monthly Monitoring (Bottom of Girder)
G-37

Span 8Date
SurveyedTemp
(F) GirderWest Pier
ElevMidspan
ElevEast Pier
ElevCamber
(in) Comment
6/10/2006 70 J 1017.62 1017.21 1016.11 4.11 Pre Strand Release (Top of Girder)
6/14/2006 70 J 1017.62 1017.27 1016.11 4.83After Temp Strands are Released (Top of Girder)
7/11/2006 85 J 1010.70 1010.30 1009.22 4.05Monthly Monitoring (Bottom of Girder)
8/16/2006 85 J 1017.62 1017.23 1016.10 4.50 Before Deck Pour (Top of Girder)
8/18/2006 85 J 1010.76 1010.20 1009.22 2.52One Day After Deck Pour (Bottom of Girder)
10/4/2006 70 J 1010.69 1010.12 1009.20 2.04Monthly Monitoring (Bottom of Girder)
11/13/2006 40 J 1010.68 1010.18 1009.19 2.97Monthly Monitoring (Bottom of Girder)
6/10/2006 70 K 1017.99 1017.63 1016.46 4.92 Pre Strand Release (Top of Girder)
6/14/2006 70 K 1017.99 1017.70 1016.46 5.70After Temp Strands are Released (Top of Girder)
7/11/2006 85 K 1011.07 1010.68 1009.59 4.17Monthly Monitoring (Bottom of Girder)
8/16/2006 85 K 1017.99 1017.67 1016.46 5.31 Before Deck Pour (Top of Girder)
8/18/2006 85 K 1011.07 1010.62 1009.57 3.57One Day After Deck Pour (Bottom of Girder)
10/4/2006 70 K 1011.06 1010.50 1009.57 2.16Monthly Monitoring (Bottom of Girder)
11/13/2006 40 K 1011.05 1010.57 1009.56 3.18Monthly Monitoring (Bottom of Girder)
6/10/2006 70 L 1018.33 1017.97 1016.82 4.77 Pre Strand Release (Top of Girder)
6/14/2006 70 L 1018.33 1018.05 1016.82 5.67After Temp Strands are Released (Top of Girder)
7/11/2006 85 L 1011.41 1011.02 1009.94 4.17Monthly Monitoring (Bottom of Girder)
8/16/2006 85 L 1018.35 1018.03 1016.82 5.34 Before Deck Pour (Top of Girder)
8/18/2006 85 L 1011.40 1010.91 1009.93 2.97One Day After Deck Pour (Bottom of Girder)
10/4/2006 70 L 1011.39 1010.84 1009.92 2.22Monthly Monitoring (Bottom of Girder)
11/13/2006 40 L 1011.39 1010.91 1009.91 3.09Monthly Monitoring (Bottom of Girder)
G-38

Span 8Date
SurveyedTemp
(F) GirderWest Pier
ElevMidspan
ElevEast Pier
ElevCamber
(in) Comment
6/10/2006 70 M 1018.70 1018.37 1017.15 5.31 Pre Strand Release (Top of Girder)
6/14/2006 70 M 1018.70 1018.43 1017.15 6.09After Temp Strands are Released (Top of Girder)
7/11/2006 85 M 1011.77 1011.45 1010.30 4.95Monthly Monitoring (Bottom of Girder)
8/16/2006 85 M 1018.71 1018.39 1017.19 5.28 Before Deck Pour (Top of Girder)
8/18/2006 85 M 1011.75 1011.28 1010.32 2.91One Day After Deck Pour (Bottom of Girder)
10/4/2006 70 M 1011.76 1011.21 1010.28 2.28Monthly Monitoring (Bottom of Girder)
11/13/2006 40 M 1011.76 1011.28 1010.27 3.18Monthly Monitoring (Bottom of Girder)
G-39

Span 9Date
SurveyedTemp
(F) GirderWest Pier
ElevMidspan
ElevEast Pier
ElevCamber
(in) Comment
7/17/2006 85 A 1013.32 1012.80 1011.39 5.40After Temp Strands are Released (Top of Girder)
8/21/2006 85 A 1013.27 1012.70 1011.36 4.62 Before Deck Pour (Top of Girder)
8/30/2006 85 A 1006.30 1005.57 1004.48 2.16One Day After Deck Pour (Bottom of Girder)
11/13/2006 40 A 1006.29 1005.58 1004.47 2.37Monthly Monitoring (bottom of Girder)
7/17/2006 85 B 1013.41 1012.96 1011.73 4.73After Temp Strands are Released (Top of Girder)
8/21/2006 85 B 1013.36 1012.88 1011.70 4.20 Before Deck Pour (Top of Girder)
8/30/2006 85 B 1006.43 1005.79 1004.80 2.07One Day After Deck Pour (Bottom of Girder)
11/13/2006 40 B 1006.42 1005.78 1004.79 2.07Monthly Monitoring (bottom of Girder)
7/17/2006 85 C 1013.73 1013.32 1011.95 5.81After Temp Strands are Released (Top of Girder)
8/21/2006 85 C 1013.68 1013.22 1011.70 6.36 Before Deck Pour (Top of Girder)
8/30/2006 85 C 1006.72 1006.06 1005.02 2.25One Day After Deck Pour (Bottom of Girder)
11/13/2006 40 C 1006.71 1006.03 1005.02 1.98Monthly Monitoring (bottom of Girder)
7/17/2006 85 D 1014.09 1013.52 1012.22 4.41After Temp Strands are Released (Top of Girder)
8/21/2006 85 D 1014.06 1013.44 1011.90 5.52 Before Deck Pour (Top of Girder)
8/30/2006 85 D 1007.10 1006.32 1005.32 1.29One Day After Deck Pour (Bottom of Girder)
11/13/2006 40 D 1007.08 1006.33 1005.31 1.62Monthly Monitoring (bottom of Girder)
7/17/2006 85 E 1014.41 1013.90 1012.57 4.98After Temp Strands are Released (Top of Girder)
8/21/2006 85 E 1014.36 1013.78 1012.53 3.99 Before Deck Pour (Top of Girder)
8/30/2006 85 E 1007.43 1006.68 1005.65 1.68One Day After Deck Pour (Bottom of Girder)
11/13/2006 E 1007.42 1006.68 1005.63 1.83Monthly Monitoring (bottom of Girder)
G-40

Span 9Date
SurveyedTemp
(F) GirderWest Pier
ElevMidspan
ElevEast Pier
ElevCamber
(in) Comment
7/17/2006 85 F 1014.74 1014.26 1012.87 5.46After Temp Strands are Released (Top of Girder)
8/21/2006 85 F 1014.69 1014.16 1012.83 4.77 Before Deck Pour (Top of Girder)
8/30/2006 85 F 1007.86 1007.06 1005.98 1.68One Day After Deck Pour (Bottom of Girder)
11/13/2006 40 F 1007.74 1007.03 1005.97 2.07Monthly Monitoring (bottom of Girder)
7/17/2006 85 G 1015.15 1014.55 1013.30 3.90After Temp Strands are Released (Top of Girder)
8/21/2006 85 G 1015.11 1014.50 1013.26 3.84 Before Deck Pour (Top of Girder)
8/30/2006 85 G 1008.16 1007.43 1006.35 2.10One Day After Deck Pour (Bottom of Girder)
11/13/2006 40 G 1008.12 1007.33 1006.34 1.23Monthly Monitoring (bottom of Girder)
7/17/2006 85 H 1015.52 1014.92 1013.61 4.26After Temp Strands are Released (Top of Girder)
8/21/2006 85 H 1015.46 1014.84 1013.57 3.87 Before Deck Pour (Top of Girder)
8/30/2006 85 H 1008.50 1007.68 1006.70 0.96One Day After Deck Pour (Bottom of Girder)
11/13/2006 40 H 1008.48 1007.66 1006.68 0.90Monthly Monitoring (bottom of Girder)
7/17/2006 85 I 1015.82 1015.30 1014.01 4.62After Temp Strands are Released (Top of Girder)
8/21/2006 85 I 1015.78 1015.22 1013.95 4.26 Before Deck Pour (Top of Girder)
8/30/2006 85 I 1008.82 1008.10 1007.09 1.74One Day After Deck Pour (Bottom of Girder)
11/13/2006 40 I 1008.80 1008.03 1007.17 0.54Monthly Monitoring (bottom of Girder)
7/17/2006 85 J 1016.14 1015.65 1014.32 5.04After Temp Strands are Released (Top of Girder)
8/21/2006 85 J 1016.11 1015.57 1014.29 4.44 Before Deck Pour (Top of Girder)
8/30/2006 85 J 1009.19 1008.44 1007.38 1.83One Day After Deck Pour (Bottom of Girder)
11/13/2006 40 J 1009.18 1008.35 1007.37 0.90Monthly Monitoring (bottom of Girder)
G-41

Span 9Date
SurveyedTemp
(F) GirderWest Pier
ElevMidspan
ElevEast Pier
ElevCamber
(in) Comment
7/17/2006 85 K 1016.58 1015.95 1014.63 4.14After Temp Strands are Released (Top of Girder)
8/21/2006 85 K 1016.54 1015.88 1014.59 3.84 Before Deck Pour (Top of Girder)
8/30/2006 85 K 1009.54 1008.78 1007.73 1.74One Day After Deck Pour (Bottom of Girder)
11/13/2006 40 K 1009.52 1008.72 1007.71 1.23Monthly Monitoring (bottom of Girder)
7/17/2006 85 L 1016.89 1016.29 1015.00 4.14After Temp Strands are Released (Top of Girder)
8/21/2006 85 L 1016.85 1016.21 1014.94 3.78 Before Deck Pour (Top of Girder)
8/30/2006 85 L 1009.88 1009.09 1008.06 1.44One Day After Deck Pour (Bottom of Girder)
11/13/2006 40 L 1009.87 1009.01 1008.05 0.60Monthly Monitoring (bottom of Girder)
7/17/2006 85 M 1017.26 1016.74 1015.34 5.28After Temp Strands are Released (Top of Girder)
8/21/2006 85 M 1017.22 1016.68 1015.29 5.13 Before Deck Pour (Top of Girder)
8/30/2006 85 M 1010.25 1009.48 1008.43 1.68One Day After Deck Pour (Bottom of Girder)
11/13/2006 40 M 1010.24 1009.40 1008.40 0.99Monthly Monitoring (bottom of Girder)
G-42

Span 3 Girders
0.0
1.0
2.0
3.0
4.0
5.0
6.0
7.0
11/2
4/05
12/1
4/05
1/3/
06
1/23
/06
2/12
/06
3/4/
06
3/24
/06
4/13
/06
5/3/
06
5/23
/06
Date
Cam
ber (
in.)
ABCDEFGHIJKLM
Temperature
0.0
20.0
40.0
60.0
80.0
100.0
10/2
5/05
12/1
4/05
2/2/
06
3/24
/06
5/13
/06
7/2/
06
8/21
/06
10/1
0/06
11/2
9/06
1/18
/07
Date
Tem
pera
ture
(°F)
G-43

Span 4 Girders
0.0
1.0
2.0
3.0
4.0
5.0
6.0
7.0
10/2
5/05
12/1
4/05
2/2/
06
3/24
/06
5/13
/06
7/2/
06
Date
Cam
ber (
in.)
ABCDEFGHIJKLM
Span 5 Girders
0.0
1.0
2.0
3.0
4.0
5.0
6.0
7.0
10/2
5/05
12/1
4/05
2/2/
06
3/24
/06
5/13
/06
7/2/
06
Date
Cam
ber (
in.)
ABCDEFGHIJKLM
G-44

Span 6 Girders
0.0
1.0
2.0
3.0
4.0
5.0
6.0
7.0
3/24
/06
5/13
/06
7/2/
06
8/21
/06
10/1
0/06
11/2
9/06
Date
Cam
ber (
in.)
ABCDEFGHIJKLM
Span 7 Girders
0.0
1.0
2.0
3.0
4.0
5.0
6.0
7.0
3/24
/06
5/13
/06
7/2/
06
8/21
/06
10/1
0/06
11/2
9/06
Date
Cam
ber (
in.)
ABCDEFGHIJKLM
G-45

Span 8 Girders
0.0
1.0
2.0
3.0
4.0
5.0
6.0
7.0
5/23
/06
6/12
/06
7/2/
06
7/22
/06
8/11
/06
8/31
/06
9/20
/06
10/1
0/06
10/3
0/06
11/1
9/06
12/9
/06
Date
Cam
ber (
in.)
ABCDEFGHIJKLM
Span 9 Girders
0.0
1.0
2.0
3.0
4.0
5.0
6.0
7.0
7/2/
06
7/22
/06
8/11
/06
8/31
/06
9/20
/06
10/1
0/06
10/3
0/06
11/1
9/06
Date
Cam
ber (
in.)
ABCDEFGHIJKLM
G-46