Embed Size (px)
Citation preview

Improving Nutritional Status for Women in Low-Income Households
IU
BA
T
C e n T r e f o r P o l I C y r e s e A r C h
C P r C o m m e n T A r y
n o . 8 • s U m m e r 2 0 1 2
IUBAT—International University of Business Agriculture and TechnologyDhaka, Bangladesh
by Afifa shahrin and John richards

for information about activities and publications of the Centre for Policy research, contact:
Dr. m. Alimullah miyan Vice-Chancellor and founder,IUBAT—International University of Business Agriculture and Technology4 embankment Drive road, sector 10, Uttara model Town, Dhaka 1230, BangladeshTel: (88 02) 896 3523-27, 01714 014933, 892 3469-70, 891 8412 | fax: (88 02) 892 2625email: [email protected] | www.iubat.edu
John richards, Ph.D. Professor, Graduate Public Policy Programsimon fraser University515 West hastings street, Vancouver, B.C.Canada, V6B 5K3Tel: 778-782-5250 | fax: 778-782-5288e-mail: [email protected]
www.iubat.edu/cpr
ImProVInG nUTrITIonAl sTATUs for Women In loW-InCome hoUseholDs
CPr Commentary number 8 | summer 2012
by Afifa shahrin and John richards
ABoUT The CenTre for PolICy reseArCh
Created in 1999, the Centre for Policy research is a nonprofit research and educational institution,
linked to IUBAT—International University of Business Agriculture and Technology.
Its goals are to identify current and emerging economic and social issues facing Bangladesh;
to analyse options for public and private sector responses; to recommend, where appropriate,
particular policy options; and to communicate the conclusions of its research in an accessible
and nonpartisan form, in both english and Bengali. Publications of the Centre are freely available
at www.iubat.edu/cpr
simon fraser University in Burnaby (Vancouver), Canada, has entered into a memorandum of
understanding with IUBAT. By this agreement, sfU will encourage participation by its faculty and
students in projects of the centre.
While the centre takes care to assure the quality of published research, the conclusions of
individual studies lie with the authors. Conclusions do not necessarily represent the opinion of
IUBAT, sfU or the members of the centre’s management committee.
Design and layout by nadene rehnby and Pete Tuepah www.handsonpublications.com.
The cover art is a reproduction of a nakshi kantha produced by women working with BrAC.
IsBn 984-70060-0005-1 | U.s. $15 | Taka 200

Contents
foreword .............................................................................................................. 5
list of Acronyms ................................................................................................... 6
executive summary .............................................................................................. 7
1. Introduction .................................................................................................... 18
2. methodology ..................................................................................................27
3. Descriptive statistics ......................................................................................32
4. statistical Analysis .........................................................................................45
5. Policy Analysis ...............................................................................................52
6. Conclusion .....................................................................................................65
references .........................................................................................................66
Appendix A: survey Questionnaire .....................................................................75
Appendix B: food scoring method .....................................................................89
Appendix C: Income and Asset Index Calculation ............................................... 93

About the authors
AfifA ShAhrin graduated in 2012 from Simon Fraser University, Vancouver, where she obtained a Masters in Public Policy degree. She is a former economics instructor at BRAC University.
John riChArdS is a faculty member of the School of Public Policy at Simon Fraser University and overseas faculty member of IUBAT. He serves as advisor to the Centre for Public Policy at IUBAT.
Acknowledgments
We thank in particular Narayan Chandra Das, a research fellow of the BRAC Research and Evalu-ation Division, who helped us to organize the survey work. We also thank Dr. Erum Marium, Director of the BRAC University Institute of Educational Development, Rokeya Khatun, BRAC area manager in Jamalpur, and Moniruzzaman, BRAC area manager in Uttara. They helped us to organize the focus group discussions. Dr. Ameena Ahmed of BRAC Nutrition Division provided us with information about the BRAC school feeding program.
We also express thanks to Dr. Alimullah Miyan, Vice-Chancellor of IUBAT, and Dr. Karen Lund, Chair of the IUBAT BSN Nursing Program. Sanchay Baruha typed the Bangla version of the questionnaire. Others at IUBAT helped us in every stage of the data collection process. Last but not least we are thankful to the 20 surveyors who worked hard to complete the survey.

5Centre for Policy Research of IUBAT • Summer 2012
Foreword
This 8th CPR Commentary is an ambitious study of nutrition among low-income women in Bangladesh. The authors undertook a survey of nearly 600 women in two sites, in slum communities along the Tongi-Ashulia Road in Uttara and in four villages in Jamalpur dis-trict. While some of the women surveyed face problems of inadequate calorie intake, the more serious nutritional problem is a lack of dietary variety. Many of the women suffer a deficiency in necessary vitamins and micronutrients to be found in fruits, vegetables, and dairy products. Nearly all women in the rural sample use hygienic tube well water, but the great majority of urban women sampled use unhygienic tap water.
The authors discuss several potential policy responses, from government promoting use of fortified rice to setting tube wells in urban slum areas.
This Commentary is the result of a collaboration among three universities. The princi-pal author, Ms. Afifa Shahrin, conducted the survey while a visitor at the IUBAT nursing college in the summer of 2011. Several IUBAT students participated in the conduct of the survey. Formerly, Ms. Shahrin was an instructor at BRAC University, and BRAC cooperated extensively in the conduct of the rural survey in Jamalpur. An earlier version of this study was submitted to Simon Fraser University in Vancouver, Canada, as part of the require-ments for Ms. Shahrin to obtain her Masters of Public Policy degree. The second author, John Richards, is a professor at Simon Fraser University and long-time overseas faculty member of IUBAT.
— Dr. M. Alimullah MiyanVice-Chancellor and Founder, IUBAT
6 Improving Nutritional Status for Women in Low-Income Households
List of Acronyms
ADB Asian Development Bank
BMI Body Mass Index
BBS Bangladesh Bureau of Statistics
BRAC Bangladesh Rural Advancement Committee
ESCAP Economic and Social Commission for Asia and Pacific
FAO Food and Agriculture Organization
ICDDR, B International Centre for Diarrhoeal Disease Research, Bangladesh
NGO Non-Government Organization
SEWA Self Employed Women’s Association,
UNICEF United Nations Children’s Emergency Fund
UNDP United Nations Development Programme
UNFPA The United Nations Population Fund
WFP World Food Programme
WHO World Health Organization

7Centre for Policy Research of IUBAT • Summer 2012
Executive Summary
THE OBJECTIVE OF THIS STUDy IS TO PROVIDE POLICy ADVICE TO IMPROVE
the nutritional status of low-income women in Bangladesh. While some suffer from inad-
equate calorie intake, the major nutritional problem is inadequate consumption of protein
and micronutrients.
We first report the nutritional status of a sample of nearly 600 women surveyed in two sites, one rural and one urban. The rural site is a group of villages near Jamal-pur; the urban site is a slum in Uttara, in the Dhaka metropolitan area.
Malnutrition among women is a serious problem – in Bangladesh as in many devel-oping countries. Protein-energy malnutri-tion, iron deficiency anaemia, and vitamin A deficiency are common. Malnutrition is a major cause of the high maternal mortal-ity rate in Bangladesh, a rate second only to Nepal among South Asian countries. Malnutrition passes from one generation to the next as malnourished mothers give birth to malnourished children.
There exist regional differences in the health and nutritional status of women. Generally, people living in the slums of Dhaka region consume more calories than those living in slums elsewhere. Among an earlier study undertaken by the nurs-ing college at IUBAT of women living in a Uttara slum, about 12 per cent did not have adequate calorie intake in their diet to achieve a body mass index (BMI) above the traditional threshold of 18.5. Other studies have found more than 20 per cent of slum women in Dhaka suffering a BMI below 18.5.
Most studies on low-income women’s health and nutritional status in Bangladesh concentrate on urban and suburban slums.

8 Improving Nutritional Status for Women in Low-Income Households
One exception is a large-scale study of rural adolescent girls (ages 13-18 years); it found 21 per cent “thin” and 32 per cent “stunted.” Another study found limited, though increasing, evidence of obesity among women living in Dhaka region and other urban centres of the country.
Food security in Bangladesh has often been assessed on the basis of the adequacy of rice consumption. In our survey more than 90 per cent of all women consumed satisfactory servings from the cereals and potato group of foods. The majority in both samples failed to eat at least five – the recommended number – of servings from the fruit and vegetables category. Women consumed inadequate dairy servings. Milk consumed with tea is often the only source of calcium and vitamin D. The majority consumed adequate protein, but over a quarter did not. Almost all women con-sumed fat, oil and sugar within acceptable limits. To obtain adequate intake of micro-nutrients, a diverse diet is required. Nearly a third of the low-income women received the lowest score on this question. Given their rural location, it is not surprising that the rural women scored better in terms of eating at least two vegetables, due to their access to home-grown and locally produced vegetables at low cost and sometimes free of cost. Rural women also scored higher in terms of eating at least one fresh fruit and choosing healthy snacks. But the majority of both groups did not eat any fresh fruit and chose relatively unhealthy snacks mostly purchased from nearby street food shops.
While the majority of low-income women may have an adequate calorie intake, the evidence is clear: many suffer
from deficiency of protein and micronu-trients. The central policy problem is how to improve the quality of their diet at a reasonable incremental cost – whether to the women’s families, to government, or to relevant NGOs.
Explaining Poor Nutrition
Many factors – at the household, commu-nity, national and international levels – un-derlie the problem. In analyzing the survey results, we considered separately six sets of factors: 1) poverty and food price inflation; 2) low education levels among women; 3) absence of basic nutritional information; 4) cultural barriers facing women; 5) inad-equate standards of cleanliness and hygiene (including source of drinking/cooking wa-ter); and 6) addiction to tobacco and betel nut among household members.
Poverty and Food Price Inflation
Poverty is often the root cause of food insecurity, inadequate access to health care services, poor sanitation and unsafe water, low education levels, and lack of proper caring practices among pregnant women. Bangladesh has experienced food price infla-tion over the last decade, the most dramatic being the 2008 spike in rice prices. Even if low-income families have sufficient income for a healthy diet, spikes in food prices may lead to a sacrifice in diversity of diet. Rural women who reported having reduced food consumption in the previous year due to food price inflation were more likely to have inadequate diets.

9Centre for Policy Research of IUBAT • Summer 2012
Education
Independently of its effect on productivity and earnings of workers, education builds abilities and social skills, which in turn contribute to health and wellbeing of people as adults. In general, women in households with higher education levels enjoyed better nutrition.
Nutritional Information
Vulnerable households usually have limited access to nutrition information. Among rural girls in Bangladesh, ages 13-18, one study found that more than half do not know the name of foods that are sources of protein, and a third do not know the ne-cessity of nutritional supplements for their physical growth. Even with a low income, families can often improve their nutritional status by substituting healthy for unhealthy foods, and eliminating or reducing expendi-ture on addictive products such as tobacco.
The survey results imply in general improved nutrition among those receiving advice comes from a reliable source such as a nurse or doctor working in a health facility. On the other hand, advice received from NGO health workers apparently had no impact.
Cultural Barriers
Due to the patriarchal nature of Bangladeshi society and a deep-rooted preference for sons, females in South Asian countries often face discrimination in terms of investment in education, access to resources (such as food and health care), and freedom to own assets
– and in household decision making. Son-preference is rooted in the idea of higher earning potential of sons than daughters, and expectation of support from sons for parents during their old age and at times of crisis. In South Asia the nutritional status of female children (age 0-4 years) is worse than male children of the same age. The South Asian gender gap in nutrition is worse than in other regions of the world and the gap widens as children grow up. Our survey found no significant evidence of this effect.
Hygiene and Cleanliness
Frequent attacks of infectious diseases can offset the value of a nutritious diet. In the rural sample nearly all women used safe water from tube wells; in the urban sample, only 16 per cent did.
Unhygienic water and sanitation may result in a high incidence of various water-borne communicable diseases. Unclean household environment, poor personal sanitation, and improper disposal of human feces are common in poor neighbourhoods resulting in various parasitic infections. Disease reduces the ability of the body to use nutrients, and poor diet increases the incidence of disease.
Tobacco and Betel Nut
Among low-income men in Bangladesh, ad-diction to tobacco is very common. More than 65 per cent of the rural households and 70 per cent of the urban households sampled have at least one member who smokes. Tobacco consumption is the cause

10 Improving Nutritional Status for Women in Low-Income Households
of eight major diseases, such as ischemic heart disease, lung cancer, stroke, oral can-cer, cancer of the larynx, chronic obstructive pulmonary disease, pulmonary tubercu-losis, and Buerger’s disease. The average standardized rate of mortality due to lung cancer in Bangladesh (18.2 per 100,000 population) is the highest among all South Asian countries.
In very few cases do the women them-selves smoke. However in analyzing the survey, we found in general a negative association between women’s nutrition and the extent of tobacco consumption in the household. Consumption of tobacco may affect women’s nutrition via several routes. Income spent on tobacco reduces income available for food. Families that smoke may be less knowledgeable of the dangers of tobacco and the requirements for a healthy diet. Whatever the nature of the link, the survey results point to a nutri-tion benefit – in addition to health benefits to those presently smoking – of eliminating use of tobacco.
About 65 per cent of poor households have at least one member who chews betel nut. The majority of those chewing are women. Betel quid (betel leaf, areca nut, lime and sometimes tobacco) is another common addictive purchase in Bangladesh and South Asia. In rural areas, offering a decorated betel quid to guests and relatives is a symbol of hospitality, which people consume for recreation, breath freshening and for digestive purpose. Chewing areca nut may cause submucous fibrosis and used along with tobacco can cause leukoplakia which ends as oral cancer.
Recommendations
We examined numerous options, some appropriate for pursuit by NGOs and oth-ers by the Government of Bangladesh. We considered options in five categories:
• promotion of nutritionAl SupplementS: Two options within this category are rice fortified with micronutrients and forti-fied yogurt (shokti-doi).
• improvementS in hygiene: Two options here are setting shallow tube wells in slum areas of cities not subject to arse-nic in groundwater and providing “siraj mixture” for treating contaminated ground water where arsenic is a serious problem. (Arsenic is not a serious prob-lem in Dhaka.)
• improvement in SourCeS of nutritionAl
AdviCe: Better training of community health workers is a potentially effective option.
• role of SoCiAl enterpriSeS: Social enter-prises pursue dual goals of providing a social service and covering all or most of their costs from sale of services. There may be a potential to copy a Jakarta-based project selling healthy food via street vans. Another is NGO promotion of vegetable gardens in rural areas.
• CAmpAignS AgAinSt tobACCo uSe: Given the negative link between tobacco con-sumption and nutrition, anti-tobacco campaigns should be pursued. However, pursuing such campaigns aggressively will probably raise significant opposition from adversely affected interests.

11Centre for Policy Research of IUBAT • Summer 2012
Policy options effectiveness Cost (Taka)
1. nutritional supplements (fortified rice)
high (among government options)
Annual cost: Tk.154 crore
Annual cost per household: Tk.960 (bottom 10 per cent of population)
2. hygienic water for urban slums (setting shallow tube wells or providing ‘siraj mixture’)
high (among government options)
Annual levelized cost of tube wells: Tk.13.9 crore
Annual cost per household of tube wells: Tk.140 (for urban slums where arsenic concentration low)
3. healthy food initiative through social enterprises
Jakarta model food van (urban)
low (among nGo options)
Annual cost per van: Tk.49,500 (10 van pilot project)
Cost per meal: Tk.20
household gardens (rural)high (among nGo options)
low cost to sponsoring nGo
4. nutritional and hygienic advice
Improve training of community health workers
high (among nGo options)
high cost relative to typical nGo budget, unless nGo obtains explicit donor support
Television advertisementmedium (among
government options)
low cost for government, provided media outlets agree to broadcast messages as public service; high, otherwise
5. Tobacco control
restrictive sellingmedium (among
government options)low cost for government
Advertisement banmedium (among
government options)low cost for government
As first priority our recommendation is the four options listed in the accompanying table as highly effective. They address key nutritional problems and are low cost in terms of cost/ household targeted or unit of service provided. Admittedly, implement-ing a subsidized rice fortification program targeted to the ultra poor poses a threat of additional corruption. There may be useful lessons from the Female Stipend Program. Potentially, the subsidy could be given to targeted families via coupons enabling a discount on purchases of fortified rice.
We have divided policy options between
those better implemented by the government
and those better implemented by NGOs.
However, the distinction is not absolute. It
may be feasible for government to contract
with slum community leaders for the main-
tenance of shallow tube wells in slums, and
NGOs may play a role. Government might
also choose to mount a program providing
nutritional training to community health
workers.

12 Improving Nutritional Status for Women in Low-Income Households

13Centre for Policy Research of IUBAT • Summer 2012

14 Improving Nutritional Status for Women in Low-Income Households

15Centre for Policy Research of IUBAT • Summer 2012

16 Improving Nutritional Status for Women in Low-Income Households

17Centre for Policy Research of IUBAT • Summer 2012

18 Improving Nutritional Status for Women in Low-Income Households
1. Introduction
THE OBJECTIVE OF THIS STUDy IS TO PROVIDE POLICy ADVICE TO IMPROVE
the nutritional status of low-income women in Bangladesh. While some suffer from inad-
equate calorie intake, the major nutritional problem is inadequate consumption of protein
and micronutrients.
We first report the nutritional status of a sample of women surveyed in two sites, one rural and one urban. The rural site is a group of villages near Jamalpur; the urban site is a slum in Uttara, in the Dhaka met-ropolitan area. (See figure 1.1.)
Though we appreciate the value of long-term measures (such as improved education levels) to address nutritional deficiencies, we focus on programs able to yield benefits within a few years – some intended for implementation by NGOs and some by the Government of Bangladesh.
In spite of rapid urbanization in recent decades – Dhaka is the world’s 9th largest city with a population approaching 20 mil-lion – about seven of ten Bangladeshi live in rural areas.1 Lacking adequate education
1 Population Division, United Nations 2011.
and skills, most urban migrants work in the informal sector as rickshaw pullers, van and auto drivers, construction workers and day labourers. A few, with better education and skills, find jobs as low-skilled office employees and garment workers (Hossain 2006). In rural areas most income earners are agricultural workers, working their own or others’ lands. Some own small businesses such as handicrafts and poultry farms. Though urban residents, including those living in slums, have in general more access to education, health care and other services than do rural villagers, often the access remains inadequate.
Rice is the basic staple food in Bangla-desh. Generally, people consume rice twice per day, along with curries made with fishes, meats, eggs, vegetables, or lentils. The quantity and quality of food greatly vary

19Centre for Policy Research of IUBAT • Summer 2012
figure 1.1 map of bangladesh Showing Sample Areas for this Study
We report the nutritional status of a sample of women surveyed in two sites, one rural and one urban. The rural site is a group of villages near Jamalpur; the urban site is a slum in Uttara, in the Dhaka metropolitan area.
Uttara, in Dhaka metropolitan area Village near Jamalpur

20 Improving Nutritional Status for Women in Low-Income Households
with the economic well-being of households. Tea is a popular drink in both urban and rural areas. Milk consumed with tea is often the only source of calcium and vitamin D among the poor. Milk, fruits, meat and fish are consumed by the poor but often not in sufficient quantities. In recent years, food consumption among the poor has included nutritionally poor food items such as chips, biscuits, samosas, chocolates, and carbon-ated cold drinks (such as Coke) (Halder et al. 2003).
Malnutrition among women is a seri-ous problem – in Bangladesh as in many developing countries. Protein-energy mal-nutrition, iron deficiency anaemia, iodine deficiency disorders2 and vitamin A defi-
2 In general iodine deficiency is not a problem in Bangladesh. More than 80 per cent of households consume iodized salt (WFP 2004).
ciency are common (UNICEF 2010, Latham 1997). Malnutrition is a major cause of the high maternal mortality rate in Bangladesh, a rate second only to Nepal among South Asian countries (UNICEF 2011). The World Food Program (2004) estimated the preva-lence of anaemia among pregnant women in Bangladesh in 2004 at 47 per cent. Mal-nutrition passes from one generation to the next generation as malnourished mothers give birth to malnourished children. Nutri-tional problems among children contribute to the high – by world standards – under age-five mortality rates in Bangladesh and other South Asian countries. (See figure 1.2.)
There exist regional differences in the health and nutritional status of women. Generally, people living in the slums of Dhaka region consume more calories than those living in slums elsewhere. In a study
figure 1.2: maternal mortality, total fertility, and under five mortality rates, South Asia
34
24
59
23 28
71
38 30
55
26
40
91
4
23 16
0
10
20
30
40
50
60
70
80
90
100
maternal mortality ratio 2008 (deaths per 10,000 live births)
total fertility rate 2005-09 (average births per 10 women over their child-bearing years)
under five mortality rate 2005-09 (deaths per 1,000 live births)
Bangladesh India Nepal Pakistan Sri Lanka
source: World Bank (2011)

21Centre for Policy Research of IUBAT • Summer 2012
of 1900 slum households in Dhaka, Chit-tagong, Khulna and Rajshahi, 24 per cent of Dhaka slum households consumed less than 80 per cent of the recommended calorie intake. The comparable statistic for Khulna was 31 per cent, for Chittagong 36 per cent, and Rajshahi 40 per cent (Benson 2007). Among a study undertaken by the nursing college at IUBAT of 120 women living in a Uttara slum, about 12 per cent did not have adequate calorie intake in their diet to achieve a body mass index (BMI) above the traditional threshold of 18.5 (Richards et al. 2010).3 Bloem et al. (2004) found more than 20 per cent of slum women in Dhaka suffering chronic energy deficiency (BMI < 18.5); in Chittagong and Khulna about 35 per cent of slum women suffered chronic deficiency.
Most studies on low-income women’s health and nutritional status in Bangladesh concentrate on urban and suburban slums. One exception is a large-scale study of rural adolescent girls (ages 13 to 18 years); it found 21 per cent “thin” and 32 per cent “stunted” (Alam et al. 2010).4 A compara-tive rural/urban study on 15-49 years old married women living in Orissa, one of the less developed Indian states, found the BMI distribution of rural women to be worse than for urban women (Rout et al. 2009). Another study (Corsi et al. 2011) found lim-
3 This previous study was conducted by nursing students at IUBAT. The study is available on line at www.iubat.edu/cpr.
4 Thin was defined as a woman below the 15th percentile of the WHO age-specific BMI distribution for women. Stunted was defined as more than two standard deviations below the average age-specific height for women.
ited, though increasing, evidence of obesity among women living in Dhaka region and other urban centres of the country. In the context of Bangladesh, where many people struggle to get adequate calories, obesity has been considered a much less serious problem than insufficient calorie intake.
Food security in Bangladesh has often been assessed on the basis of the adequacy of rice consumption (Bose and Dey 2007). Among the sample of ultra-poor women considered in her study, Haseen (2005) found that 90 per cent of their calories came from rice. Another study, of 7000 households of all income classes residing in both urban and rural areas, found that rice and wheat accounted for more than three-fourths of per-capita protein and calorie intake (Bose and Dey 2007). Benson (2007) reached similar conclusions: among urban slum households located in Dhaka, Chittagong, Khulna and Rajshahi, meat, poultry, milk products and sugar were ir-regularly consumed.
The inadequate consumption of protein and micronutrients results in various long- and short-term health problems such as stunting, underweight, osteoporosis, and low bone-mass. In turn, these problems impair the physical ability to work and undertake healthy pregnancies (Leslie 1991; Sheshadri 2001; Pathak et al. 2004; UNI-CEF 2011). Lack of dietary diversity has been identified as a reason for micronutri-ent insufficiency by researchers (Ahmed et al. 2009). Such deficiencies are most often identified during pregnancy when there is increased need of micronutrients due to changes in women’s physiology (Pathak et

22 Improving Nutritional Status for Women in Low-Income Households
al. 2004). Most nutritional interventions have targeted maternal and child health, and are limited to pregnant and lactating women (Pathak et al. 2004; Leslie 1991). This targeting, Leslie concludes, means a relative under-emphasis on overall nutrition at other times.
While the majority of low-income women may have an adequate calorie intake, the evidence is clear: many suffer from deficiency of protein and micronu-trients. The central policy problem is how to improve the quality of their diet at a reasonable incremental cost – whether to the women’s families, to government, or to relevant NGOs.
Explaining Poor Nutrition
Many factors – at the household, com-munity, national and international levels – underlie the problem posed by inadequate nutrition. Osmani (1997) organized his explanation into three theories: 1) mate-rial deprivation or poverty; 2) inadequate public health infrastructure; and 3) cultural-behavioural effects, including quality of governance. (See Three theories to explain low population nutrition status.)
In analyzing the survey results of low-income women in Uttara and Jamalpur, we consider separately six potentially relevant sets of factors: 1) poverty and food price inflation; 2) low education levels among women; 3) absence of basic nutritional information; 4) cultural barriers facing women; 5) inadequate standards of cleanli-ness and hygiene (including drinking/cook-
ing water); and 6) addiction to tobacco and betel nut among household members.
Poverty and Food Price Inflation
Poverty is often the root cause of food insecurity, inadequate access to health care services, poor sanitation and unsafe water, illiteracy and low education, and lack of proper caring practices among pregnant women (UNICEF 2009; Haseen 2005).
The most frequently cited poverty thresh-old in developing countries is per-capita income of USD1.25 per day in US dollar purchasing power parity. The most recent UNDP estimate of the Bangladesh popula-tion consuming at less than USD1.25 per day is 49.6 per cent (UNDP 2011). (Hence-forth, those consuming less than USD1.25 per day are identified as “extreme poor.”) Among the extreme poor, those living with less than USD1 per day are identified as “ultra poor” (BRAC 2012a). They comprise 8 per cent of the national population. The rural poverty rate is higher than in urban areas in the country (Narayan et al. 2007). In order to obtain adequate calories, the ex-treme poor – and even moreso the ultra poor – often sacrifice more costly foods (fish, meat, pulses, fruits and vegetables) that are high in protein and/or micronutrients.
While income is relevant, so too may be food price inflation. Even if family income remains above an income threshold, low-income families may respond to food price inflation by sacrificing quality and diversity of diet (FAO 2010; Sulaiman et al. 2010). The most dramatic example of food price inflation over the last decade was the rice

23Centre for Policy Research of IUBAT • Summer 2012
Three Theories to Explain Low Population Nutrition Status
roughly speaking, one can discern three major strands among the theories that have emerged
to explain the secular improvement in health and nutrition observed in the developed world
and parts of the contemporary developing world …
The material well-being theory explains improved health outcomes principally in terms of
the secular improvement in food consumption made possible by general expansion in material
prosperity and increased agricultural productivity. [some] have advanced this explanation for the
vast improvement in life expectancy that occurred in the Western world in the late 19th and early
20th century. They give this explanation precedence over the technology-based explanation on
the grounds that it was not until well into the 20th century that major advances occurred in medi-
cal technology capable of fighting the major infectious diseases responsible for high mortality …
This view has been challenged by proponents of the public-health or technology-based
theory. Their explanation recognizes that the most important breakthroughs in medical technol-
ogy [occurred] after and not before the most significant advances in human health were made
in the West. But they emphasize the importance of public health improvements at the local
level that were based on marginal advances in technology [that] had far-reaching implications.
examples are access to safe water, sanitation, and pasteurized milk. The argument is extended
also to the contemporary developing world. It is suggested that the sharp decline in mortality
observed in the developing world in the second half of this century owes more to technologies
that made possible mass access to safe water, sanitation, vaccination and other public health
facilities (such as oral rehydration therapy for diarrhea) than to material prosperity as such.
The third strand, namely the cultural-behavioural theory, also extends the argument to the
contemporary developing world. The vast disparities that exist in the experience of developing
countries provide the motivation for this theory. It is well-known that several poor countries
(such as China, Costa rica, Cuba, mauritius, sri lanka) and sub-regions (such as Kerala state
in India) have achieved levels of life expectancy that are close to the levels achieved by the
richest countries in the world, which suggests that a good deal more than material prosperity
is involved in the explanation of improved health status. By the same token, a good deal more
than public health technology must also be involved, since others who haven’t done so well
have had access to the same technologies that were put to good effect by the more success-
ful ones. The missing element presumably lies in the cultural and behavioural pattern of the
people concerned; different cultural influences may predispose them to respond differently to
the availability of food and health technology. Among the major determinants of the relevant
behavioural pattern, researchers have identified female education and gender relationship as
especially important, along with the system of governance.
— siddiq osmani (1997), from Poverty and Nutrition in South Asia

24 Improving Nutritional Status for Women in Low-Income Households
price spike in 2008. However other foods have also experienced significant inflation (Richards et al. 2010,33-36). In May 2011 the annual Bangladesh food price inflation rate was around 13 per cent (BBS unpub-lished, May 2011). Food price inflation has been higher in rural (14 per cent) than in urban areas (11 per cent).5
Education
Independently of its effect on labour pro-ductivity, education builds abilities and so-cial skills, which in turn contribute to health
5 Bangladesh Bureau of Statistics 2011 (unpublished).
and wellbeing of people as adults. Among countries at similar levels of economic development, higher female literacy rates typically are associated with dramatically better overall health status among women and children (Richards 2012).
Nutritional Information
Vulnerable households usually have limited access to nutrition information (FAO 2011). Among rural girls in Bangladesh, ages 13-18, more than half do not know the name of foods that are sources of protein, and a third do not know the necessity of nutri-tional supplements for their physical growth (Alam et al. 2011).

25Centre for Policy Research of IUBAT • Summer 2012
Even with a low income, families can often improve their nutritional status by substituting healthy for unhealthy foods, and eliminating or reducing expenditure on addictive products such as tobacco. Poten-tially, the provision of information can have a beneficial impact on nutrition.
Cultural Barriers
Due to the patriarchal nature of Bangladeshi society and a deep-rooted preference for sons, females in South Asian countries often face discrimination in terms of investment in education, access to resources (such as food and health care), and freedom to own assets – and in household decision making (FAO 2011; Ravindran 1986; Leslie 1991; World Bank 2011). Son-preference is rooted in the idea of higher earning potential of sons than daughters, and expectation of support from sons for parents during their old age and at times of crisis (Muhuri and Preston 1991). In the South Asian region the nutritional status of female children (ages 0 to 4 years) is worse than male children of the same age. The South Asian gender gap in nutrition is worse than in other regions of the world and the gap widens as children grow up (UNICEF 2011).
Because of the discriminatory cultural and social environment, women often have low self-confidence and accept a self-sacrificing role in the family – including acceptance of her food needs as the least im-portant among family members. As a result, from childhood through adolescence and even during pregnancy and lactating peri-ods, women consume inadequate nutrients.
Hygiene and Cleanliness
Frequent attacks of infectious diseases can offset the improvement of health status arising from a nutritious diet. In Bangladesh poor people often do not have access to safe drinking water and sanitation. Among rural people 78 per cent have access to improved water such as a household connection, a public standpipe, a borehole, a protected well or spring, or rainwater collection (World Bank 2011). Among urban people this per cent is slightly higher (85 per cent); obviously the living condition of urban slums are much worse than for the average urban resident.
Unhygienic water and sanitation may result in a high incidence of various water-borne communicable diseases. The mor-bidity rate due to diarrhoea in Bangladesh per 1,000 population is 9.4 per year (BBS

26 Improving Nutritional Status for Women in Low-Income Households
2000). Unclean household environment, poor personal sanitation, and improper disposal of human feces are common in poor neighbourhoods resulting in various parasitic infections (Haseen 2005). Osmani (1997) describes an “infection-nutrition nexus,” a two-way relationship between diet and disease. Disease reduces the ability of the body to use nutrients, and poor diet increases the incidence of disease.
Tobacco and Betel Nut
Among low-income men in Bangladesh, ad-diction to tobacco is very common. More than 65 per cent of the rural households and 70 per cent of the urban households sampled have at least one member who smokes.
In very few cases do the women sampled smoke. However in analyzing the survey, we found in general a negative association between women’s nutrition and the extent of tobacco consumption in the household. Consumption of tobacco may affect wom-en’s nutrition via several routes. Income spent on tobacco reduces income available for food. Families that smoke may be less knowledgeable of the dangers of tobacco and the requirements for a healthy diet. Whatever the nature of the link, the survey results point to a nutrition benefit – in ad-dition to health benefits to those presently smoking – of programs combating use of tobacco.
Tobacco consumption is the cause of eight major diseases, such as ischemic heart disease, lung cancer, stroke, oral cancer, cancer of the larynx, chronic obstructive
pulmonary disease, pulmonary tuberculosis, and Buerger’s disease (GLOBOCAN 2008; WHO 2005). These diseases are responsible for 16 per cent of all deaths in Bangladesh; tobacco consumption is the sole cause of 9 per cent of such deaths (WHO 2005). The average standardized rate of mortality due to lung cancer in Bangladesh (18.2 per 100,000 population) is the highest among South Asian countries (GLOBOCAN 2008). The annual cost of tobacco-related illness in Bangladesh is estimated at USD40 million (WHO 2005).
Betel quid (betel leaf, areca nut, lime and sometimes tobacco) is another com-mon addictive purchase in Bangladesh and South Asia. In rural areas, offering a decorated betel quid to guests and relatives is a symbol of hospitality, which people consume for recreation, breath freshening and for digestive purpose. The IUBAT sur-vey reported 65 per cent of households have at least one member who chews betel nut. Chewing areca nut may cause submucous fibrosis and used along with tobacco can cause leukoplakia which ends as oral cancer (Auluck et al. 2009).

27Centre for Policy Research of IUBAT • Summer 2012
2. Methodology
THE PRIMARy METHODOLOGy WAS A SURVEy TO ASSESS THE NUTRITIONAL
status of low-income women in the two sites. To explore more complex issues, two focus
group discussions were conducted, again one urban the other rural. (See figures 2.1 and
2.2.) Only married women were considered for the study.
We acknowledge here that the Asian University for Women conducted a parallel survey, using the same survey question-naire, among a sample of young women in Raozan, a suburban community near Chittagong. Their survey was addressing matters beyond the scope of low-income women and we do not here discuss their results. We hope in the future to compare the results of their sample with those drawn from the two samples analyzed in this study.
For the rural survey, low-income women were selected from four villages (Satkura, Mohadanga, Narkeli and Fatehpur) in the Kendua union in Jamalpur Sadar, an upazila in the district of Jamalpur, located in north-ern Bangladesh.6 This is a rural area where
6 Bangladesh consists of six administrative divisions, divided into 64 districts. Jamalpur is one of them. Each district is divided into sub-districts (upazila). Jamalpur Sadar is a upazila in Jamalpur district. Each upazila is divided into a number of unions, the lowest administrative unit in rural Bangladesh (Banglapedia 2012).
relatively little urbanization has occurred.The urban study was conducted in a
large slum located in the Abdullahpur / Kamarpara area in Uttara, Sector 10, in northern Dhaka city, close to the Turag River. The established residents are reason-ably prosperous. Over the last two decades, a large shanty community, mostly migrants from rural areas, has arisen on government-owned land. These slum houses are mostly built by local political leaders who often have no legal lease on the land but none-theless collect rent from the slum dwellers.
Most of the houses in the rural area and urban slums are non-pakka (without solid permanent foundations, walls and roofs). The major difference in the pattern of houses in rural and urban areas is the sur-rounding space. In Jamalpur each house is separated from other houses and has a wide open area around it. Each house has a sepa-rate kitchen and washroom. Slum houses in Uttara are spread along the two sides of a highway (the Tongi-Ashulia road). These

28 Improving Nutritional Status for Women in Low-Income Households
figure 2.1 rural sample area location: Kendua thana in Jamalpur Sadar upazila
figure 2.1 urban sample area location: uttara (dhaka)
source: Banglapedia 2012
source: Banglapedia 2012

29Centre for Policy Research of IUBAT • Summer 2012
houses are non-pakka: they share common walls made of corrugated tin or sheets of interwoven bamboo leaves. In most cases each family lives in one room, and shares kitchen, washroom and other household facilities with other families.
Sampling Technique
The surveyors restricted their sample to women who live in non-pakka houses. A systematic sampling7 technique was used. Initially we designated a sample size of 600 households divided equally between rural and urban. In each sample location, sur-veyors approached every third non-pakka house. If the woman did not want to partici-pate in the survey, then the next non-pakka house was approached. If a woman from that house participated in the survey, then surveyors repeated the process.
A household included all people living together in the same dwelling and sharing their assets and income. Both characteristics needed to be fulfilled to define a household. If two households live in the same dwell-ing, then surveyors randomly selected one household for the interview.
7 Systematic sampling is often used instead of random sampling. After the required sample size has been calculated, every Nth record is selected from a list of population members. (Source: statpac.com/surveys/sampling.htm)
Questionnaire Design
The survey consists of 37 questions. Origi-nally prepared in English, we translated the questionnaire into simple Bangla. The trans-lation used sensitive wording for questions that may be uncomfortable for the women or their household. (See Appendix A for the English version of the questionnaire.)
The broad topics for the survey were the following:
• The 24-hours diet recall was the key component to assess the nutritional status of the women. Each woman was asked to recall what she ate at breakfast, lunch, supper and other times during the day. Though the measurement of quan-tity of consumed food is subjective and depends on the respondent’s memory, this is a well accepted research method to assess a person’s regular diet (WHO 2001).
• Surveyors asked whether the women consumed iodized salt, calcium tablets, fortified yogurt, vitamin “sprinkles,” zinc and iron – either regularly or ir-regularly. Surveyors also asked about sources of drinking and other water for household uses, and about household toilet facilities.
• Twelve questions gathered information about the number of household members who smoke or chew betel nut, and about any change in use of tobacco or betel nut, and reasons behind those changes.
• The survey asked whether the women received advice on nutrition, and from what source.

30 Improving Nutritional Status for Women in Low-Income Households
• The survey assessed several socioeco-nomic characteristics of the household. Women were asked about each member’s occupation and how many hours on av-erage each member works per day. Also questions were posed about land owner-ship, electricity connection of the house-hold, and the list of assets the household owns. Information was collected on the respondent’s age, weight, height, highest school class attainment and occupation. Similar information (except height and weight) was also collected for all other members in the household. (Each pair of surveyors was provided a scale and a tape to measure the weight and height of the women.)
• To assess the effect of inflation on the respondent’s food consumption and nu-trition, she was asked to assess in general the household’s current food adequacy and food adequacy one year before. Some qualitative questions were posed about food distribution among house-hold members (who gets more food in the household or is food divided equally among all?), problems due to food price increases, and reasons for consuming less food if so reported.
In the neighbourhood of each survey area, surveyors inquired of a few shopkeep-ers about the price of regular foods pur-chased by the nearby households. National data about the price of those foods are available. However large regional variation exists in the retail price of daily foods. So we collected the local price from the neighbour-hood shops and market place.
The Survey and its Limitations
In rural areas the survey data were col-lected by 10 professional surveyors in June 2011. The survey in the urban slums was undertaken by 10 undergraduate students at IUBAT, from mid-June to early July 2011. In total, 276 rural and 301 urban women were interviewed. Being a Muslim country, Fri-days in Bangladesh are a religious day and a holiday. Most households prepare special meals on that day. So Friday and Saturday were avoided in conducting the survey.
A pair of surveyors, a male and a fe-male, went to each household to interview respondents. Questions were asked orally by the female surveyor. The male surveyor took notes and assisted the female survey-ors. The reason behind female surveyors posing questions and measuring height and weight was the cultural sensitivity of interaction between male and female. Due to security concerns of young women in Bangladesh moving alone, each pair of sur-veyors included a man. Surveyors received an honorarium for their work.
One limitation of the survey is weak information on family income. Women are reluctant to describe income to strangers and are less knowledgeable than their hus-bands of monetary matters. Accordingly, we did not pose direct questions about income. Many women were uncomfortable about mentioning household toilet facilities. Women in urban slums were less uncomfort-able regarding these questions than women in rural areas. Answers to these questions may be biased.

31Centre for Policy Research of IUBAT • Summer 2012
Focus Group Discussions
We conducted two focus group discussions with women, one in Satkura, a village in Jamalpur, and another in Uttara. The dis-cussions took place in BRAC non-formal schools located in those areas. Approxi-mately a dozen women participated in each focus group. BRAC provided organizational supports for the interviews.
We asked questions about the effects of food price inflation and coping strategies at
the time of food price spikes. We also dis-cussed women’s nutritional education, their husbands’ smoking behaviour, arranging healthy food for the family, role of schools for nutritional education, short-term income-generating initiatives appropriate for less educated and conservative women. Questions were semi-structured and were open ended. Women’s views were useful for the policy analysis part of my study.

32 Improving Nutritional Status for Women in Low-Income Households
3. Descriptive Statistics
THERE ARE MANy MEASURES OF THE HEALTH AND NUTRITIONAL STATUS
of a population. The current survey uses a WHO (2001) food score measure of dietary
intake and a widely used measure, body mass index (BMI). Surveyors listed all foods and
enquired about quantities consumed by the women for the previous 24 hours. To determine
BMI, surveyors measured weight and height.
Neither BMI nor food scoring captures detailed nutritional problems. However, these non-intrusive techniques provide fundamental nutritional information about a population. The size of the low end of the BMI distribution is a good indicator of the extent to which a group experiences inad-equate calorie intake; the food score reveals the approximate extent of inadequate di-etary intake of micronutrients and protein, of excess fat consumption, and so forth.8
Figure 3.1 illustrates the BMI distribu-tions of the rural and urban population samples. The ‘optimum’ BMI range is 18.5
8 BMI is a widely used measure, defined as the ratio of weight (in kilograms) divided by the square of height (in meters).
to 25. A BMI score below 18.5 indicates ‘underweight’, between 25 and 30 ‘over-weight’, and above 30 ‘obesity’. Relative to those within the optimum range, those whose BMI is below and above are more susceptible to a range of diseases and other complex health syndromes. Underweight is somewhat more prevalent among low-in-come rural than urban women. By a similar margin the share falling into the optimum range is higher in the urban sample. Over-weight and obesity, combined, are similar shares in both samples.
The food score is a summary measure derived from the 24-hour diet recall. It com-prises ten questions, on each of which the respondent received a score of 1 (adequate),
8

33Centre for Policy Research of IUBAT • Summer 2012
0.5 (minimally adequate), or 0 (inadequate). For example, Q6 scores diets with respect to the variety of foods consumed within the major food groups. The more variety the greater the probability that the respondent is receiving adequate micronutrients. (See Appendix B for further detail on scoring of questions.) A respondent’s food score ranges between a minimum of 0 and maximum of 10. The WHO identifies ranges of the food score as risky (3.5 or less), fair (4 – 7), good (7.5 – 8.5), excellent (9 – 10). We have sub-divided the fair category into fair-low (4 – 5), fair-medium (5.5 – 6) and fair-high (6.5 – 7). Given our interest in factors associated with nutritional inadequacy, we have for some aspects of the analysis divided the sample into those whose diet is deemed either inadequate (0 – 5) or adequate (5.5 – 10).
Figure 3.2 illustrates the distribution of food scores in each sample, by category. None of the women scored excellent; how-
ever, women in the rural sample displayed somewhat better nutrition in that they obtained higher shares in the fair-high and good categories than their urban counter-parts. Figure 3.3 illustrates the distribu-tions, by question. More than 90 per cent of all women consumed satisfactory serv-ings (score 1) from the cereals and potato group of food (Q1). The majority in both samples failed to eat at least five – the rec-ommended number – of servings from the fruit and vegetables category (Q2). Nearly all women sampled consumed inadequate dairy servings (Q3). In both samples, the majority consumed adequate protein, but a quarter did not. Nearly all women con-sumed fat, oil and sugar within acceptable limits (Q5, Q10). To obtain adequate intake of micronutrients, a diverse diet is required. Nearly a third scored zero on the question probing dietary diversity (Q6). Given their rural location, it is not surprising that the
figure 3.1: distribution of body mass index (bmi), rural and urban Samples
24.3
61.6
12.9
1.1
20.5
64.4
12.2
2.9
0
10
20
30
40
50
60
70
underweight (BMI 18.5)
optimum (18.5≤BMI 25)
overweight (25≤BMI 30)
obese (30≤BMI)
Rural (Jamalpur) Urban (Uttara) pe
rcen
t

34 Improving Nutritional Status for Women in Low-Income Households
rural women scored better in terms of eating at least two vegetables, due to their access to home-grown and locally produced veg-etables at low cost and sometimes free of cost (Q7). Rural women also scored higher in terms of eating at least one fresh fruit (Q8) and choosing healthy snacks (Q9). But the majority of both groups did not eat any fresh fruit and chose relatively unhealthy snacks, mostly purchased from nearby street food shops (Q10).
Explanatory factors
As discussed earlier, we identified six sets of factors that potentially influence women’s nutritional status. In chapter 4, we attempt to assess the statistical significance of each of the particular factors on the nutritional status of the women surveyed. In this chap-ter we describe in some detail the actual survey results.
Poverty and food price inflation
The average age of rural women in the sample is 38 years, of urban women 34 years (figure 3.4). The majority of married women in Bangladesh do not work in paid jobs outside their home, however women in the urban slum are more likely to do so than their rural counterparts (figure 3.5). An urban setting affords more opportunity to earn income, and the high cost of living encourages women to abandon traditional conservative customs. The occupations of women who do work outside the home include agricultural farming, business, handicrafts, poultry farming, house worker, official job, construction worker, garment worker. Women’s work in paid jobs con-tributes positively to their nutritional status in either or both of two ways: households where both husband and wife work will have a higher family income; women who work outside the home may have more au-
figure 3.2: distribution of rural and urban food Score, by Category
3.0
38.0
19.4 22.8
16.7
0.0 3.4
40.0
28.8
19.0
8.8
0.0 0
5
10
15
20
25
30
35
40
45
Risky Fair-low Fair-medium Fair-high Good Excellent
perc
ent
Rural (Jamalpur) Urban (Uttara)

35Centre for Policy Research of IUBAT • Summer 2012
figure 3.3: distribution of food Score, by Question
1.9
97.7
20.9
0.8
8.4
0.8
51.3
38.4
0.0 0.4
0.8 0.4
65.4
99.2
20.2
0.0
30.0 22.8
76.4 74.1
0.0
0%
10%
20%
30%
40%
50%
60%
70%
80%
90%
100%
Q1 Q2 Q3 Q4 Q5 Q6 Q7 Q8 Q9 Q10
SCORE 1.0 SCORE 0.5 SCORE 0
13.7
71.5
99.2
18.6
38.8
23.6 25.5
99.2
0.0
6.8
14.1 0.5
7.8
1.0
54.6 48.8
0.0 0.5
1.0 1.5
78.5
99.5
15.1 0.0
31.2 27.8
82.9 76.6
0.0
0%
10%
20%
30%
40%
50%
60%
70%
80%
90%
100%
Q1 Q2 Q3 Q4 Q5 Q6 Q7 Q8 Q9 Q10
SCORE 1.0 SCORE 0.5 SCORE 0
91.7
7.3
77.1
99.0
14.123.4
17.122.9
99.0
0.0
Rural
Urban

36 Improving Nutritional Status for Women in Low-Income Households
tonomy and freedom and thus access more nutritious food. However, in the context of the conservative Bangladesh society, families often do not allow women to work outside the home unless they face extreme financial difficulties. Hence, working outside the home is often a proxy for particularly low income.
In the rural area the majority of the husbands are agricultural labourers. In the urban area the majority of the husbands work in the residual category (day labourer, hawker, rickshaw-puller and construction worker). One-fifth of the urban husbands work in the low-paid formal sector, which in-cludes car driver, office assistant, field work-ers in NGOs, security guard (figure 3.6).
figure 3.5: Share of Women Who Work outside home
91.6
8.4
72.7
27.3
0
20
40
60
80
100
House wife Work outside home
Rural (Jamalpur) Urban (Uttara)
perc
ent
figure 3.4: distribution of the Age of Women
1.5
26.6 27.0 26.2
11.4
7.2 6.3
38.0
22.9
18.5
9.3
4.9
0
5
10
15
20
25
30
35
40
10-20 20-30 30-40 40-50 50-60 Above 60
Rural (Jamalpur) Urban (Uttara)
perc
ent

37Centre for Policy Research of IUBAT • Summer 2012
figure 3.6: distribution of husbands’ occupations
55.9
6.6 9.6
22.3
5.7 2.9
22.4
8.8
59.4
6.5
0
10
20
30
40
50
60
Agricultural labour
Formal sector Business Other labour Unemployed
Rural (Jamalpur) Urban (Uttara)
perc
ent
table 3.1: distribution of households, by estimated per Capita income
rural (Jamalpur) Urban (Uttara)
percent
Very low (less than $1.25 per day) 25.5 4.9
low ($1.25- $2 per day) 26.6 13.7
medium ($2-4 per day) 38.8 69.3
high ($4-10 per day) 9.1 12.2
Very high (more than $10 per day) 0.0 0.0
We constructed an estimate of household members’ labour income and income from income-generating assets. From the survey we obtained information on household members’ occupations, average hours worked per day, and household assets. In estimating money income per family member, we applied the “square-root for-mula” (dividing the estimate of total family income by the square-root of total number of household members). Rural households are on average poorer than the urban in terms of income. The high living costs in
Dhaka reduce somewhat the urban income advantage. (See table 3.1. The details of the calculation are given in Appendix C.)
Women who reported having consumed less food compared to the previous year were asked to explain. One explanation given was household financial difficulty. A far more frequently offered reason was food price inflation. Respondents may have given both reasons, but even if inflation-adjusted household income did not decline, high food price inflation may have caused women to reduce food consumption. (figure 3.7).

38 Improving Nutritional Status for Women in Low-Income Households
figure 3.7: reasons offered Among respondents Who Consumed less food than previous year
88.6
7.9 14.5
63.3
1.0
47.7
0
20
40
60
80
100
increase in food prices household financial hardship
other reasons
perc
ent
Rural (Jamalpur) Urban (Uttara)
Education
We gathered data on both ‘literacy’ and ‘highest class attendance’ of women and other members of the household (figures 3.8, 3.9). Among the women sampled, ap-proximately two out of three cannot read
at all. The median highest level of education among both women and their husbands, both in the rural and urban sample, is in the interval of class 0 – 2. As reported, husbands’ education levels are somewhat higher than for their wives; however the results are overall similar.
figure 3.8: distribution of literacy, by Sample and gender
65.8
6.8
27.4
63.4
14.1
22.4
66.1
6.9
27.0
52.9
7.6
39.4
0
10
20
30
40
50
60
70
cannot read can read a little can read
rural women urban women rural husbands urban husbands
perc
ent

39Centre for Policy Research of IUBAT • Summer 2012
figure 3.9: distribution of highest Class Attended, by Sample and gender
table 3.2: frequency of reference to particular Sources of Advice
rural (Jamalpur) Urban (Uttara)
percent
family/neighbour 35.4 32.7
health facility care providers (doctors, nurses) 16.0 18.5
Community health workers 49.4 38.0
Public meetings sponsored by nGos 20.9 43.9
radio/TV 14.4 5.9
other 1.5 10.7
Women’s husbands are primarily respon-sible for earning money income and buying food in the household. Given the patriarchal nature of society, husbands have more authority in household decision-making than women. A better educated husband is expected to earn more and buy more nutri-tious food than an illiterate husband and may be more concerned about his wife’s health and nutrition.
Nutritional Information
Women who report having received advice on nutritional diets are expected to have bet-ter nutritional status than women who do not (table 3.2). We defined several variables specifying sources of advice: 1) family, rela-tives or neighbours; 2) health facility care providers (doctors, nurses); 3) community health workers who visit homes; 4) public
67.7
18.6
10.6 3.0
64.9
20.5
13.2
1.5
68.2
16.3
7.7 7.7
55.3
24.7
8.2 11.8
0
10
20
30
40
50
60
70
80
Class 0-2 Class 3-5 Class 6-9 Class 10 and above
rural women urban women rural husbands urban husbands pe
rcen
t

40 Improving Nutritional Status for Women in Low-Income Households
meetings conducted by NGOs; 5) radio and television announcements; and 6) other (which include posters, public announce-ments, etc.). Respondents could indicate multiple sources of information.
Community health workers are the most frequently cited source of nutritional information in the rural sample and a close second in the urban sample. By contrast, less than one in five got advice from nurses or doctors in health facilities.
Most women regularly consumed iodized salt, but 20 per cent of rural and 10 per cent of urban women did not (table 3.3). More
than 90 per cent of women either did not consume or had not heard about fortified yogurt9 and sprinkles. Over 80 per cent of urban and rural women either had not heard of or never consumed zinc tablet/syrup. Most women consume calcium, vitamin and iron tablet/syrup irregularly. There was little evidence of increased use of nutritional supplements during pregnancy.
9 Fortified yogurt is a special kind of nutritious yogurt fortified with additional micro-nutrients. The joint venture of Grameen and Danone, a social business, markets such yogurt (‘shokti-doi’) (yunus Centre 2012).
table 3.3: distribution of frequency of use of nutritional Supplements
Iodized salt
Calcium tablet
fortified yogurt
Vitamin tablet
sprinklesZinc tablets
/ syrupIron tablets
/ syrup
(percent)
rUrAl
regularly 81.4 3.4 0.0 1.5 0.0 0.0 3.4
sometimes, not regularly
12.5 36.5 6.1 39.5 1.5 12.5 37.6
When pregnant or nursing children
0.0 7.6 0.8 4.9 0.0 1.9 13.7
never 4.2 49.8 86.3 47.9 82.5 74.1 43.0
Don’t know 1.9 2.7 6.8 6.1 15.2 11.4 2.3
UrBAn
regularly 90.2 2.0 0.0 2.0 0.0 0.0 1.0
sometimes, not regularly
5.9 39.5 2.0 48.3 1.0 2.9 22.4
When pregnant or nursing children
0.0 5.9 2.0 11.7 0.5 1.5 6.3
never 1.5 38.5 37.1 29.8 25.4 42.9 43.4
Don’t know 2.0 4.4 10.7 8.3 22.0 16.6 2.9

41Centre for Policy Research of IUBAT • Summer 2012
Cultural Barriers
We constructed a question on intra-house-hold variation in food consumption as a measure of intra-household gender equality (figure 3.10). It is expected that households which divide expensive and nutritious food such as milk, meat, fish and fruits equally among household members are more gender-neutral compared to households in which husbands and children get more of those foods. Approximately a third of the women sampled reported that their husband and children received more generous food servings than did they.
We categorized families as nuclear, stem, and joint. A ‘nuclear’ family is a two-gen-eration family consisting of husband and/or wife and their single children. A ‘stem’
family is a three-generation family living together. It consists of husband and/or wife, their parents, married and/or unmarried sib-lings and the unmarried children of the hus-band/wife and their siblings. A ‘joint’ family is a type of family where three or more gen-erations with members like the stem family plus husbands/wives uncles/aunts and their families live together. Women living in stem and joint families are often dominated by a number of male and older female members. So, a higher percentage of women living in stem and joint families are expected to have lower nutritional status compared to women living in nuclear families. Nearly identical fractions of both rural and urban households (78 per cent) maintain a nuclear family structure.
figure 3.10: distribution of household food Allocation patterns
17.8
38.4 37.2
0.4
6.2
15.2
48.0
35.3
1.0 0.5 0
10
20
30
40
50
Everyone varied
Everyone equally
Husband and/or children
more
Women more
Conflicting answers
per
cent
Rural (Jamalpur) Urban (Uttara)
42 Improving Nutritional Status for Women in Low-Income Households
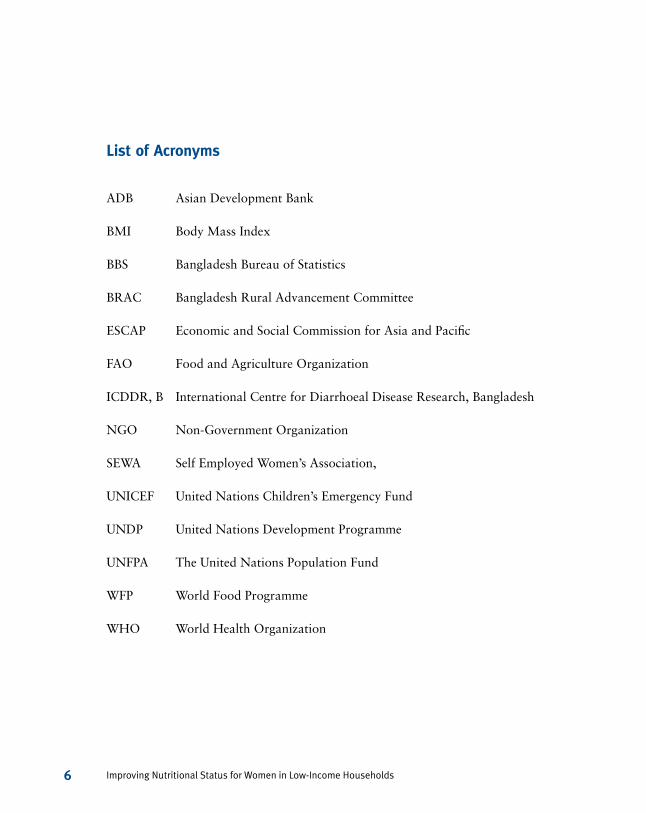
figure 3.11: distribution of Sources of drinking/Cooking Water
figure 3.12: distribution of households, by number of members Smoking tobacco
Hygiene and Cleanliness of the Household
Categorical variables on sources of water are a measure of household hygiene and cleanliness (figure 3.11). Almost all ru-ral households consume hygienic water, from either tube wells or boiled tap/river/pond water. However 84 per cent of the urban slum women use unhygienic water sources.
Addictions to Tobacco and Betel Nut
We constructed a number of categorical variables such as ‘number of household members who smoke’, ‘monthly expendi-ture on tobacco’ and share of husbands and wives smoking. Among low income men in Bangladesh, addiction to tobacco is very common. Approximately two thirds of households have at least one member who
35.7
59.3
4.9
31.7
62.9
5.4
0
20
40
60
80
none one two or more
Rural (Jamalpur) Urban (Uttara)
perc
ent
0.4
99.6
82.9
17.1
0
20
40
60
80
100
Unboiled water from government tap/hose/river/pond
Water boiled/Tubewell
Rural (Jamalpur) Urban (Uttara)
perc
ent

43Centre for Policy Research of IUBAT • Summer 2012
smokes. Very few households have female smokers (figure 3.16).
The variable ‘monthly expenditure on tobacco’ was constructed by multiplying household total cigarette consumption (add-ing cigarette consumption of all household members) by the price of the cheapest ciga-rette in Bangladesh (Tk.0.24) (figure 3.13). Since expenditure is based on the price of bidis, this is probably an underestimate. The
average monthly expenditure on tobacco in the rural households with at least one smoker is Tk.114, in the urban area Tk.139. (In both this is approximately one per cent of estimated monthly income.) In both samples, about 15 per cent of households spend over Tk.200 per month on tobacco.
About two thirds of households have at least one member who chews betel nut (figure 3.14). Prevalence of chewing betel
figure 3.13: distribution of estimated monthly expenditure on tobacco, households with Smokers
figure 3.14: distribution of households, by number of members who Chew betel nut
14.8
40.2
29.6
15.4
0.0
12.1
22.1
52.1
8.6 5.0
0
10
20
30
40
50
60
< Tk.50 Tk.50-100 Tk.100-200 Tk.200-300 > Tk.300
Rural (Jamalpur) Urban (Uttara) pe
rcen
t
31.6 36.9
31.6 35.6
46.8
17.6
0
10
20
30
40
50
none one two or more
Rural (Jamalpur) Urban (Uttara)
perc
ent

44 Improving Nutritional Status for Women in Low-Income Households
nut is somewhat greater in the rural sample, and rural households with members who chew betel nut spend on average more than their urban counterparts. The majority of those chewing are women. We estimated monthly expenditure on betel nut by multi-plying household total number of betel quid consumed (adding betel quid consumption of all household members) by the price of one quid (figure 3.15). The average monthly
expenditure varies between Tk.150 and Tk.200.
If we examine the distribution of those who smoke and those who chew betel nut by household member, there are dramatic differences. Very few women smoke; the overwhelming majority of smokers are husbands and other family members (figure 3.16). By contrast, the majority of those using betel nut are women.
figure 3.15: distribution of estimated monthly expenditure on betel nut, households with betel nut Chewers
figure 3.16: distribution of Smokers and users of betel nut
5.0
22.3
33.5
22.3
16.8 17.7
23.1 26.2
17.7 15.4
5
15
25
35
< Tk.50 Tk.50-100 Tk.100-200 Tk.200-300 > Tk.300
Rural (Jamalpur) Urban (Uttara)
perc
ent
3.2
83.8
13.0
0.0
84.8
15.2
52.9
36.0
11.0
64.1
25.9
10.0
0 10 20 30 40 50 60 70 80 90
wives husbands other household members
rural smokers urban smokers rural users of betel nut urban users of betel nut
perc
ent

45Centre for Policy Research of IUBAT • Summer 2012
4. Statistical analysis
WE UNDERTOOK TO ANALyzE THE SURVEy RESULTS VIA LOGISTIC REGRESSIONS
run separately on the rural and urban samples. There are useful results to report, but we
emphasize their tentative nature. The regressions in this chapter explain some of the vari-
ance in outcomes among the women sampled – but there is much more to explain than is
accounted for here.10
10 Regressions Constructed
We discuss nine regressions that attempt to explain five nutrition-related outcomes (regressands). (See tables at end of chapter for detailed regression results.):
• food AdeQuACy (regressions 1 and 5): Our primary interest is explaining
whether low-income women achieve an adequate level of nutrition. We defined a binary variable: 1 if women’s diet is deemed adequate, 0 if inadequate. Ad-equacy means a food score of 5 or above, inadequacy a score below 5. In other words, inadequacy is defined as a score falling in the ‘risky’ or ‘fair-low’ range.
10A logistic regression estimates the log of the odds of a particular outcome occurring as a linear function of the regressors. Beyond noting that the sign of the coefficient indicates whether the regressor has a positive or negative incremental impact on the outcome, interpreting the coefficients is not intuitive. In the case of a binary regressor that assumes a value of 0 or 1, the coefficient of the regressor, b, can be interpreted as follows: the marginal effect on the odds of an outcome due to a change in the regressor from 0 to 1 is given be eb. If the coefficient is in the range 0 < b < 0.5, then 100*b is approximately the percentage increase in the expected value of the odds. If the coefficient is in the range -0.5 < b < 0, then 100*b is approximately the percentage decrease in the expected value of the odds. This approximation becomes less exact the further the coefficient deviates from 0.
10

46 Improving Nutritional Status for Women in Low-Income Households
• diet diverSity (regressions 2 and 6): The food score is a composite index derived from ten questions. One of the central questions is no.6 dealing with diet di-versity (‘Did the respondent eat a variety of foods within each of three main food groups – cereals and potato; fruits and vegetables; meat, fish, eggs, daal?’). As with the other nine questions, this question was scored 1 (adequate), 0.5 (minimally adequate), 0 (inadequate).
• prevAlenCe of SmoKerS in houSehold (regressions 3 and 7): Very few women in the sample smoked, but in the major-ity of households there was at least one smoker. This is a binary variable assum-ing the value 1 if at least one household member smokes, 0 otherwise.
• prevAlenCe of fAmily memberS CheWing
betel nut (regressions 4 and 8): Similar to ‘smokers in household’, this vari-able assumes the value 1 if at least one household member chews betel nut, 0 otherwise.
• uSe of SAfe CooKing/drinKing WAter (regression 9): This variable assumes the value 1 if the household uses a safe source of water (from tube well or wa-ter boiled) for cooking and drinking, 0 otherwise. We ran this regression on the urban sample only.
Which Explanatory Factors Matter?
We here summarize which explanatory factors (regressors) are statistically sig-nificant in explaining the nutrition-related outcomes:
• fAmily higheSt eduCAtion level: We used three binary variables to define the household’s highest education level. The coefficients indicate the impact relative to the reference education level of class 0 – 2. The first is that at least one member achieved class 3 – 5, the second class 6 – 9, the third class 10 and above. For the urban regressions, the second variable is class 6 and above. Higher education is positively and significantly associated with higher food security in the rural sample; it is not significant in the urban sample. Higher education is strongly associated with respondents reporting a greater diversity in their diets, both in the rural and urban sample. In the rural sample, higher education is associated with a lower prevalence of smokers in the household; there is no significant association in the urban sample. Higher education is associated with a lower prevalence of betel nut chewing in both samples.
• number of CigAretteS ConSumed per dAy
in houSehold: There is a significant nega-tive association between nutrition and extent of cigarette consumption in the rural sample. This is true whether nutri-tion is defined in terms of food security or diet diversity. There are no comparable significant results for the urban sample.

47Centre for Policy Research of IUBAT • Summer 2012
• Women WorKing outSide home in pAid
Job: As discussed earlier, this is probably a proxy for a household experiencing particularly low income. In the rural sample there is a significant negative association between a woman working outside the home and her food security. In the urban sample, working outside the home does not have a significant impact on food security, but it significantly reduces diet diversity and is strongly associated with use of unhygienic water for cooking/drinking.
• SourCeS of nutrition AdviCe: Readers should be particularly cautious in in-terpreting these results. Nonetheless, the presence of a statistically significant association between a woman reporting she had received nutritional advice from a particular source is evidence that the nutritional advice from the source may have an impact.
° The only significant association from advice given by family and neighbours occurs in the case of the decision to use hygienic water among the urban sample. The as-sociation is negative: implying that advice from this source is conducive to relying on unhygienic tap water.
° Advice from doctors/nurses is signif-icantly associated with greater food security and diet diversity among rural women. In the case of urban women, such advice is associated with use of sanitary water but counter-intuitively it is also significantly associated with less diet diversity.
° Advice from home visits by commu-nity health workers is significantly associated in the rural sample with a lower prevalence of smokers in the household. However, this is the only statistically significant associa-tion between advice from commu-nity health workers and nutritional outcomes. We refer to this result in the next chapter and suggest bet-ter training for community health workers.
° In the rural sample there is a signifi-cant positive association between women who explicitly referred to nutritional advice via the media (television, radio or newspaper) and better food security and diet diversi-ty. In the urban sample women who referred to nutritional advice via the media were much more likely to use hygienic water.
° There is no statistically significant association between women attend-ing public meetings on nutrition and better outcomes, either in the rural or urban sample.
• uneQuAl intrA-houSehold diStribution
of nutritiouS foodS: Women who re-ported such inequality might be expected to have less food security and less diet diversity. There is no evidence to this effect among the rural sample. Counter-intuitively, among the urban sample is a significant, albeit weak, positive associa-tion of inequality and diet diversity.

48 Improving Nutritional Status for Women in Low-Income Households
• food priCe inflAtion as reason for re-duced food consumption in previous year: Among the rural sample there is a strong significant association between women citing this reason and both less food security and less diet diversity. There is also a strong positive association with increased prevalence of chewing betel nut – perhaps as a hunger depres-sant. Among the urban sample are no statistically significant relationships.
• finAnCiAl hArdShip as reason for reduced food consumption in previous year:
Among the rural sample there is a signifi-cant association between women citing this reason and both less food security and less diet diversity. Also, those citing this reason reported a lower prevalence of household smoking but a higher prevalence of betel nut chewing. Among the urban sample the only statistically significant association is that women reporting financial hardship are more likely to report a higher prevalence of betel nut chewing.
table 4.1 Summary regression results, rural Sample (n = 263)
food security (1.)
Diet diversity (Q6) (2.)
Prevalence of household smoking (3.)
Prevalence of betel nut chewing (4.)
household’s highest education, class 3-5: (1: highest is class 3-5; 0: otherwise)
2.1 (2.97) 2.7 (2.1)* -1.2 (3.04) -3.7 (2.9)*
household’s highest education, class 6-9: (1: highest is class 6-9; 0: otherwise)
2.4 (3.3) 2.6 (2.3) -5.2 (3.4)** -3.7 (3.2)
household’s highest education, class 10 and above: (1: highest is class 10 and above; 0: elsewhere)
4.6 (3.0)* 4.5 (2.1)*** -1.6 (3.1) -1.3 (3.0)
Cigarettes consumed per day by household members (cardinal number)
-0.32(0.11)*** -0.11 (0.08)*
Woman works outside home (1: works outside home; 0: otherwise)
-6.7 (3.6)** -0.8 (2.5) 1.1 (3.6) -2.3 (3.4)
nutrition advice from family and/or neighbours (1: received advice from this source; 0: otherwise)
1.24 (1.6) 0.6 (1.1) -0.13 (1.6) -1.7 (1.5)

49Centre for Policy Research of IUBAT • Summer 2012
table 4.1 Summary regression results, rural Sample (n = 263)
food security (1.)
Diet diversity (Q6) (2.)
Prevalence of household smoking (3.)
Prevalence of betel nut chewing (4.)
nutrition advice from doctors, nurses and health clinics (1: received advice from this source; 0: otherwise)
7.8 (2.8) *** 4.4 (1.98)*** -0.5 (2.9) -0.2 (2.8)
nutrition advice from community health workers who visit home (1: received advice from this source; 0: otherwise)
-0.6 (1.89) -0.7 (1.32) -3.5 (1.9)** -0.2 (1.8)
nutrition advice from TV, radio, or newspaper (1: received advice from this source; 0: otherwise)
4.6 (2.35)*** 5.25(1.65)*** -2.7 (2.4) 0.4 (2.3)
nutrition advice from public meeting the women attended (1: received advice from this source; 0: otherwise)
2.2 (3.0) 0.1 (2.1) 2.7 (3.1) -3.0 (2.9)
Unequal distribution of nutritious foods in household (1: unequal distribution; 0: otherwise)
-0.4 (1.98) 1.3 (1.4)
Inflation as reason for less food consumption this year over last (1: this reason cited; 0: otherwise)
-4.05(2.1)*** -4.4 (1.5)*** 0.2 (2.1) 5.7 (2.0)***
financial hardship as reason for less food consumption this year over last (1: this reason cited; 0: otherwise)
-5.4 (4.1)* -3.6 (2.9)* -7.7 (4.2)** 9.3 (4.0)***
r2 .14 .13 .04 .07
Adjusted r2 .10 .10 .00 .03
note: All regressands for Tables 4.1 and 4.2 are log of odds ratio of the respective outcome. standard errors in parentheses. legend for one-tail significance: * 10%, ** 5%, *** 2.5%.
continued

50 Improving Nutritional Status for Women in Low-Income Households
table 4.2 Summary regression results, urban Sample (n = 205)
food security (5.)
Diet diversity (Q6) (6.)
Prevalence of household smoking (7.)
Prevalence of betel nut chewing (8.)
Use of hygienic water for
cooking and drinking (9.)
household’s highest education, class 3-5: (1: highest is class 3-5; 0: otherwise)
2.3 (3.3) 3.3 (2.1)** 3.4 (3.0) -3.04 (3.0) -2.4 (2.3)
household’s highest education, class 6 and above: (1: highest is class 6 and above; 0: otherwise)
2.8 (3.3) 5.2 (2.1)*** 2.8 (3.0) -4.9 (3.12)* -1.8 (2.4)
Cigarettes consumed per day by household members (cardinal number)
0.04 (0.1) -0.07 (0.07)
Woman works outside home (1: works outside home; 0: otherwise)
-1.8 (2.7) -3.5 (1.7)*** -2.8 (2.5) -0.4 (2.5) -4.3(1.9)***
nutrition advice from family and/or neighbours (1: received advice from this source; 0: otherwise)
0.2 (2.3) 1.4 (1.4) -0.9 (1.96) 0.3 (2.0) -2.6 (1.5)**
nutrition advice from doctors, nurses and health clinics (1: received advice from this source; 0: otherwise)
-3.3 (3.1) -4.4 (2.0)*** 3.4 (2.9) -1.02(2.97) 4.1 (2.3)**
nutrition advice from community health workers who visit home (1: received advice from this source; 0: otherwise)
-1.1 (2.4) -1.5 (1.5) -2.4 (2.3) -2.3 (2.3) 0.6 (1.8)
nutrition advice from TV, radio, or newspaper (1: received advice from this source; 0: otherwise)
2.1 (2.4) -1.03 (1.5) -0.09 (2.2) 0.6 (2.3) 4.1 (1.7)***

51Centre for Policy Research of IUBAT • Summer 2012
table 4.2 Summary regression results, urban Sample (n = 205)
food security (5.)
Diet diversity (Q6) (6.)
Prevalence of household smoking (7.)
Prevalence of betel nut chewing (8.)
Use of hygienic water for
cooking and drinking (9.)
nutrition advice from public meeting the women attended (1: received advice from this source; 0: otherwise)
1.7 (5.0) -1.0 (3.2) 4.5 (4.7) 1.7 (4.8) -1.8 (3.7)
Unequal distribution of nutritious foods in household (1: unequal distribution; 0: otherwise)
1.3 (2.5) 2.1 (1.6)*
Inflation as reason for less food consumption this year over last or use of unhygienic water (1: this reason cited; 0: otherwise)
-0.05 (2.4) -0.8 (1.5) -0.3 (2.2) -2.0 (2.2) -1.4 (1.7)
financial hardship as reason for less food consumption this year over last or use of unhygienic water (1: this reason cited; 0: otherwise)
-0.8 (11.9) 3.8 (7.6) 11.6 (10.9) 13.9(11.3)* -1.95 (8.6)
source of water for cooking and drinking (1: hygienic source; 0: otherwise)
2.2 (3.2) 0.1 (2.02)
r2 .02 .10 .05 .03 .09
Adjusted r2 -.04 .03 .05 -.00 .05
note: All regressands for Tables 4.1 and 4.2 are log of odds ratio of the respective outcome. standard errors in parentheses. legend for one-tail significance: * 10%, ** 5%, *** 2.5%.
continued

52 Improving Nutritional Status for Women in Low-Income Households
5. Policy Analysis
BANGLADESH HAS VERy FEW PROGRAMS TO IMPROVE OVERALL NUTRITIONAL
status of low-income women. The ‘National Nutrition Program’ and ‘Area based com-
munity nutrition program’ are the two major programs initiated by the government. Both
target pregnant and lactating women only. In Bangladesh only 50 per cent of women visit
health facilities during pregnancy, and only 21 per cent visit facilities as part of post-natal
care (World Bank, no date). Some NGOs currently provide food supplements (‘pushti’) to
underweight (BMI<18.5) pregnant women (Ortolano et al. 2003), but the coverage is limited.
Here we concentrate on five direct nutrition-related policies. However, several long-term policies will yield nutritional benefits given sufficient time. One obvious policy is to give priority to improved female school attainment; another is improvement in the overall primary health care system accessible by low-income women. Creating income-generating opportunities will also yield nutritional benefits.11
11‘Pushti’ is a bangla word meaning nutrition. This supplement consists of rice-flour, roasted pulse flour, molasses and oil; it provides approximately 600 kcal per day.
Option 1: Nutritional supplements
There are several ways to provide nutri-tional supplements, starting with provision of direct oral micronutrient supplements via a health care centre. Home food fortification through micronutrient sachets (popularly known as sprinkles) is an effective method practised among 6-24 month-old children in many countries. Sprinkles provide iron, zinc, iodine and vitamins (Micronutrient Forum 2008; WFP 2009). However the micronutrient sachets are designed for children aged 6-24 months, who consume
11

53Centre for Policy Research of IUBAT • Summer 2012
small amounts of food. More research is necessary to prove the effectiveness of sprinkles for adults (Sprinkles Global Health Initiative 2012). Grameen Social Business12 is producing a fortified sweet yogurt (‘Shokti-doi’) specifically designed for children. The price of this yogurt (Tk.7 in rural area and Tk.12 in urban area) is not easily affordable by poor people. Large scale production may reduce cost in the long run (Planète d’Entrepreneurs 2012).
For adults, fortifying staple foods is an effective tactic for providing nutritional supplements (Allen et al. 2006, World Bank 2011, Micronutrient Forum 2012). This tactic has the advantage of not requiring any change in population eating habits. A pilot project in Bangladesh identified wheat flour and edible oil as two potential vehicles for food fortification (Dary and Rassas 2004). In 2012, six edible oil refiners in Bangladesh started to fortify edible oil. The cost of for-tified oil is predicted to be higher than the available edible oils in the market.13
In Bangladesh no initiative has yet been undertaken to fortify rice. Some countries14 have mandatory rice fortification programs: a specific per cent of total rice production must be fortified and targeted for the poor.
12 A wing of ‘Grameen Bank’, Bangladesh.13 www.thefinancialexpress-bd.com/more.
php?news_id=98443&date=2012-02-14.14 Examples are Philippines, Costa Rica and
some states in United States. India, Indonesia and China have also successfully introduced pilot programs of rice fortification for specific marginal groups.
Four main technologies can be used to fortify rice: hot extrusion, cold extrusion, coating and dusting.15 Cold extrusion and coating are the most cost-effective (Alavi et al. 2008). With coated rice, the nutrition value decreases if washed before cooking. Country case studies show that rice for-tification will increase the retail price by 1.5 to 4 per cent (Alavi et al. 2008; World Bank 2011).
Almost none of the women sampled have heard about fortified food and sprinkles, while the consumption of iron tablets/syrups, vitamin tables, zinc and calcium tablet/syrup is limited to only a few. Given the lack of use and knowledge of nutritional supplementation, a potential government policy options should include the follow-ing elements:
• Subsidizing fortified rice to the poor such that its price is equivalent to the lowest price of unfortified rice for a period of at least the first year
• Popularizing fortified rice as an easy and cheap way to address vitamin and mineral deficiencies
• Promoting the popularity of fortified yogurt.
15 Hot and cold extrusion produces rice shape kernels by mixing a rice made dough flours, a fortification mix and water either in hot (70-110oC) or in cold (below 70oC) temperature. Coating spread and layered fortification mix in wax or gum form on rice and dusting polish rice grains with micronutrient premix, stick with rice.

54 Improving Nutritional Status for Women in Low-Income Households
Option 2: Hygienic drinking water
According to the 2009 Multiple Indica-tor Cluster Survey, only 8.5 per cent of households in slum areas in Bangladesh use improved sanitation facilities that meet UNICEF monitoring standards (UNICEF 2012). Ahmed (2002) estimated the cost of treatment for hygiene-related diseases at Tk.640 crore per year. Our survey results show almost all rural and suburban women have access to either safe tube well water or boiled water. In the Uttara slum however, only 16 per cent use hygienic drinking water. Other studies (Podymow et al. 2003) have found similar results in Dhaka slums.16
No significant initiatives have been undertaken to supply safe water in urban slums in Bangladesh. In1999 the Bangla-desh Association for Social Advancement (BASA), a local NGO, set up 15 tube wells for 700 people in slums in Gazipur, a sub-urban area near Dhaka city. This NGO has carried out another safe drinking water project in a slum located in Mirpur area of Dhaka.
Setting sufficient tube wells in slum areas to ensure that slum families can access hy-gienic water is an obvious policy response. Tube wells can be either deep or shallow. Deep tube wells are not suitable as they are expensive to drill and maintain.17 Fur-
16 In this study of three slums located in Mohammadpur, Lalbagh and Dhanmondi in Dhaka city the authors found 87 per cent of slum dwellers do not have access to safe drinking water.
17 The cost of setting one deep tube well is approximately Tk.160,000 (Biswas 2004)
thermore, urban slums are often transitory. Shallow tube wells are much less costly.
Large areas in Bangladesh face a risk of arsenic in tube well water (As-arsenic 2012). In such areas, low-cost purification tablets of surface water are a potential solu-tion. ICDDR,B, the pioneer of diarrhoeal research in Bangladesh, recently invented ‘siraj mixture’, which effectively reduces the risk of diarrhoea (ICDDR,B 2012).18 A single siraj mixture costs Tk.0.35 and puri-fies 15 liters. Water purification tablets in arsenic-affected regions may well be justifi-able in terms of nutrition and improvements in overall health status, but our two sample populations live in areas not seriously af-fected by arsenic.
Option 3: Healthy food initiative through social enterprises
A social enterprise has two goals: to achieve social, cultural, community economic or en-vironmental outcomes; and to earn revenue from sale of its service or product. A fre-quently cited example is Grameen/Danone Foods, a partnership between Grameen Bank and Danone, a French manufacturer of dairy products. The social enterprise manufactures a fortified yogurt (Shokti-doi) as means to introduce micronutrients into children’s diet. The enterprise is expected to operate efficiently, raise its revenue through sales, but pose rigid limits on any dividends to the shareholders.
18 The siraj mixture contains a precise combination of alum potash, bleaching powder and lime.

55Centre for Policy Research of IUBAT • Summer 2012
Very few women, in either sample, have adequate servings of vegetables, fruits and milk in their regular diet. Moreover many of them regularly consume unhealthy snacks such as samosa, chips, biscuits, paratha and different kind of sweets. These snacks are mostly deep fried, made of flour and potato. They are prepared without maintaining minimum standards of hygiene and clean-liness. Such snacks are cheaper than fruits and vegetables.
Access to fruits, vegetables and healthy snacks at a low cost will encourage people to buy them. This is a potential tactic for NGO-sponsored social enterprises. Such enterprises also create work opportunities for women. A relevant example is Mercy Corps, an Indonesian NGO. It has launched Kedai Balitaku (My Child’s Café) selling through street vans in Jakarta.19 The goal is to provide healthy foods to school chil-dren, while raising awareness and increasing economic opportunity among local people. The cost of one chicken, rice, vegetable por-ridge meal for a child is the equivalent of Tk.16. This initiative has become popular and has been spun off as a for-profit social enterprise. Nonetheless, this porridge must compete with the favourite local snack, a gelatin pop, almost always made with ar-tificial fruit flavours and selling at half the porridge meal cost.
NGOs operating in Bangladesh could ex-pand nutrition-enhancing social enterprises with pilot initiatives in at least two ways:
19 The New york Times; May 23, 2011 (http://opinionator.blogs.nytimes.com/2011/05/23/in-food-deserts-oases-of-nutrition/)
• Sell ‘Jakarta model’ cheap nutritious meals and snacks through street vans in cities;
• Initiate gardening to produce vegetables and fruits in the homestead gardens near homes in rural areas (if land is avail-able). Women and children will work to produce fruits and vegetables for their households and community. NGOs can support the gardens via subsidized seeds, fertilizer and advice.
Option 4: Behaviour change through nutritional advice
In our survey, half of the women in the rural area and one-third in the urban area, received advice from health workers who visited them at home. Such advice did not appear to have any effect on nutritional outcomes. Inadequate nutritional knowl-edge among these health workers and lack of incentive to provide nutritional advice may be the explanation. On the other hand, there appears to be a positive relationship in all regions between women’s nutritional outcomes and receiving advice from either the media or from doctors or nurses at health facilities. Media advertisements are generally attractive and eye-catching presentations.
Moreover there are many examples of health-related advice programs in Bangla-desh dealing with specific health problems such as diarrhoea, tuberculosis, malaria, HIV, hygiene and cleanliness, and pre- and post-natal care of mother and children (BRAC 2012, Khandoker et al. 2009, UNI-

56 Improving Nutritional Status for Women in Low-Income Households
CEF 2004). These programs may contribute to better nutrition indirectly, but few aim to promote healthy food preparation at low cost. So, the fourth policy option is the following:
• Incorporate education on healthy food selection and preparation, maintaining nutrition during inflation, and balanced diet with existing health education programs;
• Improve training of community health workers.
Option 5: Reducing consumption of tobacco
In two thirds of the sampled households at least one member smokes. In Bangladesh 43.3 per cent of the adults use tobacco prod-ucts, either smoking or smokeless (GATT 2010). By contrast, in typical high-income countries one-fifth of adults smoke.20
Our statistical analysis demonstrates a significant negative association between women’s nutrition and tobacco consump-tion in the household. As discussed earlier, consumption of tobacco may affect nutri-tion via several routes. The results point to a nutrition benefit – in addition to health benefits to those presently smoking – of pro-grams combating use of tobacco. There are three general tactics to pursue: increasing the price of tobacco by taxation, restrict-ing the advertising of tobacco and tobacco
20 In Canada 20.8 per cent of the population aged 12 and above smoke (Statistics Canada, 2010).
products, and restricting the shops allowed to sell tobacco products.
Tobacco is a cheap consumer products in Bangladesh. The price of a 20-stick packet of bidi is Tk.6. Even the price of a 20-stick pack of one of the most expensive brands of cigarette is less than Tk.100.21 The tax rate on tobacco in Bangladesh has remained stagnant for almost 10 years (Unnayan Shamannay 2010).
A significant increase in the price of tobacco is probably the most effective way to reduce tobacco consumption and to encourage current users to stop smok-ing (WHO 2003, WHO 2009, Unnanyan Shamannay 2010). According to a WHO (2009) report, a 10 per cent increase in the price of tobacco reduces consumption by 8 per cent in low- and middle-income countries. The price elasticity of demand for cigarettes in Bangladesh has been esti-mated at -0.4 in the short run and -0.3 in the long run (Shamunnay 2010, Barkat et al. 2008). Poorer households may be more responsive to price changes than are rich households in Southeast Asia (Guindon 2003). Shamunnay (2010) estimates the price elasticity of bidi as -0.64. Nonetheless, demand for cigarette and bidi is inelastic: a tax increase will reduce consumption but will also result in an increase in total household expenditure on smoking. There is evidence (from Canada) that young ado-lescents are particularly sensitive to price, that the elasticity of taking up the smoking habit displays an elasticity between -1.5 and -2.0 (Sen et al. 2010). This suggests that,
21 Monthly Statistical Bulletin, Bangladesh Bureau of Statistics, August 2010.

57Centre for Policy Research of IUBAT • Summer 2012
intergenerationally, tobacco demand may be price elastic. But this is a very long-run policy. We do not recommend tobacco tax increases as an immediate policy.22 While less effective than taxation, countries may legislate to ban tobacco advertisements and restrict sales. In Bangladesh there is no restriction on buying and selling of tobacco.
In Bangladesh the first major law on tobacco control (‘The Smoking and Using of Tobacco Products Control Act, No XI, 2005’) was passed in 2005 when Bangladesh became a party to the WHO Framework
22 In 1997, South Africa increased cigarette tax by 52 per cent, and reduced consumption by 30 per cent. However, very high taxation of tobacco was not effective in Thailand: 80 per cent tax rate on cigarettes resulted in tax avoidance and large cigarette sales in the black market. In Bangladesh, where law enforcement is quite weak, high tobacco taxes may result in a large black market.
Convention on Tobacco Control. There are some restrictions on direct advertising of cigarettes, but tobacco companies can still advertise and sponsor popular events. Ac-cording to the tobacco control law, health warning labels should cover 30 per cent of the tobacco package, but this too has not been adequately enforced (Campaign for tobacco free kids 2012). Though a majority of smokers know that smoking is harmful, very few are aware of specific health effects of smoking such as cancer, respiratory dis-eases, stroke and heart diseases (Efroymson and Ahmed 2003).
In summary, this policy option involves two elements:
• Restricting tobacco sold in specific areas such as near educational institutions.
• Legislating a ban on an all advertisement of tobacco and tobacco products.
table 5.1: rates of tobacco taxes in bangladesh, 2009
Price segment Price range (Tk. )Tax rate
supplementary duty Value Added Tax (VAT)
low* 14.60-17.60 32% 15%
medium* 32.80-34.80 52% 15%
high* 46.72-58.72 55% 15%
Premium* 93+ 57% 15%
Bidi (Akiz)** 6.00 20% 15%
Jorda, Gul*** 2.00-4.00 10% 15%
note: 1. * 20 cigarettes per pack; ** handmade cigarettes of 25 sticks per pack; *** smokeless tobacco
2. 1 UsD = Tk. 80.43
source: PATT Policy Brief- 1, Unnayan shamannay 2010.

58 Improving Nutritional Status for Women in Low-Income Households
Criteria for Analysis
To assess how well the aforementioned policy options can be expected to impact women’s nutrition, we used the following criteria. Most are measured informally.
Effectiveness
The effectiveness of each policy option will be measured in two ways: first, how effective will the policy probably be in reducing nu-tritional deficiencies among those targeted; second, how effective will the policy be in reducing the likelihood of women succumb-ing to disease. If a policy fulfills both objec-tives, it will score ‘high’; if it fulfills any one objective, it will score ‘moderate’; if it fulfills neither of the objectives, it will score ‘low’.
Cost
This criterion estimates annual total cost and cost per beneficiary or unit of service. It involves the cost of implementing the specific policy by the relevant agency (either govern-ment or NGO) without any external funding support. Actual costs involved will vary with extent of corruption and quality of admin-istration. However due to the difficulty of estimating these dimensions of cost, we have not allowed for them. Consequently, our cost estimates may be unduly low.
Administrative Feasibility
Here we assess whether the new policy requires hiring administrative staff, acquir-
ing new physical facilities, enacting new legislation, and is susceptible to ‘additional corruption’. The expected implementation time lag will also be considered:
• If the policy does not require additional staff, administrative changes and new infrastructure, does not increase the likelihood of ‘additional corruption’, does not require additional legislation and can start implementation fully within six months, it scores ‘high’.
• If the policy requires some additional staffs, some administrative changes and infrastructure but does not increase the likelihood of ‘additional corruption’, does not require new legislation and can start implementation fully within one year, it scores ‘medium’.
• If the policy requires a large additional staffs, significant administrative changes and infrastructure and/or increases the likelihood of ‘additional corruption’, requires new legislation and cannot start implementation fully within one year, it scores ‘low’.
Public Acceptance
This criterion captures how the involved parties, such as the women themselves, their families and society in general, politi-cal parties, donors and businesses view the policy option:
• If the option is acceptable by all stake-holders, it scores ‘high’.
• If the policy is acceptable by the general public but not by other stakeholders, it scores ‘medium’.

59Centre for Policy Research of IUBAT • Summer 2012
• If the policy is accepted by none of the above, it scores ‘low’.
Evaluation of Options
Nutritional Supplements Program
Since almost all women consume adequate servings from the cereals and potato group (primarily in the form of rice), fortified rice will probably be highly effective in combat-ing micronutrient deficiencies – provided it sells at a price equivalent to non-fortified rice of similar quality. The average rice consumption among rural women sampled is 14.5 servings, for urban 10 servings.23 The effectiveness of fortified food to reduce short-term deficiencies and prevent long term illness has been established in many countries. The high incidence of night blind-ness in Denmark during 1900 was reduced by fortifying margarine with vitamin A and D. Fortification of flour eliminated pellagra in United States and thiamin and riboflavin deficiencies in Newfoundland. Hotz et al. (2008) showed that the consumption of iron-fortified rice for six months resulted in 80 per cent reduction of iron-deficiency anaemia among female garment workers in Mexico.
Introduction of fortified rice will require adoption of new technologies by commer-cial rice producers. If the fortified rice is targeted to all households designated ultra poor, that implies a subsidy for 10 per cent
23 6 servings from cereals and potato group considered adequate.
of the total population.24 The need for a partnership of government, international organizations and private rice producers may create new administrative complexities and some additional corruption.
The cost of rice fortification using cold extrusion comprises the cost of machinery, fortification mix, labour and the cost of rice. Building a cold extrusion rice factory with fortifying capacity of 30 thousand to 60 thousand metric tonnes per year will require Tk.6 crore (Alavi et al. 2008). This will increase the final selling price of rice by an estimated 2 per cent. Considering the current price25 of coarse rice of Tk.30 per kg, fortification will increase the price of rice to Tk. 30.6 per kg. In Bangladesh, rice consumption per capita per day is 0.44 kg (Abdullah et al. 2006). The cost of subsidizing fortified rice for the ultra poor population is accordingly Tk.154 crore per
24 The NGO BRAC has identified the bottom 10 per cent population of Bangladesh through a program named ‘Challenging the Frontiers of Poverty Reduction, Targeting the Ultra Poor’. The criteria include ‘household’s ownership of land (less than 10 decimals – or less than one tenth an acre), no active male income earners, dependency on begging or female domestic work, no ownership in productive assets and no support from children engaged in wage earning’ (BRAC 2012). The government may receive support from international organizations like Global Alliance to Improve Nutrition. GAIN provided technological support in Brazil to fortify rice (www.gainhealth.org/press-releases/path-gain-partner-advance-rice-fortification-brazil-tackle-malnutrition-globally).
25 Trading corporation of Bangladesh 2012.

60 Improving Nutritional Status for Women in Low-Income Households
year, equivalent to approximately Tk.500 per ultra poor household.26
However many women above the ultra poor threshold but still classified as ex-treme poor and better-off households also face micronutrient deficiencies. For these women, fortified yogurt may be a prefer-able option for micronutrient supplements. Selling fortified rice at a subsidized price to an additional 40 per cent of the population (includes all household members) will multi-ply by four the overall cost of the program.
Fortified rice produced through cold ex-trusion is opaque and slightly off-colour, but the taste does not change (Alavi et al. 2008). In India and other developing countries such as Cambodia and Nicaragua, fortified rice is widely accepted and performed well in terms of taste. In Bangladesh the social ac-ceptance of fortified food will be high. An initial marketing campaign might be helpful.
Implementing a subsidized rice fortifi-cation program targeted to the ultra poor poses a serious threat of additional corrup-tion. There may be useful lessons from the Female Stipend Program, which provides an incentive to low-income families that keep their daughters in school. Initially, the subsidy was given in the form of rice; subsequently, the subsidy has been in cash. Potentially, the subsidy could be given to targeted families via coupons enabling a discount on purchases of fortified rice.
26 The reported Tk.154.2 crore = 16 million (10% of Bangladesh total population) x 2% x Tk.30 (cost of fortification) x 0.44kg/capita/day x 365 days/year. The per household estimate assumes an average of five persons per household.
Providing Hygienic Drinking Water
A 2003/04 study of 225,000 in a rural area in Bangladesh showed that households with greater tube well density reported significantly lower incidence of diarrhoea (Carrel et al. 2011). The effectiveness of ‘siraj’ mixture has been proved through a randomized control trial in rural Bangladesh (Islam et. al. 2011). Among the treatment group with ‘siraj’ mixture only 0.2 per cent were subject to diarrhoea, among the control group 5.12 per cent.
If one tube well is set for 10 households, then approximately 100,000 wells are re-quired for all urban slums. We estimate the initial capital cost at Tk.75 crore. Based on a levelized cost calculation, we estimate the annual total cost of tube wells in slums at Tk.13.9 crore, which is equivalent to an an-nual cost per slum household of Tk.140.27 The initial cost of setting up tube wells is
27 The estimated number of slum households in urban areas in Bangladesh is 1 million (Centre for Urban Studies, Bangladesh 2005). According to Water Aid (2012) each shallow tube well can be shared by 10 households. The cost of pipes and hand pump of one 30 feet shallow tubewell is estimated at Tk.6,000. Additional cost of drilling and digging is estimated at Tk.1,500. www.wateraid.org/uk/get_involved/community_groups/schools/buckets_of_water/5422.asp. Considering the average cost of one shallow tube well installed to be approximately Tk.7,500, the total cost will be Tk.75 crore (= 1,000,000 households / 10 households per well x Tk.7,500 per well). Assume the levelized annual capital cost at Tk.7.5 crore. Add Tk.6.4 crore as an estimate of annual operation and maintenance costs. This implies an annual cost per slum household of Tk.139 (= Tk.13.9 crore / 1,000,000 households).

61Centre for Policy Research of IUBAT • Summer 2012
high, but the levelized annual cost per slum household is low.
One packet of siraj mixture purifies 15 liters of water and costs only Tk.0.35. However, 29 million people are exposed to groundwater with arsenic levels above the Bangladesh standard (50 microgram/liter) and 49 million above the WHO recom-mended level (10 microgram/liter) (Ahmed and Rahman 2011). The cost of provid-ing ‘siraj mix’ to this group will be nearly Tk.100 crore per year. The annual cost per household is slightly over Tk.100.28 Again, the annual cost is high, and the cost per affected household low. The cost to gov-ernment depends obviously on the extent of subsidy and total demand, which will depend on the willingness of families to pay the residual cost.
Setting up approximately 100,000 tube wells requires large scale administrative coordination. Primarily the decisions will be taken by the Water Resources Planning Organization (WARPO) and will be imple-mented by relevant city and municipal cor-porations. In some cases, NGOs may take the initiative. No additional employees need be hired beyond the labour to set up tube wells and maintain them. Maintenance costs
28 In Bangladesh 46.4 million people (= 29 per cent x 160 million) live in arsenic-contaminated areas (People’s Daily Online, 2007). An adult person needs to drink 2.5 litres water per day. One siraj mix purifies 15 litres water. The total cost of siraj provision is Tk.98.4 crore (= Tk.0.35 x [(46.4million x 2.5liters/day x 365days/year)/15liters/mix). Assuming five people per household, the average annual cost/household is Tk.106 (= Tk.98.4 crore / [46.4 million / 5 members/ household.)
will be low if supervision is good; however, it may well not be. Similar administrative problems may complicate organization of a large-scale subsidized ‘siraj’ program. We rate the administrative feasibility as medium.
The public acceptance of tube wells will be high as people in Bangladesh are already aware of the benefit of tube well water over other sources. Public acceptance of siraj mix requires a publicity campaign. If people need to buy it, acceptance will be low. If government distributes the mixture free of cost, public acceptance will be high.
Healthy Food Initiative Through Social Enterprises
The cost of a van for selling healthy food and snacks will be approximately Tk.15,000. There will be additional costs for cooking, storing and serving food of about Tk.4,000 per month.29 A reasonable estimate of cost per meal is Tk.20, which implies 2,500 meals served per van per year. Probably, the cost of food and the salary of a van driver can be covered by the revenue of food sold. Initially a pilot project in Dhaka might involve 10 vans that move around slum areas, garment factories and schools, locales where the urban poor and their children generally buy food. Ultimately, success will depend on public acceptability of the food van offerings. The availability
29 These estimates summarize our initial investigation. Assume a levelized annual cost of the van as Tk.1,500. This implies a total annual levelized cost per van of Tk.49,500 (= 1,500 + 12 x 4,000).

62 Improving Nutritional Status for Women in Low-Income Households
of healthy foods does not ensure that people will purchase it.
Family gardens may be the major source of micronutrients for low-income rural women who do not work outside the home, and have access to unused land. During 1986, CARE Bangladesh, a NGO, launched a pilot project, ‘Local Initiatives for Farm-ers’, in the district of Gaibandha and Tangail to promote homestead horticulture among landless and marginal farmers who own a little land beside their home. The benefits according to the participants were increased earnings and more adequate consumption of vegetables and fruits (Midmore et al. 1991). After CARE’s withdrawal of support, this project did not unfortunately survive. The cost of household gardens will be low as gardens are located in homestead and underutilized lands in villages and subur-ban areas. The initial cost of a household garden will be seeds, plants and fertilizers. Households with domestic animals can use dung as fertilizer.
There are moderate administrative costs to start up a healthy snack van or house-hold garden project. Some new employees are needed to manage all these initiatives. Public acceptance is uncertain in advance. However considering the success of the Ja-karta food vans, public acceptance can be considered as medium in urban areas. The public acceptance of household gardening by low-income women might be high as it increases their earning and vegetable con-sumption potential.
Both are projects suitable for NGOs not government. The effectiveness of commu-nity gardens as means to improve women’s
nutritional status is probably higher than street van food projects. We accord a ‘high’ effectiveness score to community gardens; a ‘low’ score to street van food.
Achieving Behaviour Change Through Nutritional Advice
In our study, those receiving nutritional advice from doctors and nurses in health facilities appeared to benefit. However it is beyond the scope of this study to assess the potential of increasing the supply of profes-sional health care providers.
In many developing countries health education through community health work-ers has proved effective (WHO 2007). By contrast, our analysis showed no statistical impact from advice given in home visits by community workers. Currently many com-munity health workers in Bangladesh work on a voluntary basis for NGOs, notably for BRAC. In the case of BRAC, the incen-tive to become a voluntary health worker is easy access to microcredit and other services BRAC offers, and to earn income from selling certain pharmaceutical drugs (Prashad et al. 2007, Ahmed 2008). Cur-rently BRAC has 80,000 unpaid volunteer health workers and 8,000 paid community health workers (BRAC 2012). To be effec-tive, the community health workers need basic dietary training, which would impose costs on BRAC. Furthermore, to provide an incentive for health workers to provide nutritional advice independent of selling drugs, payment of a modest salary to all health workers is probably necessary. The cost of such upgrading of the BRAC health

63Centre for Policy Research of IUBAT • Summer 2012
worker program is high relative to the finan-cial resources available to BRAC.
Providing nutritional advice via me-dia, notably television, appears to have a beneficial impact. Such programming on a widespread basis involves high cost.30 Cur-rently, there is no discount on advertising rates charged for public awareness television advertisements broadcast by channels in Bangladesh (Ahmed 2011). However, given the high profitability of private television companies, the government could prob-ably oblige private television companies to broadcast health education spots at no or low public cost.
Evaluation of Tobacco Control
Public anti-tobacco campaigns featuring bans on tobacco advertising and restrictions on tobacco sales do reduce consumption intergenerationally. But their short-term impact is likely modest. Countries that have achieved large reductions in the prevalence of smoking have maintained ongoing cam-paigns for several decades (Willemsen and
30 The cost of TV commercials per minute is Bangladesh varies between Tk.40,000 – Tk.60,000. This increases by factors of five during major national and cultural festivals (The Daily Star 2010).
Blij 2012). In South Africa, for example, strong legislation banning all advertisement and restricting sale of cigarettes among non-adults reduced cigarette consumption by 4 to 7 per cent among different groups of people from 1993 to 1999. Given the strong link in our survey between extent of smoking among family members and lower nutrition among women, we are reluctant to dismiss anti-tobacco campaigns as ‘low’ in effectiveness; we award them a ‘medium’ effectiveness score.
The public support of an aggressive anti-tobacco campaign will be medium. A large per cent of adults smoke, but there is wide civil society support for some restrictions on the industry. There is no direct cost to government upon banning advertisements. New inspectors may be necessary to impose restriction on tobacco selling, which adds some modest cost for government. The key obstacle is opposition from the tobacco in-dustry and media outlets receiving revenue from tobacco advertising. Given the likely extent of such opposition, the administra-tive feasibility of imposing tobacco control policies is currently low.

64 Improving Nutritional Status for Women in Low-Income Households
table 5.2. Summary policy evaluations
Policy options effectiveness Cost (Taka)Administrative
feasibilityPublic acceptance
1. nutritional supplements (fortified rice)
high (among government
options)
Annual cost: Tk.154 crore
Annual cost per household: Tk.960 (bottom 10 per
cent of population)
medium high
2. hygienic water for urban slums (setting shallow tube wells or providing ‘siraj mixture’)
high (among government
options)
Annual levelized cost of tube wells: Tk.13.9 crore
Annual cost per household of tube wells: Tk.140 (for
urban slums where arsenic concentration low)
medium high
3. healthy food initiative through social enterprises
Jakarta model food van (urban)
low (among nGo options)
Annual cost per van: Tk.49,500 (10 van
pilot project)
Cost per meal: Tk.20
medium medium
household gardens (rural)
high (among nGo options)
low cost to sponsoring nGo
medium high
4. nutritional advice
Improve training of community health workers
high (among nGo options)
high cost relative to typical nGo budget, unless nGo obtains
explicit donor support
medium high
Television advertisement
medium (among government
options)
low cost for government, provided media outlets
agree to broadcast messages as public
service; high, otherwise
low high
5. Tobacco control
restrictive sellingmedium (among
government options)
low cost for government low medium
Advertisement banmedium (among
government options)
low cost for government low medium

65Centre for Policy Research of IUBAT • Summer 2012
6. Conclusion
OUR RECOMMENDATION TO GOVERNMENT AND TO NGOS IS TO PURSUE AS
first priority those options rated ‘high’ in terms of effectiveness. While our ratings are
admittedly informal, the four options rated ‘high’ in effectiveness unambiguously address
key nutritional problems, are low cost in terms of cost/household targeted or unit of service
provided, could be initiated reasonably quickly, and do not face insurmountable administra-
tive difficulties or public opposition.
The government is the main institution to implement new programs. However, over the last two decades, NGOs have made significant contributions to improve social conditions for the marginalized population. Micro-credit, non-formal education, basic health care services, social enterprises and women’s empowerment programs are exam-ples of NGO activities. Funding of NGOs comes through overseas donors and, to a limited extent, through cross-subsidization from profitable business ventures (such as micro-credit) undertaken by the NGOs themselves (Davis 2006). Given the limited administrative capacity and limited public mandate of the NGOs, large-scale public
programs are primarily in the government’s domain.
We have divided policy options between those better implemented by the government and those better implemented by NGOs. However, the distinction is not absolute. It may be feasible for government to con-tract with slum community leaders for the maintenance of shallow tube wells in slums. Government might also choose to mount a program providing nutritional training to community health workers. Also, our ef-fectiveness evaluations may be wrong. The Jakarta model for selling nutritious food in urban areas might, for example, prove more effective than we concluded.
66 Improving Nutritional Status for Women in Low-Income Households
References
Abdullah A.B., Ito S., Adhana K. (2006). Estimate of Rice Consumption in Asian Countries and the World towards 2050. Proceedings for Workshop and Conference on Rice in the World at Stake, 2. School Lunch Programs and Rice Consumption Behaviours: International Comparison.
Ahmed A. U. (1993). Patterns of Food Consumption and Nutrition in Rural Bangladesh. International Food Policy Research Institute. Bangladesh Food Policy Project, Dhaka, Bangladesh.
Ahmed S.M. (2008). Taking Health Care where the Community is: The Story of the Shasthya Sebikas of BRAC in Bangladesh. BRAC University Journal. Vol. V. No. 1, 2008, (pp. 39-45).
Ahmed S., Sugimo, J., Shamim, A. A. (2009). Does Proximity to Market Influence Dietary Diversity of Pregnant Women in Rural Bangladesh? JiVitA - Maternal and Child Health Research Project, Bangladesh.
Ahmed S. (2011). Historical perspective of evaluation of advertising firms in Bangladesh. European Journal of Business and Management. Vol. 3. No. 5.
Alam A., M. Rahman. (2011). Assessment of Dugwell as an Alternative Water Supply Option in Arsenic-Affected Areas of Bangladesh. International Journal of
Civil & Environmental Engineering. Vol. 11. No. 1.
Alam K., Tasneem S., Oliveras E. (2011). Performance of female volunteer community health workers in Dhaka urban slums: A case-control study. A Manoshi working paper. No. 12. International Centre for Diarrhoeal Disease Research, Dhaka, Bangladesh; Research and Evaluation Division, BRAC.
Alam N., Roy S. K., Ahmed T., Ahmed A. M. S. (2010). Nutritional Status, Dietary Intake and Relevant Knowledge of Adolescent Girls in Rural Bangladesh. Journal of Health, Population and Nutrition. 2010 February; 28 (1). (pp 86 - 94). International Centre For Diarrhoeal Disease Research, Bangladesh.
Alavi S., Bugusu B., Cramer G., Dary O., Lee T-C., Martin L., McEntire J., Wailes E. (2008). Rice Fortification in Developing Countries: A Critical Review of the Technical and Economic Feasibility. Academy for Educational Development. U.S. Agency for International Development (USAID).Washington, DC, USA.
Allen L., Benoist B. D., Dary O. (2006). Guidelines on Food Fortification with Micronutrients. The World Health Organization; Food and Agricultural Organization; The United Nations.

67Centre for Policy Research of IUBAT • Summer 2012
As-Arsenic. (2012). Groundwater Arsenic Contamination in Bangladesh. Accessed on July 14. From http://arsenic-33.narod.ru/groundwater-arsenic-contamination-in-bangladesh.html
Asia Development Bank (ADB). (2002). Beyond boundaries: Extending services to the urban poor. The Asian Development Bank. Manila, Philippines.
Auluck A., Hislop G., Poh C., zhang L., Rosin MP. (2009). Areca nut and betel quid chewing among South Asian immigrants to Western countries and its implications for oral cancer screening. Rural Remote Health. Vol. 9. No. 2.
Banarjee A., Duflo E. (2011). More than 1 billon people are hungry in the world: But what if the experts are wrong. Foreign Policy. May/ June 2011.
Bangladesh Bureau of Statistics. (2000, 2003, 2010, 2011). Monthly Statistical Bulletin. BBS publication. Bangladesh.
Bangladesh Bureau of Statistics. (2012). Area Population, Household and Household Characteristics. Accessed on January 2012. From, www.bbs.gov.bd/WebTestApplication/userfiles/Image/Sy2010/Chapter-02.pdf
Banglapedia. (2012). Accessed on November 2011. From, www.banglapedia.org/httpdocs/english/index.htm
Barkat A., Chowdhury A.U., Nargis N., Rahman M., Khan M.S., Pk A. K., Bashar S. (2008). The Economics of tobacco and tobacco taxation in Bangladesh. Human Development Research Centre. Dhaka, Bangladesh.
Behrman, J.R., Deolalikar, A. B. (1990). The Intrahousehold Demand for Nutrients in Rural South India: Individual Estimates, Fixed Effects, and Permanent Income. The Journal of Human Resources, Vol. 25, No. 4 (Autumn, 1990), pp. 665-696
Benson, T. (2007). Study of Household Food Security in Urban Slum Areas of Bangladesh, 2006. International Food Policy Research Institute. Washington, D.C. USA.
Bhat D., Troy L., Karim R., Levinson F.J. (2002). Determining Food Consumption during Pregnancy in Rural Bangladesh. The Bangladesh Development Studies. Vol. XXVIII. December 2002. No.4. Dhaka, Bangladesh.
Biswas W. K. (2010). Application of renewable energy to provide safe water from deep tubewells in rural Bangladesh. Energy for Sustainable Development. Volume 15. Issue 1. (pp. 55-60).
Bloem M. W., Moench-Pfanner R., Graciano F., Stallkamp G., Pee S. D. (2004). Trends in health and nutrition indicators in the urban slums of three cities in Bangladesh, compared to its rural areas. Globalization of food systems in developing countries: Impact on food security and nutrition. FAO food and nutrition paper 83. Rome, Italy.
Bose, M.L., Dey, M. M. (2007). Food and Nutritional Security in Bangladesh: Going beyond Carbohydrate Counts. Agricultural Economics Research Review Vol. 20 July-December 2007 (pp. 203-225)
BRAC. (2012a). Economic Development: Targeting extreme poverty. Accessed on February 04, 2012. From www.brac.net/

68 Improving Nutritional Status for Women in Low-Income Households
content/economic-development-targeting-extreme-poverty.
BRAC. (2012b). Social Communication and Advocacy: Health. Accessed on March 15, 2012. From www.brac.net/content/social-communication-advocacy-health
Cairncross S., Hunt C., Boisson S., Bosteon K., Curtis V., Fung I. C., Schmidt W-P. (2010). Water, sanitation and hygiene for the prevention of diarrhoea. International Journal of Epidemiology. Vol. 39, Issue supppl 1. (pp i193-i205).
Campaign for tobacco free kids (2010). Bangladesh: Tobacco Burden Facts. Accessed on October 20, 2011. From http://global.tobaccofreekids.org/files/pdfs/en/Bangladesh_tob_burden_en.pdf
Campaign for tobacco free kids (2012). Global toll of tobacco: Bangladesh. Accessed on March 04, 2012. From www.tobaccofreekids.org/facts_issues/toll_global/bangladesh
Carrel M., Escamilla V., Messina J., Giebultowicz S., Winsom J., yunus M., Streatfield p. K., Emch M. (2011). Diarrrheal disease risk in rural Bangladesh decreases as tubewell density increases: a zero inflated and geographically weighted analysis. International Journal of Health Geographics 2011, 10:41.
Chen, L. C., D’Souza, S. (1981). Sex Bias in the Family Allocation of Food and Health Care in Rural Bangladesh. Population and Development Review, Vol. 7, No. 1. (pp. 55-70).
Corsi D. J., Kyu H. H., Subramanian, S. V. (2011). Socioeconomic and Geographic Patterning of Under- and Overnutrition among Women in Bangladesh. The
Journal of Nutrition. 141: 631–638, 2011.
David J.K. (2006). NGOs and Development in Bangladesh: Whose sustainability counts?, in Global Poverty: Sustainable Solutions. Proceedings of the Anti-Poverty Academic Conference with International Participation, Institute for Sustainability and Technology Policy, Murdoch University, Perth, Netherlands.
Dary O., Rassas B. (2004). Elements of a national food fortification program in Bangladesh. USAID Micronutrient Program. U.S. Agency for International Development (USAID).Virginia, USA.
Efroymson D., Ahmed S. (2003). Building Momentum for Tobacco Control: The Case of Bangladesh. In Beyer J.d. and Brigden L.W. (Ed.). Tobacco Control Policy: Strategies, Success and Setbacks. (pp. 13-37).Washington, DC. The International Bank for Reconstruction and Development and the World Bank.
Efroymson D., Alam S.M. (2009). Enforcement of Tobacco Control Law: A Guide to Basics. Health Bridge.
Efroymson, D., Ahmed, S., Townsend, J., Alam, S.M., Dey, A. R., Saha, R., Sujon., A. I., Ahmed, K. U., Rahman, O. (2001). Hungry on Tobacco: An Analysis of Economic Impact of Tobacco Consumption on the Poor in Bangladesh. Tobacco Control 2001;10:212–217.
ESCAP, ADB, WHO, UNDP, UNFPA, UNICEF. (2012). Accelerating Equitable Achievement of the MDGs: Closing Gaps in Health and Nutrition Outcomes. Asia-Pacific Regional MDG Report 2011/ 12. United Nations Economic and Social Commission for Asia and Pacific, The

69Centre for Policy Research of IUBAT • Summer 2012
Asian Development Bank, The World Health Organization, The United Nations Development Programme, The United Nations Population Fund, United Nations Children’s Emergency Fund.
FAO. (2011). Gender and Nutrition: Key facts. Accessed on November 15, 2011. From www.fao.org/docrep/012/al184e/al184e00.pdf
Fogel R. W. (1992). Second Thoughts on the European Escape from Hunger: Famines, chronic Malnutrition, and Mortality Rates. In S. R. Osmani (Ed.). Nutrition and Poverty. World Institute for Development Economics Research Studies in Development Economics. Oxford University Press, Clarendon Press. Oxford, New york, Toronto and Melbourne.
GLOBOCAN 2008. Cancer incidences and mortality worldwide: Bangladesh. Accessed on November 11, 2011. From, http://globocan.iarc.fr/factsheet.asp
Grameen Danone (2012). Accessed on February 28, 2012. Form, www.muhammadyunus.org/Social-Business/grameen-danone/. yunus Centre.
Griffiths P. L., Bently M. E. (2001). The Nutrition Transition is underway in India. Journal of Nutrition. Vol. 131. No. 10.
Guindon G. E., Perucis A-M., Boisclair D. (2003). Higher Tobacco Prices and Taxes in South-East Asia. HNP Discussion Paper. Economics of Tobacco Control Paper No. 11. Tobacco Free Initiative. Tobacco Free Initiative, The World Health Organization.
Halder S., Urey I., Barua P. (2003). Patterns and Trends in Food Consumption in
Poor Urban and Rural Households in Bangladesh: The Field Survey Results. Research and Evaluation Division (RED), BRAC, Bangladesh.
Haque I. (2009). Urban Slum Mapping in Bangladesh. Centre for Environmental and Geographic Information Services, Dhaka, Bangladesh. Presentation in the Expert Group Meeting on Slum Mapping. Organized by Socioeconomic Data and Application Centre, USA on June 11, 2009.
Haseen F. (2005); Malnutrition among Bangladeshi women in ultra poor households: prevalence and determinants. Research and Evaluation Division, BRAC, Dhaka, Bangladesh.
Hossain, S. (2006). Rapid Mass Urbanisation and Its Social Consequences in Bangladesh: The Case of the Megacity of Dhaka. Paper presented to the 16th Biennial Conference of the Asian Studies Association of Australia in Wollongong 26 June – 29 June 2006.
Hotz C., Porcayo M., Onofre G., Garcia-Guerra A., Elliott T., Jankowski S., Greiner T. (2008). Efficacy of iron-fortification ultra rice in improving iron status of women in Mexico. Food and Nutrition Bulletin. Vol. 29, No. 2 (pp 140-149).
Hove, J. (2007). Barriers to Girls’ Secondary School Participation in Rural Bangladesh. CPR Commentary No. 5. Centre for Policy Research, IUBAT – International University of Business Agriculture and Technology, Dhaka, Bangladesh.
Hurt, L.S., Ronsmans, C., Saha, S. (2004). Effects of education and other socioeconomic factors on middle age
70 Improving Nutritional Status for Women in Low-Income Households
mortality in rural Bangladesh. Journal of Epidemiology, Community Health 2004;58:315–320.
Hyder, S.M.z., Persson, L., Chowdhury, M., Lo¨nnerdal, B., Ekström, E. C. (2004). Anaemia and iron deficiency during pregnancy in rural Bangladesh. Public Health Nutrition: 7(8), 1065–1070.
ICDDR, B. (2012). Activity 6: Safe Water. Accessed on March 01, 2012. From, www.icddrb.org/what-we-do/health-programmes/improved-health-for-the-poor/activity-6-safe-water
Jha, R., Gaiha, R., and Anurag S. (2009). Calorie and Micronutrient Deprivation and Poverty Nutrition Traps in Rural India. World Development. Vol 37. Issue 5. May 2009. (pp 982-991).
Kinh H.V., Ross H., Levy D., Minah N. T., Ngoc V. T. B. (2006). The effect of imposing a higher, uniform tobacco tax in Vietnam. Health Research Policy and Systems 2006, 4:6. BioMed Central. June 2006.
Klemm R. DW, Harvey P. WJ, Wainright E., Faillace S., Wasantwisut E. (2008). Scaling up micronutrient programs: What works and what needs more works?. Micronutrient Forum.
Kraemer K., zimmermann M.B. (2007). Nutritional Anemia. Sight and Life, Basel, Switzerland.
Kunz R. (2009). Technical Profile: A Breakthrough in Rice Fortification. World Grain. August 2009.
Latham M. C. (1997). Human Nutrition in Developing World. FAO Food and Nutrition Series. No 29. Rome.
Leslie J. (1991). Women’s nutrition: the key to improving family health in developing countries?. Health Policy and Planning; 6(1): 1-19
Mananr V., Gallego E.R. (2002). Iron Fortification: Country Level Experiences and Lessons Learned. The Journal of Nutrition. Vol. 132, No. 4. American Society for Nutritional Sciences
Matin I., Hadi A., Ahmed S.M. (2004). Towards a profile of the ultra poor in Bangladesh: Findings from CFPR/TUP baseline survey. Research and Evaluation Division, BRAC, Bangladesh; Aga Khan Foundation, Canada.
McKeown T. (1976). The Modern Rise of Population. Arnold. London.
Micronutrient Initiative (2010). Annual Report 2008-2009. www.micronutrient.org/cmfiles/MI-AnnualReport0809-EN-web.pdf
Midmore D.J., Ninez V., Venkatratnam R. (1991). Household gardening projects in Asia: Past experience and future directions. Technical Bulletin No. 19. Asian Vegetable Research and Development Center. Taipei 10099, Taiwan.
Ministry of Food and Disaster Management, Dhaka, Bangladesh (2008). National Food Policy Plan of Action (2008-2015). Food Planning and Monitoring Unit (FPMU). Ministry of Food and Disaster Management. Dhaka. Bangladesh.
71Centre for Policy Research of IUBAT • Summer 2012
Ministry of Food and Disaster Management, Dhaka, Bangladesh (2008). The National Food Policy Plan of Action: A Framework for Investing in Food Security. Food Planning and Monitoring Unit (FPMU). Ministry of Food and Disaster Management. Dhaka. Bangladesh.
Muhuri, P. K., Preston, S. H. (1991). Effects of Family Composition on Mortality Differentials by Sex Among Children in Matlab, Bangladesh. Population and Development Review, Vol. 17, No. 3 (September, 1991), (pp. 415-434). Dhaka, Bangladesh.
Narayan, A., yoshida, N., zaman, H. (2007). Trends and Patterns of Poverty in Bangladesh in Recent years. The World Bank, South Asian Region.
National Institute of Population Research and Training, Dhaka, Mitra and Associates, Dhaka; ORC Macro, Calverton, Maryland, USA. (2005). Bangladesh Demographic and Health Survey 2004. Bangladesh.
Ortolan, S. E., Mahmud z., Kabir A.F.M., I., Levinson J. (2003). Effect of Targeted Food Supplementation andServices in the Bangladesh Integrated Nutrition Project on Women and their Pregnancy Outcomes. Journal of Health, Population and Nutrition. 21(2). (pp. 83-89)
Osmani, S. (1997); The Abraham Horwitz Lecture: Poverty and Nutrition in South Asia, Chapter 3 in the ‘Nutrition Policy Discussion Paper No. 16’, ACC/SCN, World Health Organization.
Pathak P., Kapil U., Kapoor S. K., Saxena R., Kumar A., Gupta N., Dwivedi S. N. Singh R., Singh P. (2004). Prevalence of Multiple Micronutrient Deficiencies
amongst Pregnant Women in a Rural Area of Haryana. Indian Journal of Pediatrics. Vol. 71. November 2004.
Planete D’Entrepreneurs (2012). Grameen Danone Foods Ltd: How to deal with children nutrition in Bangladesh. Accessed on March 07, 2012. From www.danonecommunities.com/sites/default/files/grameen_danone_foods_ltd_version_site.pdf
Podymow T., Turnbull J., Islam M. A., Ahmed M. (2009). Health and Social Conditions in the Dhaka Slums. Paper presented in the ‘9th International Conference on Urban Health’. The International Society for Urban Health. New york, USA.
Prashad B., Muraleedharan V. (2007). Community Health Workers: A review of concepts, practice and policy concerns. Working paper. London School of Hygiene and Tropical Medicine. UK.
Quddus M., Rahman S., Quazi R. (2006). The impact of NGOs in alleviating poverty in Bangladesh. Accessed on April 21, 2012. From http://cob.pvamu.edu/business/WorkingPapers/NGO-Bangladesh-JBS.pdf
Rahman, A. and Razzaque, A. (2000). On Reaching the Hardcore Poor: Some Evidence on Social Exclusion in NGO Programmes. The Bangladesh Development Studies 26.1. (pp: 1–35). Bangladesh Institute of Development Studies. Bangladesh.
Ramachandran, P. (2007). Poverty Nutrition Linkages. Indian Journal of Medical Research. 126, October 2007, (pp. 249-261).

72 Improving Nutritional Status for Women in Low-Income Households
Rao, K. M., Balakrishna, N., Arlappa, N., Brahmam, G.N. V. (2010). Diet and Nutritional Status of Women in India. Journal of Human Ecology. 29(3): 165-170 (2010).
Raut, N. R. (2009). Food Consumption Pattern and Nutritional Status of Women in Orissa: A Rural-Urban Differential. Journal of Human Ecology. 25(3): 179-185 (2009).
Ravindran S. (1986.) Health implications of sex discrimination in childhood: a review paper and an annotated bibliography. World Health Organization. Geneva, Switzerland.
Razzaque A., Nahar L., Sarder A. M., Ginneken J. K., Shaikh M. A. K. (1998). Chapter 5: Women’s Status. From the report, Demographic Surveillance System-Matlab: Vol. Smoking? Evidence from Canadian Provinces. Forum for Health Economics & Policy. Vol. 13. No. 2.
Richards, J., A. Shahrin, K. Lund. (2010). Benchmarking the Nutritional Status of Women in the Tongi-Ashulia Road Slums. CPR Commentary 7.
Richards, J. (2012). “What CIDA Should Do: The Case for Focusing on Better Schools.” Commentary 349. Toronto: C.D. Howe Institute.
Seshadri S. (2001). Prevalence of micronutrient deficiency particularly of iron, zincnd folic acid in pregnant women in South East Asia. British Journal of Nutrition (2001), 85. Suppl. 2, S87±S92.
SEWA, India. (2009). Impact of Price Rise on Poor Households: Survey by SEWA. Accessed on June 20, 2011. From www.sewa.org/pdf/IMPACT%20OF%20
PRICE%20RISE%20ON%20POOR%20HOUSE%20HOLDS%20-%20Surved%20by%20SEWA.pdf
Shetty P. (2002). Measures of nutritional status from anthropometric survey data: Keynote paper. Food and Agricultural Organization. Rome. Italy.
Sprinkles Global Health Initiative (2012). Frequently asked questions. Accessed on March 07, 2012. From www.sghi.org/about_sprinkles/faqs.html.
StatPac. (2012). Survey sampling methods. Accessed on February 10, 2012. From www.statpac.com/surveys/sampling.html
Sulaiman M., Parveen M., Das N.C. (2009). Impact of the Food Price Hike on Nutritional Status of Women and Children. Research Monograph Series No. 38, Research and Evaluation Division (RED), BRAC, Bangladesh.
The Financial Express. (February 14, 2012). Food Fortification. www.thefinancialexpress-bd.com/more.php?news_id=98443&date=2012-02-14. Accessed on March 02, 2012.
The New york Times (2011). In ‘Food Deserts’, Oases of Nutrition. http://opinionator.blogs.nytimes.com/2011/05/23/in-food-deserts-oases-of-nutrition/
Tobacco Free Centre, Bangladesh. (2010). Bangladesh Tobacco Burden Facts. Tobacco Free Centre.
Transparency International, Bangladesh. (2011). What is the corruption perception index. Aceessed on November 04, 2011. From http://cpi.transparency.org/cpi2011/in_detail/#myAnchor1

73Centre for Policy Research of IUBAT • Summer 2012
UNDP (2011). Human Development Report 2011. The United Nations Development Programme. New york. United States.
UNICEF (2004). What works for children in South Asia: Community health workers. The United Nations Children’s Fund (UNICEF). Kathmandu, Nepal.
UNICEF (2009). The State of the World’s Children 2009. United Nations Children’s Fund. New york. United States.
UNICEF (2010). Women and Girls in Bangladesh: Key Statistics. Accessed on 22 September 2011. From www.unicef.org/bangladesh/Women_and_girls_in_Bangladesh.pdf
UNICEF (2011). Child and Maternal Nutrition in Bangladesh: Key Statistics . Accessed on 04 November 2011. www.unicef.org/bangladesh/Child_and_Maternal_Nutrition(1).pdf
UNICEF (2012). Urban Water Challenges in Bangladesh. Accessed on February 27, 2012. From www.unicef.org/bangladesh/Urban_water_challenges_in_Bangladesh.pdf
United Nations (2008). The World Population Prospects: Table A.1. Accessed on October 04, 2011. From www.un.org/esa/population/publications/wpp2008/wpp2008_text_tables.pdf
United Nations (2011). World Urbanization Prospects: The 2005 Revision. Accessed on November 04, 2011. From www.un.org/esa/population/publications/WUP2005/2005WUP_FS7.pdf
United Nations Refugee Agency (2007). Micronutrient Powder (MixMeTM) Use in Kauma Refugee Camp in Kenya
(AFRICA). Nutrition Review Program. Accessed on March 04, 2012, from www.nutritionimprovement.com/pdf/kenya_briefing.pdf
Unnayan Shamannay (2010). Raising Tobacco Taxes: Taking Care of Public Health. PATT Policy Brief-1. An Unnayan Shamannay Publication.
Unnayan Shamannay (2010).Consumption and Revenue Implications of Tobacco Taxation in Bangladesh. PATT Policy Brief-2. An Unnayan Shamannay Publication.
Walbeek C. V. (2003). Tobacco Excise Taxation in South Africa. The World Health Organization.
Water Aid Bangladesh, ARBAN Bangladesh, ASD Bangladesh, DSK Bangladesh, NGO Forum, PHULKI, PSTC, PRODIPON, UST, VERC, Green Hill (2003). A national strategy for Economic Growth, Poverty Reduction and Social Development: Poverty Reduction Strategy Paper. Presented to the GED, Planning Commission. March 05, 2003.
WaterAid, Bangladesh (2012). How Money Helps. Accessed on January 30, 2012. From www.wateraid.org/uk/get_involved/community_groups/schools/buckets_of_water/5422.asp
WFP. (2004). Micronutrient deficiencies: Prevalence in Anaemia in Women. Accessed on February 11, 2011. From, www.foodsecurityatlas.org/bgd/country/utilization/micronutrient-deficiencies
WFP. (2009). Micronutrient powder use and outcomes in refugee camps in Nepal. Issue 1. No. 1. The United Nations World Food Programme. Rome. Italy.

74 Improving Nutritional Status for Women in Low-Income Households
WHO. (2001). Healthy food and Nutrition for women and their families: Training course for health professionals. WHO Regional office for Europe. Copenhagen.
WHO. (2005). Impact of Tobacco- related Illness in Bangladesh. SE/BAN TOB/NCD/001 DOC/1. World Health Organization.
WHO. (2006). Global database on Body Mass Index: an interactive surveillance tool for monitoring nutritional transition. Accessed on April 06, 2012. From, http://apps.who.int/bmi/index.jsp?introPage=intro.html
WHO. (2007). International action needed to increase health workforce. Accessed on January 15, 2012. From, www.who.int/mediacentre/news/releases/2007/pr05/en/
WHO. (2009). Communication strategy for tobacco control in South-East Asia. The World Health Organization. Regional Office in South-East Asia.
WHO. (2011). WHO Report on Global Tobacco Epidemic. Accessed on March 30, 2012. From, www.who.int/tobacco/surveillance/policy/country_profile/bgd.pdf
Willemsen M. C., Blij B. D. (2012). Tobacco Advertising. GlobaLink: Global Tobacco Control. Accessed on March 12, 2012. From www.globalink.org/en/advertising.shtml
World Bank (2005). The Bangladesh Integrated Nutrition Project Effectiveness and Lessons. Bangladesh Development Series - Paper no. 8. The World Bank Office, Dhaka.
World Bank (2007). Dhaka: Improving living condition of urban poor. Bangladesh Development Series. Paper no. 17. The World Bank Office, Dhaka, Bangladesh.
World Bank (2010). Extreme poverty rate continues to fall. Accessed on February 12, 2012. From http://data.worldbank.org/news/extreme-poverty-rates-continue-to-fall.
World Bank (2011). Rice fortification: A key part of the solution to micronutrient deficiencies. The Agriculture and Rural Development and the Health, Nutrition and Population Team. The World Bank. Washington DC.
World Bank (2011). The World Development Indicators (WDI). Washington DC.
World Bank (no date). Bangladesh: Overview of Childhood Undernutrition. Accessed on March26, 2012, http://siteresources.worldbank.org/SOUTHASIAEXT/Resources/ 223546-1171488994713/3455847-1232124140958/5748939-1234285802791/BangladeshNutrition.pdf
yunus Centre (2012). Social business: Grameen Danone. Accessed on April 19, 2012. From www.muhammadyunus.org/Social-Business/

75Centre for Policy Research of IUBAT • Summer 2012
Appendix A
Survey Questionnaire
Diet Recall:
We would like to ask you about the food you personally ate in the last 24 hours.
1. looking at the largest of the cups provided, how much of each type of food did you personally eat yesterday? (cooked volumes). If you did not eat any category keep blank under number column.
[be sure to emphasize the idea of a full day’s set of meals – early morning to evening.]
Breakfast lunch supper others
rice [large cups]
lentil (Daal) [large cups]
Beef/mutton/ lamb [small cups]
Chicken/ other birds [small cups]
egg [number]
fish [small cups]
a)
b)
a)
b)
a)
b)
a)
b)
a)
b)
leafy vegetables/shak [small cups]
a)
b)
c)
a)
b)
c)
a)
b)
c)
a)
b)
c)
a)
b)
c)
other vegetables [small cups]
a)
b)
a)
b)
a)
b)
a)
b)
a)
b)
Potato [small cups]

76 Improving Nutritional Status for Women in Low-Income Households
Breakfast lunch supper others
milk [small cups]
a) Powder milk (mixed with water)
b) liquid milk
a)
b)
a)
b)
a)
b)
a)
b)
Butter [small cups]
yoghurt/ Cheese [small cups]
a) sweet yoghurt
b) sour yoghurt
c) Cheese
a)
b)
c)
a)
b)
c)
a)
b)
c)
a)
b)
c)
Tea/Coffee [actual cups consumed]
a) Tea with milk and sugar/ condensed milk
b) Tea with sugar and without milk
c) Tea with milk and without sugar
d) Tea without milk and sugar (e.g. lime tea/ ginger tea)
a)
b)
c)
a)
b)
c)
a)
b)
c)
a)
b)
c)
Bread/ roti [pieces]
fruits [pieces]
a)
b)
c)
a)
b)
c)
a)
b)
c)
a)
b)
c)
a)
b)
c)
snacks (halka/faltu foods, like chips/ shingara) [pieces]
a)
b)
c)
a)
b)
c)
a)
b)
c)
a)
b)
c)
a)
b)
c)
others [list and record units]
a)
b)
a)
b)
a)
b)
a)
b)
a)
b)
2. how do you identify your own or your household’s cooking in terms of oil?
o more oily
o less oily

77Centre for Policy Research of IUBAT • Summer 2012
3. Compared to last year at this time, how have you changed your regular food diet? (Put √on appropriate box)
I eat more of this food
than last year
I eat the same amount of
this food as last year
I eat less of this food than
last year
I have started eating this
food recently
I no longer eat this food
rice
lentil (Daal)
Beef/mutton/ lamb
Chicken/ other birds
egg
fish
a)
b)
leafy vegetables/shak
a)
b)
c)
other vegetables
a)
b)
Potato
milk
a) Powder milk (mixed with water)
b) liquid milk
oil
Butter [woodblock]
yoghurt/ Cheese
a) sweet yoghurt
b) sour yoghurt
c) Cheese
Tea/Coffee [Actual cups consumed]
a) Tea with milk
b) Tea with condensed milk
c) Tea without milk

78 Improving Nutritional Status for Women in Low-Income Households
I eat more of this food
than last year
I eat the same amount of
this food as last year
I eat less of this food than
last year
I have started eating this
food recently
I no longer eat this food
Bread/ roti
fruits
a)
b)
c)
snacks (halka/faltu foods, like chips/ shingara)
a)
b)
c)
others [list]
a)
b)
4. If you have stopped eating, or are eating less of, particular food(s), what are the reasons? (can
check √ multiple reasons)
o Don’t like them
o overall, food prices are higher and decided to buy less or cut out some foods
o household members changed.
o other, please specify _____________
* [Iftherespondentmentions‘highprices’inquestion4,pleasedoquestion5and6,otherwise
gotoquestion7].
5. how serious a problem has been higher food prices for you and your household?
(put √ on appropriate box)
o Very serious
o serious
o somewhat serious
o no problem at all
6. how have you adjusted to the high food prices? (can check √ multiple reasons)
o I ate less
o everyone in the family ate less

79Centre for Policy Research of IUBAT • Summer 2012
o Buy lower quality foods
o spent less on non-food items
o Working family members earning more
o new family members are working. Who? ___________
o moved to city
o sold assets
o Borrowed money from ____________________
o stopped sending one or more children to schools
o received help from the government/ nGos/ school stipend
7. Who eats fish/ meat/ milk/ fruits in your family? (put √ on appropriate box or boxes)
o everybody does, but varied amounts for different family members
o everybody does, about the same amount each
o my husband gets more
o my children get more
o I get more than others
Sources of minerals and vitamins:
8. As you may know, we need certain minerals and vitamins to be healthy. I would like to ask you
whether you are eating/consuming any of the following. (Put √ on appropriate box)
regularly not regularly
When I am pregnant or nursing my
children
never Don’t know
Iodized salt
Calcium Tablets
fortified yogurt
Vitamin tablets
sprinkles
Zinc tablets or syrup
Iron tablets or syrup
other supplements or fortified foods

80 Improving Nutritional Status for Women in Low-Income Households
hygiene and cleanliness:
9. Where do you usually get water for different everyday uses? (Put √ on appropriate box).
Drinking? Cooking?Washing Clothes?
Bathing/ hand
washing?
Dish washing?
Government (tap, hose)
Tube Well
stored rain water
river/Pond
10. Do you boil water before drinking?
o yes
o no
11. What is your toilet facility? (Put √ on appropriate box)
o here and there
o open hole
o Drain to pond/canal/ river
o hanging latrine (over water)
o Pit (with cement)
o ring slab
o sanitary
o other (specify): _________________________
Smoking and betel-nut chewing:
12. how many members of your household smoke, including you? ______________
[Ifnoneput0,gotoQuestion16]
13. how many cigarettes/ bidis do you think members of your household smoke in a day?
number/ range of numbers
self
husband
Children
others

81Centre for Policy Research of IUBAT • Summer 2012
14. Among members of your household who presently smoke, do they smoke more or fewer ciga-rettes/ bidis in a day now than they did one year ago? (Put √ on appropriate box)
o more
o fewer
o same
15. Is there any member of your household who started smoking within the last year (started smoking)?
o yes
o no
16. Is there any member of your household who smoked earlier but does not smoke now (stopped smoking)?
o yes
o no
17. If your household smokes less, or any member stopped smoking, what was the reason? (can check √ multiple reasons).
o Worried about health
o Too expensive
o Prices of other foods are higher now
o religious reasons
o Disapproval of family/ community
o other, please specify:____________________
18. how many members of your household chew paan, including you? _____________
[Ifnoneput0,gotoQuestion22]
19. how many times a day does your family members take paan?
number/ range of numbers
self
husband
Children
others

82 Improving Nutritional Status for Women in Low-Income Households
20. Among members of your household who presently take paan, do they use more or less paan in a day now than they did one year ago?
o more
o less
o same
21. Is there any member of your household who started taking paan within the last year (started)?
o yes
o no
22. Is there any member of your household who used paan earlier but does not use it now (stopped)?
o yes
o no
23. If your household uses less, or if any member stopped using paan, what was the reason? (can check √ multiple reasons).
o Worried about health
o Too expensive
o Prices of other foods are higher now
o Disapproval of family/ community
o other, please specify ____________________
Awareness/ education:
24. People around you, like your family members/ doctors/ health workers may talk about health/ nutrition/ smoking etc. Also you may see programs on TV regarding these. have you received advice on these different things from any of these sources? (Put √ on appropriate box).
received advice from healthy food?
managing healthy food during price
increase?
sanitation? smoking?Chewing
paan?
none
husband
other family members/ relatives
neighbours
school Teachers

83Centre for Policy Research of IUBAT • Summer 2012
received advice from healthy food?
managing healthy food during price
increase?
sanitation? smoking?Chewing
paan?
health facilities/ Doctor/ nurse
health/ Community workers came to house
religious leader
Television
radio
newspaper
Posters
Public meeting with health workers
others (please specify)
25. When you get together with other women do you discuss any of the following things? (can check √ multiple reasons)
o health issues/ problems
o nutritious food
o no, we don’t discuss any of the above issues [ifthisistheanswermovetoquestion28]
26. how often do you discuss those issues?
o almost every day
o 2-3 times a week
o once a week
o once a month
o once a year or less often
27. Where do you meet?
o family home
o community center
o children’s school
o near tube well/ water tap/ pond/ river
o other, please specify:

84 Improving Nutritional Status for Women in Low-Income Households
28. Would you be interested in health classes at oasis medical Center?
o yes (proceed to next question)
o no (go to question 30)
29. Which of the following classes interest you? (can check √ multiple reasons)
o healthy pregnancy care
o infant feeding
o breastfeeding
o child feeding
o family feeding
o using ors
o immunizations
o diet
o diabetes
o blood pressure
o joint pain
o weakness, headache, dizziness
o family planning
o healthy eating for weight
o other:
Assets/ Wealth and income:
[Notetothesurveyor:Filloutquestion30and31byyourself(withoutaskingtherespondent)]
30. material of the house in which the respondent is living: (Check √ multiple boxes if house made with more than one material)
o mud
o Tin
o Bamboo
o Plastic
o other (specify): ____________________
31. Does the house in which the respondent is living have electricity?
[Thesurveyorcanlookatwhetheranyelectricwearisoutsidethehouse]
o yes
o no

85Centre for Policy Research of IUBAT • Summer 2012
32. Who owns the house in which you are living? (Put √ on appropriate box)
o you or your husband
o rented house
o sharing houses with others not paying rent
o other (specify) _____________________
33. Which of the following things do you/ your household own? note: Assets will include only the currently usable ones. [Thesurveyorshouldusecommonsenseinfillingoutthissection]. Put ‘0’ if they do not have any.
Type of Assets numbers Comments
homestead land (in ‘katha’)
Cultivable land (in ‘katha’)
Chicken/ Duck/ Pigeon
Goat/ lamb
Cow
mosquito net
land/ mobile phone
radio
fan
TV
Bicycle
rickshaw
motorbike
other vehicle (please specify)
refrigerator
Computer
DVD player
Internet
other important asset (specify)

86 Improving Nutritional Status for Women in Low-Income Households
34. how do you assess the situation of overall food adequacy of your family/ household? (Put √ on appropriate box)
Current situation situation one year before
o enough
o sometimes not enough
o more than enough
o never enough
o enough
o sometimes not enough
o more than enough
o never enough
35. If your family/ household had more money, how would you spend it? (Put √ on appropriate box)
o buy more rice
o buy other foods
o buy some vitamin/ mineral supplements
o spend on clothing
o spend on children’s education
o spend on health treatments
o buy a radio/ television
o repair house
o save for future
o repay debt
o other, specify __________________________
demographic and Socio-economic Status:
36. name of the respondent (optional): _______________________________________
37. height (centimeters): _________________ Weight (kilograms): ________________
38. how many members are in your household? (write down numbers): _______________

87Centre for Policy Research of IUBAT • Summer 2012
39. family members’ information:
member of the
household
Age
(in years)
Can read?
(y = yes
n = no)
highest class
attended
(in numbers)
occupation hours worked per day
school attendance of children
C / fIf C, then
A/ m/ s
respondent
husband
Child 1
Child 2
Child 3
Child 4
other members
1.
2.
3.
4.
Note:C=Continuingtotheschool,F=Finishedatschool
A=Always,M=Mostofthedays,S=Stoppedattendingforsomedays
40. If one or more of your children has stopped attending school, what was the most important reason? Any other reason? Keep going…
[Noteforthesurveyors:Rankthemostimportantreasonas1,thesecondmostimportantrea-
sonas2,etc].
o We could not afford the costs of school (such as tutoring, school supplies)
o The child was not interested in school work
o We needed the child to help with housework (such as caring for younger children)
o We need the child to earn some money for the family
o other (please specify): _______________________________________
48. Any important observation by the surveyor: _________________________________________
______________________________________________________________________________
______________________________________________________________________________
______________________________________________________________________________

88 Improving Nutritional Status for Women in Low-Income Households
[Questions to ask of local merchants]
We are interested to know about the food price changes compared to the last year. Women may
not properly know the price if the male member(s) of the household purchased the necessary
commodities. The shopkeepers near the house may ask about their selling prices. The surveyors
are advised to take help from the local people. The number of shopkeepers interviewed may vary
on the basis of spread of the interviewed households and the availability of shops nearby. Please
write down the selling prices by the local shops of the following commodities. If don’t know put
‘0’.
Commodity Current price (taka) Price one year before (taka)
rice
lentil (mosuri Daal)
flour
Chicken
Beef
fishes:
a)
b)
c)
egg
Potato
onions
oil
milk
a) Powdered milk
b) liquid milk
c) Condensed milk
sugar
salt

89Centre for Policy Research of IUBAT • Summer 2012
Appendix B
Food Scoring Method
We used a modified version of the ten-question food scoring instrument proposed by the WHO (2001). Below are the ten WHO questions and detailed notes on our scoring procedure.
Legend
s: servingcup: one cup is 250 ml.tsp: tea-spoon
Q1: did the individual eat at least 6 servings from the cereals and potato group?
° s ≥ 6 from cereals and potato group: 1 point
° 3 ≤ s < 6 from cereals and potato group: 0.5 point
° s < 3 from cereals and potato group: 0 point
where
° ½ cup cooked rice = 1 serving
° ½ cup potato (cooked/ fried) = 1 serving (not considered in vegetables group)
° 1 roti/bread = 1 serving
° 1 pitha/ pan cake/ cup cake = ½ serving
° 1 cup puffed rice/ chips = ½ serving
° 1 biscuits = 1/3 serving
Q2: did the individual eat at least 5 servings from vegetables and fruits group?
° s ≥ 5 from vegetables and fruit group: 1 point
° 2.5 ≤ s < 5 from vegetables and fruit group: 0.5 point
° s < 2.5 from vegetables and fruit group: 0 point
where
° ½ cup vegetables = 1 serving
° 1 banana or 1 apple or 1 orange or 1 mango = 1 serving
° ½ cup grapes/ jack fruit = 1 serving
Q3: did the individual have at least 2 servings from the milk products group?
° s ≥ 2 from milk products: 1 point
° 1 ≤ s < 2 from milk products: 0.5 point
° s < 1 from milk and milk products: 0 point
where
° 1 lcup milk = 1 serving
° 4 small cups tea (with milk) = 1 serving of milk

90 Improving Nutritional Status for Women in Low-Income Households
We considered 1 large cup of tea (250 ml, used in the survey) equivalent to 4 small cups of tea. Lower income people in Ban-gladesh usually use small cups. We assumed each cup of tea contains some milk and the milk in 4 cups equals one milk serving.
Q4: did the individual eat at least 1 serving from meat and alternatives group (meat, fish, eggs, daal or other pulses)?
° s ≥ 1 from meat and meat alterna-tives group: 1 point
° 0.5 ≤ s < 1 from meat and meat al-ternatives group: 0.5 point
° s < 0.5 from meat and meat alterna-tives group: 0 point
where
° ½ cup of meat (any kind) = 1 serving
° ½ cup fish (any kind including dried fish/ shutki) = 1 serving
° 1 egg = 1 serving
° ½ cup daal or other pulses = 1 serving
Q5: did the individual consume fewer than 2 servings from the fat, oils and sugar group?
° 0 ≤ s ≤ 2 from fats, oils and sugar group: 1 point
° 2 < s < 4 from fats, oils and sugar group: 0.5 point
° s ≥ 4 from fats, oils and sugar group: 0 point
where
° 2 tsp of oil = 1 serving
° 2 tsp butter = 1 serving
° 2 tsp sugar = 1 serving
For this question we made the following detailed scoring assumptions:
° 1 biscuit = ½ serving from fat, oil, sugar group
° 1 packet chips = 1 serving from fat, oil, sugar group
° 1 large cup of tea or 4 small cups of tea = 2 servings of sugar (assuming 1 tsp sugar per small cup)
° 1 cup halka/faltu food = 1 serving of fat, oil, sugar group
° 1 pitha/ pan cake = ¼ serving from fat, oil, sugar group (lower income people generally prepare pitha with or without oil, but sugar/gur is a common ingredient. As types of pitha were not specified in the survey, we assumed each pita con-tributed a small portion of a fat, oil, sugar group serving)
° 1 puri/ samosa/ singara = ¼ serving of fat, oil, sugar group
We also assessed the impact of meat, fish, vegetables, eggs and daal consumption on the fat, oil, sugar group. In Bangladesh, most people use oil (as much as they can!) when they prepare curries. Also meat and fish contain fat:
° 1 cup of meat = ½ serving of fat, oil, sugar group
° 1cup of fish = ½ serving of fat, oil, sugar group
° 1 cup of vegetable = ½ serving of fat, oil, sugar group

91Centre for Policy Research of IUBAT • Summer 2012
° 1 cup of daal = ¼ serving of fat, oil, sugar group (usually less oil use to cook daal than curry)
° 1 egg = ½ serving of fat, oil, sugar group (fried is the most common means to consume eggs for lower income people) where 1 cup egg = 2 eggs
° 1 sweet = 1 serving from fat, oil, sugar group
Q6: did the individual eat a variety of foods within each of four main food groups ([1] cereals and potato, [2] fruits and vegetables, [3] meat, fish, eggs, daal) [4] milk and milk products?
° 2 items in each of 4 food groups: 1 point
° 2 items in each of 2 or 3 food groups: 0.5 point
° 2 items in 0 or 1 food group: 0 point
Very few low-income Bangladeshi consume a variety of milk products. To include this group, as recommended by the WHO, would have generated unreasonably low scores on this question.
Q7: did the individual eat at least 2 fresh vegetables?
° 2 or more fresh vegetables: 1 point
° 1 fresh vegetable: 0.5 point
° 0 fresh vegetables: 0 pointHere I considered leafy and other veg-
etables in terms of number of items, as opposed to quantity of servings.
Q8: did the individual eat at least one fresh fruit?
° 1 or more fresh fruit: 1 point
° 0 fresh fruit: 0 point
As for Q7, we considered number of items, not quantity of servings. We awarded no intermediate 0.5 scores to this question.
Q9: did the individual eat mostly nutritious snacks?
° 0 snacks and 1 fruit: 1 point
° 0 or 1 processed snacks (shingara, samosa, puri, packet of chips) plus 1 or more fruit: 1 point
° 1 or 2 processed snacks plus 1 or more fruit: 0.5 point
° 2 processed snacks plus 1 or more fruit: 0 point
° 0 or 1 biscuit and 1 or more fruit: 1 point
° 1 or 2 biscuits plus 1 or more fruit: 0.5 point
° 2 biscuits and 1 or more fruit: 0 point
° 0 – 2 pitha and 1 or more fruit: 1 point
° 2 – 3 pitha and 1 or more fruit: 0.5 point
° 3 pitha and 1 or more fruit: 0 point
As snacks we considered the halka/faltu foods. Respondents reported consuming biscuits, chips, shingara, samosa, puri, pitha, puffed/beaten rice (khoi/chira) as snacks. We gave more points if the foods

92 Improving Nutritional Status for Women in Low-Income Households
contain hygienic/nutritious items and were probably produced in hygienic situations. Shingara, samosa, puri, and chips are widely available in Bangladesh; however they are often cooked in unhygienic situations by street vendors, and most contain lots of oil. Pithas (sweet breads or pastries) are mostly home-cooked in more hygienic situations and contain less oil. We considered fruits as potential snacks.
Q10: did the individual consume mostly lean or low fat content foods?
This question was scored identically to Q5.

93Centre for Policy Research of IUBAT • Summer 2012
Appendix C
Income and Asset Index Calculation
The survey provided data on the occupation of each member of the household and hours worked per day: full time worker (5 hrs or more per day); part time worker (less than 5 hrs per day). We categorized the occupations into six categories:
• Agricultural labour
• Other labour
• Business
• Official jobs (including driver)
• House worker (maid servant)
• Garment worker
Data for the daily wages for each category are taken from the Bangladesh Bureau of Statistics. We multiplied the hours of work times the estimated wage
to get wage per day. For each profession we considered 24–30 working days per month. We summed the income of all members in the household to calculate the annual household income.
To estimate income from family-owned assets we included cultivable land, cows, chickens, ducks and income-generating vehicles such as rickshaws. We estimated average productivity of each type of asset per unit (e.g., daily milk per cow per day).
Adding the income from labour and from as sets we calculated the total an-nual income for the household. Per capita income was calculated by dividing total annual household income by the square-root of the number of household members.

BACK IssUes
CPR CommeNtARy No. 1
Natural Gas options for Bangladesh
The very low level of available commercial energy is a serious constraint on economic development in Bangladesh. fortunately, there is one bright prospect – sizeable discoveries of natural gas.
This report explores three options for how Bangla-
desh might use its natural gas endowment: exporting
gas to provide public revenues that could be directed
to many other development needs; expanding the many
possible end-uses for gas in domestic industry, agricul-
ture and households; or concentrating natural gas use
on accelerated electrification. After assessing the three
options, the authors conclude that rapid electrification
should have the highest priority.
In addition, the report discusses institutional reforms to foster private investment and to improve the transparency, efficiency and consistency of government corporations, ministries and agencies. There is an important case to be made for integrated resource planning that includes environmental and social objectives.
by Mark Jaccard, Director, Energy Research Group, School of Resource and Environmental Management at Simon Fraser University, MuJibur
rahMan khan, Professor, College of Engineering and Technology at IUBAT, and John richards, Professor, Master of Public Policy Program at Simon Fraser University

BACK IssUes
CPR CommeNtARy No. 2
electricity for All
by RoSe muRPHy, Research Associate with the Energy and Materials Research Group at the School of Resource and Environmental Management at Simon Fraser University, NuRuddIN kAmAL, Senior Research Fellow for the Centre for Policy Research at IUBAT, and joHN RICHARdS, Professor, Master of Public Policy Program at Simon Fraser University
only one in five Bangladeshis has access to power; among those in rural areas the ratio is about one in
seven. What can be done to improve access? This report assesses the barriers to accelerated electrification
– rural electrification in particular – and offers practical recommendations.
The rural electrification Board (reB) and its network of cooperatives – Palli Biddyut samitees – now
distribute nearly a quarter of electricity consumed in the country. Despite this impressive accomplishment,
they need to do more.
The authors recommend that the reB place a high priority on power generation independent of the
national transmission grid. This expansion will require private investment and higher average tariffs
for reB customers. securing major new investment and revising tariffs will not be easy, but the goal of
increased electrification is sufficiently important to justify the required reforms.

BACK IssUes
CPR CommeNtARy No. 3
energy Policy for Bangladesh
by dR. m. ALImuLLAH mIyAN, Vice Chancellor and Founder, IUBAT, and joHN RICHARdS, Professor, Master of Public Policy Program at Simon Fraser University
It is hard to exaggerate the importance of adequate supplies of commercial energy for the future
development of Bangladesh. In may 2004, the Government of Bangladesh released a draft national
energy Policy, and invited public commentary. The government report acknowledges the serious
shortcomings of present policy and the dilemmas in designing new policy.
In this third report of the Centre for Policy research, Dr. Alimullah miyan, Vice-Chancellor and
founder of IUBAT—International University of Business Agriculture and Technology, and Dr. John
richards, Professor at simon fraser University in Canada and Visiting Professor at IUBAT, respond
to the draft national energy Policy and offer a series of recommendations. The recommendations
cover major issues from export of natural gas to improvements in the utilisation of biomass fuels.

BACK IssUes
CPR CommeNtARy No. 4
What Parents think of their Children’s SchoolsA Survey of School Quality Among Parents in uttara, Suburban dhaka, Bangladesh
by SANdRA NIkoLIC, Planner, Health Services Authority of British Columbia, and
joHN RICHARdS, Professor, Master of Public Policy Program at Simon Fraser University
over the last decade, Bangladesh has made impressive gains in the quantity of education available. As
of 2004, there were 18 million children enrolled in 110,000 primary schools. still, many parents choose
to enrol their children in private schools where parents pay, in nonformal schools run by nGos such as
BrAC, and in madrasas. The popularity of school types other than government-run schools suggests that
parents have concerns about school quality – as well as the availability of school spaces.
To assess parental attitudes to problems of school quality, student researchers from IUBAT—
International University of Business Agriculture and Technology surveyed residents in Uttara, a suburb in
northern Dhaka. This study reports their findings. The study also assesses broad strategies for improving
education outcomes.

BACK IssUes
CPR CommeNtARy No. 5
Barriers to Girls’ Secondary School Participation in Rural Bangladesh
by jeNNIFeR HoVe, Bachelor of International Relations at University of British Columbia 2000, Master of Public Policy at Simon Fraser University 2007, Visiting Fellow, IUBAT
over the last 15 years, secondary school enrolment rates among both boys and girls have risen
dramatically. however, girls’ rates of progression and completion of the secondary cycle (from
grades six through ten) are disturbingly low – albeit the comparable rates for boys are also low.
At grade six there is near parity between the number of boys and girls enrolled. By grade ten,
boys are significantly ahead of girls in participation in public examinations and promotion to
higher secondary school. only 13 per cent of girls who complete the tenth grade transition to the
higher secondary grades of eleven and twelve. There are powerful forces at work within schools,
families and the broader society that dissuade girls from staying in school. Based on interview
responses among teachers, students and parents in four rural schools, this study analyses why
girls drop out of school, and offers policy recommendations to increase completion rates.

BACK IssUes
CPR CommeNtARy No. 6
A New mandate for the Rural electrification Board
by B.d. RAHmAtuLLAH, NANCy NoRRIS, joHN RICHARdS
A lack of reliable electrical power is severely impeding Bangladesh economic development. seventy-eight per cent of Bangladeshi firms cite poor electricity service as a “major” or “severe” obstacle to expansion.
successful reform requires building on a foundation of administrative credibility. The most credible of the major agencies in the power sector is the rural electrification Board (reB). over the last decade, it has doubled the number of customer connections, and now distributes 40 per cent of all power generated in Bangladesh. The authors of this monograph recommend an expansion of the reB mandate to enable the reB and its network of rural cooperatives (Palli Biddyut samitee) to create generating capacity independent of the national grid, capacity whose power would be distributed on a priority basis to customers in the local participating PBs.

BACK IssUes
CPR CommeNtARy No. 7
Benchmarking the Nutritional Status of Women in the tongi-Ashulia Road Slums
by joHN RICHARdS, AFIFA SHAHRIN ANd kAReN LuNd
This Commentary reports on the nutritional status of shanty dwelling women in Uttara (near the Turag river). Data were collected by nursing students at IUBAT—International University of Business Agriculture and Technology. most women have an adequate caloric intake. however, most lack adequate servings from the full range of food groups. Inflation in rice prices may have induced them to sacrifice other foods in order to maintain rice consumption.
The majority use non-boiled tap water from the Dhaka Water and sewage Authority. Due to contamination from ground water, it may contain high levels of pathogens. Tobacco and betel nut are widely used by family members. Both pose serious health hazards if consumed on a long-term basis. The ability of women to read, and receiving one-on-one advice from a health worker had positive impacts on aspects of nutrition.
Uw½-Avkywjqv mo‡Ki ew —̄evwm gwnjv‡`i cywógvb g~j¨vqb
Uw½-Avkywjqv mo‡Ki ew —̄evwm gwnjv‡`i cywógvb g~j¨vqb

Us$15 – Taka 200
This monograph reports on the nutritional status of a sample of 600 women in two sites: four villages near Jamalpur, and shanty dwellers in the Dhaka metropolitan area. While some suf-fer inadequate calorie intake, the major nutritional problem is inadequate consumption of protein, vitamins and micronutrients.
The authors assess the importance of factors that influence nutrition. In general, women’s nutrition is better in households with higher education levels; most women do not smoke, but their nutrition is worse if other family members use tobacco.
The recommendation to government is to pursue two programs: rice fortification, and setting of tube wells in slum neighbourhoods (where groundwater is not affected by arsenic). nGos are invited to improve training of community health workers, and encourage household veg-etable gardens in rural villages.