Embed Size (px)
Citation preview
AgriLIFE EXTENSION Texas AampM System
Improving Lives Improvirrg Texas
Developing This Years Marketing Plan-Feed grains
Prosolttod Gy
Dr StOilO AHtossolt
ROfJoltts 10H]olN
Prssor altd 8xtoltslolt 8eoltoHtIst
Altd Dr Mar4 WoeeA
Assistaltt Prssor
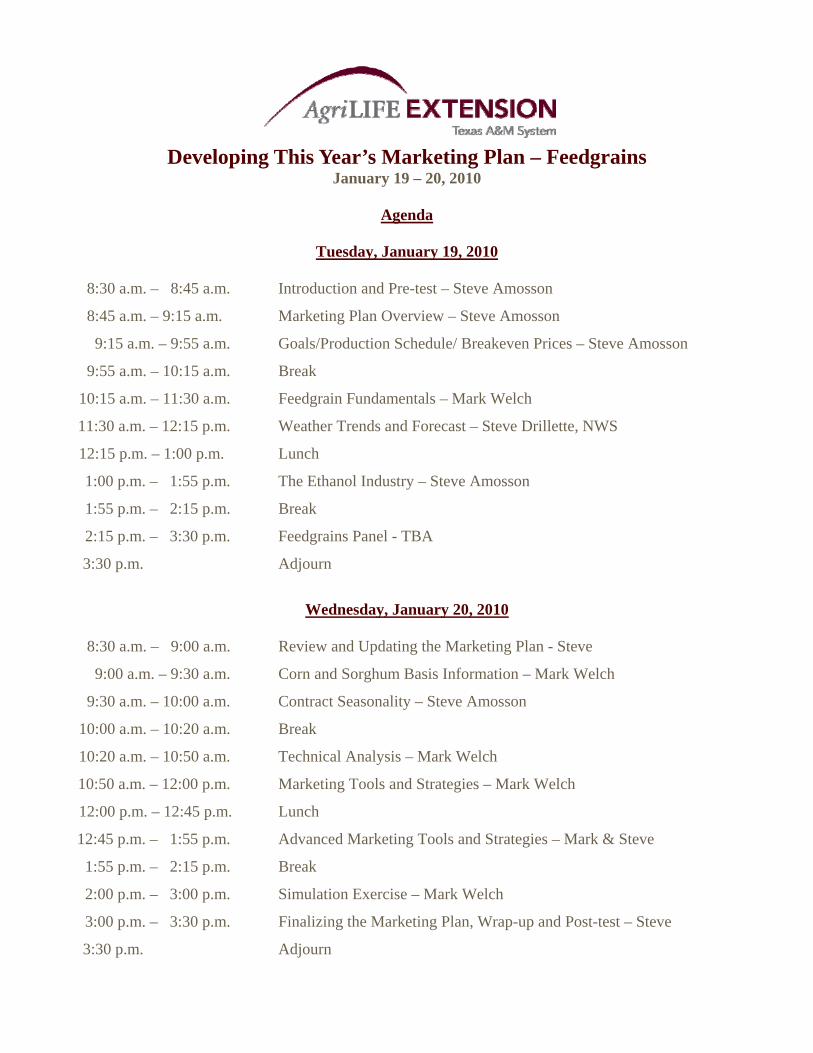
Developing This Yearrsquos Marketing Plan ndash Feedgrains January 19 ndash 20 2010
Agenda
Tuesday January 19 2010
830 am ndash 845 am Introduction and Pre-test ndash Steve Amosson
845 am ndash 915 am Marketing Plan Overview ndash Steve Amosson
915 am ndash 955 am GoalsProduction Schedule Breakeven Prices ndash Steve Amosson
955 am ndash 1015 am Break
1015 am ndash 1130 am Feedgrain Fundamentals ndash Mark Welch
1130 am ndash 1215 pm Weather Trends and Forecast ndash Steve Drillette NWS
1215 pm ndash 100 pm Lunch
100 pm ndash 155 pm The Ethanol Industry ndash Steve Amosson
155 pm ndash 215 pm Break
215 pm ndash 330 pm Feedgrains Panel - TBA
330 pm Adjourn
Wednesday January 20 2010
830 am ndash 900 am Review and Updating the Marketing Plan - Steve
900 am ndash 930 am Corn and Sorghum Basis Information ndash Mark Welch
930 am ndash 1000 am Contract Seasonality ndash Steve Amosson
1000 am ndash 1020 am Break
1020 am ndash 1050 am Technical Analysis ndash Mark Welch
1050 am ndash 1200 pm Marketing Tools and Strategies ndash Mark Welch
1200 pm ndash 1245 pm Lunch
1245 pm ndash 155 pm Advanced Marketing Tools and Strategies ndash Mark amp Steve
155 pm ndash 215 pm Break
200 pm ndash 300 pm Simulation Exercise ndash Mark Welch
300 pm ndash 330 pm Finalizing the Marketing Plan Wrap-up and Post-test ndash Steve
330 pm Adjourn
~EXTENSION TeJoas AampM System
ImproviNg Lhtflmproving lU4U
2010
Developing This Years Marketing
Plan-Feedgrains
~ ltgt shy
~
No 2 J
No3 1
~
~
No6
1010 7
1010 8
CO N TE N T 5
I Marketing Plan amp Breakeven Prices
I -Feedgrain
II Fundamentals
II The Ethanol Industry
I Corn and Sorghum Basis Information
I Contract Seasonality
Technical Analysis
Marketing Tools and Strategies
Marketing Simulation Exercise
SAVERYmiddot E X ECU TI VE READY I NDEX DI V ID ERS
1
Marketing Plan amp
Break Even Prices
Developing and Implementing a S f l M k i PlSuccessful Marketing Plan
Presented By
Dr Steve AmossonDr Steve AmossonRegents Fellow
Professor and Extension Economist
Developing and Implementing the Farm Marketing PlanFarm Marketing PlanThe Ten Steps to Success
Identify short and long term goalsy g gEstablish production estimatesCalculate breakeven and profit price goalsAssess cash-flow needs and Quantify price risk
you are willing to assume Identify who is responsible for decision makingIdentify who is responsible for decision makingKnow the market and market outlook Identify the marketing tools to be used Invest time and money to do it rightRevise and Review marketing plan as conditions
warrantwarrantMaintain Discipline
Production Estimates
Grain ndash Total bushels Grain Total bushels 5 year Average YieldsOn Farm Storageg Production Availability
Livestock ndash Animals to MarketDates (months) and weights to MarketRetained marketing alternatives
Know Your Production Costs
PER ACRE TOTALSeed $ 9000 $ 1350000 Enterprise
F tili $ 77 00 $ 141 000 00Fertilizer $ 7700 $ 14100000 breakeven
Chemicals $ 6700 $ 13050000 for 1500 acres of
Harvest and Haul $ 5500 $ 13200000 corn would be
Irrigation Fuel $ 183 00 $ 202 000 00Irrigation Fuel $ 18300 $ 20200000Allocated direct costs $ 13100 $ 16000000
(Fuels repairs interest)
Allocated overhead $ 1000 $ 5250000
If your yield is 225 bushels per acre your breakeven costs are $3 32 per bushel
(Services accounting insurance utilities)
Land $ 9000 $ 16500000TOTAL $ 66400 $ 111900000
From Your Production RecordsLow Corn Yield 200 Bushels Per Acre
If your yield is 225 bushels per acre your breakeven costs are $332 per bushel
Average Corn Yield 225 Bushels per Acre
High Corn Yield 250 Bushels Per Acre
Knowing All Your Costs
Total estimated production cost $ 111900000Plus
F il li i $ 65 000 00Family living expenses $ 6500000Plus
Annual debt service $ 5000000Minus
AMTA (f ) t $ 45 000 00AMTA (farm program) payments $ 4500000Total Cash Expenditures $ 118900000
PlusDepreciation (beyond payments) $ 6000000
$Total cashnon-cash expenses $ 124900000Plus
Profit andor growth capital $ 10000000Salesgross income objective $ 134900000
How do you determine your Growth Capital Goal
ROI ndash Return on Investment
ROE ndash Return on Equity
ROA ndash Return on Assets
Price Goals
Set GoalsCosts of production FamilyLiving expenses Profit margin desired Profit margin desired Projected growth of operation
Write Them DownStudy ThemShare them with
spousepartnerbanker
Calculating Breakeven Prices
Low Production
Average Production
High ProductionProduction Production Production
BushelsA 200 225 250Total Bushels 300000 337500 375000
Cash Expenses 1174375 1189000 1203625BEP - CE $391 $352 $321
Total Expenses 1234375 1249000 1263625BEP - TE $411 $370 $337
Total Expenses + ProfitGrowth 1334375 1349000 1363625
BEP TEP $4 45 $4 00 $3 64BEP - TEP $445 $400 $364
Determine the amount of risk yoursquore willing to takey g
Leverage
Debt structure
Age
Off-farm income
C h fl d bli tiCash flow needsobligations
On farm storageOn farm storage
Projected Marketing ScheduleCommodity Jan Feb Mar Apr May Jun Jul Aug Sep Oct Nov Dec CO
Corn
Soybeans
Wheat
Milo
Others
Payments
LandLand
Leases
Machinery
Market Outlook
Political SituationFundamental SituationSupplyDemandDemand
Marketing Psychology
SeasonalityCycles
Technical SituationTechnical Situation
Fundamentals2007 Feedgrains EWAG Analysisg y
Low Average HighPlanted Acres (mil AC) 870 870 870Harvested Acres Planted Acres () 88 00 90 45 90 50Harvested Acres Planted Acres () 8800 9045 9050Harvested Acres (mil AC) 7656 7869 7874Yield (BUAC) 1406 1520 1672Production (mil BU) 10764 11961 13164Imports (mil BU) 10 10 10Carry In (mil BU) 935 935 935Total Supply (mil BU) 11709 12906 14109USEUSEFeed (mil BU) 5600 5900 6100Food Seed and Industrial (mil BU) 4250 4500 4750Export (mil BU) 1600 2000 2250Total Use (mil BU) 11450 12400 13100Carry Out (mil BU) 259 506 1009COUSE () 23 41 77P i ($BU) $6 60 $4 20 $2 80Price ($BU) $660 $420 $280
Notes
Pricing Alternatives
Cash Market at Harvest Speculative Storage Forward Contract Hedge to Arrive Contract Basis Contract Minimum Price Contract Hedging in Futures Marketsg g
Pre-harvest hedge Post-harvest storage hedge
Options Marketsp Pre-harvest hedge Post-harvest storage hedge
Farm Program Farm Program CooperativesGroups
Advantages amp Disadvantagesof Marketing Tools
Limited to 1000 Cash Leave Upside Margin
RiskBasis Risk
Futures Risk
Easy EntryExit
or 5000 Bushels
Delivery Required
pPotential
OpportunityCash Tools
Cash Sale N N N N N Y N2Cash Sale N N N N N Y N2
Non-Cash Tools N N N N N Y N
Basis Contract N N Y N N Y Y
Hedge-to-Arrive N1 Y N N Y Y N2g
Min Price Contract N N N N Y Y Y
Non-Cash Tools
Futures Hedge Y Y Y Y Y N N2
Buy Put N Y N Y Y N Y
Buy Call N Y N Y Y N Y
Fence Y Y Y Y Y N LY N N L Li it dY = yes N = No L = Limited
1 Depends on contract agreements2 Upside Potential limited to improvement in basis
STRATEGIES
Use More Flexible Tools Use More Flexible Tools Early sales Upper one-third of productionpp p
Allocation Sales Over Time Increase of sales as price increases Decrease of sales as price declines Consider multi-year sales in historically high
iprices
Look For Pricing OpportunitiesGrain Grain
Basis
Feedgrains Marketing Plan for 2010P re -P la n t P la n t in g to H a rv e s t (H a rv e s t P o s t H a rv e s t )
R e p o rt s to W a tc h
M a rk e ta b le P ro d u c t io n
C o n t ra c t S e a so n a lit y
P r ic e T im e T a rg e ts
M a rk e t in g T o o ls to b e U se d
M a rk e t in g S t ra te g ie s
W h a t D id I D o a n d W h y
g g
Closing CommentsgldquoAmossonrsquos Words of Wisdomrdquo
Know the difference between hedging and speculating ---- Hedging you win Hedging you win Speculating you lose
F d t l t l th l i Fundamentals control the long run price ---- Technicals control the short run price Seasonals reflect normal market psychology and need to p y gy
be factored into marketing decisions
Marketing is not a point in time but a continuous Marketing is not a point in time but a continuous activity
Breakeven Prices
Presented ByDr Steve AmossonDr Steve Amosson
Regents FellowProfessor and Extension
Economist
B k P iBreakeven Prices
Q i i V i bl C t (VC) All t f k t Quaisi Variable Cost (VC) ndash All out-of-pocket expenses associated with or assigned to the crop This includes seed fertilizer paid labor family living with-drawals land
t i t t t t tpayments equipment payments government payments etc Per Acre VC Breakeven Price = VCYield Total Cost (TC) Includes VC plus all non-cash expenses Total Cost (TC) Includes VC plus all non cash expenses
such as depreciation Per Acre TC Breakeven Price = TCYield Profit Total Cost plus a profit objective usually determined
by the goals that have been set or an independent financial measure such as return on assets
Per Acre Profit Breakeven Price = TC + Desired ProfitYield
All ti C tAllocating Costs
By Crop Acre By Crop Acre
By Capital Investment
By Time Investment
By Use
E ti ti C tEstimating CostsA l l o c a t e d
CB y C r o p
t o C r o p p e r A c r eT o t a l O u t - o f - P o c k e t P r o d u c t i o n C o s t s
O v e r h e a d C a s h E x p e n s e s P l u s
( u t i l i t i e s e t c )
F a m i l y L i v i n g E x p e n s e s
A n n u a l D e b t S e r v i c e ( l a n d
P l u s
P l u s(
e q u i p m e n t e t c
D i r e c t F a r m P r o g r a m P a y m e n t
M i n u s
T o t a l C a s h E x p e n s e s ( V C )
D e p r e c i a t i o n ( B e y o n d P y m t s )T o t a l C a s h N o n - C a s h E x p e n s e s ( e t c )
P l u s
E x p e n s e s ( e t c )
P r o f i t a n d o r G r o w t h C a p i t a lS a l e s G r o s s I n c o m e O b j e c t i v e
P l u s
B k P iBreakeven Prices
Yield Scenarios
Low Average High
YieldYield
Variable Cost
BEP‐VC
BEP‐VC+FC
Variable+Fixed Cost (VC+FC)
VC+FC+Profit (TC)VC+FC+Profit (TC)
BEP‐TC
Closing Comments (continued)g
Use only the marketing tools you are comfortable with ---- Know them inside out
Futures price and basis are separate items ----Know both and market both
Marketing is like playing baseball sometimes you get a hit and sometimes you donrsquot -- Itrsquos the relative percentage thatrsquos importantp g p
The key to being a good marketer is have a solid marketing plan and the discipline to execute it
2010 Marketing Plan SummaryF u n d a m e n t a l s N o t e s S h o r t C r o p P r ic e = A v e r a g e C r o p P r ic e = L a r g e C r o p P r i c e =
B a s i s N o t e s S t r o n g B a s is A v e r a g e B a s is W e a k B a s is
C a s h M a r k e t A l t e r n a t i v e s N o t e s 11 2 3
W h a t I n e e d t o l e a r n H o w a n d w h e n a m I g o i n g t o d o i t 1 22 3
G o a l s S h o r t - T e r m G o a l s L o n g - T e r m1 1 2 2 3 33 3
L o w Y i e l d H i g h Y i e l dV a r ia b le C o s t ( V C )
V C + F ix e d C o s t ( F C )
A v e r a g e Y i e l dB r e a k e v e n s
V C + F ix e d C o s t ( F C )
V C + F C + P r o f i t
Pre‐Plant Planting to Harvest (HarvestPost Harvest)
Reports to Watch
Marketable Production
Contract Season
PriceTime Targets
Marketing Tools to be Used
Marketing Strategies
What Did I Do and Why
Feedgrains Marketing Plan for 2010
Pre‐Plant Planting to Harvest HarvestPost Harvest
Reports to Watch
Planting Intentions (PI) Report (March 31) PI Industry Reports starting early March Soil Moisture Conditions httpwwwusdagovnasspubsstaterpthtm ‐ NASS Crop Weather WASDE and other USDA reports Ethanol Industry Reports EIAISU
Crop conditionsprogress reports from NASS Crop Weather and httpwwwextensioniastateeduinformationweatherhtml ‐ Elwynn Taylor (Iowa State) WASDE and other USDA reports especially August Crop Report Ethanol Industry Reports EIAISU
WASDE and other USDA reports
Marketable Production 7525 ‐ 75 depending on pre‐plant sales with total pre‐harvest sales not to exceed 100
Remainder of unsold production
Contract Seasonality
First Seasonality price opportunity is normally early to the middle of March Followed by the first half of April Next opportunity earlymid June If normal crop prices tend to fall into harvest
Next Seasonal sale indicator is early to mid JuneSeasonal low is usually hit in September or early October
PriceTime Targets
Split the range ie start marketing at $440 (double first sale) incrementally market to $475 until 75 of crop is marketed Can fine tune selling with technical indicators (moving ave etc)
Continue scale up sales if market is trending up Sell at least 50 by mid June time frame on down trends and remainder of pre harvest sales on downtrend in July to August
Sell remainder at harvest across the scales unless you have tax concerns but to evaluate storage costs carefully before holding grain
Marketing Tools to be Used
Forward contract at least first half if not all of pre plant sales If you decide to use options consider collar window or FC ‐ Bull call spread to limit cost Consider basis contracts on un‐priced production up to 75 of total because of inc supplies
Options due to market volatility and likelihood of major up and down trends developing If forward cash sales hedges or options depending on your risk tolerance If you are pricing the last 25 of production definitely use optionsoption strategies such as a collar window or bear put spread
Cash Sales Call options strategies such as bull call spread can be used to re‐own grain if desired
Marketing Strategies
Use scale up sales based on seasonal price tendencies with moving averages and other trend indicators as marketing triggers I want to be at least 25 sold pre‐plant if at profitable levels Lock in 50 of NG (up to August) and all fertilizer ‐ NOW
Continue scale up sales based on seasonal tendencies and price trend indicators as sales triggers Need to be at least 50 marketed by the middle of June with a goal of being 100 if the weather appears normal and at profitable levels before harvest
If prices appear likely to move higher after harvest sell grain and buy calls
What Did I Do amp Why
Feedgrains Marketing Plan for 20102011Preseason Price Forecast = $405Contract Price Range $360‐$475
Collar or Three‐Way
Action Buy a put at the money sell out‐upsell out up
The money put and callExample 2010 Dec CornExample 2010 Dec Corn
Buy 400 put 43 38Sell 350 put 20 frac34Sell 500 call 20 frac12
Out‐of‐Pocket Cost
4 00 Put(B) 43 38400 Put(B) 43 38350 Put(S) ‐20 frac34500 Call(S) ‐20 frac12Commission +2 Net Cost 4 18
Assume an 0 Basis
Collar or Three‐Way (Continued)(Continued)
AdvantagesLimited up front requiredCan negate the time value of optionsProvides limited downside price protection
DisadvantagesCaps upside price potentialLimits downside price protectionPossible margin calls if price rises
When to useUncertain productionOptions premiums are highA good idea of potential price rangeA good idea of potential price rangeMarket is a profitable level or downside risk
ProblemsLimited volume in options marketLimited volume in options market
Collar or Three‐Way (Continued)(Continued)
1 What is the first price you are protected at on the downside
2 2 If the price falls lower than the put that you sold what is the maximum you could collect
3 3 What is the maximum price you can receive
4 4 If the Dec price ends up between $350 ‐$500 buthen what is your expected price range you will receive
Projections for Planning Purposes OnlyNot to be Used without Updating after December 15 2009
B-1241 (C1)
Table 4A Estimated costs and returns per Acre Bt Corn for Grain Sprinkler Irrigated (NG) 2010 Projected Costs and Returns per Acre_______________________________________________________________________ITEM UNIT PRICE QUANTITY AMOUNT YOUR FARM_______________________________________________________________________ dollars dollarsINCOME corn bu 430 2250000 96750 _________ --------TOTAL INCOME 96750 _________
DIRECT EXPENSES SEED seed - Bt corngr bags 25500 03500 8925 _________ INSECTICIDE miticide acre 2000 10000 2000 _________ HERBICIDE herb - corn pre acre 1960 10000 1960 _________ herb -corn post acre 2780 10000 2780 _________ FERTILIZER fert(N) - ANH3 lb 022 1260000 2772 _________ fert(P) - liquid lb 051 600000 3060 _________ fert(N) - liquid lb 032 780000 2496 _________ CUSTOM fert appl - ANH3 acre 1100 10000 1100 _________ crop consultant acre 725 10000 725 _________ harv amp haul - corn bu 039 2250000 8775 _________ CROP INSURANCE corn - irrigated acre 1930 10000 1930 _________ OPERATOR LABOR Implements hour 1080 02925 315 _________ Tractors hour 1080 03965 428 _________ HAND LABOR Implements hour 1080 01527 164 _________ IRRIGATION LABOR Center Pivot hour 1080 14080 1520 _________ DIESEL FUEL Tractors gal 205 21861 448 _________ GASOLINE Self-Propelled Eq gal 236 20100 474 _________ NATURAL GAS Center Pivot ac-in 675 220000 14850 _________ REPAIR amp MAINTENANCE Implements Acre 561 10000 561 _________ Tractors Acre 480 10000 480 _________ Self-Propelled Eq Acre 016 10000 016 _________ Center Pivot ac-in 203 220000 4466 _________ INTEREST ON OP CAP Acre 1088 10000 1088 _________ --------TOTAL DIRECT EXPENSES 61337 _________RETURNS ABOVE DIRECT EXPENSES 35412 _________
FIXED EXPENSES Implements Acre 873 10000 873 _________ Tractors Acre 689 10000 689 _________ Self-Propelled Eq Acre 024 10000 024 _________ Center Pivot Acre 3360 10000 3360 _________ --------TOTAL FIXED EXPENSES 4948 _________ --------TOTAL SPECIFIED EXPENSES 66286 _________RETURNS ABOVE TOTAL SPECIFIED EXPENSES 30463 _________
ALLOCATED COST ITEMS cash rent - corn acre 11000 10000 11000 _________RESIDUAL RETURNS 19463 ________________________________________________________________________________Projections for Planning Purposes Only1 ac-in = 1 Mcf
Information presented is prepared solely as a general guide amp not intended to recognize or predict the costs amp returns from any one operation Developed by Texas AgriLife Extension Service
215
667
80075252500
13200
57749 + 100 CASH amp RENT67749 (VC)
72697 (TC)
10000
600
035 215
72697 8 = 5816______
TOTAL 78513
2
Feedgrain
Fundamentals
Grain Market FundamentalsSupply and Demand Analysis
Mark WelchmdashGrain Marketing EconomistJanuary 19 2010
Improving Lives Improving Texas
bull ldquoWithout the runaway demandrunaway demand growth of ethanol many of the recent stories need to be rewritten in shortrewritten in short orderrdquo
bull
Michael Swanson
Pumping ethanol from corn in 1933
--Michael Swanson Economics Department Wells Fargo
httpwwwnassusdagovPublicationsindexasp
httpwwwersusdagovBriefing
httpwwwfasusdagovpsdonlinepsdHomeaspx
httpwwwfaprimissourieduindexaspcurrent_page=home
httpwww cpc ncep noaa govproductsanalysis monitoringregional monitoringindex shtmlhttpwwwcpcncepnoaagovproductsanalysis_monitoringregional_monitoringindexshtml
httpwwwdroughtnoaagovindexhtml
The 10 Commandments
Of Successful Commodity TradingOf Successful Commodity Trading
IV Thou shalt not let thy emotions rule
Separate what you think from what you want
Fundamental AnalysisFundamental Analysis
bull The use of information regarding the factors of supply and demand for a given commodity to formulate a price estimate
Price Estimation using Demand d S land Supply
SupplyP Supply
New Supply
P
Old Price
New Price
DemandNew Demand
New Price
Q
Wh d thi tt Why does this matter
bull Price changes due to changes in demand are usually sustained for longer periods of time
bull Price changes due to changes in supply are usually short livedsupply are usually short lived
Schematic Representation of the US Grain Marketp
B S k E di St k
Factors of Supply = Factors of Demand
Grain
Beg Stocks Ending Stocks
GrainPrice
Imports Exports
Production Domestic Use
Area
Yield
Returns from Competing
Crops
Corn US SupplyDemand (million bushels)pp y ( )
200506 200607 200708 200809 200910SupplyBeginning Stks 2114 1967 1304 1624 1673Beginning StksProduction
211411114
196710531
130413038
162412101
167313151
Total Supply 13237 12510 14362 13739 14834DisappearanceDisappearanceDomestic UseExports
91362134
90812125
103002437
102071858
110202050
T l U 11 270 11 207 12 737 12 065 13 070Total Use 11270 11207 12737 12065 13070
Ending StksCarryoverUse ()
19671745
13041164
16241275
16741387
17641350
11210
Avg Farm Price 200 304 420 406 370
US Corn UseUS Corn Use
7 000
Million bushels
5000 6000 7000
Feed and Residual
2 0003000 4000
Ethanol
0 1000 2000
7 9 1 3 5 7 9
Exports
Food Seed and Other
9697
9899
0001
0203
0405
0607
0809
Industrial
Source USDA revised 11210
US Corn Supply and DemandMil bu
11210
Stock to Use RatioStock to Use Ratio
bull The stock to use ratio is a convenient measure of supply and demand interrelationships of commodities
bull The stocks to use ratio indicates the level of carryover stock for a given commodity as a percentage of the total demand or use
Stocks to Use RatioStocks to Use Ratio
M th ti l f l f thi l ti hiMathematical formula for this relationship
Ending Stocks = Beg Stocks + Production +Ending Stocks = Beg Stocks + Production + Imports ndash Domestic Use ndash Exports
Total Use = Domestic Use + Exports
St k t U E di St k T t l UStocks to Use = Ending Stocks divide Total Use
Multiply by 100 to express as a percentageMultiply by 100 to express as a percentage
Season Average Corn Price vs US Ending Stocks-to-Useg196980 ndash 200910
45 70
3 0
35
40
50
60Average Price
2 025
30
$B
u
30
40
Perc
ent
10
15
20
20
30 P
00
05
69 71 73 75 77 79 81 83 85 87 89 91 93 95 97 99 01 03 05 07 090
10US Ending Stks-to-Use
121009
69 71 73 75 77 79 81 83 85 87 89 91 93 95 97 99 01 03 05 07 09
SAFP to 5-yr avg Stocks to U R tiUse Ratio
500 1011
$bu
3 50
400
45008090708
0910
y = 17132x-0221
Rsup2 = 02755250
300
350
100
150
200
Y = -00887X + 03579R2 = 0 629
000
050
0 0 2 0 4 0 6 0 8
R2 = 0629
0 02 04 06 08
U S Corn Crop ConditionUS Corn Crop Condition
1507 1539 1604
China Net Trade000 MT
10000
20000
Exports
‐10000
0
‐30000
‐20000Imports
‐50000
‐40000
‐60000
Coarse Grain Wheat Soybeans Rice
Source USDA and FAPRI
US Corn Supply and Demand 11210mil bu
US Corn Stocks All Positions000 bu
NASS report date 11210
World Per Capita Grain UseWorld Per Capita Grain Usekg
corn barley sorghum rye oats millet mixed grains wheat rice121009
World Per Capita ConsumptionKg
Yr to Yr 10-yr
+18
-0-0
-0
+22
Updated 121009
World Corn Days of Use on Hand
11210
Food versus FuelFood versus Fuel
2007 US Biofuel Mandates Billi llBillion gallons
Source FAPRI and RFA
Break even price of Corn for Eth lEthanol
Y=3x-162
Long-Run Impact of Corn-Based Ethanol on the Grain Oilseed and Livestock Sectors A Preliminary Assessment TheAmani Elobeid Simla Tokgoz Dermot J Hayes Bruce A Babcock Chad E Hart[06-BP 49]
Ethanol Returns
Cattle CrushCattle Crush$head
Global Economic GrowthGlobal economic growth is being driven by developing nations
810
e
Real GDP Growth 1980 - 2010
246
nt C
hang
e
-4-20
1980
1982
1984
1986
1988
1990
1992
1994
1996
1998
2000
2002
2004
2006
2008
2010
Perc
en
-6Advanced Economies Emerging and Developing Economies
World Change in Crude OilWorld Change in Crude Oil
Source httpwwwimforgexternaldatamapperindexphp
World Liquid Fuel ConsumptionMillion barrels per day
Energy Information Administration Short-term Energy Outlook December 2009
US Stocks of Crude Oil and P t l P d tPetroleum Products
Weekly Petroleum Status Report Energy Information Administration December 25 2009
Crude Oil and Natural Gas N b F t P iNearby Futures Prices
Outside MarketsDollar Crude OilDollar Crude Oil
C Eth lCopper Ethanol
Wheat Corn and Soybeans Speculative Investment
Net long contracts centbu
Source CFTC released 11210
Corn Speculative Investment
Net Long Contracts centbu
Anhydrous Ammonia Prices$t$ton
April Prices USDA
Bushels of Corn to buy 1 ton of A h d A iAnhydrous Ammonia
Soybean Harvested AcresSoybean Harvested Acresmillion acres
Yield per acre is very similar asymp 42 bushels
2010 SoybeanCorn Price Ratio(weekly average closing prices)(weekly average closing prices)
0809 0910 1011Planted Acreage (Mil Acs) 860 865 900Harvested Acreage (Mil Acs)Yield (Bushels)
7861539
7961652
8161575
Supply - - - Million Bushels - - -
US CornBeginning StocksProductionImports
162412092
14
167313151
10
176412855
10
SampD
pTotal Supply 13729 14834 14619Disappearance
Feed and Residual 5 246 5 550 5 600
January 12 2010
Feed and ResidualFood Seed amp IndustrialExports
524649531858
555054702050
560057252100
T t l U 12 056 13 070 13 425Total Use 12056 13070 13425Ending Stocks 1673 1764 1194CarryoverUse () 139 135 89Average Farm Price ($Bu) 406 370 444Closing Price Dec Futures 360 392 444
Marketing PhilosophiesMarketing Philosophies
R d Aibull Ready Aim Aim Aim Aim Aim helliphelliphellip
bull Ready Fire AimAim
The man who insists on seeing with gperfect clearness before he decides never decidesHenri-Freacutedeacuteric Amiel
3
The Ethanol Industry
The Future of the Ethanol Industry
Presented Byy
Dr Steve AmossonRegents FellowgProfessor and Extension Economist
Presentation OutlinePresentation OutlineHow We Got Where We AreHow We Got Where We AreCurrent Status of EthanolC t d R t f Eth lCost and Returns of EthanolEthanol in the High PlainsCellulosic Ethanol Time LineSummary and Conclusionsy
Complex Economic Relationships
Bioenergy Success or Failure Depends
Complex Economic Relationships
Bioenergy Success or Failure Depends on
Oil indash Oil pricesndash Processing coststechnology
R l ti f d t k tndash Relative feedstock costsndash Demand for the biofuelsndash Technology improvementsndash Government Policy
Ethanolt a ol
E85ndash Motor fuel blend of 85
ethanol and 15 gasoline
E10ndash Motor fuel blend of 10 ethanol and
90 gasoline
Currently primarily comes from corn y p y but any grain crop will work
Largely due to Government policies ethanol production grew from about 62 million gallons in 1976grew from about 62 million gallons in 1976
to over 2 billion gallons in 2002Surface Transportation
2500
Million gallons
Energy Tax Actof 1978 gaveethanol a $040gal
Assistance Act of 1983 increased ethanol tax exemption to $050gal and the blenderrsquos income tax credit to $050gal
MTBE discovered inCalifornia drinking waterin 1998
1500
2000g
credit on the Federalmotor fuels tax Regulations under the
Clean Air Act Amendments of 1990started in 1992Blenderrsquos
Income tax dit f
RFG beginsin 1995
500
1000
Tax Reform Act of 1984increased ethanol taxexemption to $060gal and the blenderrsquos income tax credit to
In 1999 CaliforniaGovernor banned MTBEby 1203
credit of$040gal
Energy policy Act of 1992 applied ethanoltax credits to lower blends
0
1976
1978
1980
1982
1984
1986
1988
1990
1992
1994
1996
1998
2000
2002
blender s income tax credit to $060gal
tax credits to lower blends
Source US Energy Information Administration and USDA ERS
EthanolBasic Facts
Currently one bushel of corn produces 28 gallons of ethanol overall 275g By Productsndash 17 75 lbs of distillers dried grainndash 1775 lbs of distillers dried grainndash CO2
Figure 3
Total 11693 mil Bu
E h l P d iEthanol ProductionndashJanuary 2009 Est
Status Plants Capacityp y(Billions of Gallons)
Operating 193 1274
Under Construction 20 204
213 1478
US Average Regular Gas and Ethanol Prices Monthly 1991 ndash 2006
35
4
2
25
3
allo
n
Ethanol
1
15
2
$G
a
Reg Gas
0
05
991992
993994
995996
997998
999000
001002
003004
005006
19911992
19931994
19951996
19971998
19992000
20012002
20032004
20052006
Source Renewable Fuels Association
Ethanol PricesRelative to Unleaded Gas
Time Price Relationship
lsquo82 ndash lsquo05 Premium Basis
2006 +$64
Aug lsquo07 +$10
Oct rsquo07 $ 45Oct 07 -$45
Jan lsquo09 +$ 54Jan 09 +$54
US Ethanol Situation-Spring lsquo09 2nd L t fi i b k t2nd Largest firm in bankruptcy5-8 more in bankruptcy24 28 f l ti l t idl d24-28 formerly operating plants idled Several completed or nearly complete plants delay opening
Returns near break-evenSevere loss in asset valuesGovt Mandates support corn processing demand near current level -- ldquoblending wallrdquo issueIdle operating capacity 135-150 mil tons cornIdle plants =14-18 of capacity
Ethanol Plant Operating MarginsOperating Margins
Natrsquol Gas
Profit
Corn
Profit
I donrsquot particularly see anyone outside the ethanol industry trying to get into the industry now That would be like running into a burning barnmdashSander Cohen industry analyst
Bellwether MarketBellwether MarketCorn $bu
Crude $bbl
Statistician A man who believes figures dont lie but admits that under analysis some of them wont stand up either ndash Evan Esar
40109 updated 5609
July lsquo10 crude oil
July rsquo10 corn5609
y 40109
July rsquo10 crude 5609
$barrel
Spot Crude20909
July 2010 $6165 brings corn near
$480bu
Proposed amp Initiated Ethanol Plants and Their Grain Requirement
Ethanol Capacity Million
Corn Required Million Corn Acres
and Their Grain Requirement
Location Company Million galyr
Million bushels
Corn Acres Required
Levelland LevellandHockey 40 148 76365Muleshoe Panda Energy 100 37 0 190 913Muleshoe Panda Energy 100 370 190913Plainview White Energy 100 370 190913Hereford Panda Energy 100 370 190913H f d Whit E 100 37 0 190 913Hereford White Energy 100 370 190913Dumas Pan Ener of Dumas 30 111 57274Stratford Panda Energy 100 370 190913Total 570 2111 108820227 gallons of ethanol produced from a bushel of corn194 buacre base on TASS 2005
Energy BillEnergy BillSigned into law 121907Requires 36 billion gallons of ethanol use by 2022yMandates that 21 of the 36 billion gallons come from feedstocks othergallons come from feedstocks other than corn
Renewable Fuels Standard MandateRenewable Fuels Standard MandateEnacted under the Clean Air Act ndash Applies to bl dblendersEPA is the Enforcement AgencyStandard calculated for the year in November based on previous 12 months gas use
C l l d i l b indash Calculated on a national basisndash 111 billion gallons of ethanolndash 2009 ndash 1021 must be RF
The larger volume blenders would be impacted less
RFS Mandate PenaltiesRFS Mandate PenaltiesReturn ill begotten gainsReturn ill begotten gainsPlus $25000 fine per day or $9 125 000$9125000yrTechnically-If out of compliance for a y pday could be considered out of compliance for the year-EPArsquos discretionp y
2007 US Biofuel Mandates Billion gallonsf Billion gallons
Source FAPRI and RFA
Applicable volume of
Calendar Year
renewable fuel (in billions of gallons)
2006 402007 4 72007 472008 902009 1112010 12952011 13952012 1522013 16552014 18 152014 18152015 2052016 22252017 2402018 2602019 2802020 3002021 33 02021 3302022 360
Source High Plains Journal 010708
Renewable Fuel StandardsEthanol-Corn Use
Year Renewable Fuel Billing of Gallons
Corn ReqBilling of Bushels
Net Even Req Billing of bushels
2008 90 321 220
2009 111 396 271
2010 1295 463 316
2011 1395 498 340
2012 152 543 371
Assumes 28 galbushel and 1775 lbs of DGrsquos produced
Distillerrsquos GrainDistiller s Grain2009 2010
Corn for Eth l (b ) 3 964 000 4 62 000Ethanol (bu) 3964000 4625000Distillers Grain (bu) 1257000 1466000N t CNet Corn Use (bu) 2707000 3159000
P blProblem
BiBiggerggProblemProblem
ldquoI have established a goal to have 60 billion
gallons of our fuel comefrom sustainable
affordable biofuelsin 2022helliprdquo
Biofuels grow but fall short of the 36 billion gallon RFS target in 2022 exceed it in 2035
billion gallon-equivalents
45 R bl
35
40
45 Legislated RFS in 2022
RFS with Biomass-to-
liquids
Renewable diesel
20
25
30 adjustments under CAA Sec211(o)(7) Biodiesel
Oth
q
Net ethanol imports
10
15
20 Other feedstocks Cellulosic
ethanol
0
5
2008 2022 2022 in 2035
Corn ethanol
Richard Newell SAIS December 14 2009 29
2008 2022 2022 inAEO2009
2035
Source Annual Energy Outlook 2010
Ethanol Blend AnnouncementEthanol Blend Announcement
The announcement was made onDec 1 which was the deadline forEPA to respond to a request fromp qethanol producers who want theblend limit raised from the currentblend limit raised from the current10 to 15
Blending Wall for EthanolBlending Wall for Ethanol
Federal standards set the maximum of ethanolFederal standards set the maximum of ethanol blending at 10 of the total gas supply - -Additional to E85Concerns over vehicle ability to use it mileage and transportation infrastructureCurrent annual fuel consumption in the US about 130 ndash 140 billion gallonsCurrently blending wall is estimated at 12 13Currently blending wall is estimated at 12 ndash 13 billion gallons of ethanol
Blending Wall ObservationsBlending Wall - Observations
B il h b i hi h bl d t (E20Brazil has been using higher blend rates (E20 ndashE30) without any problemsLong term need to modify production processesLong term - - need to modify production processes or product (butanol)Short term solution Raise blending limit to E12Short term solution - - Raise blending limit to E12 or E15 or E20Long term problem - - increased pressure onLong term problem increased pressure on ethanol prices due to added production (cellulosic)
SteversquosSteve s Crystal BallCrystal Ball
Whatrsquos coming in the
Wi dS l Stfuture
WindSolar StorageImproved Electric CarsImproved Electric CarsAlgae OilH-H-OTh A M bilThe Amosson Mobile
Summary and ConclusionsyShort Run
E d d h l d i iExpanded ethanol production is probably a given however the pace is expected to slow do to capacity and policyp yThe President Elect and Secretary of Ag are big supporters of Renewable Fuelsare big supporters of Renewable FuelsCurrent Ethanol Margins have turned
i ipositive
Summary and ConclusionsSummary and Conclusions
Ethanol Production is and will suffer fromEthanol Production is and will suffer from growing painsndash Demand amp SupplyDemand amp Supply
DDG prices will be falling (relatively) making them attractive for livestock rationsThe limit on corn based ethanol and the growth in yields will eventually cap corn prices in the LRBl di ll d ll l i d i illBlending wall and cellulosic production will become a problem in the future for corn based ethanolethanol
Educational programs of Texas AgriLife Extension Service are open to all people without regard to race color sexare open to all people without regard to race color sex
disability religion age or national origin
4
Corn amp Sorghum Basis
Information
BasisMarketing Plan Seminar
Mark WelchmdashGrain Marketing EconomistJanuary 20 2010
Improving Lives Improving Texas
BasisBasis
bull The amount that the local cash price of a commodity is above or below the futures price for a pparticular month
bull Impacted by transportation costsImpacted by transportation costs storage and handling interest charges supply and demandcharges supply and demand fundamentals
(basis = cash - futures)(basis = cash - futures)
Corn Prices in the Triangle A F t C h B iArea Futures Cash Basis
600
400
500
200
300
(1 00)
000
100
(100)
basis cash futures
Sorghum Prices North of the C di C F t C h B iCanadian Corn Futures Cash Basis600
400
500
200
300
000
100
-100
Basis Corn Futures Cash
Basis
bull Basis exists mainly because of carrying y y gcharge arbitrage between futures and cash markets and transportation costsndash The carrying charge exists because stored
commodities are harvested and stored one time each year There are financingtime each year There are financing storage and management cost associated with carrying charge
ndash Because of carrying charge it is likely that the deferred futures price will be higher than cash price or basis with a negative p gsign will exist during harvest
BasisBasis
bull Transportation costs also affect the local basis The grain handler receives a bid from buyer determines the transportation cost to deliver the grain and subtract that cost from the price bid to determine the local price paid to the farmer
BasisBasis
bull Basis may also serve as a barometer of market strength or weakness
bull Improving basis is a sign of underlying strength in market demand
bull Declining basis is a sign of weak demanddemand
BasisBasis
bull There are times when the formula generates a basis with a positive sign
bull This denotes that the cash price is higher than futures price or cash pricehigher than futures price or cash price is selling at a premium to the futures
bull This occurs because supplydemandThis occurs because supplydemand relationships in the local cash market is different from futures market The local
l f i i th k t bsupply of grain in the market may be limited relative to demand or demand may be relatively higher than supply inmay be relatively higher than supply in the local market
Basis
bull The observed basis is termed asThe observed basis is termed as strong when the present basis is more positive or less negativemore positive or less negative than the historic average basis
For example assume that thendash For example assume that the average basis for a hypothetical market is -$035 per bushel The $ ppresent basis is -$010
ndash Therefore present basis is strong p grelative to the historic average
Basis
bull Similarly the observed basis isSimilarly the observed basis is termed as weak when the present basis is less positive or morebasis is less positive or more negative than the historic averagendash For example assume that theFor example assume that the
average basis for a hypothetical market is -$035 per bushel The present basis is -$045
ndash Therefore present basis is weak relative to the historic average
BasisCash Price ndash Futures Price = Basisbull Is the relationship between a local cash market and theIs the relationship between a local cash market and the
futures market
bull Can be negative or positiveCan be negative or positive
bull Is more stable than cash or futures prices
Basis Componentsbull Storage (insurance and interest)
bull Transportation
bull Local supply and demand
The Role of Basis in Hedgingg gBasis describes the price relationship between cash market prices and futures market prices at a particular time and location Basis is the number of cents (dollars) per unit that the local cash price of a commodity is above or below the current priceper unit that the local cash price of a commodity is above or below the current price for a particular futures contract delivery month on a given day Thus basis is the cash market price minus the futures market price at a specific time
Basis is important yet often the least understood concept in hedging agricultural p y p g g gcommodities An understanding and an accurate estimate of basis is needed by farmers and rancher who want to include hedging as part of their pricing strategy
Basis is important because approximately 97 percent of all agricultural commodities traded in the futures market are offset before delivery Therefore because the actualtraded in the futures market are offset before delivery Therefore because the actual physical commodity is mostly sold on the cash market the hedged futures price will not be the realized price for the commodity An estimate of that price can be calculated using the basis
A knowledge of the local basis is necessary to translate a given futures price into probable effective price for local delivery The futures price plus the expected basis (with appropriate arithmetic sign) is an estimate of the price the futures market is offering for the commodity delivered to the local market during a particular month Remember the basis is cash minus futures Therefore when the basis is negative gthe futures price is reduced by the amount of the basis When the basis is positive the futures price is increased by the basis value
Market CarryNormal Market
Sept
July $235
Sept $238
Mar
May $222
Dec $200
$212
Market CarryInverted Market
Dec $3 26
May $306
Mar $311
$326
Sept
July $299
$280
Basis and Expected PriceBasis and Expected Pricebull Knowledge of local basis is
t t l t inecessary to translate a given futures price into a probable price f l l d lifor local delivery
bull The futures price adjusted for basis is the price the market is offering for your grain delivered at a local elevator during a particular month(expected price = futures + basis)( p p )
Expected Price -$050 basisExpected Price $050 basis
5 1
49
51
45
47
Cash
4 1
43
39
41
450 460 470 480 490 500 510 520 530 540 550
December Futures
Texas Corn Basis in Oct vs Dec Contract Hi h L A (2005 09)High Low Average (2005-09)
North of the
0 30
040
0 30
040Canadian Triangle Area South of Line
0 10
020
030
0 10
020
030
0 10
000
010
0 10
000
010
0 30
-020
-010
0 30
-020
-010
Oct 2010 -030-030
Source httpmastermarketertamuedu
Basis Tracking FormBasis Table
Commodity LocationNearby Futures Contract Harvest Delivery
CashFutures Contract
Futures Contract
Forward Cash
Contract
Harvest Contract Futures Implied
Basis Contract
Date Price Month Price Basis Offer Price Basis Offer
Basis Corn North of the C diCanadian
Basis Sorghum North of the C diCanadian
Basis Expected Harvest Basis
Expected Mar 1 Basis
Expected May 1 BasisExpected May 1 Basis
If short crop basis will
If large crop basis will
StrategiesStrategies
NOTES

1
Marketing Plan amp
Break Even Prices
Developing and Implementing a S f l M k i PlSuccessful Marketing Plan
Presented By
Dr Steve AmossonDr Steve AmossonRegents Fellow
Professor and Extension Economist
Developing and Implementing the Farm Marketing PlanFarm Marketing PlanThe Ten Steps to Success
Identify short and long term goalsy g gEstablish production estimatesCalculate breakeven and profit price goalsAssess cash-flow needs and Quantify price risk
you are willing to assume Identify who is responsible for decision makingIdentify who is responsible for decision makingKnow the market and market outlook Identify the marketing tools to be used Invest time and money to do it rightRevise and Review marketing plan as conditions
warrantwarrantMaintain Discipline
Production Estimates
Grain ndash Total bushels Grain Total bushels 5 year Average YieldsOn Farm Storageg Production Availability
Livestock ndash Animals to MarketDates (months) and weights to MarketRetained marketing alternatives
Know Your Production Costs
PER ACRE TOTALSeed $ 9000 $ 1350000 Enterprise
F tili $ 77 00 $ 141 000 00Fertilizer $ 7700 $ 14100000 breakeven
Chemicals $ 6700 $ 13050000 for 1500 acres of
Harvest and Haul $ 5500 $ 13200000 corn would be
Irrigation Fuel $ 183 00 $ 202 000 00Irrigation Fuel $ 18300 $ 20200000Allocated direct costs $ 13100 $ 16000000
(Fuels repairs interest)
Allocated overhead $ 1000 $ 5250000
If your yield is 225 bushels per acre your breakeven costs are $3 32 per bushel
(Services accounting insurance utilities)
Land $ 9000 $ 16500000TOTAL $ 66400 $ 111900000
From Your Production RecordsLow Corn Yield 200 Bushels Per Acre
If your yield is 225 bushels per acre your breakeven costs are $332 per bushel
Average Corn Yield 225 Bushels per Acre
High Corn Yield 250 Bushels Per Acre
Knowing All Your Costs
Total estimated production cost $ 111900000Plus
F il li i $ 65 000 00Family living expenses $ 6500000Plus
Annual debt service $ 5000000Minus
AMTA (f ) t $ 45 000 00AMTA (farm program) payments $ 4500000Total Cash Expenditures $ 118900000
PlusDepreciation (beyond payments) $ 6000000
$Total cashnon-cash expenses $ 124900000Plus
Profit andor growth capital $ 10000000Salesgross income objective $ 134900000
How do you determine your Growth Capital Goal
ROI ndash Return on Investment
ROE ndash Return on Equity
ROA ndash Return on Assets
Price Goals
Set GoalsCosts of production FamilyLiving expenses Profit margin desired Profit margin desired Projected growth of operation
Write Them DownStudy ThemShare them with
spousepartnerbanker
Calculating Breakeven Prices
Low Production
Average Production
High ProductionProduction Production Production
BushelsA 200 225 250Total Bushels 300000 337500 375000
Cash Expenses 1174375 1189000 1203625BEP - CE $391 $352 $321
Total Expenses 1234375 1249000 1263625BEP - TE $411 $370 $337
Total Expenses + ProfitGrowth 1334375 1349000 1363625
BEP TEP $4 45 $4 00 $3 64BEP - TEP $445 $400 $364
Determine the amount of risk yoursquore willing to takey g
Leverage
Debt structure
Age
Off-farm income
C h fl d bli tiCash flow needsobligations
On farm storageOn farm storage
Projected Marketing ScheduleCommodity Jan Feb Mar Apr May Jun Jul Aug Sep Oct Nov Dec CO
Corn
Soybeans
Wheat
Milo
Others
Payments
LandLand
Leases
Machinery
Market Outlook
Political SituationFundamental SituationSupplyDemandDemand
Marketing Psychology
SeasonalityCycles
Technical SituationTechnical Situation
Fundamentals2007 Feedgrains EWAG Analysisg y
Low Average HighPlanted Acres (mil AC) 870 870 870Harvested Acres Planted Acres () 88 00 90 45 90 50Harvested Acres Planted Acres () 8800 9045 9050Harvested Acres (mil AC) 7656 7869 7874Yield (BUAC) 1406 1520 1672Production (mil BU) 10764 11961 13164Imports (mil BU) 10 10 10Carry In (mil BU) 935 935 935Total Supply (mil BU) 11709 12906 14109USEUSEFeed (mil BU) 5600 5900 6100Food Seed and Industrial (mil BU) 4250 4500 4750Export (mil BU) 1600 2000 2250Total Use (mil BU) 11450 12400 13100Carry Out (mil BU) 259 506 1009COUSE () 23 41 77P i ($BU) $6 60 $4 20 $2 80Price ($BU) $660 $420 $280
Notes
Pricing Alternatives
Cash Market at Harvest Speculative Storage Forward Contract Hedge to Arrive Contract Basis Contract Minimum Price Contract Hedging in Futures Marketsg g
Pre-harvest hedge Post-harvest storage hedge
Options Marketsp Pre-harvest hedge Post-harvest storage hedge
Farm Program Farm Program CooperativesGroups
Advantages amp Disadvantagesof Marketing Tools
Limited to 1000 Cash Leave Upside Margin
RiskBasis Risk
Futures Risk
Easy EntryExit
or 5000 Bushels
Delivery Required
pPotential
OpportunityCash Tools
Cash Sale N N N N N Y N2Cash Sale N N N N N Y N2
Non-Cash Tools N N N N N Y N
Basis Contract N N Y N N Y Y
Hedge-to-Arrive N1 Y N N Y Y N2g
Min Price Contract N N N N Y Y Y
Non-Cash Tools
Futures Hedge Y Y Y Y Y N N2
Buy Put N Y N Y Y N Y
Buy Call N Y N Y Y N Y
Fence Y Y Y Y Y N LY N N L Li it dY = yes N = No L = Limited
1 Depends on contract agreements2 Upside Potential limited to improvement in basis
STRATEGIES
Use More Flexible Tools Use More Flexible Tools Early sales Upper one-third of productionpp p
Allocation Sales Over Time Increase of sales as price increases Decrease of sales as price declines Consider multi-year sales in historically high
iprices
Look For Pricing OpportunitiesGrain Grain
Basis
Feedgrains Marketing Plan for 2010P re -P la n t P la n t in g to H a rv e s t (H a rv e s t P o s t H a rv e s t )
R e p o rt s to W a tc h
M a rk e ta b le P ro d u c t io n
C o n t ra c t S e a so n a lit y
P r ic e T im e T a rg e ts
M a rk e t in g T o o ls to b e U se d
M a rk e t in g S t ra te g ie s
W h a t D id I D o a n d W h y
g g
Closing CommentsgldquoAmossonrsquos Words of Wisdomrdquo
Know the difference between hedging and speculating ---- Hedging you win Hedging you win Speculating you lose
F d t l t l th l i Fundamentals control the long run price ---- Technicals control the short run price Seasonals reflect normal market psychology and need to p y gy
be factored into marketing decisions
Marketing is not a point in time but a continuous Marketing is not a point in time but a continuous activity
Breakeven Prices
Presented ByDr Steve AmossonDr Steve Amosson
Regents FellowProfessor and Extension
Economist
B k P iBreakeven Prices
Q i i V i bl C t (VC) All t f k t Quaisi Variable Cost (VC) ndash All out-of-pocket expenses associated with or assigned to the crop This includes seed fertilizer paid labor family living with-drawals land
t i t t t t tpayments equipment payments government payments etc Per Acre VC Breakeven Price = VCYield Total Cost (TC) Includes VC plus all non-cash expenses Total Cost (TC) Includes VC plus all non cash expenses
such as depreciation Per Acre TC Breakeven Price = TCYield Profit Total Cost plus a profit objective usually determined
by the goals that have been set or an independent financial measure such as return on assets
Per Acre Profit Breakeven Price = TC + Desired ProfitYield
All ti C tAllocating Costs
By Crop Acre By Crop Acre
By Capital Investment
By Time Investment
By Use
E ti ti C tEstimating CostsA l l o c a t e d
CB y C r o p
t o C r o p p e r A c r eT o t a l O u t - o f - P o c k e t P r o d u c t i o n C o s t s
O v e r h e a d C a s h E x p e n s e s P l u s
( u t i l i t i e s e t c )
F a m i l y L i v i n g E x p e n s e s
A n n u a l D e b t S e r v i c e ( l a n d
P l u s
P l u s(
e q u i p m e n t e t c
D i r e c t F a r m P r o g r a m P a y m e n t
M i n u s
T o t a l C a s h E x p e n s e s ( V C )
D e p r e c i a t i o n ( B e y o n d P y m t s )T o t a l C a s h N o n - C a s h E x p e n s e s ( e t c )
P l u s
E x p e n s e s ( e t c )
P r o f i t a n d o r G r o w t h C a p i t a lS a l e s G r o s s I n c o m e O b j e c t i v e
P l u s
B k P iBreakeven Prices
Yield Scenarios
Low Average High
YieldYield
Variable Cost
BEP‐VC
BEP‐VC+FC
Variable+Fixed Cost (VC+FC)
VC+FC+Profit (TC)VC+FC+Profit (TC)
BEP‐TC
Closing Comments (continued)g
Use only the marketing tools you are comfortable with ---- Know them inside out
Futures price and basis are separate items ----Know both and market both
Marketing is like playing baseball sometimes you get a hit and sometimes you donrsquot -- Itrsquos the relative percentage thatrsquos importantp g p
The key to being a good marketer is have a solid marketing plan and the discipline to execute it
2010 Marketing Plan SummaryF u n d a m e n t a l s N o t e s S h o r t C r o p P r ic e = A v e r a g e C r o p P r ic e = L a r g e C r o p P r i c e =
B a s i s N o t e s S t r o n g B a s is A v e r a g e B a s is W e a k B a s is
C a s h M a r k e t A l t e r n a t i v e s N o t e s 11 2 3
W h a t I n e e d t o l e a r n H o w a n d w h e n a m I g o i n g t o d o i t 1 22 3
G o a l s S h o r t - T e r m G o a l s L o n g - T e r m1 1 2 2 3 33 3
L o w Y i e l d H i g h Y i e l dV a r ia b le C o s t ( V C )
V C + F ix e d C o s t ( F C )
A v e r a g e Y i e l dB r e a k e v e n s
V C + F ix e d C o s t ( F C )
V C + F C + P r o f i t
Pre‐Plant Planting to Harvest (HarvestPost Harvest)
Reports to Watch
Marketable Production
Contract Season
PriceTime Targets
Marketing Tools to be Used
Marketing Strategies
What Did I Do and Why
Feedgrains Marketing Plan for 2010
Pre‐Plant Planting to Harvest HarvestPost Harvest
Reports to Watch
Planting Intentions (PI) Report (March 31) PI Industry Reports starting early March Soil Moisture Conditions httpwwwusdagovnasspubsstaterpthtm ‐ NASS Crop Weather WASDE and other USDA reports Ethanol Industry Reports EIAISU
Crop conditionsprogress reports from NASS Crop Weather and httpwwwextensioniastateeduinformationweatherhtml ‐ Elwynn Taylor (Iowa State) WASDE and other USDA reports especially August Crop Report Ethanol Industry Reports EIAISU
WASDE and other USDA reports
Marketable Production 7525 ‐ 75 depending on pre‐plant sales with total pre‐harvest sales not to exceed 100
Remainder of unsold production
Contract Seasonality
First Seasonality price opportunity is normally early to the middle of March Followed by the first half of April Next opportunity earlymid June If normal crop prices tend to fall into harvest
Next Seasonal sale indicator is early to mid JuneSeasonal low is usually hit in September or early October
PriceTime Targets
Split the range ie start marketing at $440 (double first sale) incrementally market to $475 until 75 of crop is marketed Can fine tune selling with technical indicators (moving ave etc)
Continue scale up sales if market is trending up Sell at least 50 by mid June time frame on down trends and remainder of pre harvest sales on downtrend in July to August
Sell remainder at harvest across the scales unless you have tax concerns but to evaluate storage costs carefully before holding grain
Marketing Tools to be Used
Forward contract at least first half if not all of pre plant sales If you decide to use options consider collar window or FC ‐ Bull call spread to limit cost Consider basis contracts on un‐priced production up to 75 of total because of inc supplies
Options due to market volatility and likelihood of major up and down trends developing If forward cash sales hedges or options depending on your risk tolerance If you are pricing the last 25 of production definitely use optionsoption strategies such as a collar window or bear put spread
Cash Sales Call options strategies such as bull call spread can be used to re‐own grain if desired
Marketing Strategies
Use scale up sales based on seasonal price tendencies with moving averages and other trend indicators as marketing triggers I want to be at least 25 sold pre‐plant if at profitable levels Lock in 50 of NG (up to August) and all fertilizer ‐ NOW
Continue scale up sales based on seasonal tendencies and price trend indicators as sales triggers Need to be at least 50 marketed by the middle of June with a goal of being 100 if the weather appears normal and at profitable levels before harvest
If prices appear likely to move higher after harvest sell grain and buy calls
What Did I Do amp Why
Feedgrains Marketing Plan for 20102011Preseason Price Forecast = $405Contract Price Range $360‐$475
Collar or Three‐Way
Action Buy a put at the money sell out‐upsell out up
The money put and callExample 2010 Dec CornExample 2010 Dec Corn
Buy 400 put 43 38Sell 350 put 20 frac34Sell 500 call 20 frac12
Out‐of‐Pocket Cost
4 00 Put(B) 43 38400 Put(B) 43 38350 Put(S) ‐20 frac34500 Call(S) ‐20 frac12Commission +2 Net Cost 4 18
Assume an 0 Basis
Collar or Three‐Way (Continued)(Continued)
AdvantagesLimited up front requiredCan negate the time value of optionsProvides limited downside price protection
DisadvantagesCaps upside price potentialLimits downside price protectionPossible margin calls if price rises
When to useUncertain productionOptions premiums are highA good idea of potential price rangeA good idea of potential price rangeMarket is a profitable level or downside risk
ProblemsLimited volume in options marketLimited volume in options market
Collar or Three‐Way (Continued)(Continued)
1 What is the first price you are protected at on the downside
2 2 If the price falls lower than the put that you sold what is the maximum you could collect
3 3 What is the maximum price you can receive
4 4 If the Dec price ends up between $350 ‐$500 buthen what is your expected price range you will receive
Projections for Planning Purposes OnlyNot to be Used without Updating after December 15 2009
B-1241 (C1)
Table 4A Estimated costs and returns per Acre Bt Corn for Grain Sprinkler Irrigated (NG) 2010 Projected Costs and Returns per Acre_______________________________________________________________________ITEM UNIT PRICE QUANTITY AMOUNT YOUR FARM_______________________________________________________________________ dollars dollarsINCOME corn bu 430 2250000 96750 _________ --------TOTAL INCOME 96750 _________
DIRECT EXPENSES SEED seed - Bt corngr bags 25500 03500 8925 _________ INSECTICIDE miticide acre 2000 10000 2000 _________ HERBICIDE herb - corn pre acre 1960 10000 1960 _________ herb -corn post acre 2780 10000 2780 _________ FERTILIZER fert(N) - ANH3 lb 022 1260000 2772 _________ fert(P) - liquid lb 051 600000 3060 _________ fert(N) - liquid lb 032 780000 2496 _________ CUSTOM fert appl - ANH3 acre 1100 10000 1100 _________ crop consultant acre 725 10000 725 _________ harv amp haul - corn bu 039 2250000 8775 _________ CROP INSURANCE corn - irrigated acre 1930 10000 1930 _________ OPERATOR LABOR Implements hour 1080 02925 315 _________ Tractors hour 1080 03965 428 _________ HAND LABOR Implements hour 1080 01527 164 _________ IRRIGATION LABOR Center Pivot hour 1080 14080 1520 _________ DIESEL FUEL Tractors gal 205 21861 448 _________ GASOLINE Self-Propelled Eq gal 236 20100 474 _________ NATURAL GAS Center Pivot ac-in 675 220000 14850 _________ REPAIR amp MAINTENANCE Implements Acre 561 10000 561 _________ Tractors Acre 480 10000 480 _________ Self-Propelled Eq Acre 016 10000 016 _________ Center Pivot ac-in 203 220000 4466 _________ INTEREST ON OP CAP Acre 1088 10000 1088 _________ --------TOTAL DIRECT EXPENSES 61337 _________RETURNS ABOVE DIRECT EXPENSES 35412 _________
FIXED EXPENSES Implements Acre 873 10000 873 _________ Tractors Acre 689 10000 689 _________ Self-Propelled Eq Acre 024 10000 024 _________ Center Pivot Acre 3360 10000 3360 _________ --------TOTAL FIXED EXPENSES 4948 _________ --------TOTAL SPECIFIED EXPENSES 66286 _________RETURNS ABOVE TOTAL SPECIFIED EXPENSES 30463 _________
ALLOCATED COST ITEMS cash rent - corn acre 11000 10000 11000 _________RESIDUAL RETURNS 19463 ________________________________________________________________________________Projections for Planning Purposes Only1 ac-in = 1 Mcf
Information presented is prepared solely as a general guide amp not intended to recognize or predict the costs amp returns from any one operation Developed by Texas AgriLife Extension Service
215
667
80075252500
13200
57749 + 100 CASH amp RENT67749 (VC)
72697 (TC)
10000
600
035 215
72697 8 = 5816______
TOTAL 78513
2
Feedgrain
Fundamentals
Grain Market FundamentalsSupply and Demand Analysis
Mark WelchmdashGrain Marketing EconomistJanuary 19 2010
Improving Lives Improving Texas
bull ldquoWithout the runaway demandrunaway demand growth of ethanol many of the recent stories need to be rewritten in shortrewritten in short orderrdquo
bull
Michael Swanson
Pumping ethanol from corn in 1933
--Michael Swanson Economics Department Wells Fargo
httpwwwnassusdagovPublicationsindexasp
httpwwwersusdagovBriefing
httpwwwfasusdagovpsdonlinepsdHomeaspx
httpwwwfaprimissourieduindexaspcurrent_page=home
httpwww cpc ncep noaa govproductsanalysis monitoringregional monitoringindex shtmlhttpwwwcpcncepnoaagovproductsanalysis_monitoringregional_monitoringindexshtml
httpwwwdroughtnoaagovindexhtml
The 10 Commandments
Of Successful Commodity TradingOf Successful Commodity Trading
IV Thou shalt not let thy emotions rule
Separate what you think from what you want
Fundamental AnalysisFundamental Analysis
bull The use of information regarding the factors of supply and demand for a given commodity to formulate a price estimate
Price Estimation using Demand d S land Supply
SupplyP Supply
New Supply
P
Old Price
New Price
DemandNew Demand
New Price
Q
Wh d thi tt Why does this matter
bull Price changes due to changes in demand are usually sustained for longer periods of time
bull Price changes due to changes in supply are usually short livedsupply are usually short lived
Schematic Representation of the US Grain Marketp
B S k E di St k
Factors of Supply = Factors of Demand
Grain
Beg Stocks Ending Stocks
GrainPrice
Imports Exports
Production Domestic Use
Area
Yield
Returns from Competing
Crops
Corn US SupplyDemand (million bushels)pp y ( )
200506 200607 200708 200809 200910SupplyBeginning Stks 2114 1967 1304 1624 1673Beginning StksProduction
211411114
196710531
130413038
162412101
167313151
Total Supply 13237 12510 14362 13739 14834DisappearanceDisappearanceDomestic UseExports
91362134
90812125
103002437
102071858
110202050
T l U 11 270 11 207 12 737 12 065 13 070Total Use 11270 11207 12737 12065 13070
Ending StksCarryoverUse ()
19671745
13041164
16241275
16741387
17641350
11210
Avg Farm Price 200 304 420 406 370
US Corn UseUS Corn Use
7 000
Million bushels
5000 6000 7000
Feed and Residual
2 0003000 4000
Ethanol
0 1000 2000
7 9 1 3 5 7 9
Exports
Food Seed and Other
9697
9899
0001
0203
0405
0607
0809
Industrial
Source USDA revised 11210
US Corn Supply and DemandMil bu
11210
Stock to Use RatioStock to Use Ratio
bull The stock to use ratio is a convenient measure of supply and demand interrelationships of commodities
bull The stocks to use ratio indicates the level of carryover stock for a given commodity as a percentage of the total demand or use
Stocks to Use RatioStocks to Use Ratio
M th ti l f l f thi l ti hiMathematical formula for this relationship
Ending Stocks = Beg Stocks + Production +Ending Stocks = Beg Stocks + Production + Imports ndash Domestic Use ndash Exports
Total Use = Domestic Use + Exports
St k t U E di St k T t l UStocks to Use = Ending Stocks divide Total Use
Multiply by 100 to express as a percentageMultiply by 100 to express as a percentage
Season Average Corn Price vs US Ending Stocks-to-Useg196980 ndash 200910
45 70
3 0
35
40
50
60Average Price
2 025
30
$B
u
30
40
Perc
ent
10
15
20
20
30 P
00
05
69 71 73 75 77 79 81 83 85 87 89 91 93 95 97 99 01 03 05 07 090
10US Ending Stks-to-Use
121009
69 71 73 75 77 79 81 83 85 87 89 91 93 95 97 99 01 03 05 07 09
SAFP to 5-yr avg Stocks to U R tiUse Ratio
500 1011
$bu
3 50
400
45008090708
0910
y = 17132x-0221
Rsup2 = 02755250
300
350
100
150
200
Y = -00887X + 03579R2 = 0 629
000
050
0 0 2 0 4 0 6 0 8
R2 = 0629
0 02 04 06 08
U S Corn Crop ConditionUS Corn Crop Condition
1507 1539 1604
China Net Trade000 MT
10000
20000
Exports
‐10000
0
‐30000
‐20000Imports
‐50000
‐40000
‐60000
Coarse Grain Wheat Soybeans Rice
Source USDA and FAPRI
US Corn Supply and Demand 11210mil bu
US Corn Stocks All Positions000 bu
NASS report date 11210
World Per Capita Grain UseWorld Per Capita Grain Usekg
corn barley sorghum rye oats millet mixed grains wheat rice121009
World Per Capita ConsumptionKg
Yr to Yr 10-yr
+18
-0-0
-0
+22
Updated 121009
World Corn Days of Use on Hand
11210
Food versus FuelFood versus Fuel
2007 US Biofuel Mandates Billi llBillion gallons
Source FAPRI and RFA
Break even price of Corn for Eth lEthanol
Y=3x-162
Long-Run Impact of Corn-Based Ethanol on the Grain Oilseed and Livestock Sectors A Preliminary Assessment TheAmani Elobeid Simla Tokgoz Dermot J Hayes Bruce A Babcock Chad E Hart[06-BP 49]
Ethanol Returns
Cattle CrushCattle Crush$head
Global Economic GrowthGlobal economic growth is being driven by developing nations
810
e
Real GDP Growth 1980 - 2010
246
nt C
hang
e
-4-20
1980
1982
1984
1986
1988
1990
1992
1994
1996
1998
2000
2002
2004
2006
2008
2010
Perc
en
-6Advanced Economies Emerging and Developing Economies
World Change in Crude OilWorld Change in Crude Oil
Source httpwwwimforgexternaldatamapperindexphp
World Liquid Fuel ConsumptionMillion barrels per day
Energy Information Administration Short-term Energy Outlook December 2009
US Stocks of Crude Oil and P t l P d tPetroleum Products
Weekly Petroleum Status Report Energy Information Administration December 25 2009
Crude Oil and Natural Gas N b F t P iNearby Futures Prices
Outside MarketsDollar Crude OilDollar Crude Oil
C Eth lCopper Ethanol
Wheat Corn and Soybeans Speculative Investment
Net long contracts centbu
Source CFTC released 11210
Corn Speculative Investment
Net Long Contracts centbu
Anhydrous Ammonia Prices$t$ton
April Prices USDA
Bushels of Corn to buy 1 ton of A h d A iAnhydrous Ammonia
Soybean Harvested AcresSoybean Harvested Acresmillion acres
Yield per acre is very similar asymp 42 bushels
2010 SoybeanCorn Price Ratio(weekly average closing prices)(weekly average closing prices)
0809 0910 1011Planted Acreage (Mil Acs) 860 865 900Harvested Acreage (Mil Acs)Yield (Bushels)
7861539
7961652
8161575
Supply - - - Million Bushels - - -
US CornBeginning StocksProductionImports
162412092
14
167313151
10
176412855
10
SampD
pTotal Supply 13729 14834 14619Disappearance
Feed and Residual 5 246 5 550 5 600
January 12 2010
Feed and ResidualFood Seed amp IndustrialExports
524649531858
555054702050
560057252100
T t l U 12 056 13 070 13 425Total Use 12056 13070 13425Ending Stocks 1673 1764 1194CarryoverUse () 139 135 89Average Farm Price ($Bu) 406 370 444Closing Price Dec Futures 360 392 444
Marketing PhilosophiesMarketing Philosophies
R d Aibull Ready Aim Aim Aim Aim Aim helliphelliphellip
bull Ready Fire AimAim
The man who insists on seeing with gperfect clearness before he decides never decidesHenri-Freacutedeacuteric Amiel
3
The Ethanol Industry
The Future of the Ethanol Industry
Presented Byy
Dr Steve AmossonRegents FellowgProfessor and Extension Economist
Presentation OutlinePresentation OutlineHow We Got Where We AreHow We Got Where We AreCurrent Status of EthanolC t d R t f Eth lCost and Returns of EthanolEthanol in the High PlainsCellulosic Ethanol Time LineSummary and Conclusionsy
Complex Economic Relationships
Bioenergy Success or Failure Depends
Complex Economic Relationships
Bioenergy Success or Failure Depends on
Oil indash Oil pricesndash Processing coststechnology
R l ti f d t k tndash Relative feedstock costsndash Demand for the biofuelsndash Technology improvementsndash Government Policy
Ethanolt a ol
E85ndash Motor fuel blend of 85
ethanol and 15 gasoline
E10ndash Motor fuel blend of 10 ethanol and
90 gasoline
Currently primarily comes from corn y p y but any grain crop will work
Largely due to Government policies ethanol production grew from about 62 million gallons in 1976grew from about 62 million gallons in 1976
to over 2 billion gallons in 2002Surface Transportation
2500
Million gallons
Energy Tax Actof 1978 gaveethanol a $040gal
Assistance Act of 1983 increased ethanol tax exemption to $050gal and the blenderrsquos income tax credit to $050gal
MTBE discovered inCalifornia drinking waterin 1998
1500
2000g
credit on the Federalmotor fuels tax Regulations under the
Clean Air Act Amendments of 1990started in 1992Blenderrsquos
Income tax dit f
RFG beginsin 1995
500
1000
Tax Reform Act of 1984increased ethanol taxexemption to $060gal and the blenderrsquos income tax credit to
In 1999 CaliforniaGovernor banned MTBEby 1203
credit of$040gal
Energy policy Act of 1992 applied ethanoltax credits to lower blends
0
1976
1978
1980
1982
1984
1986
1988
1990
1992
1994
1996
1998
2000
2002
blender s income tax credit to $060gal
tax credits to lower blends
Source US Energy Information Administration and USDA ERS
EthanolBasic Facts
Currently one bushel of corn produces 28 gallons of ethanol overall 275g By Productsndash 17 75 lbs of distillers dried grainndash 1775 lbs of distillers dried grainndash CO2
Figure 3
Total 11693 mil Bu
E h l P d iEthanol ProductionndashJanuary 2009 Est
Status Plants Capacityp y(Billions of Gallons)
Operating 193 1274
Under Construction 20 204
213 1478
US Average Regular Gas and Ethanol Prices Monthly 1991 ndash 2006
35
4
2
25
3
allo
n
Ethanol
1
15
2
$G
a
Reg Gas
0
05
991992
993994
995996
997998
999000
001002
003004
005006
19911992
19931994
19951996
19971998
19992000
20012002
20032004
20052006
Source Renewable Fuels Association
Ethanol PricesRelative to Unleaded Gas
Time Price Relationship
lsquo82 ndash lsquo05 Premium Basis
2006 +$64
Aug lsquo07 +$10
Oct rsquo07 $ 45Oct 07 -$45
Jan lsquo09 +$ 54Jan 09 +$54
US Ethanol Situation-Spring lsquo09 2nd L t fi i b k t2nd Largest firm in bankruptcy5-8 more in bankruptcy24 28 f l ti l t idl d24-28 formerly operating plants idled Several completed or nearly complete plants delay opening
Returns near break-evenSevere loss in asset valuesGovt Mandates support corn processing demand near current level -- ldquoblending wallrdquo issueIdle operating capacity 135-150 mil tons cornIdle plants =14-18 of capacity
Ethanol Plant Operating MarginsOperating Margins
Natrsquol Gas
Profit
Corn
Profit
I donrsquot particularly see anyone outside the ethanol industry trying to get into the industry now That would be like running into a burning barnmdashSander Cohen industry analyst
Bellwether MarketBellwether MarketCorn $bu
Crude $bbl
Statistician A man who believes figures dont lie but admits that under analysis some of them wont stand up either ndash Evan Esar
40109 updated 5609
July lsquo10 crude oil
July rsquo10 corn5609
y 40109
July rsquo10 crude 5609
$barrel
Spot Crude20909
July 2010 $6165 brings corn near
$480bu
Proposed amp Initiated Ethanol Plants and Their Grain Requirement
Ethanol Capacity Million
Corn Required Million Corn Acres
and Their Grain Requirement
Location Company Million galyr
Million bushels
Corn Acres Required
Levelland LevellandHockey 40 148 76365Muleshoe Panda Energy 100 37 0 190 913Muleshoe Panda Energy 100 370 190913Plainview White Energy 100 370 190913Hereford Panda Energy 100 370 190913H f d Whit E 100 37 0 190 913Hereford White Energy 100 370 190913Dumas Pan Ener of Dumas 30 111 57274Stratford Panda Energy 100 370 190913Total 570 2111 108820227 gallons of ethanol produced from a bushel of corn194 buacre base on TASS 2005
Energy BillEnergy BillSigned into law 121907Requires 36 billion gallons of ethanol use by 2022yMandates that 21 of the 36 billion gallons come from feedstocks othergallons come from feedstocks other than corn
Renewable Fuels Standard MandateRenewable Fuels Standard MandateEnacted under the Clean Air Act ndash Applies to bl dblendersEPA is the Enforcement AgencyStandard calculated for the year in November based on previous 12 months gas use
C l l d i l b indash Calculated on a national basisndash 111 billion gallons of ethanolndash 2009 ndash 1021 must be RF
The larger volume blenders would be impacted less
RFS Mandate PenaltiesRFS Mandate PenaltiesReturn ill begotten gainsReturn ill begotten gainsPlus $25000 fine per day or $9 125 000$9125000yrTechnically-If out of compliance for a y pday could be considered out of compliance for the year-EPArsquos discretionp y
2007 US Biofuel Mandates Billion gallonsf Billion gallons
Source FAPRI and RFA
Applicable volume of
Calendar Year
renewable fuel (in billions of gallons)
2006 402007 4 72007 472008 902009 1112010 12952011 13952012 1522013 16552014 18 152014 18152015 2052016 22252017 2402018 2602019 2802020 3002021 33 02021 3302022 360
Source High Plains Journal 010708
Renewable Fuel StandardsEthanol-Corn Use
Year Renewable Fuel Billing of Gallons
Corn ReqBilling of Bushels
Net Even Req Billing of bushels
2008 90 321 220
2009 111 396 271
2010 1295 463 316
2011 1395 498 340
2012 152 543 371
Assumes 28 galbushel and 1775 lbs of DGrsquos produced
Distillerrsquos GrainDistiller s Grain2009 2010
Corn for Eth l (b ) 3 964 000 4 62 000Ethanol (bu) 3964000 4625000Distillers Grain (bu) 1257000 1466000N t CNet Corn Use (bu) 2707000 3159000
P blProblem
BiBiggerggProblemProblem
ldquoI have established a goal to have 60 billion
gallons of our fuel comefrom sustainable
affordable biofuelsin 2022helliprdquo
Biofuels grow but fall short of the 36 billion gallon RFS target in 2022 exceed it in 2035
billion gallon-equivalents
45 R bl
35
40
45 Legislated RFS in 2022
RFS with Biomass-to-
liquids
Renewable diesel
20
25
30 adjustments under CAA Sec211(o)(7) Biodiesel
Oth
q
Net ethanol imports
10
15
20 Other feedstocks Cellulosic
ethanol
0
5
2008 2022 2022 in 2035
Corn ethanol
Richard Newell SAIS December 14 2009 29
2008 2022 2022 inAEO2009
2035
Source Annual Energy Outlook 2010
Ethanol Blend AnnouncementEthanol Blend Announcement
The announcement was made onDec 1 which was the deadline forEPA to respond to a request fromp qethanol producers who want theblend limit raised from the currentblend limit raised from the current10 to 15
Blending Wall for EthanolBlending Wall for Ethanol
Federal standards set the maximum of ethanolFederal standards set the maximum of ethanol blending at 10 of the total gas supply - -Additional to E85Concerns over vehicle ability to use it mileage and transportation infrastructureCurrent annual fuel consumption in the US about 130 ndash 140 billion gallonsCurrently blending wall is estimated at 12 13Currently blending wall is estimated at 12 ndash 13 billion gallons of ethanol
Blending Wall ObservationsBlending Wall - Observations
B il h b i hi h bl d t (E20Brazil has been using higher blend rates (E20 ndashE30) without any problemsLong term need to modify production processesLong term - - need to modify production processes or product (butanol)Short term solution Raise blending limit to E12Short term solution - - Raise blending limit to E12 or E15 or E20Long term problem - - increased pressure onLong term problem increased pressure on ethanol prices due to added production (cellulosic)
SteversquosSteve s Crystal BallCrystal Ball
Whatrsquos coming in the
Wi dS l Stfuture
WindSolar StorageImproved Electric CarsImproved Electric CarsAlgae OilH-H-OTh A M bilThe Amosson Mobile
Summary and ConclusionsyShort Run
E d d h l d i iExpanded ethanol production is probably a given however the pace is expected to slow do to capacity and policyp yThe President Elect and Secretary of Ag are big supporters of Renewable Fuelsare big supporters of Renewable FuelsCurrent Ethanol Margins have turned
i ipositive
Summary and ConclusionsSummary and Conclusions
Ethanol Production is and will suffer fromEthanol Production is and will suffer from growing painsndash Demand amp SupplyDemand amp Supply
DDG prices will be falling (relatively) making them attractive for livestock rationsThe limit on corn based ethanol and the growth in yields will eventually cap corn prices in the LRBl di ll d ll l i d i illBlending wall and cellulosic production will become a problem in the future for corn based ethanolethanol
Educational programs of Texas AgriLife Extension Service are open to all people without regard to race color sexare open to all people without regard to race color sex
disability religion age or national origin
4
Corn amp Sorghum Basis
Information
BasisMarketing Plan Seminar
Mark WelchmdashGrain Marketing EconomistJanuary 20 2010
Improving Lives Improving Texas
BasisBasis
bull The amount that the local cash price of a commodity is above or below the futures price for a pparticular month
bull Impacted by transportation costsImpacted by transportation costs storage and handling interest charges supply and demandcharges supply and demand fundamentals
(basis = cash - futures)(basis = cash - futures)
Corn Prices in the Triangle A F t C h B iArea Futures Cash Basis
600
400
500
200
300
(1 00)
000
100
(100)
basis cash futures
Sorghum Prices North of the C di C F t C h B iCanadian Corn Futures Cash Basis600
400
500
200
300
000
100
-100
Basis Corn Futures Cash
Basis
bull Basis exists mainly because of carrying y y gcharge arbitrage between futures and cash markets and transportation costsndash The carrying charge exists because stored
commodities are harvested and stored one time each year There are financingtime each year There are financing storage and management cost associated with carrying charge
ndash Because of carrying charge it is likely that the deferred futures price will be higher than cash price or basis with a negative p gsign will exist during harvest
BasisBasis
bull Transportation costs also affect the local basis The grain handler receives a bid from buyer determines the transportation cost to deliver the grain and subtract that cost from the price bid to determine the local price paid to the farmer
BasisBasis
bull Basis may also serve as a barometer of market strength or weakness
bull Improving basis is a sign of underlying strength in market demand
bull Declining basis is a sign of weak demanddemand
BasisBasis
bull There are times when the formula generates a basis with a positive sign
bull This denotes that the cash price is higher than futures price or cash pricehigher than futures price or cash price is selling at a premium to the futures
bull This occurs because supplydemandThis occurs because supplydemand relationships in the local cash market is different from futures market The local
l f i i th k t bsupply of grain in the market may be limited relative to demand or demand may be relatively higher than supply inmay be relatively higher than supply in the local market
Basis
bull The observed basis is termed asThe observed basis is termed as strong when the present basis is more positive or less negativemore positive or less negative than the historic average basis
For example assume that thendash For example assume that the average basis for a hypothetical market is -$035 per bushel The $ ppresent basis is -$010
ndash Therefore present basis is strong p grelative to the historic average
Basis
bull Similarly the observed basis isSimilarly the observed basis is termed as weak when the present basis is less positive or morebasis is less positive or more negative than the historic averagendash For example assume that theFor example assume that the
average basis for a hypothetical market is -$035 per bushel The present basis is -$045
ndash Therefore present basis is weak relative to the historic average
BasisCash Price ndash Futures Price = Basisbull Is the relationship between a local cash market and theIs the relationship between a local cash market and the
futures market
bull Can be negative or positiveCan be negative or positive
bull Is more stable than cash or futures prices
Basis Componentsbull Storage (insurance and interest)
bull Transportation
bull Local supply and demand
The Role of Basis in Hedgingg gBasis describes the price relationship between cash market prices and futures market prices at a particular time and location Basis is the number of cents (dollars) per unit that the local cash price of a commodity is above or below the current priceper unit that the local cash price of a commodity is above or below the current price for a particular futures contract delivery month on a given day Thus basis is the cash market price minus the futures market price at a specific time
Basis is important yet often the least understood concept in hedging agricultural p y p g g gcommodities An understanding and an accurate estimate of basis is needed by farmers and rancher who want to include hedging as part of their pricing strategy
Basis is important because approximately 97 percent of all agricultural commodities traded in the futures market are offset before delivery Therefore because the actualtraded in the futures market are offset before delivery Therefore because the actual physical commodity is mostly sold on the cash market the hedged futures price will not be the realized price for the commodity An estimate of that price can be calculated using the basis
A knowledge of the local basis is necessary to translate a given futures price into probable effective price for local delivery The futures price plus the expected basis (with appropriate arithmetic sign) is an estimate of the price the futures market is offering for the commodity delivered to the local market during a particular month Remember the basis is cash minus futures Therefore when the basis is negative gthe futures price is reduced by the amount of the basis When the basis is positive the futures price is increased by the basis value
Market CarryNormal Market
Sept
July $235
Sept $238
Mar
May $222
Dec $200
$212
Market CarryInverted Market
Dec $3 26
May $306
Mar $311
$326
Sept
July $299
$280
Basis and Expected PriceBasis and Expected Pricebull Knowledge of local basis is
t t l t inecessary to translate a given futures price into a probable price f l l d lifor local delivery
bull The futures price adjusted for basis is the price the market is offering for your grain delivered at a local elevator during a particular month(expected price = futures + basis)( p p )
Expected Price -$050 basisExpected Price $050 basis
5 1
49
51
45
47
Cash
4 1
43
39
41
450 460 470 480 490 500 510 520 530 540 550
December Futures
Texas Corn Basis in Oct vs Dec Contract Hi h L A (2005 09)High Low Average (2005-09)
North of the
0 30
040
0 30
040Canadian Triangle Area South of Line
0 10
020
030
0 10
020
030
0 10
000
010
0 10
000
010
0 30
-020
-010
0 30
-020
-010
Oct 2010 -030-030
Source httpmastermarketertamuedu
Basis Tracking FormBasis Table
Commodity LocationNearby Futures Contract Harvest Delivery
CashFutures Contract
Futures Contract
Forward Cash
Contract
Harvest Contract Futures Implied
Basis Contract
Date Price Month Price Basis Offer Price Basis Offer
Basis Corn North of the C diCanadian
Basis Sorghum North of the C diCanadian
Basis Expected Harvest Basis
Expected Mar 1 Basis
Expected May 1 BasisExpected May 1 Basis
If short crop basis will
If large crop basis will
StrategiesStrategies
NOTES
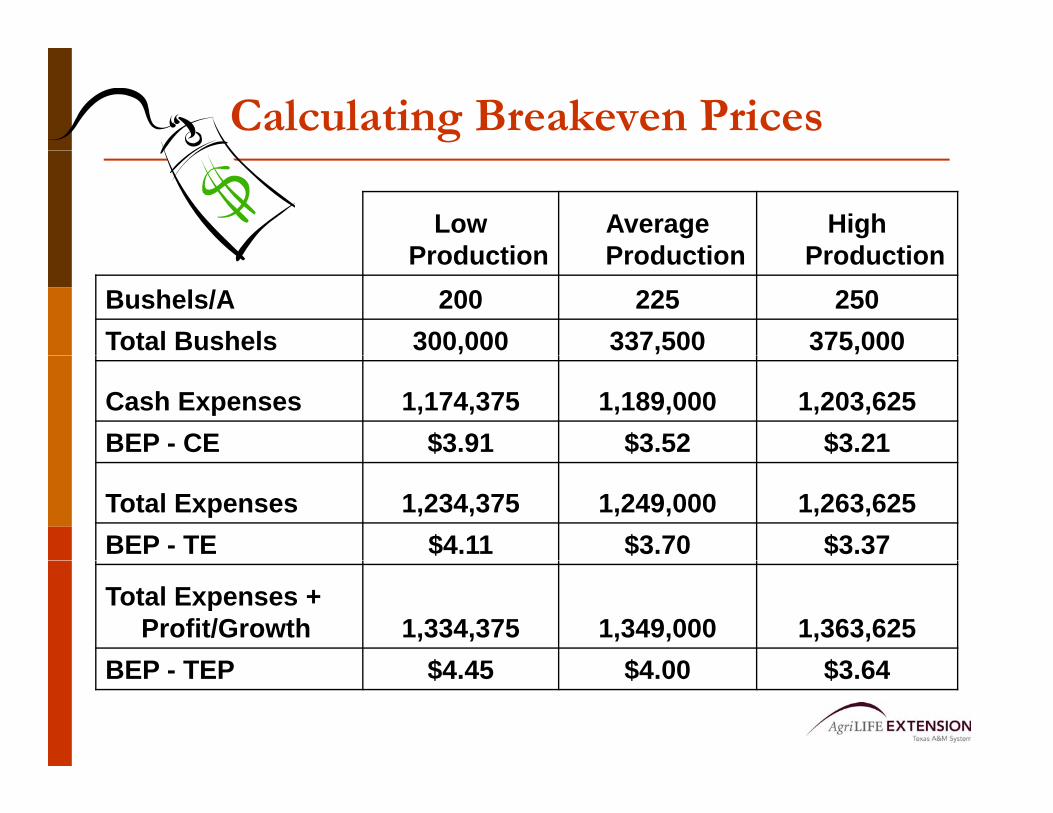

B k P iBreakeven Prices
Q i i V i bl C t (VC) All t f k t Quaisi Variable Cost (VC) ndash All out-of-pocket expenses associated with or assigned to the crop This includes seed fertilizer paid labor family living with-drawals land
t i t t t t tpayments equipment payments government payments etc Per Acre VC Breakeven Price = VCYield Total Cost (TC) Includes VC plus all non-cash expenses Total Cost (TC) Includes VC plus all non cash expenses
such as depreciation Per Acre TC Breakeven Price = TCYield Profit Total Cost plus a profit objective usually determined
by the goals that have been set or an independent financial measure such as return on assets
Per Acre Profit Breakeven Price = TC + Desired ProfitYield
All ti C tAllocating Costs
By Crop Acre By Crop Acre
By Capital Investment
By Time Investment
By Use
E ti ti C tEstimating CostsA l l o c a t e d
CB y C r o p
t o C r o p p e r A c r eT o t a l O u t - o f - P o c k e t P r o d u c t i o n C o s t s
O v e r h e a d C a s h E x p e n s e s P l u s
( u t i l i t i e s e t c )
F a m i l y L i v i n g E x p e n s e s
A n n u a l D e b t S e r v i c e ( l a n d
P l u s
P l u s(
e q u i p m e n t e t c
D i r e c t F a r m P r o g r a m P a y m e n t
M i n u s
T o t a l C a s h E x p e n s e s ( V C )
D e p r e c i a t i o n ( B e y o n d P y m t s )T o t a l C a s h N o n - C a s h E x p e n s e s ( e t c )
P l u s
E x p e n s e s ( e t c )
P r o f i t a n d o r G r o w t h C a p i t a lS a l e s G r o s s I n c o m e O b j e c t i v e
P l u s
B k P iBreakeven Prices
Yield Scenarios
Low Average High
YieldYield
Variable Cost
BEP‐VC
BEP‐VC+FC
Variable+Fixed Cost (VC+FC)
VC+FC+Profit (TC)VC+FC+Profit (TC)
BEP‐TC
Closing Comments (continued)g
Use only the marketing tools you are comfortable with ---- Know them inside out
Futures price and basis are separate items ----Know both and market both
Marketing is like playing baseball sometimes you get a hit and sometimes you donrsquot -- Itrsquos the relative percentage thatrsquos importantp g p
The key to being a good marketer is have a solid marketing plan and the discipline to execute it
2010 Marketing Plan SummaryF u n d a m e n t a l s N o t e s S h o r t C r o p P r ic e = A v e r a g e C r o p P r ic e = L a r g e C r o p P r i c e =
B a s i s N o t e s S t r o n g B a s is A v e r a g e B a s is W e a k B a s is
C a s h M a r k e t A l t e r n a t i v e s N o t e s 11 2 3
W h a t I n e e d t o l e a r n H o w a n d w h e n a m I g o i n g t o d o i t 1 22 3
G o a l s S h o r t - T e r m G o a l s L o n g - T e r m1 1 2 2 3 33 3
L o w Y i e l d H i g h Y i e l dV a r ia b le C o s t ( V C )
V C + F ix e d C o s t ( F C )
A v e r a g e Y i e l dB r e a k e v e n s
V C + F ix e d C o s t ( F C )
V C + F C + P r o f i t
Pre‐Plant Planting to Harvest (HarvestPost Harvest)
Reports to Watch
Marketable Production
Contract Season
PriceTime Targets
Marketing Tools to be Used
Marketing Strategies
What Did I Do and Why
Feedgrains Marketing Plan for 2010
Pre‐Plant Planting to Harvest HarvestPost Harvest
Reports to Watch
Planting Intentions (PI) Report (March 31) PI Industry Reports starting early March Soil Moisture Conditions httpwwwusdagovnasspubsstaterpthtm ‐ NASS Crop Weather WASDE and other USDA reports Ethanol Industry Reports EIAISU
Crop conditionsprogress reports from NASS Crop Weather and httpwwwextensioniastateeduinformationweatherhtml ‐ Elwynn Taylor (Iowa State) WASDE and other USDA reports especially August Crop Report Ethanol Industry Reports EIAISU
WASDE and other USDA reports
Marketable Production 7525 ‐ 75 depending on pre‐plant sales with total pre‐harvest sales not to exceed 100
Remainder of unsold production
Contract Seasonality
First Seasonality price opportunity is normally early to the middle of March Followed by the first half of April Next opportunity earlymid June If normal crop prices tend to fall into harvest
Next Seasonal sale indicator is early to mid JuneSeasonal low is usually hit in September or early October
PriceTime Targets
Split the range ie start marketing at $440 (double first sale) incrementally market to $475 until 75 of crop is marketed Can fine tune selling with technical indicators (moving ave etc)
Continue scale up sales if market is trending up Sell at least 50 by mid June time frame on down trends and remainder of pre harvest sales on downtrend in July to August
Sell remainder at harvest across the scales unless you have tax concerns but to evaluate storage costs carefully before holding grain
Marketing Tools to be Used
Forward contract at least first half if not all of pre plant sales If you decide to use options consider collar window or FC ‐ Bull call spread to limit cost Consider basis contracts on un‐priced production up to 75 of total because of inc supplies
Options due to market volatility and likelihood of major up and down trends developing If forward cash sales hedges or options depending on your risk tolerance If you are pricing the last 25 of production definitely use optionsoption strategies such as a collar window or bear put spread
Cash Sales Call options strategies such as bull call spread can be used to re‐own grain if desired
Marketing Strategies
Use scale up sales based on seasonal price tendencies with moving averages and other trend indicators as marketing triggers I want to be at least 25 sold pre‐plant if at profitable levels Lock in 50 of NG (up to August) and all fertilizer ‐ NOW
Continue scale up sales based on seasonal tendencies and price trend indicators as sales triggers Need to be at least 50 marketed by the middle of June with a goal of being 100 if the weather appears normal and at profitable levels before harvest
If prices appear likely to move higher after harvest sell grain and buy calls
What Did I Do amp Why
Feedgrains Marketing Plan for 20102011Preseason Price Forecast = $405Contract Price Range $360‐$475
Collar or Three‐Way
Action Buy a put at the money sell out‐upsell out up
The money put and callExample 2010 Dec CornExample 2010 Dec Corn
Buy 400 put 43 38Sell 350 put 20 frac34Sell 500 call 20 frac12
Out‐of‐Pocket Cost
4 00 Put(B) 43 38400 Put(B) 43 38350 Put(S) ‐20 frac34500 Call(S) ‐20 frac12Commission +2 Net Cost 4 18
Assume an 0 Basis
Collar or Three‐Way (Continued)(Continued)
AdvantagesLimited up front requiredCan negate the time value of optionsProvides limited downside price protection
DisadvantagesCaps upside price potentialLimits downside price protectionPossible margin calls if price rises
When to useUncertain productionOptions premiums are highA good idea of potential price rangeA good idea of potential price rangeMarket is a profitable level or downside risk
ProblemsLimited volume in options marketLimited volume in options market
Collar or Three‐Way (Continued)(Continued)
1 What is the first price you are protected at on the downside
2 2 If the price falls lower than the put that you sold what is the maximum you could collect
3 3 What is the maximum price you can receive
4 4 If the Dec price ends up between $350 ‐$500 buthen what is your expected price range you will receive
Projections for Planning Purposes OnlyNot to be Used without Updating after December 15 2009
B-1241 (C1)
Table 4A Estimated costs and returns per Acre Bt Corn for Grain Sprinkler Irrigated (NG) 2010 Projected Costs and Returns per Acre_______________________________________________________________________ITEM UNIT PRICE QUANTITY AMOUNT YOUR FARM_______________________________________________________________________ dollars dollarsINCOME corn bu 430 2250000 96750 _________ --------TOTAL INCOME 96750 _________
DIRECT EXPENSES SEED seed - Bt corngr bags 25500 03500 8925 _________ INSECTICIDE miticide acre 2000 10000 2000 _________ HERBICIDE herb - corn pre acre 1960 10000 1960 _________ herb -corn post acre 2780 10000 2780 _________ FERTILIZER fert(N) - ANH3 lb 022 1260000 2772 _________ fert(P) - liquid lb 051 600000 3060 _________ fert(N) - liquid lb 032 780000 2496 _________ CUSTOM fert appl - ANH3 acre 1100 10000 1100 _________ crop consultant acre 725 10000 725 _________ harv amp haul - corn bu 039 2250000 8775 _________ CROP INSURANCE corn - irrigated acre 1930 10000 1930 _________ OPERATOR LABOR Implements hour 1080 02925 315 _________ Tractors hour 1080 03965 428 _________ HAND LABOR Implements hour 1080 01527 164 _________ IRRIGATION LABOR Center Pivot hour 1080 14080 1520 _________ DIESEL FUEL Tractors gal 205 21861 448 _________ GASOLINE Self-Propelled Eq gal 236 20100 474 _________ NATURAL GAS Center Pivot ac-in 675 220000 14850 _________ REPAIR amp MAINTENANCE Implements Acre 561 10000 561 _________ Tractors Acre 480 10000 480 _________ Self-Propelled Eq Acre 016 10000 016 _________ Center Pivot ac-in 203 220000 4466 _________ INTEREST ON OP CAP Acre 1088 10000 1088 _________ --------TOTAL DIRECT EXPENSES 61337 _________RETURNS ABOVE DIRECT EXPENSES 35412 _________
FIXED EXPENSES Implements Acre 873 10000 873 _________ Tractors Acre 689 10000 689 _________ Self-Propelled Eq Acre 024 10000 024 _________ Center Pivot Acre 3360 10000 3360 _________ --------TOTAL FIXED EXPENSES 4948 _________ --------TOTAL SPECIFIED EXPENSES 66286 _________RETURNS ABOVE TOTAL SPECIFIED EXPENSES 30463 _________
ALLOCATED COST ITEMS cash rent - corn acre 11000 10000 11000 _________RESIDUAL RETURNS 19463 ________________________________________________________________________________Projections for Planning Purposes Only1 ac-in = 1 Mcf
Information presented is prepared solely as a general guide amp not intended to recognize or predict the costs amp returns from any one operation Developed by Texas AgriLife Extension Service
215
667
80075252500
13200
57749 + 100 CASH amp RENT67749 (VC)
72697 (TC)
10000
600
035 215
72697 8 = 5816______
TOTAL 78513
2
Feedgrain
Fundamentals
Grain Market FundamentalsSupply and Demand Analysis
Mark WelchmdashGrain Marketing EconomistJanuary 19 2010
Improving Lives Improving Texas
bull ldquoWithout the runaway demandrunaway demand growth of ethanol many of the recent stories need to be rewritten in shortrewritten in short orderrdquo
bull
Michael Swanson
Pumping ethanol from corn in 1933
--Michael Swanson Economics Department Wells Fargo
httpwwwnassusdagovPublicationsindexasp
httpwwwersusdagovBriefing
httpwwwfasusdagovpsdonlinepsdHomeaspx
httpwwwfaprimissourieduindexaspcurrent_page=home
httpwww cpc ncep noaa govproductsanalysis monitoringregional monitoringindex shtmlhttpwwwcpcncepnoaagovproductsanalysis_monitoringregional_monitoringindexshtml
httpwwwdroughtnoaagovindexhtml
The 10 Commandments
Of Successful Commodity TradingOf Successful Commodity Trading
IV Thou shalt not let thy emotions rule
Separate what you think from what you want
Fundamental AnalysisFundamental Analysis
bull The use of information regarding the factors of supply and demand for a given commodity to formulate a price estimate
Price Estimation using Demand d S land Supply
SupplyP Supply
New Supply
P
Old Price
New Price
DemandNew Demand
New Price
Q
Wh d thi tt Why does this matter
bull Price changes due to changes in demand are usually sustained for longer periods of time
bull Price changes due to changes in supply are usually short livedsupply are usually short lived
Schematic Representation of the US Grain Marketp
B S k E di St k
Factors of Supply = Factors of Demand
Grain
Beg Stocks Ending Stocks
GrainPrice
Imports Exports
Production Domestic Use
Area
Yield
Returns from Competing
Crops
Corn US SupplyDemand (million bushels)pp y ( )
200506 200607 200708 200809 200910SupplyBeginning Stks 2114 1967 1304 1624 1673Beginning StksProduction
211411114
196710531
130413038
162412101
167313151
Total Supply 13237 12510 14362 13739 14834DisappearanceDisappearanceDomestic UseExports
91362134
90812125
103002437
102071858
110202050
T l U 11 270 11 207 12 737 12 065 13 070Total Use 11270 11207 12737 12065 13070
Ending StksCarryoverUse ()
19671745
13041164
16241275
16741387
17641350
11210
Avg Farm Price 200 304 420 406 370
US Corn UseUS Corn Use
7 000
Million bushels
5000 6000 7000
Feed and Residual
2 0003000 4000
Ethanol
0 1000 2000
7 9 1 3 5 7 9
Exports
Food Seed and Other
9697
9899
0001
0203
0405
0607
0809
Industrial
Source USDA revised 11210
US Corn Supply and DemandMil bu
11210
Stock to Use RatioStock to Use Ratio
bull The stock to use ratio is a convenient measure of supply and demand interrelationships of commodities
bull The stocks to use ratio indicates the level of carryover stock for a given commodity as a percentage of the total demand or use
Stocks to Use RatioStocks to Use Ratio
M th ti l f l f thi l ti hiMathematical formula for this relationship
Ending Stocks = Beg Stocks + Production +Ending Stocks = Beg Stocks + Production + Imports ndash Domestic Use ndash Exports
Total Use = Domestic Use + Exports
St k t U E di St k T t l UStocks to Use = Ending Stocks divide Total Use
Multiply by 100 to express as a percentageMultiply by 100 to express as a percentage
Season Average Corn Price vs US Ending Stocks-to-Useg196980 ndash 200910
45 70
3 0
35
40
50
60Average Price
2 025
30
$B
u
30
40
Perc
ent
10
15
20
20
30 P
00
05
69 71 73 75 77 79 81 83 85 87 89 91 93 95 97 99 01 03 05 07 090
10US Ending Stks-to-Use
121009
69 71 73 75 77 79 81 83 85 87 89 91 93 95 97 99 01 03 05 07 09
SAFP to 5-yr avg Stocks to U R tiUse Ratio
500 1011
$bu
3 50
400
45008090708
0910
y = 17132x-0221
Rsup2 = 02755250
300
350
100
150
200
Y = -00887X + 03579R2 = 0 629
000
050
0 0 2 0 4 0 6 0 8
R2 = 0629
0 02 04 06 08
U S Corn Crop ConditionUS Corn Crop Condition
1507 1539 1604
China Net Trade000 MT
10000
20000
Exports
‐10000
0
‐30000
‐20000Imports
‐50000
‐40000
‐60000
Coarse Grain Wheat Soybeans Rice
Source USDA and FAPRI
US Corn Supply and Demand 11210mil bu
US Corn Stocks All Positions000 bu
NASS report date 11210
World Per Capita Grain UseWorld Per Capita Grain Usekg
corn barley sorghum rye oats millet mixed grains wheat rice121009
World Per Capita ConsumptionKg
Yr to Yr 10-yr
+18
-0-0
-0
+22
Updated 121009
World Corn Days of Use on Hand
11210
Food versus FuelFood versus Fuel
2007 US Biofuel Mandates Billi llBillion gallons
Source FAPRI and RFA
Break even price of Corn for Eth lEthanol
Y=3x-162
Long-Run Impact of Corn-Based Ethanol on the Grain Oilseed and Livestock Sectors A Preliminary Assessment TheAmani Elobeid Simla Tokgoz Dermot J Hayes Bruce A Babcock Chad E Hart[06-BP 49]
Ethanol Returns
Cattle CrushCattle Crush$head
Global Economic GrowthGlobal economic growth is being driven by developing nations
810
e
Real GDP Growth 1980 - 2010
246
nt C
hang
e
-4-20
1980
1982
1984
1986
1988
1990
1992
1994
1996
1998
2000
2002
2004
2006
2008
2010
Perc
en
-6Advanced Economies Emerging and Developing Economies
World Change in Crude OilWorld Change in Crude Oil
Source httpwwwimforgexternaldatamapperindexphp
World Liquid Fuel ConsumptionMillion barrels per day
Energy Information Administration Short-term Energy Outlook December 2009
US Stocks of Crude Oil and P t l P d tPetroleum Products
Weekly Petroleum Status Report Energy Information Administration December 25 2009
Crude Oil and Natural Gas N b F t P iNearby Futures Prices
Outside MarketsDollar Crude OilDollar Crude Oil
C Eth lCopper Ethanol
Wheat Corn and Soybeans Speculative Investment
Net long contracts centbu
Source CFTC released 11210
Corn Speculative Investment
Net Long Contracts centbu
Anhydrous Ammonia Prices$t$ton
April Prices USDA
Bushels of Corn to buy 1 ton of A h d A iAnhydrous Ammonia
Soybean Harvested AcresSoybean Harvested Acresmillion acres
Yield per acre is very similar asymp 42 bushels
2010 SoybeanCorn Price Ratio(weekly average closing prices)(weekly average closing prices)
0809 0910 1011Planted Acreage (Mil Acs) 860 865 900Harvested Acreage (Mil Acs)Yield (Bushels)
7861539
7961652
8161575
Supply - - - Million Bushels - - -
US CornBeginning StocksProductionImports
162412092
14
167313151
10
176412855
10
SampD
pTotal Supply 13729 14834 14619Disappearance
Feed and Residual 5 246 5 550 5 600
January 12 2010
Feed and ResidualFood Seed amp IndustrialExports
524649531858
555054702050
560057252100
T t l U 12 056 13 070 13 425Total Use 12056 13070 13425Ending Stocks 1673 1764 1194CarryoverUse () 139 135 89Average Farm Price ($Bu) 406 370 444Closing Price Dec Futures 360 392 444
Marketing PhilosophiesMarketing Philosophies
R d Aibull Ready Aim Aim Aim Aim Aim helliphelliphellip
bull Ready Fire AimAim
The man who insists on seeing with gperfect clearness before he decides never decidesHenri-Freacutedeacuteric Amiel
3
The Ethanol Industry
The Future of the Ethanol Industry
Presented Byy
Dr Steve AmossonRegents FellowgProfessor and Extension Economist
Presentation OutlinePresentation OutlineHow We Got Where We AreHow We Got Where We AreCurrent Status of EthanolC t d R t f Eth lCost and Returns of EthanolEthanol in the High PlainsCellulosic Ethanol Time LineSummary and Conclusionsy
Complex Economic Relationships
Bioenergy Success or Failure Depends
Complex Economic Relationships
Bioenergy Success or Failure Depends on
Oil indash Oil pricesndash Processing coststechnology
R l ti f d t k tndash Relative feedstock costsndash Demand for the biofuelsndash Technology improvementsndash Government Policy
Ethanolt a ol
E85ndash Motor fuel blend of 85
ethanol and 15 gasoline
E10ndash Motor fuel blend of 10 ethanol and
90 gasoline
Currently primarily comes from corn y p y but any grain crop will work
Largely due to Government policies ethanol production grew from about 62 million gallons in 1976grew from about 62 million gallons in 1976
to over 2 billion gallons in 2002Surface Transportation
2500
Million gallons
Energy Tax Actof 1978 gaveethanol a $040gal
Assistance Act of 1983 increased ethanol tax exemption to $050gal and the blenderrsquos income tax credit to $050gal
MTBE discovered inCalifornia drinking waterin 1998
1500
2000g
credit on the Federalmotor fuels tax Regulations under the
Clean Air Act Amendments of 1990started in 1992Blenderrsquos
Income tax dit f
RFG beginsin 1995
500
1000
Tax Reform Act of 1984increased ethanol taxexemption to $060gal and the blenderrsquos income tax credit to
In 1999 CaliforniaGovernor banned MTBEby 1203
credit of$040gal
Energy policy Act of 1992 applied ethanoltax credits to lower blends
0
1976
1978
1980
1982
1984
1986
1988
1990
1992
1994
1996
1998
2000
2002
blender s income tax credit to $060gal
tax credits to lower blends
Source US Energy Information Administration and USDA ERS
EthanolBasic Facts
Currently one bushel of corn produces 28 gallons of ethanol overall 275g By Productsndash 17 75 lbs of distillers dried grainndash 1775 lbs of distillers dried grainndash CO2
Figure 3
Total 11693 mil Bu
E h l P d iEthanol ProductionndashJanuary 2009 Est
Status Plants Capacityp y(Billions of Gallons)
Operating 193 1274
Under Construction 20 204
213 1478
US Average Regular Gas and Ethanol Prices Monthly 1991 ndash 2006
35
4
2
25
3
allo
n
Ethanol
1
15
2
$G
a
Reg Gas
0
05
991992
993994
995996
997998
999000
001002
003004
005006
19911992
19931994
19951996
19971998
19992000
20012002
20032004
20052006
Source Renewable Fuels Association
Ethanol PricesRelative to Unleaded Gas
Time Price Relationship
lsquo82 ndash lsquo05 Premium Basis
2006 +$64
Aug lsquo07 +$10
Oct rsquo07 $ 45Oct 07 -$45
Jan lsquo09 +$ 54Jan 09 +$54
US Ethanol Situation-Spring lsquo09 2nd L t fi i b k t2nd Largest firm in bankruptcy5-8 more in bankruptcy24 28 f l ti l t idl d24-28 formerly operating plants idled Several completed or nearly complete plants delay opening
Returns near break-evenSevere loss in asset valuesGovt Mandates support corn processing demand near current level -- ldquoblending wallrdquo issueIdle operating capacity 135-150 mil tons cornIdle plants =14-18 of capacity
Ethanol Plant Operating MarginsOperating Margins
Natrsquol Gas
Profit
Corn
Profit
I donrsquot particularly see anyone outside the ethanol industry trying to get into the industry now That would be like running into a burning barnmdashSander Cohen industry analyst
Bellwether MarketBellwether MarketCorn $bu
Crude $bbl
Statistician A man who believes figures dont lie but admits that under analysis some of them wont stand up either ndash Evan Esar
40109 updated 5609
July lsquo10 crude oil
July rsquo10 corn5609
y 40109
July rsquo10 crude 5609
$barrel
Spot Crude20909
July 2010 $6165 brings corn near
$480bu
Proposed amp Initiated Ethanol Plants and Their Grain Requirement
Ethanol Capacity Million
Corn Required Million Corn Acres
and Their Grain Requirement
Location Company Million galyr
Million bushels
Corn Acres Required
Levelland LevellandHockey 40 148 76365Muleshoe Panda Energy 100 37 0 190 913Muleshoe Panda Energy 100 370 190913Plainview White Energy 100 370 190913Hereford Panda Energy 100 370 190913H f d Whit E 100 37 0 190 913Hereford White Energy 100 370 190913Dumas Pan Ener of Dumas 30 111 57274Stratford Panda Energy 100 370 190913Total 570 2111 108820227 gallons of ethanol produced from a bushel of corn194 buacre base on TASS 2005
Energy BillEnergy BillSigned into law 121907Requires 36 billion gallons of ethanol use by 2022yMandates that 21 of the 36 billion gallons come from feedstocks othergallons come from feedstocks other than corn
Renewable Fuels Standard MandateRenewable Fuels Standard MandateEnacted under the Clean Air Act ndash Applies to bl dblendersEPA is the Enforcement AgencyStandard calculated for the year in November based on previous 12 months gas use
C l l d i l b indash Calculated on a national basisndash 111 billion gallons of ethanolndash 2009 ndash 1021 must be RF
The larger volume blenders would be impacted less
RFS Mandate PenaltiesRFS Mandate PenaltiesReturn ill begotten gainsReturn ill begotten gainsPlus $25000 fine per day or $9 125 000$9125000yrTechnically-If out of compliance for a y pday could be considered out of compliance for the year-EPArsquos discretionp y
2007 US Biofuel Mandates Billion gallonsf Billion gallons
Source FAPRI and RFA
Applicable volume of
Calendar Year
renewable fuel (in billions of gallons)
2006 402007 4 72007 472008 902009 1112010 12952011 13952012 1522013 16552014 18 152014 18152015 2052016 22252017 2402018 2602019 2802020 3002021 33 02021 3302022 360
Source High Plains Journal 010708
Renewable Fuel StandardsEthanol-Corn Use
Year Renewable Fuel Billing of Gallons
Corn ReqBilling of Bushels
Net Even Req Billing of bushels
2008 90 321 220
2009 111 396 271
2010 1295 463 316
2011 1395 498 340
2012 152 543 371
Assumes 28 galbushel and 1775 lbs of DGrsquos produced
Distillerrsquos GrainDistiller s Grain2009 2010
Corn for Eth l (b ) 3 964 000 4 62 000Ethanol (bu) 3964000 4625000Distillers Grain (bu) 1257000 1466000N t CNet Corn Use (bu) 2707000 3159000
P blProblem
BiBiggerggProblemProblem
ldquoI have established a goal to have 60 billion
gallons of our fuel comefrom sustainable
affordable biofuelsin 2022helliprdquo
Biofuels grow but fall short of the 36 billion gallon RFS target in 2022 exceed it in 2035
billion gallon-equivalents
45 R bl
35
40
45 Legislated RFS in 2022
RFS with Biomass-to-
liquids
Renewable diesel
20
25
30 adjustments under CAA Sec211(o)(7) Biodiesel
Oth
q
Net ethanol imports
10
15
20 Other feedstocks Cellulosic
ethanol
0
5
2008 2022 2022 in 2035
Corn ethanol
Richard Newell SAIS December 14 2009 29
2008 2022 2022 inAEO2009
2035
Source Annual Energy Outlook 2010
Ethanol Blend AnnouncementEthanol Blend Announcement
The announcement was made onDec 1 which was the deadline forEPA to respond to a request fromp qethanol producers who want theblend limit raised from the currentblend limit raised from the current10 to 15
Blending Wall for EthanolBlending Wall for Ethanol
Federal standards set the maximum of ethanolFederal standards set the maximum of ethanol blending at 10 of the total gas supply - -Additional to E85Concerns over vehicle ability to use it mileage and transportation infrastructureCurrent annual fuel consumption in the US about 130 ndash 140 billion gallonsCurrently blending wall is estimated at 12 13Currently blending wall is estimated at 12 ndash 13 billion gallons of ethanol
Blending Wall ObservationsBlending Wall - Observations
B il h b i hi h bl d t (E20Brazil has been using higher blend rates (E20 ndashE30) without any problemsLong term need to modify production processesLong term - - need to modify production processes or product (butanol)Short term solution Raise blending limit to E12Short term solution - - Raise blending limit to E12 or E15 or E20Long term problem - - increased pressure onLong term problem increased pressure on ethanol prices due to added production (cellulosic)
SteversquosSteve s Crystal BallCrystal Ball
Whatrsquos coming in the
Wi dS l Stfuture
WindSolar StorageImproved Electric CarsImproved Electric CarsAlgae OilH-H-OTh A M bilThe Amosson Mobile
Summary and ConclusionsyShort Run
E d d h l d i iExpanded ethanol production is probably a given however the pace is expected to slow do to capacity and policyp yThe President Elect and Secretary of Ag are big supporters of Renewable Fuelsare big supporters of Renewable FuelsCurrent Ethanol Margins have turned
i ipositive
Summary and ConclusionsSummary and Conclusions
Ethanol Production is and will suffer fromEthanol Production is and will suffer from growing painsndash Demand amp SupplyDemand amp Supply
DDG prices will be falling (relatively) making them attractive for livestock rationsThe limit on corn based ethanol and the growth in yields will eventually cap corn prices in the LRBl di ll d ll l i d i illBlending wall and cellulosic production will become a problem in the future for corn based ethanolethanol
Educational programs of Texas AgriLife Extension Service are open to all people without regard to race color sexare open to all people without regard to race color sex
disability religion age or national origin
4
Corn amp Sorghum Basis
Information
BasisMarketing Plan Seminar
Mark WelchmdashGrain Marketing EconomistJanuary 20 2010
Improving Lives Improving Texas
BasisBasis
bull The amount that the local cash price of a commodity is above or below the futures price for a pparticular month
bull Impacted by transportation costsImpacted by transportation costs storage and handling interest charges supply and demandcharges supply and demand fundamentals
(basis = cash - futures)(basis = cash - futures)
Corn Prices in the Triangle A F t C h B iArea Futures Cash Basis
600
400
500
200
300
(1 00)
000
100
(100)
basis cash futures
Sorghum Prices North of the C di C F t C h B iCanadian Corn Futures Cash Basis600
400
500
200
300
000
100
-100
Basis Corn Futures Cash
Basis
bull Basis exists mainly because of carrying y y gcharge arbitrage between futures and cash markets and transportation costsndash The carrying charge exists because stored
commodities are harvested and stored one time each year There are financingtime each year There are financing storage and management cost associated with carrying charge
ndash Because of carrying charge it is likely that the deferred futures price will be higher than cash price or basis with a negative p gsign will exist during harvest
BasisBasis
bull Transportation costs also affect the local basis The grain handler receives a bid from buyer determines the transportation cost to deliver the grain and subtract that cost from the price bid to determine the local price paid to the farmer
BasisBasis
bull Basis may also serve as a barometer of market strength or weakness
bull Improving basis is a sign of underlying strength in market demand
bull Declining basis is a sign of weak demanddemand
BasisBasis
bull There are times when the formula generates a basis with a positive sign
bull This denotes that the cash price is higher than futures price or cash pricehigher than futures price or cash price is selling at a premium to the futures
bull This occurs because supplydemandThis occurs because supplydemand relationships in the local cash market is different from futures market The local
l f i i th k t bsupply of grain in the market may be limited relative to demand or demand may be relatively higher than supply inmay be relatively higher than supply in the local market
Basis
bull The observed basis is termed asThe observed basis is termed as strong when the present basis is more positive or less negativemore positive or less negative than the historic average basis
For example assume that thendash For example assume that the average basis for a hypothetical market is -$035 per bushel The $ ppresent basis is -$010
ndash Therefore present basis is strong p grelative to the historic average
Basis
bull Similarly the observed basis isSimilarly the observed basis is termed as weak when the present basis is less positive or morebasis is less positive or more negative than the historic averagendash For example assume that theFor example assume that the
average basis for a hypothetical market is -$035 per bushel The present basis is -$045
ndash Therefore present basis is weak relative to the historic average
BasisCash Price ndash Futures Price = Basisbull Is the relationship between a local cash market and theIs the relationship between a local cash market and the
futures market
bull Can be negative or positiveCan be negative or positive
bull Is more stable than cash or futures prices
Basis Componentsbull Storage (insurance and interest)
bull Transportation
bull Local supply and demand
The Role of Basis in Hedgingg gBasis describes the price relationship between cash market prices and futures market prices at a particular time and location Basis is the number of cents (dollars) per unit that the local cash price of a commodity is above or below the current priceper unit that the local cash price of a commodity is above or below the current price for a particular futures contract delivery month on a given day Thus basis is the cash market price minus the futures market price at a specific time
Basis is important yet often the least understood concept in hedging agricultural p y p g g gcommodities An understanding and an accurate estimate of basis is needed by farmers and rancher who want to include hedging as part of their pricing strategy
Basis is important because approximately 97 percent of all agricultural commodities traded in the futures market are offset before delivery Therefore because the actualtraded in the futures market are offset before delivery Therefore because the actual physical commodity is mostly sold on the cash market the hedged futures price will not be the realized price for the commodity An estimate of that price can be calculated using the basis
A knowledge of the local basis is necessary to translate a given futures price into probable effective price for local delivery The futures price plus the expected basis (with appropriate arithmetic sign) is an estimate of the price the futures market is offering for the commodity delivered to the local market during a particular month Remember the basis is cash minus futures Therefore when the basis is negative gthe futures price is reduced by the amount of the basis When the basis is positive the futures price is increased by the basis value
Market CarryNormal Market
Sept
July $235
Sept $238
Mar
May $222
Dec $200
$212
Market CarryInverted Market
Dec $3 26
May $306
Mar $311
$326
Sept
July $299
$280
Basis and Expected PriceBasis and Expected Pricebull Knowledge of local basis is
t t l t inecessary to translate a given futures price into a probable price f l l d lifor local delivery
bull The futures price adjusted for basis is the price the market is offering for your grain delivered at a local elevator during a particular month(expected price = futures + basis)( p p )
Expected Price -$050 basisExpected Price $050 basis
5 1
49
51
45
47
Cash
4 1
43
39
41
450 460 470 480 490 500 510 520 530 540 550
December Futures
Texas Corn Basis in Oct vs Dec Contract Hi h L A (2005 09)High Low Average (2005-09)
North of the
0 30
040
0 30
040Canadian Triangle Area South of Line
0 10
020
030
0 10
020
030
0 10
000
010
0 10
000
010
0 30
-020
-010
0 30
-020
-010
Oct 2010 -030-030
Source httpmastermarketertamuedu
Basis Tracking FormBasis Table
Commodity LocationNearby Futures Contract Harvest Delivery
CashFutures Contract
Futures Contract
Forward Cash
Contract
Harvest Contract Futures Implied
Basis Contract
Date Price Month Price Basis Offer Price Basis Offer
Basis Corn North of the C diCanadian
Basis Sorghum North of the C diCanadian
Basis Expected Harvest Basis
Expected Mar 1 Basis
Expected May 1 BasisExpected May 1 Basis
If short crop basis will
If large crop basis will
StrategiesStrategies
NOTES
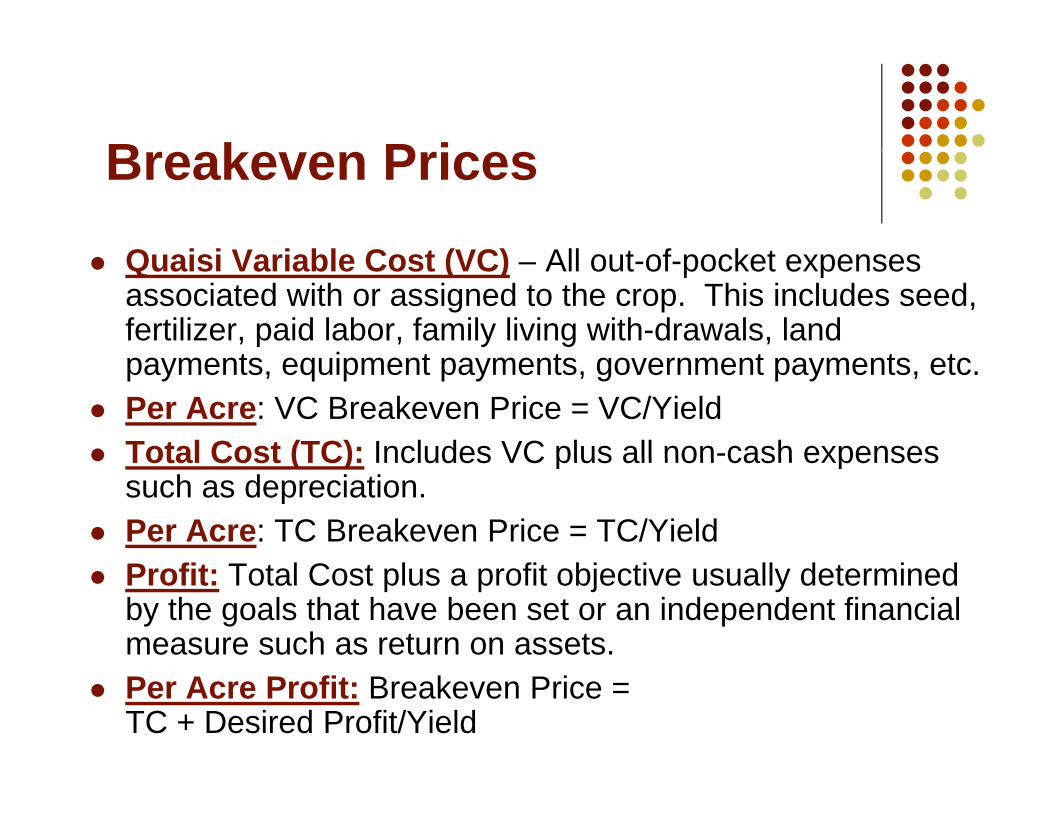
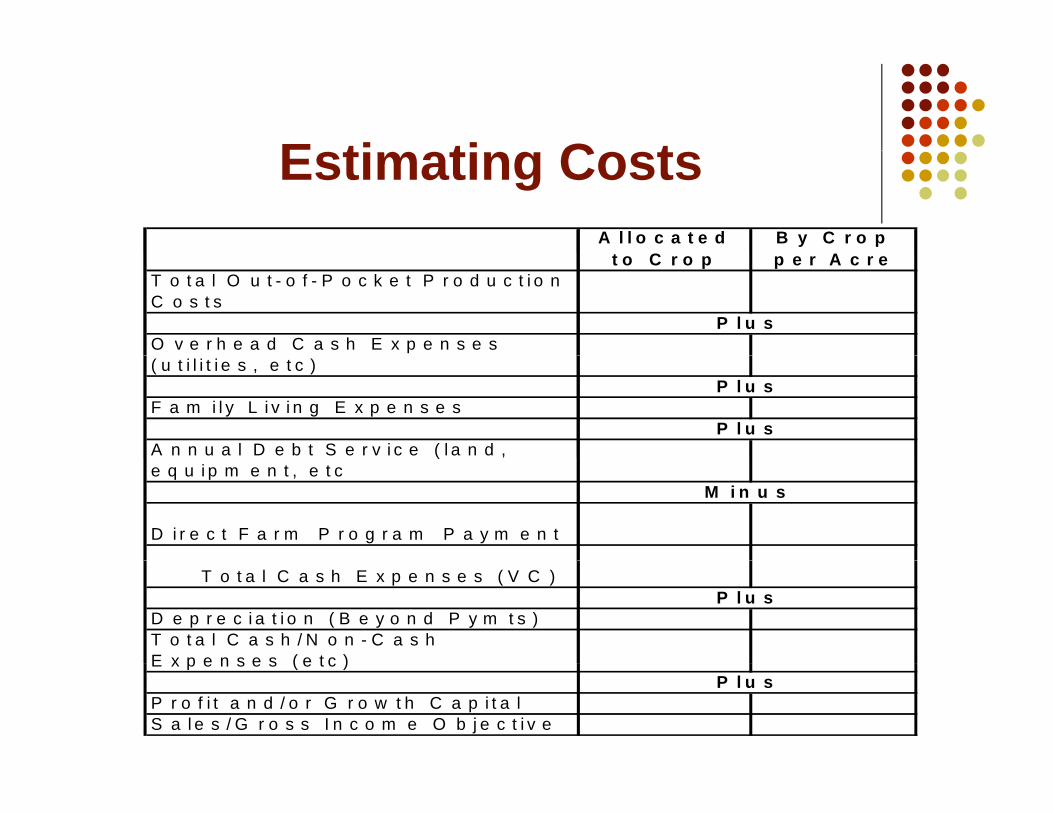
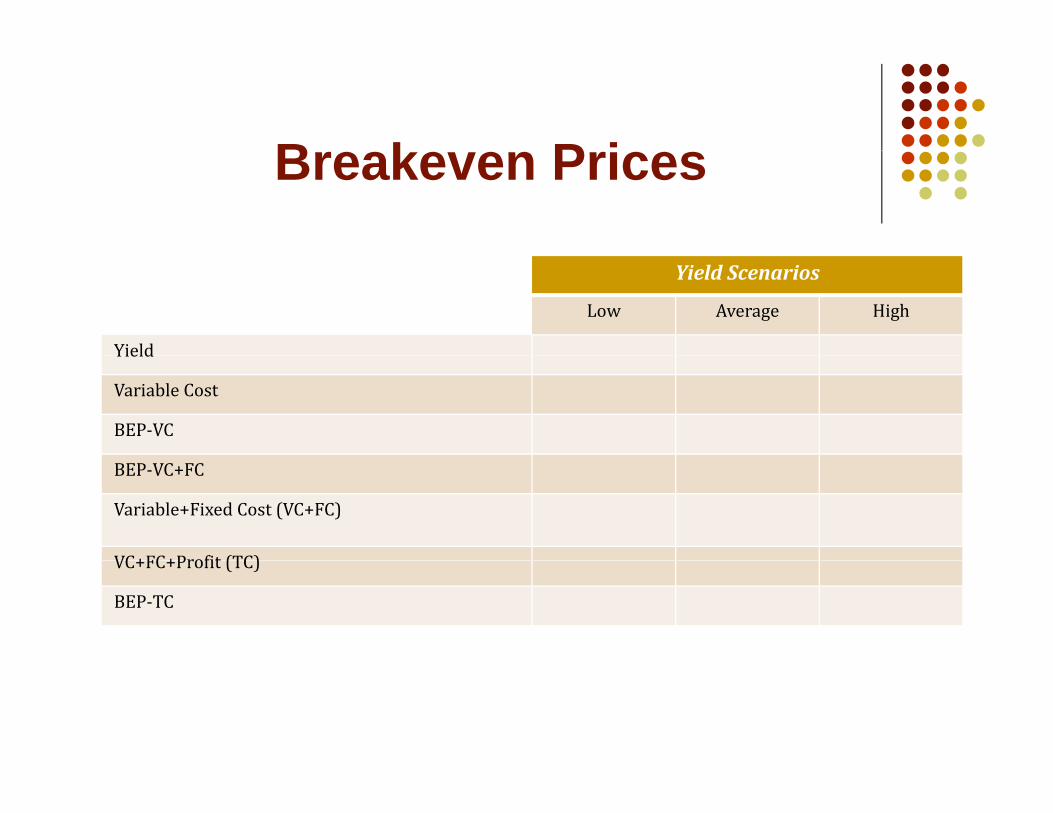
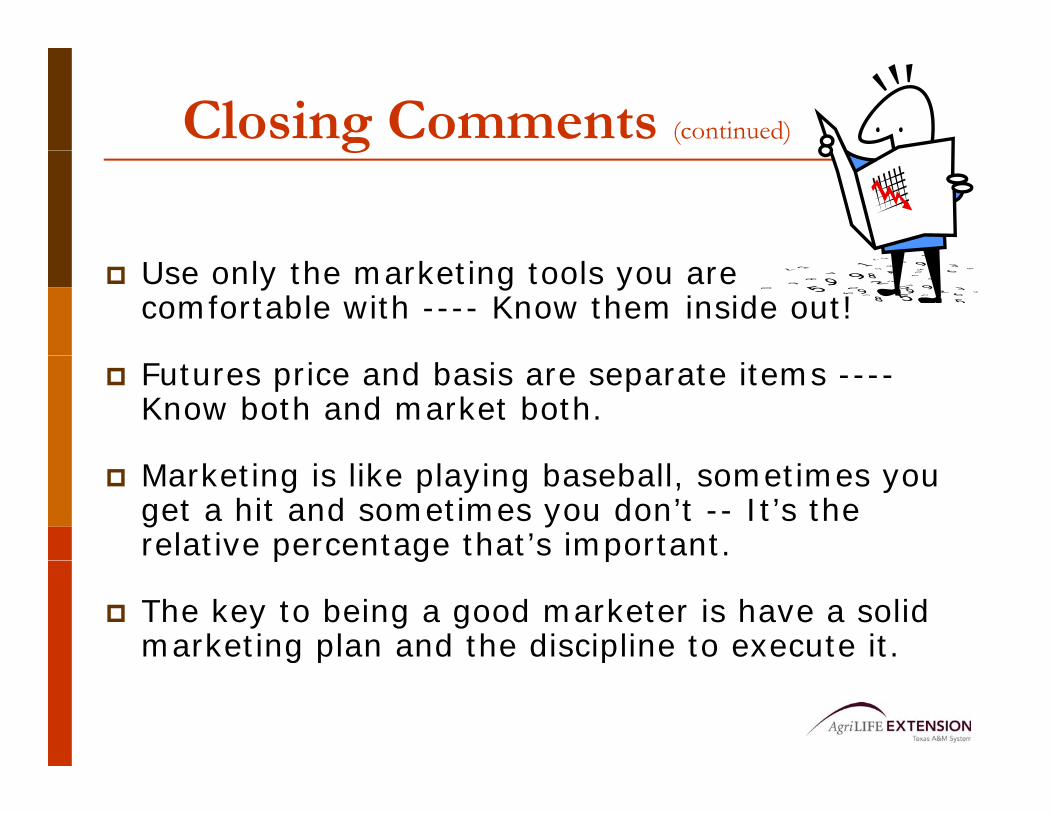

Collar or Three‐Way (Continued)(Continued)
1 What is the first price you are protected at on the downside
2 2 If the price falls lower than the put that you sold what is the maximum you could collect
3 3 What is the maximum price you can receive
4 4 If the Dec price ends up between $350 ‐$500 buthen what is your expected price range you will receive
Projections for Planning Purposes OnlyNot to be Used without Updating after December 15 2009
B-1241 (C1)
Table 4A Estimated costs and returns per Acre Bt Corn for Grain Sprinkler Irrigated (NG) 2010 Projected Costs and Returns per Acre_______________________________________________________________________ITEM UNIT PRICE QUANTITY AMOUNT YOUR FARM_______________________________________________________________________ dollars dollarsINCOME corn bu 430 2250000 96750 _________ --------TOTAL INCOME 96750 _________
DIRECT EXPENSES SEED seed - Bt corngr bags 25500 03500 8925 _________ INSECTICIDE miticide acre 2000 10000 2000 _________ HERBICIDE herb - corn pre acre 1960 10000 1960 _________ herb -corn post acre 2780 10000 2780 _________ FERTILIZER fert(N) - ANH3 lb 022 1260000 2772 _________ fert(P) - liquid lb 051 600000 3060 _________ fert(N) - liquid lb 032 780000 2496 _________ CUSTOM fert appl - ANH3 acre 1100 10000 1100 _________ crop consultant acre 725 10000 725 _________ harv amp haul - corn bu 039 2250000 8775 _________ CROP INSURANCE corn - irrigated acre 1930 10000 1930 _________ OPERATOR LABOR Implements hour 1080 02925 315 _________ Tractors hour 1080 03965 428 _________ HAND LABOR Implements hour 1080 01527 164 _________ IRRIGATION LABOR Center Pivot hour 1080 14080 1520 _________ DIESEL FUEL Tractors gal 205 21861 448 _________ GASOLINE Self-Propelled Eq gal 236 20100 474 _________ NATURAL GAS Center Pivot ac-in 675 220000 14850 _________ REPAIR amp MAINTENANCE Implements Acre 561 10000 561 _________ Tractors Acre 480 10000 480 _________ Self-Propelled Eq Acre 016 10000 016 _________ Center Pivot ac-in 203 220000 4466 _________ INTEREST ON OP CAP Acre 1088 10000 1088 _________ --------TOTAL DIRECT EXPENSES 61337 _________RETURNS ABOVE DIRECT EXPENSES 35412 _________
FIXED EXPENSES Implements Acre 873 10000 873 _________ Tractors Acre 689 10000 689 _________ Self-Propelled Eq Acre 024 10000 024 _________ Center Pivot Acre 3360 10000 3360 _________ --------TOTAL FIXED EXPENSES 4948 _________ --------TOTAL SPECIFIED EXPENSES 66286 _________RETURNS ABOVE TOTAL SPECIFIED EXPENSES 30463 _________
ALLOCATED COST ITEMS cash rent - corn acre 11000 10000 11000 _________RESIDUAL RETURNS 19463 ________________________________________________________________________________Projections for Planning Purposes Only1 ac-in = 1 Mcf
Information presented is prepared solely as a general guide amp not intended to recognize or predict the costs amp returns from any one operation Developed by Texas AgriLife Extension Service
215
667
80075252500
13200
57749 + 100 CASH amp RENT67749 (VC)
72697 (TC)
10000
600
035 215
72697 8 = 5816______
TOTAL 78513
2
Feedgrain
Fundamentals
Grain Market FundamentalsSupply and Demand Analysis
Mark WelchmdashGrain Marketing EconomistJanuary 19 2010
Improving Lives Improving Texas
bull ldquoWithout the runaway demandrunaway demand growth of ethanol many of the recent stories need to be rewritten in shortrewritten in short orderrdquo
bull
Michael Swanson
Pumping ethanol from corn in 1933
--Michael Swanson Economics Department Wells Fargo
httpwwwnassusdagovPublicationsindexasp
httpwwwersusdagovBriefing
httpwwwfasusdagovpsdonlinepsdHomeaspx
httpwwwfaprimissourieduindexaspcurrent_page=home
httpwww cpc ncep noaa govproductsanalysis monitoringregional monitoringindex shtmlhttpwwwcpcncepnoaagovproductsanalysis_monitoringregional_monitoringindexshtml
httpwwwdroughtnoaagovindexhtml
The 10 Commandments
Of Successful Commodity TradingOf Successful Commodity Trading
IV Thou shalt not let thy emotions rule
Separate what you think from what you want
Fundamental AnalysisFundamental Analysis
bull The use of information regarding the factors of supply and demand for a given commodity to formulate a price estimate
Price Estimation using Demand d S land Supply
SupplyP Supply
New Supply
P
Old Price
New Price
DemandNew Demand
New Price
Q
Wh d thi tt Why does this matter
bull Price changes due to changes in demand are usually sustained for longer periods of time
bull Price changes due to changes in supply are usually short livedsupply are usually short lived
Schematic Representation of the US Grain Marketp
B S k E di St k
Factors of Supply = Factors of Demand
Grain
Beg Stocks Ending Stocks
GrainPrice
Imports Exports
Production Domestic Use
Area
Yield
Returns from Competing
Crops
Corn US SupplyDemand (million bushels)pp y ( )
200506 200607 200708 200809 200910SupplyBeginning Stks 2114 1967 1304 1624 1673Beginning StksProduction
211411114
196710531
130413038
162412101
167313151
Total Supply 13237 12510 14362 13739 14834DisappearanceDisappearanceDomestic UseExports
91362134
90812125
103002437
102071858
110202050
T l U 11 270 11 207 12 737 12 065 13 070Total Use 11270 11207 12737 12065 13070
Ending StksCarryoverUse ()
19671745
13041164
16241275
16741387
17641350
11210
Avg Farm Price 200 304 420 406 370
US Corn UseUS Corn Use
7 000
Million bushels
5000 6000 7000
Feed and Residual
2 0003000 4000
Ethanol
0 1000 2000
7 9 1 3 5 7 9
Exports
Food Seed and Other
9697
9899
0001
0203
0405
0607
0809
Industrial
Source USDA revised 11210
US Corn Supply and DemandMil bu
11210
Stock to Use RatioStock to Use Ratio
bull The stock to use ratio is a convenient measure of supply and demand interrelationships of commodities
bull The stocks to use ratio indicates the level of carryover stock for a given commodity as a percentage of the total demand or use
Stocks to Use RatioStocks to Use Ratio
M th ti l f l f thi l ti hiMathematical formula for this relationship
Ending Stocks = Beg Stocks + Production +Ending Stocks = Beg Stocks + Production + Imports ndash Domestic Use ndash Exports
Total Use = Domestic Use + Exports
St k t U E di St k T t l UStocks to Use = Ending Stocks divide Total Use
Multiply by 100 to express as a percentageMultiply by 100 to express as a percentage
Season Average Corn Price vs US Ending Stocks-to-Useg196980 ndash 200910
45 70
3 0
35
40
50
60Average Price
2 025
30
$B
u
30
40
Perc
ent
10
15
20
20
30 P
00
05
69 71 73 75 77 79 81 83 85 87 89 91 93 95 97 99 01 03 05 07 090
10US Ending Stks-to-Use
121009
69 71 73 75 77 79 81 83 85 87 89 91 93 95 97 99 01 03 05 07 09
SAFP to 5-yr avg Stocks to U R tiUse Ratio
500 1011
$bu
3 50
400
45008090708
0910
y = 17132x-0221
Rsup2 = 02755250
300
350
100
150
200
Y = -00887X + 03579R2 = 0 629
000
050
0 0 2 0 4 0 6 0 8
R2 = 0629
0 02 04 06 08
U S Corn Crop ConditionUS Corn Crop Condition
1507 1539 1604
China Net Trade000 MT
10000
20000
Exports
‐10000
0
‐30000
‐20000Imports
‐50000
‐40000
‐60000
Coarse Grain Wheat Soybeans Rice
Source USDA and FAPRI
US Corn Supply and Demand 11210mil bu
US Corn Stocks All Positions000 bu
NASS report date 11210
World Per Capita Grain UseWorld Per Capita Grain Usekg
corn barley sorghum rye oats millet mixed grains wheat rice121009
World Per Capita ConsumptionKg
Yr to Yr 10-yr
+18
-0-0
-0
+22
Updated 121009
World Corn Days of Use on Hand
11210
Food versus FuelFood versus Fuel
2007 US Biofuel Mandates Billi llBillion gallons
Source FAPRI and RFA
Break even price of Corn for Eth lEthanol
Y=3x-162
Long-Run Impact of Corn-Based Ethanol on the Grain Oilseed and Livestock Sectors A Preliminary Assessment TheAmani Elobeid Simla Tokgoz Dermot J Hayes Bruce A Babcock Chad E Hart[06-BP 49]
Ethanol Returns
Cattle CrushCattle Crush$head
Global Economic GrowthGlobal economic growth is being driven by developing nations
810
e
Real GDP Growth 1980 - 2010
246
nt C
hang
e
-4-20
1980
1982
1984
1986
1988
1990
1992
1994
1996
1998
2000
2002
2004
2006
2008
2010
Perc
en
-6Advanced Economies Emerging and Developing Economies
World Change in Crude OilWorld Change in Crude Oil
Source httpwwwimforgexternaldatamapperindexphp
World Liquid Fuel ConsumptionMillion barrels per day
Energy Information Administration Short-term Energy Outlook December 2009
US Stocks of Crude Oil and P t l P d tPetroleum Products
Weekly Petroleum Status Report Energy Information Administration December 25 2009
Crude Oil and Natural Gas N b F t P iNearby Futures Prices
Outside MarketsDollar Crude OilDollar Crude Oil
C Eth lCopper Ethanol
Wheat Corn and Soybeans Speculative Investment
Net long contracts centbu
Source CFTC released 11210
Corn Speculative Investment
Net Long Contracts centbu
Anhydrous Ammonia Prices$t$ton
April Prices USDA
Bushels of Corn to buy 1 ton of A h d A iAnhydrous Ammonia
Soybean Harvested AcresSoybean Harvested Acresmillion acres
Yield per acre is very similar asymp 42 bushels
2010 SoybeanCorn Price Ratio(weekly average closing prices)(weekly average closing prices)
0809 0910 1011Planted Acreage (Mil Acs) 860 865 900Harvested Acreage (Mil Acs)Yield (Bushels)
7861539
7961652
8161575
Supply - - - Million Bushels - - -
US CornBeginning StocksProductionImports
162412092
14
167313151
10
176412855
10
SampD
pTotal Supply 13729 14834 14619Disappearance
Feed and Residual 5 246 5 550 5 600
January 12 2010
Feed and ResidualFood Seed amp IndustrialExports
524649531858
555054702050
560057252100
T t l U 12 056 13 070 13 425Total Use 12056 13070 13425Ending Stocks 1673 1764 1194CarryoverUse () 139 135 89Average Farm Price ($Bu) 406 370 444Closing Price Dec Futures 360 392 444
Marketing PhilosophiesMarketing Philosophies
R d Aibull Ready Aim Aim Aim Aim Aim helliphelliphellip
bull Ready Fire AimAim
The man who insists on seeing with gperfect clearness before he decides never decidesHenri-Freacutedeacuteric Amiel
3
The Ethanol Industry
The Future of the Ethanol Industry
Presented Byy
Dr Steve AmossonRegents FellowgProfessor and Extension Economist
Presentation OutlinePresentation OutlineHow We Got Where We AreHow We Got Where We AreCurrent Status of EthanolC t d R t f Eth lCost and Returns of EthanolEthanol in the High PlainsCellulosic Ethanol Time LineSummary and Conclusionsy
Complex Economic Relationships
Bioenergy Success or Failure Depends
Complex Economic Relationships
Bioenergy Success or Failure Depends on
Oil indash Oil pricesndash Processing coststechnology
R l ti f d t k tndash Relative feedstock costsndash Demand for the biofuelsndash Technology improvementsndash Government Policy
Ethanolt a ol
E85ndash Motor fuel blend of 85
ethanol and 15 gasoline
E10ndash Motor fuel blend of 10 ethanol and
90 gasoline
Currently primarily comes from corn y p y but any grain crop will work
Largely due to Government policies ethanol production grew from about 62 million gallons in 1976grew from about 62 million gallons in 1976
to over 2 billion gallons in 2002Surface Transportation
2500
Million gallons
Energy Tax Actof 1978 gaveethanol a $040gal
Assistance Act of 1983 increased ethanol tax exemption to $050gal and the blenderrsquos income tax credit to $050gal
MTBE discovered inCalifornia drinking waterin 1998
1500
2000g
credit on the Federalmotor fuels tax Regulations under the
Clean Air Act Amendments of 1990started in 1992Blenderrsquos
Income tax dit f
RFG beginsin 1995
500
1000
Tax Reform Act of 1984increased ethanol taxexemption to $060gal and the blenderrsquos income tax credit to
In 1999 CaliforniaGovernor banned MTBEby 1203
credit of$040gal
Energy policy Act of 1992 applied ethanoltax credits to lower blends
0
1976
1978
1980
1982
1984
1986
1988
1990
1992
1994
1996
1998
2000
2002
blender s income tax credit to $060gal
tax credits to lower blends
Source US Energy Information Administration and USDA ERS
EthanolBasic Facts
Currently one bushel of corn produces 28 gallons of ethanol overall 275g By Productsndash 17 75 lbs of distillers dried grainndash 1775 lbs of distillers dried grainndash CO2
Figure 3
Total 11693 mil Bu
E h l P d iEthanol ProductionndashJanuary 2009 Est
Status Plants Capacityp y(Billions of Gallons)
Operating 193 1274
Under Construction 20 204
213 1478
US Average Regular Gas and Ethanol Prices Monthly 1991 ndash 2006
35
4
2
25
3
allo
n
Ethanol
1
15
2
$G
a
Reg Gas
0
05
991992
993994
995996
997998
999000
001002
003004
005006
19911992
19931994
19951996
19971998
19992000
20012002
20032004
20052006
Source Renewable Fuels Association
Ethanol PricesRelative to Unleaded Gas
Time Price Relationship
lsquo82 ndash lsquo05 Premium Basis
2006 +$64
Aug lsquo07 +$10
Oct rsquo07 $ 45Oct 07 -$45
Jan lsquo09 +$ 54Jan 09 +$54
US Ethanol Situation-Spring lsquo09 2nd L t fi i b k t2nd Largest firm in bankruptcy5-8 more in bankruptcy24 28 f l ti l t idl d24-28 formerly operating plants idled Several completed or nearly complete plants delay opening
Returns near break-evenSevere loss in asset valuesGovt Mandates support corn processing demand near current level -- ldquoblending wallrdquo issueIdle operating capacity 135-150 mil tons cornIdle plants =14-18 of capacity
Ethanol Plant Operating MarginsOperating Margins
Natrsquol Gas
Profit
Corn
Profit
I donrsquot particularly see anyone outside the ethanol industry trying to get into the industry now That would be like running into a burning barnmdashSander Cohen industry analyst
Bellwether MarketBellwether MarketCorn $bu
Crude $bbl
Statistician A man who believes figures dont lie but admits that under analysis some of them wont stand up either ndash Evan Esar
40109 updated 5609
July lsquo10 crude oil
July rsquo10 corn5609
y 40109
July rsquo10 crude 5609
$barrel
Spot Crude20909
July 2010 $6165 brings corn near
$480bu
Proposed amp Initiated Ethanol Plants and Their Grain Requirement
Ethanol Capacity Million
Corn Required Million Corn Acres
and Their Grain Requirement
Location Company Million galyr
Million bushels
Corn Acres Required
Levelland LevellandHockey 40 148 76365Muleshoe Panda Energy 100 37 0 190 913Muleshoe Panda Energy 100 370 190913Plainview White Energy 100 370 190913Hereford Panda Energy 100 370 190913H f d Whit E 100 37 0 190 913Hereford White Energy 100 370 190913Dumas Pan Ener of Dumas 30 111 57274Stratford Panda Energy 100 370 190913Total 570 2111 108820227 gallons of ethanol produced from a bushel of corn194 buacre base on TASS 2005
Energy BillEnergy BillSigned into law 121907Requires 36 billion gallons of ethanol use by 2022yMandates that 21 of the 36 billion gallons come from feedstocks othergallons come from feedstocks other than corn
Renewable Fuels Standard MandateRenewable Fuels Standard MandateEnacted under the Clean Air Act ndash Applies to bl dblendersEPA is the Enforcement AgencyStandard calculated for the year in November based on previous 12 months gas use
C l l d i l b indash Calculated on a national basisndash 111 billion gallons of ethanolndash 2009 ndash 1021 must be RF
The larger volume blenders would be impacted less
RFS Mandate PenaltiesRFS Mandate PenaltiesReturn ill begotten gainsReturn ill begotten gainsPlus $25000 fine per day or $9 125 000$9125000yrTechnically-If out of compliance for a y pday could be considered out of compliance for the year-EPArsquos discretionp y
2007 US Biofuel Mandates Billion gallonsf Billion gallons
Source FAPRI and RFA
Applicable volume of
Calendar Year
renewable fuel (in billions of gallons)
2006 402007 4 72007 472008 902009 1112010 12952011 13952012 1522013 16552014 18 152014 18152015 2052016 22252017 2402018 2602019 2802020 3002021 33 02021 3302022 360
Source High Plains Journal 010708
Renewable Fuel StandardsEthanol-Corn Use
Year Renewable Fuel Billing of Gallons
Corn ReqBilling of Bushels
Net Even Req Billing of bushels
2008 90 321 220
2009 111 396 271
2010 1295 463 316
2011 1395 498 340
2012 152 543 371
Assumes 28 galbushel and 1775 lbs of DGrsquos produced
Distillerrsquos GrainDistiller s Grain2009 2010
Corn for Eth l (b ) 3 964 000 4 62 000Ethanol (bu) 3964000 4625000Distillers Grain (bu) 1257000 1466000N t CNet Corn Use (bu) 2707000 3159000
P blProblem
BiBiggerggProblemProblem
ldquoI have established a goal to have 60 billion
gallons of our fuel comefrom sustainable
affordable biofuelsin 2022helliprdquo
Biofuels grow but fall short of the 36 billion gallon RFS target in 2022 exceed it in 2035
billion gallon-equivalents
45 R bl
35
40
45 Legislated RFS in 2022
RFS with Biomass-to-
liquids
Renewable diesel
20
25
30 adjustments under CAA Sec211(o)(7) Biodiesel
Oth
q
Net ethanol imports
10
15
20 Other feedstocks Cellulosic
ethanol
0
5
2008 2022 2022 in 2035
Corn ethanol
Richard Newell SAIS December 14 2009 29
2008 2022 2022 inAEO2009
2035
Source Annual Energy Outlook 2010
Ethanol Blend AnnouncementEthanol Blend Announcement
The announcement was made onDec 1 which was the deadline forEPA to respond to a request fromp qethanol producers who want theblend limit raised from the currentblend limit raised from the current10 to 15
Blending Wall for EthanolBlending Wall for Ethanol
Federal standards set the maximum of ethanolFederal standards set the maximum of ethanol blending at 10 of the total gas supply - -Additional to E85Concerns over vehicle ability to use it mileage and transportation infrastructureCurrent annual fuel consumption in the US about 130 ndash 140 billion gallonsCurrently blending wall is estimated at 12 13Currently blending wall is estimated at 12 ndash 13 billion gallons of ethanol
Blending Wall ObservationsBlending Wall - Observations
B il h b i hi h bl d t (E20Brazil has been using higher blend rates (E20 ndashE30) without any problemsLong term need to modify production processesLong term - - need to modify production processes or product (butanol)Short term solution Raise blending limit to E12Short term solution - - Raise blending limit to E12 or E15 or E20Long term problem - - increased pressure onLong term problem increased pressure on ethanol prices due to added production (cellulosic)
SteversquosSteve s Crystal BallCrystal Ball
Whatrsquos coming in the
Wi dS l Stfuture
WindSolar StorageImproved Electric CarsImproved Electric CarsAlgae OilH-H-OTh A M bilThe Amosson Mobile
Summary and ConclusionsyShort Run
E d d h l d i iExpanded ethanol production is probably a given however the pace is expected to slow do to capacity and policyp yThe President Elect and Secretary of Ag are big supporters of Renewable Fuelsare big supporters of Renewable FuelsCurrent Ethanol Margins have turned
i ipositive
Summary and ConclusionsSummary and Conclusions
Ethanol Production is and will suffer fromEthanol Production is and will suffer from growing painsndash Demand amp SupplyDemand amp Supply
DDG prices will be falling (relatively) making them attractive for livestock rationsThe limit on corn based ethanol and the growth in yields will eventually cap corn prices in the LRBl di ll d ll l i d i illBlending wall and cellulosic production will become a problem in the future for corn based ethanolethanol
Educational programs of Texas AgriLife Extension Service are open to all people without regard to race color sexare open to all people without regard to race color sex
disability religion age or national origin
4
Corn amp Sorghum Basis
Information
BasisMarketing Plan Seminar
Mark WelchmdashGrain Marketing EconomistJanuary 20 2010
Improving Lives Improving Texas
BasisBasis
bull The amount that the local cash price of a commodity is above or below the futures price for a pparticular month
bull Impacted by transportation costsImpacted by transportation costs storage and handling interest charges supply and demandcharges supply and demand fundamentals
(basis = cash - futures)(basis = cash - futures)
Corn Prices in the Triangle A F t C h B iArea Futures Cash Basis
600
400
500
200
300
(1 00)
000
100
(100)
basis cash futures
Sorghum Prices North of the C di C F t C h B iCanadian Corn Futures Cash Basis600
400
500
200
300
000
100
-100
Basis Corn Futures Cash
Basis
bull Basis exists mainly because of carrying y y gcharge arbitrage between futures and cash markets and transportation costsndash The carrying charge exists because stored
commodities are harvested and stored one time each year There are financingtime each year There are financing storage and management cost associated with carrying charge
ndash Because of carrying charge it is likely that the deferred futures price will be higher than cash price or basis with a negative p gsign will exist during harvest
BasisBasis
bull Transportation costs also affect the local basis The grain handler receives a bid from buyer determines the transportation cost to deliver the grain and subtract that cost from the price bid to determine the local price paid to the farmer
BasisBasis
bull Basis may also serve as a barometer of market strength or weakness
bull Improving basis is a sign of underlying strength in market demand
bull Declining basis is a sign of weak demanddemand
BasisBasis
bull There are times when the formula generates a basis with a positive sign
bull This denotes that the cash price is higher than futures price or cash pricehigher than futures price or cash price is selling at a premium to the futures
bull This occurs because supplydemandThis occurs because supplydemand relationships in the local cash market is different from futures market The local
l f i i th k t bsupply of grain in the market may be limited relative to demand or demand may be relatively higher than supply inmay be relatively higher than supply in the local market
Basis
bull The observed basis is termed asThe observed basis is termed as strong when the present basis is more positive or less negativemore positive or less negative than the historic average basis
For example assume that thendash For example assume that the average basis for a hypothetical market is -$035 per bushel The $ ppresent basis is -$010
ndash Therefore present basis is strong p grelative to the historic average
Basis
bull Similarly the observed basis isSimilarly the observed basis is termed as weak when the present basis is less positive or morebasis is less positive or more negative than the historic averagendash For example assume that theFor example assume that the
average basis for a hypothetical market is -$035 per bushel The present basis is -$045
ndash Therefore present basis is weak relative to the historic average
BasisCash Price ndash Futures Price = Basisbull Is the relationship between a local cash market and theIs the relationship between a local cash market and the
futures market
bull Can be negative or positiveCan be negative or positive
bull Is more stable than cash or futures prices
Basis Componentsbull Storage (insurance and interest)
bull Transportation
bull Local supply and demand
The Role of Basis in Hedgingg gBasis describes the price relationship between cash market prices and futures market prices at a particular time and location Basis is the number of cents (dollars) per unit that the local cash price of a commodity is above or below the current priceper unit that the local cash price of a commodity is above or below the current price for a particular futures contract delivery month on a given day Thus basis is the cash market price minus the futures market price at a specific time
Basis is important yet often the least understood concept in hedging agricultural p y p g g gcommodities An understanding and an accurate estimate of basis is needed by farmers and rancher who want to include hedging as part of their pricing strategy
Basis is important because approximately 97 percent of all agricultural commodities traded in the futures market are offset before delivery Therefore because the actualtraded in the futures market are offset before delivery Therefore because the actual physical commodity is mostly sold on the cash market the hedged futures price will not be the realized price for the commodity An estimate of that price can be calculated using the basis
A knowledge of the local basis is necessary to translate a given futures price into probable effective price for local delivery The futures price plus the expected basis (with appropriate arithmetic sign) is an estimate of the price the futures market is offering for the commodity delivered to the local market during a particular month Remember the basis is cash minus futures Therefore when the basis is negative gthe futures price is reduced by the amount of the basis When the basis is positive the futures price is increased by the basis value
Market CarryNormal Market
Sept
July $235
Sept $238
Mar
May $222
Dec $200
$212
Market CarryInverted Market
Dec $3 26
May $306
Mar $311
$326
Sept
July $299
$280
Basis and Expected PriceBasis and Expected Pricebull Knowledge of local basis is
t t l t inecessary to translate a given futures price into a probable price f l l d lifor local delivery
bull The futures price adjusted for basis is the price the market is offering for your grain delivered at a local elevator during a particular month(expected price = futures + basis)( p p )
Expected Price -$050 basisExpected Price $050 basis
5 1
49
51
45
47
Cash
4 1
43
39
41
450 460 470 480 490 500 510 520 530 540 550
December Futures
Texas Corn Basis in Oct vs Dec Contract Hi h L A (2005 09)High Low Average (2005-09)
North of the
0 30
040
0 30
040Canadian Triangle Area South of Line
0 10
020
030
0 10
020
030
0 10
000
010
0 10
000
010
0 30
-020
-010
0 30
-020
-010
Oct 2010 -030-030
Source httpmastermarketertamuedu
Basis Tracking FormBasis Table
Commodity LocationNearby Futures Contract Harvest Delivery
CashFutures Contract
Futures Contract
Forward Cash
Contract
Harvest Contract Futures Implied
Basis Contract
Date Price Month Price Basis Offer Price Basis Offer
Basis Corn North of the C diCanadian
Basis Sorghum North of the C diCanadian
Basis Expected Harvest Basis
Expected Mar 1 Basis
Expected May 1 BasisExpected May 1 Basis
If short crop basis will
If large crop basis will
StrategiesStrategies
NOTES

2
Feedgrain
Fundamentals
Grain Market FundamentalsSupply and Demand Analysis
Mark WelchmdashGrain Marketing EconomistJanuary 19 2010
Improving Lives Improving Texas
bull ldquoWithout the runaway demandrunaway demand growth of ethanol many of the recent stories need to be rewritten in shortrewritten in short orderrdquo
bull
Michael Swanson
Pumping ethanol from corn in 1933
--Michael Swanson Economics Department Wells Fargo
httpwwwnassusdagovPublicationsindexasp
httpwwwersusdagovBriefing
httpwwwfasusdagovpsdonlinepsdHomeaspx
httpwwwfaprimissourieduindexaspcurrent_page=home
httpwww cpc ncep noaa govproductsanalysis monitoringregional monitoringindex shtmlhttpwwwcpcncepnoaagovproductsanalysis_monitoringregional_monitoringindexshtml
httpwwwdroughtnoaagovindexhtml
The 10 Commandments
Of Successful Commodity TradingOf Successful Commodity Trading
IV Thou shalt not let thy emotions rule
Separate what you think from what you want
Fundamental AnalysisFundamental Analysis
bull The use of information regarding the factors of supply and demand for a given commodity to formulate a price estimate
Price Estimation using Demand d S land Supply
SupplyP Supply
New Supply
P
Old Price
New Price
DemandNew Demand
New Price
Q
Wh d thi tt Why does this matter
bull Price changes due to changes in demand are usually sustained for longer periods of time
bull Price changes due to changes in supply are usually short livedsupply are usually short lived
Schematic Representation of the US Grain Marketp
B S k E di St k
Factors of Supply = Factors of Demand
Grain
Beg Stocks Ending Stocks
GrainPrice
Imports Exports
Production Domestic Use
Area
Yield
Returns from Competing
Crops
Corn US SupplyDemand (million bushels)pp y ( )
200506 200607 200708 200809 200910SupplyBeginning Stks 2114 1967 1304 1624 1673Beginning StksProduction
211411114
196710531
130413038
162412101
167313151
Total Supply 13237 12510 14362 13739 14834DisappearanceDisappearanceDomestic UseExports
91362134
90812125
103002437
102071858
110202050
T l U 11 270 11 207 12 737 12 065 13 070Total Use 11270 11207 12737 12065 13070
Ending StksCarryoverUse ()
19671745
13041164
16241275
16741387
17641350
11210
Avg Farm Price 200 304 420 406 370
US Corn UseUS Corn Use
7 000
Million bushels
5000 6000 7000
Feed and Residual
2 0003000 4000
Ethanol
0 1000 2000
7 9 1 3 5 7 9
Exports
Food Seed and Other
9697
9899
0001
0203
0405
0607
0809
Industrial
Source USDA revised 11210
US Corn Supply and DemandMil bu
11210
Stock to Use RatioStock to Use Ratio
bull The stock to use ratio is a convenient measure of supply and demand interrelationships of commodities
bull The stocks to use ratio indicates the level of carryover stock for a given commodity as a percentage of the total demand or use
Stocks to Use RatioStocks to Use Ratio
M th ti l f l f thi l ti hiMathematical formula for this relationship
Ending Stocks = Beg Stocks + Production +Ending Stocks = Beg Stocks + Production + Imports ndash Domestic Use ndash Exports
Total Use = Domestic Use + Exports
St k t U E di St k T t l UStocks to Use = Ending Stocks divide Total Use
Multiply by 100 to express as a percentageMultiply by 100 to express as a percentage
Season Average Corn Price vs US Ending Stocks-to-Useg196980 ndash 200910
45 70
3 0
35
40
50
60Average Price
2 025
30
$B
u
30
40
Perc
ent
10
15
20
20
30 P
00
05
69 71 73 75 77 79 81 83 85 87 89 91 93 95 97 99 01 03 05 07 090
10US Ending Stks-to-Use
121009
69 71 73 75 77 79 81 83 85 87 89 91 93 95 97 99 01 03 05 07 09
SAFP to 5-yr avg Stocks to U R tiUse Ratio
500 1011
$bu
3 50
400
45008090708
0910
y = 17132x-0221
Rsup2 = 02755250
300
350
100
150
200
Y = -00887X + 03579R2 = 0 629
000
050
0 0 2 0 4 0 6 0 8
R2 = 0629
0 02 04 06 08
U S Corn Crop ConditionUS Corn Crop Condition
1507 1539 1604
China Net Trade000 MT
10000
20000
Exports
‐10000
0
‐30000
‐20000Imports
‐50000
‐40000
‐60000
Coarse Grain Wheat Soybeans Rice
Source USDA and FAPRI
US Corn Supply and Demand 11210mil bu
US Corn Stocks All Positions000 bu
NASS report date 11210
World Per Capita Grain UseWorld Per Capita Grain Usekg
corn barley sorghum rye oats millet mixed grains wheat rice121009
World Per Capita ConsumptionKg
Yr to Yr 10-yr
+18
-0-0
-0
+22
Updated 121009
World Corn Days of Use on Hand
11210
Food versus FuelFood versus Fuel
2007 US Biofuel Mandates Billi llBillion gallons
Source FAPRI and RFA
Break even price of Corn for Eth lEthanol
Y=3x-162
Long-Run Impact of Corn-Based Ethanol on the Grain Oilseed and Livestock Sectors A Preliminary Assessment TheAmani Elobeid Simla Tokgoz Dermot J Hayes Bruce A Babcock Chad E Hart[06-BP 49]
Ethanol Returns
Cattle CrushCattle Crush$head
Global Economic GrowthGlobal economic growth is being driven by developing nations
810
e
Real GDP Growth 1980 - 2010
246
nt C
hang
e
-4-20
1980
1982
1984
1986
1988
1990
1992
1994
1996
1998
2000
2002
2004
2006
2008
2010
Perc
en
-6Advanced Economies Emerging and Developing Economies
World Change in Crude OilWorld Change in Crude Oil
Source httpwwwimforgexternaldatamapperindexphp
World Liquid Fuel ConsumptionMillion barrels per day
Energy Information Administration Short-term Energy Outlook December 2009
US Stocks of Crude Oil and P t l P d tPetroleum Products
Weekly Petroleum Status Report Energy Information Administration December 25 2009
Crude Oil and Natural Gas N b F t P iNearby Futures Prices
Outside MarketsDollar Crude OilDollar Crude Oil
C Eth lCopper Ethanol
Wheat Corn and Soybeans Speculative Investment
Net long contracts centbu
Source CFTC released 11210
Corn Speculative Investment
Net Long Contracts centbu
Anhydrous Ammonia Prices$t$ton
April Prices USDA
Bushels of Corn to buy 1 ton of A h d A iAnhydrous Ammonia
Soybean Harvested AcresSoybean Harvested Acresmillion acres
Yield per acre is very similar asymp 42 bushels
2010 SoybeanCorn Price Ratio(weekly average closing prices)(weekly average closing prices)
0809 0910 1011Planted Acreage (Mil Acs) 860 865 900Harvested Acreage (Mil Acs)Yield (Bushels)
7861539
7961652
8161575
Supply - - - Million Bushels - - -
US CornBeginning StocksProductionImports
162412092
14
167313151
10
176412855
10
SampD
pTotal Supply 13729 14834 14619Disappearance
Feed and Residual 5 246 5 550 5 600
January 12 2010
Feed and ResidualFood Seed amp IndustrialExports
524649531858
555054702050
560057252100
T t l U 12 056 13 070 13 425Total Use 12056 13070 13425Ending Stocks 1673 1764 1194CarryoverUse () 139 135 89Average Farm Price ($Bu) 406 370 444Closing Price Dec Futures 360 392 444
Marketing PhilosophiesMarketing Philosophies
R d Aibull Ready Aim Aim Aim Aim Aim helliphelliphellip
bull Ready Fire AimAim
The man who insists on seeing with gperfect clearness before he decides never decidesHenri-Freacutedeacuteric Amiel
3
The Ethanol Industry
The Future of the Ethanol Industry
Presented Byy
Dr Steve AmossonRegents FellowgProfessor and Extension Economist
Presentation OutlinePresentation OutlineHow We Got Where We AreHow We Got Where We AreCurrent Status of EthanolC t d R t f Eth lCost and Returns of EthanolEthanol in the High PlainsCellulosic Ethanol Time LineSummary and Conclusionsy
Complex Economic Relationships
Bioenergy Success or Failure Depends
Complex Economic Relationships
Bioenergy Success or Failure Depends on
Oil indash Oil pricesndash Processing coststechnology
R l ti f d t k tndash Relative feedstock costsndash Demand for the biofuelsndash Technology improvementsndash Government Policy
Ethanolt a ol
E85ndash Motor fuel blend of 85
ethanol and 15 gasoline
E10ndash Motor fuel blend of 10 ethanol and
90 gasoline
Currently primarily comes from corn y p y but any grain crop will work
Largely due to Government policies ethanol production grew from about 62 million gallons in 1976grew from about 62 million gallons in 1976
to over 2 billion gallons in 2002Surface Transportation
2500
Million gallons
Energy Tax Actof 1978 gaveethanol a $040gal
Assistance Act of 1983 increased ethanol tax exemption to $050gal and the blenderrsquos income tax credit to $050gal
MTBE discovered inCalifornia drinking waterin 1998
1500
2000g
credit on the Federalmotor fuels tax Regulations under the
Clean Air Act Amendments of 1990started in 1992Blenderrsquos
Income tax dit f
RFG beginsin 1995
500
1000
Tax Reform Act of 1984increased ethanol taxexemption to $060gal and the blenderrsquos income tax credit to
In 1999 CaliforniaGovernor banned MTBEby 1203
credit of$040gal
Energy policy Act of 1992 applied ethanoltax credits to lower blends
0
1976
1978
1980
1982
1984
1986
1988
1990
1992
1994
1996
1998
2000
2002
blender s income tax credit to $060gal
tax credits to lower blends
Source US Energy Information Administration and USDA ERS
EthanolBasic Facts
Currently one bushel of corn produces 28 gallons of ethanol overall 275g By Productsndash 17 75 lbs of distillers dried grainndash 1775 lbs of distillers dried grainndash CO2
Figure 3
Total 11693 mil Bu
E h l P d iEthanol ProductionndashJanuary 2009 Est
Status Plants Capacityp y(Billions of Gallons)
Operating 193 1274
Under Construction 20 204
213 1478
US Average Regular Gas and Ethanol Prices Monthly 1991 ndash 2006
35
4
2
25
3
allo
n
Ethanol
1
15
2
$G
a
Reg Gas
0
05
991992
993994
995996
997998
999000
001002
003004
005006
19911992
19931994
19951996
19971998
19992000
20012002
20032004
20052006
Source Renewable Fuels Association
Ethanol PricesRelative to Unleaded Gas
Time Price Relationship
lsquo82 ndash lsquo05 Premium Basis
2006 +$64
Aug lsquo07 +$10
Oct rsquo07 $ 45Oct 07 -$45
Jan lsquo09 +$ 54Jan 09 +$54
US Ethanol Situation-Spring lsquo09 2nd L t fi i b k t2nd Largest firm in bankruptcy5-8 more in bankruptcy24 28 f l ti l t idl d24-28 formerly operating plants idled Several completed or nearly complete plants delay opening
Returns near break-evenSevere loss in asset valuesGovt Mandates support corn processing demand near current level -- ldquoblending wallrdquo issueIdle operating capacity 135-150 mil tons cornIdle plants =14-18 of capacity
Ethanol Plant Operating MarginsOperating Margins
Natrsquol Gas
Profit
Corn
Profit
I donrsquot particularly see anyone outside the ethanol industry trying to get into the industry now That would be like running into a burning barnmdashSander Cohen industry analyst
Bellwether MarketBellwether MarketCorn $bu
Crude $bbl
Statistician A man who believes figures dont lie but admits that under analysis some of them wont stand up either ndash Evan Esar
40109 updated 5609
July lsquo10 crude oil
July rsquo10 corn5609
y 40109
July rsquo10 crude 5609
$barrel
Spot Crude20909
July 2010 $6165 brings corn near
$480bu
Proposed amp Initiated Ethanol Plants and Their Grain Requirement
Ethanol Capacity Million
Corn Required Million Corn Acres
and Their Grain Requirement
Location Company Million galyr
Million bushels
Corn Acres Required
Levelland LevellandHockey 40 148 76365Muleshoe Panda Energy 100 37 0 190 913Muleshoe Panda Energy 100 370 190913Plainview White Energy 100 370 190913Hereford Panda Energy 100 370 190913H f d Whit E 100 37 0 190 913Hereford White Energy 100 370 190913Dumas Pan Ener of Dumas 30 111 57274Stratford Panda Energy 100 370 190913Total 570 2111 108820227 gallons of ethanol produced from a bushel of corn194 buacre base on TASS 2005
Energy BillEnergy BillSigned into law 121907Requires 36 billion gallons of ethanol use by 2022yMandates that 21 of the 36 billion gallons come from feedstocks othergallons come from feedstocks other than corn
Renewable Fuels Standard MandateRenewable Fuels Standard MandateEnacted under the Clean Air Act ndash Applies to bl dblendersEPA is the Enforcement AgencyStandard calculated for the year in November based on previous 12 months gas use
C l l d i l b indash Calculated on a national basisndash 111 billion gallons of ethanolndash 2009 ndash 1021 must be RF
The larger volume blenders would be impacted less
RFS Mandate PenaltiesRFS Mandate PenaltiesReturn ill begotten gainsReturn ill begotten gainsPlus $25000 fine per day or $9 125 000$9125000yrTechnically-If out of compliance for a y pday could be considered out of compliance for the year-EPArsquos discretionp y
2007 US Biofuel Mandates Billion gallonsf Billion gallons
Source FAPRI and RFA
Applicable volume of
Calendar Year
renewable fuel (in billions of gallons)
2006 402007 4 72007 472008 902009 1112010 12952011 13952012 1522013 16552014 18 152014 18152015 2052016 22252017 2402018 2602019 2802020 3002021 33 02021 3302022 360
Source High Plains Journal 010708
Renewable Fuel StandardsEthanol-Corn Use
Year Renewable Fuel Billing of Gallons
Corn ReqBilling of Bushels
Net Even Req Billing of bushels
2008 90 321 220
2009 111 396 271
2010 1295 463 316
2011 1395 498 340
2012 152 543 371
Assumes 28 galbushel and 1775 lbs of DGrsquos produced
Distillerrsquos GrainDistiller s Grain2009 2010
Corn for Eth l (b ) 3 964 000 4 62 000Ethanol (bu) 3964000 4625000Distillers Grain (bu) 1257000 1466000N t CNet Corn Use (bu) 2707000 3159000
P blProblem
BiBiggerggProblemProblem
ldquoI have established a goal to have 60 billion
gallons of our fuel comefrom sustainable
affordable biofuelsin 2022helliprdquo
Biofuels grow but fall short of the 36 billion gallon RFS target in 2022 exceed it in 2035
billion gallon-equivalents
45 R bl
35
40
45 Legislated RFS in 2022
RFS with Biomass-to-
liquids
Renewable diesel
20
25
30 adjustments under CAA Sec211(o)(7) Biodiesel
Oth
q
Net ethanol imports
10
15
20 Other feedstocks Cellulosic
ethanol
0
5
2008 2022 2022 in 2035
Corn ethanol
Richard Newell SAIS December 14 2009 29
2008 2022 2022 inAEO2009
2035
Source Annual Energy Outlook 2010
Ethanol Blend AnnouncementEthanol Blend Announcement
The announcement was made onDec 1 which was the deadline forEPA to respond to a request fromp qethanol producers who want theblend limit raised from the currentblend limit raised from the current10 to 15
Blending Wall for EthanolBlending Wall for Ethanol
Federal standards set the maximum of ethanolFederal standards set the maximum of ethanol blending at 10 of the total gas supply - -Additional to E85Concerns over vehicle ability to use it mileage and transportation infrastructureCurrent annual fuel consumption in the US about 130 ndash 140 billion gallonsCurrently blending wall is estimated at 12 13Currently blending wall is estimated at 12 ndash 13 billion gallons of ethanol
Blending Wall ObservationsBlending Wall - Observations
B il h b i hi h bl d t (E20Brazil has been using higher blend rates (E20 ndashE30) without any problemsLong term need to modify production processesLong term - - need to modify production processes or product (butanol)Short term solution Raise blending limit to E12Short term solution - - Raise blending limit to E12 or E15 or E20Long term problem - - increased pressure onLong term problem increased pressure on ethanol prices due to added production (cellulosic)
SteversquosSteve s Crystal BallCrystal Ball
Whatrsquos coming in the
Wi dS l Stfuture
WindSolar StorageImproved Electric CarsImproved Electric CarsAlgae OilH-H-OTh A M bilThe Amosson Mobile
Summary and ConclusionsyShort Run
E d d h l d i iExpanded ethanol production is probably a given however the pace is expected to slow do to capacity and policyp yThe President Elect and Secretary of Ag are big supporters of Renewable Fuelsare big supporters of Renewable FuelsCurrent Ethanol Margins have turned
i ipositive
Summary and ConclusionsSummary and Conclusions
Ethanol Production is and will suffer fromEthanol Production is and will suffer from growing painsndash Demand amp SupplyDemand amp Supply
DDG prices will be falling (relatively) making them attractive for livestock rationsThe limit on corn based ethanol and the growth in yields will eventually cap corn prices in the LRBl di ll d ll l i d i illBlending wall and cellulosic production will become a problem in the future for corn based ethanolethanol
Educational programs of Texas AgriLife Extension Service are open to all people without regard to race color sexare open to all people without regard to race color sex
disability religion age or national origin
4
Corn amp Sorghum Basis
Information
BasisMarketing Plan Seminar
Mark WelchmdashGrain Marketing EconomistJanuary 20 2010
Improving Lives Improving Texas
BasisBasis
bull The amount that the local cash price of a commodity is above or below the futures price for a pparticular month
bull Impacted by transportation costsImpacted by transportation costs storage and handling interest charges supply and demandcharges supply and demand fundamentals
(basis = cash - futures)(basis = cash - futures)
Corn Prices in the Triangle A F t C h B iArea Futures Cash Basis
600
400
500
200
300
(1 00)
000
100
(100)
basis cash futures
Sorghum Prices North of the C di C F t C h B iCanadian Corn Futures Cash Basis600
400
500
200
300
000
100
-100
Basis Corn Futures Cash
Basis
bull Basis exists mainly because of carrying y y gcharge arbitrage between futures and cash markets and transportation costsndash The carrying charge exists because stored
commodities are harvested and stored one time each year There are financingtime each year There are financing storage and management cost associated with carrying charge
ndash Because of carrying charge it is likely that the deferred futures price will be higher than cash price or basis with a negative p gsign will exist during harvest
BasisBasis
bull Transportation costs also affect the local basis The grain handler receives a bid from buyer determines the transportation cost to deliver the grain and subtract that cost from the price bid to determine the local price paid to the farmer
BasisBasis
bull Basis may also serve as a barometer of market strength or weakness
bull Improving basis is a sign of underlying strength in market demand
bull Declining basis is a sign of weak demanddemand
BasisBasis
bull There are times when the formula generates a basis with a positive sign
bull This denotes that the cash price is higher than futures price or cash pricehigher than futures price or cash price is selling at a premium to the futures
bull This occurs because supplydemandThis occurs because supplydemand relationships in the local cash market is different from futures market The local
l f i i th k t bsupply of grain in the market may be limited relative to demand or demand may be relatively higher than supply inmay be relatively higher than supply in the local market
Basis
bull The observed basis is termed asThe observed basis is termed as strong when the present basis is more positive or less negativemore positive or less negative than the historic average basis
For example assume that thendash For example assume that the average basis for a hypothetical market is -$035 per bushel The $ ppresent basis is -$010
ndash Therefore present basis is strong p grelative to the historic average
Basis
bull Similarly the observed basis isSimilarly the observed basis is termed as weak when the present basis is less positive or morebasis is less positive or more negative than the historic averagendash For example assume that theFor example assume that the
average basis for a hypothetical market is -$035 per bushel The present basis is -$045
ndash Therefore present basis is weak relative to the historic average
BasisCash Price ndash Futures Price = Basisbull Is the relationship between a local cash market and theIs the relationship between a local cash market and the
futures market
bull Can be negative or positiveCan be negative or positive
bull Is more stable than cash or futures prices
Basis Componentsbull Storage (insurance and interest)
bull Transportation
bull Local supply and demand
The Role of Basis in Hedgingg gBasis describes the price relationship between cash market prices and futures market prices at a particular time and location Basis is the number of cents (dollars) per unit that the local cash price of a commodity is above or below the current priceper unit that the local cash price of a commodity is above or below the current price for a particular futures contract delivery month on a given day Thus basis is the cash market price minus the futures market price at a specific time
Basis is important yet often the least understood concept in hedging agricultural p y p g g gcommodities An understanding and an accurate estimate of basis is needed by farmers and rancher who want to include hedging as part of their pricing strategy
Basis is important because approximately 97 percent of all agricultural commodities traded in the futures market are offset before delivery Therefore because the actualtraded in the futures market are offset before delivery Therefore because the actual physical commodity is mostly sold on the cash market the hedged futures price will not be the realized price for the commodity An estimate of that price can be calculated using the basis
A knowledge of the local basis is necessary to translate a given futures price into probable effective price for local delivery The futures price plus the expected basis (with appropriate arithmetic sign) is an estimate of the price the futures market is offering for the commodity delivered to the local market during a particular month Remember the basis is cash minus futures Therefore when the basis is negative gthe futures price is reduced by the amount of the basis When the basis is positive the futures price is increased by the basis value
Market CarryNormal Market
Sept
July $235
Sept $238
Mar
May $222
Dec $200
$212
Market CarryInverted Market
Dec $3 26
May $306
Mar $311
$326
Sept
July $299
$280
Basis and Expected PriceBasis and Expected Pricebull Knowledge of local basis is
t t l t inecessary to translate a given futures price into a probable price f l l d lifor local delivery
bull The futures price adjusted for basis is the price the market is offering for your grain delivered at a local elevator during a particular month(expected price = futures + basis)( p p )
Expected Price -$050 basisExpected Price $050 basis
5 1
49
51
45
47
Cash
4 1
43
39
41
450 460 470 480 490 500 510 520 530 540 550
December Futures
Texas Corn Basis in Oct vs Dec Contract Hi h L A (2005 09)High Low Average (2005-09)
North of the
0 30
040
0 30
040Canadian Triangle Area South of Line
0 10
020
030
0 10
020
030
0 10
000
010
0 10
000
010
0 30
-020
-010
0 30
-020
-010
Oct 2010 -030-030
Source httpmastermarketertamuedu
Basis Tracking FormBasis Table
Commodity LocationNearby Futures Contract Harvest Delivery
CashFutures Contract
Futures Contract
Forward Cash
Contract
Harvest Contract Futures Implied
Basis Contract
Date Price Month Price Basis Offer Price Basis Offer
Basis Corn North of the C diCanadian
Basis Sorghum North of the C diCanadian
Basis Expected Harvest Basis
Expected Mar 1 Basis
Expected May 1 BasisExpected May 1 Basis
If short crop basis will
If large crop basis will
StrategiesStrategies
NOTES
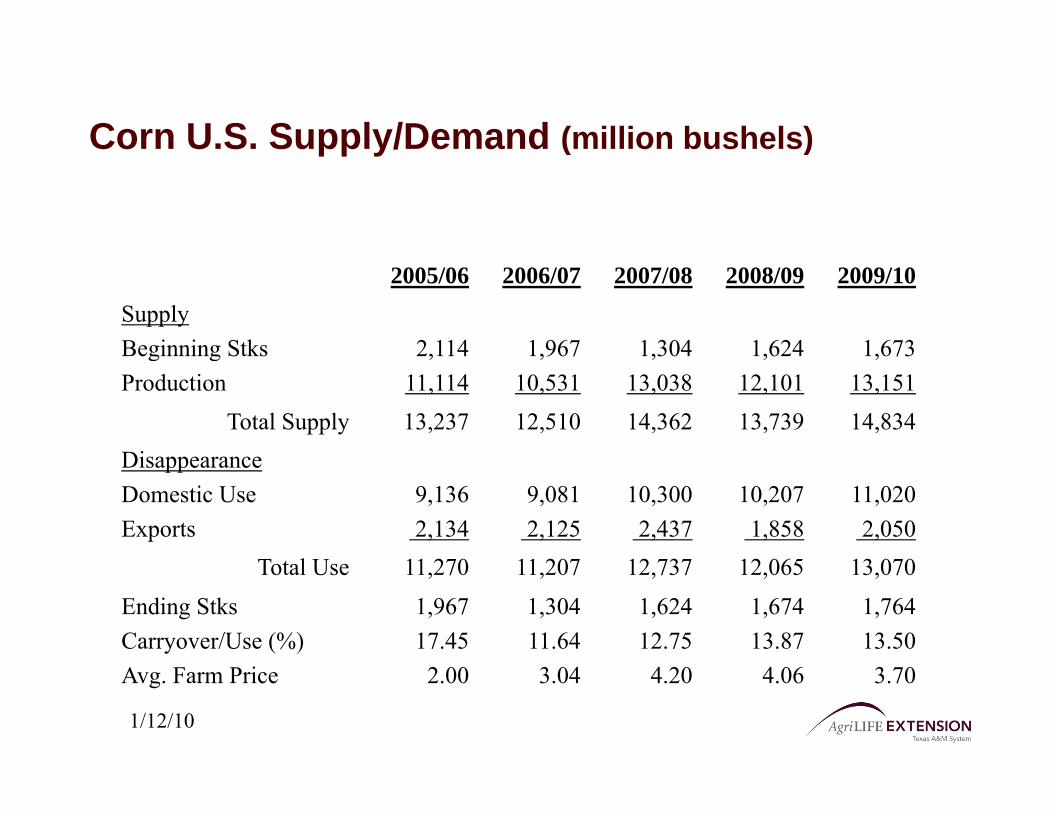
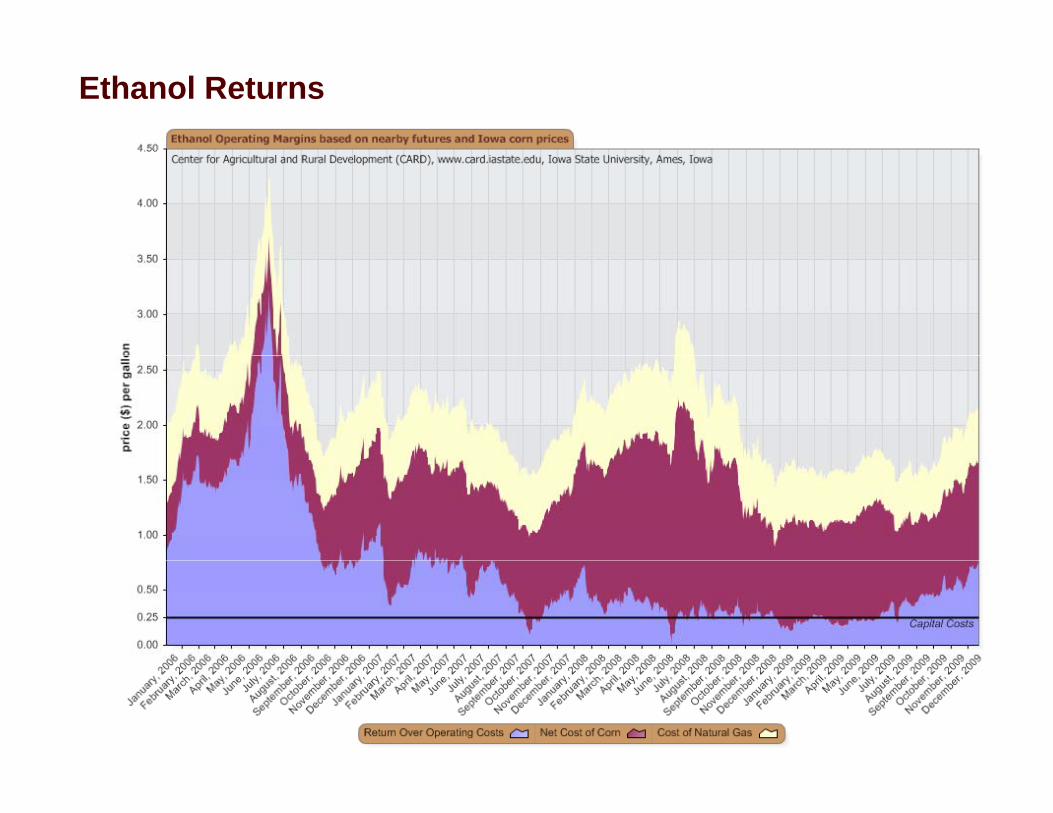
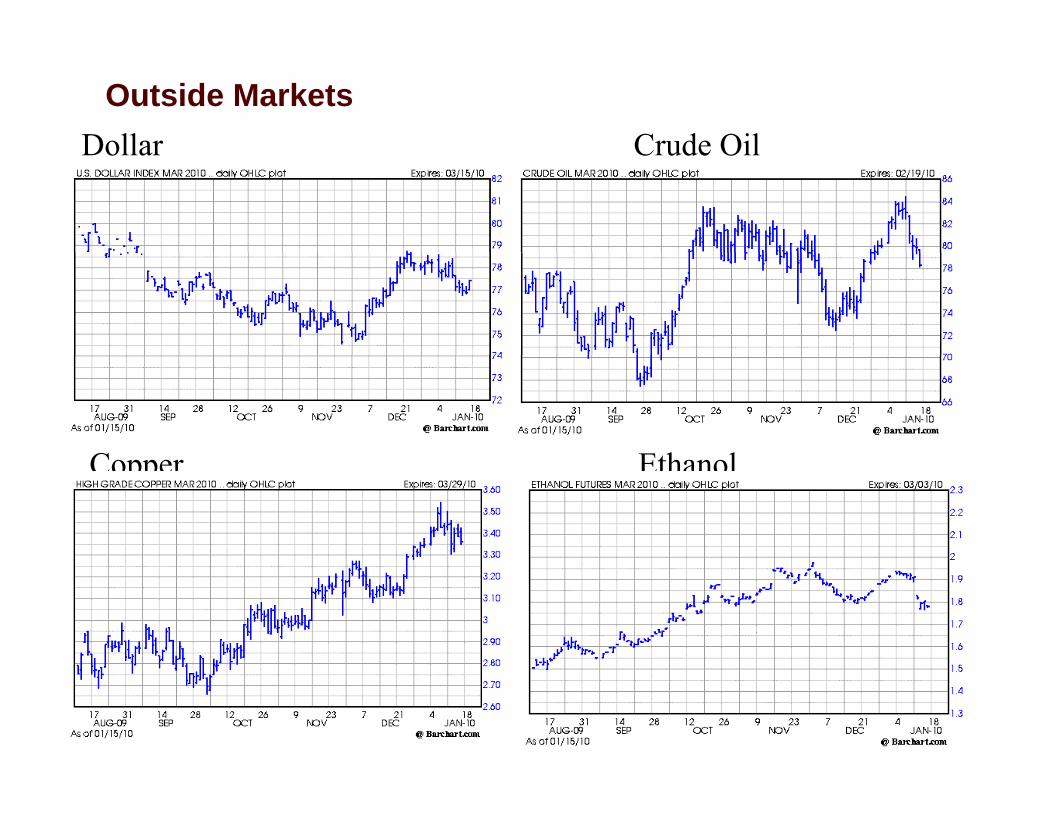

3
The Ethanol Industry
The Future of the Ethanol Industry
Presented Byy
Dr Steve AmossonRegents FellowgProfessor and Extension Economist
Presentation OutlinePresentation OutlineHow We Got Where We AreHow We Got Where We AreCurrent Status of EthanolC t d R t f Eth lCost and Returns of EthanolEthanol in the High PlainsCellulosic Ethanol Time LineSummary and Conclusionsy
Complex Economic Relationships
Bioenergy Success or Failure Depends
Complex Economic Relationships
Bioenergy Success or Failure Depends on
Oil indash Oil pricesndash Processing coststechnology
R l ti f d t k tndash Relative feedstock costsndash Demand for the biofuelsndash Technology improvementsndash Government Policy
Ethanolt a ol
E85ndash Motor fuel blend of 85
ethanol and 15 gasoline
E10ndash Motor fuel blend of 10 ethanol and
90 gasoline
Currently primarily comes from corn y p y but any grain crop will work
Largely due to Government policies ethanol production grew from about 62 million gallons in 1976grew from about 62 million gallons in 1976
to over 2 billion gallons in 2002Surface Transportation
2500
Million gallons
Energy Tax Actof 1978 gaveethanol a $040gal
Assistance Act of 1983 increased ethanol tax exemption to $050gal and the blenderrsquos income tax credit to $050gal
MTBE discovered inCalifornia drinking waterin 1998
1500
2000g
credit on the Federalmotor fuels tax Regulations under the
Clean Air Act Amendments of 1990started in 1992Blenderrsquos
Income tax dit f
RFG beginsin 1995
500
1000
Tax Reform Act of 1984increased ethanol taxexemption to $060gal and the blenderrsquos income tax credit to
In 1999 CaliforniaGovernor banned MTBEby 1203
credit of$040gal
Energy policy Act of 1992 applied ethanoltax credits to lower blends
0
1976
1978
1980
1982
1984
1986
1988
1990
1992
1994
1996
1998
2000
2002
blender s income tax credit to $060gal
tax credits to lower blends
Source US Energy Information Administration and USDA ERS
EthanolBasic Facts
Currently one bushel of corn produces 28 gallons of ethanol overall 275g By Productsndash 17 75 lbs of distillers dried grainndash 1775 lbs of distillers dried grainndash CO2
Figure 3
Total 11693 mil Bu
E h l P d iEthanol ProductionndashJanuary 2009 Est
Status Plants Capacityp y(Billions of Gallons)
Operating 193 1274
Under Construction 20 204
213 1478
US Average Regular Gas and Ethanol Prices Monthly 1991 ndash 2006
35
4
2
25
3
allo
n
Ethanol
1
15
2
$G
a
Reg Gas
0
05
991992
993994
995996
997998
999000
001002
003004
005006
19911992
19931994
19951996
19971998
19992000
20012002
20032004
20052006
Source Renewable Fuels Association
Ethanol PricesRelative to Unleaded Gas
Time Price Relationship
lsquo82 ndash lsquo05 Premium Basis
2006 +$64
Aug lsquo07 +$10
Oct rsquo07 $ 45Oct 07 -$45
Jan lsquo09 +$ 54Jan 09 +$54
US Ethanol Situation-Spring lsquo09 2nd L t fi i b k t2nd Largest firm in bankruptcy5-8 more in bankruptcy24 28 f l ti l t idl d24-28 formerly operating plants idled Several completed or nearly complete plants delay opening
Returns near break-evenSevere loss in asset valuesGovt Mandates support corn processing demand near current level -- ldquoblending wallrdquo issueIdle operating capacity 135-150 mil tons cornIdle plants =14-18 of capacity
Ethanol Plant Operating MarginsOperating Margins
Natrsquol Gas
Profit
Corn
Profit
I donrsquot particularly see anyone outside the ethanol industry trying to get into the industry now That would be like running into a burning barnmdashSander Cohen industry analyst
Bellwether MarketBellwether MarketCorn $bu
Crude $bbl
Statistician A man who believes figures dont lie but admits that under analysis some of them wont stand up either ndash Evan Esar
40109 updated 5609
July lsquo10 crude oil
July rsquo10 corn5609
y 40109
July rsquo10 crude 5609
$barrel
Spot Crude20909
July 2010 $6165 brings corn near
$480bu
Proposed amp Initiated Ethanol Plants and Their Grain Requirement
Ethanol Capacity Million
Corn Required Million Corn Acres
and Their Grain Requirement
Location Company Million galyr
Million bushels
Corn Acres Required
Levelland LevellandHockey 40 148 76365Muleshoe Panda Energy 100 37 0 190 913Muleshoe Panda Energy 100 370 190913Plainview White Energy 100 370 190913Hereford Panda Energy 100 370 190913H f d Whit E 100 37 0 190 913Hereford White Energy 100 370 190913Dumas Pan Ener of Dumas 30 111 57274Stratford Panda Energy 100 370 190913Total 570 2111 108820227 gallons of ethanol produced from a bushel of corn194 buacre base on TASS 2005
Energy BillEnergy BillSigned into law 121907Requires 36 billion gallons of ethanol use by 2022yMandates that 21 of the 36 billion gallons come from feedstocks othergallons come from feedstocks other than corn
Renewable Fuels Standard MandateRenewable Fuels Standard MandateEnacted under the Clean Air Act ndash Applies to bl dblendersEPA is the Enforcement AgencyStandard calculated for the year in November based on previous 12 months gas use
C l l d i l b indash Calculated on a national basisndash 111 billion gallons of ethanolndash 2009 ndash 1021 must be RF
The larger volume blenders would be impacted less
RFS Mandate PenaltiesRFS Mandate PenaltiesReturn ill begotten gainsReturn ill begotten gainsPlus $25000 fine per day or $9 125 000$9125000yrTechnically-If out of compliance for a y pday could be considered out of compliance for the year-EPArsquos discretionp y
2007 US Biofuel Mandates Billion gallonsf Billion gallons
Source FAPRI and RFA
Applicable volume of
Calendar Year
renewable fuel (in billions of gallons)
2006 402007 4 72007 472008 902009 1112010 12952011 13952012 1522013 16552014 18 152014 18152015 2052016 22252017 2402018 2602019 2802020 3002021 33 02021 3302022 360
Source High Plains Journal 010708
Renewable Fuel StandardsEthanol-Corn Use
Year Renewable Fuel Billing of Gallons
Corn ReqBilling of Bushels
Net Even Req Billing of bushels
2008 90 321 220
2009 111 396 271
2010 1295 463 316
2011 1395 498 340
2012 152 543 371
Assumes 28 galbushel and 1775 lbs of DGrsquos produced
Distillerrsquos GrainDistiller s Grain2009 2010
Corn for Eth l (b ) 3 964 000 4 62 000Ethanol (bu) 3964000 4625000Distillers Grain (bu) 1257000 1466000N t CNet Corn Use (bu) 2707000 3159000
P blProblem
BiBiggerggProblemProblem
ldquoI have established a goal to have 60 billion
gallons of our fuel comefrom sustainable
affordable biofuelsin 2022helliprdquo
Biofuels grow but fall short of the 36 billion gallon RFS target in 2022 exceed it in 2035
billion gallon-equivalents
45 R bl
35
40
45 Legislated RFS in 2022
RFS with Biomass-to-
liquids
Renewable diesel
20
25
30 adjustments under CAA Sec211(o)(7) Biodiesel
Oth
q
Net ethanol imports
10
15
20 Other feedstocks Cellulosic
ethanol
0
5
2008 2022 2022 in 2035
Corn ethanol
Richard Newell SAIS December 14 2009 29
2008 2022 2022 inAEO2009
2035
Source Annual Energy Outlook 2010
Ethanol Blend AnnouncementEthanol Blend Announcement
The announcement was made onDec 1 which was the deadline forEPA to respond to a request fromp qethanol producers who want theblend limit raised from the currentblend limit raised from the current10 to 15
Blending Wall for EthanolBlending Wall for Ethanol
Federal standards set the maximum of ethanolFederal standards set the maximum of ethanol blending at 10 of the total gas supply - -Additional to E85Concerns over vehicle ability to use it mileage and transportation infrastructureCurrent annual fuel consumption in the US about 130 ndash 140 billion gallonsCurrently blending wall is estimated at 12 13Currently blending wall is estimated at 12 ndash 13 billion gallons of ethanol
Blending Wall ObservationsBlending Wall - Observations
B il h b i hi h bl d t (E20Brazil has been using higher blend rates (E20 ndashE30) without any problemsLong term need to modify production processesLong term - - need to modify production processes or product (butanol)Short term solution Raise blending limit to E12Short term solution - - Raise blending limit to E12 or E15 or E20Long term problem - - increased pressure onLong term problem increased pressure on ethanol prices due to added production (cellulosic)
SteversquosSteve s Crystal BallCrystal Ball
Whatrsquos coming in the
Wi dS l Stfuture
WindSolar StorageImproved Electric CarsImproved Electric CarsAlgae OilH-H-OTh A M bilThe Amosson Mobile
Summary and ConclusionsyShort Run
E d d h l d i iExpanded ethanol production is probably a given however the pace is expected to slow do to capacity and policyp yThe President Elect and Secretary of Ag are big supporters of Renewable Fuelsare big supporters of Renewable FuelsCurrent Ethanol Margins have turned
i ipositive
Summary and ConclusionsSummary and Conclusions
Ethanol Production is and will suffer fromEthanol Production is and will suffer from growing painsndash Demand amp SupplyDemand amp Supply
DDG prices will be falling (relatively) making them attractive for livestock rationsThe limit on corn based ethanol and the growth in yields will eventually cap corn prices in the LRBl di ll d ll l i d i illBlending wall and cellulosic production will become a problem in the future for corn based ethanolethanol
Educational programs of Texas AgriLife Extension Service are open to all people without regard to race color sexare open to all people without regard to race color sex
disability religion age or national origin
4
Corn amp Sorghum Basis
Information
BasisMarketing Plan Seminar
Mark WelchmdashGrain Marketing EconomistJanuary 20 2010
Improving Lives Improving Texas
BasisBasis
bull The amount that the local cash price of a commodity is above or below the futures price for a pparticular month
bull Impacted by transportation costsImpacted by transportation costs storage and handling interest charges supply and demandcharges supply and demand fundamentals
(basis = cash - futures)(basis = cash - futures)
Corn Prices in the Triangle A F t C h B iArea Futures Cash Basis
600
400
500
200
300
(1 00)
000
100
(100)
basis cash futures
Sorghum Prices North of the C di C F t C h B iCanadian Corn Futures Cash Basis600
400
500
200
300
000
100
-100
Basis Corn Futures Cash
Basis
bull Basis exists mainly because of carrying y y gcharge arbitrage between futures and cash markets and transportation costsndash The carrying charge exists because stored
commodities are harvested and stored one time each year There are financingtime each year There are financing storage and management cost associated with carrying charge
ndash Because of carrying charge it is likely that the deferred futures price will be higher than cash price or basis with a negative p gsign will exist during harvest
BasisBasis
bull Transportation costs also affect the local basis The grain handler receives a bid from buyer determines the transportation cost to deliver the grain and subtract that cost from the price bid to determine the local price paid to the farmer
BasisBasis
bull Basis may also serve as a barometer of market strength or weakness
bull Improving basis is a sign of underlying strength in market demand
bull Declining basis is a sign of weak demanddemand
BasisBasis
bull There are times when the formula generates a basis with a positive sign
bull This denotes that the cash price is higher than futures price or cash pricehigher than futures price or cash price is selling at a premium to the futures
bull This occurs because supplydemandThis occurs because supplydemand relationships in the local cash market is different from futures market The local
l f i i th k t bsupply of grain in the market may be limited relative to demand or demand may be relatively higher than supply inmay be relatively higher than supply in the local market
Basis
bull The observed basis is termed asThe observed basis is termed as strong when the present basis is more positive or less negativemore positive or less negative than the historic average basis
For example assume that thendash For example assume that the average basis for a hypothetical market is -$035 per bushel The $ ppresent basis is -$010
ndash Therefore present basis is strong p grelative to the historic average
Basis
bull Similarly the observed basis isSimilarly the observed basis is termed as weak when the present basis is less positive or morebasis is less positive or more negative than the historic averagendash For example assume that theFor example assume that the
average basis for a hypothetical market is -$035 per bushel The present basis is -$045
ndash Therefore present basis is weak relative to the historic average
BasisCash Price ndash Futures Price = Basisbull Is the relationship between a local cash market and theIs the relationship between a local cash market and the
futures market
bull Can be negative or positiveCan be negative or positive
bull Is more stable than cash or futures prices
Basis Componentsbull Storage (insurance and interest)
bull Transportation
bull Local supply and demand
The Role of Basis in Hedgingg gBasis describes the price relationship between cash market prices and futures market prices at a particular time and location Basis is the number of cents (dollars) per unit that the local cash price of a commodity is above or below the current priceper unit that the local cash price of a commodity is above or below the current price for a particular futures contract delivery month on a given day Thus basis is the cash market price minus the futures market price at a specific time
Basis is important yet often the least understood concept in hedging agricultural p y p g g gcommodities An understanding and an accurate estimate of basis is needed by farmers and rancher who want to include hedging as part of their pricing strategy
Basis is important because approximately 97 percent of all agricultural commodities traded in the futures market are offset before delivery Therefore because the actualtraded in the futures market are offset before delivery Therefore because the actual physical commodity is mostly sold on the cash market the hedged futures price will not be the realized price for the commodity An estimate of that price can be calculated using the basis
A knowledge of the local basis is necessary to translate a given futures price into probable effective price for local delivery The futures price plus the expected basis (with appropriate arithmetic sign) is an estimate of the price the futures market is offering for the commodity delivered to the local market during a particular month Remember the basis is cash minus futures Therefore when the basis is negative gthe futures price is reduced by the amount of the basis When the basis is positive the futures price is increased by the basis value
Market CarryNormal Market
Sept
July $235
Sept $238
Mar
May $222
Dec $200
$212
Market CarryInverted Market
Dec $3 26
May $306
Mar $311
$326
Sept
July $299
$280
Basis and Expected PriceBasis and Expected Pricebull Knowledge of local basis is
t t l t inecessary to translate a given futures price into a probable price f l l d lifor local delivery
bull The futures price adjusted for basis is the price the market is offering for your grain delivered at a local elevator during a particular month(expected price = futures + basis)( p p )
Expected Price -$050 basisExpected Price $050 basis
5 1
49
51
45
47
Cash
4 1
43
39
41
450 460 470 480 490 500 510 520 530 540 550
December Futures
Texas Corn Basis in Oct vs Dec Contract Hi h L A (2005 09)High Low Average (2005-09)
North of the
0 30
040
0 30
040Canadian Triangle Area South of Line
0 10
020
030
0 10
020
030
0 10
000
010
0 10
000
010
0 30
-020
-010
0 30
-020
-010
Oct 2010 -030-030
Source httpmastermarketertamuedu
Basis Tracking FormBasis Table
Commodity LocationNearby Futures Contract Harvest Delivery
CashFutures Contract
Futures Contract
Forward Cash
Contract
Harvest Contract Futures Implied
Basis Contract
Date Price Month Price Basis Offer Price Basis Offer
Basis Corn North of the C diCanadian
Basis Sorghum North of the C diCanadian
Basis Expected Harvest Basis
Expected Mar 1 Basis
Expected May 1 BasisExpected May 1 Basis
If short crop basis will
If large crop basis will
StrategiesStrategies
NOTES
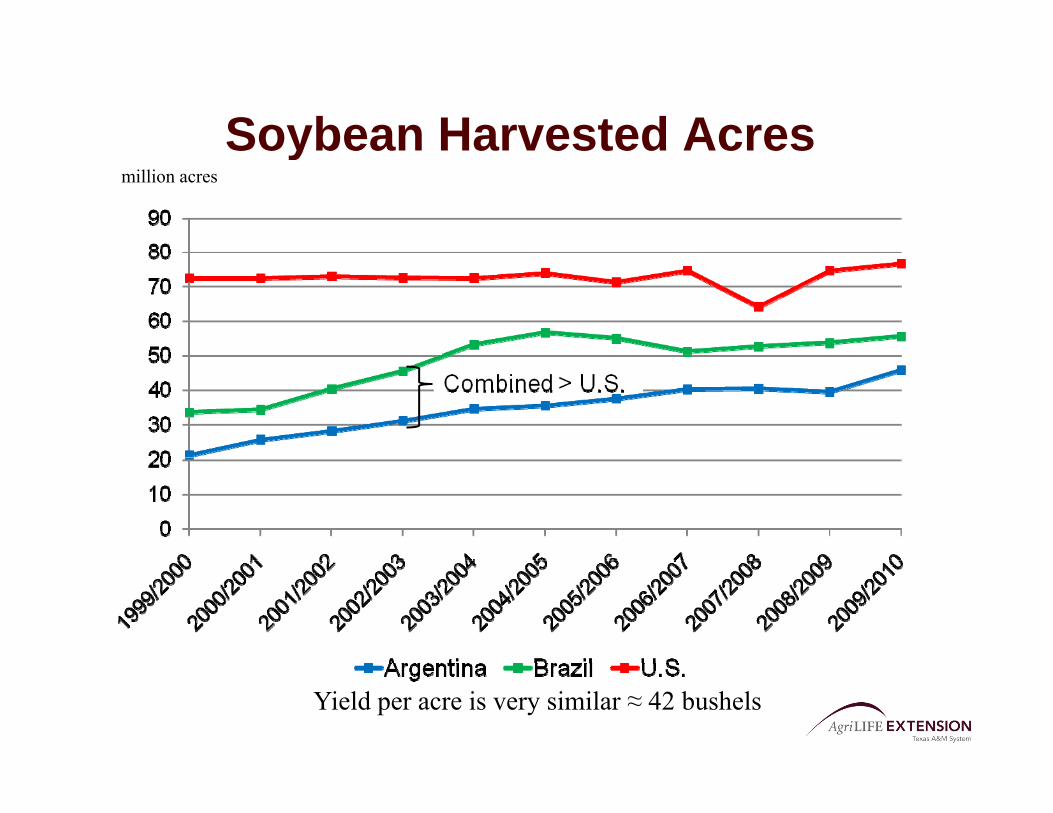

Complex Economic Relationships
Bioenergy Success or Failure Depends
Complex Economic Relationships
Bioenergy Success or Failure Depends on
Oil indash Oil pricesndash Processing coststechnology
R l ti f d t k tndash Relative feedstock costsndash Demand for the biofuelsndash Technology improvementsndash Government Policy
Ethanolt a ol
E85ndash Motor fuel blend of 85
ethanol and 15 gasoline
E10ndash Motor fuel blend of 10 ethanol and
90 gasoline
Currently primarily comes from corn y p y but any grain crop will work
Largely due to Government policies ethanol production grew from about 62 million gallons in 1976grew from about 62 million gallons in 1976
to over 2 billion gallons in 2002Surface Transportation
2500
Million gallons
Energy Tax Actof 1978 gaveethanol a $040gal
Assistance Act of 1983 increased ethanol tax exemption to $050gal and the blenderrsquos income tax credit to $050gal
MTBE discovered inCalifornia drinking waterin 1998
1500
2000g
credit on the Federalmotor fuels tax Regulations under the
Clean Air Act Amendments of 1990started in 1992Blenderrsquos
Income tax dit f
RFG beginsin 1995
500
1000
Tax Reform Act of 1984increased ethanol taxexemption to $060gal and the blenderrsquos income tax credit to
In 1999 CaliforniaGovernor banned MTBEby 1203
credit of$040gal
Energy policy Act of 1992 applied ethanoltax credits to lower blends
0
1976
1978
1980
1982
1984
1986
1988
1990
1992
1994
1996
1998
2000
2002
blender s income tax credit to $060gal
tax credits to lower blends
Source US Energy Information Administration and USDA ERS
EthanolBasic Facts
Currently one bushel of corn produces 28 gallons of ethanol overall 275g By Productsndash 17 75 lbs of distillers dried grainndash 1775 lbs of distillers dried grainndash CO2
Figure 3
Total 11693 mil Bu
E h l P d iEthanol ProductionndashJanuary 2009 Est
Status Plants Capacityp y(Billions of Gallons)
Operating 193 1274
Under Construction 20 204
213 1478
US Average Regular Gas and Ethanol Prices Monthly 1991 ndash 2006
35
4
2
25
3
allo
n
Ethanol
1
15
2
$G
a
Reg Gas
0
05
991992
993994
995996
997998
999000
001002
003004
005006
19911992
19931994
19951996
19971998
19992000
20012002
20032004
20052006
Source Renewable Fuels Association
Ethanol PricesRelative to Unleaded Gas
Time Price Relationship
lsquo82 ndash lsquo05 Premium Basis
2006 +$64
Aug lsquo07 +$10
Oct rsquo07 $ 45Oct 07 -$45
Jan lsquo09 +$ 54Jan 09 +$54
US Ethanol Situation-Spring lsquo09 2nd L t fi i b k t2nd Largest firm in bankruptcy5-8 more in bankruptcy24 28 f l ti l t idl d24-28 formerly operating plants idled Several completed or nearly complete plants delay opening
Returns near break-evenSevere loss in asset valuesGovt Mandates support corn processing demand near current level -- ldquoblending wallrdquo issueIdle operating capacity 135-150 mil tons cornIdle plants =14-18 of capacity
Ethanol Plant Operating MarginsOperating Margins
Natrsquol Gas
Profit
Corn
Profit
I donrsquot particularly see anyone outside the ethanol industry trying to get into the industry now That would be like running into a burning barnmdashSander Cohen industry analyst
Bellwether MarketBellwether MarketCorn $bu
Crude $bbl
Statistician A man who believes figures dont lie but admits that under analysis some of them wont stand up either ndash Evan Esar
40109 updated 5609
July lsquo10 crude oil
July rsquo10 corn5609
y 40109
July rsquo10 crude 5609
$barrel
Spot Crude20909
July 2010 $6165 brings corn near
$480bu
Proposed amp Initiated Ethanol Plants and Their Grain Requirement
Ethanol Capacity Million
Corn Required Million Corn Acres
and Their Grain Requirement
Location Company Million galyr
Million bushels
Corn Acres Required
Levelland LevellandHockey 40 148 76365Muleshoe Panda Energy 100 37 0 190 913Muleshoe Panda Energy 100 370 190913Plainview White Energy 100 370 190913Hereford Panda Energy 100 370 190913H f d Whit E 100 37 0 190 913Hereford White Energy 100 370 190913Dumas Pan Ener of Dumas 30 111 57274Stratford Panda Energy 100 370 190913Total 570 2111 108820227 gallons of ethanol produced from a bushel of corn194 buacre base on TASS 2005
Energy BillEnergy BillSigned into law 121907Requires 36 billion gallons of ethanol use by 2022yMandates that 21 of the 36 billion gallons come from feedstocks othergallons come from feedstocks other than corn
Renewable Fuels Standard MandateRenewable Fuels Standard MandateEnacted under the Clean Air Act ndash Applies to bl dblendersEPA is the Enforcement AgencyStandard calculated for the year in November based on previous 12 months gas use
C l l d i l b indash Calculated on a national basisndash 111 billion gallons of ethanolndash 2009 ndash 1021 must be RF
The larger volume blenders would be impacted less
RFS Mandate PenaltiesRFS Mandate PenaltiesReturn ill begotten gainsReturn ill begotten gainsPlus $25000 fine per day or $9 125 000$9125000yrTechnically-If out of compliance for a y pday could be considered out of compliance for the year-EPArsquos discretionp y
2007 US Biofuel Mandates Billion gallonsf Billion gallons
Source FAPRI and RFA
Applicable volume of
Calendar Year
renewable fuel (in billions of gallons)
2006 402007 4 72007 472008 902009 1112010 12952011 13952012 1522013 16552014 18 152014 18152015 2052016 22252017 2402018 2602019 2802020 3002021 33 02021 3302022 360
Source High Plains Journal 010708
Renewable Fuel StandardsEthanol-Corn Use
Year Renewable Fuel Billing of Gallons
Corn ReqBilling of Bushels
Net Even Req Billing of bushels
2008 90 321 220
2009 111 396 271
2010 1295 463 316
2011 1395 498 340
2012 152 543 371
Assumes 28 galbushel and 1775 lbs of DGrsquos produced
Distillerrsquos GrainDistiller s Grain2009 2010
Corn for Eth l (b ) 3 964 000 4 62 000Ethanol (bu) 3964000 4625000Distillers Grain (bu) 1257000 1466000N t CNet Corn Use (bu) 2707000 3159000
P blProblem
BiBiggerggProblemProblem
ldquoI have established a goal to have 60 billion
gallons of our fuel comefrom sustainable
affordable biofuelsin 2022helliprdquo
Biofuels grow but fall short of the 36 billion gallon RFS target in 2022 exceed it in 2035
billion gallon-equivalents
45 R bl
35
40
45 Legislated RFS in 2022
RFS with Biomass-to-
liquids
Renewable diesel
20
25
30 adjustments under CAA Sec211(o)(7) Biodiesel
Oth
q
Net ethanol imports
10
15
20 Other feedstocks Cellulosic
ethanol
0
5
2008 2022 2022 in 2035
Corn ethanol
Richard Newell SAIS December 14 2009 29
2008 2022 2022 inAEO2009
2035
Source Annual Energy Outlook 2010
Ethanol Blend AnnouncementEthanol Blend Announcement
The announcement was made onDec 1 which was the deadline forEPA to respond to a request fromp qethanol producers who want theblend limit raised from the currentblend limit raised from the current10 to 15
Blending Wall for EthanolBlending Wall for Ethanol
Federal standards set the maximum of ethanolFederal standards set the maximum of ethanol blending at 10 of the total gas supply - -Additional to E85Concerns over vehicle ability to use it mileage and transportation infrastructureCurrent annual fuel consumption in the US about 130 ndash 140 billion gallonsCurrently blending wall is estimated at 12 13Currently blending wall is estimated at 12 ndash 13 billion gallons of ethanol
Blending Wall ObservationsBlending Wall - Observations
B il h b i hi h bl d t (E20Brazil has been using higher blend rates (E20 ndashE30) without any problemsLong term need to modify production processesLong term - - need to modify production processes or product (butanol)Short term solution Raise blending limit to E12Short term solution - - Raise blending limit to E12 or E15 or E20Long term problem - - increased pressure onLong term problem increased pressure on ethanol prices due to added production (cellulosic)
SteversquosSteve s Crystal BallCrystal Ball
Whatrsquos coming in the
Wi dS l Stfuture
WindSolar StorageImproved Electric CarsImproved Electric CarsAlgae OilH-H-OTh A M bilThe Amosson Mobile
Summary and ConclusionsyShort Run
E d d h l d i iExpanded ethanol production is probably a given however the pace is expected to slow do to capacity and policyp yThe President Elect and Secretary of Ag are big supporters of Renewable Fuelsare big supporters of Renewable FuelsCurrent Ethanol Margins have turned
i ipositive
Summary and ConclusionsSummary and Conclusions
Ethanol Production is and will suffer fromEthanol Production is and will suffer from growing painsndash Demand amp SupplyDemand amp Supply
DDG prices will be falling (relatively) making them attractive for livestock rationsThe limit on corn based ethanol and the growth in yields will eventually cap corn prices in the LRBl di ll d ll l i d i illBlending wall and cellulosic production will become a problem in the future for corn based ethanolethanol
Educational programs of Texas AgriLife Extension Service are open to all people without regard to race color sexare open to all people without regard to race color sex
disability religion age or national origin
4
Corn amp Sorghum Basis
Information
BasisMarketing Plan Seminar
Mark WelchmdashGrain Marketing EconomistJanuary 20 2010
Improving Lives Improving Texas
BasisBasis
bull The amount that the local cash price of a commodity is above or below the futures price for a pparticular month
bull Impacted by transportation costsImpacted by transportation costs storage and handling interest charges supply and demandcharges supply and demand fundamentals
(basis = cash - futures)(basis = cash - futures)
Corn Prices in the Triangle A F t C h B iArea Futures Cash Basis
600
400
500
200
300
(1 00)
000
100
(100)
basis cash futures
Sorghum Prices North of the C di C F t C h B iCanadian Corn Futures Cash Basis600
400
500
200
300
000
100
-100
Basis Corn Futures Cash
Basis
bull Basis exists mainly because of carrying y y gcharge arbitrage between futures and cash markets and transportation costsndash The carrying charge exists because stored
commodities are harvested and stored one time each year There are financingtime each year There are financing storage and management cost associated with carrying charge
ndash Because of carrying charge it is likely that the deferred futures price will be higher than cash price or basis with a negative p gsign will exist during harvest
BasisBasis
bull Transportation costs also affect the local basis The grain handler receives a bid from buyer determines the transportation cost to deliver the grain and subtract that cost from the price bid to determine the local price paid to the farmer
BasisBasis
bull Basis may also serve as a barometer of market strength or weakness
bull Improving basis is a sign of underlying strength in market demand
bull Declining basis is a sign of weak demanddemand
BasisBasis
bull There are times when the formula generates a basis with a positive sign
bull This denotes that the cash price is higher than futures price or cash pricehigher than futures price or cash price is selling at a premium to the futures
bull This occurs because supplydemandThis occurs because supplydemand relationships in the local cash market is different from futures market The local
l f i i th k t bsupply of grain in the market may be limited relative to demand or demand may be relatively higher than supply inmay be relatively higher than supply in the local market
Basis
bull The observed basis is termed asThe observed basis is termed as strong when the present basis is more positive or less negativemore positive or less negative than the historic average basis
For example assume that thendash For example assume that the average basis for a hypothetical market is -$035 per bushel The $ ppresent basis is -$010
ndash Therefore present basis is strong p grelative to the historic average
Basis
bull Similarly the observed basis isSimilarly the observed basis is termed as weak when the present basis is less positive or morebasis is less positive or more negative than the historic averagendash For example assume that theFor example assume that the
average basis for a hypothetical market is -$035 per bushel The present basis is -$045
ndash Therefore present basis is weak relative to the historic average
BasisCash Price ndash Futures Price = Basisbull Is the relationship between a local cash market and theIs the relationship between a local cash market and the
futures market
bull Can be negative or positiveCan be negative or positive
bull Is more stable than cash or futures prices
Basis Componentsbull Storage (insurance and interest)
bull Transportation
bull Local supply and demand
The Role of Basis in Hedgingg gBasis describes the price relationship between cash market prices and futures market prices at a particular time and location Basis is the number of cents (dollars) per unit that the local cash price of a commodity is above or below the current priceper unit that the local cash price of a commodity is above or below the current price for a particular futures contract delivery month on a given day Thus basis is the cash market price minus the futures market price at a specific time
Basis is important yet often the least understood concept in hedging agricultural p y p g g gcommodities An understanding and an accurate estimate of basis is needed by farmers and rancher who want to include hedging as part of their pricing strategy
Basis is important because approximately 97 percent of all agricultural commodities traded in the futures market are offset before delivery Therefore because the actualtraded in the futures market are offset before delivery Therefore because the actual physical commodity is mostly sold on the cash market the hedged futures price will not be the realized price for the commodity An estimate of that price can be calculated using the basis
A knowledge of the local basis is necessary to translate a given futures price into probable effective price for local delivery The futures price plus the expected basis (with appropriate arithmetic sign) is an estimate of the price the futures market is offering for the commodity delivered to the local market during a particular month Remember the basis is cash minus futures Therefore when the basis is negative gthe futures price is reduced by the amount of the basis When the basis is positive the futures price is increased by the basis value
Market CarryNormal Market
Sept
July $235
Sept $238
Mar
May $222
Dec $200
$212
Market CarryInverted Market
Dec $3 26
May $306
Mar $311
$326
Sept
July $299
$280
Basis and Expected PriceBasis and Expected Pricebull Knowledge of local basis is
t t l t inecessary to translate a given futures price into a probable price f l l d lifor local delivery
bull The futures price adjusted for basis is the price the market is offering for your grain delivered at a local elevator during a particular month(expected price = futures + basis)( p p )
Expected Price -$050 basisExpected Price $050 basis
5 1
49
51
45
47
Cash
4 1
43
39
41
450 460 470 480 490 500 510 520 530 540 550
December Futures
Texas Corn Basis in Oct vs Dec Contract Hi h L A (2005 09)High Low Average (2005-09)
North of the
0 30
040
0 30
040Canadian Triangle Area South of Line
0 10
020
030
0 10
020
030
0 10
000
010
0 10
000
010
0 30
-020
-010
0 30
-020
-010
Oct 2010 -030-030
Source httpmastermarketertamuedu
Basis Tracking FormBasis Table
Commodity LocationNearby Futures Contract Harvest Delivery
CashFutures Contract
Futures Contract
Forward Cash
Contract
Harvest Contract Futures Implied
Basis Contract
Date Price Month Price Basis Offer Price Basis Offer
Basis Corn North of the C diCanadian
Basis Sorghum North of the C diCanadian
Basis Expected Harvest Basis
Expected Mar 1 Basis
Expected May 1 BasisExpected May 1 Basis
If short crop basis will
If large crop basis will
StrategiesStrategies
NOTES
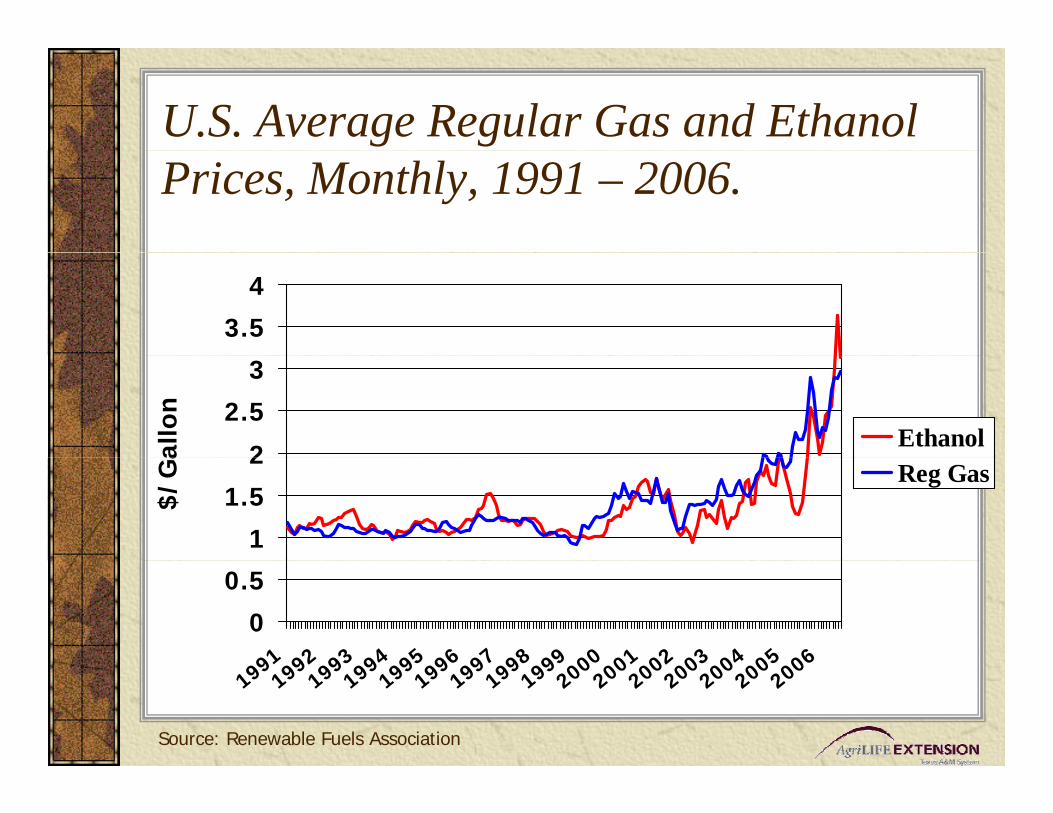
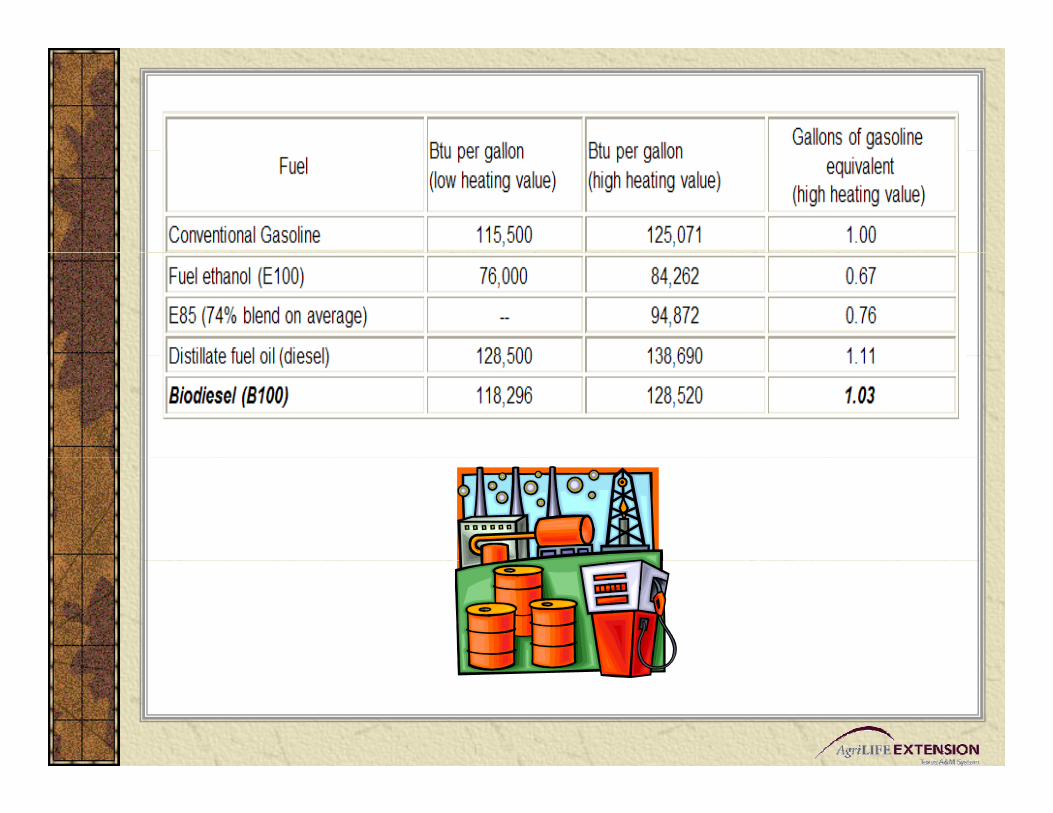
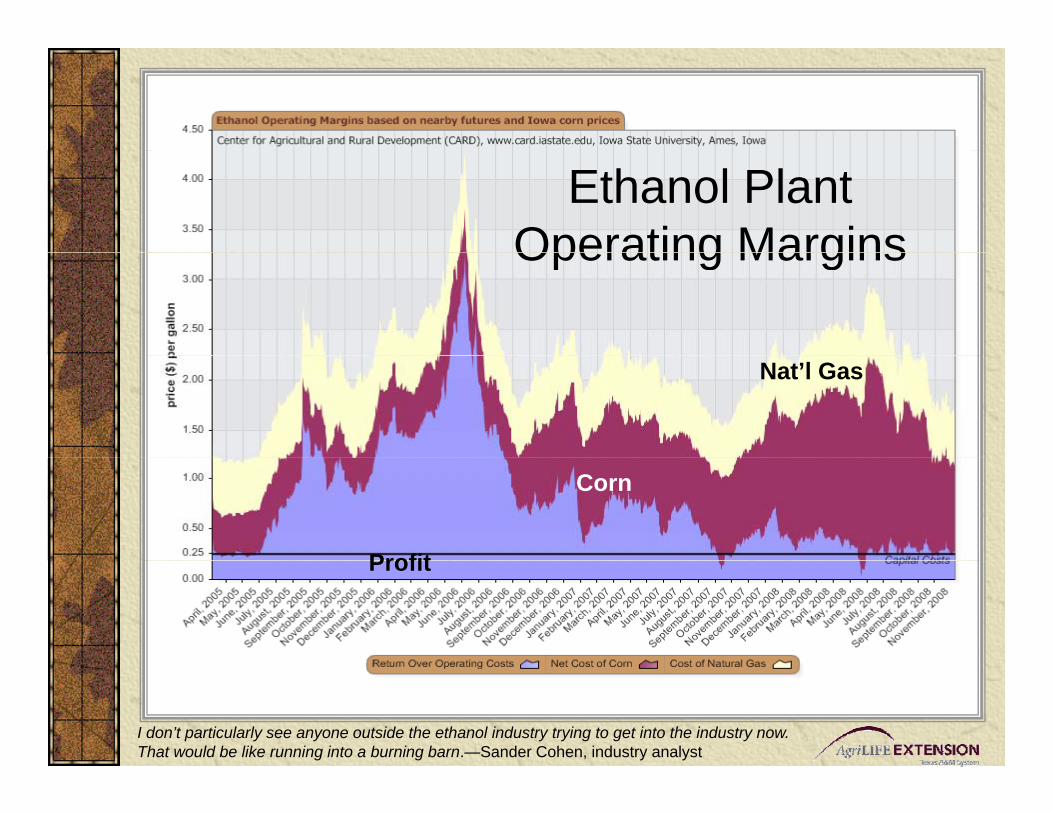
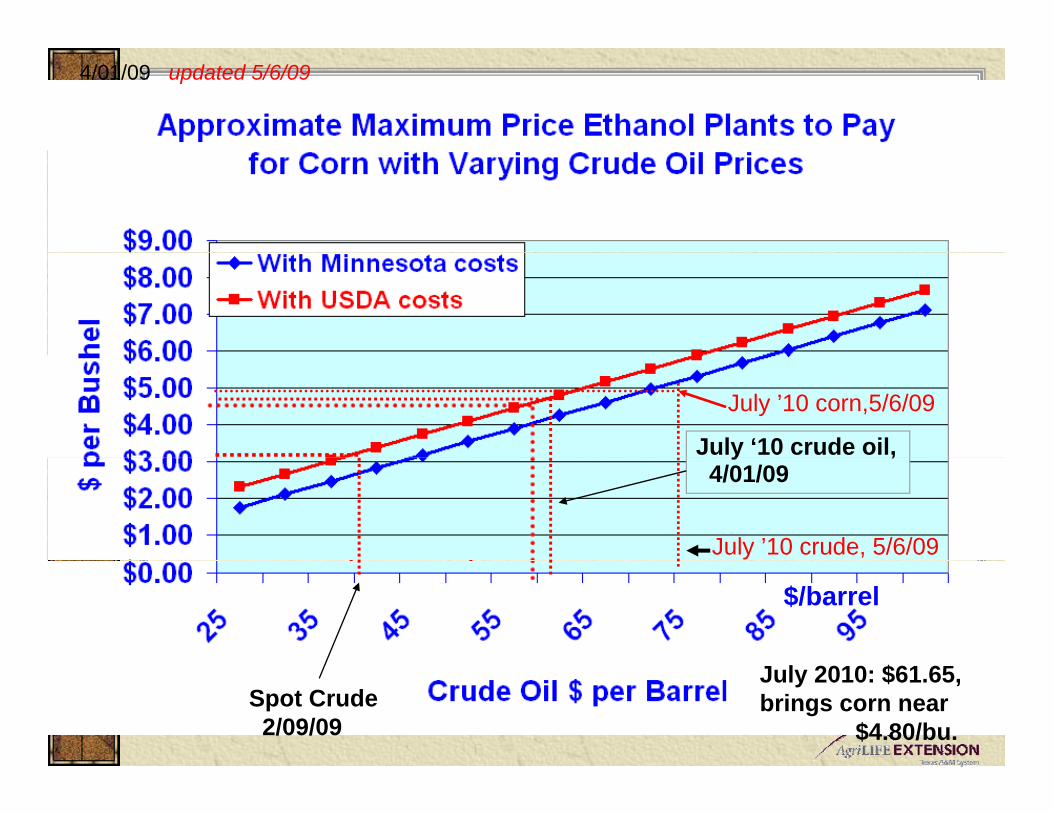
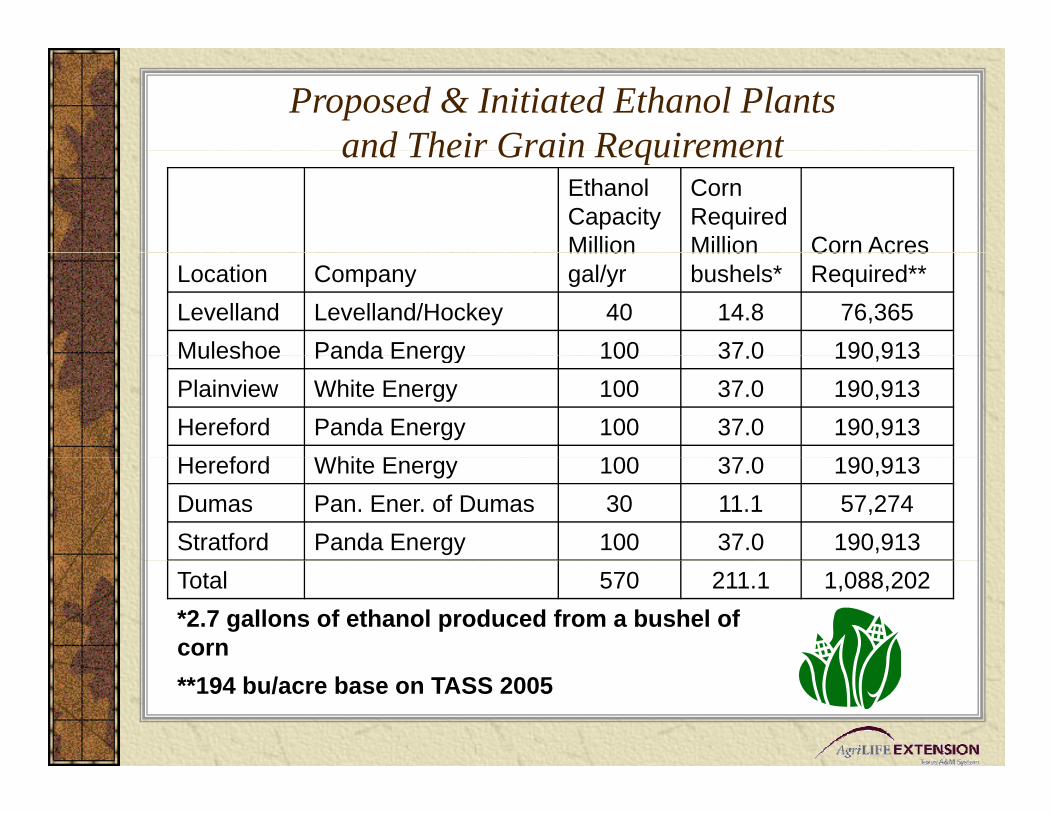
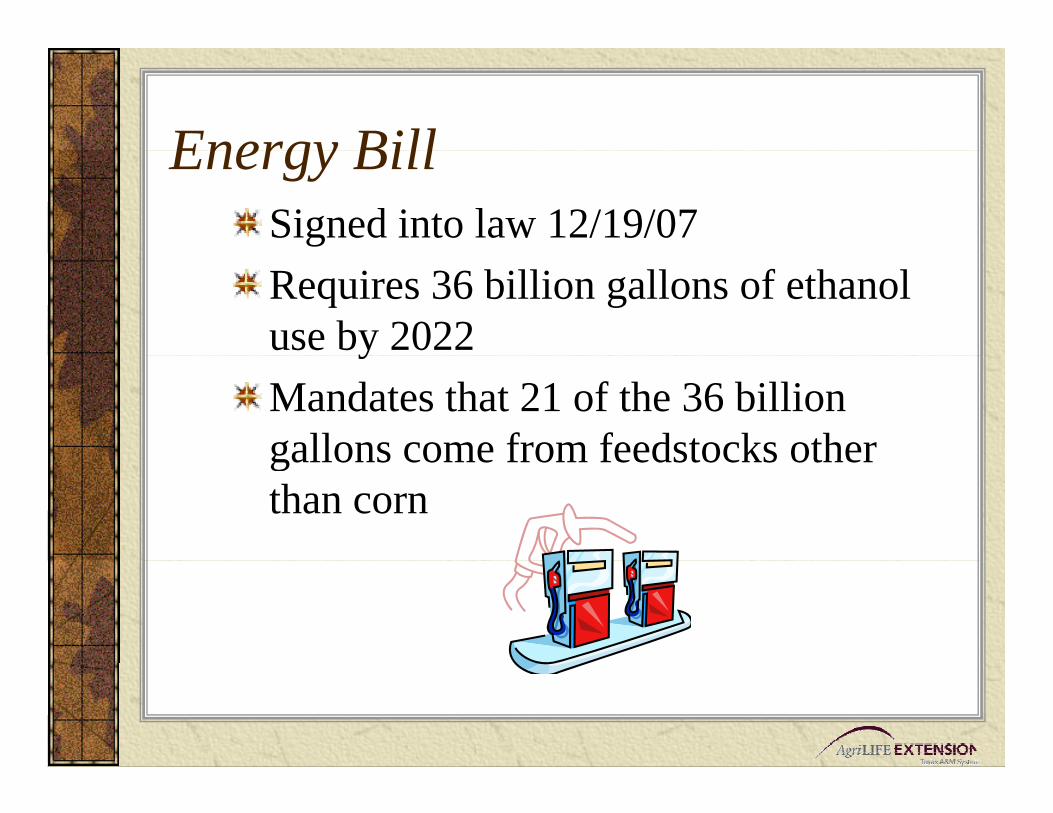
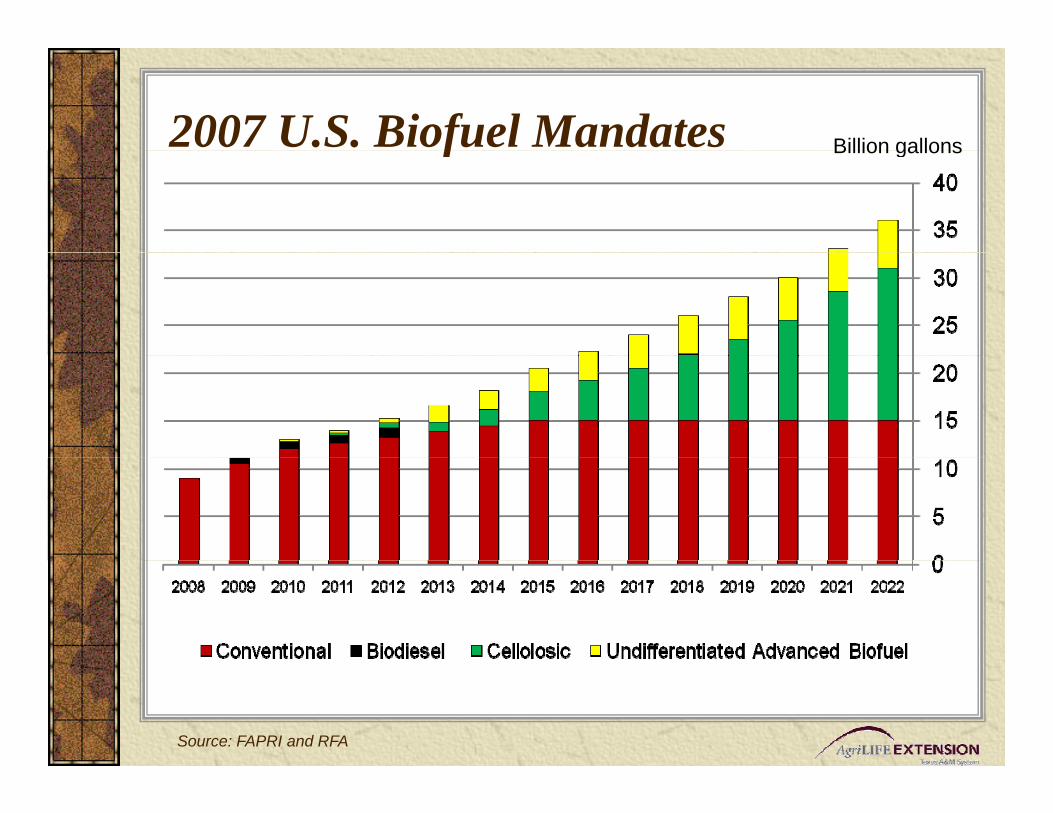
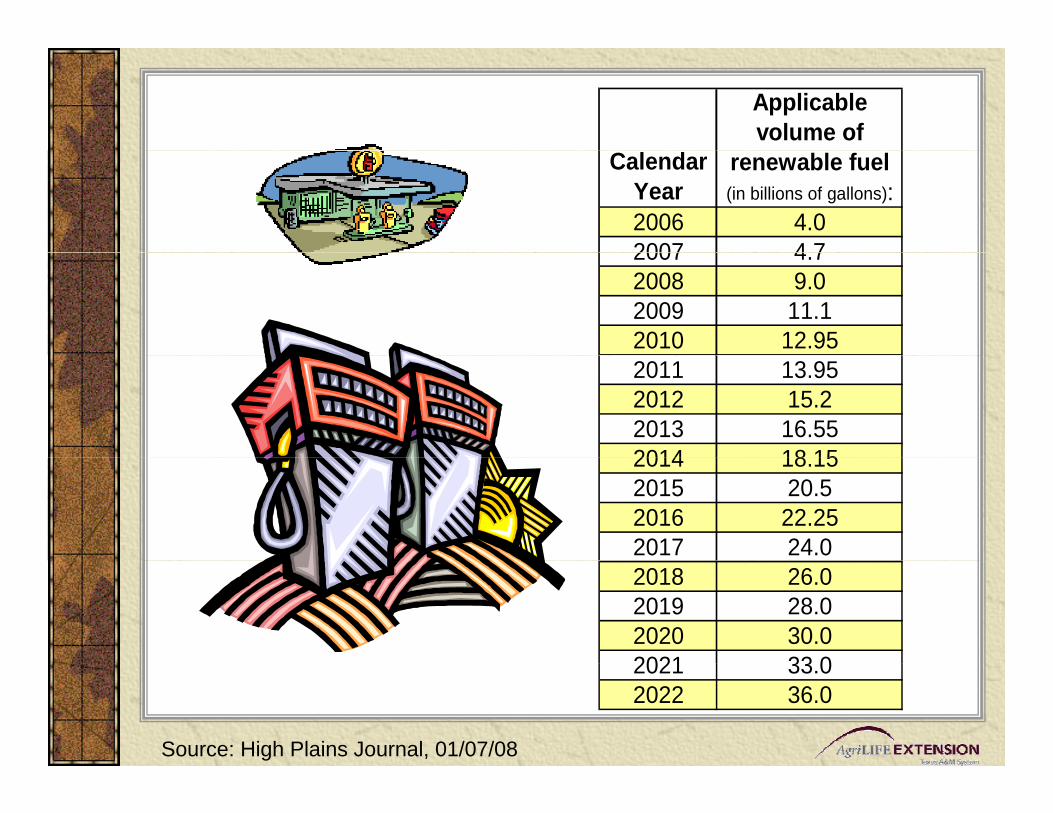
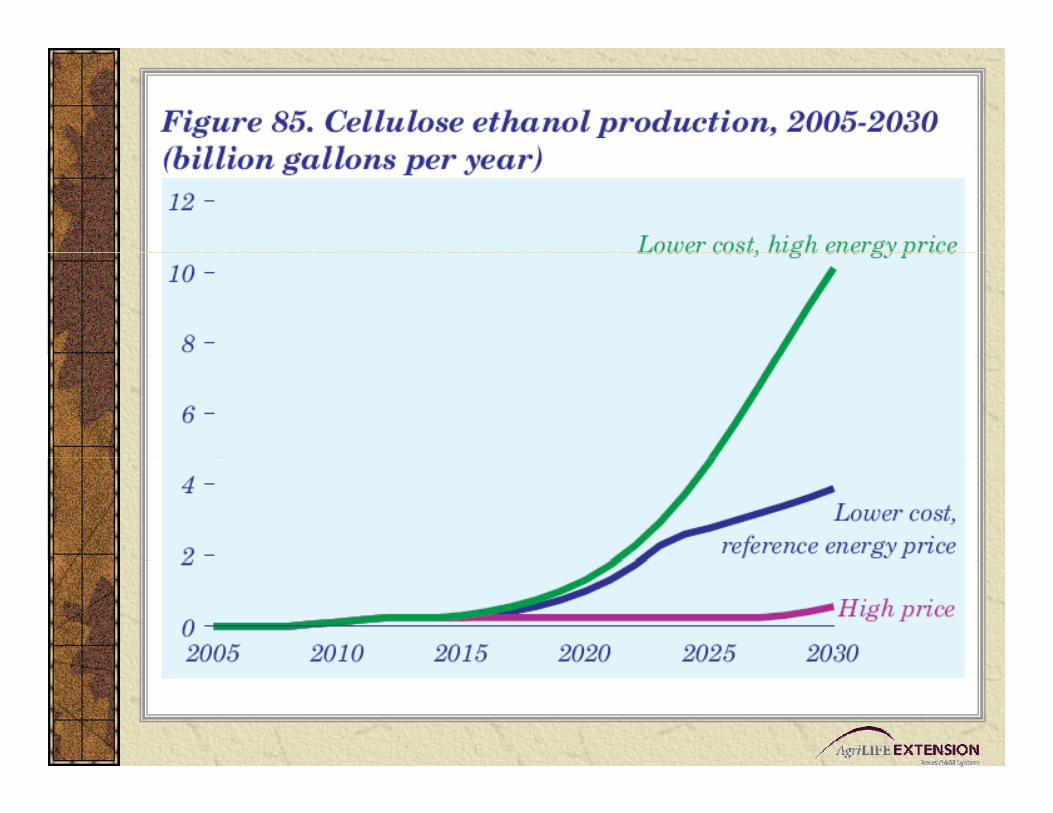
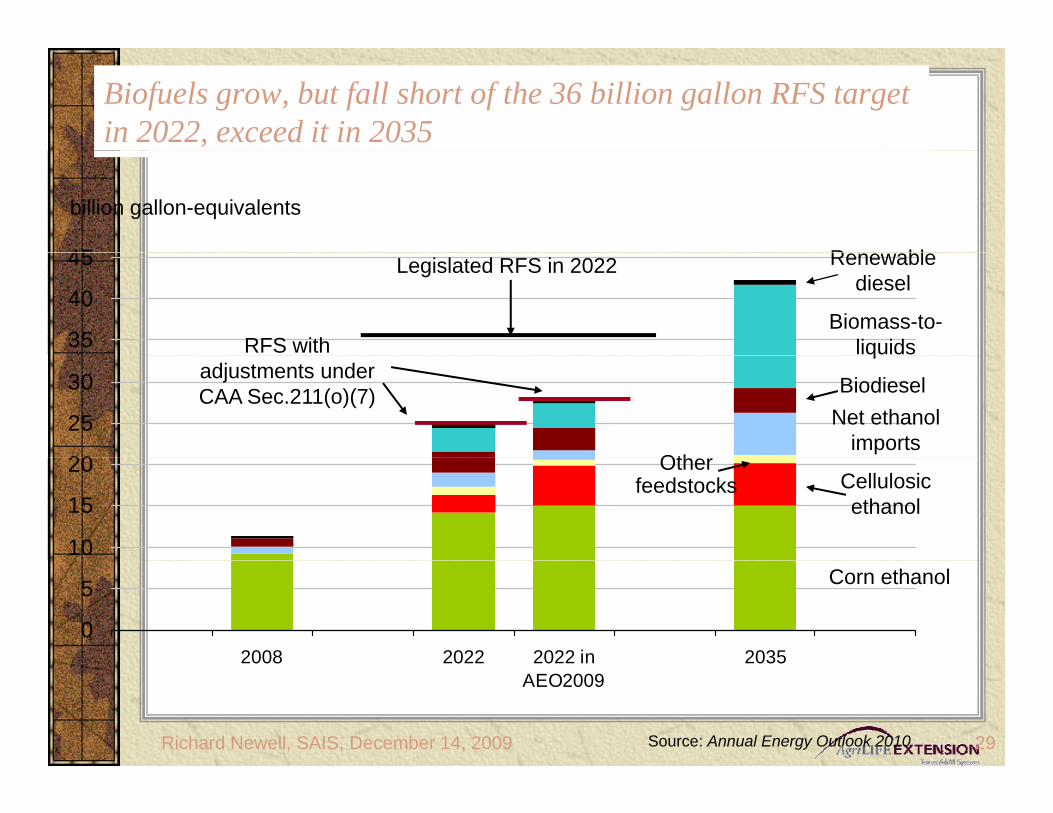

BasisBasis
bull The amount that the local cash price of a commodity is above or below the futures price for a pparticular month
bull Impacted by transportation costsImpacted by transportation costs storage and handling interest charges supply and demandcharges supply and demand fundamentals
(basis = cash - futures)(basis = cash - futures)
Corn Prices in the Triangle A F t C h B iArea Futures Cash Basis
600
400
500
200
300
(1 00)
000
100
(100)
basis cash futures
Sorghum Prices North of the C di C F t C h B iCanadian Corn Futures Cash Basis600
400
500
200
300
000
100
-100
Basis Corn Futures Cash
Basis
bull Basis exists mainly because of carrying y y gcharge arbitrage between futures and cash markets and transportation costsndash The carrying charge exists because stored
commodities are harvested and stored one time each year There are financingtime each year There are financing storage and management cost associated with carrying charge
ndash Because of carrying charge it is likely that the deferred futures price will be higher than cash price or basis with a negative p gsign will exist during harvest
BasisBasis
bull Transportation costs also affect the local basis The grain handler receives a bid from buyer determines the transportation cost to deliver the grain and subtract that cost from the price bid to determine the local price paid to the farmer
BasisBasis
bull Basis may also serve as a barometer of market strength or weakness
bull Improving basis is a sign of underlying strength in market demand
bull Declining basis is a sign of weak demanddemand
BasisBasis
bull There are times when the formula generates a basis with a positive sign
bull This denotes that the cash price is higher than futures price or cash pricehigher than futures price or cash price is selling at a premium to the futures
bull This occurs because supplydemandThis occurs because supplydemand relationships in the local cash market is different from futures market The local
l f i i th k t bsupply of grain in the market may be limited relative to demand or demand may be relatively higher than supply inmay be relatively higher than supply in the local market
Basis
bull The observed basis is termed asThe observed basis is termed as strong when the present basis is more positive or less negativemore positive or less negative than the historic average basis
For example assume that thendash For example assume that the average basis for a hypothetical market is -$035 per bushel The $ ppresent basis is -$010
ndash Therefore present basis is strong p grelative to the historic average
Basis
bull Similarly the observed basis isSimilarly the observed basis is termed as weak when the present basis is less positive or morebasis is less positive or more negative than the historic averagendash For example assume that theFor example assume that the
average basis for a hypothetical market is -$035 per bushel The present basis is -$045
ndash Therefore present basis is weak relative to the historic average
BasisCash Price ndash Futures Price = Basisbull Is the relationship between a local cash market and theIs the relationship between a local cash market and the
futures market
bull Can be negative or positiveCan be negative or positive
bull Is more stable than cash or futures prices
Basis Componentsbull Storage (insurance and interest)
bull Transportation
bull Local supply and demand
The Role of Basis in Hedgingg gBasis describes the price relationship between cash market prices and futures market prices at a particular time and location Basis is the number of cents (dollars) per unit that the local cash price of a commodity is above or below the current priceper unit that the local cash price of a commodity is above or below the current price for a particular futures contract delivery month on a given day Thus basis is the cash market price minus the futures market price at a specific time
Basis is important yet often the least understood concept in hedging agricultural p y p g g gcommodities An understanding and an accurate estimate of basis is needed by farmers and rancher who want to include hedging as part of their pricing strategy
Basis is important because approximately 97 percent of all agricultural commodities traded in the futures market are offset before delivery Therefore because the actualtraded in the futures market are offset before delivery Therefore because the actual physical commodity is mostly sold on the cash market the hedged futures price will not be the realized price for the commodity An estimate of that price can be calculated using the basis
A knowledge of the local basis is necessary to translate a given futures price into probable effective price for local delivery The futures price plus the expected basis (with appropriate arithmetic sign) is an estimate of the price the futures market is offering for the commodity delivered to the local market during a particular month Remember the basis is cash minus futures Therefore when the basis is negative gthe futures price is reduced by the amount of the basis When the basis is positive the futures price is increased by the basis value
Market CarryNormal Market
Sept
July $235
Sept $238
Mar
May $222
Dec $200
$212
Market CarryInverted Market
Dec $3 26
May $306
Mar $311
$326
Sept
July $299
$280
Basis and Expected PriceBasis and Expected Pricebull Knowledge of local basis is
t t l t inecessary to translate a given futures price into a probable price f l l d lifor local delivery
bull The futures price adjusted for basis is the price the market is offering for your grain delivered at a local elevator during a particular month(expected price = futures + basis)( p p )
Expected Price -$050 basisExpected Price $050 basis
5 1
49
51
45
47
Cash
4 1
43
39
41
450 460 470 480 490 500 510 520 530 540 550
December Futures
Texas Corn Basis in Oct vs Dec Contract Hi h L A (2005 09)High Low Average (2005-09)
North of the
0 30
040
0 30
040Canadian Triangle Area South of Line
0 10
020
030
0 10
020
030
0 10
000
010
0 10
000
010
0 30
-020
-010
0 30
-020
-010
Oct 2010 -030-030
Source httpmastermarketertamuedu
Basis Tracking FormBasis Table
Commodity LocationNearby Futures Contract Harvest Delivery
CashFutures Contract
Futures Contract
Forward Cash
Contract
Harvest Contract Futures Implied
Basis Contract
Date Price Month Price Basis Offer Price Basis Offer
Basis Corn North of the C diCanadian
Basis Sorghum North of the C diCanadian
Basis Expected Harvest Basis
Expected Mar 1 Basis
Expected May 1 BasisExpected May 1 Basis
If short crop basis will
If large crop basis will
StrategiesStrategies
NOTES

Basis
bull Basis exists mainly because of carrying y y gcharge arbitrage between futures and cash markets and transportation costsndash The carrying charge exists because stored
commodities are harvested and stored one time each year There are financingtime each year There are financing storage and management cost associated with carrying charge
ndash Because of carrying charge it is likely that the deferred futures price will be higher than cash price or basis with a negative p gsign will exist during harvest
BasisBasis
bull Transportation costs also affect the local basis The grain handler receives a bid from buyer determines the transportation cost to deliver the grain and subtract that cost from the price bid to determine the local price paid to the farmer
BasisBasis
bull Basis may also serve as a barometer of market strength or weakness
bull Improving basis is a sign of underlying strength in market demand
bull Declining basis is a sign of weak demanddemand
BasisBasis
bull There are times when the formula generates a basis with a positive sign
bull This denotes that the cash price is higher than futures price or cash pricehigher than futures price or cash price is selling at a premium to the futures
bull This occurs because supplydemandThis occurs because supplydemand relationships in the local cash market is different from futures market The local
l f i i th k t bsupply of grain in the market may be limited relative to demand or demand may be relatively higher than supply inmay be relatively higher than supply in the local market
Basis
bull The observed basis is termed asThe observed basis is termed as strong when the present basis is more positive or less negativemore positive or less negative than the historic average basis
For example assume that thendash For example assume that the average basis for a hypothetical market is -$035 per bushel The $ ppresent basis is -$010
ndash Therefore present basis is strong p grelative to the historic average
Basis
bull Similarly the observed basis isSimilarly the observed basis is termed as weak when the present basis is less positive or morebasis is less positive or more negative than the historic averagendash For example assume that theFor example assume that the
average basis for a hypothetical market is -$035 per bushel The present basis is -$045
ndash Therefore present basis is weak relative to the historic average
BasisCash Price ndash Futures Price = Basisbull Is the relationship between a local cash market and theIs the relationship between a local cash market and the
futures market
bull Can be negative or positiveCan be negative or positive
bull Is more stable than cash or futures prices
Basis Componentsbull Storage (insurance and interest)
bull Transportation
bull Local supply and demand
The Role of Basis in Hedgingg gBasis describes the price relationship between cash market prices and futures market prices at a particular time and location Basis is the number of cents (dollars) per unit that the local cash price of a commodity is above or below the current priceper unit that the local cash price of a commodity is above or below the current price for a particular futures contract delivery month on a given day Thus basis is the cash market price minus the futures market price at a specific time
Basis is important yet often the least understood concept in hedging agricultural p y p g g gcommodities An understanding and an accurate estimate of basis is needed by farmers and rancher who want to include hedging as part of their pricing strategy
Basis is important because approximately 97 percent of all agricultural commodities traded in the futures market are offset before delivery Therefore because the actualtraded in the futures market are offset before delivery Therefore because the actual physical commodity is mostly sold on the cash market the hedged futures price will not be the realized price for the commodity An estimate of that price can be calculated using the basis
A knowledge of the local basis is necessary to translate a given futures price into probable effective price for local delivery The futures price plus the expected basis (with appropriate arithmetic sign) is an estimate of the price the futures market is offering for the commodity delivered to the local market during a particular month Remember the basis is cash minus futures Therefore when the basis is negative gthe futures price is reduced by the amount of the basis When the basis is positive the futures price is increased by the basis value
Market CarryNormal Market
Sept
July $235
Sept $238
Mar
May $222
Dec $200
$212
Market CarryInverted Market
Dec $3 26
May $306
Mar $311
$326
Sept
July $299
$280
Basis and Expected PriceBasis and Expected Pricebull Knowledge of local basis is
t t l t inecessary to translate a given futures price into a probable price f l l d lifor local delivery
bull The futures price adjusted for basis is the price the market is offering for your grain delivered at a local elevator during a particular month(expected price = futures + basis)( p p )
Expected Price -$050 basisExpected Price $050 basis
5 1
49
51
45
47
Cash
4 1
43
39
41
450 460 470 480 490 500 510 520 530 540 550
December Futures
Texas Corn Basis in Oct vs Dec Contract Hi h L A (2005 09)High Low Average (2005-09)
North of the
0 30
040
0 30
040Canadian Triangle Area South of Line
0 10
020
030
0 10
020
030
0 10
000
010
0 10
000
010
0 30
-020
-010
0 30
-020
-010
Oct 2010 -030-030
Source httpmastermarketertamuedu
Basis Tracking FormBasis Table
Commodity LocationNearby Futures Contract Harvest Delivery
CashFutures Contract
Futures Contract
Forward Cash
Contract
Harvest Contract Futures Implied
Basis Contract
Date Price Month Price Basis Offer Price Basis Offer
Basis Corn North of the C diCanadian
Basis Sorghum North of the C diCanadian
Basis Expected Harvest Basis
Expected Mar 1 Basis
Expected May 1 BasisExpected May 1 Basis
If short crop basis will
If large crop basis will
StrategiesStrategies
NOTES

BasisBasis
bull There are times when the formula generates a basis with a positive sign
bull This denotes that the cash price is higher than futures price or cash pricehigher than futures price or cash price is selling at a premium to the futures
bull This occurs because supplydemandThis occurs because supplydemand relationships in the local cash market is different from futures market The local
l f i i th k t bsupply of grain in the market may be limited relative to demand or demand may be relatively higher than supply inmay be relatively higher than supply in the local market
Basis
bull The observed basis is termed asThe observed basis is termed as strong when the present basis is more positive or less negativemore positive or less negative than the historic average basis
For example assume that thendash For example assume that the average basis for a hypothetical market is -$035 per bushel The $ ppresent basis is -$010
ndash Therefore present basis is strong p grelative to the historic average
Basis
bull Similarly the observed basis isSimilarly the observed basis is termed as weak when the present basis is less positive or morebasis is less positive or more negative than the historic averagendash For example assume that theFor example assume that the
average basis for a hypothetical market is -$035 per bushel The present basis is -$045
ndash Therefore present basis is weak relative to the historic average
BasisCash Price ndash Futures Price = Basisbull Is the relationship between a local cash market and theIs the relationship between a local cash market and the
futures market
bull Can be negative or positiveCan be negative or positive
bull Is more stable than cash or futures prices
Basis Componentsbull Storage (insurance and interest)
bull Transportation
bull Local supply and demand
The Role of Basis in Hedgingg gBasis describes the price relationship between cash market prices and futures market prices at a particular time and location Basis is the number of cents (dollars) per unit that the local cash price of a commodity is above or below the current priceper unit that the local cash price of a commodity is above or below the current price for a particular futures contract delivery month on a given day Thus basis is the cash market price minus the futures market price at a specific time
Basis is important yet often the least understood concept in hedging agricultural p y p g g gcommodities An understanding and an accurate estimate of basis is needed by farmers and rancher who want to include hedging as part of their pricing strategy
Basis is important because approximately 97 percent of all agricultural commodities traded in the futures market are offset before delivery Therefore because the actualtraded in the futures market are offset before delivery Therefore because the actual physical commodity is mostly sold on the cash market the hedged futures price will not be the realized price for the commodity An estimate of that price can be calculated using the basis
A knowledge of the local basis is necessary to translate a given futures price into probable effective price for local delivery The futures price plus the expected basis (with appropriate arithmetic sign) is an estimate of the price the futures market is offering for the commodity delivered to the local market during a particular month Remember the basis is cash minus futures Therefore when the basis is negative gthe futures price is reduced by the amount of the basis When the basis is positive the futures price is increased by the basis value
Market CarryNormal Market
Sept
July $235
Sept $238
Mar
May $222
Dec $200
$212
Market CarryInverted Market
Dec $3 26
May $306
Mar $311
$326
Sept
July $299
$280
Basis and Expected PriceBasis and Expected Pricebull Knowledge of local basis is
t t l t inecessary to translate a given futures price into a probable price f l l d lifor local delivery
bull The futures price adjusted for basis is the price the market is offering for your grain delivered at a local elevator during a particular month(expected price = futures + basis)( p p )
Expected Price -$050 basisExpected Price $050 basis
5 1
49
51
45
47
Cash
4 1
43
39
41
450 460 470 480 490 500 510 520 530 540 550
December Futures
Texas Corn Basis in Oct vs Dec Contract Hi h L A (2005 09)High Low Average (2005-09)
North of the
0 30
040
0 30
040Canadian Triangle Area South of Line
0 10
020
030
0 10
020
030
0 10
000
010
0 10
000
010
0 30
-020
-010
0 30
-020
-010
Oct 2010 -030-030
Source httpmastermarketertamuedu
Basis Tracking FormBasis Table
Commodity LocationNearby Futures Contract Harvest Delivery
CashFutures Contract
Futures Contract
Forward Cash
Contract
Harvest Contract Futures Implied
Basis Contract
Date Price Month Price Basis Offer Price Basis Offer
Basis Corn North of the C diCanadian
Basis Sorghum North of the C diCanadian
Basis Expected Harvest Basis
Expected Mar 1 Basis
Expected May 1 BasisExpected May 1 Basis
If short crop basis will
If large crop basis will
StrategiesStrategies
NOTES

Basis
bull Similarly the observed basis isSimilarly the observed basis is termed as weak when the present basis is less positive or morebasis is less positive or more negative than the historic averagendash For example assume that theFor example assume that the
average basis for a hypothetical market is -$035 per bushel The present basis is -$045
ndash Therefore present basis is weak relative to the historic average
BasisCash Price ndash Futures Price = Basisbull Is the relationship between a local cash market and theIs the relationship between a local cash market and the
futures market
bull Can be negative or positiveCan be negative or positive
bull Is more stable than cash or futures prices
Basis Componentsbull Storage (insurance and interest)
bull Transportation
bull Local supply and demand
The Role of Basis in Hedgingg gBasis describes the price relationship between cash market prices and futures market prices at a particular time and location Basis is the number of cents (dollars) per unit that the local cash price of a commodity is above or below the current priceper unit that the local cash price of a commodity is above or below the current price for a particular futures contract delivery month on a given day Thus basis is the cash market price minus the futures market price at a specific time
Basis is important yet often the least understood concept in hedging agricultural p y p g g gcommodities An understanding and an accurate estimate of basis is needed by farmers and rancher who want to include hedging as part of their pricing strategy
Basis is important because approximately 97 percent of all agricultural commodities traded in the futures market are offset before delivery Therefore because the actualtraded in the futures market are offset before delivery Therefore because the actual physical commodity is mostly sold on the cash market the hedged futures price will not be the realized price for the commodity An estimate of that price can be calculated using the basis
A knowledge of the local basis is necessary to translate a given futures price into probable effective price for local delivery The futures price plus the expected basis (with appropriate arithmetic sign) is an estimate of the price the futures market is offering for the commodity delivered to the local market during a particular month Remember the basis is cash minus futures Therefore when the basis is negative gthe futures price is reduced by the amount of the basis When the basis is positive the futures price is increased by the basis value
Market CarryNormal Market
Sept
July $235
Sept $238
Mar
May $222
Dec $200
$212
Market CarryInverted Market
Dec $3 26
May $306
Mar $311
$326
Sept
July $299
$280
Basis and Expected PriceBasis and Expected Pricebull Knowledge of local basis is
t t l t inecessary to translate a given futures price into a probable price f l l d lifor local delivery
bull The futures price adjusted for basis is the price the market is offering for your grain delivered at a local elevator during a particular month(expected price = futures + basis)( p p )
Expected Price -$050 basisExpected Price $050 basis
5 1
49
51
45
47
Cash
4 1
43
39
41
450 460 470 480 490 500 510 520 530 540 550
December Futures
Texas Corn Basis in Oct vs Dec Contract Hi h L A (2005 09)High Low Average (2005-09)
North of the
0 30
040
0 30
040Canadian Triangle Area South of Line
0 10
020
030
0 10
020
030
0 10
000
010
0 10
000
010
0 30
-020
-010
0 30
-020
-010
Oct 2010 -030-030
Source httpmastermarketertamuedu
Basis Tracking FormBasis Table
Commodity LocationNearby Futures Contract Harvest Delivery
CashFutures Contract
Futures Contract
Forward Cash
Contract
Harvest Contract Futures Implied
Basis Contract
Date Price Month Price Basis Offer Price Basis Offer
Basis Corn North of the C diCanadian
Basis Sorghum North of the C diCanadian
Basis Expected Harvest Basis
Expected Mar 1 Basis
Expected May 1 BasisExpected May 1 Basis
If short crop basis will
If large crop basis will
StrategiesStrategies
NOTES

Basis Corn North of the C diCanadian
Basis Sorghum North of the C diCanadian
Basis Expected Harvest Basis
Expected Mar 1 Basis
Expected May 1 BasisExpected May 1 Basis
If short crop basis will
If large crop basis will
StrategiesStrategies
NOTES
Basis Sorghum North of the C diCanadian
Basis Expected Harvest Basis
Expected Mar 1 Basis
Expected May 1 BasisExpected May 1 Basis
If short crop basis will
If large crop basis will
StrategiesStrategies
NOTES

Basis Expected Harvest Basis
Expected Mar 1 Basis
Expected May 1 BasisExpected May 1 Basis
If short crop basis will
If large crop basis will
StrategiesStrategies
NOTES