Embed Size (px)
Citation preview

Rohit Ramaswamy, PhD, MPH Associate Professor
Public Health Leadership/Maternal and Child Health University of North Carolina, Chapel Hill
IMPROVING IMPLEMENTATION OR IMPLEMENTING IMPROVEMENT ?
How do improvement science and implementation science contribute to quality and effectiveness in health care?
Abe Wandersman, PhD Professor
Dept. of Psychology University of South Carolina
• Big picture issue • Evidence Based Interventions are necessary but not
sufficient for outcomes • Bridging research and practice • The Interactive Systems Framework (ISF) • Readiness • Evidence Based System for Innovation Support (EBSIS) • Integrating Improvement and Implementation: Ghana case
study
OVERVIEW

IMPLEMENTATION AND IMPROVEMENT SCIENCES – CONNECTED BY A COMMON GOAL
IMPLEMENTATION SCIENCE
IMPROVEMENT SCIENCE
GOOD AND SUSTAINED OUTCOMES
CONTINUALLY IMPROVE IMPLEMENTATION QUALITY
IMPLEMENT WHAT YOU IMPROVE WITH QUALITY

IMPROVING IMPLEMENTATION QUALITY
• CQI embedded into common implementation frameworks
Quality Implementation Framework Getting to Outcomes NIRN Active Implementation

IMPLEMENTING WHAT IS IMPROVED
1. No tools to guide the actual process of implementation. 2. No formal approach that facilitates adoption of improvement solutions 3. No formal method and tools to adapt improvement solutions to other situations and contexts.

Evidence Based Interventions are Necessary But Not Sufficient for Outcomes


Replication worked (at first)

But Not at Scale

RESEARCH PRACTICE

BRIDGING RESEARCH AND PRACTICE
*WHERE DO EVIDENCE BASED PRACTICES COME FROM AND WHERE DO THEY GO
*RESEARCH TO PRACTICE MODELS *THE INTERACTIVE SYSTEMS FRAMEWORK FOR DISSEMINATION AND IMPLEMENTATION (ISF)

2.With an emphasis on risk and protective factors, review relevant information—both from fields outside prevention and from existing preventive intervention research programs
RISK AND PROTECTIVE FACTORS
3. Design, conduct, and analyze pilot studies and confirmatory and replication trials of the preventive intervention program
EFFICACY TRIALS
4. Design, conduct, and analyze large-scale trails of the preventive intervention program
EFFECTIVENESS
TRIALS
5. Facilitate large-scale implementation and ongoing evaluation of the preventive intervention program in the community
PRACTICE
1. Identity problem or disorder(s) and review information to determine its extent
EPIDEMIOLOGY
Feedback Loop
FIGURE 1.1 The preventive intervention research cycle. Preventive intervention research is represented in boxes three and four. Note that although information from many different fields in health research, represented in the first and second boxes, is necessary to the cycle depicted here, it is the review of this information, rather than the original studies, that is considered to be part of the preventive intervention research cycle. Likewise, for the fifth box, it is the facilitation by the investigator of the shift from research project to community service program with ongoing evaluation, rather than the service program itself, that is part of the preventive intervention research cycle. Although only one feedback loop is represented here, the exchange of knowledge among researchers and between researchers and community practitioners occurs throughout the cycle.

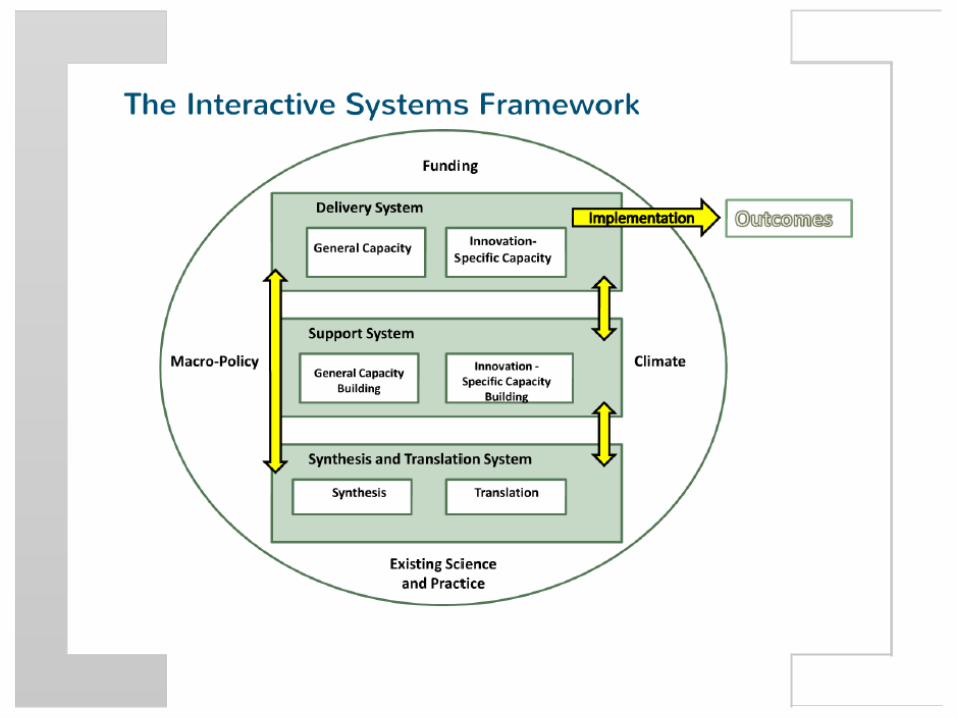
Distilling the Information— Synthesis & Translation System
Supporting the Work—Support System
Putting It Into Practice— Delivery System
Synthesis
General Capacity Building
Innovation-Specific Capacity Building
General Capacity Use
Innovation-Specific Capacity Use
Macro Policy
Climate
Funding
Existing Research and Theory
Translation

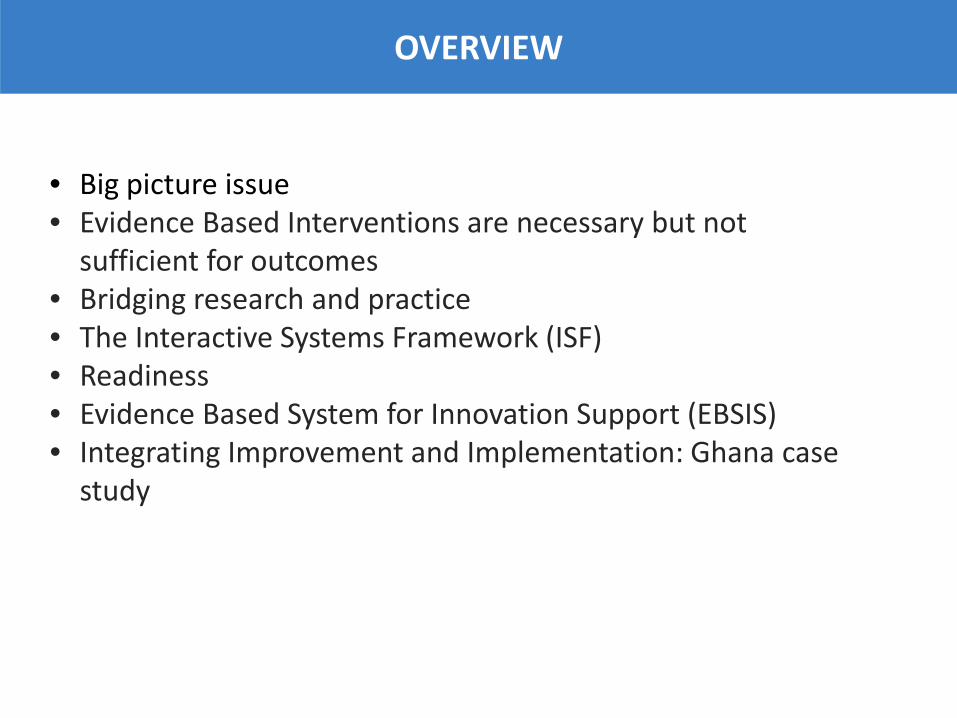
Interactive Systems Framework for Dissemination and Implementation
Delivery System
General Capacity

General Capacities Types of General Capacities
(non-exhaustive) Authors
Culture Drzensky et al., 2012; Glisson, 2007; Glisson & Schoenwald, 2005; Hemmelgarn et al., 2006
Climate Aarons et al., 2011; Beidas et al., 2013; Damschroder et al., 2009; Glisson, 2007; Greenhalgh et al., 2004, Hall & Hord, 2010; Lehman et al., 2002
Organizational Innovativeness
Damschroder et al., 2009; Fetterman & Wandersman, 2005; Greenhalgh et al., 2004; Klein & Knight, 2005; Rafferty et al., 2013; Rogers, 2003
Resource Utilization Armstrong et al., 2006; Greenhalgh et al., 2004; Klein et al., 2001; Rogers, 2003; Simpson, 2002
Leadership Aarons & Sommerfield, 2012; Becan, Knight, & Flynn, 2012; Beidas et al., 2013; Fixsen et al., 2005; Grant, 2013; Rafferty et al., 2013; Simpson et al., 2002
Structure Damschroder et al., 2009; Flaspohler et al., 2008; Greenhalgh et al., 2004, Lehman et al., 2002; Rafferty et al., 2013; Rogers, 2003
Staff Capacity Flaspohler et al., 2008; McShane & Van Glinow, 2009; Simpson et al., 2002

GC Components are “Normal”
High Medium Low
Leadership
Interactive Systems Framework for Dissemination and Implementation
Delivery System
General Capacity
Innovation-Specific Capacity

An Innovation
•Any policy, program, or process that is new to a setting

Innovation-Specific Capacities Types of Innovation-Specific Capacities;
(non-exhaustive) Authors
Innovation-Specific knowledge, skills, and abilities
Wandersman, Chien, & Katz, 2012; Fixsen et al., 2005; Greenhalgh et al., 2004; Simpson, 2002
Program Champion Atkins et al., 2008; Damshroder et al., 2009; Greenhalgh et al., 2004; Gladwell, 2002; Grant, 2013; Rafferty et al., 2013; Rogers, 2003
Specific Implementation Supports
Aarons et al., 2011; Beidas et al., 2013; Damshroder et al., 2009; Fetterman & Wandersman, 2005; Greenhalgh et al., 2004; Hall & Hord, 2010; Rogers, 2003; Schoenwald & Hoagwood, 2001; Weiner et al., 2008.
Interorganizational Relationships
Aarons et al., 2011; Flaspohler et al., 2004; Powell et al., 2012
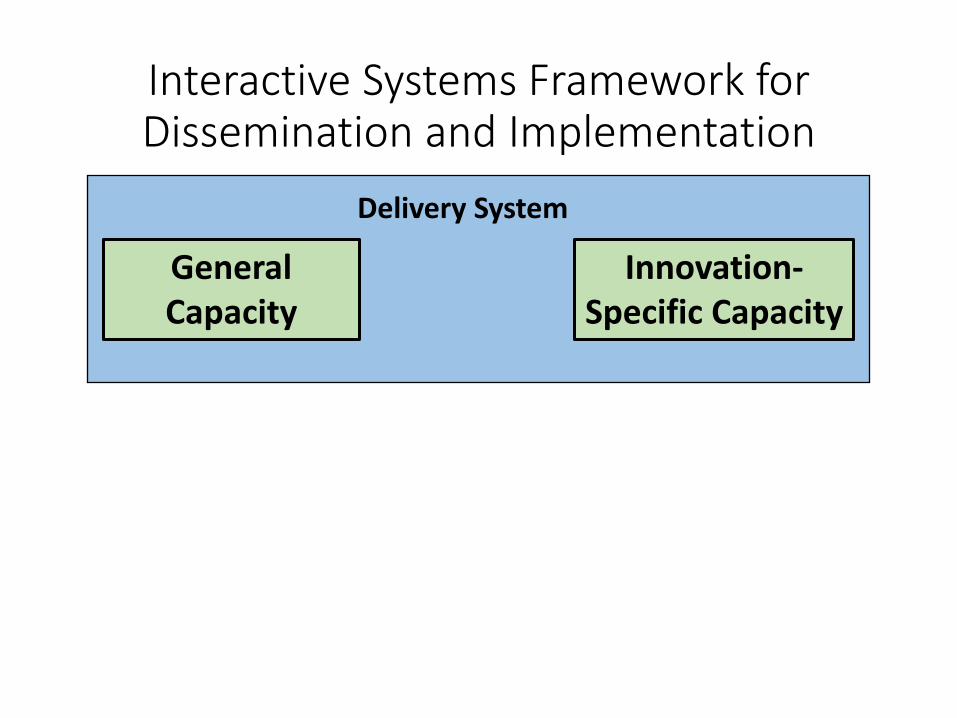
Interactive Systems Framework for Dissemination and Implementation
Delivery System
General Capacity
Innovation-Specific Capacity Motivation

Motivation for Innovation Types of Motivations
(non-exhaustive) Authors
Relative Advantage Armenakis et al., 1993; Damschroder et al., 2009; Hall & Hord, 2010; Rafferty et al., 2013; Rogers, 2003; Weiner, 2009
Compatibility Chinman et al., 2004; Durlak & Dupre, 2008; Fetterman & Wandersman, 2005; Greenhalgh et al., 2004; Rogers, 2003; Simpson, 2002
Complexity Damschroder & Hagedorn, 2011; Fixsen et al., 2005; Greenhalgh et al., 2004; Meyers, Durlak & Wandersman, 2012; Wandersman et al., 2008.
Trialability Armenakis et al., 1993; Greenhalgh et al., 2004; Rapkin et al., 2012; Rogers, 2003
Observability Beutler, 2001; Chinman et al., 2004; Damschroder et al., 2009; Ford et al., 2008; Rossi, Lipsey, & Freeman, 2004
Priority Armenakis & Harris, 2009; Greenhalgh et al., 2004; Flaspohler et al., 2008

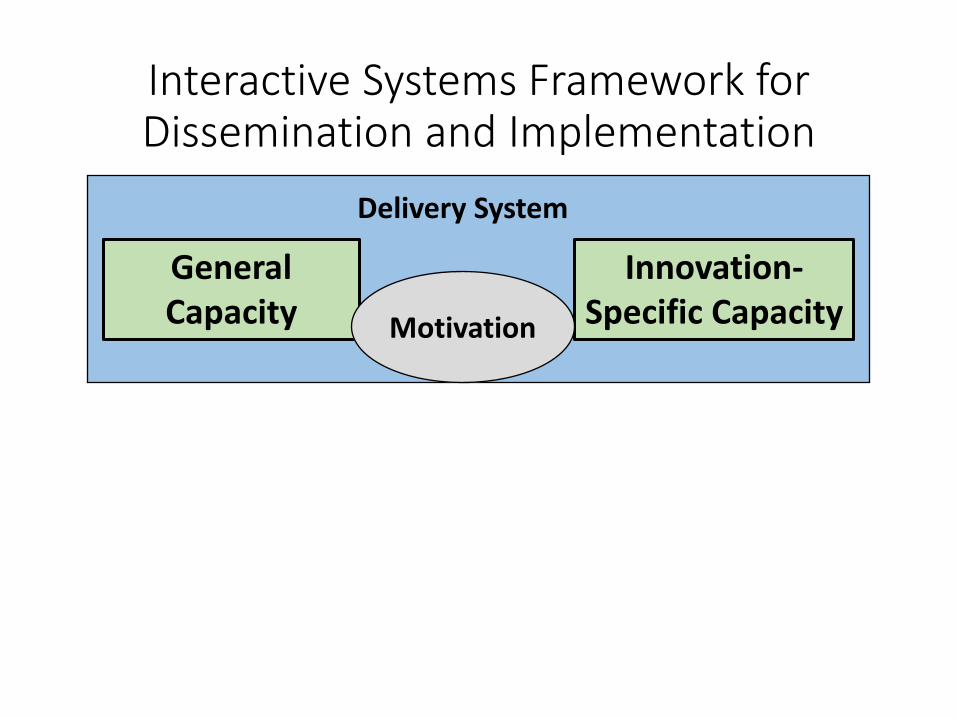
A Heuristic
Readinessi = Motivationi x General Capacity x
Innovation-Specific Capacityi
R = MC 2

Interactive Systems Framework for Dissemination and Implementation
Delivery System
General Capacity
Innovation-Specific Capacity Motivation
Support System
General Capacity
Innovation-Specific Capacity Motivation
Readiness Building Strategies


Building Readiness Broad Strategies
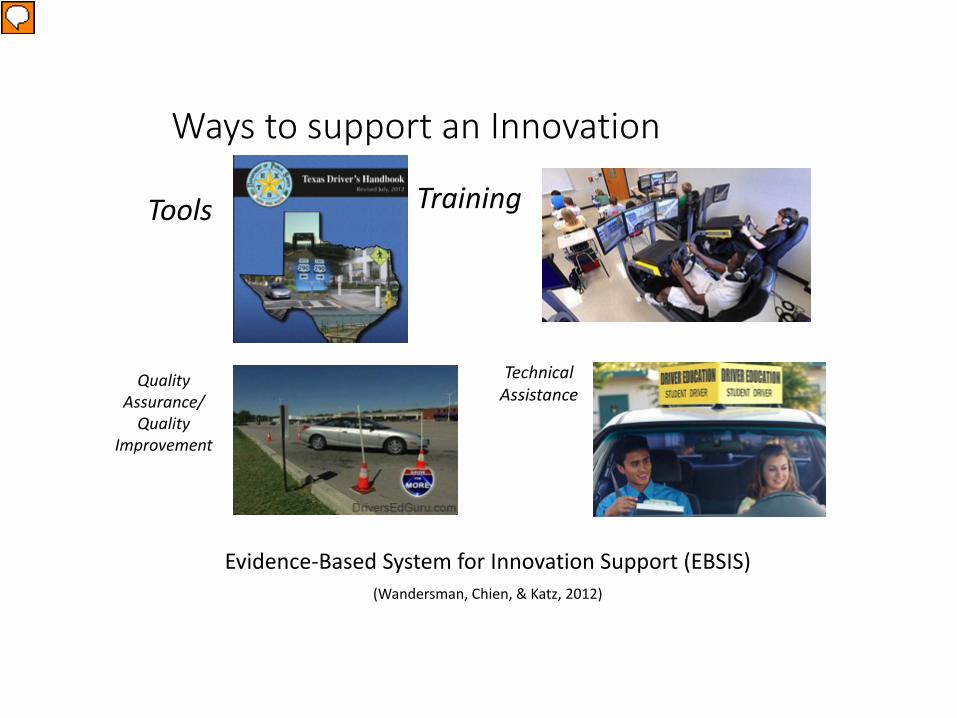
Ways to support an Innovation
Evidence-Based System for Innovation Support (EBSIS) (Wandersman, Chien, & Katz, 2012)
Tools Training
Technical Assistance
Quality Assurance/
Quality Improvement

Testing out systems to help assess and develop readiness and capability:
Building Readiness Through an Evidence-Based System for Implementation Support (EBSIS)
To Achieve Desired Outcomes
Initial Readiness
• General Capacities
• Innovation-Specific Capacities
• Motivation
Readiness Outcomes Improved:
• General
Capacity • Innovation
- Specific Capacity
• Motivation
Relationships
Training
Quality Assurance Quality Improvement
Tools Technical Assistance

IMPLEMENTATION


Definition of Quality Implementation
We define quality implementation as putt ing an innovation into practice in a way that meets the necessary standards to achieve the innovation's desired outcomes

SYNTHESIS OF IMPLEMENTATION FRAMEWORKS
Meyers, Durlak & Wandersman 2012
• Review of implementation frameworks • Implementation Action strategies used in
Iiterature ·Act ion steps for implementing technologies,
practices, and/or processes in organizations and/or communities
• 25 frameworks were retained (e.g., framework by Dean Fixsen and colleagues)

Synthesis Methodology ·Quanti tat ive and qualitative articles were
retained • Peer-reviewed publications, book chapters,
dissertations, or non-peer-reviewed monographs
• Articles which were retained had to include an implementation framework


What is Practical Implementation Science?
A user-friendly translationof the results of implementation science

Quality Implementation Tool (QIT)
• User-friendly translation of the quality implementation framework
• QIT can be applied to: • Planning for implementation
• Thinking through implementation dimensions a priori can help systematize implementation
• Monitoring implementation ·Use of the checklist during implementation can inform
needs for mid-course correction • Evaluating implementation
·Checklist can be used for retrospective evaluation of implementation in relation to outcomes

QIT Components
1. Develop an implementation team 2. Foster supportive organizational climate and conditions 3. Develop an implementation plan 4. Receive training and technical assistance 5. Practitioner-developer collaboration in implementation 6. Evaluate aspects of implementation
Each component is broken down into concrete act ion steps

Component 1 : Develop an Implementation Team
Action Steps: 1. Decide on structure of team overseeing
implementation 2. Identify an implementation team leader 3. Identify and recruit content area specialists as
team members 4. Identify and recruit other agencies and/or
community members as team members 5. Assign team members documented roles,
processes, and responsibilities
1. im ad WC
1. le
1 . SJ)•
1.4 an
1 . ro

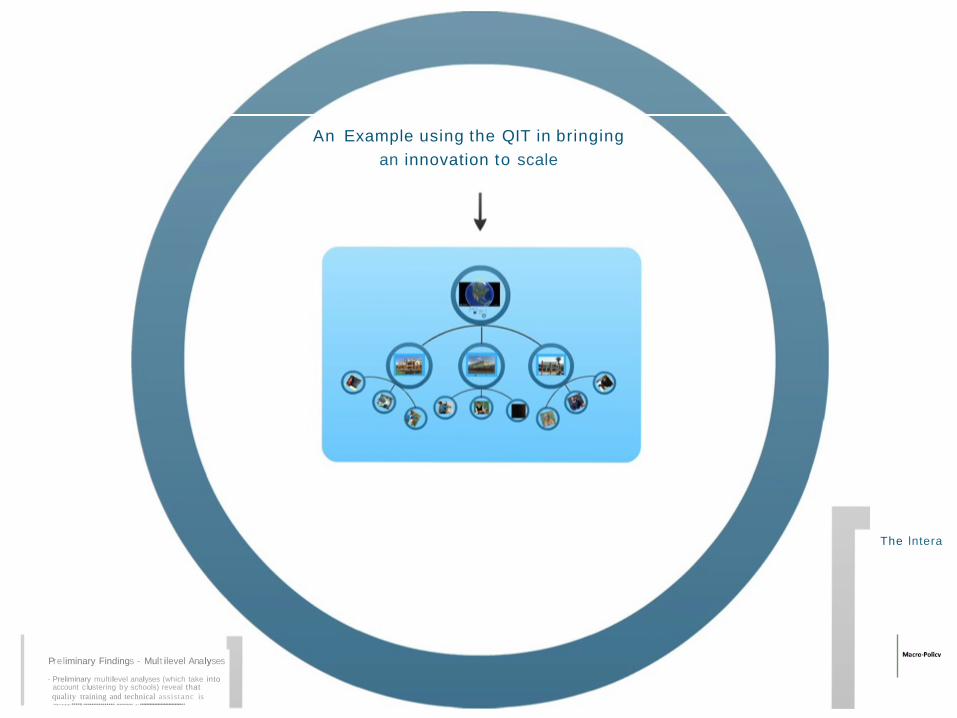
An Example using the QIT in bringing an innovation to scale
Preliminary Findings - Mult ilevel Ana lyses · Preliminary multilevel analyses (which take into
account clustering by schools) reveal that quality training and technical assistanc is ...,..,.,.,......,.................;........... ,.............................
The lntera


Q

Challenges to implementing 1TW01 with quality
• 1TW01 is a district level innovation ·Quality implementation at multiple sites
• 38 different schools • district uses a site-based management system, so schools
have autonomy and distr ict has less influence over local decisions
• Need to provide professional development and support to a diverse set of teachers, all with varying levels of capacity
·Schools varied in level of "buy - in" • Different types of resistance across schools ·Significant technical issues, including infrastructure differences
across schools
Ho w can we monito r quality . . . . .
.


Dealing with challenges
Used the QIT to help the distr ict plan for and monitor implementation Representatives from schools and distr ict came together to talk about how they can support implementation at the school-level
The end result was a specific task l ist of what needed to be done and by when.

QIT is helping us navigate the layers of work - layers that take planning, and implementation down to the school and classroom level and layers that break large tasks into even smaller tasks wi th specific responsibi Iities" -Dr. Debbie Hamm, Chief Information Officer


1TW01 was the "skunk on the table" for middle schools
Variabi Ii ty in the implementation of 1TW01 (e.g. different devices, professional development) posed unique challenges in bringing quality implementation to scale

"The tool allows potentially dysfunctional relationships to step back, take a deep breath, and apply clear and structured logical steps to working through a challenge ... The OIT tool seems to position the elements of the project (and the challenges) externally in a way that the key team members can see through the hype and work in logical ways that lead to better outcomes. Also, many times in education ...we begin wi th the end-game in mind and struggle to work backwards to force the end game - sometimes with incorrect practices -- without any structured guide to step through sequentially.
The OIT helps people to "face the brutal facts". I t is effective in taking complex and potentially convoluted projects and converting the variables to their lowest common denominator."
- Tom Cranmer, Executive Director of IT services


, , . I
' 1 I a


Get to this!!

• Durlak, J. A., & Dupre, E. P. (2008). Implementation matters: A review of research on the influence of implementation on progam outcomes and the factors affecting the implementation. American Journal of Community Psychology, 41, 327-350.
• Gottfredson, D. C. & Gottfredson, G. D. (2002). Quality of School Based Prevention Programs: Results from a National Survey. Journal of Research in Crime and Delinquency, 39, 1, 3-35.
•Meyers DC, Katz J, Chien V, Wandersman A, Scaccia JP, & Wright A. (2012). Practical implementation science: developing and piloting the quality implementation tool.American Journal of Community Psychology, 50(3-4), 481-96.
•Meyers, D.C., Durlak, J.A.,& Wandersman A. (2012). The qua Ii ty implementation framework: a synthesis of critical steps in the implementation process. American Journal of Community Psychology, 50(3-4), 462-480.
• U.S. Department of Education, Office of Planning, Evaluation and Policy Development, Pol icy and Program Studies Service (2011). Prevalence and Implementation Fidelity of Research-Based Prevention Programs in Public Schools: Final Report, Washington, D C
References

IMPLEMENTATION AND IMPROVEMENT SCIENCES – CONNECTED BY A COMMON GOAL
IMPLEMENTATION SCIENCE
IMPROVEMENT SCIENCE
GOOD AND SUSTAINED OUTCOMES
CONTINUALLY IMPROVE IMPLEMENTATION QUALITY
IMPLEMENT WHAT YOU IMPROVE WITH QUALITY

INTEGRATING IMPLEMENTATION AND IMPROVEMENT - GHANA CASE STUDY
• Ghana has implemented interventions
to promote access, increasing facility based deliveries.
• But the question is: what happens when the patient gets to the hospital?
• MMR has not been reduced significantly in tertiary hospitals
• Ghana has emphasized access, without addressing quality of care within institutions

THE CONTEXT
• Ridge Regional Hospital (RRH) is an obstetric referral center in Accra
• Almost 10,000 births per year
• 6 labor and 2 delivery beds
• Operating theatre 200m away
• 1 consultant OB • 4 medical
officers/residents • 3-4 midwives/shift

THE HISTORY
• Volunteer medical team from UNC, Duke and Wake Forest Universities working at hospital from 2007-2012
• Improved clinical staff capacity, provided equipment and supplies
• Dramatic impact on outcomes • Volumes and case complexity
increased • System strengthening project
started in 2013 • Focus on 5 regional hospitals • Systematic approach to systems
change through QI methods.

MATERNAL MORTALITY AT RIDGE HOSPITAL
300
350
400
450
500
550
600
0
2000
4000
6000
8000
10000
12000
1 2 3 4 5 6 7 8
MM
R
Deliv
erie
s per
Yea
r
Year
Deliveries and MMR - Ridge Hospital: 2007 to 2014
Deliveries
MMR

MORTALITY DUE TO MOST COMMON COMPLICATIONS
Pre-eclampsia Hemorrhage
Year Total Deliveries
Prevalence (%)
Case Fatality Rate (%)
Prevalence (%)
Case Fatality Rate (%)
2007 6049 5.3 3.1 0.8 14.8 2008 7465 7.9 1.3 1.3 5.1 2009 8230 12.1 1.1 3.9 1.9 2010 8133 12.8 1.1 4.2 2.0
2011 9357 14.5 1.1* 5.2 1.6#
2012 11032 16.3 1.0 7.2 1.9
2013 7591 16.1 0.6 5.5 2.1
2014 9113 15.5 1.2 6.0 1.8
Represent 56% and 60% of all deaths in 2007 and 2014

MORTALITY AUDIT 2014 – AVOIDABLE FACTORS FACTOR CATEGORY
Inadequate dose of ketanine Clinical
Delay in getting basic labs Operational
Unavailability of size 18 cannula Operational
Failure of adequate monitoring Leadership
Delay in ANC referral Operational
Delay in labs Operational
Delay in seeking health care Operational
Administration of wrong medication Clinical
Temporary failure of oxygen system Operational
Risk factor of anaemia not identified Clinical
Not diagnosing pelvic absess Clinical
No funds for blood Operational
Senior person not called on time Leadership
Unavailability of blood Operational
Should involve physicians earlier Leadership
Discharged too early Leadership

IMPLEMENTATION MODEL
Clinical Excellence
Leadership Excellence
Operational Excellence
Integrated Systems Strengthening Approach

io
Synthesis & Translation System – What practices are important for this setting?
Support System – How do we promote capability in these practices
Delivery System – How do we ensure change is occurring?
Synthesis
General Capacity Building
Innovation-Specific Capacity Building
General Capacity Use
Innovation-Specific Capacity Use
Macro Policy
Climate
Funding
Existing Research and Theory
Translation
USING THE INTERACTIVE SYSTEMS FRAMEWORK
Wandersman A, Duffy J, Flaspohler P, Noonan R, Lubell K, et al. Bridging the gap between prevention research and practice: the interactive systems framework for dissemination and implementation.[

To Achieve Desired Outcomes
Initial Readiness
• General Capacities
• Innovation-Specific Capacities
• Motivation
Readiness Outcomes Improved:
• General
Capacity • Innovation
- Specific Capacity
• Motivation
Relationships
Training
Quality Assurance Quality Improvement
Tools Technical Assistance
Performance Gaps
BUILDING THE SUPPORT SYSTEM

IMPROVING IMPLEMENTATION QUALITY - PDSA
• Identify areas where implementation needs to be improved
• Launch local quality improvement projects led by clinical champions
• Use PDSA model for rapid improvements

IMPROVING IMPLEMENTATION - TRIAGE

RED YELLOW GREEN Eclampsia/seizure Sickle cell not in crisis Generalized
complaints Hemorrhage/heavy
vaginal bleeding Decreased or no fetal
movement Normal labor
Antepartum/postpartum hemorrhage
Multiple pregnancy in labor
Coma/unconscious Preterm labor
Abnormal vital signs Preterm rupture of membranes
Sickle cell crisis Stable/managed hypertension
2 or more previous c/s in active labor Previous c/s
Diabetic
HIV Positive Appendix B Slide 68
Kybele, Inc. Triage Training
TRIAGE PROTOCOL

% of shifts where wrist band use was monitored
0102030405060708090
100
%
IMPROVEMENT CYCLE 1 – BAND MONITORING

% of patients with wristbands
0102030405060708090
100%
IMPROVEMENT CYCLE 2 – BANDING COMPLIANCE

Audit 10 patients wrist band + folder combinations per week
Total patient wrist band + folder combinations
Correct Incorrect
535 495 (93%)
40 (7%)
IMPROVEMENT CYCLE 3 – BANDING QUALITY

Working diagnosis and Plan - Triage Admission Form Audit 2013 - 2014
0
10
20
30
40
50
60
70
80
90
100
Working diagnosis made Plan made
Dec-13Q1 2014Q2 2014Q3 2014Q4 2014
%
IMPROVEMENT CYCLE 4 – BANDING USE

IMPLEMENTING IMPROVEMENTS - NICU HAND HYGIENE
• 21 beds • Census audit conducted
from Dec 9, 2014 - 176 days have been audited
• The peak number of babies was 50
• Cot sharing occurred on 86% of days

CLOSING OPERATIONAL GAPS – QI PROJECTS
•Led by QI Leaders •Focus on cross-departmental projects
•Use Six Sigma methodology
•Emphasis on operational issues

• Hand hygiene training presentation (with post test)
• Visual reminders posted throughout NICU
• Weekly reinforcement messages on hand hygiene topic areas during staff meetings
• Additional hand towels supplied to NICU
IMPROVEMENT ACTIVITIES

76
#1 Needs/
Resources/ Readiness
#2 Goals &
Objectives
#3 Best
Practices
#4 Fit
#5 Capacities
#6 Plan
#7 Process
Evaluation #8
Outcome Evaluation
#9 Improve /
CQI
#10 Sustain
RESULTS
USING AN IMPLEMENTATION APPROACH

DESIGNING SOLUTIONS FOR FIT
• Involving staff team in improvement design
• Including NICU specific images
• Redesigning language of training materials
• Using local voices to record training video

BUILDING CAPACITY
• Multiple training sessions
• Weekly reminders in staff meetings
• Use of clinical champions for support and reinforcement
• Multiple presentations • Building monitoring
capacity

PLANNING FOR IMPLEMENTATION
• Clear plan with timelines
• Involvement of multiple stakeholders at various points in implementation
• Clear roles and responsibilities
• Ongoing monitoring

• Big picture issue • Evidence Based Interventions are necessary but not
sufficient for outcomes • Bridging research and practice • The Interactive Systems Framework (ISF) • Readiness • Evidence Based System for Innovation Support (EBSIS) • Integrating Improvement and Implementation: Ghana case
study
SUMMARY

CONCLUSION
“An integration of systematic implementation with quality improvement approaches is likely to enhance the quality of healthcare delivery by increasing the ability of practitioners to improve as well as to implement well” – Wandersman, Alia, Cook and Ramaswamy (2015)