Embed Size (px)
Citation preview

Improving explosion protection methods for industrial
processes : the collaborative project DELFINE
Emmanuel Leprette, Stephane Cousin, Jef Snoeys, Christophe Proust
To cite this version:
Emmanuel Leprette, Stephane Cousin, Jef Snoeys, Christophe Proust. Improving explosionprotection methods for industrial processes : the collaborative project DELFINE. 14. Congresde la Societe Francaise de Genie des Procedes ”Les sciences du genie des procedes pour uneindustrie durable” (SFGP 2013), Oct 2013, Lyon, France. SFGP. Paris, 104, pp.NC, 2013,Recents Progres en Genie des Procedes. <ineris-00973716>
HAL Id: ineris-00973716
https://hal-ineris.ccsd.cnrs.fr/ineris-00973716
Submitted on 4 Apr 2014
HAL is a multi-disciplinary open accessarchive for the deposit and dissemination of sci-entific research documents, whether they are pub-lished or not. The documents may come fromteaching and research institutions in France orabroad, or from public or private research centers.
L’archive ouverte pluridisciplinaire HAL, estdestinee au depot et a la diffusion de documentsscientifiques de niveau recherche, publies ou non,emanant des etablissements d’enseignement et derecherche francais ou etrangers, des laboratoirespublics ou prives.

Improving explosion protection methods for industrial processes : the
collaborative project DELFINE
(Evolution des méthodes de protection des procédés industriels contre les effets des
explosions : le projet DELFINE)
Emmanuel LEPRETTE a1
, Stéphane COUSIN b, Jef SNOEYS
c, Christophe PROUST
a, d
a INERIS, Parc Technologique ALATA, B.P. 2, 60550 Verneuil-en-Halatte
b DELTA NEU SAS, Z.I. rue Ampère, B.P. 10, 59932 La Chapelle d’Armentières Cedex
c FIKE Corp., Toekomstlaan 52, B-2200 Herentals, Belgique
d UTC, Laboratoire TIMR, EA4297, Centre Pierre Guillaumat, 60200 Compiègne
Summary Classical methods for vent sizing are based on experimental correlations coming from academic test
situations, sometime quite different from real industrial conditions. Thus, they do not take into account
the variation of turbulence in industrial enclosures, which may alter drastically the explosion violence.
The DELFINE installation presently in construction will allow studying dust explosions in real working
conditions of a dust collector. Preliminary experiments in an instrumented small size filter are presented,
which allow characterizing the turbulence level in every work phase of the system. It appears that the
turbulence level is generally lower than in the standard conditions for vent testing, even during reverse jet
cleaning. It should offer perspective for optimization of the venting areas for dust collectors. Explosion
tests in real conditions on the DELFINE installation will be performed to try to confirm these first
observations.
Keywords: Explosion, protection systems, venting, dust, turbulence
1. Background Dust explosions continue to represent major risks in the process industries. Some accidents, such as the
explosion of the grain silo in Blaye, France (August 1997, 12 victims: Masson, 1998), remind us that
explosions in the industry can have serious consequences. There is an obvious need to be capable of
“engineering” the safety to reduce the consequences of such accidents. In Europe, a legal framework has
been imposed to implement prevention and protection measures (EU directives 94/9/CE and 99/92/CE)
and practical guidelines and standards have been issued. One of these standards, EN14491 describes a
comprehensive method to calculate vent areas and design venting systems. This standard is an
interpretation of preceding guidelines (VDI 3673, NFPA68) by a panel of European experts. In the USA,
the venting guideline NPA68 was substantially revised and the 2007 version became a standard.
Vent sizing methods have received considerable attention, especially since the work of Donat (1971),
followed by experimental test programmes by Pineau (1982), Radandt (1983), Lunn (1988, Bartknecht
(1993), and Eckhoff (1991). A number of correlations have been proposed, deriving more or less
explicitly, from the theory of flames (Rust, 1979; Runes, 1972). It can be recalled (Proust and al., 2009)
that, if A is the size of the vent aperture in a vessel of volume V, the internal overpressure ΔPred
(“reduced explosion pressure”) can be expressed as
[1]
With Cd the discharge coefficient of the orifice, Af the flame area, St the burning velocity and Eexp the
expansion ratio of the burnt products. The “expansion velocity” St. (Eexp-1) mainly depends on the
( ) 2
exp 1
2
f t
red
d
A S EP
C A
ρ ⋅ ⋅ − ∆ = ⋅ ⋅

properties of the cloud itself (particle size and distribution, dust concentration, turbulence level, etc.) so
that for a “given cloud” the explosion overpressure will correlate to the geometrical parameters
implicitely contained in Af (and explicitely in A). The practical use of [1] is not straightforward because
the determination of the expansion velocity St. (Eexp-1) is rather difficult. Fortunately, flame theory
suggests a direct link between the expansion velocity and the maximum rate of pressure rise of the
explosion in a closed vessel:
[2]
Thus, the “flame speed” parameter Kex is much more conveniently determined indirectly at standard
conditions in, for instance, the 1m3 ISO vessel (ISO6184/1) and is better known as “Kst”. Note that there
is no evidence that the way in which the flame propagates in these standard test conditions corresponds to
any practical situation. However since the experimental conditions are kept constant in this standard
testing (Proust et al., 2007), the variation of the Kst between dusts certainly reflects the differences in
terms of powder reactivity.
Usually the flame theory cannot be applied directly and some fitting with the experimental data is
required. Some of those fitted correlations have been incorporated into guidelines and standards (NFPA
68, VDI 3673, EN 14491). Most process parameters suggested by [1] are covered such as the volume of
the vessel, the shape factor from the proportionality between Ach (internal area of vented vessel) and V2/3
and the reactivity of the dust cloud via KSt and Pmax. The European standard (EN 14491) for example
proposes the following relationship [3]:
where L/D represent the shape factor of the vessel.
Table 1 : vented dust explosion experiments in real or “realistic” equipments
ref Author Equipment Dispersion of the powder Injection
velocity-
pressure (m/s-barg)
Pipe
diameter
(m)
Volume
of the
vessel (m3)
Aspect
ratio
Area of
the
opening (m2)
Dust
A Eckhoff,
1988
filter tangential flow of dust from a
pneumatic transport line
35 - 0 0,155 5,8 2 0,11 Maize
starch B Eckhoff,
1988
filter tangential flow of dust from a
pneumatic transport line
35 - 0 0,155 5,8 2 0,2 Maize
starch
C Eckhoff, 1988
filter tangential flow of dust from a pneumatic transport line
35 - 0 0,155 5,8 2 0,4 Maize starch
D Eckhoff,
1988
filter tangential flow of dust from a
pneumatic transport line
35 - 0 0,155 5,8 2 0,55 Maize
starch E Tonkin,
1972
cyclone tangential flow of dust from a
pneumatic transport line
13 - 0 0,23 1,2 1 0,06 Wheat
flour
F Tonkin, 1972
cyclone tangential flow of dust from a pneumatic transport line
13 - 0 0,23 1,2 1 0,08 Wheat flour
G Tonkin,
1972
cyclone tangential flow of dust from a
pneumatic transport line
13 - 0 0,23 1,2 1 0,12 Wheat
flour H Eckhoff,
1986
silo cell coaxial flow of dust from a
pneumatic transport line
38 - 0 0,155 236 6 3,4 Maize
starch
I Eckhoff, 1986
silo cell coaxial flow of dust from a pneumatic transport line
38 - 0 0,155 236 6 5,7 Maize starch
J Eckhoff,
1984
silo cell coaxial flow of dust from a
pneumatic transport line
12 - 0 0,2 500 3,5 2 Wheat
dust K Eckhoff,
1984
silo cell coaxial flow of dust from a
pneumatic transport line
12 - 0 0,2 500 3,5 3 Wheat
dust
L Eckhoff, 1984
silo cell coaxial flow of dust from a pneumatic transport line
12 - 0 0,2 500 3,5 5 Wheat dust
M Eckhoff,
1984
silo cell coaxial flow of dust from a
pneumatic transport line
12 - 0 0,2 500 3,5 8,8 Wheat
dust
1/3
max exp
max
( 1)ex t
dPK V P S E
dt
= ⋅ ≈ ⋅ ⋅ −
( ) ( )5 0.569 0.5
max0.7533.264 10 P 0.27 0.1 P 1 4.305 log P 0.758 logSt red stat red red
A Lp K P
V D
− − − = × × × × + × − × × + − × + ×

N Eckhoff, 1984
silo cell coaxial flow of dust from a pneumatic transport line
12 - 0 0,2 500 3,5 14 Wheat dust
O Pineau,
1985
featured air
mill*
coaxial flow from a
pressurised line
250 - 4 0,025 1 3,5 0,03 Wheat
flour P Pineau,
1985
featured air
mill*
coaxial flow from a
pressurised line
250 - 4 0,025 1 3,5 0,05 Wheat
flour
Q Pineau, 1985
featured air mill*
coaxial flow from a pressurised line
250 - 4 0,025 1 3,5 0,07 Wheat flour
R Pineau,
1985
featured air
mill*
coaxial flow from a
pressurised line
250 - 4 0,025 1 3,5 0,1 Wheat
flour * 1 m3 vessel with pressurised injection
Eckhoff discussed this kind of approach and recalled that Kst is not a material constant (Eckhoff et al.,
1984; Eckhoff et al., 1986; Eckhoff et al., 1988) and should depend also on the turbulence. Eckhoff
produced data in very large silo explosions which showed that the severity of the explosion was greatly
affected by the state of the dust cloud at ignition. Further controlled experiments (table 1 from the data of
Eckhoff et al., 1984; Eckhoff et al., 1986; Eckhoff et al., 1988; Tonkin et al., 1972; Pineau et al., 1985),
including large tests which more closely resembled real processes, facilitated the confrontation between
the “Kst” based correlation (as [3]) and the realistic experimental results.
A comparison between calculated vent areas (by using [3]) and experiments in close-to-real
configurations is shown in figure 1. The calculated vent areas diverge significantly from the
measurements with some significant over estimations of ∆Pred but also severe underestimations.
Figure 1: Calculated (by using [3]) and measured overpressures for vented dust explosions developing in real
process equipment
This situation is by no means acceptable from a safety point of view and not even more from the
industrial point of view because the safety performance is not ensured. One likely reason for these
discrepancies is the significant influence of the initial turbulence of the cloud (Amyotte, 1985, Eckhoff et
al., 1984; Zalosh, 2006; Proust et al., 2009) on the combustion (via St). Because the turbulence level
depends strongly on the flow field inside the vessel prior to ignition, it is natural to think that a more
accurate prediction of the course of explosions can only be achieved if sufficient details on the flow field
could be entered into the combustion model (incorporating explicitly the influence of turbulence). One of
the aims of DELFINE project is to be capable of better predicting the course of the explosion to achieve a
better explosion projection by venting.
2. DELFINE experimental setup
Experiments will firstly be performed in filtration process in a filter not only because dust collectors are
involved in a majority of the reported dust explosions, but also because the reverse jet cleaning system
(RJC) –very frequently used in dust collectors- is often invoked as being the reason for explosions.

The experimental setup will consist in a DELTA NEU dust collector (volume about 4 m3) connected to an
open dust circulation duct (figure 2). The duct will be equipped with a dust injection system (constant
mass flow rate injector). The injector is designed to deliver dust fuel to a flowing system in a known feed
rate, thereby allowing for the creation of a homogeneous concentration atmosphere in the whole system.
The dust collector will be modified for the implementation of various explosion protection systems
(venting, suppression, isolation) at different locations, and will offer many ports with large possibilities
for measurement: turbulence, concentration, flame and pressure. Additionally videos from the inside of
the collector and the pipe will be captured through transparent walls and windows.
Figure 2: View of the future DELFINE experimental set-up
As a first step, preliminary work was performed in a real dust collector at small scale to test the
instrumentation and help the design of the future installation. A 1/3 scaled down filter + pipe device
available in the premises of one the partners (FIKE) was used to prepare the instrumentation and begin
the physical analysis. A full operational dust collector with piping was purposely built (figures 3 and 4).
Two different lengths of filter bags or ‘envelopes’ are used to represent a small (index 9 on figure 4) and
larger filter area (index 8), and different distances from filter bag to filter bag and filter bag to walls. The
flow rate can be adjusted. The reverse jet cleaning system consists of a 1 L tank pressurized to 5 bar,
solenoid valves release short (typical duration 0,2 sec) blasts of air into the filterbags (index A). During
RJC, short blasts of high pressure air are introduced through venturi’s and nozzles inside the sleeves
(figure 5). This pulse of air travels through the filter sleeve, causing it to flex out from the cage to
dislodge the dust accumulated on the filter sleeve (figure 6). During this period of time, the flow is
globally “reversed”, large amounts of dust fall into the hopper and it is believed that a significant degree
of turbulence appears.

Figure 3: Purposely built dust collector Figure 4: Short and long filter bags
(height 1 m, side 0.4 m, pipe 200 mm I.D.)
Figure 5: Illustration of RJC on a dust collector
Figure 6: Release behavior of non-consolidated dust during the reverse jet cleaning (from Mitsuhiko Hata et al.)
t=10ms 12.5ms 25ms 55ms 77.5ms 120ms 180ms
(c) Cleaning pressure 300kPa

In the real system the turbulence should be measured while a large quantity of dust will be conveyed so
that LDA techniques will not work anymore. To overcome this very important difficulty, the bidirectional
probe system (McCaffrey, 1976) once used by Tamanini (1990) to measure turbulence was further
developed (figure 7). The gauge is a small portion of a cylinder with a separating wall in the middle (10
mm outer diameter, 20 mm long). The difference of pressure measured on both sides of the separation is
proportional to the dynamic pressure applied along the axis.
Figure 7: Schematic principle of bidirectional probe
The instantaneous velocity is deduced directly from the measurement. A Furnace Control type of sensor
was used enabling velocity measurement in the range ±10m/s with a cutoff frequency of some tens of Hz.
having a sufficient dynamics (10 Hz) and accuracy (±100 Pa). A detailed description of the techniques
falls out of the scope of this paper but the results obtained with this technique can be compared with
known data. For instance, the mean velocity (U) and turbulence intensity (u’ : root means square of the
fluctuations of the velocity around the mean value) of the flow was measured inside the feeding pipe (at a
location where the flow field was established, far from the inlet) and at several position across the section.
An excellent agreement is found between the measurements and the available data from the literature
(figure 8).
Figure 8: arrangement of probes in the inlet tube and results (curves : original graphs from Comte-Bellot and Hinze
stars : present measurements) no dust in the flowfield
Towards pressure measurement
Differential pressure sensor

3. Flowfield and turbulence inside the experimental setup
Measurements were performed at several locations inside the filter (figure 9), during normal steady state
operations and during reverse jet cleaning. All the tests were performed without dust added although it is
possible to do the measurement with a dust cloud with the bidirectional probes.
Figure 9: locations of the measuring points in the filter (location 6 is on the inlet pipe, 1&3 below the sleeves, 2
between the sleeves, 4 top between wall and short sleeves)
Steady state operation
The flow in the inlet pipe (location 6) during steady state operation was measured as outlined above
described above (figure 10 and 11): with an average velocity of 7 m/s (resp. 10 m/s), the turbulence
intensity was on the order of 0.4 m/s (resp. 0.6 m/s).
Location 1 represents what happen just below the bags in the empty space of the filter. It can be seen
(figure 10) that gauges 1&2 detect a globally positive velocity2, gauges 4&5 see a negative flow whereas
for the central gauge (n°3) the average velocity seems close to zero. This suggests a swirling flow. The
average velocity over all the probes amounts about 2 m/s (absolute value) when the flow velocity in the
pipe is set to 10 m/s. Since the cross section of the filter is about 0.16 m2 and that of the pipe 0.03 m
2, the
average velocity seem to be in proportion to the cross section ratio. Note however that the turbulence
intensity is significantly larger than in the pipe, typically more than 1.1 m/s, which might result from the
velocity gradient induced by the swirling flow. In location 2 (between the sleeves), the flow seems mainly
orientated in the same direction with an average velocity (calculated on all the gauges) of about 1m/s
(absolute value). The turbulence intensity is about 0.8 m/s, smaller that in location 1. The presence of the
sleeves may dampen slightly the velocity fluctuations. A summary of all the measurements done at all
locations is presented in figure 11.
2 The sign depends on the orientation of the probe. Positive here means from the top to the bottom of the filter

Figure 10: flowfield at location 1 (left: inlet velocity10 m/s) and 2 (right: same velocity)
Figure 11: flowfield at all locations (inlet velocity10 m/s) during filtering operation
During reverse jet cleaning operation
A significant influence of RJC operation on the turbulence is expected. Statistical averaging was applied
on a batch of about 30 identical pulses (figure 12 for two gauges at location 1). Note that the average flow
is largely positive so that it is now going from the top toward the bottom of the filter with a significant
velocity, peaking up at about 8-10 m/s during the pulse. It is on the same order than the steady state flow
at this particular location. Fluctuations in time are noticeable, with a frequency of 15 to 20 Hz which
seems a natural acoustic resonance of the filter/duct assembly. This last remark suggests that rather than
producing a turbulent flow, the air-pulse, triggers the acoustic vibration of the filter with is more a kind of
plug pulsating flow with no randomly distributed eddies (which we would expect from a turbulent
flowfield). This result would suggest that this kind of RJC process would not degenerate in more
turbulence than in the mean flow during normal filtering operations. This important point will be verified
in the final DELFINE setup using transparent walls.
Location 5
u’ = 1.4 m/s
Location 3
u’ = 1.1 m/s
Location 1
u’ = 1.3 m/s
Location 2
u’ = 0.8 m/s
Location 4
u’ = 0.5 m/s
Location 6 (pipe)
u’ = 0.5 m/s
Pitot tube locations overview
L1: below short bags, above the hopper
L2: below short bags, middle of vertical wall
L3: below long bags, above hopper
L4: top, between short bags
L5: centre of hopper
L6: in inlet pipe
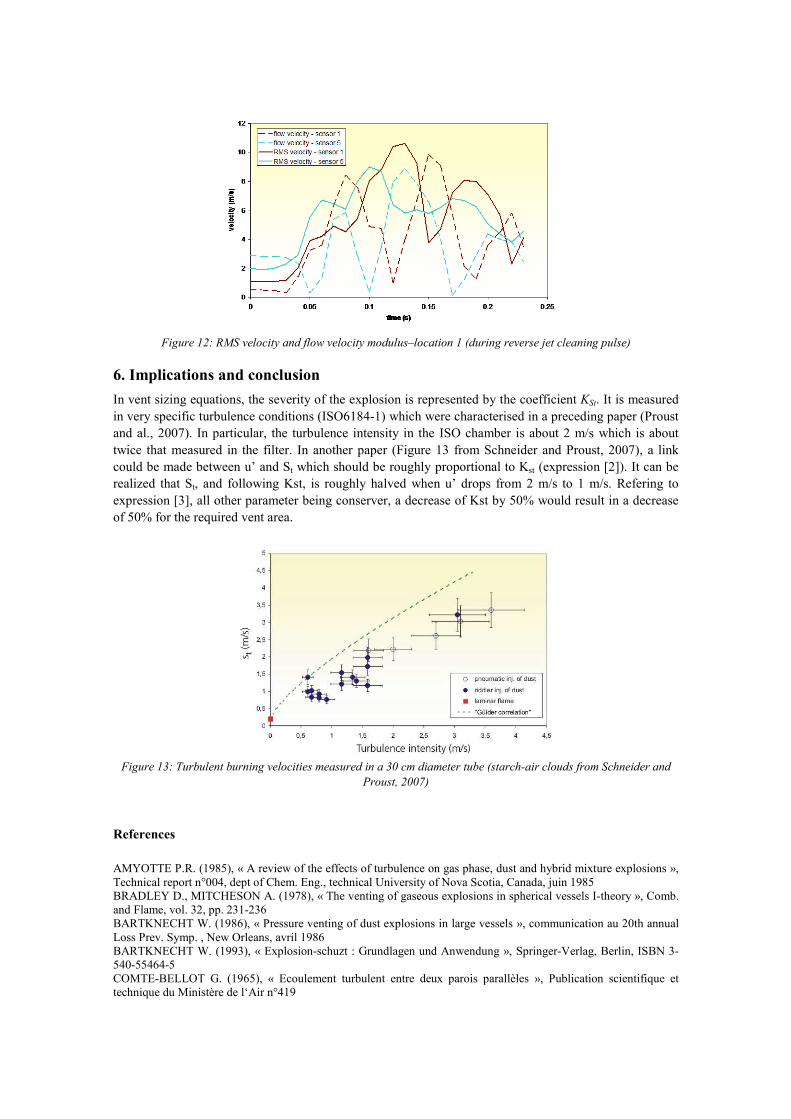
Figure 12: RMS velocity and flow velocity modulus–location 1 (during reverse jet cleaning pulse)
6. Implications and conclusion
In vent sizing equations, the severity of the explosion is represented by the coefficient KSt. It is measured
in very specific turbulence conditions (ISO6184-1) which were characterised in a preceding paper (Proust
and al., 2007). In particular, the turbulence intensity in the ISO chamber is about 2 m/s which is about
twice that measured in the filter. In another paper (Figure 13 from Schneider and Proust, 2007), a link
could be made between u’ and St which should be roughly proportional to Kst (expression [2]). It can be
realized that St, and following Kst, is roughly halved when u’ drops from 2 m/s to 1 m/s. Refering to
expression [3], all other parameter being conserver, a decrease of Kst by 50% would result in a decrease
of 50% for the required vent area.
Figure 13: Turbulent burning velocities measured in a 30 cm diameter tube (starch-air clouds from Schneider and
Proust, 2007)
References
AMYOTTE P.R. (1985), « A review of the effects of turbulence on gas phase, dust and hybrid mixture explosions »,
Technical report n°004, dept of Chem. Eng., technical University of Nova Scotia, Canada, juin 1985
BRADLEY D., MITCHESON A. (1978), « The venting of gaseous explosions in spherical vessels I-theory », Comb.
and Flame, vol. 32, pp. 231-236
BARTKNECHT W. (1986), « Pressure venting of dust explosions in large vessels », communication au 20th annual
Loss Prev. Symp. , New Orleans, avril 1986
BARTKNECHT W. (1993), « Explosion-schuzt : Grundlagen und Anwendung », Springer-Verlag, Berlin, ISBN 3-
540-55464-5
COMTE-BELLOT G. (1965), « Ecoulement turbulent entre deux parois parallèles », Publication scientifique et
technique du Ministère de l‘Air n°419

DONAT K (1971), « Auswal und Bemessung von Druckentlastungseinrichtungen f¨r Staubexplosionen », Staub
Reinh. Luft, vol. 31, pp.154-160
ECKHOFF R.K. (1991), " Dust explosions in the process industries ", Butterworth-Heinemann, Oxford
ECKHOFF R.K., ALFERT F., FUHRE K., MILLS J.D., PERDERSEN G.H. (1986), « Maize starch explosions in a
236 m3 experimental silo with vents in the wall », rapport CMI ref CMI n° 863307-1, December 1986
ECKHOFF R.K., ALFERT F., FUHRE K., PERDERSEN G.H. (1988), « Maize starch explosions in a 236 m3
experimental silo with vents in the wall », J. Loss. Prev. IND . vol 1
ECKHOFF R.K., FUHRE K. (1984), « Dust explosion experiments in a 500 m3 silo cell », J. of Occupational
Accidents, vol. 6
ELLIS O.C.C., WHEELER R.V. (1925), « The movement of flame in closed vessels », J. Chem. Soc., Trans, 127,
764 – 767
ISO 6184-1 (1985), “Explosion Protection Systems - Part 1: Determination of Explosion Indices of Combustible
Dusts in Air”
HAUERT F., VOGL A., RADANDT S. (1994), « Measurement of turbulence and dust concentration in silos and
vessels », 6th Int. Coll. on Dust Explosions, Shenyang, China, August 1994
HINZE J.O. (1975), « Turbulence », 2nd edition, Mc Graw-Hill company, New-York, ISBN 0-07-029037-7
LUNN G.A. , CROWHURST D., HEY M. (1988), « The Effect of Vent Ducts on the reduced Explosion Pressures of
vented Dust Explosions », J. Loss Prev. Process Ind., vol. 1
MASSON F. (1998), « Explosion d’un silo de céréales », Rapport de synthèse, INERIS EMA-FMs-98-21FP30-
07/07/98
MITSUHIKO HATA et al. - Kanazawa University, Analysis of Pulse-jet Cleaning of Dust, 2002 Conference Proceedings 5th International Symposium on Gas Cleaning at High Temperature September 17-20, 2002
PINEAU J.P. (1985), »Gas and Dust Explosions in closed and vented Vessels », « A two-day practical approach to
gas and dust explosion venting », EUROPEX seminar, Frankfurt, June 1985
PROUST Ch. (2006), “ A few fundamental aspects about ignition and flame propagation in dust clouds “, J. Loss
Prev. Process Ind., vol. 19, pp. 104-120
PROUST Ch., ACCORSI A., DUPONT L. (2007), « Measuring the violence of dust explosions with the 20 liter
sphere and the standard ISO 1 m3-systematic comparison and interpretation of the discrepancies » , J. Loss
Prevention, Process. Ind., vol. 20, pp. 599-606
PROUST Ch., DAUBECH J., LEPRETTE E. (2009), « Differentiated routes for the simulation of dust explosions » ,
J. Loss Prevention, Process. Ind., vol. 22, pp. 288-294
RADANDT S, 1983 : Staubexplosionen in Silos. Symposium Heft 12 (pp. 18–51), Berufsgenossenschaft
Nahrungsmittel und Gaststätten
RUNES, E. (1972), Loss Prev. vol. 6a, , pp. 63–67 (1972)
RUST E. (1979), “Explosion venting of low pressure equipment. A theoretical solution to explosion relief”, Chemical
Engineering, p.102
SCHNEIDER H., PROUST Ch. (2007), « Determination of turbulent burning velocities of dust air mixtures with the
open tube method », J. Loss Prevention, Process. Ind., vol. 20, pp. 470-476.
TAMANINI F., VALUILIS J.V. (1996), "Improved guidelines for the sizing of vents in dust explosions", J. Loss
Prevention, Process. Ind., vol. 9, pp. 105-118.
TAMANINI F. (1998), "The role of turbulence in dust explosions", J. Loss Prevention, Process. Ind., vol. 11, pp. 1-
10.
TONKIN P.S., BERLEMONT C.F.J. (1972), « Dust explosions in a large scale cyclone plant », Internal report of the
Joint Fire Research Organization, n° 942, July 1972
ZALOSH R. (2006) : New Dust Explosion Venting Design Requirements for turbulent operating Conditions, 6th
ISHPMIE, Halifax, Canada, 2006.
NFPA 68 : Guide for Venting of Deflagration, ed. 2002
EN 14491 : Dust explosion venting protection system
VDI 3673 : Druckentlastung von Staubexplosionen – Pressure venting of Dust explosions, ed. 2002.
FSA ((Forschungsgesellschaft für angewandte Systemsicherheit und Arbeitsmedizin), Work Package 6: Validation
of the Dust Explosion Simulation Code - Final Report of Measurements of Flow Field and Dust Concentration, July
2006
Résumé Les méthodes classiquement utilisées pour le dimensionnement d’évents reposent sur des lois
expérimentales obtenues dans des conditions d’essais académiques, parfois fort éloignées des conditions
industrielles réelles. C’est ainsi qu’elles ne prennent pas directement en compte la turbulence dans les
enceintes industrielles, qui affecte pourtant fortement le développement de l’explosion. L’installation
DELFINE actuellement en construction permettra d’étudier le développement d’une explosion de
poussières dans les conditions réelles de fonctionnement d’un dépoussiéreur. Des expériences
préliminaires dans un filtre instrumenté de petite taille sont présentées, qui permettent de caractériser le
développement de la turbulence dans les différentes phases de fonctionnement du système. Il ressort que

le niveau de turbulence est globalement plus faible que dans les conditions « standard » d’essais des
évents d’explosion, même pendant les phases de décolmatage. Cela laisse entrevoir des possibilités
d’optimisation des surfaces d’évents dans les dépoussiéreurs. On tentera de confirmer ces conclusions à
l’aide d’essais d’explosion en conditions réelles sur l’installation DELFINE.
Mots-clés: Explosion, systèmes de protection, évent, poussière, turbulence


![14475785 Fire and Explosion Hazards Handbook of Industrial Chemicals[1]](https://img.dokumen.tips/doc/110x75/547f3a16b4af9fd14e8b4569/14475785-fire-and-explosion-hazards-handbook-of-industrial-chemicals1.jpg)