Embed Size (px)
Citation preview

Rochester Institute of Technology Rochester Institute of Technology
RIT Scholar Works RIT Scholar Works
Theses
Spring 2019
Improving Energy Efficiency Performance of Existing Residential Improving Energy Efficiency Performance of Existing Residential
Building in Northern China Building in Northern China
Zhengyu Kang [email protected]
Follow this and additional works at: https://scholarworks.rit.edu/theses
Recommended Citation Recommended Citation Kang, Zhengyu, "Improving Energy Efficiency Performance of Existing Residential Building in Northern China" (2019). Thesis. Rochester Institute of Technology. Accessed from
This Thesis is brought to you for free and open access by RIT Scholar Works. It has been accepted for inclusion in Theses by an authorized administrator of RIT Scholar Works. For more information, please contact [email protected].

R·I·T Improving Energy Efficiency Performance of Existing Residential Building in
Northern China
by
Zhengyu Kang
A Thesis for the degree of Master of Architecture
Department of Architecture
Golisano Institute for Sustainability
Rochester Institute of Technology
Rochester, NY
Spring 2019

I
Committee Approval
Julius, J. Chiavaroli, AIA, NCARB, LEED-AP Date
Professor, Department of Architecture
Thesis Advisor
Dennis A. Andrejko, FAIA Date
Head, Department of Architecture
Nana-Yaw Andoh Date
Assistant Professor, Department of Architecture

II
Acknowledgments
This thesis is the culmination of four years of studying at Rochester Institute of Technology. I am
thankful for the opportunity to have been part of this program, to learn from amazing faculty, and
to have worked with wonderful peers.
I would like to give my deepest gratitude to my Thesis Committee, Professor Julius Chiavaroli,
Head Dennis Andrejko, and Professor Nana-Yaw Andoh for continuous guidance and support.
This thesis would not have completed without their enormous help.
I am very grateful to my family, who support my education and life in every way. Their love and
support motivate me to keep going and become an architect.

III
Abstract
China has replaced the U.S. as the world’s largest consumer of energy. The Ministry of
Housing and Urban-Rural Development (MOHURD)’s latest data shows that China’s building
sector accounts for around one-third of its final energy consumption (MOHURD, 2016).
Particularly in northern China, the cold climate exerts pressure on its central heating system, which
is responsible for a total energy consumption of about four hundred million tons of standard coal
equivalent (TCE) (National Development and Reform Commission, 2017). Due to the growing
population, economic development, and increasing standards of living, China expects that building
energy use will escalate in the coming years. As a result of rapid urbanization, China’s building
stock nearly tripled from 1995 to 2005, and it is estimated to nearly triple again by 2030 (Global
Buildings Performance Network, 2013). There are a large number of existing buildings that
perform poorly in terms of energy, wasting resources and polluting the environment. In order to
overcome big challenges in energy conservation and the reduction in carbon dioxide emissions,
promoting the energy efficiency of existing buildings should be of great use.
This thesis aims to provide solutions for improving the energy efficiency of existing residential
buildings in northern China. Using data from a typical residential building in Beijing, the biggest

IV
city in northern China, an energy model is built and analyzed. Models with different energy-saving
strategies are then presented to investigate practical and potential solutions with regards to energy
efficiency and cost.
V
Table of Contents
Committee Approval __________________________________________________________ I
Acknowledgments ____________________________________________________________ II
Abstract ___________________________________________________________________ III
1.0 Introduction ____________________________________________________________ - 1 -
1.1 Background __________________________________________________________ - 1 -
1.2 Problem Statement ____________________________________________________ - 7 -
2. Literature Review _______________________________________________________ - 14 -
2.1 Concepts of Energy-Saving Buildings ____________________________________ - 14 -
2.1.1Passive House _____________________________________________________ - 14 -
2.1.2 Net-Zero Energy Building (NZEB) ____________________________________ - 16 -
2.1.3 Plus Energy House _________________________________________________ - 19 -
2.2 Energy Policies ______________________________________________________ - 22 -
2.2.1 U.S. ____________________________________________________________ - 22 -
2.2.2 China ___________________________________________________________ - 23 -
2.3 Case Studies _________________________________________________________ - 26 -
2.3.1 Beach Green Dunes, NY, U.S. ________________________________________ - 26 -
2.3.2 Second + Delaware, MO, U.S. ________________________________________ - 27 -
2.3.3 Four Case Studies of Energy Savings Achieved by Retrofitting Multi-Unit Residential
Buildings in Toronto, Canada _____________________________________________ - 28 -
2.3.4 Building C15, Qinhuangdao, China ____________________________________ - 31 -
2.3.5 Nanjing Tiptop Residential, Nanjing, China _____________________________ - 34 -
2.3.6 Tangshan Pilot Project, Hebei, China __________________________________ - 36 -
2.3.7 Case Study Summary _______________________________________________ - 37 -
2.4 Green Building Three-Star Rating System in China ________________________ - 40 -
3.0 Methodology __________________________________________________________ - 43 -
4.0 Analysis and Results ____________________________________________________ - 46 -
4.1 Climate _____________________________________________________________ - 46 -

VI
4.1.1 Temperature Range ________________________________________________ - 46 -
4.1.2 Comfort Zone _____________________________________________________ - 49 -
4.2 Reference Model _____________________________________________________ - 52 -
4.2.1 Basic Information__________________________________________________ - 52 -
4.2.2 Building Envelope _________________________________________________ - 53 -
4.2.3 Heating System ___________________________________________________ - 54 -
4.2.4 Cooling System ___________________________________________________ - 58 -
4.2.5 Hot Water Heating System __________________________________________ - 59 -
4.2.6 Lighting System ___________________________________________________ - 60 -
4.2.7 Plug Loads _______________________________________________________ - 61 -
4.2.8 Reference Model Energy Usage ______________________________________ - 63 -
4.3 Analysis of Passive Strategies __________________________________________ - 65 -
4.3.1 Building’s Thermal Envelope ________________________________________ - 65 -
4.3.1.1 Wall Assembly __________________________________________________ - 67 -
4.3.1.2 Roof Assembly __________________________________________________ - 71 -
4.3.1.3 Windows _______________________________________________________ - 74 -
4.3.2 Sun shading ______________________________________________________ - 76 -
4.4 Analysis of Active Strategies ___________________________________________ - 80 -
4.4.1 HVAC __________________________________________________________ - 80 -
4.4.2 Photovoltaic System________________________________________________ - 83 -
5.0 Summary & Conclusion _________________________________________________ - 88 -
5.1 Summary ___________________________________________________________ - 88 -
5.2 The Ultimate Energy-Efficient Residential Building Model __________________ - 90 -
5.3 Application of Results _________________________________________________ - 92 -
5.4 Area for Further Research _____________________________________________ - 94 -
List of Figures ____________________________________________________________ - 96 -
List of Tables _____________________________________________________________ - 98 -
References _______________________________________________________________ - 99 -

- 1 -
1.0 Introduction
1.1 Background
Climate change and the energy crisis are the largest problems that the world needs to address.
According to “LiveScience,” 2018 was the hottest year on record. Global land and ocean-surface
temperatures were 1.42 degrees Fahrenheit above the average for the 20th century. Further, nine of
the ten warmest winters have occurred since 2005, and five of the warmest years on the record
occurred in the period 2014 to 2018 (Laura Geggel, 2019). One of the biggest contributors to global
warming is the excessive consumption of oil, coal, and other fossil fuels. As massive amounts of
energy are consumed, the energy crisis is growing steadily worse. Further, shortages in energy will
lead to increases in energy prices, affecting the development of the world’s economies and perhaps
even causing energy wars. Hence, reducing energy consumption is a vital solution and requires the
world to work together.
Based on the data in Figure 1, in 2016, primary energy consumption in the U.S. was 97.52
quadrillion British Thermal Unit (Btu). The U.S. is a highly developed and industrialized society.
Americans use 38% of their energy in buildings, 32% for industrial uses, and 29% on

- 2 -
transportation. Of the 38% spent on buildings, 20% of total energy is put to residential use and 18%
is put to commercial use (U.S. Energy Information Administration, 2018).
Figure 1 Total Energy Consumption (quadrillions of Btu) (KNOEMA, 2017)
China is a developing country. It has the world's second-largest economy. Its GDP has grown
close to 10% annually for the past 30 years (World Bank, 2018). Although the growth rate has
slowed in recent years, sustained economic development will not cease. With the fast growth in
the economy, energy consumption is also increasing.

- 3 -
In 2016, the total energy consumption in China was 136.24 quadrillion Btu, more than three
times as much as in 2000. China has become the largest energy consumer in the world, with 28%
of its energy being consumed by buildings (Building Energy Research Center of Tsinghua
University, 2016). To put it more clearly, 28% of 137.26 quadrillion Btu equals 38.1 quadrillion
Btu. Meanwhile, the U.S.’s 38% energy use in buildings amounts to 37.9 quadrillion Btu. Hence,
China has become the world’s largest building energy consumer as well as the biggest residential
energy consumer since 90% of its building energy consumption is directed towards residential
buildings. In addition, residential energy demand has an annual growth rate of 1.1% (Evans, et al.,
2009). In addition, 22.5% of China’s total building energy use goes to northern China’s central
heating system (Building Energy Research Center of Tsinghua University, 2016).
31.0343.22
74.91
109.97120.87
129.27 135 136.7 137.19 136.24
0
50
100
150
1990 2000 2005 2010 2011 2012 2013 2014 2015 2016
CHINA ANNUAL ENERGY CONSUMPTION
TOTAL ENERGY CONSUMPTION (quadrillion BTU)
Figure 2 China’s annual energy consumption

- 4 -
Sixty years ago, China established its central heating system in the northern region with
assistance from the Soviet Union. The central heating system is the network that distributes heat
generated in a centralized location through insulated pipes for residential and commercial heating
requirements. Since the supplies of coal and other resources are limited, it was suggested that heat
be only for those areas where the average daily temperature falls below 41 degrees Fahrenheit (°F)
for more than 90 days a year (National Standard of the People's Republic of China, 2012). Based
on this suggestion, Premier Zhou Enlai proposed a heating dividing line to select regions that
Figure 3 China Central Heating Map (Source: Infzm.com)

- 5 -
would benefit from central heating. The Qinling Huaihe line, also known as the Qin-Huai line, was
named after the Qinling Mountains and Huai River and corresponds roughly to the 33rd parallel
(Makinen, 2014). Most of the regions that are north of the Qin-Huai line are located in either the
Severe Cold climatic zone or the Cold climatic zone, both of which have average daily
temperatures lower than 41°F for more than 90 days a year. In contrast, areas that are to the south
of the Qin-Huai line are located in the Hot Summer and Warm Winter climatic zone and failed to
meet the requirement for central heating, leaving these regions to deal with the cold on their own
(Li & Yao, 2009).
Figure 4 indicates that, from 2010 to 2017, the total heated floor area in northern China
increased continuously. By 2017, the heated floor area totaled 77.43 hundred million m2 (833.45

- 6 -
hundred million ft2).
Eighty-three percent of the total floor area is heated by coal-fired boilers, with the rest of the heat
coming from gas, electricity, solar power, and other sources. Hence, the annual consumption of
coal for central heating amounts to four hundred million TCE (MOHURD, 2016).
43.5747.38
51.8457.17
61.1267.22
73.8777.43
0
10
20
30
40
50
60
70
80
90
2010 2011 2012 2013 2014 2015 2016 2017
HU
ND
RED
MIL
LIO
N M
2
YEAR
CHINA'S CENTRAL HEATING FLOOR AREA
Figure 4 China’s Central Heating Floor Area

- 7 -
1.2 Problem Statement
China, as a developing country, is constantly seeking opportunities for rapid development. In
order to keep pace with this rapid economic development, energy consumption has been increasing
as well, bringing about many severe environmental problems, such as air pollution, and climate
change. In particular, the issue of harmful smog should be addressed. As seen in Figure 5 and
Figure 6, smog has negative effect on China’s environment and the Chinese people. According to
the Environmental Protection Agency (EPA), smog is formed by air pollution and not only causes
health problems, such as asthma and lung infections, but also the deaths of plants and innumerable
Figure 5 Smog in Beijing (Source: https://www.popsci.com/why-is-smog-in-china-so-bad)

- 8 -
animal species (EPA, 2017). What is worse, it has a negative impact on people’s lifestyles and
living habits.
Urban extension in recent years has boosted China’s economy. Every year, large numbers of
people pour into big cities such as Beijing and Shanghai. As shown in Figure 7, in the case of
Beijing, both permanent and temporary residents increased from 1990 to 2005.
Figure 6 Smog in Beijing II (Source: https://www.businessinsider.com/china-smog-pollution-coal-burning-toxic-
red-alert-2015-12)

- 9 -
As this urbanization has evolved rapidly, the building stock has increased as well. Figure 8
presents the continuous growth in building stock between 2001 and 2014. In addition, according
10.8612.51
13.63
15.38
19.61
21.7
0.531.8
2.53.57
7.048.22
0
5
10
15
20
25
1990 1995 2000 2005 2010 2015
Population of Beijing (in Millions)
Permanent Resident Temporary Resident
Figure 7 Beijing's Population
Figure 8 China's Existing Building Stock (2001-2014) (Building Energy Research Center of Tsinghua University, 2016)

- 10 -
to data from the National Bureau of Statistics of China, in 2015, new construction totaled 12.4
billion m2 (133.5 billion ft2) (National Bureau of Statistics of China, 2015). In terms of energy
consumption, Xu, Anadon, and Lee (2016) emphasized that urban residential energy use has
increased rapidly during the ongoing urbanization process that has been relocating millions of
people from rural areas to cities every year, and it will continue to grow (Xu, Anadon, & Lee,
2016). In order to pursue a low-carbon economy, China has been developing building energy
efficiency policies and actively promoting domestic building energy-labeling programs. However,
out of this huge building stock, a large number of buildings do not meet building energy efficiency
requirements because they were built earlier than the establishment of the updated policies. In
other cases, existing buildings have poor energy efficiency performances due to limited
construction budgets, developers lacking the willingness to invest in energy savings, and
contractors lacking in strategies and skills.
As mentioned previously, central heating is provided in northern China in the winter time.
Heat is generated mostly by hard coal boilers in different heating plants. As the heat is distributed
from these centralized locations through insulated pipes to residential buildings, there is an

- 11 -
enormous loss in heat and energy waste due to radiation and hydraulic imbalances, accounting for
nearly 30% of the total heat supply (Yan, Zhe, Yong, & Neng, 2011). Moreover, the China
Academy of Building Research (CABR) has estimated that buildings with low energy efficiency
in northern China use two to three times more energy per square meter for heating than buildings
in comparable temperature zones in Europe or the U.S.
Increasing existing high-rise residential building stock results in an enlarged total heating floor
area. Furthermore, enlarging the total heating floor area increases coal consumption, worsening
pollution. It is crucial that China begin reducing coal consumption and its carbon dioxide emissions,
improving air quality, and increasing energy savings. Therefore, using a long-term perspective,
this research will be carried out under the difficult assumption that no heat being imported from a
central heating system in the winter. This has the potential of saving 22.5% of China’s total
building energy use.
In addition, since realizing that a growing number of existing residential buildings cannot meet
energy efficiency requirements, China’s government has begun to allocate more funding and
resources to improving energy efficiency. However, it has not been going as well as expected. The
- 12 -
money to be used for an existing residential building is supposed to be collected from the
government and owners (the State Council of the People's Republic of China, 2008). First, due to
huge existing residential building stock, the funding distributed by the government to each unit is
limited. Therefore, unlike in pilot or demonstrative retrofit projects, for each ordinary unit, the
choices of materials are restricted by a limited budget. Second, in China, a typical residential
building includes many units owned by different residents. Without an explicit explanation and
detailed approach, it is not an easy job to request that residents be responsible for their portion. It
is impossible to proceed with any improvements without every resident agreeing to the plan.
Further, developers tend to invest in new construction rather than existing residential buildings
because existing buildings do not bring in a good profit and they don’t receive attractive benefits
from the government. However, since China is determined to reduce the energy consumption of
existing residential buildings, it is essential to research cost-efficient solutions. Thus, this paper
will compare the results of the analyses not only in terms of energy efficiency but also in terms of
cost efficiency.
In the following chapters, energy modeling will be used to analyze the energy use in a typical

- 13 -
existing residential building in Beijing, northern China, in order to provide an existing reference
building model. Both passive and active methods will then be considered in order to find energy
solutions from the perspectives of saving energy, human comfort, and cost savings. Then the
solution found in this paper can be applied as a guide to improve the energy efficiency of existing
residential buildings in northern China.

- 14 -
2. Literature Review
2.1 Levels of Energy-Saving Buildings
2.1.1Passive House
Passive House is a rigorous and voluntary standard that was originally launched in 1988 by
Wolfgang Feist and Bo Adamson. It established performance requirements that involve the
technical and thermophysical characteristics of the building in order to achieve an overall energy
performance that ensures near-zero energy consumption and high levels of indoor comfort. The
first Passive House was built in 1991 in Darmstadt-Kranichstein (The Passive House Resource,
2018). The Passive House standard can be applied to any type of building. Specifically, it has the
following requirements as Table 1 shows.
Variable Limit
Space heating energy demand ≤15 kWh/m2/year (4.7 kBtu/ft2/year)
Space cooling energy demand ≤15 kWh/m2/year (4.7 kBtu/ft2/year)
Primary energy demand
(heating, cooling, ventilation, domestic
hot water, lighting, auxiliary electric
consumption, and domestic
appliances)
≤120 kWh/m2/year (38 kBtu/ft2/year)
Airtightness n 50 ≤ 0.6/h
Table 1 Passive House Standards (Passive House Institute, 2015)

- 15 -
As shown in Figure 9, the five Passive House basic building-science principles are:
1. Employing continuous super insulation throughout the structure’s entire envelope
without any thermal bridging.
2. Ensuring that the building envelope is extremely airtight to maintain low infiltration and
exfiltration.
3. Employing high-performance windows such as triple-pane, double-low-e-glazed
windows.
4. Using a ventilation system with heat recovery and heat exchange.
5. Gaining solar power through installations such as thermal collectors.

- 16 -
2.1.2 Net-Zero Energy Building (NZEB)
A net-zero energy building (NZEB) can be defined in many ways. Four commonly used
definitions are net zero site energy, net-zero source energy, net-zero energy costs, and net-zero
energy emissions. In the U.S., the definition that is generally referred to is net-zero site energy,
which means that the building produces at least as much on-site renewable energy as it uses
annually (Torcellini, Pless, Deru, & Crawley, 2006). Theoretically, the annul total energy used by
Figure 9 Passive House Diagram (Source: Passive House Institute)

- 17 -
the heating system, hot water system, lighting, and all of the fixtures can be 100% covered by
renewable energy generated on site. No extra energy is then needed from the utility grade.
Torcellini et al. (2006) pointed out that this kind of building design is easy to implement, and its
net-zero status is verifiable through on-site measurements. Such a building emphasizes energy
efficiency and environmental protection (Torcellini, Pless, Deru, & Crawley, 2006). An NZEB is
becoming the standard and goal for an increasing number of new buildings. In addition, Rabani
revealed that NZEB standards can be applied when upgrading existing buildings (Rabani, Madessa,
& Nord, 2017).
As shown in Figure 10, the features of an NZEB are:
1. Renewable energy source: depending on the site, location, and the cost, use of, for
instance, solar panels to generate energy in order to meet the building’s energy demands.
2. Effective building envelops: employ high-performance insulation in the walls and install
high-performance windows and doors to lower the heat loss.
3. Efficient water heating and heating and cooling system: use an efficient heat pump and
a heat pump water heater to reduce energy consumption.
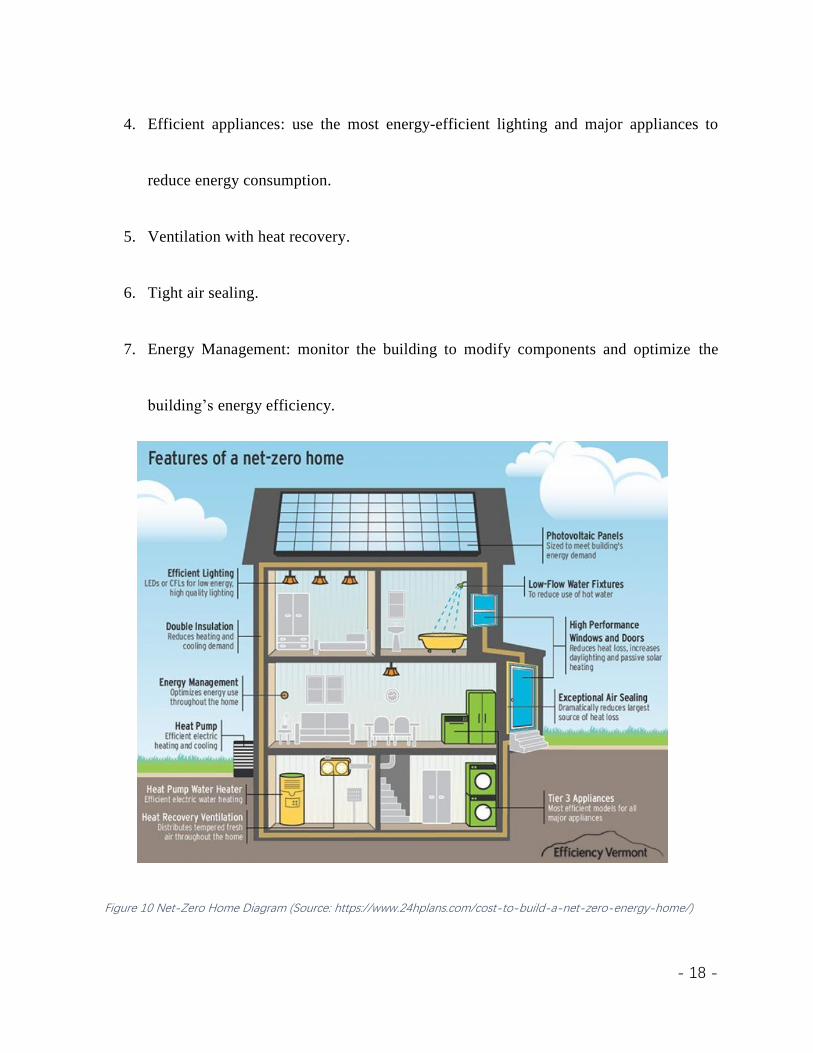
- 18 -
4. Efficient appliances: use the most energy-efficient lighting and major appliances to
reduce energy consumption.
5. Ventilation with heat recovery.
6. Tight air sealing.
7. Energy Management: monitor the building to modify components and optimize the
building’s energy efficiency.
Figure 10 Net-Zero Home Diagram (Source: https://www.24hplans.com/cost-to-build-a-net-zero-energy-home/)

- 19 -
2.1.3 Plus Energy House
The German Ministry for Transport, Building and Urban Development (BMVBS) provided
the first definition for a Plus Energy House in 2011. The Plus Energy House standard is considered
to have been achieved when a building has both a negative annual primary energy demand (∑Qp
< 0 kWh/m2/year) and a negative annual final energy demand (∑Qe < 0 kWh/m2/year) (Hendricks,
2014). That is, the building generates more energy than it needs. It is notable that the balance
boundary is the site’s boundary. Furthermore, as a future-oriented standard, it also considers
energy consumed for purposes other than just the basic operation of the building, i.e., air-
conditioning and electricity needed for domestic appliances and processes are included. For
example, in order to produce the negative energy demands cited above, a Photovoltaic (PV) system
could be used to generate electricity from solar power for the building. The Plus Energy House
contributes greatly to saving resources and protecting the climate by reducing carbon dioxide
emissions.

- 20 -
As shown in Figure 11, in an energy plus house, techniques that adopted are:
1. Importing energy production from renewable sources.
2. Capturing heat from solar and producing renewable heat.
3. Employing a very good building envelope to maintain low-transmission heat losses.
4. Using heat recovery ventilation to reduce heat losses.
To sum up, these three levels of energy-efficient buildings, i.e., the Passive House, NetZero
Energy Building, and Plus Energy House show increased standards for generating renewable
Figure 11 Energy Plus House Diagram (Hendricks, 2014)

- 21 -
energy to fulfill a building’s energy demand. They respond actively and positively to the current
issues of climate change, global warming, resource conservation, and environmental protection.
Their concepts have a great impact on the development of architectural design and construction.
What is more, they have become globally trending standards for both new buildings and existing
buildings. Though these three standards have different requirements for a building’s energy
demand, they utilize similar strategies, such as employing high-performance insulation, high-
performance windows, energy-efficient heating and cooling systems, and PV systems. These
levels provide a solid foundation and give explicit guidance for this research in terms of suitably
effective strategies with which to improve the energy efficiency performance of existing
residential buildings.
Table 2 Summary of Three Levels
- 22 -
2.2 Energy Policies
2.2.1 U.S.
Dixon et al. analyzed the U.S. energy conservation and efficiency policies which emerged
from the Energy Policy and Conservation Act (EPCA) of 1975, the Energy Policy Act of 2005
(EPAct05), and the Energy Independence and Security Act (EISA) of 2007, revealing that the U.S.
has been writing energy efficiency codes and standards for regulating buildings, appliances, and
products energy efficiency into U.S. laws. In terms of building-related energy conservation and
efficiency policies, Dixon et al. (2010) confirm that energy-efficiency standards have been
expanded and strengthened. In particular, in terms of energy savings in residential buildings, the
key provisions of EISA and EPAct05 are that energy savings activities be conducted for residential
buildings, including the reauthorization of funding for weatherization and energy code
improvements for manufactured housing. In addition, net-zero energy buildings are recommended
for new construction. Further, Dixon et al. express the expectation of further progress. There is
room for such progress due to the fact that when it comes to interest and decision-making processes,
the disconnects between building designers, builders, and homeowners are real (Dixon, McGowan,
Onysko, & Scheer, 2010). What is more, research has been conducted on an executive order issued

- 23 -
by the Obama administration in 2011, which specified that one of the Obama administration’s
goals was to reduce energy use in residential homes by 30-50% relative to current energy-use
levels in existing buildings. The research showed that even though no target dates were specified
for these goals, the U.S. government projected confidence by improving coordination between
local, utility, state, and federal facilities and devoting significant resources to reducing residential
buildings’ energy consumption (Amecke, et al., 2013).
2.2.2 China
In 1986, China released its first energy efficiency code, JGJ26-1986, 11 years after the U.S.
started its process. In 1995, the code was updated to JGJ26-95, then, in 2010, it was updated again
to JGJ26-2010. The latest revision was designated the “Design Standard for Energy Efficiency of
Residential Buildings in Severe Cold and Cold Zones” and ultimately required an additional 30%
in energy savings. In addition, according to the “Regulations on Energy Savings for Civil
Buildings,” originating in 2008 in the case of improving energy savings in existing residential
buildings, retrofitting should prioritize low-cost strategies, i.e., improvement of building envelops
should proceed changing the heat supply system, and, as stated earlier, the costs of the retrofit
should be shared between the owners of the existing residential buildings and the government (the

- 24 -
State Council of the People's Republic of China, 2008). Furthermore, China developed its system
of building energy efficiency labeling and evaluation in 2006. The government recommends that
buildings be evaluated and rated by China’s Green Building Three-Star Rating System. Xu,
Anadon, and Lee (2016) conducted a systematic, quantitative evaluation of the energy savings
resulting from China’s policies. Though no policies were found to exhibit superior performance
according to their six criteria, collectively all of the policies can have an impact on China’s future
energy outlook. China not only promotes the robust enforcement of these codes during the process
of new construction but has also realized the importance of retrofitting the huge stock of existing
buildings to comply with current energy codes.
To sum up, compared with the U.S.’s policies, China’s energy policies were established later
and are not as advanced. Though China is pursuing greener buildings, it has yet to specify high
standards, such as net-zero energy buildings, in its policies as the U.S. has done. In addition,
according to Xu, Anadon, and Lee (2016), the energy savings produced by China’s policies do not
fit their criteria for superior performance. However, China’s policies do have the ambition to
improve energy savings and highlight the importance of new buildings and retrofitting existing

- 25 -
residential buildings to meet, the latest energy codes. Studying China’s energy codes provides
official guidance from the Chinese government as to the lowest standards that need to be reached.
Also, they provide sources for looking up more detailed information. In addition to providing a
guide to the U.S.’s energy policies, the U.S.’s advanced codes provide a glimpse of what proactive
and potential approaches China, as a developing country, may take. Hence, this research will be
conducted using a long-term perspective.

- 26 -
2.3 Case Studies
2.3.1 Beach Green Dunes, NY, U.S.
The Beach Green Dunes project is designed to Passive House standards and located in Far
Rockaway, Queens. It finished its first phase, a seven-story, 101-unit building, in the fall of 2017.
Phase II, an eight-story, 127-unit building, had its construction documents completed recently.
This project incorporates insulated concrete forms, energy-recovery ventilation throughout, and
variable-refrigerant-flow central air source heat pumps to not only provide heating and cooling but
also to maintain a large roof-top solar PV system for renewable on-site electricity production. In
addition, Phase I has a natural-gas-fired cogeneration system that produces electricity, meeting all
of the building’s hot water needs and serving as a back-up emergency generator. These features
enabled this project to achieve low energy and water consumption levels (Multifamily Resource
Center, 2016).

- 27 -
2.3.2 Second + Delaware, MO, U.S.
The Arnold Development Group focused on Passive Science to ensure that this $60 million
project would meet the PHIUS+ 2015 Passive Building Criteria, thus making it the largest Passive
House certified building in the world. Located in Kansas City, MO, it has two residential towers
with seven stories of conditioned space over a two-level garage and a gross area of 550,000 ft2.
This concrete structure is designed to last more than 200 years and has urban farming on the roof.
It should have a 19% total lower lifecycle cost than stick-built multi-family buildings. Its design
contains eight ambient thermal bridges, and its glazing has a minimum of 50% visible
transmittance. Notably, the garage columns cause the most severe thermal bridge, i.e., U-0.609
Figure 12 Beach Green Dunes, NY, U.S. (Source: https://multifamily.phius.org/case-study/beach-green-north-ny)

- 28 -
Btu/hr °F ft2. with around 11% of total transmission losses or a 107,893 kBtu/yr loss (Multifamily
Resource Center, 2016).
2.3.3 Four Case Studies of Energy Savings Achieved by Retrofitting Multi-Unit Residential
Buildings in Toronto, Canada
Touchie, Pressnail, and Tzekova (2012) studied four sucessful retrofits of exisiting multi-unit
residential buildings located in Toronto, Canada. Each case study described the motivation for the
retrofit, retrofit strategies, work completed, energy use before and after the retrofit, and included
a financial analysis. Their paper comes to the conclusion that financing, indoor environmental
quality, and the current state of the building components must be considered in order to determine
the most effective strategies for reducing energy use while improving occupant comfort. In
Figure 13 Second + Delaware, MO, U.S. (Source: https://multifamily.phius.org/case-study/second-and-delaware)

- 29 -
addition, compared with the total building life cycle, heating and cooling systems and envelope
components become obsolete in a relatively shorter time span and should be replaced or upgraded
to ensure efficient resource use. Moreover, they noted that more comprehensive projects can be
made financially viable by blending short and longer payback components in order to maximize
energy savings. The details of each case study that should be highlighted are listed below:
Case Study 1: Building 1 was constructed in the 1930s and had 32 units. The project installed
insulated, glazed window units with a low-e coating, replaced the boiler controls and steam traps,
and installed attic insulation with a thermal resistance of R-44 ft2 °F h /Btu. The result was a 40%
reduction in natural gas consumption.
Case Study 2: Building 2 was constructed in 1970. It was a 10-story, 128-unit apartment
building. It replaced all of the windows with high-performance, argon-filled, double-glazed units
with a low-e coating (U-0.4 Btu/hr °F ft2), and installed R-21 ft2 °F h /Btu polyisocyanurate rigid
insulating board and an evacuated-tube solar collector on the roof. These changes resulted in a 21%
drop in the use of natural gas and a reduction in carbon dioxide emissions of about 176.37 tonnes.

- 30 -
This project maximized the return on investment by reducing the energy demand and supplying
energy through a renewable energy source.
Case Study 3: Building 3 was constructed in 1974, and it had 210 units. It upgraded two
domestic hot water boilers with 88% efficiency (0.77M Btu) that are oversized so that they can
accommodate the air handling unit motors with variable frequency drives replaced later that year.
The retrofit measures resulted in natural gas savings of 28%. This project did a good job in
planning ahead with suitable strategies and making provisions for improvement in the future for
retrofitting an existing residential building.
Case Study 4: Building 4 was constructed in 2001. It was a 12-story residential building. Since
costs had to be kept to a minimum, the project only made minor changes, such as replacing the
lighting in the parking garage and replacing part of the domestic hot water boilers and atmospheric
domestic prime boilers with more energy efficient models. Compared with the other three
buildings, Building 4 had the smallest percentage of savings in natural gas at 18%. Replacing only
part of the boilers was done in such a way that the heating needs could be switched primarily to

- 31 -
the new equipment without having to replace all of the boilers at once (Touchie, Pressnail, &
Tzekova, 2012).
2.3.4 Building C15, Qinhuangdao, China
Since 2009, China has been working with Germany to build model Passive Houses in China.
In 2013, the first Passive House models were built in the “Zai Shui Yi Fang” residential district,
located in Qinhuangdao, China. This residential district covers 1.5 million m2 (16.15 million ft2)
and is divided into six zones from A to F. Building C15, in Zone C, is one of the nine model
Figure 14 Multi-Unit Residential Buildings in Toronto, Canada (Touchie, Pressnail and Tzekova 2012)

- 32 -
buildings that was built in 2013. It has eighteen floors and a total floor area of 6467m2 (69610.21
ft2).
It has integrated many passive strategies to achieve the Passive House certification distributed
by the German Energy Agency (Dena); for instance, it used 250 mm (9.84 inch) of EPS insulation
for the external walls with no thermal bridges, utilized double low-e, high-performance glass, used
an air source heat pump, ensured that the airtightness was n50 <=0.6h, and made full use of all
kinds of solar energy and other renewable energy onsite. According to Dena’s testing results for
Building C15, the primary energy demand for heating and cooling in the testing area in Building
C15 ranged from 38.71 kWh/m2/year (3.60 kWh/ft2/year) to 46.17 kWh/m2/year (4.29
kWh/ft2/year), which is lower than the Passive House standards of 60 kWh/m2/year (5.57
kWh/ft2/year). Total primary energy demand ranged from 89 kWh/m2/year (8.27 kWh/ft2/year) to
104.89 kWh/m2/year (9.74 kWh/ft2/year), which is also lower than the upper limit value of 120
kWh/m2/year (11.15 kWh/ft2/year) for a Passive House. Building C15’s revolutionary significance
boosted China’s confidence in terms of achievable energy efficiency in urban construction,
particularly in terms of having the necessary technical skills, being able to reduce building costs,

- 33 -
and being able to lower carbon dioxide emissions. This project has impacted the Chinese
construction industry greatly. However, the project did reveal China’s lack of knowledge about
the technology needed for Passive Houses in China, especially in the area of assessment and rating
systems (Peng, Zhang, & Ma, 2013).
Figure 15 Building C15, Qinhuangdao, China (Source:
https://wenku.baidu.com/view/8d773e0a77232f60dd
cca17f.html)

- 34 -
2.3.5 Nanjing Tiptop Residential, Nanjing, China
As the first zero-energy residential building in China, the Nanjing Tiptop Residential Project
in Nanjing was awarded a residential technology innovation design prize in 2005. It has a total
floor area of 70,700 m2 (761008.47 ft2). Restricted in terms of building density and height, the
Tiptop Residential project was divided into two zones. The northern zone is dominated by single-
family houses, while the southern zone consists of apartments. In order to achieve the goal of net-
zero site energy, this project balances its water system through rainwater storage and sewage reuse.
In addition, it uses ground-source heat pumps for heating and cooling, as well as domestic hot
water, throughout the four seasons, reducing energy consumption by 30%-50% compared with
conventional systems.

- 35 -
Furthermore, radiant heating and cooling systems use capillary tubes. Through the utilization
of solar energy, such as that obtained through the PV system, the micro energy demand of the
whole project is met (The Climate Group, 2011).
Figure 16 Nanjing Tiptop Residential, Nanjing, China (The Climate Group 2011)

- 36 -
2.3.6 Tangshan Pilot Project, Hebei, China
This pilot project lasted from 2005 to 2010. It represented official cooperation between
Germany and China. After the 1976 earthquake disaster in Tangshan, during the great restoration
period, almost 30% of the urban building that took place in Tangshan (a total building area of
around 18 million m2 [193.75 million ft2]) was done without considering energy savings. The
buildings that were retrofitted were in the Hebei No.1 Quarter, located in the northeast of the Lubei
District in Tangshan City. They were 5- to 6-floor buildings. In this project, the original three
selected demonstration buildings’ conditions were investigated before retrofitting took place. Air
permeability performances, exterior walls, roofs, and so on were checked. According to the data
collected from Hebei No. 1 Quarter, 74% of the energy consumed was for heating only. In order
to improve the energy savings, roofs were completely renovated with 14 cm (5.51 inch)
polyurethane; a 10-cm (3.94 inch) EPS German exterior thermal insulation system was installed;
inward-opening, double-glazed windows with a low-e coating replaced old windows; solar panels
were installed to supply lighting in the public areas; automatic temperature control and heat
metering were put in place; and a vertical double-pipe heating system was installed. As a result of
the retrofits, energy costs dropped from 110 kWh/m2/year (10.22 kWh/ft2/year) to 49 kWh/m2/year

- 37 -
(4.55 kWh/ft2/year). This project resulted in a 22-degree increase, on average, in indoor winter
temperatures. For the first time in 30 years, the quality of living had improved vastly (Building
Energy Efficiency; China Academy of Building Research, 2007).
2.3.7 Case Study Summary
To sum up, two case studies in the U.S. and four case studies in Canada presented several
practical strategies for both new construction and existing residential buildings:
Installation of high-performance wall and roof insulation.
Figure 17 Pilot Project in Tangshan, China (Building Energy Efficiency; China
Academy of Building Research 2007)

- 38 -
Replacement of windows with energy-efficient ones with low-e coatings.
Utilization of air source heat pumps.
Upgrading domestic hot water boilers
Changing lighting bulbs to energy-efficient models.
Production of on-site renewable energy through systems such as solar panels and
evacuated-tube solar collectors.
In contrast to new construction projects in the U.S. with relatively large budgets, the case
studies in Canada were restricted by the owners’ individual budgets. Faced with limited budgets,
however, four case studies in Canada provide many practical strategies for other investors who are
interested in retrofitting existing residential buildings at lower costs. The use of different strategies,
such as investing in the generation of on-site renewable energy and changing only part of an entire
heating system, made it possible to balance costs and improvements in order to meet stated goals.
It is true that low-cost strategies have less effect. However, as long as retrofitting can meet its goal,
investors can always plan ahead to leave space for further improvements in the future.
Two of the three case studies in China were the result of teamwork between China and

- 39 -
Germany. The German teams introduced many advanced energy-saving strategies to China, such
as installing super insulation, high-performance windows, air source heat pumps, and other basic
energy-saving items found in Passive Houses. Further, the Nanjing Tiptop Residential Project took
local variations into account and is a good example of utilizing ground-source heat pumps as well
as producing renewable energy through a PV system to meet its own energy demand. In both new-
construction cases, especially Building C15 in Qinhuangdao, the projects did not reply on the
central heating system at all. However, at the same time, Building C15 met the rigorous
requirements for Passive Houses. Thus, it is possible for new construction in China to avoid the
central heating system while producing greener buildings with less coal consumption. On the other
hand, the case of retrofitting existing residential buildings in Tangshan exposed the enormous
amount of energy being used for heating and the discomfort that the residents endured. This
successful retrofit proved that investing in improving energy efficiency to achieve better living
quality is possible and showed the value of looking for better solutions at reasonable costs. Thus,
it can be attractive to residents in northern China to invest in and achieve energy-saving goals at a
relatively rapid pace. Furthermore, its retrofit back in 2010 still includes central heating system. It

- 40 -
leaves the space for researchers to conduct further study on the retrofit of existing residential
buildings without central heating system and look for energy-saving and environment protection
solutions.
Each case study shines a light on the necessity and trend of building new high energy
efficiency residential building and retrofitting existing residential building to high energy
efficiency. In addition, each case study provides beneficial insights into solutions to improving
residential buildings energy efficiency with various interventions under various conditions.
Especially, case studies about retrofitting existing residential buildings in Canada and China
motivate the researcher to look for a practical solution to improving China’s residential buildings’
energy efficiency with lower cost. Thus, the large stock of existing residential buildings in northern
China will be able to save the most energy use in a shorter time span.
2.4 Green Building Three-Star Rating System in China
A milestone in China’s building energy efficiency policy is the Green Building Three-Star
Rating System(GB/T 50378-2006), which was established in 2006. The Three-Star evaluation
standard evaluates a building’s energy savings in six categories: land efficiency, energy efficiency,
water efficiency, resource efficiency, indoor environment quality, and operations management. It

- 41 -
is a semi-mandatory standard promoted by the government, and it is a market-driven program that
provides certification of green buildings by a third party. Liu et al. (2018) analyzed the Chinese
Green Building Three-Star evaluation standard in terms of occupant satisfaction. Their research
results indicate that Three-Star building users are more satisfied than the users of non-certified
buildings in terms of every parameter investigated (Liu, Wang, Lin, Hong, & Zhu, 2018). In
addition, since the locals have the authority to grant one to two stars to residential buildings, while
only the government can evaluate whether a building has reached the (sometimes poorly defined)
standards necessary for three stars, one- and two-stars buildings are far more common than three-
star buildings. In addition, since the Three-Star Rating System only rates buildings that have
already been in use for at least one year and involves a long waiting period and high costs,
landlords and builders tend to make an effort to earn only one or two stars or even give up on
achieving green building credits. China’s Green Building Three-Star Rating System stresses the
importance of using energy-efficient insulation and heating and cooling systems and for including
overall energy savings. Since the Green Building Three-Star Rating System has become the

- 42 -
mainstream in China, its criteria should be incorporated into the designing and planning for
retrofitting existing residential buildings.
Table 3 Item Requirements for Grade Classifications of Green Buildings (Residential Buildings)

- 43 -
3.0 Methodology
The objective of this research is to turn the typical existing multi-family residential building,
the most common residential type in Beijing into a high performance, energy-efficient building. In
particular, this research will be conducted without considering the central heating system, aiming
to reduce coal consumption and lessen the severe pollution in northern China. This research will
utilize two types of strategies: passive strategies (including thermal insulation, glazing types,
shading systems) and active strategies (including HVAC systems, PV systems).
In regards to the data source, Beijing located in northern China is chosen. Information
collected from Beijing will be used in building the reference model. Beijing is the largest city by
urban population in northern China, the nation’s political, historical, cultural, and educational
center. It has a huge influence on other cities in China. As increasing number of companies and
people flush into Beijing seeking for opportunities, Beijing has experienced problems with the
rapid growth of urbanization, such as new building constructions, carbon dioxide emission,
environmental pollution, energy consumption, and so on. It represents other growing cities in
northern China. Thus, collecting data from Beijing and conducting a study to solve its problems
will provide an influential reference for areas in northern China.

- 44 -
Specifically, four steps will be taken as stated below.
In the first step of the study, Climate Consultant, a climate simulation program will be used to
analyze Beijing’s climate data and generate characteristics of local temperatures. It will also
produce a psychrometric chart indicating the yearly total hours in the comfort zone and how to
increase those hours.
In the second step, a reference model will be set up in Revit, a building information modeling
software. The chosen 18-story existing residential building’s components, such as the information
on its wall, roof, windows, and building service system will be added as basic information for the
reference model. Next, an energy simulation program will be used to generate the reference
building’s energy use within the climate zone of the chosen city. The energy use number generated
will then be used as the baseline for further comparison.
In the third step of the study, using Autodesk Insight 360, an energy simulation program, three
different proposed thicknesses of thermal insulation for the walls and roof, two different types of
windows, different sizes of the sun shading system, two different rates of energy efficiency for the
electric air-source heat pumps, and different sizes of PV systems (in terms of roof coverage) will

- 45 -
be analyzed within the same climate zone that the reference building occupies. Proposed types are
decided among most common ones in the market, in terms of effectiveness and cost. After analysis,
the results will be compared. Based on energy savings, the cost of materials, and possible
construction work, the most cost-efficient components will be obtained.
Lastly, each component recommended in steps 2 and 3 of the study will input into Autodesk
Insight 360, thereby generating the energy usage for the ultimate energy-efficient and cost-efficient
residential building model. Through comparing the results with the baseline model’s energy usage,
the energy savings will be obtained, as demonstrated in Figure 18.
Figure 18 Result Comparison
- 46 -
4.0 Analysis and Results
4.1 Climate
4.1.1 Temperature Range
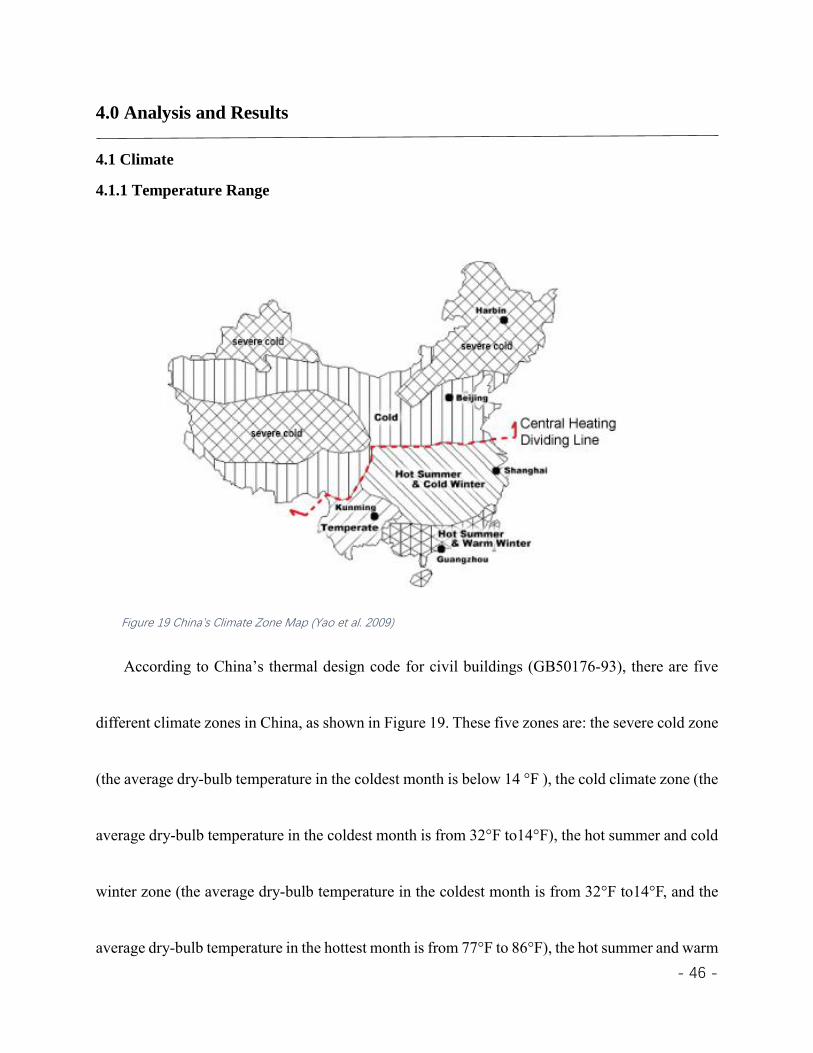
According to China’s thermal design code for civil buildings (GB50176-93), there are five
different climate zones in China, as shown in Figure 19. These five zones are: the severe cold zone
(the average dry-bulb temperature in the coldest month is below 14 °F ), the cold climate zone (the
average dry-bulb temperature in the coldest month is from 32°F to14°F), the hot summer and cold
winter zone (the average dry-bulb temperature in the coldest month is from 32°F to14°F, and the
average dry-bulb temperature in the hottest month is from 77°F to 86°F), the hot summer and warm
Figure 19 China’s Climate Zone Map (Yao et al. 2009)

- 47 -
winter zone (the average dry-bulb temperature in the coldest month is more than 50°F, and the
average dry-bulb temperature in the hottest month is from 77°F to 86°F), and the temperate zone
(the average dry-bulb temperature in the coldest month is from 32°F to 86°F, and the average dry-
bulb temperature in the hottest month is from 64.4°F to 77°F). Beijing is at latitude 39.93 N and
longitude 116.28 E in northern China. Figure 19 presents Beijing’s dry-bulb temperature range for
each month. The coldest month in Beijing is January, when the average temperature is 29.5°F,
placing Beijing firmly in the cold climate zone. Its annual outdoor temperature ranges from 5°F to
95°F, and the average outdoor temperature is 55°F. For five months each year, the average
temperature is under 45°F. The number of days for which the dry-bulb temperature is under 41°F
exceeds 90. According to GB50176-93, Beijing is in the central heating district zone.
According to the American Society of Heating, Refrigerating and Air-Conditioning Engineers
(ASHRAE) Standard 55, Beijing’s comfort temperature zone is 75°F - 80°F in summer and 69°F
- 75°F in winter (ASHRAE, 2013). In Figure 20, it shows that in Beijing, January, February, March,
November, and December, these five months are exclusively heating needed. Because their highest
dry-bulb temperature is even lower than 69°F, the lowest temperature of the winter comfort zone.

- 48 -
July is the only month for which the average temperature is in the summer comfort zone. The
average temperature of June and August is very close to reaching 75°F, the lowest temperature of
summer comfort temperature. In these three months, more than 50% of the days that require
cooling more than heating. In April, May, September, and October, more than 50% of the days
require heating than cooling in order to feel comfortable.
Figure 20 Beijing’s Annual Temperature Chart

- 49 -
4.1.2 Comfort Zone
The comfort zone is also referred as the thermal comfort zone. It describes people’s
perceptions of satisfactory levels for their thermal environment (Ecophon, 2010). The heat
exchange between a human body and its surroundings affects the thermal indoor environment. An
input of metabolic rate (human activity type) and clothing level (human clothing type) is required
to generate a comfort zone. According to ASHRAE Standard 55, the metabolic rate for standing
while relaxed is 1.2; for seated, it is 1.0; and for sleeping, it is 0.7. These activities represent the
most common human activities in a residential building. This study will use the average of these
three rates, which is 1.0, as the metabolic input data. The clothing levels will be 0.5 for typical
summer indoor clothing (shorts, light top) and 1.0 for typical winter indoor clothing (long pants,
sweater). The psychrometric chart generated using this information is shown in Figure 21. It
indicates that people feel comfortable only 10% of the year without heating or cooling. Heating,
in particular, is very important in terms of making people feel comfortable. It can increase the
number of comfortable hours by 44.2% (3870 hrs). A well-insulated thermal envelope can reduce
heat loss and increase the number of comfortable hours by 18.9% (1655 hrs). Sun shading of
windows can increase the number of comfortable hours by 10% (880 hours), and dehumidification

- 50 -
can increase the number of comfortable hours by 13.8% (1136 hours). It is easy to see that heating
is the largest factor affecting thermal comfort.

- 51 -
Figure 21 Psychometric Chart

- 52 -
4.2 Reference Model
4.2.1 Basic Information
A typical existing multi-story residential building in Beijing is used for the reference data. It
is an eighteen-story building, with three units on each floor. The gross area for each unit is from
80 m2 (861 ft2) to 120 m2 (1291 ft2). It has two elevators and one staircase, which is used for
vertical circulation. Based on the data collected regarding this typical building, the reference model
is built in Revit, as shown in Figure 22. Zones A, B, and C represent the three different units on
each story. Because the energy analysis is based on zones, the interior walls in each unit are not
Figure 22 Existing Building's Floor Plan

- 53 -
shown in the reference model.
Figure 23 Reference Model in Revit
4.2.2 Building Envelope
Figure 24 shows the details of the wall assembly in the existing building. They are very
common wall details, found in residential construction throughout China. The exterior wall is
reinforced concrete with an 8-inch CMU (Concrete Masonry Unit) fill and has cement and sand
on each outer side to level the surface. One layer of paint is applied to the external side of the walls
only. The R-value of this exterior wall is R- 1.4. The interior wall is similar to the exterior wall,

- 54 -
i.e., another 8” CMU wall. The roof is 8” cast-in-place concrete (reinforced). Aluminum-framed
windows with double clear glazing, which provide a U-factor of 0.65 Btu/(h·ft²·°F), are very
common in China and used throughout. The building’s airtightness is modeled at 2 air changes per
hour (ACH).
4.2.3 Heating System
Based on the climate data analysis using Climate Consultant, Beijing has 150 days of
temperatures under 41 °F. According to the Design Code for the Heating, Ventilation, and Air
Conditioning of a Civil Building, if the daily temperature is less than or equal to 5 °C (41°F) for
Figure 24 Existing building wall detail

- 55 -
at least 90 days throughout the year, central heating should be provided in the area (National
Standard of the People's Republic of China, 2012).
China has the largest central heating system in the world. It has 124,000 miles of pipes,
providing 97 billion square feet of building area with heat, which is equivalent to providing heat
for one-fourth of the total gross floor area in the U.S. (Birol & Jiang, 2017). Building and
maintaining such a massive central heating system is not a simple mission. Ideally, central heating
is provided by thermal power stations which can supply both heat and power. However, they can
only provide heating for a limited floor area. Hence, each city needs a number of central heating
plants to generate heating via coal boilers, which have relatively low energy efficiency and result
in heavy pollution. Both thermal power stations and central heating plants generate hot water and
distribute through network to radiator in each unit. The heat loss as the heat is distributed is large.
In addition, the amount of heat dispensed cannot be adjusted by individuals, so “over-heating”
may cause a huge amount of waste in terms of energy and cost. Moreover, when considering the
characteristics of the central heating network, the heat goes into each building from the bottom to
top and is diverted to each unit on each floor. Hence, the units on the top of the building will get

- 56 -
less heat than those on the lower level due to heat loss during distribution. In such a situation, the
central heating system is not reliable. It cannot ensure a comfortable environment for every family
in the building as well as indicating the real energy demand of each family for heating. Therefore,
in order to maintain a stable and comfortable environment for people living in northern China, the
heating system information in reference model is collected from the most common heat pump 7.7
Heating seasonal performance factor (HSPF) in China in lieu of the central heating system.
Figure 25 Central Heating Diagram I
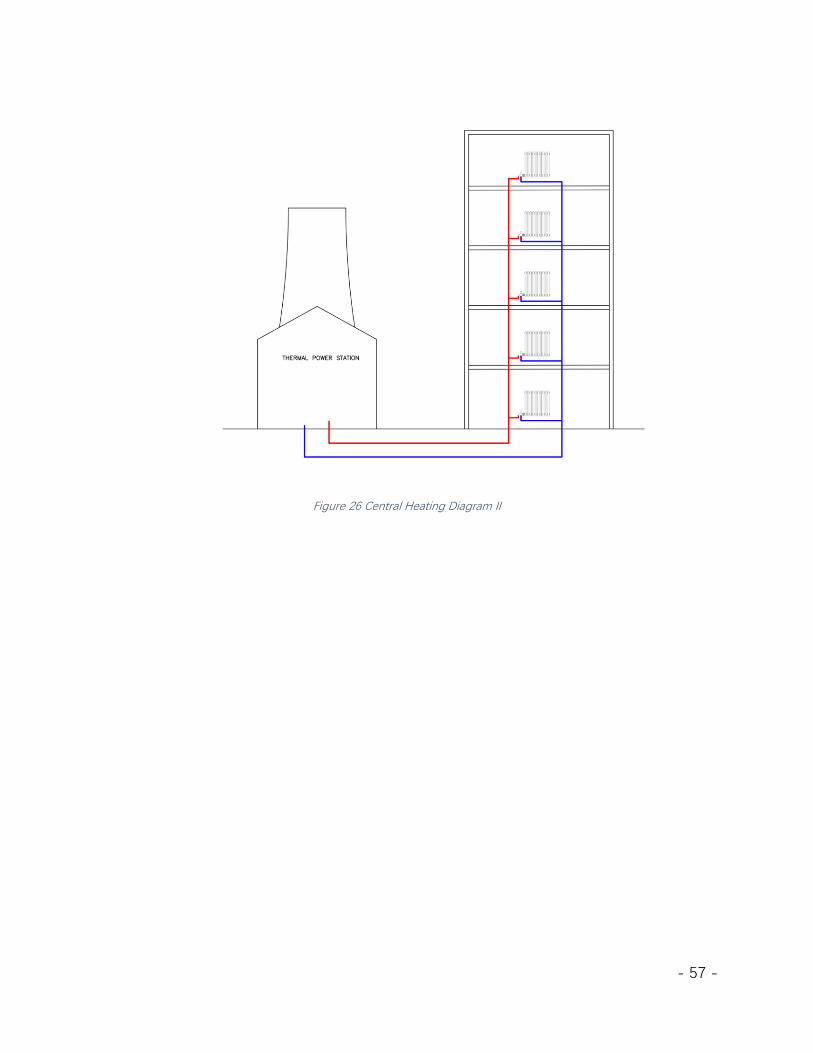
- 57 -
Figure 26 Central Heating Diagram II

- 58 -
4.2.4 Cooling System
In China, the most common cooling system used in a residential building is a split-air-handling
unit. It comes with two components: one is the indoor air handler, the other is an outdoor heat
pump. It works as an air cooling system in all regions, but also for space heating in areas not within
the heating zone. In this research, a heat pump, which has a 12 SEER (Seasonal Energy Efficiency
Ratio – measurement of cooling efficiency over typical cooling; the higher, the better) as a
reference point, will be used.
Figure 27 Split-Air-Handling Unit Diagram

- 59 -
4.2.5 Hot Water Heating System
In China’s residential buildings, hot water is provided by a small water heater in each unit.
There are three types of water heaters: gas, electric, and solar-powered. For the purposes of this
thesis, an electric water heater is used as the reference hot water heating system since it is the most
commonly used system in China’s residential buildings.
Based on the lifestyle habits of Chinese families in terms of reducing living expenses, China's
hot water demand is less than that of Western developed countries. According to reports, the main
use of domestic hot water in China is for taking a bath. Eighty-five percent of families use hot
water for taking baths, 30% of families do not use hot water to wash their hands, 40% of families
do not use hot water to wash clothes, and 68% of families do not use hot water to wash vegetables
or to cook (Tsinghua University, 2015). Less hot water demand means that less energy is expended
on heating hot water. There are almost 70% of Chinese families have hot water heaters. The
average energy consumption per family for the hot water heater is 80-130 kWh/family/year (27-
44 kBtu/family/year) (Jiang, 2007). Compared with U.S. families, in 2015, a three-person
household consumed 17,000 kBtu on average, about 386 times of the average of Chinese families
(U.S. Energy Information Administration, 2018). Hence, for this research, hot water heating is not

- 60 -
considered to be a major energy consumption improvement task. Therefore, the hot water heater
will be regarded as just another basic component, which consumes energy in the energy analysis.
4.2.6 Lighting System
Lighting systems are discussed generally in this research. Because LED lighting has the
highest energy efficiency of all of the lightings on the market, as its technology develops, prices
have continued to drop. In 2018, one 60-watt-equivalent LED light bulb (8.3 watts) was $1.24,
very different from its $10 price in 2015 (LEDinside Nicole, 2016).
In terms of lighting power density (LPD), for example, using LED lighting in a 100 ft2 family
dining area, which would need the equivalent of 30 lumens x 100 = 3000 lumens of light
(Submissions, 2018), would mean that four 8.3-watt LED bulbs would be needed (an 8.3-watt
LED bulb provides 800 lumens of light). The LPD is thus 4x8.3-watt/100 ft2= 33 w/ft2. The
ASHRAE 90.1-2010 standard for that same area is 0.89 w/ft2. Hence using LED lighting makes
the lighting 62% more efficient than the ASHRAE standard. The LED lighting is the best choice
for improving lighting energy efficiency in both existing and new buildings.
The LPD for this research is set as 0.7 w/ft2, which is the previous standard for a multifamily
building (ASHRAE, 2007). Since there is a clear way to improve this number, keeping it as is

- 61 -
makes the analysis conservative.
4.2.7 Plug Loads
Plug loads are the energy that used by equipment that is plugged into an outlet, excluding
general lighting, heating, cooling, water heating, or ventilation. Plug loads devices vary by
household and location. In terms of common ones in Chinese household, refrigerators, washing
machines, televisions, computers, rice cookers, and kitchen ventilation are most likely seen in an
average Chinse family. With acceleration of urbanization and rising income in Chinese households,
ownership of appliances is expected to increase. According to the results of 1450 surveys
conducted by China Residential Energy Consumption Survey (CRECS) in 2013, every 100 three-
person households owned 89 refrigerators, 91 washing machines, 120 televisions, 76 rice cookers,
and 89 computers (Zheng, et al., 2014). In addition, kitchen ventilation becomes necessary for
cleaner and healthier life due to Chinese cooking habits. Therefore, these six types of plus load
devices will be included in reference model. Each type of appliances has various models with
different wattages. Table 4 shows the typical wattages that most common models of these six plug
load devices may pull in an average three-person Chinese household. In the reference model

- 62 -
Plug load device Wattage (W)
Refrigerator 110W
Washing machine 240W
Television 50W
Computer 200W
Rice cooker 300W
Kitchen ventilation 220W
Table 4 Power of plug load devices
the unit of 861 ft2 consumes 1120 watts. In another word, it consumes 1.3w/ft2. As the floor area
increases, the number will become smaller. Smaller number may cause lower outcomes when
calculating the reference model’s plug loads. Therefore, 1.3w/ft2 will be set as the reference point
of plug loads in reference model.
This research intends to improve energy efficiency of existing residential buildings in northern
China. It is true that as buildings become more energy efficient, the impact of plug loads become
more apparent. Hence, it is strongly recommended that each household pay attention to the China
Energy Label on the bodies of appliances and purchase as highest level as they can afford to live

- 63 -
an energy saving life. In addition, it is suggested that residents care about plug loads and keep no-
cost energy-saving habits, such as turning appliances all off instead of leaving them active modes.
However, it is impossible to require residents to use or not to use specific models of appliances.
Therefore, in this research the plug loads will be considered as only a basic component in the
analysis.
4.2.8 Reference Model Energy Usage
The reference model annual energy use intensity is 119 kBtu / ft² / year, as shown in Figure
28. The energy cost is $1.86/ft2/year. The cooling-on set point is 78°F, and the heat-on set point is
64°F.
Figure 28 Energy Consumption for Existing Building

- 64 -
Figure 29 Energy Consumption in Different Categories
Figure 29 shows that 72.4% of the energy is used by the HVAC system, making it the largest
consumer of energy in the reference model. The energy usage for HVAC is calculated as 119 (kBtu
/ ft² / year) x72.4% = 86 (kBtu / ft² / year), and reducing the HVAC’s energy use will have the
largest impact on the total energy consumption in the reference model.
There are two strategies that could be used to reduce the HVAC’s energy use:
1. Insulating the thermal envelope well in order to reduce the energy loss.
2. Using high-performance HVAC equipment to use less energy to generate the same
amount of heating and cooling.
These two strategies will be compared in the following section.

- 65 -
4.3 Analysis of Passive Strategies
4.3.1 Building’s Thermal Envelope
According to the analysis for the reference model above, heating and cooling cost the most
energy. The heating and cooling energy transmission loss (Q) is the dominate way energy is lost.
The solution to reducing the energy loss for heating and cooling must be adjusted while
considering three variables: A [area (the area being considered for heating and cooling loss)], U
[U-value (a measurement of heating and cooling transmission)], and ∆𝑇 [the difference between
the inside and outside temperatures]. The relationship between the four variables above can be
presented via the following equation.
𝑄 = 𝐴 ∗ 𝑈 ∗ ∆𝑇 ∗ ℎ (hour)
This equation reflects that lowering any of the values of A, U and T or all of them at the
same time will reduce the Q value. However, the area of thermal envelope A is already set for the
reference model. Also, the outdoor temperatures are set by environmental factors. A control of T
is limited. Therefore, the only way to significantly reduce Q for the existing building is to lower
U. The way to reduce the U-value is to increase the R-value, which is the capacity of an insulating
material to resist heat transfer. The relation between U and R can be expressed as:

- 66 -
𝑈 =1
𝑅
Insulation is the most important component in terms of increasing the R-value of the building
envelope assembly. The three most popular types of insulation are rigid board insulation, batt
insulation, and spray foam insulation. The R-value for rigid insulation (Polystyrene Board) is 5 per
inch, for batt insulation (Fiberglass) is 3.1 per inch, and for spray foam insulation (closed cell) is
6.5 per inch (Great Day Improvements, 2019). The spray foam insulation has the highest R-value
compared with the other two, but, at the same time, it costs significantly more than a conventional
insulation product. For instance, using spray foam insulation can cost as much as three times more
than installing fiberglass insulation. Considering the large stock of existing buildings in northern
China in need of retrofitting, using a high-cost insulation is not economically feasible. Hence, from
the standpoint of this research, using spray foam is not a suitable solution. When comparing prices,
the batt insulation is the cheapest insulation material. However, it also has the lowest R-value,
which means that it will have to be thicker than the other two. In a typical situation, batt insulation
is installed in the inner layer of the thermal envelope, thereby reducing the floor area. Such an
installation is not possible in an existing building which has a limited net floor area and is located
- 67 -
in a high-density country. Hence, rigid insulation is the best choice for this research. Thicker
insulation will provide a higher R-value but also drive up the cost. An optimal thickness which can
balance between the increased cost for the insulation and the reduced energy cost for heating and
cooling will have to found. This research analyzes R-5, R-10, and R-20 polystyrene board
insulation for the wall and roof assemblies. These are common R-values for this product. The
energy savings obtained using each insulation are provided below.
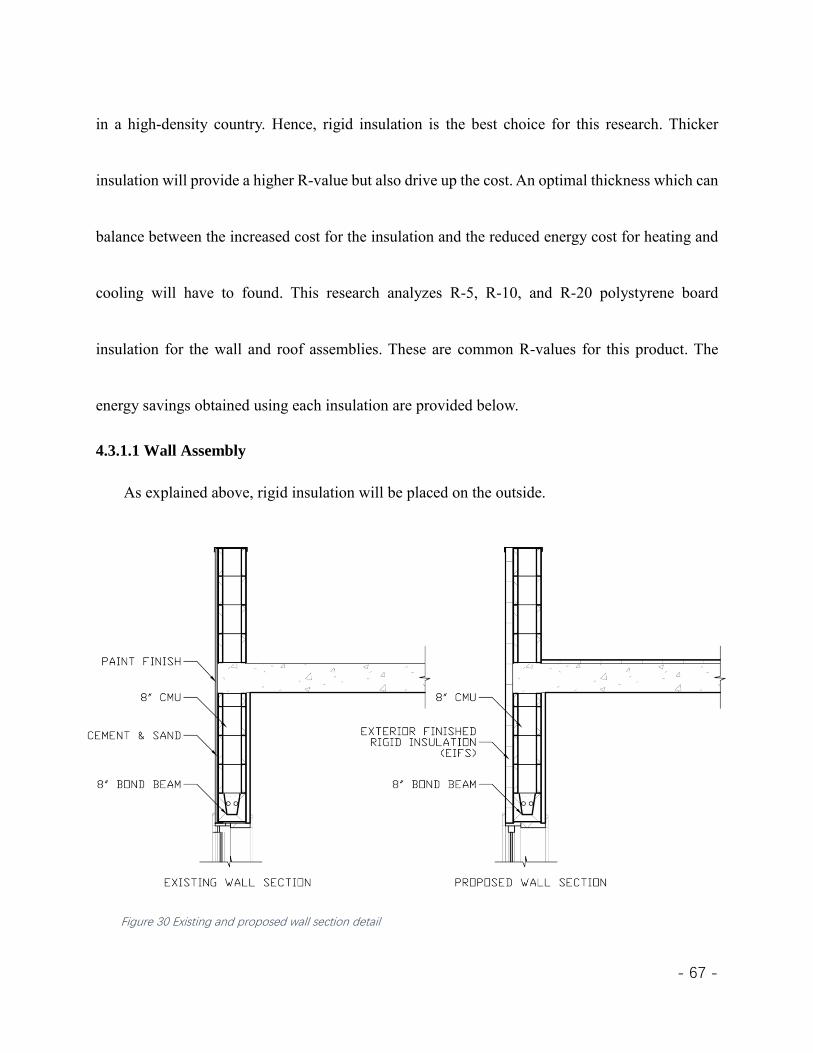
4.3.1.1 Wall Assembly
As explained above, rigid insulation will be placed on the outside.
Figure 30 Existing and proposed wall section detail

- 68 -
The analysis will keep the reference model’s data constant except for the R-value for the walls.
Figure 31 shows that when applying R-5 insulation to the existing building, the energy cost is 93.1
kBtu/ft2/yr, which is 25 kBtu/ft2/yr better than the reference model. Figure 32 shows that when
providing R-10 insulation to the existing building, the insulation will reduce the energy to 86.6
kBtu/ft2/yr, which is 32.4 kBtu/ft2/yr better than the reference model.
Figure 31 Energy Consumption with R-5 Insulation

- 69 -
Finally, Figure 33 shows that when providing R-20 insulation to the existing building, the energy
consumed is 83.5 kBtu/ft2/yr, which is 35.5 kBtu/ft2/yr better than the reference model.
Figure 32 Energy Consumption for R-10 Insulation
Figure 33 Energy Consumption with R-20 Insulation

- 70 -
In terms of energy efficiency, the R-5 to R-20 insulations all have improved the energy
performance of the reference model. In terms of cost, one-inch R-5 rigid insulation is about
$0.42/ft2, two-inch R-10 rigid insulation is $0.75/ft2, and four-inch R-20 rigid insulation is
$1.45/ft2. In order to compare the results, the units for the price of rigid insulation will be converted
to $/100 ft². The comparison of the energy efficiencies and costs of the potential wall assembly
insulations is shown in Table 5.
R-value Energy used (kBtu/ft²/yr) Cost($/100 ft²) Energy
Efficiency
R-5 92.3 42 22%
R-10 86.6 75 27%
R-20 83.5 145 30%
Table 5 Energy Efficiencies and Costs for wall Insulations
R-20 is the most energy efficient insulation compared with the other two at 3 percentage points
higher than R-10 and 7 percentage points higher than R-5; however, it cost 2 times more than the
R-10 insulation and 3.5 times more than the R-5 insulation. In addition, according to China’s
Design Standard for the Energy Efficiency of Residential Buildings in Severe Cold and Cold Zones
(JGJ26-2010), for new construction with more than 9 stories, the K-value should be 0.7 Watts/m2
Kelvin (MOHURD, 2010). The K-value represents a measure of the thermal conductivity of a

- 71 -
material. Based on the conversion from metric U-values to Imperial inch-pound U-values, the R-
value is related to the K-value via 𝑅 − 𝑉𝑎𝑙𝑢𝑒 =5.678
𝐾−𝑉𝑎𝑙𝑢𝑒. Hence, according to JGJ26-2010, the R-
value should be at least 8.11. Therefore, compared with R-5 and R-20, R-10 is the most
economically efficient insulation that meets China’s latest code.
4.3.1.2 Roof Assembly
Up to 45% of a building’s heat loss is through the roof in the winter (Gerhardt, 2010). As part
of the thermal envelope, the roof also needs to increasing its R-value to reduce its energy loss.
In this section, based on the research above, R-5, R-10, and R-20 polystyrene board insulation
are analyzed for the roof assembly. All of the other components will be held constant in the
Figure 34 Existing and proposed roof section detail

- 72 -
reference model for this analysis. The results of the analysis are shown below. Figure 35 shows
that the energy cost is 112 kBtu/ft2/yr when R-5 insulation is used. In addition, the energy costs
shown in Figures 36 and 37 are the same, i.e., 111 kBtu/ft2/yr, meaning that providing R-10 or R-
20 rigid insulation will lead to the same energy costs.
Figure 35 Energy Consumption for R-5 Roof Insulation

- 73 -
As shown in Table 6, R-20 has the highest price, so R-10 insulation is the better choice of the two.
Figure 37 Energy Consumption for R-20 Roof Insulation
Figure 36 Energy Consumption for R-10 Roof Insulation

- 74 -
Furthermore, comparing the energy performances of R-5 and R-10 rigid insulation on the roof,
only a 1 kBtu/ft2/yr difference exists between them. However, R-10 costs 78.57% more than R-5.
Therefore, the R-5 polystyrene rigid insulation is the optimal choice.
R-value Energy used (kBtu/ft²/yr) Cost($/100 ft²) Energy
Efficiency
R-5 112 42 5%
R-10 111 75 6.7%
R-20 111 145 6.7%
Table 6 Energy Efficiencies and Costs for roof Insulations
4.3.1.3 Windows
Windows are considered as an opening in the thermal envelope, and they lose the largest
amount of the heat, i.e., they are responsible for 25%-30% of residential heating and cooling
energy use (U.S. Department of Energy, 2017). High-performance windows are one of the key
factors for improving energy use in both new and existing buildings. The lower the U-value, the
better the energy performance. In general, it is vital to choose highly energy efficient windows.
Low emissivity (low-e) glass was created to minimize the amount of infrared and ultraviolet
light that comes through the glass, while, at the same time, maintaining the amount of light that
enters the space. Low-e glass windows have a microscopically thin coating that keeps the
temperature in the space consistent by reflecting the interior temperatures back inside (Stanek

- 75 -
Windows, 2017). In this section, two common window types that perform better than the double
clear windows used in the reference model are analyzed: vinyl-frame double low-e (U-0.35)
windows and vinyl-frame triple low-e (U-0.27) windows. Using insight360, the energy used when
using double low-e and triple low-e windows is computed, with results shown in Figures 38 and
39.
As it shows in the figures above, energy use is the same for the two types of window. However,
the figures cannot display decimal places and there is really a 0.6 kBtu/ft2/yr difference between
two figures, with the building with triple low-e windows consuming slightly less energy.
Figure 38 Energy Consumption for Double Low-E (U-0.35) Windows

- 76 -
Comparing the costs of the two types of window, the double low-e double-hung window unit price
is around $500, and the triple low-e double-hung window unit price is around $625 (Hatfield,
2018). Hence, the price of a triple low-e window is 25% higher than that of a double low-e window.
Given the less than 1 kBtu/ft2/yr difference in energy usage, double low-e windows are both
economically efficient and economically feasible for improving the huge stock of existing
buildings in northern China.
4.3.2 Sun shading
Sun shading is done through a device that controls the sunlight going through the building. In
the warm summertime, the more solar gain may result in more cooling energy consumption; in the
Figure 39 Energy Consumption for Triple Low-E (U-0.27) Windows

- 77 -
cold wintertime, the windows on the south-facing side can contribute more passive solar gain
(Prowler, 2016).
A well-designed sun shading system will adjust the heat gain and cooling requirements
efficiently and increase the quality of natural light for the interior spaces. An effective sun shading
system is based on the solar orientation of the building. Generally, in the Northern Hemisphere,
the most influential sides of a building are the south and west sides. Hence, for this research,
different sizes of sun shading will be compared on both the south and west sides of the building.
Figure 40 South-Side Shading System’s Energy Savings

- 78 -
Figures 40 and 41 show that the energy savings obtained by using a sun shading system on
the existing reference building are limited. The shading system size which saves the most energy
on the south side of the building is 2/3 of the window height, which can reduce energy consumption
by 0.25 kBtu/ft2/yr. On the west side, 2/3 of the window height is also the most energy-saving size,
reducing energy consumption by 0.06 kBtu/ft2/yr.
Figure 41 West-Side Shading System’s Energy Savings

- 79 -
Compared with internal devices, exterior sun shading system are effective to reduce solar heat
gain and cooling load before the sun strikes the window (Carmody, Selkowitz, Arasteh, &
Heschong, 2007). Compared with traditional sun shades such as window awnings and canopies,
exterior aluminum roller shades are more suitable in this case. Because they are easy to install and
have reasonable prices. Moreover, it can adjust its height based on demand to control the solar heat
gain. The average cost for an aluminum roller shade per window is about $50. Hence, installing
sun shades is an optimal choice.
Figure 42 Aluminum roller shades (Source: www.hongchang168.com/mobile/detail/24)

- 80 -
4.4 Analysis of Active Strategies
4.4.1 HVAC
HVAC stands for heating, ventilation, and air conditioning (Merriam-Webster Dictionary,
2019). An HVAC is an important system in a building, providing as it does a comfortable indoor
environment for human beings.
According to the analysis for the existing reference building above, heating and cooling use
up the largest part of the total energy consumption. As the air-source heat pump is the only system
that provides heating and cooling in the reference model, the product’s energy efficiency is crucial
in terms of reducing the energy used for heating and cooling. The Seasonal Energy Efficiency
Ratio (SEER) is an important standard with which to measure the energy savings of a heat pump
when it is being used for cooling. A higher SEER means that that less electricity is needed by the
system to produce the cooling. The Heating Season Performance Factor (HSPF) is the standard
used to measure the heat pump’s efficiency in heating mode. It is a heat pump’s heating version of
SEER (Doodman Air Conditioning and Heating, 2019). A higher HSPF means higher energy
performance.
The Air-Conditioning, Heating, and Refrigeration Institute (AHRI) indicates that the

- 81 -
minimum SEER for units manufactured in the U.S. was 10 SEER in 1992, which was updated to
13 SEER in 2006 (AHRI, 2018). Nowadays, 13-14 SEER indicates a standard efficiency model,
15-18 indicates a high-efficiency model, and 19 or higher SEER indicates a super-high-efficiency
model. Super-high SEER equipment is significantly more expensive than high SEER units. After
installation, maintenance, energy, and other factors are taken into consideration, over the span of
15 years, it is 26% more expensive to buy a 21-SEER air conditioner than 13-18 SEER units (All
Systems Mechanical, 2016). Therefore, in this section, only the 14 SEER/8.2 HSPF and 17 SEER
/9.6 HSPF heat pump will be investigated.

- 82 -
Figure 43 14 SEER/8.2 HSPF Energy Use
Figure 44 17 SEER/9.6 HSPF Energy Use

- 83 -
The results are obtained by using the original data from the reference model, except for the energy
efficiency of the heat pump. The energy used by a 14 SEER/8.2 HSPF model is 85.9 kBtu/ft2/yr,
which is 28% more efficient than the heating system in the existing building. The 17 SEER /9.6
HSPF model uses 80.5 kBtu/ft2/yr, which is 32% more efficient than the existing model and 4%
more efficient than the 14 SEER /8.2 HSPF. Therefore, the 17 SEER /9.6 HSPF model is the
optimal choice in terms of energy consumed.
The price of such a unit varies from brand to brand; for example, the CARRIER 14 SEER/8.2
HSPF model costs about $1300 dollars, whereas the 17 SEER/9.6 HSPF model is $2750. There is
a $1450 difference between the two CARRIER models. However, if PIONEER or TOSHIBA
models are used, the 17 SEER/9.6 HSPF model’s price is around $1750, which is $1000 dollars
cheaper than the CARRIER’s model. Since the price varies significantly from model to model and
brand to brand, it is difficult to recommend a model.
4.4.2 Photovoltaic System
A PV system generates electric power from the sun. Falling prices have made a PV system
more affordable than ever before. In 2017, the price of a PV system was $1.50 per watt, which is
50% cheaper than the same system was in 2012 (SEIA, 2018). PV systems are easy to install, even

- 84 -
on existing buildings. Hence, PV systems have become the most popular renewable energy
systems.
It is notable that the higher efficiency a solar panel is, the stronger ability of a solar panel to
convert sunlight into electricity. Nowadays, the highest efficiency solar panel offered on the market
is about 20% (Energysage, 2019). In this section, a 20%-efficient solar panel is chosen and
different percentages of roof coverage are compared.
Figure 45 shows that with 60% roof coverage, the energy use reduces to 118 kBtu/ft2/yr, only
1 kBtu/ft2/yr better than the existing building. Figure 46 shows the same result for 75% roof
coverage. Energy consumption when covering 90% of the roof with the PV system is 117
kBtu/ft2/yr, as shown in Figure 47. The results show that the energy savings obtained by using this
PV system is no more than 2 kBtu/ft2/yr. Since the effect of applying a PV system can be influenced
by a number of factors, such as the building’s location, roof area, building orientation, etc., each
existing building should be considered individually.

- 85 -
Figure 45 Energy Use Reduction with 60% PV Coverage

- 86 -
Figure 46 Energy Use Reduction with 75% PV Coverage

- 87 -
Figure 47 Energy Use Reduction with 90% PV Coverage

- 88 -
5.0 Summary & Conclusion
5.1 Summary
Urbanization in China has been evolving rapidly. The increasing building stock contributes
China to become the largest energy consumer in residential buildings in the world. It has made
China the biggest carbon dioxide emitter (Global Carbon Atlas, 2017). Moreover, it has brought
environmental problems such as smog that is harmful to health. Following developed countries’
lead, China’s government has implemented policies about the energy efficiency of new residential
buildings. However, comparing with new construction, China’s government and developers have
not endeavored to reduce the energy consumption in existing residential buildings.
This research aims to propose most cost-efficient solutions to improving energy efficiency in
existing residential buildings in northern China. It seeks to suggest a direction that can be taken as
a reference when retrofitting existing residential buildings in northern regions. Especially, this
research investigates to remove inefficient central heating system as the heat source in winter in
northern China, in order to reduce coal consumption and carbon dioxide emission.
In this research, reference model is located in Beijing, the most representative city of northern
China. Four steps have been taken to propose the ultimate cost-efficient and energy-efficient

- 89 -
residential building model. Firstly, it runs Climate Consultant to simulate and collect climate data
of reference model. Secondly, it uses Revit to set up a building model based on the basic
information of the most common 18-story existing residential building in northern China. Thirdly,
with Autodesk Insight 360, it analyzed proposed active and passive strategies that are inspired by
literature review. It finds an optimal solution, which is installing R-10 insulation on the exterior
wall, R-5 insulation on the roof, upgrading the existing windows to U-0.35 double low-e windows,
and using an electric air-source heat pump with an energy efficiency rating of 17 SEER/9.5 HSPF
as the heating and cooling system results in the ultimate model. The results are summarized as
below in Table 7.
Lastly, it presents the ultimate cost-efficient and energy-efficient residential building model.
Components Proposed Energy Efficiency
Wall Assembly R-10 Polystyrene Insulation 27%
Roof Assembly R-5 Polystyrene Insulation 5.8%
Window U-0.35 Double Low-E 3%
Sun Shading Aluminum Roller Shades 0.26%
Heat Pump 17 SEER/9.6 HSPF 32%
PV System N/A N/A
Table 7 Elements of the Ultimate Building Model

- 90 -
5.2 The Ultimate Energy-Efficient Residential Building Model
The energy consumption of the building when using all of the recommended elements is 66.3
kBtu / ft² / year, as shown in Figure 48. The energy cost is $1.44/ft2/year.
It has increased energy efficiency by 44% over the existing reference building model.
According to the AIA 2030 Design Data Exchange (DDX), the national average energy
consumption of a mid-rise/high-rise residential building in the U.S. is 78.85 kBtu / ft² / year (AIA
Figure 48 Energy Consumption of the Ultimate Model

- 91 -
2030 Commitment Working Group, 2006). The recommended ultimate model uses 12.5 kBtu / ft²
/ year less energy than that.
Figure 49 compares the three levels with the existing and proposed buildings. Although it is
difficult to define a high-performance energy efficient residential building as using 66.3 kBtu / ft²
/ year in energy, on top of ensuring residents’ consistent comfort all year round, this result
represents a significant energy efficiency improvement without relying on the central heating
system. More importantly, it reduces its annual energy cost from $1.86/ft2 to $1.44/ft2. In addition
to the cost of applying all the proposed interventions, which is $299,483, it only takes 11.5 years
38
0<0
119
66.3
-20
0
20
40
60
80
100
120
140
Passive House Net zero Building Energy Plus House Exiting Building Proposed Building
Energy Demand (kBtu/sf/yr)
Figure 49 Comparing With Three Levels

- 92 -
to pay back all the investments. Its cost efficiency will allow China to support more retrofits of
existing residential buildings in northern China in a short span of time.
5.3 Application of Results
As the largest building construction market in the world, China in recent years has paid great
attention to establishing policies, updating regulations, and upgrading rating systems for energy-
efficient buildings to provide guidance for new construction. As shown in China’s 13th Five Year
Plan for Building Energy Efficiency and Green Building Development, it has set aggressive goals
for green building construction and renovation, including a requirement that 50% of all new urban
buildings be certified as green buildings (MOHURD, 2017). What is more, China, in 2017, set a
goal of turning 60% of the existing residential buildings in urban areas across the whole nation
into energy-efficient buildings. When it comes to Chinese residents’ higher and higher
expectations in terms of living environments and quality of life, new construction can mostly meet
their needs. However, it is also important to improve the existing residential buildings for people
who cannot afford to move to new buildings. Thus, whether examining the situation from the
vantage point of the Chinese government’s determination or the Chinese residents’ rising
expectations, improving existing residential buildings’ energy-efficiency performances is urgent.

- 93 -
The public and private sectors have an obligation to work together to implement energy-saving
strategies and solutions. Therefore, this research has aimed to make a contribution to this
meaningful and high-priority mission, providing these findings to lighten the burden of all of
society slightly.
By collecting data from an existing residential building in Beijing, the reference model was
built to represent the most common residential buildings in northern China. Through applying
different types of passive and active strategies, the ultimate building model was simulated,
improving both energy efficiency and cost efficiency. Hence, this research can be used with
confidence as a reference as well as a guideline for retrofitting other existing residential buildings
in northern China. In particular, in order to make it economically feasible to improve the energy
performance of the large stock of existing residential buildings, this research has taken cost under
careful consideration. Thus, improving existing residential buildings can be achieved at a rapid
pace, boosting the possibility of achieving China’s 13th Five Year Plan. In addition, since this
research was conducted without utilizing the central heating system, its results may inspire them
possible removal of the central heating system in order to conserve resources and protect the

- 94 -
environment. Especially in the case of new construction in northern China, it may be possible to
cut the expenses involved in expanding the central heating network and buying more equipment
for it. Additionally, the results from this research can be applied in southern China since a central
heating system is not provided in the southern area. Nowadays, people will no longer tolerate being
cold indoors. Bringing heating to the southern area via HVAC has resulted in greater energy
consumption. Thus, when turning existing residential buildings in southern China into energy-
efficient buildings, the desire for heat needs to be considered as well. In this situation, the results
from this research can provide guidance for lowering heat loss and recommendations in terms of
HVAC systems.
5.4 Area for Further Research
Since this research was conducted based on Beijing, China, its large population, rapid
urbanization, and a large number of existing residential buildings become the dominant factors.
Therefore, the reference data may not be applicable to existing residential buildings in rural
northern China. In the future, existing residential buildings in rural areas should be investigated in
terms of improving their energy efficiency and maximizing their potential in order for them to
serve the local residents well. In addition, this research is not an endpoint but rather a small

- 95 -
beginning step in the improvement of existing residential buildings. It is meant to encourage more
discussion and research, intensifying the effort to improve the energy performances of existing
residential buildings in order to provide a better living for people. Last, but not least, this research
should be updated as scientifically and technologically innovative methods and strategies are
introduced. Thus, this line of research can keep analyzing and providing better solutions for
improving the energy-efficiency of the stock of existing residential buildings in China.

- 96 -
List of Figures
Figure 1 Total Energy Consumption (quadrillions of Btu) (KNOEMA, 2017) ......................... - 2 -
Figure 2 China’s annual energy consumption ............................................................................ - 3 -
Figure 3 China Central Heating Map (Source: Infzm.com) ....................................................... - 4 -
Figure 4 China’s Central Heating Floor Area ............................................................................. - 6 -
Figure 5 Smog in Beijing (Source: https://www.popsci.com/why-is-smog-in-china-so-bad) ... - 7 -
Figure 6 Smog in Beijing II (Source: https://www.businessinsider.com/china-smog-pollution-
coal-burning-toxic-red-alert-2015-12) ................................................................................ - 8 -
Figure 7 Beijing's Population ...................................................................................................... - 9 -
Figure 8 China's Existing Building Stock (2001-2014) (Building Energy Research Center of
Tsinghua University, 2016) ................................................................................................ - 9 -
Figure 9 Passive House Diagram (Source: Passive House Institute) ........................................ - 16 -
Figure 10 Net-Zero Home Diagram (Source: https://www.24hplans.com/cost-to-build-a-net-zero-
energy-home/) ................................................................................................................... - 18 -
Figure 11 Energy Plus House Diagram (Hendricks, 2014) ...................................................... - 20 -
Figure 12 Beach Green Dunes, NY, U.S. (Source: https://multifamily.phius.org/case-
study/beach-green-north-ny) ............................................................................................. - 27 -
Figure 13 Second + Delaware, MO, U.S. (Source: https://multifamily.phius.org/case-
study/second-and-delaware) ............................................................................................. - 28 -
Figure 14 Multi-Unit Residential Buildings in Toronto, Canada (Touchie, Pressnail and Tzekova
2012) ................................................................................................................................. - 31 -
Figure 15 Building C15, Qinhuangdao, China (Source:
https://wenku.baidu.com/view/8d773e0a77232f60ddcca17f.html) .................................. - 33 -
Figure 16 Nanjing Tiptop Residential, Nanjing, China (The Climate Group 2011) ................ - 35 -
Figure 17 Pilot Project in Tangshan, China (Building Energy Efficiency; China Academy of
Building Research 2007)................................................................................................... - 37 -
Figure 18 Result Comparison ................................................................................................... - 45 -
Figure 19 China’s Climate Zone Map (Yao et al. 2009) .......................................................... - 46 -
Figure 20 Beijing’s Annual Temperature Chart ....................................................................... - 48 -
Figure 21 Psychometric Chart .................................................................................................. - 51 -

- 97 -
Figure 22 Existing Building's Floor Plan .................................................................................. - 52 -
Figure 23 Reference Model in Revit ......................................................................................... - 53 -
Figure 24 Existing building wall detail ..................................................................................... - 54 -
Figure 25 Central Heating Diagram I ....................................................................................... - 56 -
Figure 26 Central Heating Diagram II ...................................................................................... - 57 -
Figure 27 Split-Air-Handling Unit Diagram............................................................................. - 58 -
Figure 28 Energy Consumption for Existing Building ............................................................. - 63 -
Figure 29 Energy Consumption in Different Categories .......................................................... - 64 -
Figure 30 Existing and proposed wall section detail ................................................................ - 67 -
Figure 31 Energy Consumption with R-5 Insulation ................................................................ - 68 -
Figure 32 Energy Consumption for R-10 Insulation ................................................................ - 69 -
Figure 33 Energy Consumption with R-20 Insulation .............................................................. - 69 -
Figure 34 Existing and proposed roof section detail ................................................................ - 71 -
Figure 35 Energy Consumption for R-5 Roof Insulation ......................................................... - 72 -
Figure 36 Energy Consumption for R-10 Roof Insulation ....................................................... - 73 -
Figure 37 Energy Consumption for R-20 Roof Insulation ....................................................... - 73 -
Figure 38 Energy Consumption for Double Low-E (U-0.35) Windows .................................. - 75 -
Figure 39 Energy Consumption for Triple Low-E (U-0.27) Windows .................................... - 76 -
Figure 40 South-Side Shading System’s Energy Savings ........................................................ - 77 -
Figure 41 West-Side Shading System’s Energy Savings ......................................................... - 78 -
Figure 42 Aluminum roller shades (Source: www.hongchang168.com/mobile/detail/24) ...... - 79 -
Figure 43 14 SEER/8.2 HSPF Energy Use ............................................................................... - 82 -
Figure 44 17 SEER/9.6 HSPF Energy Use ............................................................................... - 82 -
Figure 45 Energy Use Reduction with 60% PV Coverage ....................................................... - 85 -
Figure 46 Energy Use Reduction with 75% PV Coverage ....................................................... - 86 -
Figure 47 Energy Use Reduction with 90% PV Coverage ....................................................... - 87 -
Figure 48 Energy Consumption of the Ultimate Model ........................................................... - 90 -
Figure 49 Comparing With Three Levels ................................................................................. - 91 -

- 98 -
List of Tables
Table 1 Passive House Standards (Passive House Institute, 2015) ......................................... - 14 -
Table 2 Summary of Three Levels ............................................................................................ - 21 -
Table 3 Item Requirements for Grade Classifications of Green Buildings (Residential Buildings)-
42 -
Table 4 Power of plug load devices .......................................................................................... - 62 -
Table 5 Energy Efficiencies and Costs for wall Insulations ..................................................... - 70 -
Table 6 Energy Efficiencies and Costs for roof Insulations ..................................................... - 74 -
Table 7 Elements of the Ultimate Building Model ................................................................... - 89 -

- 99 -
References
AHRI. (2018, 1 1). Seasonal Energy Efficiency Ratio. Retrieved 3 3, 2019, from
http://www.ahrinet.org/Homeowners/Save-Energy/Seasonal-Energy-Efficiency-Ratio
AIA 2030 Commitment Working Group. (2006). REFERENCE: US National Average Site EUI
and LPD. Retrieved from https://2030ddx.aia.org/helps/National%20Avg%20EUI
All Systems Mechanical. (2016, 5 25). What's a Good Seer Rating? The Truth About High SEER
Air Conditioners. Retrieved 3 3, 2019, from https://asm-air.com/asm-air-conditioning-
blog/what-is-a-good-seer-rating/
Amecke, H., Zhang, S., Yang, X., Novikova, A., Hobbs, A., & Deason, J. (2013). Buildings
Energy Efficiency in China, Germany, and the United States. Climate Policy Initiative.
ASHRAE. (2007). ASHRAE 90.1-2007. Atlanta: ASHRAE.
ASHRAE. (2013). ASHRAE Standard 55-2013. Atlanta: ASHRAE.
Birol, F., & Jiang, Y. (2017). District Energy System In China-option for optimisation and
diversification. Paris, France: IEA Publication.
Building Energy Efficiency; China Academy of Building Research. (2007). Sino-German
Technical Cooperation Energy Efficiency in Existing Buildings Project Output.
Tangshan, China: BEE & CABR.
Building Energy Research Center of Tsinghua University. (2016). China Building Energy Use
2016. Beijing: China Architecture & Building Press.
Carmody, J., Selkowitz, S., Arasteh, D., & Heschong, L. (2007). Residential Windows: A Guide
to New Technologies and Energy Performance (Third ed.). New York: W.W. Norton &
Company.
Dixon, R. K., McGowan, E., Onysko, G., & Scheer, R. M. (2010). US energy conservtation and
dfficiency policies: Challenges and opportunities. Energy Policy, 6403.
Doodman Air Conditioning and Heating. (2019, 1 1). What HSPF means for you. Retrieved 3 2,
2019, from https://www.goodmanmfg.com/resources/hvac-learning-center/before-you-
buy/what-hspf-means-for-you
Ecophon. (2010, 1 1). Thermal Comfort. Retrieved from Ecophon:
https://www.ecophon.com/en/about-ecophon/functional-demands/thermal-comfort/

- 100 -
Enerdata. (2015, 6 16). Total energy consumption. Retrieved 7 1, 2018, from
https://yearbook.enerdata.net/total-energy/world-consumption-statistics.html
Energysage. (2019, January 1). What are the most efficient solar panels on the market? Solar
panel efficiency explained. Retrieved March 30, 2019, from Energysage:
http://news.energysage.com/what-are-the-most-efficient-solar-panels-on-the-market/
EPA. (2017, 1 19). The Sources and Solutions: Fossil Fuels. Retrieved from
https://www.epa.gov/nutrientpollution/sources-and-solutions-fossil-fuels
Evans, M., Lin, H., Jiang, W., Liu, B., Song, B., Somasundaram, S., & Shui, B. (2009). Country
Report on Building Energy Codes in China. Washington: National Laboratory.
Gerhardt, T. (2010, 2 10). Basics of Insulation and cool Roofing. Retrieved 2 26, 2019, from
https://news.duro-last.com/2010/02/10/basics-of-insulation-and-cool-roofing/
Global Buildings Performance Network. (2013). Activities in China . Retrieved 2 18, 2019, from
http://www.gbpn.org/activities/china
Global Carbon Atlas. (2017, 1 1). CO2 Emissions. Retrieved 4 1, 2019, from
http://www.globalcarbonatlas.org/en/CO2-emissions
Great Day Improvements. (2019, 1 1). Insulation R Value Chart. Retrieved 2 24, 2019, from
https://www.greatdayimprovements.com/insulation-r-value-chart.aspx
Hatfield, J. (2018, 1 1). DOUBLE OR TRIPLE: A CASE STUDY FOR TRIPLE-PANE
WINDOWS IN STUDENT HOUSING. Retrieved from
http://www.designcollaborative.com/design-blog/double-or-triple-a-case-study-for-triple-
pane-windows-in-student-housing/
Hendricks, B. (2014). What makes an Efficiency House Plus? Berlin: Federal Ministry for the
Environment, Nature Conservation, Building and Nuclear Safety.
Jiang, Y. (2007, 06 25). Building Energy Consumption of China. Retrieved 3 3, 2019, from
Chinadialogue: https://www.chinadialogue.net/article/show/single/ch/1118-Promoting-
Chinese-energy-efficiency-part-one-
KNOEMA. (2017, 1 4). KNOEMA. Retrieved 2 8, 2019, from
https://knoema.com/atlas/ranks/Primary-energy-consumption?baseRegion=CN
Krygiel, E., & Vandezande, J. (2015). Mastering Autodesk Revit Architecture 2015. Indiana:
SYBEX .

- 101 -
Laura Geggel, S. W. (2019, 2 6). 2018 Was 4th Hottest Year on Record, NASA Finds. Retrieved
2 6, 2019, from https://www.livescience.com/64700-2018-heat-record.html
LEDinside Nicole. (2016, 1 29). 2015 LED lighting prices. Retrieved 3 3, 2019, from Strategic
sourcing: http://www.worldsourcing.de/enews/65.html
Li, B., & Yao, R. (2009). Urbanisation and its impact on building energy consumption and
efficiency in China. Urban Climate, 34(9), 1991-1998.
Liu, Y., Wang, Z., Lin, B., Hong, J., & Zhu, Y. (2018). Occupant satisfaction in Three-Star-
certified office buildings based on comparative study using LEED and BREEAM.
Building and Environment, 132, 1-10.
Makinen, J. (2014, 11 15). For central heat, China has a north-south divide at Qin-Huai line.
Retrieved from Los Angeles Times: https://www.latimes.com/world/asia/la-fg-china-
heat-20141115-story.html
Merriam-Webster Dictionary. (2019, 1 1). HVAC. Retrieved 3 2, 2019, from
https://www.merriam-webster.com/dictionary/HVAC
MOHURD. (2010). Design Standard for Energy Efficiency of Residential Buildings in Severe
Cold and Cold Zones. China: China Architecture & Building Press.
MOHURD. (2016, 4 26). China's Building Energy Consumption is about One-third of Total
Energy Use. Retrieved 2 18, 2019, from
http://www.cnenergy.org/hb/jzyth/201604/t20160426_291312.html
MOHURD. (2017). 13th Five-Year Plan for the Development of Building Energy Efficiency and
Green Buildings. Beijing: MOHURD.
Multifamily Resource Center. (2016). Case Studies of Beach Green Dunes. Retrieved 3 3, 2019,
from https://multifamily.phius.org/case-study/beach-green-north-ny
Multifamily Resource Center. (2016). Case Studies of Second + Delaware, MO. Retrieved 3 3,
2019, from https://multifamily.phius.org/case-study/second-and-delaware
National Bureau of Statistics of China. (2015). China Statistical Yearbook-2015. Retrieved from
http://www.stats.gov.cn/tjsj/ndsj/2015/indexch.htm
National Bureau of Statistics of China. (2018, 1 1). National Bureau of Statistics of China.
Retrieved 2 8, 2019, from http://data.stats.gov.cn/easyquery.htm?cn=E0103

- 102 -
National Development and Reform Commission. (2017, 12 21). Official Establishment of Clean
Central Heating Plan in Northern China. Retrieved 2 18, 2019, from
http://www.cnenergy.org/tt/201712/t20171221_449380.html
National Standard of the People's Republic of China. (2012). GB 50736-2012 Design Code for
Heating Ventilation And Air Conditioning of Civil Building. Beijing, China: National
Standard of The People's Republic of China.
Passive House Institute. (2015). Passive House requirements. Retrieved from
https://passivehouse.com/02_informations/02_passive-house-requirements/02_passive-
house-requirements.htm
Peng, M., Zhang, x., & Ma, Y. (2013). The feasible of passice residential housing in Chian.
Bejing: Center of Science and Technology construction.
Prowler, D. (2016, 8 9). Sun Control and Shading Devices. Retrieved 3 1, 2016, from
http://www.wbdg.org/resources/sun-control-and-shading-devices
Rabani, M., Madessa, H. B., & Nord, N. (2017). A state-of-art review of retrofit interventions in
buildings towards nearly zero energy level. ScienceDirect, 318.
SEIA. (2018, 1 1). Photovoltaics. Retrieved 3 3, 2019, from
https://www.seia.org/initiatives/photovoltaics
Stanek Windows. (2017, 2 14). What is Low-E Glass & Does it Make Windows Energy
Efficient? . Retrieved 3 1, 2019, from https://www.stanekwindows.com/what-is-low-e-
glass-and-does-it-make-windows-more-energy-efficient.aspx
Submissions, R. (2018, 7 2). How To Determine How Many LED Lumens You’ll Need To
Properly Light Your Space. Retrieved 3 3, 2019, from Archdaily:
https://www.archdaily.com/897277/how-to-determine-how-many-led-lumens-youll-need-
to-properly-light-your-space
The Climate Group. (2011, 3). Case Studies of Low-Carbon Buildings in China. Policy Brief, 2,
13.
The Passive House Resource. (2018, 6 22). The world's first Passive House, Darmstadt-
Kranichstein, Germany. Retrieved from
https://passipedia.org/examples/residential_buildings/multi-

- 103 -
family_buildings/central_europe/the_world_s_first_passive_house_darmstadt-
kranichstein_germany
the State Council of the People's Republic of China. (2008). Regulation on Energy Conservation
in Civil Buildings (No. 530). Beijing: the State Council of the People's Republic of China.
Torcellini, P., Pless, S., Deru, M., & Crawley, D. (2006). Zero Energy Buildings: A Critical
Look at the Definition. National Renewable Energy Laboratory (p. 5). Battelle: Midwest
Research Institute.
Touchie, M. F., Pressnail, K. D., & Tzekova, E. S. (2012). Energy Savings by Retrofitting Multi-
Unit Residential Buildings: Case Studies. Proc. 3rd Building Enclosure Science and
Technology (BEST3) Conference (p. 105). Atlanta, GA: Building Enclosure Science and
Technology Conference.
Tsinghua University. (2015). Reseach of the evaluation system for household water heaters.
Beijing: Energy Foundation.
U.S. Department of Energy. (2017, 1 1). Update or Replace Windows. Retrieved from
Energy.GOV: https://www.energy.gov/energysaver/design/windows-doors-and-
skylights/update-or-replace-windows
U.S. Energy Information Administration. (2018, 5 29). How the United States uses energy.
Retrieved 2 6, 2019, from
https://www.eia.gov/energyexplained/index.php?page=us_energy_use
U.S. Energy Information Administration. (2018, 11 7). Space heating and water heating account
for nearly two thirds of U.S. home energy use. Retrieved 3 1, 2019, from
https://www.eia.gov/todayinenergy/detail/php?id=37433
World Bank. (2018, 7 6). GDP growth rate. Retrieved 2 6, 2019, from
https://www.google.com/publicdata/explore?ds=d5bncppjof8f9_&met_y=ny_gdp_mktp_
kd_zg&hl=en&dl=en#!ctype=l&strail=false&bcs=d&nselm=h&met_y=ny_gdp_mktp_kd
_zg&scale_y=lin&ind_y=false&rdim=country&idim=country:CHN&ifdim=country&hl=
en_US&dl=en&ind=false
Xu, X., Anadon, L. D., & Lee, H. (2016). Increasing Residential Building Energy Efficiency in
China An Evaluation of Policy Instruments. Cambridge, MA: Energy Technology

- 104 -
Innovation Policy Research Group Science, Technology, and Public Policy Program
Environment and Natural Resources Program.
Yan, D., Zhe, T., Yong, W., & Neng, Z. (2011, 9). Achievements and suggestions of heat
metering and energy efficiency retrofit for existing residential buildings in northern
heating regions of China. Energy Policy, 39(9), 4675-4682.
Yao, R., Li, B., Steemers, K., & Short, A. (2009). Assessing the natural ventilation cooling
potential of office buildings in different climate zones in China. Renewable Energy,
2697.
Zheng, X., Wei, C., Qin, P., Guo, J., Yu, Y., Song, F., & Chen, Z. (2014). Characteristics of
residential energy consumption in China: Findings from a household survey. Energy
Policy, 75, 126-135.