Embed Size (px)
Citation preview

Heikki Laitinen
Improving electric vehicle energy efficiency with two-speed gearbox
Thesis submitted in partial fulfilment of the requirements for
the degree of Master of Science in Technology.
Espoo, May 29, 2017
Supervisor: Professor Kari Tammi
Advisor: Antti Lajunen, D.Sc. (Tech)

Aalto University, P.O. BOX 11000, 00076 AALTO
www.aalto.fi
Abstract of master's thesis
Author Heikki Laitinen
Title of thesis Improving electric vehicle energy efficiency with two-speed gearbox
Degree programme Master’s programme in Mechanical Engineering
Major/minor Machine design Code K3001
Thesis supervisor Professor Kari Tammi
Thesis advisor(s) Antti Lajunen, D.Sc. (Tech)
Date 29.5.2017 Number of pages 56+3 Language English
Abstract
Road transportation is one of the most significant carbon dioxide emission sources and about one tenth of European Union region emissions are produced by passenger cars. These emissions have been reduced successfully in Finland and also on European Union region and so far, the set goals have been reached. Car manufacturers have developed internal combustion engines which produce less emissions and this has reduced emissions of new registered cars. Nevertheless, there is limits to internal combustion engine development and emissions cannot be reduced infinitely with this development. Therefore, the number of cars using alternative fuels and energy sources has to grow. Electricity as an alternative fuel has been a choice in vehicle industry for a while. Limited driving range with a single battery charge has been a major barrier in electric vehicle fleet growth. Driving range can be extended by increasing battery capacity but there is volume, weight and cost boundaries that limit battery size. One option for increasing driving range is improving the energy efficiency of the electric vehicle when the on-board battery energy would be utilized more efficiently. This research focuses on improving electric vehicle energy efficiency with two-speed gearbox. Traditionally, the electric motor of an electric vehicle is coupled to driving wheels with a single-speed gearbox. Electric motor as a traction motor enables such drivetrain but with a single-speed gearbox the electric motor must operate in wide speed range. The use of wide speed range forces the motor to work in non-optimal speeds which effects on its energy efficiency. The possible energy efficiency improvement of electric vehicle with multi-speed gearbox is examined in this research. The benefits of two-speed gearbox were evaluated based on the simulation results provided by a developed simulation model. Evaluations were done by comparing the energy consumptions of the reference model to the model that utilizes a two-speed gearbox. Simulations also included an optimization study for determining the optimal gear ratios in order to minimize energy consumption. The results reveal that it is possible to improve energy efficiency with two-speed gearbox but it is heavily dependent on the motor efficiency map which in turn depends on the electric motor type. The benefit of a two-speed gearbox was slightly better in higher speed driving cycles.
Keywords Electric vehicle, energy efficiency, transmission, simulation

Aalto-yliopisto, PL 11000, 00076 AALTO
www.aalto.fi
Diplomityön tiivistelmä
Tekijä Heikki Laitinen
Työn nimi Sähköauton energiatehokkuuden parantaminen kaksiportaisen
vaihdelaatikon avulla
Koulutusohjelma Konetekniikan maisteriohjelma
Pää-/sivuaine Koneensuunnittelu Koodi K3001
Työn valvoja Professori Kari Tammi
Työn ohjaaja(t) TkT Antti Lajunen
Päivämäärä 29.5.2017 Sivumäärä 56+3 Kieli englanti
Tiivistelmä
Liikenne on yksi merkittävimmistä hiilidioksidipäästöjä aiheuittavista lähteistä ja Euroopan Unionin alueella noin kymmenesosa kaikista päästöistä on peräisin henkilöautoista. Liikenteen päästöjä on rajoitettu onnistuneesti ja asetettuihin tavoitteisiin on toistaiseksi päästy niin Suomen kuin Euroopan Unionin osalta. Ajoneuvovalmistajat ovat onnistuneet kehittämään entistä vähäpäästöisempiä polttomoottoreita, mikä näkyy uusien autojen päästöjen pienentymisenä. Polttomoottorien kehitykselle on kuitenkin rajansa eikä liikenteen päästöjä voi rajattomasti pienentää tämän kehityksen avulla, joten vaihtoehtoisia polttoaineita käyttävien ajoneuvojen määrää on lisättävä. Sähkö vaihtoehtoisena polttoaineena on ollut jo pitkää ajoneuvotekniikan käytössä. Sähköautojen merkittävän lisääntymisen esteenä on kuitenkin ollut suhteellisen lyhyt ajomatka yhdellä latauksella, mikä on vaikuttanut vahvasti kuluttajien ostopäätöksiin. Ajomatkaa voidaan kasvattaa akkukapasiteettia lisäämällä, mutta koko ja hinta rajoittavat akkukapasiteetin kasvua. Yksi keino saavutettavan ajomatkan lisäämiseksi on parantaa sähköauton energiatehokkuutta, jolloin yhä suurempi osa mukana olevasta energiasta hyödynnetään ajoneuvon liikuttamiseen. Tässä tutkimuksessa keskitytään sähköauton energiatehokkuuden parantamisen tutkimiseen kaksiportaisen vaihdelaatikon avulla. Perinteisesti sähköautoissa on käytetty kiinteällä välityssuhteella olevaa vaihdetta moottorin ja vetävien pyörin välillä. Voimanlähteenä sähkömoottori mahdollistaa kyseisen voimalinjan, mutta tällöin sähkömoottori toimii laajalla kierroslukualueella, jolloin se ei toimi sen parhaalla mahdollisella hyötysuhteella. Tässä tutkimuksessa tutkitaan simulointien avulla kaksiportaisen vaihteiston vaikutusta sähkömoottorin hyötysuhteeseen ja sen vaikutusta sähköauton energiatehokkuuteen. Tutkimus suoritettiin simulointimallilla, jonka avulla kaksiportaisen vaihteiston hyötyjä voitiin arvioida. Arviointi tehtiin vertailemalla energiankulutusta referenssimallin ja kaksiportaisen vaihteiston sisältävän mallin välillä. Työ sisälsi myös optimoinnin, jolla pyrittiin löytämään välityssuhteet energiankulutuksen minimoimiseksi. Työn tuloksista nähdään, että kaksiportaisen vaihteiston avulla saavutetaan parempi energiatehokkuus, mutta tulokset ovat voimakkaasti riippuvia käytettävän moottorin hyötysuhdekartasta, joka puolestaan riippuu moottorityypistä. Kaksiportaisen vaihteiston hyödyt tulivat paremmin esiin ajosykleillä, joissa on korkeampia ajonopeuksia.
Avainsanat Sähköauto, hyötysuhde, energiatehokkuus, vaihteisto, simulaatio

Preface This thesis is written to provide ideas and tools for further research and development of
electric vehicles. Henry Ford Foundation Finland provided financial support for this
research and I would like to thank them. I would also like to thank my supervisor
Professor Kari Tammi, who provided me the opportunity for this thesis topic and was
supporting through the whole project, and my instructor Antti Lajunen, who provided his
knowledge and expertise.
My parents have provided me an opportunity to study and practice my all other activities
to the full, and I would like to thank them for all their support and encouragement.
Lastly, I would like to remember my fellow students and friends who have been involved
in this journey. Without you studying would have been harder, but above all, more boring.
Espoo, May 29, 2017
Heikki Laitinen

Table of contents
Abstract
Tiivistelmä
Preface
Table of contents
Symbols
List of Abbreviations
1 Introduction ............................................................................................................... 1 1.1 Background ........................................................................................................ 1 1.2 Objectives ........................................................................................................... 2
1.3 Scope .................................................................................................................. 2 1.4 Methods .............................................................................................................. 2
2 State-of-art................................................................................................................. 3 2.1 Energy consumption of passenger vehicles ........................................................ 3
2.1.1 Conventional vehicles ................................................................................. 3 2.1.2 Hybrid vehicles ........................................................................................... 5 2.1.3 Electric vehicles .......................................................................................... 6 2.1.4 Energy consumption of commercial vehicles ............................................. 7
2.2 Driving cycles ..................................................................................................... 9 2.2.1 Driving conditions effect on energy consumption of EV ......................... 11
2.3 Electric motor as traction motor ....................................................................... 14
2.4 Electric motors in traction application ............................................................. 17
2.4.1 Induction motor ......................................................................................... 17 2.4.2 Permanent magnet synchronous motor ..................................................... 21 2.4.3 Switched reluctance motor ........................................................................ 25
2.5 Multi-speed transmissions ................................................................................ 28 2.6 Related research ............................................................................................... 29
3 Simulation model of an electric vehicle .................................................................. 32 3.1 Reference model ............................................................................................... 32
3.1.1 Efficiency map modelling ......................................................................... 36
3.2 Model with two-speed transmission ................................................................. 39 4 Results and analysis ................................................................................................ 40
5 Discussion ............................................................................................................... 48
References ....................................................................................................................... 49
Appendices

Symbols α = Angular acceleration
β = Road gradient
𝜌𝑎 = density of ambient air
Φ𝑎𝑟𝑚 = Armature flux
Φ𝑚𝑎𝑔 = Magnetic flux
𝜓𝑚= Stator winding flux linkage
𝐴𝑓 = Frontal area of the vehicle
𝑐𝑑 = Aerodynamic drag coefficient
𝑐𝑟 = Rolling friction coefficient
E = Electro motive force
𝐹𝑎 = Aerodynamic friction
𝐹𝑟 = Rolling friction
𝐹𝑔 = Gravitation force
𝐹𝑑 = Other disturbance forces
𝐹𝑡 = Traction force
𝐹𝐼 = Inertia force
G = Gravitation acceleration
𝐼𝑇 = Curren torque component
𝐼𝐹 = Curretn field component
𝐼𝑟= Rated current
𝐼𝑞= Quadrature axis current component
𝐼𝑑 = Direct axis current compon
𝑖𝑠𝛼= Current field component
𝑖𝑠𝛽 = Current torque component
i = Gear ratio
𝐽𝑟 =Transformed moment of inertia
𝐽𝑚𝑜𝑡 = Rotor moment of inertia
𝐿𝑟= Rotor inductance per phase
𝐿𝑑 = Direct axis winding inductance
𝐿𝑞 = Quadrature axis winding inductance
M = Mutual Inductance per phase
𝑚𝑣 = mass of the vehicle
𝑁𝑠= Synchronous speed
N = rotor speed
𝑃𝑎𝑢𝑥 =Auxiliary power
P = number of poles
r = Wheel dynamic radius
S = Slip
T = Torque
TR eff = Transmission efficiency
V = Voltage
v = velocity

List of Abbreviations
EU European Union
EV Electric vehicle
FHDS Federal highway driving cycle
FTP Federal test procedure
FUDS Federal urban driving cycle
HEV Hybrid electric vehicle
HWFET Highway fuel economy test
ICE Internal combustion engine
IM Induction motor
IPM Interior permanent magnet motors
J10-15 Japanese 10-15 cycle
NEDC New European driving cycle
PM Permanent magnet
PMSM Permanent magnet synchronous motor
SPM Surface permanent magnet motor
SOC State of charge
UDC Urban driving cycle
WLTP Worldwide Harmonized Light Duty Test Procedure

1
1 Introduction
1.1 Background
The growing concern of environment and slowing down the global warming has changed
the car fleet. This can be seen from the statistics that shows that in Finland the average carbon
dioxide emissions of new cars have decreased 26 percent from year 2006 to 2013 (Trafi
2014). This is a result of tightened European Union (EU) legislation and the same change
can be seen in the whole EU scale and goals has been set to further decrease emissions
(European Commission 2017a). This is reasonable, because about one fifth of EU’s carbon
dioxide emissions are contributed by cars and transportation is the only main sector in which
these emissions are still growing (European Commission 2017b).
Based on Eurostat statistics, 2015, it can be stated that the reduction of new registered cars
emissions is based on the improved internal combustion engine (ICE) technology. Statistics
shows that in 2013 only 4 percent of new registered cars used alternative fuels. In the
statistics, alternative fuels are referred as liquefied petroleum gas, natural gas, electricity and
other alternative fuels. Even when hybrid cars are taken into account the majority on new
registered cars are powered only with traditional fuels, diesel or petrol.
It is clear that in the future ICE technology will reach its limits and reduction of emissions
will saturate. This will lead to increasing need of cars using alternative fuels. European
commission, 2011, stated a goal that in 2050 conventionally fuelled cars will be phased out
of cities. In this case, conventionally fuelled cars are referred as non-hybrid vehicles using
internal combustion engines. Nevertheless, this will increase the need and importance of
electric vehicles (EV) as a crucial members of future car fleet.
One of the major difference between ICE vehicle and EV performance is the achieved
driving range. Nowadays ICE vehicles’ have superior range compared to EVs and this is one
of the main reasons why popularity of EVs have not raised. Although most of the daily
driving is done at urban areas and extensively long driving range is not that essential, driver
needs some certainty that car has enough range for whole day needs.
Improving the range of EVs would promote the popularity of them. Increase of range can be
done by growing the battery capacity, but the size, weight and cost sets limits for this.
Another way to enhance the performance of EV would be improving the energy efficiency
of the vehicle. Key component of the EV is the traction motor and allowing it to operate at
its best possible efficiency would be one way of improving EV’s energy efficiency. Åhman,
2001, estimated that total efficiency of electric motor and control system are only about 86
percent.
Traction motors used in EVs’ need to provide enough torque for acceleration and hill
climbing and power for high speed cruising. With suitable motor and reduction gear
combination sufficient driving characteristics are achieved and there is no need for multi-
speed transmission that is required with ICEs. (Ehsani, Yimin et al. 2003). In traction
application, electric motor uses wide speed range and thus it is not operating at optimal
efficiency (de Santiago, Bernhoff et al. 2012). These characteristics leads to an idea of multi-

2
speed transmission use in EV to improve its efficiency by moving the operating point of
electric motor to more efficient region.
1.2 Objectives
The main interest in this research is examining the effects of adding two-speed gearbox to
EV’s powertrain. As stated earlier, there is potential to improve EV efficiency by using
traction motor at its optimal area of efficiency. In addition, inverter and its efficiency is also
considered in this research because it is also dependent on the operating point. Energy
consumption comparison between fixed gear ratio gearbox and two-speed gearbox is done
and effect to the overall EV energy efficiency is examined.
Another objective is to examine whether introducing two-speed gearbox reduces the driving
cycle dependent energy consumption. This means that with properly selected gear ratios the
electric traction motor and inverter would operate on their optimal operating area despite the
used driving cycle and the losses caused by the motor and inverter would be independent
from the driving cycle. An optimization study is required to determine the best suitable gear
ratios to achieve energy savings in different driving cycles.
1.3 Scope
This research focus on passenger car size EV which has two-speed gearbox in its drivetrain.
Only the two-speed gearbox’s effect on the traction motor and inverter behaviour and the
effect on the overall energy efficiency of the EV is considered. Most suitable gear ratios to
be used in various driving cycles are found. The possible weight increase and multi-speed
gearbox’s efficiency are taken into account. On the other hand, friction losses of the clutch
during the gear change and costs of implementing of the multi-speed gearbox, are ignored.
1.4 Methods
The effect of multi-speed gearbox in EV powertrain is evaluated with simulations.
Simulation is carried out with Matlab/Simulink and reference model, that is equivalent to
real life EV with single-speed gearbox, is created. After the reference model is verified to
match real life EV at sufficient accuracy, the model can be developed further by adding two-
speed gearbox to it.
The evaluation of two-speed gearbox effect to EV’s energy efficiency can be done by
comparing developed model to a reference model. Comparison of energy consumption
between driving cycles is done and traction motor operating points during cycles are plotted
to the efficiency maps. Also, the losses of motor and inverter in different driving cycles are
determined to explore the cycle dependent losses. At the end, evaluation of multi-speed
gearbox utility in EV’s drivetrain is done.

3
2 State-of-art
2.1 Energy consumption of passenger vehicles
The efficiency of drivetrain is determined by the efficiency of its individual components. In
this section, the losses in powertrain of conventional, hybrid and electric vehicles are gone
through and methods of improving efficiency are explored. In addition, different types of
state-of-art passenger vehicles’ energy consumptions are compared.
2.1.1 Conventional vehicles
ICE and gearbox are the main components of internal combustion engine -based propulsion
system. In addition to these, clutches or torque converters and auxiliaries are needed to
operate the propulsion system. These components have effect on the vehicle’s energy
efficiency but the ICE, and its torque and speed dependent efficiency, has the major role.
Figure 1 presents schematic power flow from tank-to-wheel of ICE vehicle. (Guzzella,
Sciarretta 2013, p. 36-37)
Figure 1. Power flow and component efficiencies in ICE vehicle (Guzzella, Sciarretta 2013, p. 36).
The efficiency of engine represents how efficiently the chemical energy of fuel is converted
to mechanical energy. The optimal operating region of ICE is usually at the middle of the
speed range at high torque, as shown in figure 2. Figure 2 also shows that typical spark
ignited ICE has relatively low peak efficiency and the area where it is achieved is small. As
the efficiency of the motor drops significantly when speed or torque are changed, the
operating points of the motor should be designed to be as close as possible to the efficient
region to achieve high operating fuel economy. (Ehsani, Yimin et al. 2005, p. 72-73).

4
Figure 2. Efficiency map of typical spark ignited ICE (Ehsani, Yimin et al. 2005, p. 73).
The operating points of ICE can be adjusted by selecting sufficient gear ratios of gearbox.
The selection of gear ratios is also done to meet the sufficient operating characteristics of the
vehicle e.g. the maximum speed. The gearbox causes losses and the efficiencies of different
transmission are introduced in chapter 2.5. (Guzzella, Sciarretta 2013, p. 51-55).
In ICE powered cars, engine and transmission has to be kinematically decoupled, when
engine and vehicle speed are not the same. In practise this is done with friction clutch in cars
with manual transmission and with torque converter in cars with automatic transmission.
The friction clutch produces most of its losses during the first acceleration phase i.e. when
the vehicle speed is increased from the zero. The torque converter used with automatic
transmissions is hydraulic device and it produces losses when it is not locked up. (Guzzella,
Sciarretta 2013, p. 55-57)
It is evident that by improving efficiency of individual components, it is possible to improve
the energy efficiency of the vehicle. Guzzella and Sciarretta, 2013 p. 63-65, also propose
that reduction of weight, aerodynamic drag and rolling friction are methods to decrease
energy consumption. In addition to these they suggest that downsizing the combustion
engine would naturally increase the relative load of the engine and thus shift the operating
point to more efficient region. This operating point shifting can be done with hybridization
which also enables kinetic energy recovery. The hybridization and its benefits are presented
in the following chapter.

5
2.1.2 Hybrid vehicles
Hybrid electric vehicle (HEV) uses two different power sources, most commonly ICE
powered by petrol or diesel and electric motor drive. Due to use of multiple power sources,
there is different alternatives for HEVs’ powertrain topology. Different topology alternatives
are series hybrid, parallel hybrid and series-parallel hybrid. (Ehsani, Gao et al. 2007).
In series hybrid drivetrain, the traction to wheel is produced only with electric motor. This
configuration produces energy to battery with ICE and generator, which the electric traction
motor utilizes. In parallel configuration both ICE and electric motor are used to produce
torque for driving wheels. The third version, series-parallel drivetrain, combines the two
earlier versions. This adjustment requires two electric motors and the other works also as a
generator. ICE power can be split to produce traction or to power generator. In figure 3
schematic series-parallel drivetrain used in Toyota Prius is presented. (Ehsani, Gao et al.
2007)
Figure 3. Series-parallel hybrid powertrain (Ehsani, Gao et al. 2007).
The only electric-mode of HEV can be added with plug-in option. Plug-in hybrid electric
vehicle (PHEV) battery can be charged from the grid and thus it can be operated like EV.
(Chan 2007). The interest of PHEV by car manufacturers has been growing and there is
many of this type of vehicles commercially available.
Combining the advantages of EV and ICE vehicle, has been one of the main motivations in
HEV development. Downsizing the engine in conventional vehicle lower the energy
consumption but it also effects on the maximum power and thus characteristics of the
vehicle. With the use of hybridization, the maximum power requirement can be achieved
with the help of the electric motor while the ICE can be downsized. Also, recuperation is
possible with HEVs as earlier mentioned and the idling consumption of the ICE can be
eliminated by turning the engine off while power from it is not required. These
improvements are achieved with adding components and thus weight, which may counteract
the achieved energy savings. (Guzzella, Sciarretta 2013, p. 70).

6
The losses in mechanical drivetrain was discussed in earlier chapter with ICE vehicles. The
fact that all hybrid configurations have both mechanical and electrical power flow paths,
means that also losses in electric powertrain has to be concerned.
2.1.3 Electric vehicles
There are many different possibilities for EV drivetrain topology. Used traction motor
defines the need for possible gearbox and the number of traction motors per driven axle
determines the need of differential (Ehsani, Yimin et al. 2005, p. 99-102). Schematic EV
powertrain with single-speed reduction gear is presented in figure 4 and it shows that from
the motor to wheels the powertrain is mechanical and thus components used are similar to
conventional vehicles.
The energy storage of EV is usually an electrochemical battery, often referred only as
battery. During charging the energy from the grid is converted to a potential chemical energy
and during discharging the chemical energy is converted back to electric energy. The specific
energy, the energy capacity per unit battery weight (Wh/kg), is dependent on the battery
type. The battery discharge and charge efficiency is dependent on the type, but also on the
state of charge (SOC) of the battery. Usually the discharging efficiency is at its highest at
high SOC values and it decreases with the SOC. (Ehsani, Yimin et al. 2005, p. 300-309).
Nissan Leaf uses Lithium-ion batteries (Nissan Motor 2017) and according to Ehsani, Yimin
et al., 2005 p. 208, these batteries have specific energy of 80-130 Wh/kg and efficiency
above 95%. On the other hand, Hannan, Hoque et al., 2017, suggest same quantity of specific
energy but efficiency only from 75% to 85%.
The energy is supplied from the battery to the motor via motor controller and inverter that
provides sufficient waveform for the motor. The efficiency of inverter is high, usually around
97%, but a solution to provide 99% efficiency has also been reported (Johnson 2016). The
main component of the EV is of course the electric motor. The efficiency of the motor is
dependent on the torque and speed. The type of motor defines the efficiency of the motor
and different types of motors are presented later in this work. It is notable, that electric
motors have significantly better efficiency than ICEs, but they also have limited region for
maximum efficiency.
Figure 4. Schematic EV powertrain (Larminie, Lowry 2012, p. 20).
7
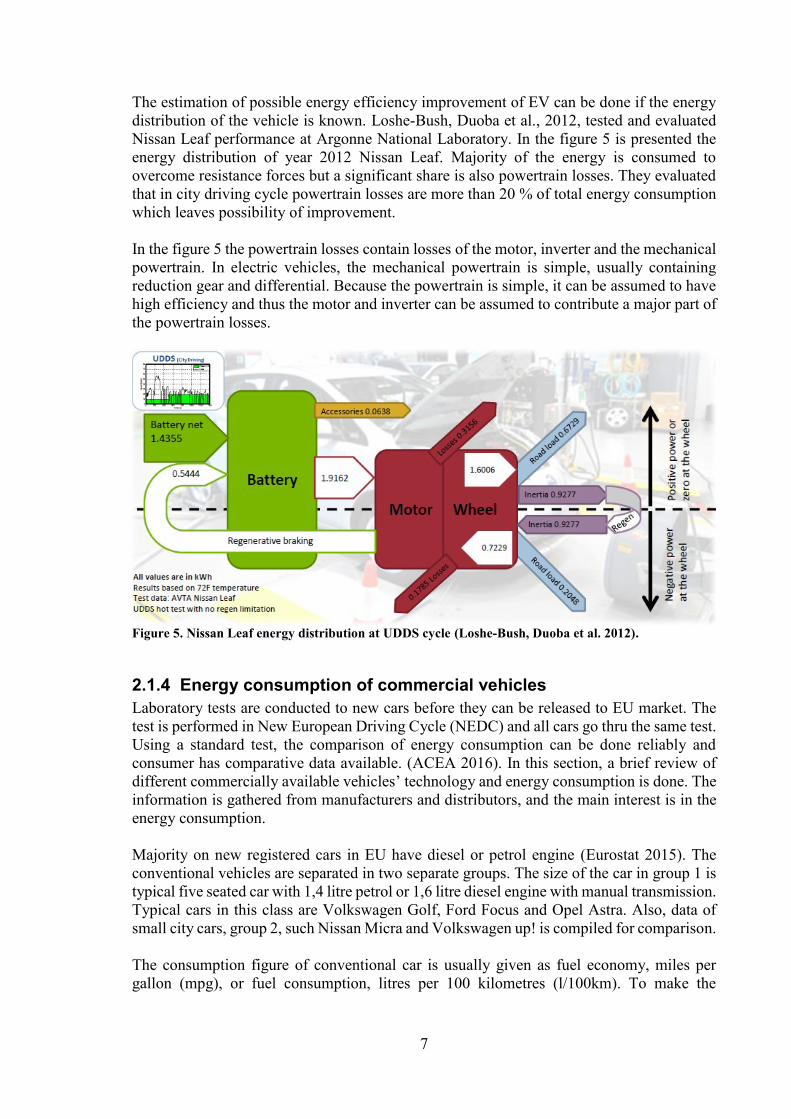
The estimation of possible energy efficiency improvement of EV can be done if the energy
distribution of the vehicle is known. Loshe-Bush, Duoba et al., 2012, tested and evaluated
Nissan Leaf performance at Argonne National Laboratory. In the figure 5 is presented the
energy distribution of year 2012 Nissan Leaf. Majority of the energy is consumed to
overcome resistance forces but a significant share is also powertrain losses. They evaluated
that in city driving cycle powertrain losses are more than 20 % of total energy consumption
which leaves possibility of improvement.
In the figure 5 the powertrain losses contain losses of the motor, inverter and the mechanical
powertrain. In electric vehicles, the mechanical powertrain is simple, usually containing
reduction gear and differential. Because the powertrain is simple, it can be assumed to have
high efficiency and thus the motor and inverter can be assumed to contribute a major part of
the powertrain losses.
Figure 5. Nissan Leaf energy distribution at UDDS cycle (Loshe-Bush, Duoba et al. 2012).
2.1.4 Energy consumption of commercial vehicles
Laboratory tests are conducted to new cars before they can be released to EU market. The
test is performed in New European Driving Cycle (NEDC) and all cars go thru the same test.
Using a standard test, the comparison of energy consumption can be done reliably and
consumer has comparative data available. (ACEA 2016). In this section, a brief review of
different commercially available vehicles’ technology and energy consumption is done. The
information is gathered from manufacturers and distributors, and the main interest is in the
energy consumption.
Majority on new registered cars in EU have diesel or petrol engine (Eurostat 2015). The
conventional vehicles are separated in two separate groups. The size of the car in group 1 is
typical five seated car with 1,4 litre petrol or 1,6 litre diesel engine with manual transmission.
Typical cars in this class are Volkswagen Golf, Ford Focus and Opel Astra. Also, data of
small city cars, group 2, such Nissan Micra and Volkswagen up! is compiled for comparison.
The consumption figure of conventional car is usually given as fuel economy, miles per
gallon (mpg), or fuel consumption, litres per 100 kilometres (l/100km). To make the

8
consumption figures more comparable with HEVs and EVs, the consumption is converted
to kilowatt-hours per 100 kilometres (kWh/100 km). Energy consumption of different
conventional cars are compiled in the figure 6 (Ford Motor Company Limited 2017), (Kia
Motors Finland 2017), (Opel 2017), (Toyota Auto Finland OY 2017a), (VV-Auto Group OY
2017a), (Ford Motor Company Limited 2016), (Nissan 2016), (Toyota Auto Finland OY
2016), (VV-Auto Group OY 2017b). The conversion from consumption l/100 km to
kWh/100km is done with an assumption that energy density of petrol is 33.87 MJ/litre and
diesel 37.18 MJ/litre (Neutrium 2014).
Information of HEVs and PHEVs are also compiled in figure 6. (Automobiles Peugeot
2015), (Toyota Auto Finland OY 2017a), (Kia Motors Finland 2016a), (VV-Auto Group OY
2015), (Kia Motors Finland 2016b), (Mitsubishi Motors Corporation 2015), (Toyota Auto
Finland OY 2017b), (Veho OY AB 2017), (Länsiauto 2017b),(Länsiauto 2017a).
The energy consumption of discovered EVs are also in figure 6 (Nissan Motor
2017),(Volkswagen 2017), (Mitsubishi Motors North America, Inc 2017), (Renault Suomi
2015), (Kia Motors Europe 2017). Tesla only provided the achieved range on NEDC, not
the energy consumption and thus it is not included in the figure 6 (Tesla 2017a), (Tesla
2017b), (Tesla 2017c). The more detailed info of vehicles, including Tesla Model S, are
presented in the appendix 1. As the appendix 1 shows, the official achievable range varies
between different EVs from Tesla’s 403 km to VW up! and Mitsubishi I-MIEV 160 km.
This difference is directly comparable with the battery capacity. All the electric vehicles
presented in the appendix 1 had single gear transmission and one electric motor, except Tesla
that provides also 4-wheel drive models which has one motor per axle.
Figure 6. Different car types and models’ energy consumption announced by manufacturers and
gathered from manufacturers and distributors.
Energy consumption of both types of hybrids are generally lower than conventional vehicles.
Research also revealed that most of the manufacturers rely on plug-in technology. It is
reasonable and comparison between HEVs’ and PHEVs’ energy consumption shows the
difference clearly. Most clearly this difference can be seen when Toyota’s models, Prius
HEV and PHEV with similar ICE and electric motor sizes, are compared. Interesting things
to be noticed are that EVs and PHEVs have similar energy consumptions and some PHEVs
9
have even lower. Another thing to notice from appendix 1 table is that most of the
manufactures rely on Permanent magnet synchronous motor (PMSM), tesla being the only
one to use induction motors (IM).
2.2 Driving cycles
As earlier mentioned in this work, laboratory tests are conducted to new cars before they can
be released to EU market. For light-duty vehicles, the tests are conducted in power-absorbing
chassis dynamometer. Dynamometer rollers are adjusted to simulate losses of driving
resistances. Energy consumption is measured as the vehicle progress through a driving cycle
that is pre-defined and designed to represent real-world driving conditions. (Barlow, Latham
et al. 2009).
In the laboratory test a test driver is operating the car i.e. controls the gas and brake pedals.
The speed profile is displayed on a monitor and the driver follows it. For vehicles with
manual transmission the requested gear changes are also signalled on the monitor. The driver
is expected to follow the reference speed within pre-specified error bands. (Guzzella,
Sciarretta 2013, p. 21).
Emissions and thus energy consumption depend on many parameters. These parameters
include vehicle dependent, such as model, type, size, fuel type and technology level, and
operational factors such as acceleration, speed, road gradient and gear selection. The variety
of parameters lead to several driving cycles developed for specific vehicle types such as cars
and trucks. (Barlow, Latham et al. 2009).
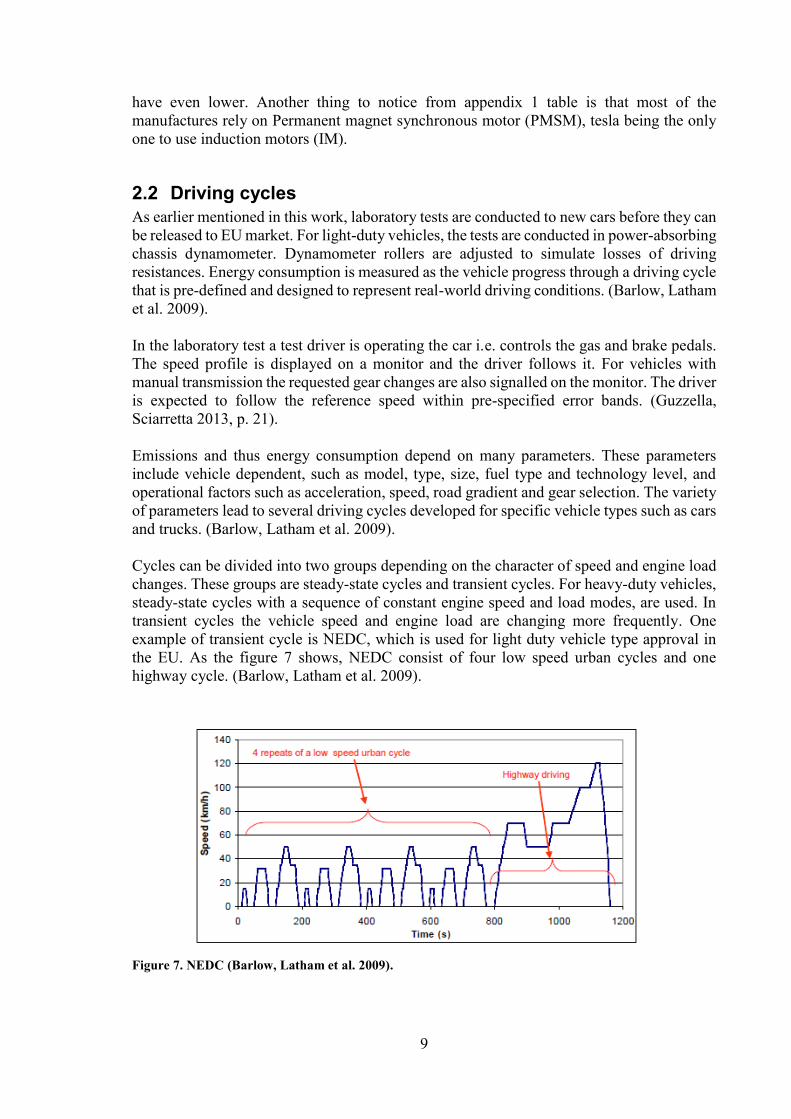
Cycles can be divided into two groups depending on the character of speed and engine load
changes. These groups are steady-state cycles and transient cycles. For heavy-duty vehicles,
steady-state cycles with a sequence of constant engine speed and load modes, are used. In
transient cycles the vehicle speed and engine load are changing more frequently. One
example of transient cycle is NEDC, which is used for light duty vehicle type approval in
the EU. As the figure 7 shows, NEDC consist of four low speed urban cycles and one
highway cycle. (Barlow, Latham et al. 2009).
Figure 7. NEDC (Barlow, Latham et al. 2009).

10
In addition to NEDC, there is several other driving cycles. To simulate urban driving the
federal urban driving cycle (FUDS) is used in the United States and for extra urban
conditions federal highway driving cycle (FHDS) is used. Like NEDC, the federal test
procedure (FTP-75) is combination of urban FUDS and extra urban FHDS cycles. (Guzzella,
Sciarretta 2013, p.21).
The variety of used driving cycles in Europe, Unites States and Japan has lead a development
of Worldwide Harmonized Light Duty Test Procedure (WLTP) (Guzzella, Sciarretta 2013,
p. 22). The figure 8 represents the WLTP speed trajectory. When comparing the NEDC and
WLTP trajectories it can be seen that WLTP has no constant speed zones thus it imitates real
driving behaviour of drivers. Figure 9 shows a driving cycle which is based on real world
driving data.
Figure 8. WLTP driving cycle (Guzzella, Sciarretta 2013, p. 23).
Figure 9. A real-world cycle (Barlow, Latham et al. 2009).

11
2.2.1 Driving conditions effect on energy consumption of EV
It is evident that the selected driving cycle has significant influence on vehicle’s energy
consumption. Energy is consumed to overcome driving resistances which are dependent on
the vehicle physical properties, acceleration, speed and road conditions. Badin, Le Berr et
al., 2013, evaluated the factors that influence on EV’s energy consumption. Figure 10 shows
the result of driving speed influence on energy consumption.
Figure 10. Vehicle speed relation to energy consumption (Badin, Le Berr et al. 2013).
Badin, Le Berr et al., 2013, simulated a EV with a mass of 1250 kg and it had an electric
motor with peak power of 43kW. As the figure 10 shows the vehicle has lowest energy
consumption at speed around 20 km/h. Below this the energy consumption rises due to
auxiliaries and above this point consumption is affected by the increasing vehicle losses due
to increasing speed.
The power consumption of auxiliaries is strongly dependent on the operating temperature of
the vehicle. In hot environment air conditioner is used to cool down the temperature inside
the cabin and in cold environment the cabin has to be warmed up. The cold operating
environment also increases the internal resistance of the battery, which degreases the
efficiency of the battery. (Yuksel, Michalek 2015). The effect of cold climate to battery
performance can be reduced by implementing active thermal management system to warm
up the battery pack at cold conditions (Delos Reyes, Parsons et al. 2016).
Delos Reyes, Parsons et al., 2016, evaluated the operating temperature effect on the EV
operating range. Figure 11 shows their results for Nissan Leaf, which had winter package to
improve drivers comfort and battery performance at cold conditions. As the figure 11 shows,
the difference between optimal warm conditions to cold conditions is significant. The results
also show the effect of air conditioner use during driving.

12
Figure 11. Nissan Leaf operating range in different driving temperatures (Delos Reyes, Parsons et al.
2016).
Acceleration has also significant influence on the energy consumption and Badin, Le Berr
et al., 2013, examined this. They examined the driver’s aggressiveness impact which
correlates with the acceleration of the vehicle. In their simulations acceleration varied from
0.38 𝑚/𝑠2 to 1.03 𝑚/𝑠2 and as figure 12 shows, aggressive behaviour has also significant
impact on the energy consumption.
Figure 12. The impact of acceleration on energy consumption (Badin, Le Berr et al. 2013).

13
The speed characteristics of driving cycle influences on the EV’s electric motor’s operating
points. Because the electric motor has different efficiencies on different working points,
driving cycle has effect on electric motor’s efficiency. The driving cycle dependent
efficiency was examined by Ji, Xu et al., 2009,.
Figure 13. Electric motor working points and efficiencies on four different driving cycles: NEDC (a),
EUDC (b), FTP (c) and CONST (40 km/h) (d) (Ji, Xu et al. 2009).
From the figure 13 can be seen the driving cycle effect on the operating points of the electric
motor. In the NEDC and EUDC the working points are at same level of torque and the speed
of the motor varies. In FTP the operating points are more scattered and wider range of torque
is used. Constant has obviously only one point. Based on the efficiency maps and working
points Ji, Xu et al, 2009, calculated the average electric motor efficiency for each cycle, table
1, which shows the variation of motor efficiency between cycles.
Table 1. Energy efficiency of electric motor on different driving cycles (Ji, Xu et al. 2009).
Ji, Xu et al, 2009, proposed that due to different operating conditions, the electric motor
parameters could be chosen based on driving cycle. Driving cycle based optimisations of
electric motor was done by Chen, Wang et al., 2013,. They performed optimization for
surface mounted permanent magnet synchronous machine (SPM) against NEDC, Artemis
Drving cycle
NEDC 0.8414
EUDC 0.8613
FTP 0.8036
CONST 0.9
𝑚

14
Urban Driving Cycle (ARTEMIS) and NEDC/ARTEMIS combined cycles. In figure 14
efficiency maps for NEDC and ARTEMIS optimized motors are presented.
Figure 14. Efficiency maps of NEDC (left) and ARTEMIS (right) optimized electric motors (Chen, Wang
et al. 2013).
As it can be seen from the figure 14, there is some difference between motors’ behaviours.
According to Chen, Wang et al., 2013, the difference in energy consumption against different
driving cycles with permanent magnet (PM) machine are relatively small because PM
machines have relatively good efficiency over wide speed range. The NEDC optimized
motor requires less PM in its construction making it more suitable in that sense.
2.3 Electric motor as traction motor
According to Ehsani, Yimin et al., 2005 p. 34, ideal characteristic of vehicle’s traction motor
is constant power output over full speed range, in other words torque varies hyperbolically
with speed as shown in figure 15a. Wide constant power characteristics provide high tractive
effort at low speeds where it is needed for acceleration, gradeability and drawbar pull.
The use of ICE as vehicle’s power plant requires a multi-speed transmission because the
torque characteristics of ICE are far from ideal described above. With electric motor the case
is opposite as can be seen from the figure 15b. The figure 15b presents typical characteristic
of electric motor. The motor starts with zero speed and it increases until base speed, where
voltage reaches its rated value while flux remains constant. Beyond this point the increase
in speed is achieved by keeping the voltage constant but weakening the flux. (Ehsani, Yimin
et al. 2005, p. 34-36). This constant power zone is also referred as flux-weakening zone
(Zhu, Howe 2007).

15
Figure 15. Ideal characteristics of traction motor (a) and typical electric motor characteristics (b)
(Ehsani, Yimin et al. 2005, p. 34-36).
Industrial electric motors are designed to be used in typical operating point. Typical motor
can supply continuous torque from zero to rated torque and this variable torque can be
delivered at all speeds up till rated speed. These rated conditions can be exceeded but
typically with industrial motors the overload torque and maximum speed are only twice the
rated value and the maximum operating efficiency is optimized to be achieved at rated
conditions. Industrial motors do not provide sufficient characteristics for traction motor use
and this is why traction motors are considered as an individual class. (Chan, Chau 2001, p.
69)
One of the important characteristic of variable speed electric motor is a speed ratio. The
speed ratio is defined as ratio of motor’s maximum speed versus the base speed. Importance
of speed ratio, especially with traction motors, is illustrated in figure 16 where 60 kW
motor’s torque-speed characteristics with different speed ratios are shown. As it can be seen,
the maximum torque, and thus vehicle’s acceleration and gradeability, is increased with
motor that have long constant power region i.e. high speed ratio. High speed ratio motor also
enables the use of single-gear transmission in EV’s powertrain making it more simple and
robust. (Ehsani, Yimin et al. 2005, p. 103-105).
Figure 16 . 60 kW electric motor’s characteristics with different speed ratios (Ehsani, Yimin et al. 2005,
p. 104).
16
Higher speed ratios also reduce the required power rating of the traction motor. The relation
between motor power and speed ratio is illustrated in table 2. For the case in table 2, the
motor requirements were: maximum motor speed 10 000 rpm and maximum vehicle speed
160 km/h. As the table 2 shows, the power requirement of the motor reduces significantly
up to speed ratio 4 and speed ratio of 6 almost halves the required power. (Ehsani, Rahman
et al. 1997)
Table 2. Required motor rated power relation to speed ratio (Ehsani, Rahman et al. 1997).
In addition to above mentioned characteristics electric traction motors should also fulfil
some other demands. The use in vehicle application requires good overall efficiency over
wide speed range and high power density to reduce total vehicle weight. Vehicular
application also means installation in harsh conditions so tolerance against high
temperatures, weather and vibrations are required. (Chan, Chau 2001, p. 69)
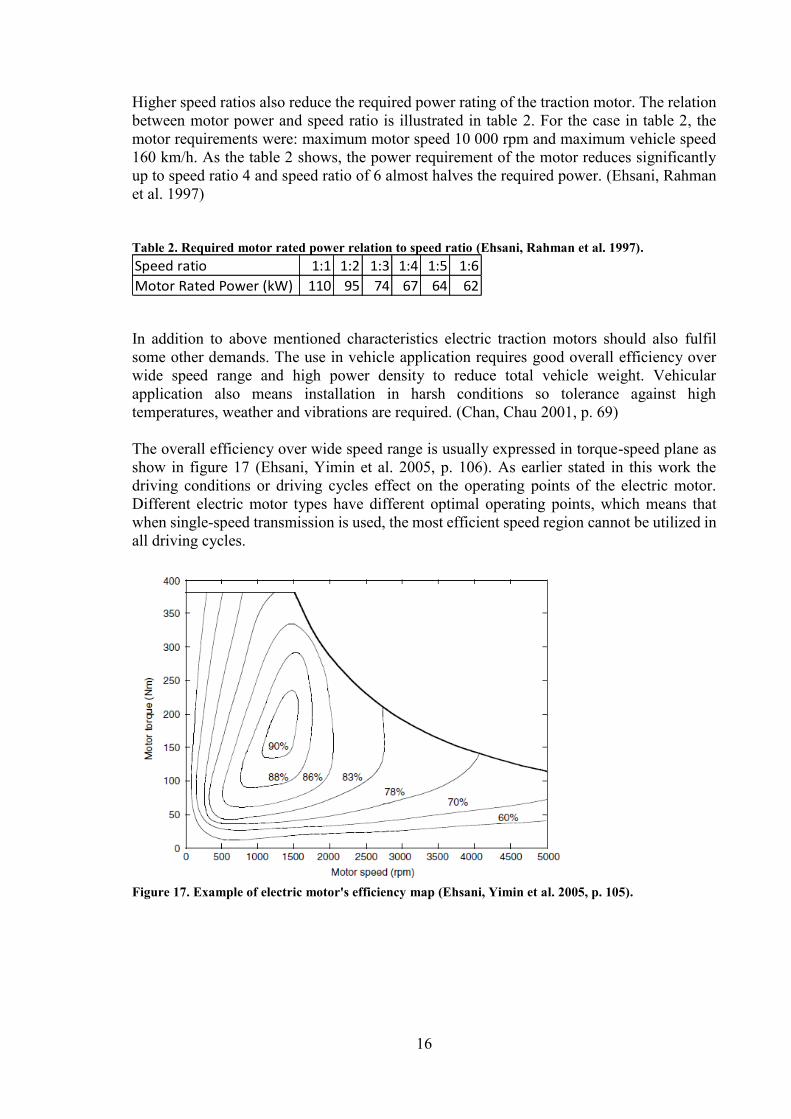
The overall efficiency over wide speed range is usually expressed in torque-speed plane as
show in figure 17 (Ehsani, Yimin et al. 2005, p. 106). As earlier stated in this work the
driving conditions or driving cycles effect on the operating points of the electric motor.
Different electric motor types have different optimal operating points, which means that
when single-speed transmission is used, the most efficient speed region cannot be utilized in
all driving cycles.
Figure 17. Example of electric motor's efficiency map (Ehsani, Yimin et al. 2005, p. 105).
Speed ratio 1:1 1:2 1:3 1:4 1:5 1:6
Motor Rated Power (kW) 110 95 74 67 64 62

17
2.4 Electric motors in traction application
In this section three types of electric motor are discovered: Induction motor (IM), permanent
magnet synchronous motor (PMSM) and switched reluctance motor (SRM). These types are
selected based on the market research done, which revealed that most of the manufactures
use PMSM. IM is chosen because it can be considered maybe the most mature technology
among electric motors and because one of the top brand EV utilizes it. Lastly SRM is
presented due to increasing interest among researchers to use it in EV application.
2.4.1 Induction motor
IMs can be categorized into two types according to their rotor construction: wound-rotor and
squirrel-cage motor. Wound-rotor type motor requires maintenance, it has high cost and it
suffers lack of sturdiness, thus it is not as attractive for EV propulsion. (Ehsani, Yimin et al.
2005, p. 155). For the reasons mentioned above, only squirrel-cage rotor IMs are considered
in this work and thus when speaking about IM, squirrel-cage type is considered.
Figure 18. two-pole IM construction (Ehsani, Yimin et al. 2005, p. 156).
In figure 18, a cross section of IM is shown. IM consist of two parts, rotor and stator. Three
phase windings are inserted into slots of stator inner periphery and the turns of each winding
are distributed to create approximately sinusoidal flux density to the air gap when current is
applied to windings. (Ehsani, Yimin et al. 2005, p. 156). Rotor core consist of stacked silicon
steel laminations. These laminations have evenly spaced slots on the outer periphery in
which typically aluminium or copper conductor bars are inserted. These conductor bars are
joined together in both ends which gives the name squirrel-cage, figure 19. (Hughes, Drury
2013, p. 155-156)
Figure 19. Squirrel-cage rotor construction (Hughes, Drury 2013, p. 155).

18
The basic operating principle of IM relies on the currents that are induced to the rotor by the
rotating magnetic field of the stator. Each of the stator phase is fed with sinusoidal current
with frequency ω and phase difference 120º between each current. Each phase creates
moving magnetic field and together they produce resultant moving magnetic field of the
stator which is rotating at angular velocity of ω in case of two pole stator, figure 18. (Ehsani,
Yimin et al. 2005, p. 156-157).
The torque production of the IM depends on the slip. Slip speed is the relative velocity
between the rotor and the stator field, which is also referred as synchronous speed. Usually
slip s is expressed as ratio as presented in equation (1), where N is the speed of the rotor and
𝑁𝑠 is the synchronous speed. If slip is 0, the rotor speed is same as synchronous speed and
corresponding slip of 1 means that rotor is stationary. (Hughes, Drury 2013, p. 156-157).
𝑠 = 𝑁𝑠−𝑁
𝑁𝑠 (1)
The slip in torque production of IMs is important because the induced electro motive force
(e.m.f.) of the rotor is directly proportional to slip. If slip is 0, no e.m.f. is produced and when
the rotor is stationary, at slip of 1, induced e.m.f. is at its maximum. The voltages, that are
induced in the short-circuited rotor bars, drive currents in the bars. These axial currents of
rotor bars create the driving torque of the motor by interacting with the radial flux wave. The
rotor is rotating to the same direction as the rotating field so it is dragged by the field. The
expression asynchronous with induction machines comes from the fact that motor action is
only possible if the rotor speed is less than synchronous speed. (Hughes, Drury 2013, p. 157-
158).
Figure 20 presents torque relation to slip in IM with constant voltage and frequency. At the
slip of 1, the torque produced is starting torque. The torque rises approximately linearly from
stationary condition to rated slip 𝑠𝑚 where the produced torque is at its maximum. If rotor
speeds up after rated slip, produced torque reduces until slip is zero. At high slips the induced
currents are also high and it may cause overheating of the motor. With fixed voltage and
frequency, the IM is not suitable as traction motor because of its low starting torque, limited
speed range and unstable operation at slip values above rated slip. (Ehsani, Yimin et al. 2005,
p. 161).
Figure 20. IM torque to slip relation with constant voltage and frequency (Ehsani, Yimin et al. 2005, p.
161).

19
To achieve torque-speed characteristics applicable for traction, figure 15, the characteristics
of IM can be enhanced. The characteristics can be enhanced by simultaneously varying the
voltage and frequency. This control is also known as constant volt/hertz control. (Ehsani,
Yimin et al. 2005, p. 162). In constant volt/hertz control the voltage/frequency (V/f) ratio,
the flux, is kept constant until the rated voltage and frequency of the motor i.e. until the base
speed. Beyond the base speed, at the constant power region, voltage is kept constant and the
flux is weakened by increasing the frequency. Figure 21 presents the concept of constant
volt/hertz control. The low frequency performance is affected due to rotor resistances and it
can be improved with voltage-boost. (Hughes, Drury 2013, p. 209-211).
Figure 21. Constant volt/hertz control (Hughes, Drury 2013, p. 210).
Inverter is used to vary the voltage and frequency, but it also limits the current. The current
limit of the inverter is set at the rated current of the motor to prevent overheating. With
modern control, which is presented later, the current limits the permissible torque and it
allows some controlled exceeding of current limit for peak torque demand. In the constant
torque region rated torque is usually half of the pull-out torque that the motor can provide.
(Hughes, Drury 2013, p. 211-212).
Although, IM speed range can be extended with constant volt/hertz control, it does not
provide suitable characteristics for EV application. The main reasons for this are poor
response to frequent and fast speed varying. Field oriented control (FOC) has been
developed to overcome the limitations of constant volt/hertz control. (Ehsani, Yimin et al.
2005, p. 166).
FOC relies on the transformation of IM’s mathematical model. The stationary reference
frame is transformed to synchronously rotating frame. In the transformed frame the
variables, such as supply voltage, stator current, rotor current and flux linkage can be
expressed by dc quantities. In figure 22 is shown synchronously rotating α-β frame, where
flux linkage vector is chosen to be coincident with the α-axis. In the figure 22 𝑖𝑠𝛼 and 𝑖𝑠𝛽 are
stator currents and 𝜆𝑟 is rotor flux linkage. The obtained motor torque is following:

20
𝑇 =3
2𝑝
𝑀2
𝐿𝑟𝑖𝑠𝛼𝑖𝑠𝛽 (2)
Where M is mutual inductance per phase, 𝐿𝑟 rotor inductance per phase and p the number of
pole pairs. The most important thing in the above equation is the similarity to separately
exited dc motor; 𝑖𝑠𝛼 being considered as field current and 𝑖𝑠𝛽 as the armature current. 𝑖𝑠𝛼
can be considered responsible for the air-gap flux and 𝑖𝑠𝛽 responsible for the motor torque.
Thus, with FOC, the torque of IM can be controlled by adjusting the torque component while
keeping the field component constant. (Chan, Chau 2001, p. 105-106).
In FOC, the flux linkage vector has to be aligned with the α-axis and thus the flux position
has to be known. The more used technology in EV applications is indirect method, where
the flux position is calculated to avoid applying vulnerable sensors to motor construction.
(Chan, Chau 2001, p. 106-107), (Ehsani, Yimin et al. 2005, p. 178).
Figure 22. Synchronously rotating α-β frame (Chan, Chau 2001, p. 105).
According to Xue, Cheng et al., 2008, and Ehsani, Yimin et al., 2003, properly designed IM
with FOC can achieve speed ratio of 3 to 5. Ehsani, Rahman et al., 1997, Suggested that
proper traction motor should have speed ratio from 4 to 6. On the other hand, Hall,
Ramamurthy et al., 2001, optimized the speed ratio of IM for electric vehicle and came out
with the ratio of 3. In addition to motor performance they took into account other factors,
such as increasing weight of the motor after speed ratio of 3. Based on these proceedings it
can be concluded that IM with FOC can provide suitable speed ratio for EV application.
As mentioned earlier, good overall efficiency over wide speed range is considered as an
advantage for a traction motor. Different motor types have different efficiency maps and
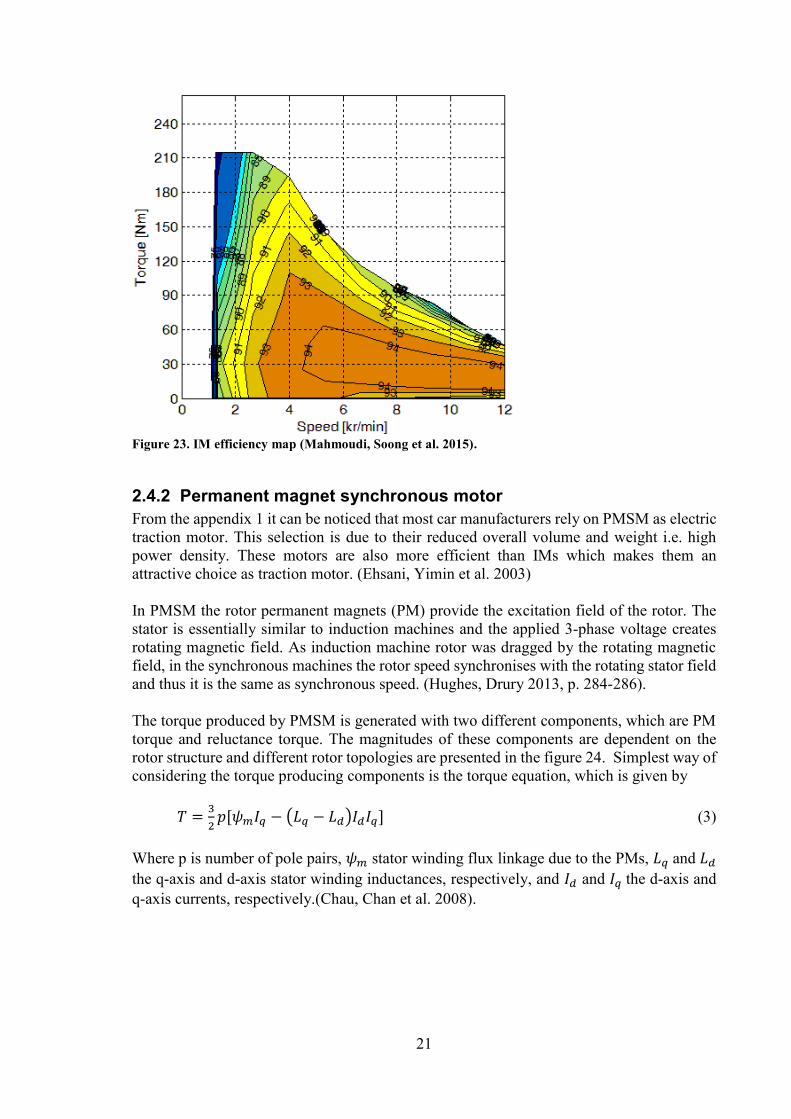
different optimal working points. Mahmoudi, Soong et al., 2015, determined the losses and
efficiency of and induction machine via finite element analysis. The motor rated power was
60 kW and maximum speed 12 000 rpm. The graph in the figure 23 suggest, that the most
efficient working points of IM are located at constant power region. Similar conclusions can
be done after referring the studies of Demmelmayr, Troyer et al., 2011, and Guan, Zhu et
al., 2014,.
21
Figure 23. IM efficiency map (Mahmoudi, Soong et al. 2015).
2.4.2 Permanent magnet synchronous motor
From the appendix 1 it can be noticed that most car manufacturers rely on PMSM as electric
traction motor. This selection is due to their reduced overall volume and weight i.e. high
power density. These motors are also more efficient than IMs which makes them an
attractive choice as traction motor. (Ehsani, Yimin et al. 2003)
In PMSM the rotor permanent magnets (PM) provide the excitation field of the rotor. The
stator is essentially similar to induction machines and the applied 3-phase voltage creates
rotating magnetic field. As induction machine rotor was dragged by the rotating magnetic
field, in the synchronous machines the rotor speed synchronises with the rotating stator field
and thus it is the same as synchronous speed. (Hughes, Drury 2013, p. 284-286).
The torque produced by PMSM is generated with two different components, which are PM
torque and reluctance torque. The magnitudes of these components are dependent on the
rotor structure and different rotor topologies are presented in the figure 24. Simplest way of
considering the torque producing components is the torque equation, which is given by
𝑇 =3
2𝑝[𝜓𝑚𝐼𝑞 − (𝐿𝑞 − 𝐿𝑑)𝐼𝑑𝐼𝑞] (3)
Where p is number of pole pairs, 𝜓𝑚 stator winding flux linkage due to the PMs, 𝐿𝑞 and 𝐿𝑑
the q-axis and d-axis stator winding inductances, respectively, and 𝐼𝑑 and 𝐼𝑞 the d-axis and
q-axis currents, respectively.(Chau, Chan et al. 2008).

22
Figure 24. PMSM rotor structures: a) Surface mounted. b) Surface inset. c) Interior radial. d) interior
circumferential. (Chau, Chan et al. 2008).
The reluctance torque component is dependent on the inductances i.e. the saliency of the
rotor (Chau, Chan et al. 2008). Both rotors of figure 25 are salient, because at direct axis, d-
axis, there is low permeability PMs on the flux path and the quadrature axis, q-axis, path is
entirely iron, thus the inductances are different (Schiferl, Lipo 1990). In addition to rotor
saliency, the PMs’ location inside the rotor provides mechanical protection and it allows
high-speed operation (Chau, Chan et al. 2008) but on the other hand interior mounted PMs
increase the complexity of manufacturing (Pellegrino, Vagati et al. 2012).
Figure 25. Salient PM rotors. a) interior mounted magnets. b) surface inset magnets. (Schiferl, Lipo
1990).
FOC can be applied also with PMSM. Figure 26 presents phasor diagrams of three operating
modes of FOC operated PMSM, with surface mounted PMs. In the case a, motor is working
at base speed and full torque. In this case stator current, I, has zero flux component and thus
the armature flux, Φ𝑎𝑟𝑚, is perpendicular to magnetic flux, Φ𝑚𝑎𝑔, which provides optimal
torque production condition. In case b, the motor is working at full torque and a half base
speed. Like in previous case, the stator voltage can be adjusted so that the current is in phase
with e.m.f (E) so it is working at the most efficient current. The magnitude of the magnetic
flux is the same as in case a and also current is at the same magnitude because full torque is
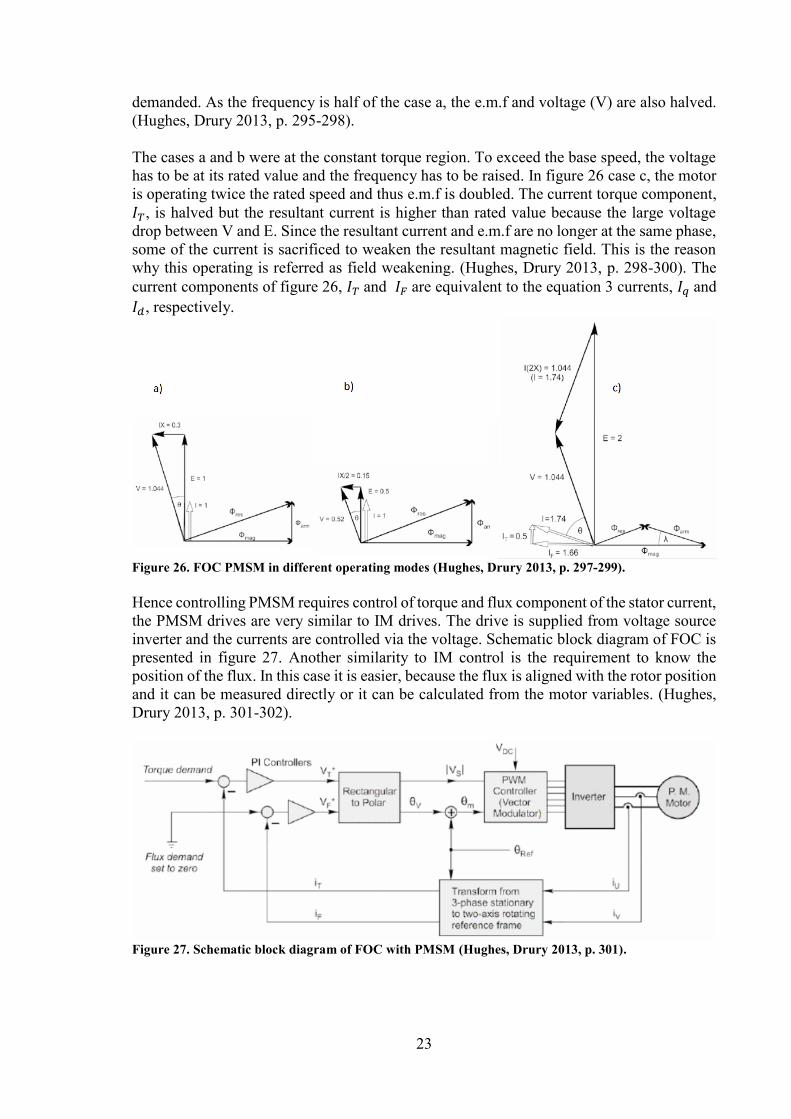
23
demanded. As the frequency is half of the case a, the e.m.f and voltage (V) are also halved.
(Hughes, Drury 2013, p. 295-298).
The cases a and b were at the constant torque region. To exceed the base speed, the voltage
has to be at its rated value and the frequency has to be raised. In figure 26 case c, the motor
is operating twice the rated speed and thus e.m.f is doubled. The current torque component,
𝐼𝑇, is halved but the resultant current is higher than rated value because the large voltage
drop between V and E. Since the resultant current and e.m.f are no longer at the same phase,
some of the current is sacrificed to weaken the resultant magnetic field. This is the reason
why this operating is referred as field weakening. (Hughes, Drury 2013, p. 298-300). The
current components of figure 26, 𝐼𝑇 and 𝐼𝐹 are equivalent to the equation 3 currents, 𝐼𝑞 and
𝐼𝑑, respectively.
Figure 26. FOC PMSM in different operating modes (Hughes, Drury 2013, p. 297-299).
Hence controlling PMSM requires control of torque and flux component of the stator current,
the PMSM drives are very similar to IM drives. The drive is supplied from voltage source
inverter and the currents are controlled via the voltage. Schematic block diagram of FOC is
presented in figure 27. Another similarity to IM control is the requirement to know the
position of the flux. In this case it is easier, because the flux is aligned with the rotor position
and it can be measured directly or it can be calculated from the motor variables. (Hughes,
Drury 2013, p. 301-302).
Figure 27. Schematic block diagram of FOC with PMSM (Hughes, Drury 2013, p. 301).

24
As earlier mentioned, most of the characteristics of PMSM are due to rotor construction.
This is also valid in case of field weakening capabilities. The maximum field weakening
capability is achieved, when following is fulfilled
𝐿𝑑𝐼𝑟
𝜓𝑚= 1 (4)
Where 𝐿𝑑 is the d-axis inductance, 𝐼𝑟 is the rated current and 𝜓𝑚 is the stator flux linkage
due to permanent magnets. Theoretically it is possible achieve infinite flux weakening
capability, when the ratio is 1, but usually the ratio is less. (Zhu, Howe 2007). Generally, the
better field weakening capabilities can be achieved with interior permanent magnet motors
(IPM) because the salient nature or their rotor (Soong, Ertugrul 2002) but field weakening
operation of surface permanent magnet motors (SPM) can be significantly improved with
introduction of stator with concentrated fractional-slot windings (EL-Refaie, Jahns 2005).
Pellegrino, Vagati et al., 2012, Compared the characteristics of IPMs and SPMs. They found
out, that SPM motor have poor overload capabilities at constant torque and none at constant
power whereas IPMs can achieve significant overload at constant torque and constant power.
Figure 28 compares these characteristics of IPM and SPM and provide also efficiency maps
for both of the motors. Both of the motors have same base speed, maximum speed,
continuous current and overload current. White line in figure 28 represent the rated current
performance.
Figure 28. Characteristics and efficiency maps of IPM (a) and SPM (b) (Pellegrino, Vagati et al. 2012).
Figure 28 suggest that both machines have high peak and overall efficiency, both
significantly better than induction machine, figure 23. The most efficient region is wider
with IPM and overall SPM has the optimal operating region at lower speeds. The
characteristic of IPM are more suitable for traction motor, but the complexity of
manufacturing is major drawback. SPM are easier to manufacture and the high efficiency at
low speeds are possible to be utilized with multi-speed transmission.

25
2.4.3 Switched reluctance motor
Switched reluctance motor (SRM) has many attractive characteristics that makes it a good
option for EV traction motor. SRM provides high efficiency over wide speed range in low
cost and rugged structure with simple control. (Ehsani, Yimin et al. 2005, p. 204). The
working fundament and torque production of SRM differ from the motors previously
presented and these are briefly gone through in this section.
Two typical constructions of SRM are presented in figure 29. The structure of SRM is
doubly-salient, which means that it has projecting poles in rotor and stator as well. The stator
consists of laminations and it has no windings or magnets, which makes it simple and easy
to manufacture. The stator has coils on each pole and they are grouped to form three phases
to be energized independently by 3-phase inverter. (Hughes, Drury 2013, p. 343-344).
As the motor name suggest, the torque is produced with reluctance method. The working
principle is same as the behaviour of an iron bar in a magnetic field: If the bar is suspended
to rotate freely, it will align itself with the field and it will turn if the direction of the field is
changed. (Hughes, Drury 2013, p. 320-321). The rotor of SRM acts like the iron bar and
when the stator coils are energized in right sequence it will rotate.
Figure 29. SRM motor with configurations 6/4 (a) and 8/6 (b) (Ehsani, Yimin et al. 2005, p. 205).
As in figure 29, SRM has usually unequal number of poles in rotor and stator. This
construction is crucial, because by this way it can be prevented that all the rotor poles are
aligned with stator poles and no torque can be produced. (Zabihi, Gouws 2016). The figure
29a motor is operated clockwise by energizing the coil in sequence A-C-B and anti-
clockwise with sequence A-B-C. The sequential operation causes torque ripple, vibration
and noise (Zhu, Howe 2007).
The motor construction i.e. the amount of rotor -and stator poles has significant influence on
the torque ripple. Petrus, Pop et al., 2010, studied three different usually used configurations,
6/4, 8/6 and 10/8, and found out that torque ripple can be reduced by increasing the number
of poles, figure 30. Increasing the number of poles also increase the available average torque,
as figure 30 shows. The torque ripple of 8/6 configuration could be degreased by introduction
of appropriate control strategy.

26
Figure 30. SRM topology relation to torque production (Petrus, Pop et al. 2010).
The continuous operation of SRM is considered as self-synchronous, which requires position
detection of the shaft (Hughes, Drury 2013, p. 344). Additional sensors always add
complexity and cost but also lower the reliability of the system operation. To avoid the
drawbacks of sensors, sensorless control is introduced also to SRM operation. Most of these
techniques rely on the changing magnetic status of the rotor i.e. the phase inductance is at
its highest value when rotor and stator poles are aligned and at unaligned position the
inductance is respectively lowest. (Ehsani, Yimin et al. 2005, p. 216-217).
The operation currents of SRM are usually discontinuous, thus currents are controlled by
pulse width modulation (PWM) (Zhu, Howe 2007). Rekik, Besbes et al., 2008, described
two classical operating modes of SRM, below and above base speed. Below the base speed
back e.m.f is lower than bus voltage and the phase current amplitude can be controlled with
PWM. The maximum torque is available when the rotor is at the unaligned position, i.e. the
rotor pole is between stator poles, and the phase current is at its rated value. Figure 31a
presents the below base speed waveforms for voltage and current.
The other operating mode that Rekik, Besbes et al., 2008, described is above base speed,
where increased back e.m.f limits the phase current. Back e.m.f limits the current because it
is bigger than the dc bus voltage due to increased rotor speed. To achieve high current, the
phase current is raised before the unaligned position. Because the back e.m.f limits the
current at high speed, the converter operates at single-pulse mode, as shown in figure 31b.

27
Figure 31. Current and voltage waveforms at low speed (a) and high speed (b) operation of SRM (Rekik,
Besbes et al. 2008).
SRM can achieve speed range up to 7, which is desirable for traction motor. As well as
torque characteristics, constant power operation characteristics are dependent on the motor
construction. The less poles in the motor, the wider constant power region can be achieved.
This means for 6/4 machines speed ratio up to 7 and 24/16 machines only to 2. The operation
characteristics of SRM can be also improved with control. Common practise to reduce torque
ripple and to extend constant power range is overlapping the phase excitation currents i.e.
the next phase is energized before the former is de-energized. (Zhu, Howe 2007).
Figure 32. 18/12 SRM efficiency map done with FEM analysis (Kiyota, Sugimoto et al. 2014)
The efficiency map of figure 32 suggest that SRM has good efficiency over wide speed range
(Kiyota, Sugimoto et al. 2014). Similar results were found out by Takeno, Chiba et al., 2012,
with their measurements of their prototype performance with similar construction. It has to
be noted that both of the previous researches focused on to develop competitive SRM against
IPM. Mokhtari, Tara, 2007, conducted a FEM analysis to a 4/6 SRM and came out with a
result that most efficient region is near nominal speed and load, while high speed low torque
operation is poor efficiency region. They also had maximum efficiency of the motor only
90%.

28
2.5 Multi-speed transmissions
There are many competitive options as transmission of a passenger vehicle. There have been
several studies of different transmission configurations for EV from commonly used single-
gear with fixed gear ratio to multi-speed manual transmissions and continuously variable
transmissions (CVT). Because the efficiency of the transmission has major role in this
research, the efficiencies of different multi-speed transmissions are considered.
With CVT vehicles traction motor, ICE or electric motor, can operate at the ideal operating
point. In mass production vehicles’ the CVT technology that is used is almost in every case
pulley transmission, in which the main component is variator. Power is transmitted with the
help of friction via a chain that run between two axially adjustable taper discs. The discs’
diameter can be varied thus the chain runs between two adjustable diameters. Figure 33a
presents the operating principle of a variator. Another CVT configuration is toroidal variator.
The variable gear ratio is achieved by swivelling the friction gears, figure 33b.
(Naunheimer, Bertsche et al. 2011, p. 186-188).
Figure 33. CVT configurations. Pulley (a) and toroidal (b) (Naunheimer, Bertsche et al. 2011, p. 187-
188).
The major drawback with CVT is the poor efficiency, compared to traditional gear
transmission. The traditional CVT that is used with ICE vehicles has efficiency of 85% but
with EVs more simple construction can be achieved i.e. no torque converter is needed, thus
efficiency of 90% can be achieved. (Ruan, Walker et al. 2016). The achieved improvement
in electric motor performance and energy efficiency with implementation of CVT may be
even out due to the poor efficiency of the transmission.
In the table 3 is listed efficiencies of different types of gearboxes. The automatic
transmission with various gear ratios use planetary-type gearboxes (Naunheimer, Bertsche
et al. 2011, p. 174). Shin, Kim et al., 2014, developed Simpson type two-speed planetary
gear for EV application. They calculated that the transmission gear mesh would have average
efficiency around 98%, but the built prototype, that contained also clutches, had measured
efficiency only 85%.

29
The planetary gearbox enables the gear ratio change without engaging and disengaging
individual gears (Shin, Kim et al. 2014). This feature can also be achieved with dual clutch
setting, which was presented by Wang, Lü et al., 2017,. Their solution also included only
two gear pairs per gear, which increases the efficiency of the transmission, because the
efficiency of single gear pair is high as table 3 shows.
Table 3. Gearbox efficiencies (Naunheimer, Bertsche et al. 2011, p. 67).
For this research, the powertrain efficiency can be evaluated based on the table 3. The
simulated vehicle is assumed to have reduction gear and differential. If the reduction gear is
implemented with spur gear, it has high efficiency as table 3 shows. For the differential, the
bevel gear is most likely the choice, so it would have poorer efficiency than the reduction
gear.
2.6 Related research
Many studies have been conducted of the improvement of EV energy efficiency with the
help of multi-speed gearbox. Ren, Crolla et al., 2009, concluded a simulation study with
QSS toolkit and compared different transmissions effect to EV’s energy consumption. As a
reference, they had original single-speed transmission and they compared its energy
consumption to CVT and multi-speed transmission with 2-,3- and 4 speeds. Their
summarized results are presented in table 4.
Table 4 shows that applying multi-speed transmission can improve energy efficiency of EV.
In the study of Ren, Crolla et al., 2009, the efficiencies and weights of transmission are
neglected and thus only the improved performance of electric motor effects on the energy
efficiency. They concluded that for the losses of multi-speed gearbox would cancel the
improvements in energy efficiency at least for the NEDC cycle. For the other cycles thought,
they found the result more promising because the improvement in efficiency was more than
10%. In addition to possible improvement in energy efficiency, the performance of vehicle

30
improves and with two-speed gearbox the acceleration time from zero to 100 km/h reduces
from 18.6 s to 12.4 s.
Table 4. Multi-speed transmission effect on EV energy consumption in different cycles (Ren, Crolla et
al. 2009).
Similar study of different drivetrain efficiencies was done by Bottiglione, De Pinto et al.,
2014,. The efficiencies and increase in weight were taken into account in this study and they
compared infinitely variable transmission (IVT), CVT with toroidal technology and
transmissions with 1 and 2-speeds. Both IVT and CVT had two different configurations. The
simulation result for Urban driving cycle (UDC) and Japanese 10-15 cycle (J10-15) are
presented in tables 5 and 6.
Table 5. UDC energy consumptions (Bottiglione, De Pinto et al. 2014).
Table 6. J10-15 energy consumptions (Bottiglione, De Pinto et al. 2014).
Bottiglione, De Pinto et al., 2014, concluded that by optimizing the torque dependent
efficiency of CVT and IVT with the efficiency map of used electric motor, the energy
efficiency of EV can be significantly improved, as tables 5 and 6 shows. These results can

31
be favourable for the IVTs, because the planetary gear that is involved in those is assumed
to work with 100% efficiency.
As table 6 shows, it is possible to achieve remarkable energy saving just with two-speed
transmission. The possibilities of two-speed transmission with EV were explored by Gao,
Liang et al., 2015,. They simulated and optimized gear ratio and shift control of two-speed
transmission for EV. The transmission layout was such simple that the efficiency was
considered as good as single-gear transmission and the overall efficiency of the powertrain
was assumed to be 96%.
Results of Gao, Liang et al., 2015, were similar to the result previous presented. One
remarkable difference was the fact that in their results the most energy saving was achieved
in the NEDC whereas at Ren, Crolla et al., 2009, research NEDC provided least saving
potential. Gao, Liang et al., 2015, also mentioned the improved performance of the EV with
two-speed transmission i.e. better acceleration and top speed. Their simulation also noticed
the friction losses due to the clutch in the gear change and effect of gear change smoothness
to friction losses. The comfortable gear change with no torque interrupt generates remarkable
losses in comparison to more rough and rapid change.
In addition to simulation studies, a real prototype to test two-speed transmission effect to
EV’s energy consumption, was built by Spanoudakis, Tsourveloudis et al., 2014,. The used
test vehicle was an ultralight vehicle for urban environment developed in Technical
University of Crete and the electric motor was powered with hydrogen fuel cell. The gear
selection was done manually and the test drive was conducted in a simple oval test track.
The result showed that 3.4% energy saving was reached compared to single-gear
transmission and most of the energy saving was achieved during the acceleration. Energy
saving potential during acceleration is remarkable in city driving conditions with frequent
start and stops.
This area of EV technology has raised interest among the researchers and some tangible
results have been presented. The explored studies expose the potential energy efficiency
improvement that multi-speed transmission can provide.

32
3 Simulation model of an electric vehicle
3.1 Reference model
Nissan Leaf is well known electric vehicle and it is chosen to be the reference vehicle of this
work. This decision is done, because there is data available of this vehicle’s energy
consumption, the characteristics of the motor are known well enough, and the efficiency
maps of motor and inverter are available with reasonable accuracy. This section describes
the reference model construction and the chosen vehicle parameters are justified.
Vehicle’s longitudinal dynamics are described by following elementary equation
𝑚𝑣𝑑
𝑑𝑡𝑣(𝑡) = 𝐹𝑡 − (𝐹𝑎(𝑡) + 𝐹𝑟(𝑡) + 𝐹𝑔(𝑡) + 𝐹𝑑(𝑡)) (5)
Where 𝑚𝑣 in the vehicle mass, v the vehicle speed, 𝐹𝑎 the aerodynamic friction, 𝐹𝑟 the rolling
friction, 𝐹𝑔 the force caused by gravity on non-horizontal road and 𝐹𝑑 the disturbance forces
that summarizes the other non-specified forces. 𝐹𝑡 is the traction force created by the prime
mover minus the force to accelerate the rotating parts inside the vehicle and friction losses
of the powertrain. (Guzzella, Sciarretta 2013, p. 14).
The equation for aerodynamic friction is following
𝐹𝑎(𝑣) =1
2𝜌𝑎 𝐴𝑓 𝑐𝑑 𝑣
2 (6)
Where 𝜌𝑎 is density of ambient air, 𝐴𝑓 the frontal area of the vehicle, v the vehicle speed
and 𝑐𝑑 the aerodynamic drag coefficient. Another significant resistance component for
equation 5, rolling friction, is calculated
𝐹𝑟 = 𝑐𝑟 𝑚𝑣 𝑔 cos (𝛽) (7)
Where 𝑚𝑣 is the vehicle mass, g the acceleration due to gravitation, β the road gradient and
𝑐𝑟 the rolling friction coefficient. The road gradient is zero, because the road is assumed to
be horizontal, and thus the gravitational force term of equation 5 can also be neglected. The
rolling friction coefficient depend on many variables e.g. vehicle speed, road surface
conditions and tire pressure, but it is assumed to be constant in this work. (Guzzella,
Sciarretta 2013, p. 14-16). The inertial forces to reduce 𝐹𝑡, caused by rotating rotor is
calculated as additional force
𝐹𝐼 =𝐽𝑟𝛼
𝑟 (8)
Where 𝛼 is the angular acceleration of rotor, r the wheel dynamic radius and 𝐽𝑟 the
transformed inertia (Seppänen, Kervinen et al. 2005, p. 118). The motor inertia 𝐽𝑚𝑜𝑡 is
transformed through the transmission
𝐽𝑟 = 𝐽𝑚𝑜𝑡𝑖2 (9)

33
Where i is the gear ratio of the transmission (Airila, Ekman et al. 2009, p. 792). The inertia
force has negative and positive values depending on the angular acceleration.
To successfully model the vehicle, the efficiencies of different components has to be
determined. The typical efficiencies of EV powertrain components are presented earlier in
this work and they provide solid basis for the model. The most crucial powertrain component
for this work is evidently the traction motor and therefore it is important to determine the
efficiency map of reference model as accurate as possible. The performance of year 2012
Nissan Leaf was measured in Oak Ridge National Laboratory (Burress 2013) and the
measured efficiency maps of the electric motor and inverter are presented in figures 34 to
36. As the efficiency maps are in such key role, the modelling of them is presented in
separate section.
Figure 34. Nissan Leaf 2012 motor efficiency map (Burress 2013).

34
Figure 35. Nissan Leaf 2012 inverter efficiency map (Burress 2013).
Figure 36. Nissan Leaf 2012 motor and inverter combined efficiency map (Burress 2013).
The vehicle model is constructed in Matlab/Simulink environment and it includes a speed-
controller to follow the reference speed defined by the driving cycle. The schematic block
diagram of the model is presented in the figure 37 and the upper level of the complete
Simulink model is presented in appendix 2.

35
Figure 37. Schematic block diagram of the vehicle model. Electric motor (M), Transmission (TR).
The supplied power of the motor, to meet reference velocity, can be calculated with the help
of supplied torque and the rotation speed of the motor. The actual power demand and energy
consumption is determined by multiplying the motor power with the efficiency of the motor,
inverter and battery. The efficiency of the differential and reduction gear are taken into
account at block TR eff. Transmission and battery efficiencies are assumed to be constant
while motor and inverter efficiencies are defined by the efficiency maps’ of each component.
In the vehicle model the negative power supplied by the motor is assumed to be used for
recuperation. Because the electric motor acts as a generator in recuperation, the recuperation
efficiency is also dependent on the motor and inverter efficiency maps.
Different data sources were discovered to find parameters for the model. Grillaert, Pace et
al., 2014, concluded freewheel test for Nissan Leaf, to determine the coefficients for rolling
resistance and aerodynamic drag and came out with results of 𝑐𝑟 0.013 and 𝑐𝑑 0.27. They
assumed that the car has frontal area of 2.5 𝑚2. Nissan reports similar official value of 0.28
for 𝑐𝑑 (Nissan 2017). Sherman, 2014, reported value of 0.32 for 𝑐𝑑 after wind tunnel tests
and frontal area of 2.276 𝑚2. The chosen parameters are listed in table 7 and some variables
are estimated by the author, such as the motor inertia, because no reliable data was available.
The final selection of each parameter is done to achieve the optimal achievable simulation
results i.e. energy consumption of the vehicle model matches the measured data in different
driving cycles as accurate as possible.

36
Table 7. Vehicle model parameters.
The simulation results are compared against actual measured dynamometer data. The data
that is used is from Loshe-Bush, Duoba et al., 2012,. They measured year 2012 Nissan Leaf
energy consumption at Argonne National Laboratory in different driving cycles and
conditions. These results are used to verify the reference model. The simulation results and
actual measured consumption are compared in the table 8.
Table 8. Simulation results and measured energy consumption
3.1.1 Efficiency map modelling
The modelling of the motor’s efficiency map of the reference model is based on the work of
Mahmoudi, Soong et al., 2015,. Following is the form to calculate the normalized loss terms
of the motor
𝑃𝑙𝑜𝑠𝑠(𝑇, 𝜔) = ∑𝑘𝑚𝑛 (𝑇
𝑇𝑏)𝑚
(𝜔
𝜔𝑏)𝑛
𝑝𝑢 (8)
Where 𝑇𝑏 is the maximum available torque and 𝜔𝑏 the maximum speed. The m and n are
integers that have values from 0 to 3. The loss coefficient 𝑘𝑚𝑛 values are determined from
the table 9, based on the values of m and n.

37
Table 9. Loss coefficient values for equation 8 (Mahmoudi, Soong et al. 2015).
Using equation 8 and loss coefficient from table 9, provide losses for motor that was
modelled by Mahmoudi, Soong et al., 2015,. The map is not similar with Leaf’s map earlier
presented, so the loss coefficients are modified and an efficiency map, with modified loss
coefficients, is presented in figure 38. This map is used in the model and when compared to
the actual map, figure 34, it can be seen that they are similar at sufficient level. The efficiency
of the inverter is modelled at similar manner and the map used in the model is presented in
39 and the combined efficiency map is presented in figure 40.
Figure 38. Efficiency map of motor for simulation model.
0.339
0.103 1.071
T 0.470 -1.022 0.534
1 -0.033 0.239 -0.334 0.171
1 ω
𝑇2
𝑇3
2 3

38
Figure 39. Efficiency map of inverter for simulation model.
Figure 40. Motor and inverter combined efficiency map.

39
The Matlab script to create efficiency map of the motor is provided in appendix 3. The
efficiency values for low power are rounded to 0.5 in the motor map and 0.7 in the inverter
map. This is done to avoid problems and inaccuracies during simulations due to negative
and zero values of efficiency.
3.2 Model with two-speed transmission
The gearbox of the vehicle is modelled with simple switch structure in the vehicle model. At
this stage, only two speed transmission is considered to avoid excessive increase in weight
and decrease in powertrain efficiency. The transmission is assumed to increase vehicles
overall weight with 20 kg, but the transmission efficiency remains the same, 0.98.
For the model with two-speed transmission, the gear ratios have to be determined. Another
important variable is the selection of changing speed i.e. the speed where the second gear is
engaged. The optimisation of gear ratios and changing velocity is done simultaneously and
the optimization goal is to minimize the energy consumption of the vehicle. The optimization
is done for different cycles separately, because it is presumable that the gear ratios and
changing speeds vary between cycles.
The gear ratios are assumed to be found on both sides of the final drive ratio of the reference
model and the changing speed is assumed to be near the maximum velocity of urban driving
cycles, which is usually near 15 m/s. To retain the vehicle characteristics i.e. gradeability
and top speed, the first gear ratio is assumed to be bigger than 7 and the second gear less
than 7. In the optimization process, speeds from 7 m/s to 18 m/s are gone through.
In the first round of iteration at speed 7 m/s, the optimum first gear ratio for this changing
speed is found by going through all gear ratios from range 7 to 13, with step size on 0.1. At
this stage, the second gear is set to be 7. After all the gear ratios from the range are gone
through, the second gear is found with similar manner between 7 and 1. After optimal gear
ratios for the first velocity are found the consumption with this combination is stored and
the optimisation loop is repeated and the changing speed is increased by 1 m/s. After all the
changing speeds are gone through, the optimal combination of gear ratios and changing
speed is found by comparing the energy consumptions of different combinations and the
combination with smallest energy consumption is selected.

40
4 Results and analysis The simulations were carried out in four different cycles: UDDS, NEDC, HWFET and
WLTP Class 3. All the cycles represent driving in urban and extra urban areas, except
Highway fuel economy test (HWFET), that represent only extra urban driving. Figure 41
presents a part of WLTP class 3 cycle and the speed responses that were achieved with
reference model and model with two-speed gearbox. As the figure shows the response to
cycle speed is sufficient and thus the control system is appropriate.
Figure 41. Speed response of simulations in WLTP class 3.
Two kind of simulations and gear ratio optimizations were conducted. In Case 1, gear ratios
and changing speed were found for model that determines efficiencies for the motor and
inverter based on the efficiency maps, figures 38 and 39. In Case 2, optimizations were
carried out for a model, that has constant efficiency of 0.96 for the inverter, so only the
efficiency of the motor varies. The efficiency of 0.96 is selected so that the consumption
matches with the reference model consumption. In both cases the two-speed model weight
is increased with 20kg. Table 10 summarizes the result for Case 1 and optimal gearbox
parameters for each cycle. In table 11 is presented the Case 1 results with common gearbox
parameters that are selected based on the result of table 10. The motor and inverter efficiency
on both tables is for traction mode.
Table 10. Case 1 simulation results with optimal gearbox parameters.
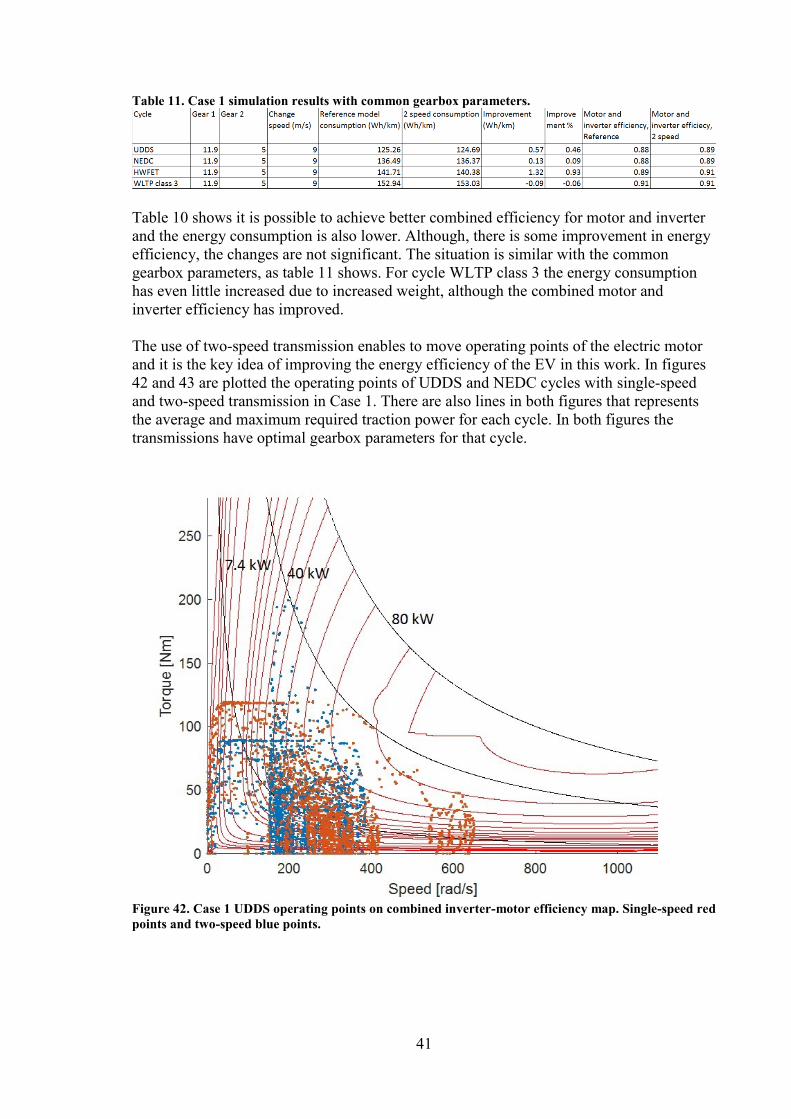
41
Table 11. Case 1 simulation results with common gearbox parameters.
Table 10 shows it is possible to achieve better combined efficiency for motor and inverter
and the energy consumption is also lower. Although, there is some improvement in energy
efficiency, the changes are not significant. The situation is similar with the common
gearbox parameters, as table 11 shows. For cycle WLTP class 3 the energy consumption
has even little increased due to increased weight, although the combined motor and
inverter efficiency has improved.
The use of two-speed transmission enables to move operating points of the electric motor
and it is the key idea of improving the energy efficiency of the EV in this work. In figures
42 and 43 are plotted the operating points of UDDS and NEDC cycles with single-speed
and two-speed transmission in Case 1. There are also lines in both figures that represents
the average and maximum required traction power for each cycle. In both figures the
transmissions have optimal gearbox parameters for that cycle.
Figure 42. Case 1 UDDS operating points on combined inverter-motor efficiency map. Single-speed red
points and two-speed blue points.

42
Figure 43. Case 1 NEDC operating points on combined inverter-motor efficiency map. Single-speed red
points and two-speed blue points.
For both cycles, the maximum rotating speed of the motor is reduced and more torque is
utilized to produce needed power. As table 10 shows, the motor and inverter are working on
better efficiency and both figures plotting the operating points of motor indicate that the
points are more concentrated when two-speed transmission is used. Although the energy
consumption is reduced due to better efficiency, some of the benefit is lost with the increased
power demand due to increased weight.
As it can be seen from the figure 42, the operating points at highest power demand are not
at the optimal region. This is due to the optimization strategy, which aimed to find the best
combination of changing speed and gear ratios to minimize energy consumption. The high
power demanding acceleration is done with the second gear, which obviously moves the
operating point to higher torque. The optimal use of second gear would be for highspeed
cruising, but in this study it is also utilised at urban driving and it leads to a situation that
some of the high power demand operating points are not at the optimal area.
The operating points are more concentrated as the figures 42 and 43 show and by this the
location of point can be shifted to a more efficient area. Even if the points are more
concentrated, the average needed power line goes through efficiency contours at relatively
poor efficiency. To achieve remarkable benefits with two-speed transmission, there should
be area that has good efficiency on lower power region and the used inverter-motor
combination does not provide it. Although the motor and inverter has high level of peak
efficiency at high power, it cannot be utilized properly because the needed power is much
lower that maximum available most of the time.

43
To achieve better result and utilize working point shift, Case 2 simulations were carried out.
In Case 2 the inverter efficiency was set to constant 0.96 and thus the motor efficiency map,
figure 38, is determining. Tables 12 and 13 shows the results for Case 2 in different cycles
and the results are better than in Case 1. The result in table 13 are with common gearbox
parameters that are selected based on results of table 12. Also in these tables the motor and
inverter efficiency is for traction mode.
Table 12. Case 2 simulation results with optimal gearbox parameters.
Table 13. Case 2 simulation results with common gearbox parameters.
As tables 12 and 13 show, the improvement in motor and inverter efficiency is notable and
it is above 90 % in all cycles. Due to this improvement, the energy consumption is lower,
also with common gearbox parameters. In figures 44 and 45 are plotted the motor working
points of the cycles that has improved most, NEDC and HWFET. In both figures optimal
gearbox parameters are used.

44
Figure 44. Case 2 HWFET operating points on motor efficiency map. Red points for Single-speed
model and blue points for-two speed model.
Figure 45. Case 2 NEDC operating points on motor efficiency map. Red points for Single-speed model
and blue points for two-speed model.

45
The improvement in terms of motor operating points’ can clearly be seen from figures 44
and 45. Especially with HWFET, that has higher average power demand, the improvement
is clear. The concentration of working points in HWFET has moved to area that has
efficiency of 0.95 and due to this the energy consumption is 4 % lower than in reference.
This proves that operating point shift enables improvement in operating efficiency of motor
if the used efficiency map is favourable i.e. the high efficiency contours reach low power
regions.
For UDDS and WLTP class 3 the results were also better in case 2. Even improvement was
achieved it was not as big as in the other two cycles. This is due to scattering of operating
points which is caused by multiple aggressive accelerations and decelerations. The scattering
can be seen from the figure 46 where Case 2 operating points for WLTP class 3 with optimal
gearbox parameters are plotted.
Figure 46. WLTP class 3 operating points on motor efficiency map. Red points for reference model and
blue points for two-speed model
Another objective of this work was to determine if the use of two-speed gearbox decreases
the energy consumption dependence of driving cycle i.e. the losses of electric motor and
inverter would be independent of the cycle. This matter can be observed by determining the
share of the motor and inverter losses in comparison to total energy consumption. Figures
47 and 48 summarizes the energy consumption distribution for all cycles in simulation Case
1. The diagrams of figure 47 and 48 presents the absolute values and percentage shares for
each sector.

46
Figure 47. Case 1 energy consumption distribution for UDDS and NEDC.
Figure 48. Case 1 energy consumption distribution for HWFET and WLTP class 3.
In the figures 47 and 48 the energy consumption of EV is divided in five separate groups.
Mot & inv loss contain the losses contributed by motor and inverter and powertrain loss
contain the losses contributed by the reduction gear and differential. Based on the figure 5,
the motor, inverter and mechanical powertrain contribute 25 % of the EV energy
consumption in city driving cycle. To evaluate the accuracy of the developed model, the
same losses can be calculated from the figure 47 and it can be seen that the motor, inverter
and mechanical powertrain contribute 27.7 % of EV energy consumption in city driving
cycle, thus it can be stated that the reference model has sufficient accuracy.

47
In this case it can be said that the motor and inverter losses are highly dependent on the cycle.
In the UDDS the share is one fifth of the energy consumption and in HWFET the share is
only a tenth. Some of this difference is due to the difference in total energy consumption but
also on the matter that in HWFET the motor is working with 1 % better efficiency with
reference model and 2 % better efficiency with two-speed model as table 10 shows. Higher
speeds and power demand yield higher powertrain efficiency and these results was also
found by Loshe-Bush, Duoba et al., 2012, at their laboratory test.
In all cycles the utilization of two-speed gearbox decreased the absolute and the relative
energy consumption of motor and inverter. In the Case 1 simulations the absolute losses of
motor and inverter decrease most at the UDDS cycle, in which the most potential to reduce
losses can be found. Although absolute losses decrease most at the UDDS, the relative share
decreases most at HWFET, which increases the gap between the cycles in motor and inverter
losses. Similar result was found at the Case 2 simulation, figure 49.
Figure 49. Case 2 simulations energy consumption distribution for UDDS and HWFET.
In all driving cycles, there was potential to increase energy efficiency of the EV. More
potential was achieved in Case 2 when inverter efficiency was assumed to be constant. This
was due to motor efficiency map that provides good efficiency regions at lower power.
Another remark is the energy saving potential between cycles and the effectiveness of
operating point shift. Strong scattering of operating points result less potential to concentrate
operating points to a high efficiency region and thus less improvement in energy efficiency.
Most energy efficiency improvement in both simulation cases was achieved at HWFET
which has concentrated operating points and high speed and power demand to further yield
higher powertrain efficiency.

48
5 Discussion Based on the literature survey, the potential to improve energy efficiency of EV with two-
speed gearbox was found possible. The findings that support this are the energy distribution
of EV presented in the section 2.1.3 and the related researches that were discovered in section
2.6. The results of this research in Case 2 were similar with the other researches’ discovered
but in Case 1 the results were modest. The modest results in Case 1 was due to the efficiency
map that provided high efficiency at high power. Different type of electric motor and
efficiency characteristics would increase the benefit of a two-speed gearbox.
The accuracy of the developed model can be evaluated by considering the possible error
sources and their effect to the results. Inaccuracies are caused by the estimated initial
parameters and especially the battery efficiency, which is not dependent on the SOC and
battery current. Some inaccuracies are also caused by the used efficiency maps therefore
higher reliability could be achieved if maps were based on measurements. Although some
error sources can be pointed out, the developed model is considered to have sufficient
accuracy for this work. The sufficient accuracy can be stated based on the comparison
against measured data, which revealed that the model yielded similar total energy
consumption and consumption distribution as the measured data.
The motor and inverter losses was found to be highly dependent on the driving cycle and
powertrain efficiency is higher at higher power and speeds. This means that in the cycles
that have higher powertrain efficiency with single-gear, have also more ability to increase
efficiency with two-speed gearbox. This led to a conclusion that the powertrain dependent
losses and the differences between cycles would be hard to decrease with two-speed gearbox
with this motor-inverter combination. The results were similar also in Case 2.
The characteristics of motor-inverter combination is based on the fact that it is designed to
be used with single-speed transmission. To utilize two-speed transmission properly, the
motor and inverter combination should be chosen for this purpose. With two-speed
transmission the maximum rotating speed is reduced and, with the motor used in this
research, rotating speed reduced near to the base speed. Suitable motor to be used with two-
speed gearbox could be SPM, which has high efficiency region at suitable location, as figure
28b shows. High rotating speeds, which are considered as weak point of SPMs’, are not
needed with two-speed gearbox.
The possibilities of two-speed gearbox utilization were discovered quite narrowly in this
research and only the effect on the traction mode efficiency was considered with simple gear
changing strategy. Gear ratios are also selected based on a rather simple optimization. The
gear changing strategy could be chosen in a way, that the motor provides always the best
efficiency for traction and regeneration. In addition to improving energy efficiency, the gear
changing strategy could be selected to improve vehicle driving characteristics and different
driving modes could be provided.
This research revealed some topics for future research. One topic could be finding proper
motor-inverter combination to be used with two-speed gearbox and evaluate the
improvement in energy efficiency. Another matter to view could be the effect of gear
changing to energy consumption and finding the suitable strategy for it. This research offer
basis for all mentioned topics and the model created in this research can be easily modified
for different type of vehicles that use different types of motors.

49
References
ACEA, (2016), (Last update: 22.4.2016). Laboratory Test. European Automobile
Manufacturers Association, [Online]. Available (URL): http://www.acea.be/industry-
topics/tag/category/laboratory-test. [Accessed: 1.3.2017].
Airila, M., Ekman, K., Hautala, P., Kivioja, S., Klemola, M. and Martikka, H., (2009).
Koneenosien suunnittelu. 4th ed. Helsinki: WSOYpro OY. 796 p. ISBN: 976-951-0-20172-
5.
Automobiles Peugeot, (2015), (Last update: 3.9.2015). Peugeot 508 RXH, tekniset tiedot.
Automobiles Peugeot, [Online]. Available (URL):
http://veho.alkali.fi/static/peugeot/508_rxh/tekniset_tiedot/pdf?lcdv16=1PW2CAXBBW09
A0C0. [Accessed: 1.3.2017].
Badin, F., Le Berr, F., Briki, H., Dabadie, J.C., Petit, M., Magand, S. and Condemine, E.,
(2013). Evaluation of EVs energy consumption influencing factors, driving conditions,
auxiliaries use, driver's aggressiveness. 2013 World Electric Vehicle Symposium and
Exhibition (EVS27). Barcelona, Spain. 17-20.11.2013, IEEE. p. 1-12. [Retrieved: 6.3.2017].
ISBN (electronic): 978-1-4799-3832-2. DOI: 10.1109/EVS.2013.6914723.
Barlow, T.J., Latham, S., McCrae, I.S. and Boulter, P.G., (2009). A reference book of driving
cycles for use in the measurement of road vehicle emissions. United Kingdom: TRL.
Available (URL): http://www.ademloos.be/gezondheiddocumenten/reference-book-
driving-cycles-use-measurement-road-vehicle-emissions. [Accessed: 8.3.2017].
Bottiglione, F., De Pinto, S., Mantriota, G. and Sorniotti, A., (2014). Energy consumption
of a battery electric vehicle with infinitely variable transmission. Energies, Vol: 7, Iss: 12,
p. 8317-8337. [Retrieved: 22.3.2017]. ISSN: 19961073. DOI: 10.3390/en7128317.
Burress, T., (2013). Benchmarking State-of-the-Art Technologies. Oak Ridge National
Laboratory. Available (URL): https://energy.gov/eere/vehicles/downloads/benchmarking-
state-art-technologies. [Accessed: 16.5.2017].
Chan, C.C., (2007). The State of the Art of Electric, Hybrid, and Fuel Cell Vehicles.
Proceedings of the IEEE, Vol: 95, Iss: 4, p. 704-718. [Retrieved: 3.3.2017]. ISSN: 1558-
2256. DOI: 10.1109/JPROC.2007.892489.
Chan, C.C. and Chau, K.T., (2001). Modern electric vehicle technology. Oxford, England:
Oxford University Press. 300 p. ISBN: (Online): 978-1-62870-853-0.
Chau, K.T., Chan, C.C. and Liu, C., (2008). Overview of Permanent-Magnet Brushless
Drives for Electric and Hybrid Electric Vehicles. IEEE Transactions on Industrial
Electronics, Vol: 55, Iss: 6, p. 2246-2257. [Retrieved: 14.3.2017]. ISSN: 1557-9948. DOI:
10.1109/TIE.2008.918403.

50
Chen, L., Wang, J., Lazari, P. and Chen, X., (2013). Optimizations of a permanent magnet
machine targeting different driving cycles for electric vehicles. 2013 International Electric
Machines & Drives Conference. Chicago, IL, USA. 12-15.5.2013, IEEE. p. 855-862.
[Retrieved: 7.3.2017]. ISBN (electronic): 978-1-4673-4974-1. DOI:
10.1109/IEMDC.2013.6556198.
de Santiago, J., Bernhoff, H., Ekergård, B., Eriksson, S., Ferhatovic, S., Waters, R. and
Leijon, M., (2012). Electrical Motor Drivelines in Commercial All-Electric Vehicles: A
Review. IEEE Transactions on Vehicular Technology, Vol: 61, Iss: 2, p. 475-484.
[Retrieved: 22.2.2017]. ISSN: 1939-9359. DOI: 10.1109/TVT.2011.2177873.
Delos Reyes, J. R. M., Parsons, R.V. and Hoemsen, R., (2016). Winter Happens: The Effect
of Ambient Temperature on the Travel Range of Electric Vehicles. IEEE Transactions on
Vehicular Technology, Vol: 65, Iss: 6, p. 4016-4022. [Retrieved: 4.5.2017]. ISSN: 1939-
9359. DOI: 10.1109/TVT.2016.2544178.
Demmelmayr, F., Troyer, M. and Schroedl, M., (2011). Advantages of PM-machines
compared to induction machines in terms of efficiency and sensorless control in traction
applications. IECON 2011 - 37th Annual Conference of the IEEE Industrial Electronics
Society. Melbourne, VIC, Australia. 7-10.2011, IEEE. p. 2762-2768. [Retrieved:
14.3.2017]. ISBN (electronic): 978-1-61284-972-0. DOI: 10.1109/IECON.2011.6119749.
Ehsani, M., Gao, Y. and Miller, J.M., (2007). Hybrid Electric Vehicles: Architecture and
Motor Drives. Proceedings of the IEEE, Vol: 95, Iss: 4, p. 719-728. [Retrieved: 3.3.2017].
ISSN: 0018-9219. DOI: 10.1109/JPROC.2007.892492.
Ehsani, M., Rahman, K.M. and Toliyat, H.A., (1997). Propulsion system design of electric
and hybrid vehicles. IEEE Transactions on Industrial Electronics, Vol: 44, Iss: 1, p. 19-27.
[Retrieved: 13.3.2017]. ISSN: 1557-9948. DOI: 10.1109/41.557495.
Ehsani, M., Yimin, G. and Gay, S., (2003). Characterization of electric motor drives for
traction applications. Industrial Electronics Society, 2003. IECON '03. The 29th Annual
Conference of the IEEE. Roanoke, VA, USA. 2-6.11.2003, IEEE. p. 891-896 vol.1.
[Retrieved: 21.2.2017]. ISBN (Print): 0-7803-7906-3. DOI: 10.1109/IECON.2003.1280101.
Ehsani, M., Yimin, G., Sebastien, E.G. and Ali, E., (2005). Modern electric, hybrid electric,
and fuel cell vehicles: fundamentals, theory, and design. 1st ed. Boca Raton, FL, USA: CRC
Press. 395 p. ISBN: 0-8493-3154-4.
EL-Refaie, A.M. and Jahns, T.M., (2005). Optimal flux weakening in surface PM machines
using fractional-slot concentrated windings. IEEE Transactions on Industry Applications,
Vol: 41, Iss: 3, p. 790-800. [Retrieved: 20.3.2017]. ISSN: 1939-9367. DOI:
10.1109/TIA.2005.847312.
European Commission, (2017a), (Last update: 18.2.2017). Reducing CO2 emissions from
passenger cars. European Comission, [Online]. Available (URL):
https://ec.europa.eu/clima/policies/transport/vehicles/cars_en. [Accessed: 21.2.2017].

51
European Commission, (2017b), (Last update: 17.2.2017). Road transport: Reducing CO2
emissions from vehicles. European Comission, [Online]. Available (URL):
https://ec.europa.eu/clima/policies/transport/vehicles_en#tab-0-0. [Accessed: 21.2.2017].
European Commission, (2011). White Paper: Roadmap to a Single European Transport Area
– Towards a competitive and resource efficient transport system. Brussels, Belgium:
Publications Office of the European Union. Available (URL):
https://ec.europa.eu/transport/themes/strategies/2011_white_paper_en. [Accessed:
21.2.2017].
Eurostat, (2015), (Last update: 8/2015). Passenger cars in the EU. Eurostat, [Online].
Available (URL): http://ec.europa.eu/eurostat/statistics-
explained/index.php/Passenger_cars_in_the_EU. [Accessed: 21.2.2017].
Ford Motor Company Limited, (2017), (Last update: 2017). Hinnastot ja esitteet,
Henkilöautot, Focus, esite. Ford Motor Company Limited, [Online]. Available (URL):
http://www.ford.fi/SBE/Lataa/Hinnastot-ja-esitteet. [Accessed: 28.2.2017].
Ford Motor Company Limited, (2016), (Last update: 5/2016). Hinnastot ja esitteet,
Henkilöautot, Ka+, esite. Ford Motor Company Limited, [Online]. Available (URL):
http://www.ford.fi/SBE/Lataa/Hinnastot-ja-esitteet. [Accessed: 1.3.2017].
Gao, B., Liang, Q., Xiang, Y., Guo, L. and Chen, H., (2015). Gear ratio optimization and
shift control of 2-speed I-AMT in electric vehicle. Mechanical Systems and Signal
Processing, Vol: 50–51, January 2015, p. 615-631. [Retrieved: 22.3.2017]. ISSN: 0888-
3270. DOI: 10.1016/j.ymssp.2014.05.045.
Grillaert, K., Pace, G. and Claessens, L., (2014). Technical Report on EV Laboratory Tests,
deliverable 5.1. Ghent, Belgium: North Sea Region Electric Mobility Network. Available
(URL): http://e-mobility-nsr.eu/info-pool/. [Accessed: 10.4.2017].
Guan, Y., Zhu, Z.Q., Afinowi, I.A.A., Mipo, J.C. and Farah, P., (2014). Calculation of
torque-speed characteristic of induction machine for electrical vehicle application using
analytical method. 2014 International Conference on Electrical Machines (ICEM). Berlin,
Germany. 2-5.9.2014, IEEE. p. 2715-2721. [Retrieved: 14.3.2017]. ISBN (electronic): 978-
1-4799-4389-0. DOI: 10.1109/ICELMACH.2014.6960572.
Guzzella, L. and Sciarretta, A., (2013). Vehicle propulsion systems : introduction to
modeling and optimization. 3rd ed. Heidelberg, New York: Springer-Verlag. 418 p. ISBN:
(Online): 978-3-642-35913-2.
Hall, E., Ramamurthy, S.S. and Balda, J.C., (2001). Optimum speed ratio of induction motor
drives for electrical vehicle propulsion. APEC 2001. Sixteenth Annual IEEE Applied Power
Electronics Conference and Exposition (Cat. No.01CH37181). Anaheim, CA, USA. 4-
8.3.2001, IEEE. p. 371. [Retrieved: 13.3.2017]. ISBN (print): 0-7803-6618-2. DOI:
10.1109/APEC.2001.911674.
52
Hannan, M.A., Hoque, M.M., Mohamed, A. and Ayob, A., (2017). Review of energy storage
systems for electric vehicle applications: Issues and challenges. Renewable and Sustainable
Energy Reviews, Vol: 69, Iss: March 2017, p. 771-789. [Retrieved: 23.3.2017]. ISSN: 1364-
0321. DOI: 10.1016/j.rser.2016.11.171.
Hughes, A. and Drury, B., (2013). Electric motors and drives: fundamentals, types and
applications. 4th ed. Amsterdam: Elsevier. 458 p. ISBN: (Online): 9780080993683.
Ji, F., Xu, L. and Wu, Z., (2009). Effect of driving cycles on energy efficiency of electric
vehicles. Science in China.Series E, Technological Sciences, Vol: 52, Iss: 11, p. 3168-3172.
[Retrieved: 6.3.2017]. ISSN: 1869-1900. DOI: 10.1007/s11431-009-0265-3.
Johnson, R.C., (2016), (Last update: 23.9.2016). eeNews Power Management. SiC triples
inverter efficiency for electric vehicles. European Business Press SA, [Online]. Available
(URL): http://www.eenewspower.com/news/sic-triples-inverter-efficiency-electric-
vehicles. [Accessed: 4.4.2017].
Kia Motors Europe, (2017), (Last update: 2017). Soul EV. Kia Motors Europe, [Online].
Available (URL): http://www.kia.com/eu/campaigns-and-redirects/soul-ev/. [Accessed:
2.3.2017].
Kia Motors Finland, (2017), (Last update: 1/2017). Esitteet ja Hinnastot, cee'd, Tekniikka &
varusteet, vuosimalli 2016. Kia Motors Finland / Delta Motor Group OY, [Online].
Available (URL): http://www.kia.com/fi/. [Accessed: 28.2.2017].
Kia Motors Finland, (2016a), (Last update: 11/2016). Esitteet ja Hinnastot, Niro, Tekniikka
& varusteet MY17. Kia Motors Finland / Delta Motor Group OY, [Online]. Available
(URL): http://www.kia.com/fi/. [Accessed: 1.3.2017].
Kia Motors Finland, (2016b), (Last update: 9/2016). Esitteet ja Hinnastot, Optima Plug-In
hybrid, Tekniikka & varusteet. Kia Motors Finland / Delta Motor Group OY, [Online].
Available (URL): http://www.kia.com/fi/. [Accessed: 1.3.2017].
Kiyota, K., Sugimoto, H. and Chiba, A., (2014). Comparing electric motors: An analysis
using four standard driving schedules. IEEE Industry Applications Magazine, Vol: 20, Iss:
4, p. 12-20. [Retrieved: 20.3.2017]. ISSN: 1077-2618. DOI: 10.1109/MIAS.2013.2288380.
Larminie, J. and Lowry, J., (2012). Electric vehicle technology explained. 2nd ed.
Chichester, UK: Wiley. 314 p. ISBN: (Online): 9781118361139.
Loshe-Bush, H., Duoba, M. and Meyer, M., (2012). AVTA Nissan Leaf testing and analysis.
Argonne National Laboratory. Available (URL): https://www.anl.gov/energy-
systems/group/downloadable-dynamometer-database/electric-vehicles/2012-nissan-leaf.
[Accessed: 18.5.2017].
Länsiauto, (2017a), (Last update: 2017). Opel Ampera, jokapäiväinen käyttö. Länsiauto,
[Online]. Available (URL):
http://opel.lansiauto.fi/autot/henkiloautot/ampera/jokapaivainen-kaytto/. [Accessed:
2.3.2017].

53
Länsiauto, (2017b), (Last update: 2017). Opel Ampera, tekniikka. Länsiauto, [Online].
Available (URL): http://opel.lansiauto.fi/autot/henkiloautot/ampera/tekniikka/. [Accessed:
2.3.2017].
Mahmoudi, A., Soong, W.L., Pellegrino, G. and Armando, E., (2015). Efficiency maps of
electrical machines. 2015 IEEE Energy Conversion Congress and Exposition (ECCE).
Montreal, QC, Canada. 20-24.9.2015, IEEE. p. 2791-2799. [Retrieved: 4.4.2017]. ISSN
(electronic): 2329-3748. DOI: 10.1109/ECCE.2015.7310051.
Mitsubishi Motors Corporation, (2015), (Last update: 2015). Outlander, Tekniikka, Kaikki
Malliversiot, katso kaikki tekniset tiedot. Mitsubishi Motors Corporation, [Online].
Available (URL): http://www.mitsubishi.fi/outlander-phev-my16/#!tekniikka/tech-
spec/phev-4wd-5p. [Accessed: 1.3.2017].
Mitsubishi Motors North America, Inc, (2017), (Last update: 2017). I-MIEV, Trims and
Specs. Mitsubishi Motors North America, Inc, [Online]. Available (URL):
https://www.mitsubishicars.com/imiev/specifications. [Accessed: 2.3.2017].
Mokhtari, H. and Tara, E., (2007). Efficiency map of a Switched Reluctance Motor using
Finite Element Method in vehicular applications. 2007 7th Internatonal Conference on
Power Electronics. Daegu, South Korea. 22-26.8.2007, IEEE. p. 644-649. [Retrieved:
1.4.2017]. ISSN (electronic): 2150-6086. DOI: 10.1109/ICPE.2007.4692467.
Naunheimer, H., Bertsche, B., Ryborz, J. and Novak, W., (2011). Automotive
Transmissions. Fundamentals, Selection, Design
and Application. 2nd ed. Springer Berlin Heidelberg. 741 p. ISBN: (Online) 978-3-642-
16214-5.
Neutrium, (2014), (Last update: 26.3.2014). Specific Energy and Energy Density of Fuels.
Neutrium, [Online]. Available (URL): https://neutrium.net/properties/specific-energy-and-
energy-density-of-fuels/. [Accessed: 28.2.2017].
Nissan, (2016), (Last update: 6/2016). Nissan Micra. Nissan, [Online]. Available (URL):
https://www.nissan.fi/content/dam/Nissan/fi/brochures/brochuresfinland/Nissan_Micra_FI.
pdf. [Accessed: 1.3.2017].
Nissan Motor, (2017), (Last update: 1.4.2017). Nissan LEAF, Prices & Specifications,
Download Brochure. NISSAN MOTOR (GB) LIMITED, [Online]. Available (URL):
https://www.nissan.co.uk/vehicles/new-vehicles/leaf/prices-specifications.html. [Accessed:
4.4.2017].
Opel, (2017), (Last update: 2017). Hinnastot ja esitteet, Astra, Esite. Opel, [Online].
Available (URL): http://www.opel.fi/tools/hinnastot.html. [Accessed: 28.2.2017].
Pellegrino, G., Vagati, A., Guglielmi, P. and Boazzo, B., (2012). Performance Comparison
Between Surface-Mounted and Interior PM Motor Drives for Electric Vehicle Application.
IEEE Transactions on Industrial Electronics, Vol: 59, Iss: 2, p. 803-811. [Retrieved:
15.3.2017]. ISSN: 1557-9948. DOI: 10.1109/TIE.2011.2151825.

54
Petrus, V., Pop, A.C., Martis, C.S., Gyselinck, J. and Iancu, V., (2010). Design and
comparison of different Switched Reluctance Machine topologies for electric vehicle
propulsion. The XIX International Conference on Electrical Machines - ICEM 2010. Rome,
Italy. 6-8.9.2010, IEEE. p. 1-6. [Retrieved: 13.4.2017]. ISBN (electronic): 978-1-4244-
4175-4. DOI: 10.1109/ICELMACH.2010.5608008.
Rekik, M., Besbes, M., Marchand, C., Multon, B., Loudot, S. and Lhotellier, D., (2008).
High-speed-range enhancement of switched reluctance motor with continuous mode for
automotive applications. European transactions on electrical power, Vol: 18, Iss: 7, p. 674-
693. [Retrieved: 18.3.2017]. ISSN: 1430-144X. DOI: 10.1002/etep.216.
Ren, Q., Crolla, D.A. and Morris, A., (2009). Effect of transmission design on Electric
Vehicle (EV) performance. 2009 IEEE Vehicle Power and Propulsion Conference.
Dearborn, MI, USA. 7-10.9.2009, IEEE. p. 1260-1265. [Retrieved: 22.3.2017]. ISBN
(print): 978-1-4244-2600-3. DOI: 10.1109/VPPC.2009.5289707.
Renault Suomi, (2015), (Last update: 2015). ZOE, tekniset tiedot. Renault Suomi, [Online].
Available (URL): https://www.renault.fi/henkiloautot/zoe/tekniset-tiedot-zoe/. [Accessed:
17.3.2017].
Ruan, J., Walker, P. and Zhang, N., (2016). A comparative study energy consumption and
costs of battery electric vehicle transmissions. Applied Energy, Vol: 165, Iss: March, p. 119-
134. [Retrieved: 20.3.2017]. ISSN: 0306-2619. DOI:
http://dx.doi.org.libproxy.aalto.fi/10.1016/j.apenergy.2015.12.081.
Schiferl, R.F. and Lipo, T.A., (1990). Power capability of salient pole permanent magnet
synchronous motors in variable speed drive applications. IEEE Transactions on Industry
Applications, Vol: 26, Iss: 1, p. 115-123. [Retrieved: 14.3.2017]. ISSN: 1939-9367. DOI:
10.1109/28.52682.
Seppänen, R., Kervinen, M., Parkkila, I., Karkela, L. and Meriläinen, P., (2005). maol
taulukot. 6th ed. Helsinki: Otava. 167 p. ISBN: 978-951-1-20607-1.
Sherman, D., (2014). Drag Queens: Aerodynamics Compared. Car and driver, (June),
Available (URL): http://www.caranddriver.com/features/drag-queens-aerodynamics-
compared-comparison-test. [Accessed: 20.4.2017].
Shin, J.W., Kim, J.O., Choi, J.Y. and Oh, S.H., (2014). Design of 2-speed transmission for
electric commercial vehicle. International Journal of Automotive Technology, Vol: 15, Iss:
1, p. 145-150. ISSN: 1976-3832. DOI: 10.1007/s12239-014-0016-8.
Soong, W.L. and Ertugrul, N., (2002). Field-weakening performance of interior permanent-
magnet motors. IEEE Transactions on Industry Applications. Rome, Italy. 8-12.8.2000,
IEEE. p. 1251-1258. [Retrieved: 14.3.2017]. ISBN (print): 0-7803-6401-5. DOI:
10.1109/TIA.2002.803013.

55
Spanoudakis, P., Tsourveloudis, N.C., Koumartzakis, G., Krahtoudis, A., Karpouzis, T. and
Tsinaris, I., (2014). Evaluation of a 2-speed transmission on electric vehicle's energy
consumption. 2014 IEEE International Electric Vehicle Conference (IEVC). Florence, Italy.
17-19.12.2014, IEEE. p. 1-6. [Retrieved: 23.3.2017]. ISBN (electronic): 978-1-4799-6075-
0. DOI: 10.1109/IEVC.2014.7056116.
Takeno, M., Chiba, A., Hoshi, N., Ogasawara, S., Takemoto, M. and Rahman, M.A., (2012).
Test Results and Torque Improvement of the 50-kW Switched Reluctance Motor Designed
for Hybrid Electric Vehicles. IEEE Transactions on Industry Applications, Vol: 48, Iss: 4,
p. 1327-1334. ISSN: 0093-9994. DOI: 10.1109/TIA.2012.2199952.
Tesla, (2017a), (Last update: 2017). Model S. Tesla, [Online]. Available (URL):
https://www.tesla.com/fi_FI/models. [Accessed: 17.3.2017].
Tesla, (2017b), (Last update: 2017). Models S, Design. Tesla, [Online]. Available (URL):
https://www.tesla.com/fi_FI/models/design. [Accessed: 17.3.2017].
Tesla, (2017c), (Last update: 2017). Support, Model S specifications. Tesla, [Online].
Available (URL): https://www.tesla.com/support/model-s-specifications. [Accessed:
17.3.2017].
Toyota Auto Finland OY, (2017a), (Last update: 2/2017). Auris. Toyota Auto Finland OY,
[Online]. Available (URL): https://www.toyota.fi/hinnastot-esitteet/autoesitteet/auris-
autoesite.json. [Accessed: 28.2.2017].
Toyota Auto Finland OY, (2017b), (Last update: 3/2016). Prius. Toyota Auto Finland OY,
[Online]. Available (URL): https://www.toyota.fi/hinnastot-esitteet/autoesitteet/prius-
autoesite.json. [Accessed: 1.3.2017].
Toyota Auto Finland OY, (2016), (Last update: 5/2017). AYGO. Toyota Auto Finland OY,
[Online]. Available (URL): https://www.toyota.fi/hinnastot-esitteet/autoesitteet/aygo-
autoesite.json. [Accessed: 1.3.2017].
Trafi, t., (2014), (Last update: 30.9.2014). Liikenteen päästöt ilmaan. Trafi, [Online].
Available (URL):
https://www.trafi.fi/tietopalvelut/arviointipalvelut/indikaattorit/ymparistoindikaattorit/liike
nteen_paastot_ilmaan. [Accessed: 21.2.2017].
Veho OY AB, (2017), (Last update: 2017). C 350 e Plug-In Hybrid. Veho OY AB, [Online].
Available (URL): http://www.mercedes-
benz.fi/content/finland/mpc/mpc_finland_website/fi/home_mpc/passengercars/home/new_
cars/news/news.htm. [Accessed: 1.3.2017].
Volkswagen, (2017), (Last update: 2017). Sähköautot, Täyssähköautot. Volkswagen,
[Online]. Available (URL): http://www.volkswagen.fi/fi/models/sahkoautot/tietoa-
sahkoautoista/tayssahkoautot.html. [Accessed: 2.3.2017].

56
VV-Auto Group OY, (2017a), (Last update: 8.2.2017). Uusi Volkswagen Golf 4-oviset,
Hinnasto. VV-Auto Group OY;, [Online]. Available (URL):
http://www.volkswagen.fi/content/medialib/vwd4/fi/hinnastot/ha-vw-hinnasto_uusi-
golf/_jcr_content/renditions/rendition.download_attachment.file/ha-vw-2017-02-08-uusi-
golf-4-oviset-nro-37.pdf. [Accessed: 28.2.2017].
VV-Auto Group OY, (2017b), (Last update: 1.3.2017). Volkswagen Uusi up!, tekniset
tiedot, mitat, varusteet. VV-Auto Group OY;, [Online]. Available (URL):
http://content.volkswagen.fi/VV-
Auto/VW_PDF.nsf/(PDFsWeb)/Uusi_up!/$file/Volkswagen_Uusi_up!.pdf. [Accessed:
1.3.2017].
VV-Auto Group OY, (2015), (Last update: 1/2015). Uusi Golf GTE. VV-Auto Group OY;,
[Online]. Available (URL):
http://www.volkswagen.fi/content/medialib/vwd4/fi/esitteet/esite_golf_gte_12015-
pdf/_jcr_content/renditions/rendition.download_attachment.file/golf_gte_1445gl_ge_k71_
w1.pdf. [Accessed: 1.3.2017].
Wang, Y., Lü, E., Lu, H., Zhang, N. and Zhou, X., (2017). Comprehensive design and
optimization of an electric vehicle powertrain equipped with a two-speed dual-clutch
transmission. Advances in Mechanical Engineering, Vol: 9, Iss: 1, p. 1. [Retrieved:
22.5.2017]. ISSN: 1687-8132. DOI: 10.1177/1687814016683144.
Xue, X.D., Cheng, K.W.E. and Cheung, N.C., (2008). Selection of electric motor drives for
electric vehicles. 2008 Australasian Universities Power Engineering Conference. Sydney,
NSW, Australia. 14-17.12.2008, IEEE. p. 1-6. [Retrieved: 13.3.2017]. ISBN (print): 978-0-
7334-2715-2.
Yuksel, T. and Michalek, J.J., (2015). Effects of regional temperature on electric vehicle
efficiency, range, and emissions in the united states. Environmental science & technology,
Vol: 49, Iss: 6, p. 3974-3980. [Retrieved: 5.4.2017]. ISSN: 0013-936X. DOI:
10.1021/es505621s.
Zabihi, N. and Gouws, R., (2016). A review on switched reluctance machines for electric
vehicles. 2016 IEEE 25th International Symposium on Industrial Electronics (ISIE). Santa
Clara, CA, USA. 8-10.6.2016, IEEE. p. 799-804. [Retrieved: 18.3.2017]. DOI:
10.1109/ISIE.2016.7744992.
Zhu, Z.Q. and Howe, D., (2007). Electrical Machines and Drives for Electric, Hybrid, and
Fuel Cell Vehicles. Proceedings of the IEEE, Vol: 95, Iss: 4, p. 746-765. [Retrieved:
21.2.2017]. ISSN: 1939-9359. DOI: 10.1109/JPROC.2006.892482.
Åhman, M., (2001). Primary energy efficiency of alternative powertrains in vehicles.
Energy, Vol: 26, Iss: 11, p. 973-989. [Retrieved: 17.3.2017]. ISSN: 0360-5442. DOI:
10.1016/S0360-5442(01)00049-4.

Appendix 1 (1/1)
Appendix 1. Different vehicles energy consumption and characteristics announced by the manufacturers.
Brand Model Fuel EM type EM
Power
(kW)
Battery
capacity
(kWh)
EV-mode
range (km)
ICE size (l)
/power(kW)
Consumption
(l/100km)
Consumption
(kWh/100km)Total hybrid
system
power (kW)
VW Golf Diesel - - - - 1.6/85 4.1 42.34 -
Opel Astra Diesel - - - - 1.6/81 3.6 37.18 -
Ford Focus Diesel - - - - 1.5/77 3.4 35.11 -
Toyota Auris Diesel - - - - 1.6/82 4.2 43.38 -
Kia Ceed Diesel - - - - 1.6/81 3.6 37.18 -
VW Golf Petrol - - - - 1.4/92 5.2 48.92 -
Opel Astra Petrol - - - - 1.4/92 5.1 47.98 -
Ford Focus Petrol - - - - 1.5/110 5.5 51.5 -
Toyota Auris Petrol - - - - 1.33/73 5.5 51.75 -
Kia Ceed Petrol - - - - 1.4/73 5.6 52.69 -
Ford KA+ Petrol - - - - 1.2/63 4.8 45.16 -
Nissan Micra Petrol - - - - 1.2/60 5 47.04 -
Toyota AYGO Petrol - - - - 1.0/51 4.1 38.57 -
VW up! Petrol - - - - 1.0/44 4.1 38.57 -
Fiat 500 Petrol - - - - 1.2/51 4.3 40.46 -
Peugeot 508 RXH Diesel - 20 - - 2.0/120 4.6 47.5 -
Toyota Auris Petrol PMSM 60 - - 1.8/100 3.5 32.93 100
Toyota Prius Petrol PMSM 53 - - 1.8/72 3 35.75 91
Kia Niro Petrol PMSM 52 - - 1.6/77.2 3.8 28.23 103.6
VW Golf GTE Petrol - 75 - 50 -/110 - 11.4 150
Kia PHEV Petrol PMSM 50 9.8 - 2.0/115 1.6 l/100 15.05 151
Mitsubishi Outlander PHEV Petrol - 2x60 12 52 2.0/89 1.8 l/100 16.94 -
Toyota Prius PHEV Petrol PMSM 53 - - 1,8/72 1.0 l/100 9.4 90
MB C 350 e Petrol - 60 6.38 31 2.0/155 2.1 l/100 19.76 205
Opel Ampera Petrol - 111 16 80 1.4/63 1.2 l/100 11.29 111
Nissan LEAF - PMSM 80 24 199 - - 15 -
Nissan LEAF - PMSM 80 30 250 - - 15 -
VW e-up! - - 60 18.7 160 - - 11.7 -
VW e-Golf - - 100 35.8 300 - - 12.7 -
Mitsubishi I-MIEV - PMSM 49 16 160 - - 12.5 -
Renault ZOE - PMSM 68 41 403 - - 13.3 -
Kia SOUL - PMSM 81.4 27 212 - - 14.7 -
Tesla Model S - Induction - 60 408 - - - -
Co
nve
nti
on
al, G
rou
p 1
Co
nve
nti
on
al,
Gro
up
2H
EVPH
EVEV

Appendix 2 (1/1)
Appendix 2. Vehicle reference model.

Appendix 3 (1/1)
Appendix 3. Matlab script for efficinecy map creation