Embed Size (px)
Citation preview

Accep
ted M
anus
cript
Not Cop
yedit
ed
1
Improving Data Quality in Construction Engineering Projects: An Action Design Research Approach
Soffi Westin1 and Maung K. Sein2
ABSTRACT
The topic of data and information quality (DQ/IQ) is a longstanding issue of interest in both academia and practice in the construction engineering field. Poor DQ/IQ has led to poor engineering drawings that, in turn, have led to delays and eventuality to cost overruns. In this paper, we report a study that took an Action Design Research (ADR) approach to develop and evaluate a DQ/IQ assessment tool, which we call Information Quality System (IQS), in a large global engineering and construction company. The evaluation was performed by comparing the level of DQ/IQ in a project that used IQS with two projects that did not use the tool. The result is encouraging: the DQ/IQ in the project using IQS was significantly higher overall than in the two other projects. The implication is that a tool based on the design principles on which IQS was built is likely to help improve DQ/IQ in engineering systems and, hence, in engineering drawings. Consequently, it will decrease project delays and cost overruns. More generally, our paper adds to the discourse in the literature on the use of information and communication technologies (ICT) in the construction context. Our paper illustrates another successful application of action-oriented research that can solve practical problems while generating academic knowledge. In taking a design approach, we augment the literature on the use of action research in construction engineering and management.
Keywords
Information management, Data quality, Information quality, construction engineering, action design research, frameworks
INTRODUCTION
Delays and cost overruns are common phenomena in construction projects (Toor and Ogunlana 2008). Several causes have been identified such as: waiting for information (Frimpong et al. 2003), design complexity (Lim and Mohamed 2000), delays in design information (Assaf and Al-Hejji 2006) and changes in scope (Sambasivan and Soon 2007). Recent research has specifically pointed to issues related to drawings as one of the most significant problem areas (Dai et al. 2009; Westin and Päivärinta 2011). For example, poor drawings and specifications have been identified as a significant factor that causes delays and cost overruns (Rivas et al. 2010). The variation between planned and actual task start time and start duration has been traced to errors in design and/or drawings (Wambeke et al. 2011).
Improving drawings by reducing errors has, thus, become vital to reduce delays and overruns. Engineering projects are carried out in phases. After the feasibility of alternative solutions has been evaluated in the “concept engineering” phase, the project moves to the “detail engineering” phase where the design is completed and drawings and specifications are detailed to be handed over to the “assembly and construction” crews at remote construction sites (Ogunlana et al. 1998). This design information is commonly communicated in documents, often in electronic form (Tribelsky and Sacks 2011). Since the drawings are based on data (e.g. specifications), errors in such design documentation can be traced to poor data and information quality (DQ/IQ) in the data sources and systems in the construction engineering. Clearly, there is a need to improve DQ/IQ. In order to do so, we first need quality assessment frameworks.
The substantial body of literature on DQ/IQ proposes several quality assessment frameworks (English 1999; Lee et al. 2002; Pipino et al. 2002). These frameworks aim to increase the level of DQ/IQ in information systems by identifying, and sometimes automatically correcting, data errors. The frameworks are based on the premise that the correct data values are known at the time of insertion of data values in a database record (Neely et al. 2006). This assumption of correct insertion is not valid in the context of engineering construction. Moreover, construction engineering has characteristics that raise unique challenges. For example, the iterative nature of concurrent engineering forces engineers to proceed with only partial information (Blechinger et al. 2010). The upshot is that the existing DQ/IQ framework and tools are not useful in the
1 Ph.D. candidate, Dept. of Information Systems, Univ. of Agder (UiA), Kristiansand, Norway. E-mail: [email protected] 2 Professor, Dept. of Information Systems, Univ. of Agder (UiA), Kristiansand, Norway, and Luleå University of Technology, Luleå, Sweden. E-mail: [email protected]
Journal of Management in Engineering. Submitted January 24, 2013; accepted April 24, 2013; posted ahead of print April 26, 2013. doi:10.1061/(ASCE)ME.1943-5479.0000202
Copyright 2013 by the American Society of Civil EngineersJ. Manage. Eng.
Dow
nloa
ded
from
asc
elib
rary
.org
by
Lou
isvi
lle, U
nive
rsity
Of
on 1
0/07
/13.
Cop
yrig
ht A
SCE
. For
per
sona
l use
onl
y; a
ll ri
ghts
res
erve
d.
Accep
ted M
anus
cript
Not Cop
yedit
ed
2
engineering construction context. There is a need to develop tools that meet its specifics needs. In this paper, we address this need by taking an Action Design Research approach (Sein et al. 2011) to develop and evaluate a DQ/IQ tool.
The rest of the paper is organized as follows. First, we define the problem as the lack of appropriate DQ/IQ assessment frameworks in construction engineering and briefly examine the engineering context to justify our problem definition. In the following section, we present ADR and describe how we applied it to our research. We then describe our proposed solution to the problem, namely, development of a tool named Information Quality System (IQS) in a large global engineering and construction company. Next, we describe how we evaluated IQS, and in the following section, we discuss our findings. We conclude the paper by raising some questions for which we provide some preliminary answers.
THE PROBLEM DEFINITION
We define the problem as the lack of appropriate DQ/IQ assessment tools in the construction engineering context. We first offer a brief description of the nature of large construction engineering projects and engineering data. Then, we look at the existing DQ/IQ assessment tools as possible solutions and argue that they are inadequate for our purpose.
Construction Engineering
Large construction engineering projects are generally complex and challenging to manage (Miller and Lessard 2001). As mentioned in the introduction, delays and cost overruns are common phenomena in construction projects; in fact, several researchers have reported delays as the costliest problem (Ling et al. 2009; Memon et al. 2011).
Apart from the huge costs involved, large-scale construction projects are characterized by the large number of project participants and the broad variety of stakeholders (Yeo and Ning 2002). Moreover, construction sites usually are far away from where the design is carried out. This presents the continuous challenge of providing adequate project information to construction sites (Braimah and Ndekugri 2009). The teams carrying out these projects are of a transient nature and deliver their products through project-based temporary multiple organizations that exist only for the single project (Cherns and Bryant 1984). The project is usually carried out in phases; pre-engineering (engineering design needed for planning the project) and detail engineering (engineering design needed for the specific project concept) are carried out first. The outcome of the engineering phase is mainly drawings and documents, which form the basis for the construction (or assembly) phase.
Although phase-based, engineering today is iterative and concurrent. Concurrent engineering means that tasks previously performed in sequence are now performed in parallel. This break from the traditional linear engineering model is mainly attributed to the globalization of engineering, which requires shorter delivery schedules (Dobson and Martinez 2007).
Engineering data possesses some unique characteristics that are different from typical business environments. For example, data are collected in a variety of formats while in business systems data often are provided in fixed formats (Lin et al. 2007). Engineering data are also typically shared among various technical and business systems. The unique characteristic that is most relevant for our problem definition is that the “correct answer” for the values to be inserted into an engineering asset data record is not always known at the time of insertion. Therefore, in keeping with concurrent engineering, engineers have to proceed with partial data. Clearly, this can lead to poor data quality. In our search for an appropriate solution to the problem, we turn to the existing DQ/IQ assessment literature.
DQ/IQ Assessment
DQ/IQ has been defined in various ways. For our purpose, we adopt the “fitness of use” perspective (Wang and Strong 1996), which is based on the intended purposes of the users of information. DQ/IQ research has moved on from such technical issues as query techniques on multiple data sources and data warehouses in the 1980s, to a number of new application areas, such as knowledge management (Madnick et al. 2009) and health care registers (e.g. Pipino and Lee 2007; Vician 2011). Recently, attention has turned to the context of construction engineering (e.g. Lin et al. 2008; Tribelsky and Sacks 2011).
An important aspect of DQ/IQ assessment is “quality dimensions,” which are groups of data values with the same qualities (e.g. accurate values or consistent values). Quality dimensions make it easier to define and discuss issues related to DQ/IQ without referring to specific data values. A number of quality dimensions have been identified; e.g. a review of data quality methodologies identified 28 (Batini et al. 2009). The four dimensions that have been emphasized most frequently are accuracy, completeness, consistency and timeliness. An additional dimension, logical coherence, was identified by Westin et al. (2012). Table 1 lists a sample of dimensions relevant to DQ/IQ in engineering organizations. The three dimensions specifically relevant to our problem definition are italicized.
Journal of Management in Engineering. Submitted January 24, 2013; accepted April 24, 2013; posted ahead of print April 26, 2013. doi:10.1061/(ASCE)ME.1943-5479.0000202
Copyright 2013 by the American Society of Civil EngineersJ. Manage. Eng.
Dow
nloa
ded
from
asc
elib
rary
.org
by
Lou
isvi
lle, U
nive
rsity
Of
on 1
0/07
/13.
Cop
yrig
ht A
SCE
. For
per
sona
l use
onl
y; a
ll ri
ghts
res
erve
d.

Accep
ted M
anus
cript
Not Cop
yedit
ed
3
Place Table 1 about here
Dimensions such as these are the elements on which DQ/IQ assessment frameworks are built, several of which have been proposed in the literature (e.g. Lee et al. 2002). However, as we pointed out in the introduction, such frameworks require that the “correct answer” has to be known in order to perform the comparison of inserted data with real-world data. As we stressed earlier, this requirement is not feasible in an engineering project. In order to underscore our contention, we next take a closer look at the construction engineering context.
DQ/IQ Assessment in Construction Engineering
DQ/IQ problems in construction engineering lead primarily to errors and omissions in engineering drawings (Dai et al. 2009; Westin and Päivärinta 2011). Studies have been conducted on different aspects of an engineering project. However, while quite a few DQ/IQ studies have examined the assembly and operation phases (e.g. Carter and Thorpe 2006; Elazouni and Salem 2011; Murphy 2009), the earlier phases in a project have received less attention. Thus, extant literature gives us little empirical evidence on how the specific and unique characteristics of construction engineering affect DQ/IQ.
Some insight, however, is provided from a literature review conducted by Westin (2012) . She lists five challenges that lead engineers to proceed with partial information, which in turn leads to poor DQ/IQ. The challenges and their connections are shown in Figure 1.
Place Figure 1 about here
In a specific construction engineering project, the first four challenges (shown on the left-hand side of Figure 1) are invariant. Since they could all contribute to “lack of timely information,” this challenge too is invariant. Lack of timely information forces engineers to proceed with partial information (Blechinger et al. 2010) due to short delivery schedules (Dobson and Martinez 2007). The result is poor DQ/IQ in data sources and, consequently, incorrect drawings.
Taken together, viz., the inadequacy of the existing DQ/IQ frameworks and the lack of attention to earlier phases of engineering projects, we find few possible solutions to our problem definition. The alternative, then, is to construct our own solution. Action design research is an appropriate approach for such a solution. We, therefore, used this approach to develop a tool that we call IQS. Here, we briefly describe IQS and how we evaluated it.
OUR SOLUTION: IQS IQS was developed in close collaboration between the researcher and the members of a specific project termed as the test project (TestP). IQS was built using design principles that emerged during the project. First, we briefly describe the organization where IQS was developed, and then present IQS before proceeding on to the evaluation.
The Organization The organization is a European multi-discipline construction engineering company. Though the organization is European, their approximately100 offices and 19,500 employees are located around the globe, including the US and China. The operating revenue is more than 6.5 billion USD per year. The company is a world leader in management of global construction engineering projects, viz., engineering design, product development, procurement, completion and complex installations for the offshore oil and gas industry. They have a significant share of global markets in their product and project domains. A majority of the employees takes part in construction engineering projects. Our focus of research lies in the intersection between the engineering design phase and handover to the phases of assembly and completion, which are performed at the construction site. The main deliveries for handover are drawings, documents and 3D models. The biggest projects typically cost over 150 million USD and take up to three years. Several experts representing different engineering disciplines are needed to design large, complex, robust and yet delicate constructions. Project teams are set up according to engineering and other professional disciplines required by the individual projects. Table 2 describes the engineering disciplines typically represented in the projects of the organization.
Methodology
We used the ADR approach to develop IQS. Introduced by Sein et al. (2011), ADR creates scholarly knowledge through designing an IT artifact in a real organization. Organization intervention is crucial to ADR because of its underlying philosophy that the artifact is not only based on the design, but also emerges from interaction with an organizational context. The four stages of ADR are shown and briefly described in Figure 2.
Place Figure 2 about here
Journal of Management in Engineering. Submitted January 24, 2013; accepted April 24, 2013; posted ahead of print April 26, 2013. doi:10.1061/(ASCE)ME.1943-5479.0000202
Copyright 2013 by the American Society of Civil EngineersJ. Manage. Eng.
Dow
nloa
ded
from
asc
elib
rary
.org
by
Lou
isvi
lle, U
nive
rsity
Of
on 1
0/07
/13.
Cop
yrig
ht A
SCE
. For
per
sona
l use
onl
y; a
ll ri
ghts
res
erve
d.
Accep
ted M
anus
cript
Not Cop
yedit
ed
4
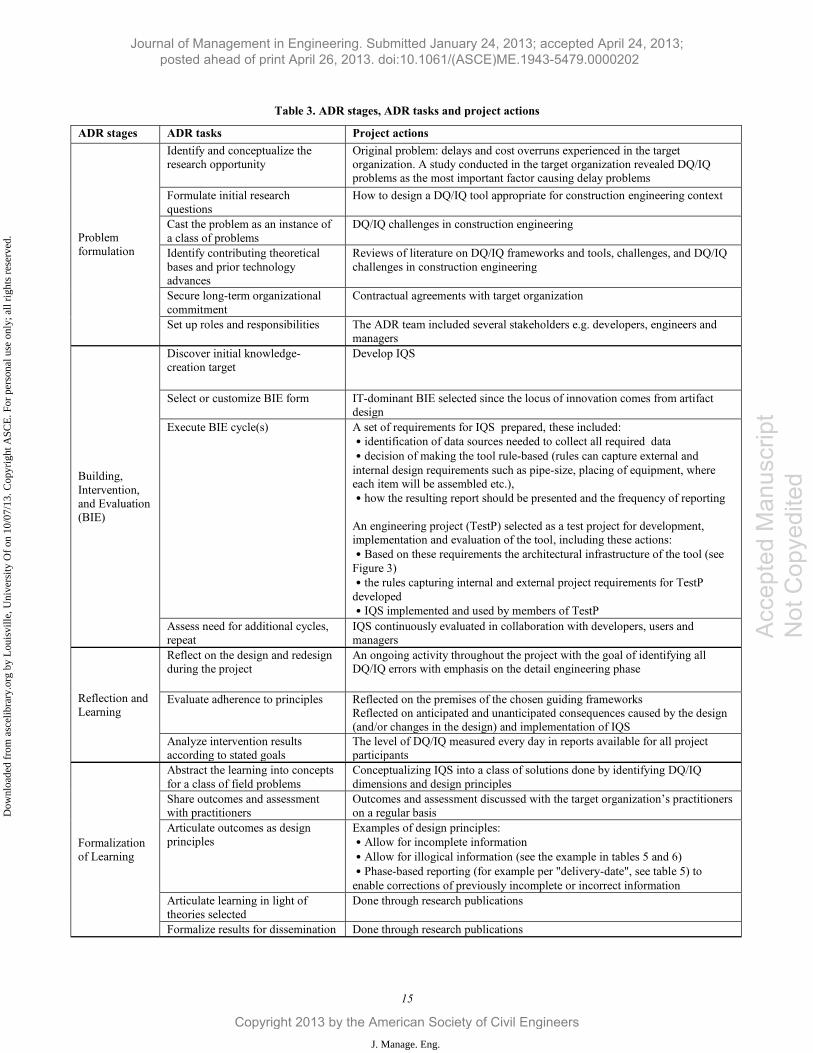
Each stage of ADR has a number of distinct tasks. These tasks are shown in Table 3. The rightmost column of the table shows how these tasks were carried out in our project. We emphasize that although these tasks are presented as stage-based, the actual process was iterative in keeping with Figure 2. To illustrate, the continuous evaluation in stage 2 almost always leads to a change in problem formulation. This is exactly what happened in our project. During the first evaluation of the problem, the result of an initial study and review of existing literature led to a reformulation of the problem from delays and cost overruns to inadequate DQ/IQ, which led to the decision to design IQS. The project generated design principles that could be used in any organization that carries out construction engineering projects. Examples are “phase-based assessment” (or reporting) and “allowing for inconsistencies” (in early phases).
Place Table 3 about here
The System
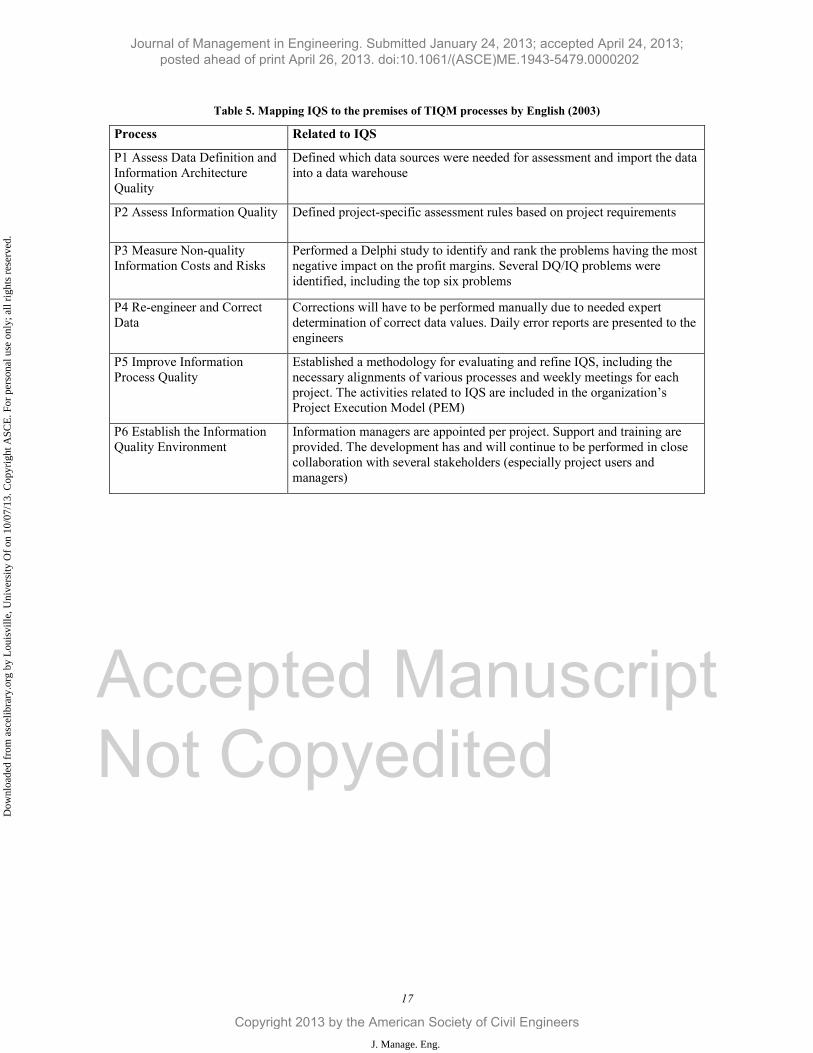
IQS was developed mainly on two premises: the data quality assessments in practice proposed by Pipino et al. (2002) and the processes of TIQM (Total Information Quality Management) proposed by English (2003). Both emphasize the importance of solving the root of the problem. In our case, this meant that we had to ensure a sufficient level of DQ/IQ in data sources before extraction and use of drawings. Table 4 and Table 5 show how the development of IQS relates to these premises.
Place Table 4 about here
In addition, Pipino et al. (2002, p. 217) mention the possibility for an industry to “……adopt a set of data quality metrics as a de facto standard…..” For IQS, we translated this by developing a default set of assessment rules that could be used in any engineering project as well as an additional set of rules meant for various individual project requirements.
Place Table 5 about here
The most conspicuous issue in Table 5 is the absence of automated correction of errors. This is due to the nature of engineering data, which requires engineering expertise to determine the correct data values (see P4).
IQS is rule-based. A rule is defined as a select statement that is based on a project requirement. Generally, all rules contain a default set of selected fields to display. These fields are chosen in collaboration with the users to provide sufficient information on the item reported with an error. In addition, most rules contain more selected fields depending on the type of item checked. The WHERE-clause of every rule contains syntax determining exactly which records are to be assessed. This could be, for example, only records belonging to a specific engineering discipline, only items of a specific type, only items belonging to a specific contractor, only items in a specific mode of state, etc. The content of the WHERE-clause is determined by the delivery requirements related to the different items.
The requirement is captured in the syntax of the rule, so the rule can be executed against all required records with the purpose of identifying any irregularities concerning the requirement. For example, “Rule2: X,Y,Z is outside area limits” means that the coordinates indicating exactly where the item is located is not in accordance with the area value chosen (areas are imaginary cubes indicating various areas of the whole construction and determined by coordinates and named as D1, D2,… etc.). If the coordinates of the item is outside the coordinates of the chosen area, one of the chosen values (coordinates or area) must be incorrect. Only the opinion of an expert can tell which one is correct; the assessment tool will merely report this as an error. (An example of the syntax is shown for this rule in Appendix A.)
Figure 3 shows a schematic model of IQS.
Place Figure 3 about here
The various data sources depicted in the upper-left corner of the model are sources and systems used in engineering design. These sources consist of a main engineering database, various CAD (Computer-Aided Design) tools, files containing data in various formats (e.g. tif, gif, pdf, etc.) and external databases such as customer databases. Data from these sources are imported each night to an Operational Data Warehouse. This integrated data repository is similar to an operational data store (ODS) and, thus, contains data from disparate sources later used for reporting. The extraction, cleaning and loading of the data is done using interfaces developed in-house. Each record in the data warehouse is marked with the ID of the project it belongs to and Contractor ID (each project may include several contractors).
The upper-right corner of the model depicts IQS rules that cover the requirements of each project. Requirements that recur between projects are put together in a default set of rules, which provide the starting point of assessment for each new project.
Journal of Management in Engineering. Submitted January 24, 2013; accepted April 24, 2013; posted ahead of print April 26, 2013. doi:10.1061/(ASCE)ME.1943-5479.0000202
Copyright 2013 by the American Society of Civil EngineersJ. Manage. Eng.
Dow
nloa
ded
from
asc
elib
rary
.org
by
Lou
isvi
lle, U
nive
rsity
Of
on 1
0/07
/13.
Cop
yrig
ht A
SCE
. For
per
sona
l use
onl
y; a
ll ri
ghts
res
erve
d.

Accep
ted M
anus
cript
Not Cop
yedit
ed
5
Every defined rule is saved in a Rule DB from which individual projects select the rules they need. They may, in addition, ask for new rules to cover their specific requirements. When a rule is chosen by a project, it is marked with the Project ID for the system to know which rules to execute against that project’s data. Several projects may choose the same rule.
Every night, the rules in the Rule DB are executed against the data in the data warehouse. After processing, the identified DQ/IQ errors are saved in a Result DB, which becomes the data source for Excel-based IQS reports for all projects. The reports displayed on the home intranet site of each individual project identify errors only pertinent to that project. The users can display the report in multiple formats, such as per engineering discipline, per product, per date of delivery, per work package, etc. An example of a report displaying a selected work package is shown in Table 6.
Place Table 6 about here
The first column of the report shows the delivery date to the customer for information related to the selected work package (shown in column 2). Column 3 displays the rules that have identified errors. The next four columns display the affected engineering disciplines (E= Electro, I =Instrument, M= Mechanical and P=Process) and the number of errors related to that discipline. Column 8 shows the total number of errors identified by the rule executed.
In a typical use case, an electrical engineer may want to further investigate the four identified errors shown under E (column 4) for Rule 2: X, Y, Z outside area limits. The engineer can double-click the number ‘4’ in the column in order to display more details (see examples of additional information in Table 7). The first column tells the user exactly which item the error is related to. The second column displays the values of the field in the item record where the error was identified, in this case the value of the coordinate field. The actual coordinate values for the item related to row 1 are as follows: X=806.000, Y=795.000, Z=219.000. In column 5 (area), the value M60 refer to an imaginary cube determined by its coordinates. If the coordinates of the item are outside the coordinates of its area, either the area value is incorrect or the coordinate value is incorrect. The rest of the columns are commonly chosen to provide the user with enough information to determine which value is incorrect and what the correct value is. Some items might have to be excluded from assessment by this rule for reasons of impracticality or because no rule syntax was possible. Such items are then set aside in a parking table together with the RuleID, and are not checked further against that specific rule. At any time, a parked item can be revoked on request. A question may also arise about who is responsible for this item. Column 7 (resp._eng.) provides the name of the person to ask for the correct weight or any needed additional information.
Place Table 7 about here
EVALUATION AND FINDINGS To evaluate whether IQS indeed helped to improve DQ/IQ, we compared the project where it was used: TestP with two other projects (Projects A and B) that did not use it. Project A was an upgrade of a specific system called Mud System in use in an existing oil rig. Mud is a mixture of water, clay and chemicals used in oil drilling to lubricate and cool the oil drill, flush out mass that has been drilled out and to cover the walls of the drilling hole. Without an efficient mud system, the chance of equipment failure and hole and drilling problems will increase.
Project B was a “new-build” where the target organization was responsible for the drilling facilities of the oil rig. Drilling facilities are “structures containing systems and equipment required for drilling operations” (NORSOK 1998, p. 4). Offshore oil and gas production is challenging inter alia because of the remote and harsh environment. The drilling facilities are complex constructions and need to be able to operate at depths far below the ocean surface. For example, the well-known Troll A platform stands on the sea floor approximately 300 meters below the surface, and has an overall height of 472 meters.
TestP was an upgrade of existing drilling facilities to prolong the lifetime of the construction. This included prefabrication and offshore installation of equipment and prefabricated parts, in addition to offshore completion and commissioning.
To make a fair comparison, we identified a set of assessment rules that included customer requirements common for all three projects. Other rules covering nice-to-have information or ones used by developers only to mitigate any problems concerning interfaces or malfunctions directly related to the IS’s in use were omitted from the comparison since they were not relevant to the final deliverables of the compared projects. Where the rules were not directly usable in Projects A and B, they were modified to suit their individual requirements. In short, we wanted to ensure that our comparison of the level of DQ/IQ in the projects was based on their individual requirements. With that said, more rules are required to capture all assessable requirements of a project. At the time of evaluation, TestP was using 137 rules, capturing more and more details in the requirements as the project progressed. These projects each represent a one-of-a-kind construction, and the total requirements
Journal of Management in Engineering. Submitted January 24, 2013; accepted April 24, 2013; posted ahead of print April 26, 2013. doi:10.1061/(ASCE)ME.1943-5479.0000202
Copyright 2013 by the American Society of Civil EngineersJ. Manage. Eng.
Dow
nloa
ded
from
asc
elib
rary
.org
by
Lou
isvi
lle, U
nive
rsity
Of
on 1
0/07
/13.
Cop
yrig
ht A
SCE
. For
per
sona
l use
onl
y; a
ll ri
ghts
res
erve
d.
Accep
ted M
anus
cript
Not Cop
yedit
ed
6
can never be identical. Some of the projects using the tool today require only a total of 49 rules, which illustrates the deviation among requirements.
For this comparison, a total of 20 rules were selected as the common base. These rules reflected some of the most important requirements as identified in the target organization, for example weight, missing drawings and incorrect drawing types, and represent part of the requirements for each project.
The indices of comparison were as follows:
Pe = the total number of possible errors for each rule (i.e. number of records checked for that rule since each rule can only identify one error per record)
Te = the total number of errors indicated by that rule
Pcte= Percentage of errors (Pe/Te)
SumPe = Sum of Pe for each project
SumTe = Sum of Te for each project
PctSum = SumPe/SumTe
We could, thus, compare the total percentage of errors between each project, as well as granulate it by comparing the percentage of errors per rule per project. We also grouped the rules into three dimensions of quality identified by Westin et al. (2012), namely, Completeness, Consistency and Logical Coherence (see Table 1). Thus, we tested whether IQS helped improve these dimensions in addition to overall quality.
Figure 4 shows the result of the comparison. Note that both Project A and Project B are completed projects, while TestP was nine months away from completion at the time of comparison.
Place Figure 4 about here
DISCUSSION
The findings show that TestP’s level of DQ/IQ was significantly better overall than for those in the two other projects. While TestP had 2.17% errors identified in total, the numbers for projects A and B were 17.18% and 15.19%, respectively (see percentage indications in TOTAL row in Figure 4). This superiority extends to the quality dimensions, i.e. level of Completeness, Consistency and Logical Coherence (see TOTAL PER DIMENSION section in Figure 4).
For every rule, with three exceptions, TestP had the lowest percentage of errors. The three rules are circled in Figure 4. Since TestP is not yet completed (while the other two are completed), the number of errors identified by these three rules could decrease towards delivery date. Even if this is not the case, the number will certainly not increase since all items required were registered in the engineering databases; hence, all missing or partial data values related to the item records were already identified and displayed in the reports. We, therefore, conclude that TestP is overall at a much better state in terms of the level of DQ/IQ than the two other projects. This speaks well for the effectiveness of IQS.
Our study has some limitations. First, the three projects were not contemporaries: TestP is yet to be completed, while projects A and B were completed three and six years ago, respectively. In that timeframe, it is reasonable to expect an increase in the quality of project deliveries simply because the organization gained more experience. However, projects A and B have quite similar data quality status (approx. 17% and 18% errors despite the three-year difference between them), while it is a significant leap to TestP (approx. 2% errors). In all other aspects, the three projects were quite similar. This further lends support for the effectiveness of IQS.
Second, the errors are not weighted. Some errors might lead to more severe consequences than others, especially concerning delays and cost overruns. We have not examined this issue yet since it requires a thorough investigation at the assembly site for several projects. Such an investigation will also increase our understanding of the relationship between a low level of DQ/IQ in engineering data sources and delays and cost overruns.
CONTRIBUTIONS AND IMPLICATIONS
The contribution of our paper can be seen at two levels. At a specific level, it addresses an area that is relatively ignored in the construction engineering literature, namely, DQ/IQ. Existing DQ/IQ assessment frameworks and tools are developed
Journal of Management in Engineering. Submitted January 24, 2013; accepted April 24, 2013; posted ahead of print April 26, 2013. doi:10.1061/(ASCE)ME.1943-5479.0000202
Copyright 2013 by the American Society of Civil EngineersJ. Manage. Eng.
Dow
nloa
ded
from
asc
elib
rary
.org
by
Lou
isvi
lle, U
nive
rsity
Of
on 1
0/07
/13.
Cop
yrig
ht A
SCE
. For
per
sona
l use
onl
y; a
ll ri
ghts
res
erve
d.

Accep
ted M
anus
cript
Not Cop
yedit
ed
7
based on assumptions that are not valid for construction engineering projects. By situating the research in construction engineering, it brings to light the importance of characteristics and features that are unique to a specific context in understanding and subsequently solving DQ/IQ problems. Moreover, by applying a design research methodology, it demonstrates the usefulness of taking a proactive approach in meeting DQ/IQ challenges. For practice, the tool itself is a useful artifact. More importantly, the design principles can guide the development and enhancement of such tools in the future. The relevance of the tool is self-evident: it was developed, implemented and tested in a real organization. That the organization was a large global construction engineering firm argues further for its relevance. Beyond demonstrating the efficacy of the tool, our findings validate the design principles on which the tool was built.
At a more general level, our paper adds to the small but rapidly growing body of literature in construction engineering management on the role of information and communication technologies (ICT) in research and practice. Scholars in the field have long bemoaned the lack of serious attention paid to ICT in the literature beyond descriptions of tools that are used (Ahmad et al. 1995). Specifically noted is the need to examine the transformational capability of ICT and the related socio-organizational context of its use (Ahmad et al. 2010; Gal et al. 2008). (This was the topic of a spirited panel discussion at the conference organized in 2007 at the University of Reading, UK to mark the 25th anniversary of one of the premium journals of the field Construction Management & Economics.)
The recent trend, however, is encouraging (for a thorough review specifically on BIM research, see Merschbrock and Munkvold (2012)). Several papers have gone beyond simply describing cases of implementation of an ICT tool in a construction project and have discussed organizational implications (e.g. Azhar and Ahmad 2007; Gal et al. 2008). Our paper contributes to this healthy trend. We specifically used an action-oriented approach in our project. It can be seen at first glance as an illustration of action research in construction management as described by Azhar et al. (2010). By intervening in a real organization and designing an ICT system to solve a practical problem and generating scientific knowledge, our project is similar to previously reported work in construction management (Azhar 2005; Cushman 2001; Rezgui 2007).
Our approach has a nuanced difference: we frame it as being more in line with action design research (ADR) as elaborated by Sein et al. (2011). ADR blends essential elements of action research with design research to generate design knowledge in a real practical setting. While AR requires intervention in an actual organization, it does not necessarily require design of a technological system. For example, such intervention could be a managerial action (e.g. Cushman 2001) or studying the effectiveness of implementation of technology (e.g. Rezgui 2007). Even where designing a system is an integral part of the intervention, it can be a tried and tested technology such as data warehousing (Azhar and Ahmad 2007). These types of AR can create generalizable and transferable knowledge that can be applied across a wider context than the project itself. An excellent example is the five-phase framework developed by Azhar (2005) for implementing a data-warehousing solution in a construction organization. The nuanced difference in ADR is that in addition to designing and evaluating a system in an actual organization, it also requires that the research must generate new design rules and principles specifically for the design of the system itself. In this regard, it is different from straightforward design projects (e.g. Ahuja et al. 2010; Zhou et al. 2011) where actual intervention in an organization is not required.
These characteristics make ADR an exceptionally appropriate research approach for the construction engineering and management context since innovative and creative design is a vital part of new knowledge created in the field. The design, of course, is not limited to ICT, but also applies to the entire spectrum that is part of the eclectic field of construction management.
CONCLUSION
We conclude by raising some specific questions and offering some answers:
• How can the learning from the development and evaluation of IQS be transferred to other contexts?
This addresses the question of abstraction of knowledge one gains from an ADR project. In such projects, abstraction of knowledge requires that the specific artifact built must be viewed as an instantiation of a class of system and a class of problem. IQS belongs to the general class of DQ/IQ assessment tools. The way IQS was developed and the eventual principles embedded in it could serve future researchers and developers with guidelines and principles when developing DQ/IQ assessment tools for contexts similar to ours. The context was large-scale and complex projects that involved highly sophisticated tasks that required a broad variety of expertise and involved huge amounts of data, which constituted an important part of the deliverables. It remains to be seen whether this approach would be equally effective in a smaller organization or for simpler tasks.
Journal of Management in Engineering. Submitted January 24, 2013; accepted April 24, 2013; posted ahead of print April 26, 2013. doi:10.1061/(ASCE)ME.1943-5479.0000202
Copyright 2013 by the American Society of Civil EngineersJ. Manage. Eng.
Dow
nloa
ded
from
asc
elib
rary
.org
by
Lou
isvi
lle, U
nive
rsity
Of
on 1
0/07
/13.
Cop
yrig
ht A
SCE
. For
per
sona
l use
onl
y; a
ll ri
ghts
res
erve
d.

Accep
ted M
anus
cript
Not Cop
yedit
ed
8
• To what extent have we contributed to theory building in DQ/IQ in general and to construction engineering in particular?
By locating our research in the specific context of construction engineering, and addressing its unique characteristics, we have contributed to contextualization of the concept of DQ/IQ. Using ADR as the research method was instrumental in this. However, one may argue that we have simply demonstrated the “proof of concept”. Moreover, contextualization is just one aspect of DQ/IQ theory, and we only used a subset of the DQ/IQ dimensions. Much research needs to be done to substantially enhance DQ/IQ theory. For the field of construction engineering, this study particularly brings forward the importance of managing data and information in a controlled manner throughout the project. To achieve a sufficient level of DQ/IQ, adequate tools are needed for assessment. IQS provide one example of such tools, and the evaluation performed in this study indicates that there is a good foundation for using such a tool.
• What concrete guidelines emerge for practice from projects such as ours?
ADR is rooted in pragmatism, and the utility of the research outcome for practice is essential in ADR projects. Ours was no exception. In briefly commenting on the knowledge outcomes of the project above, we have also indicated the learning opportunities for developers. In addition to the design principles and lessons from the development process, the artifact itself, IQS, has relevance for practice. Yet, as ADR stresses, an artifact is in continuous emergence, and its final form will only emerge after it has been in use for a reasonable period of time. This emergence will result from the context in which it is used and the exigencies of its actual use. Design principles, therefore, will continue to emerge.
• How can a possible enhancement in project performance be measured if improvement in DQ/IQ is achieved?
Our study was motivated mainly to reduce delays and cost overruns in large construction engineering projects. Our investigation first led us to errors in drawings and specifications and eventually to DQ/IQ. Our solution to this problem was to build IQS. We evaluated the tool and found that it indeed improved DQ/IQ. However, we did not go “the last mile” by assessing whether this reduction in DQ/IQ improved project performance. This is a fruitful, and essential, extension of projects such as ours. One possible way to measure improvement in project performance could be to follow Wambeke et al. (2011) by focusing solely on quality in drawings and specifications used at construction sites. Another approach is to measure employee-hours used on site (assembly) to see if they decrease if the DQ problems are resolved before the drawings are handed over to assembly. However, this is not a simple task since all these projects are one-of-a-kind and difficult to compare. An alternative is to measure extra man-hours used on-site for locating missing information or correcting information.
Journal of Management in Engineering. Submitted January 24, 2013; accepted April 24, 2013; posted ahead of print April 26, 2013. doi:10.1061/(ASCE)ME.1943-5479.0000202
Copyright 2013 by the American Society of Civil EngineersJ. Manage. Eng.
Dow
nloa
ded
from
asc
elib
rary
.org
by
Lou
isvi
lle, U
nive
rsity
Of
on 1
0/07
/13.
Cop
yrig
ht A
SCE
. For
per
sona
l use
onl
y; a
ll ri
ghts
res
erve
d.

Accep
ted M
anus
cript
Not Cop
yedit
ed
9
REFERENCES
Ahmad, I., Russell, J. S. and Abou-Zeid, A. (1995). Information technology (IT) and integration in the construction industry, Construction Management and Economics, 13, 2, 163-171.
Ahmad, I., Sein, M. K. and Panthi, K. (2010). Challenges of integration and ICT's potentials in the globalized construction industry. Proceedings of the Technology Management for Global Economic Growth (PICMET), 2010 Proceedings of PICMET'10:.
Ahuja, V., Yang, J. and Shankar, R. (2010). Benchmarking framework to measure extent of ICT adoption for building project management, Journal of Construction Engineering and Management, 136, 5, 538-545.
Assaf, S. A. and Al-Hejji, S. (2006). Causes of delay in large construction projects, International Journal of Project Management, 24, 4, 349-357.
Azhar, S. (2005). Information systems to support decision-making in construction owner organizations| A data warehousing approach. Ph. D. dissertation, Florida International University, Miami.
Azhar, S. and Ahmad, I. (2007). A case study of data warehousing implementation in a public construction owner organization. In S.-H. Song (Ed.), Construction data warehouse (2 ed., pp. 15-31). Seoul National Univ., Seoul, Korea.
Azhar, S., Ahmad, I. and Sein, M. K. (2010). Action Research as a Proactive Research Method for Construction Engineering and Management, Journal of Construction Engineering and Management, 136, 1, 87-98.
Batini, C., Cappiello, C., Francalanci, C. and Maurino, A. (2009). Methodologies for data quality assessment and improvement, ACM Computing Surveys, 41, 3, 1-52.
Blechinger, J., Lauterwald, F. and Lenz, R. (2010). Supporting the Production of High-Quality Data in Concurrent Plant Engineering Using a MetaDataRepository. Proceedings of the Americas Conference on Information Systems, August 12 -15, Lima, Peru.
Braimah, N. and Ndekugri, I. (2009). Consultants’ perceptions on construction delay analysis methodologies, Journal of Construction Engineering and Management, 135, 12, 1279-1288.
Carter, N. and Thorpe, T. (2006). Internet provision on small construction sites: The i-MO solution. Proceedings of, Proceedings of the 6th European Conference on Product and Process Modelling - eWork and eBusiness in Architecture, Engineering and Construction, ECPPM 2006 , pp. 391-396.
Cherns, A. B. and Bryant, D. T. (1984). Studying the client's role in construction management, Construction Management and Economics, 2, 2, 177-184.
Cushman, M. (2001). Action research in the UK construction industry-the B-hive project. Proceedings of the IFIP WG 8.2 Working Conference on Realigning Research and Practice in Information System Development: The Social and Organizational Perspective, Boise State University, Boise, Id.
Dai, J., Goodrum, P. M. and Maloney, W. F. (2009). Construction Craft Workers’ Perceptions of the Factors Affecting Their Productivity, Journal of Construction Engineering & Management, 135, 3, 217-226.
Dobson, D. and Martinez, R. (2007). Integrated engineering, ABB Review, SPEC. REP., 48-52. Elazouni, A. and Salem, O. A. (2011). Progress monitoring of construction projects using pattern recognition techniques,
Construction Management and Economics, 29, 4, 355-370. English, L. P. (1999). Improving data warehouse and business information quality: methods for reducing costs and increasing
profits: John Wiley and Sons, Inc., New York, New York, USA, 1999. English, L. P. (2003). Total information quality management: a complete methodology for IQ management, Dm Review (Now
: Information Management ), 9, 1-7. Frimpong, Y., Oluwoye, J. and Crawford, L. (2003). Causes of delay and cost overruns in construction of groundwater
projects in a developing countries; Ghana as a case study, International Journal of Project Management, 21, 5, 321-326.
Gal, U., Lyytinen, K. and Yoo, Y. (2008). The dynamics of IT boundary objects, information infrastructures, and organisational identities: the introduction of 3D modelling technologies into the architecture, engineering, and construction industry, European Journal of Information Systems, 17, 3, 290-304.
Ge, M., Helfert, M. and Jannach, D. (2011). Information quality assessment: Validating measurement dimensions and processes. Proceedings of the European Conference on Information Systems, June 9 - 11, Helsinki, Finland.
Lee, Y. W., Strong, D. M., Kahn, B. K. and Wang, R. Y. (2002). AIMQ: a methodology for information quality assessment, Information & Management, 40, 2, 133-146.
Lim, C. S. and Mohamed, M. Z. (2000). An exploratory study into recurring construction problems, International Journal of Project Management, 18, 3, 267-273.
Lin, S., Gao, J. and Koronios, A. (2008). A data quality framework for engineering asset management, Australian Journal of Mechanical Engineering, 5, 2, 209-219.
Journal of Management in Engineering. Submitted January 24, 2013; accepted April 24, 2013; posted ahead of print April 26, 2013. doi:10.1061/(ASCE)ME.1943-5479.0000202
Copyright 2013 by the American Society of Civil EngineersJ. Manage. Eng.
Dow
nloa
ded
from
asc
elib
rary
.org
by
Lou
isvi
lle, U
nive
rsity
Of
on 1
0/07
/13.
Cop
yrig
ht A
SCE
. For
per
sona
l use
onl
y; a
ll ri
ghts
res
erve
d.

Accep
ted M
anus
cript
Not Cop
yedit
ed
10
Lin, S., Gao, J., Koronios, A. and Chanana, V. (2007). Developing a data quality framework for asset management in engineering organisations, International Journal of Information Quality, 1, 1, 100-126.
Ling, F. Y. Y., Pham, V. M. C. and Hoang, T. P. (2009). Strengths, Weaknesses, Opportunities, and Threats for Architectural, Engineering, and Construction Firms: Case Study of Vietnam, Journal of Construction Engineering and Management, 135, 10, 1105-1113.
Madnick, S. E., Wang, R. Y., Lee, Y. W. and Zhu, H. (2009). Overview and Framework for Data and Information Quality Research, Journal of Data and Information Quality, 1, 1, 1-22.
Memon, A. H., Abdul Rahman, I. and Abdul Azis, A. A. (2011). Preliminary Study on Causative Factors Leading to Construction Cost Overrun, International Journal of Sustainable Construction Engineering and Technology, 2, 1.
Merschbrock, C. and Munkvold, B. E. (2012). A Research Review on Building Information Modeling in Construction―An Area Ripe for IS Research, Communications of the Association for Information Systems, 31, 1, 10.
Miller, R. and Lessard, D. (2001). Understanding and managing risks in large engineering projects, International Journal of Project Management, 19, 8, 437-443.
Murphy, G. D. (2009). Improving the quality of manually acquired data: Applying the theory of planned behaviour to data quality, Reliability Engineering and System Safety, 94, 12, 1881-1886.
Neely, M. P., Lin, S., Gao, J. and Koronios, A. (2006). The Deficiencies of current data quality tools in the realm of engineering asset management. Proceedings of the Americas Conference on Information Systems, August 4 - 6, Acapulco, México.
NORSOK. (1998). D-001 NORSOK STANDARD, Drilling facilities. http://www.standard.no/pagefiles/1318/d-001.pdf. Ogunlana, S., Lim, J. and Saeed, K. (1998). Desman: A dynamic model for managing civil engineering design projects,
Computers & structures, 67, 5, 401-419. Pipino, L. L. and Lee, Y. W. (2007). Applying IT to Healthcare: Humans, Errors, and a Data Quality Perspective.
Proceedings of the Americas Conference on Information Systems, August 10 - 12, Keystone, Colorado. Pipino, L. L., Lee, Y. W. and Wang, R. Y. (2002). Data Quality Assessment, Communications of the ACM, 45, 4ve, 211-218. Rezgui, Y. (2007). Exploring virtual team-working effectiveness in the construction sector, Interacting with Computers, 19,
1, 96-112. Rivas, R. A., Borcherding, J. D., González, V. and Alarcón, L. F. (2010). Analysis of factors influencing productivity using
craftsmen questionnaires: Case study in a Chilean construction company, Journal of Construction Engineering and Management, 137, 4, 312-320.
Sambasivan, M. and Soon, Y. W. (2007). Causes and effects of delays in Malaysian construction industry, International Journal of Project Management, 25, 5, 517-526.
Sein, M. K., Henfridsson, O., Purao, S., Rossi, M. and Lindgren, R. (2011). Action Design Research, MIS Quarterly, 35, 1, 37-56.
Singh, P., Park, I., Lee, J. K. and Rao, H. R. (2009). Information sharing: a study of information attributes and their relative significance during catastrophic events, Cyber-Security and Global Information Assurance: Threat Analysis and Response Solutions, IGI Publishers.
Toor, S.-U.-R. and Ogunlana, S. O. (2008). Problems causing delays in major construction projects in Thailand, Construction Management & Economics, 26, 4, 395-408.
Tribelsky, E. and Sacks, R. (2011). An empirical study of information flows in multidisciplinary civil engineering design teams using lean measures, Architectural Engineering and Design Management, 7, 2, 85-101.
Vician, C. (2011). A Resource Review for Health Care Quality Execution: Business Intelligence Strategy. Proceedings of the Americas Conference on Information Systems, August 5 - 7, Detroit, Michigan.
Wambeke, B. W., Hsiang, S. M. and Liu, M. (2011). Causes of variation in construction project task starting times and duration, Journal of Construction Engineering and Management, 137, 9, 663-677.
Wang, R. W. and Strong, D. M. (1996). Beyond Accuracy: What Data Quality Means to Data Consumers, Journal of Management Information Systems, 12, 4, 5-33.
Westin, S. (2012). Data and Information Quality Research in Engineering Construction Projects: A Review of Literature. Proceedings of the 21st International Conference on Information Systems Development (ISD2012), Prato, Italy, August 29-30, 2012.
Westin, S., Holen, O. B. and Päivärinta, T. (2012). Data and Information Quality Dimensions in Engineering Construction Projects. Proceedings of the Americas Conference on Information Systems, Seattle, Washington, USA.
Westin, S. and Päivärinta, T. (2011). Information quality in large engineering and construction projects: A Delphi Case Study. Proceedings of the European Conference on Information Systems, June 9 - 11, Helsinki, Finland.
Yeo, K. and Ning, J. (2002). Integrating supply chain and critical chain concepts in engineer-procure-construct (EPC) projects, International Journal of Project Management, 20, 4, 253-262.
Journal of Management in Engineering. Submitted January 24, 2013; accepted April 24, 2013; posted ahead of print April 26, 2013. doi:10.1061/(ASCE)ME.1943-5479.0000202
Copyright 2013 by the American Society of Civil EngineersJ. Manage. Eng.
Dow
nloa
ded
from
asc
elib
rary
.org
by
Lou
isvi
lle, U
nive
rsity
Of
on 1
0/07
/13.
Cop
yrig
ht A
SCE
. For
per
sona
l use
onl
y; a
ll ri
ghts
res
erve
d.

Accep
ted M
anus
cript
Not Cop
yedit
ed
11
Zhou, Z., Li, Q. and Wu, W. (2011). Developing a Versatile Subway Construction Incident Database (SCID) for the Safety Management, Journal of Construction Engineering and Management, 138, 10, 1169-1180.
APPENDIX A
Example of Syntax Code Rule2: X, Y, Z outside area limits SELECT tbl.project_code, tbl.contractor_code, tbl.tagno, 'X=' VARCHAR(tbl.x_min)+ ',Y='+VARCHAR(tbl.y_min)+ ',Z='+VARCHAR(tbl.z_min), tbl.description, tbl.upd_by, tbl.upd_date, tbl.upd_code, tbl.po_no, tbl.discipline_code, tbl.product_code, tbl.area, tbl.system_no, tbl.site_code, '', '', tbl.status3, '' FROM table1 tbl, table2 b WHERE tbl.project_code = b.project_code AND tbl.area = b.area AND tbl.x_min <> 0 AND tbl.y_min <> 0 AND tbl.z_min <> 0 AND (tbl.x_min NOT BETWEEN b.x_min AND b.x_max OR tbl.y_min NOT BETWEEN b.y_min AND b.y_max
OR tbl.z_min NOT BETWEEN b.z_min AND b.z_max) AND (tbl.eq_pack_no = 'NA' OR tbl.eq_pack_no = '' OR tbl.eq_pack_no = tbl.tagno) AND tbl.upd_code <> 'D' AND tbl.project_code = ‘NN‘ AND tbl.contractor_code = ‘ZZ'
Journal of Management in Engineering. Submitted January 24, 2013; accepted April 24, 2013; posted ahead of print April 26, 2013. doi:10.1061/(ASCE)ME.1943-5479.0000202
Copyright 2013 by the American Society of Civil EngineersJ. Manage. Eng.
Dow
nloa
ded
from
asc
elib
rary
.org
by
Lou
isvi
lle, U
nive
rsity
Of
on 1
0/07
/13.
Cop
yrig
ht A
SCE
. For
per
sona
l use
onl
y; a
ll ri
ghts
res
erve
d.

Accep
ted M
anus
cript
Not Cop
yedit
ed
12
FIGURE CAPTIONS LIST
Fig. 1. Connections between challenges and level of DQ/IQ (from Westin, 2012)
Fig. 2. Overview of ADR stages (adapted from Sein et al., 2011)
Fig. 3. A schematic model of IQS
Fig. 4. Result of comparison of projects
Journal of Management in Engineering. Submitted January 24, 2013; accepted April 24, 2013; posted ahead of print April 26, 2013. doi:10.1061/(ASCE)ME.1943-5479.0000202
Copyright 2013 by the American Society of Civil EngineersJ. Manage. Eng.
Dow
nloa
ded
from
asc
elib
rary
.org
by
Lou
isvi
lle, U
nive
rsity
Of
on 1
0/07
/13.
Cop
yrig
ht A
SCE
. For
per
sona
l use
onl
y; a
ll ri
ghts
res
erve
d.

13
Table 1. A sample of relevant dimensions
Dimension Description Reference
Accessibility available Ge et al. (2011)
Security secure, protected, authorized access
Ge et al. (2011)
Relevancy relevant Ge et al. (2011)
Completeness include all necessary (required) values
Ge et al. (2011)
Consistency consistent meaning Ge et al. (2011)
Timeliness current, delivered on time, timely
Ge et al. (2011)
Logical coherence Two or more values do not conflict with each other
Singh et al. (2009)
Accepted Manuscript Not Copyedited
Journal of Management in Engineering. Submitted January 24, 2013; accepted April 24, 2013; posted ahead of print April 26, 2013. doi:10.1061/(ASCE)ME.1943-5479.0000202
Copyright 2013 by the American Society of Civil EngineersJ. Manage. Eng.
Dow
nloa
ded
from
asc
elib
rary
.org
by
Lou
isvi
lle, U
nive
rsity
Of
on 1
0/07
/13.
Cop
yrig
ht A
SCE
. For
per
sona
l use
onl
y; a
ll ri
ghts
res
erve
d.

14
Table 2. Engineering disciplines in the target organization's projects (from Westin and Päivärinta, 2011)
Discipline Responsibility Process Design of industrial processes; all facts, sequences and relations
in the process, logical placing of items Mechanical Design (choice of equipment and its physical layout and weight) Piping/Layout Design of all piping Electro Design and cabling of power distribution for electrical systems:
equipment, lights, heat, etc.
Instrument Design of control systems, i.e. control of various valves, machines, alarm systems, cables, etc.
Telecom Selection and location of radio and audio systems, alarms, etc. HVAC (Heating, Ventilating and Air Conditioning)
Capacity calculations and layout for ventilation, etc.
Safety Various safety assessments Structure (steel) Design of steel structures, supports, outfitting like handrails,
stairs, etc. Architecture Interior design
Accepted Manuscript Not Copyedited
Journal of Management in Engineering. Submitted January 24, 2013; accepted April 24, 2013; posted ahead of print April 26, 2013. doi:10.1061/(ASCE)ME.1943-5479.0000202
Copyright 2013 by the American Society of Civil EngineersJ. Manage. Eng.
Dow
nloa
ded
from
asc
elib
rary
.org
by
Lou
isvi
lle, U
nive
rsity
Of
on 1
0/07
/13.
Cop
yrig
ht A
SCE
. For
per
sona
l use
onl
y; a
ll ri
ghts
res
erve
d.
15
Table 3. ADR stages, ADR tasks and project actions
ADR stages ADR tasks Project actions
Problem formulation
Identify and conceptualize the research opportunity
Original problem: delays and cost overruns experienced in the target organization. A study conducted in the target organization revealed DQ/IQ problems as the most important factor causing delay problems
Formulate initial research questions
How to design a DQ/IQ tool appropriate for construction engineering context
Cast the problem as an instance of a class of problems
DQ/IQ challenges in construction engineering
Identify contributing theoretical bases and prior technology advances
Reviews of literature on DQ/IQ frameworks and tools, challenges, and DQ/IQ challenges in construction engineering
Secure long-term organizational commitment
Contractual agreements with target organization
Set up roles and responsibilities The ADR team included several stakeholders e.g. developers, engineers and managers
Building, Intervention, and Evaluation (BIE)
Discover initial knowledge-creation target
Develop IQS
Select or customize BIE form IT-dominant BIE selected since the locus of innovation comes from artifact design
Execute BIE cycle(s) A set of requirements for IQS prepared, these included: • identification of data sources needed to collect all required data • decision of making the tool rule-based (rules can capture external and internal design requirements such as pipe-size, placing of equipment, where each item will be assembled etc.), • how the resulting report should be presented and the frequency of reporting An engineering project (TestP) selected as a test project for development, implementation and evaluation of the tool, including these actions: • Based on these requirements the architectural infrastructure of the tool (see Figure 3) • the rules capturing internal and external project requirements for TestP developed • IQS implemented and used by members of TestP
Assess need for additional cycles, repeat
IQS continuously evaluated in collaboration with developers, users and managers
Reflection and Learning
Reflect on the design and redesign during the project
An ongoing activity throughout the project with the goal of identifying all DQ/IQ errors with emphasis on the detail engineering phase
Evaluate adherence to principles Reflected on the premises of the chosen guiding frameworks Reflected on anticipated and unanticipated consequences caused by the design (and/or changes in the design) and implementation of IQS
Analyze intervention results according to stated goals
The level of DQ/IQ measured every day in reports available for all project participants
Formalization of Learning
Abstract the learning into concepts for a class of field problems
Conceptualizing IQS into a class of solutions done by identifying DQ/IQ dimensions and design principles
Share outcomes and assessment with practitioners
Outcomes and assessment discussed with the target organization’s practitioners on a regular basis
Articulate outcomes as design principles
Examples of design principles: • Allow for incomplete information • Allow for illogical information (see the example in tables 5 and 6) • Phase-based reporting (for example per "delivery-date", see table 5) to enable corrections of previously incomplete or incorrect information
Articulate learning in light of theories selected
Done through research publications
Formalize results for dissemination Done through research publications
Acc
epte
d M
anus
crip
t N
ot C
opye
dite
d
Journal of Management in Engineering. Submitted January 24, 2013; accepted April 24, 2013; posted ahead of print April 26, 2013. doi:10.1061/(ASCE)ME.1943-5479.0000202
Copyright 2013 by the American Society of Civil EngineersJ. Manage. Eng.
Dow
nloa
ded
from
asc
elib
rary
.org
by
Lou
isvi
lle, U
nive
rsity
Of
on 1
0/07
/13.
Cop
yrig
ht A
SCE
. For
per
sona
l use
onl
y; a
ll ri
ghts
res
erve
d.

16
Table 4. Mapping IQS to the premises of subjective and objective data quality assessment proposed by Pipino et al. (2002)
Assessment type Related to IQS
Subjective data quality assessments reflect the needs and experience of stakeholders
The needs are in our case the requirements of the individual projects. These are mainly collected from contracts and coding manuals. Together with several stakeholders such as engineers and discipline managers, we decided which assessment rules and quality dimensions were needed
Objective assessment can be task-independent or task-dependent. Task-dependent metrics are developed in specific application contexts
We focused on task-dependent assessment, which, among other factors, include the IS’s used in construction engineering projects within the organization, interfaces towards external IS’s (for example, the customer IS’s) and business rules such as use of organization’s Project Execution Model (PEM)
Accepted Manuscript Not Copyedited
Journal of Management in Engineering. Submitted January 24, 2013; accepted April 24, 2013; posted ahead of print April 26, 2013. doi:10.1061/(ASCE)ME.1943-5479.0000202
Copyright 2013 by the American Society of Civil EngineersJ. Manage. Eng.
Dow
nloa
ded
from
asc
elib
rary
.org
by
Lou
isvi
lle, U
nive
rsity
Of
on 1
0/07
/13.
Cop
yrig
ht A
SCE
. For
per
sona
l use
onl
y; a
ll ri
ghts
res
erve
d.
17
Table 5. Mapping IQS to the premises of TIQM processes by English (2003)
Process Related to IQS
P1 Assess Data Definition and Information Architecture Quality
Defined which data sources were needed for assessment and import the data into a data warehouse
P2 Assess Information Quality Defined project-specific assessment rules based on project requirements
P3 Measure Non-quality Information Costs and Risks
Performed a Delphi study to identify and rank the problems having the most negative impact on the profit margins. Several DQ/IQ problems were identified, including the top six problems
P4 Re-engineer and Correct Data
Corrections will have to be performed manually due to needed expert determination of correct data values. Daily error reports are presented to the engineers
P5 Improve Information Process Quality
Established a methodology for evaluating and refine IQS, including the necessary alignments of various processes and weekly meetings for each project. The activities related to IQS are included in the organization’s Project Execution Model (PEM)
P6 Establish the Information Quality Environment
Information managers are appointed per project. Support and training are provided. The development has and will continue to be performed in close collaboration with several stakeholders (especially project users and managers)
Accepted Manuscript Not Copyedited
Journal of Management in Engineering. Submitted January 24, 2013; accepted April 24, 2013; posted ahead of print April 26, 2013. doi:10.1061/(ASCE)ME.1943-5479.0000202
Copyright 2013 by the American Society of Civil EngineersJ. Manage. Eng.
Dow
nloa
ded
from
asc
elib
rary
.org
by
Lou
isvi
lle, U
nive
rsity
Of
on 1
0/07
/13.
Cop
yrig
ht A
SCE
. For
per
sona
l use
onl
y; a
ll ri
ghts
res
erve
d.

18
Table 6. An IQS report displaying identified errors for a work package
deliv_date work_pkg error_msg E I M P Grand Total
2012_12_28 Work Package: 9999-Z99
Rule3: Tags without drawing references 4 12 96 112
Rule10: Missing mounted-on 1 1 Rule15: Missing or inadequate description on tag 1 1
Rule17: Missing or illegal PO-number 1 3 13 17 Rule13: Missing EX-class 32 14 22 68
Rule14: Missing IP-grade 32 14 22 68 Rule2: X, Y, Z outside area limits 4 25 31 1 61
Accepted Manuscript Not Copyedited
Journal of Management in Engineering. Submitted January 24, 2013; accepted April 24, 2013; posted ahead of print April 26, 2013. doi:10.1061/(ASCE)ME.1943-5479.0000202
Copyright 2013 by the American Society of Civil EngineersJ. Manage. Eng.
Dow
nloa
ded
from
asc
elib
rary
.org
by
Lou
isvi
lle, U
nive
rsity
Of
on 1
0/07
/13.
Cop
yrig
ht A
SCE
. For
per
sona
l use
onl
y; a
ll ri
ghts
res
erve
d.

19
Table 7. IQS detail report
object_name field_value description discpl area work_pkg resp_eng error_msg GD111222 X=806.000
Y=795.000Z=219.000
Starter for el.motor for centrifugal fan
E M60 Work Package: 9999-Z99
John Smith
Rule2: X, Y, Z outside area limits
GD222333 X=806.000Y=795.000Z=219.000
Starter for el.motor for centrifugal fan
E M60 Work Package: 9999-Z99
John Smith
Rule2: X, Y, Z outside area limits
GD333444 X=806.000Y=795.000Z=219.000
Starter for el.motor for centrifugal fan
E M60 Work Package: 9999-Z99
John Smith
Rule2: X, Y, Z outside area limits
EC777888 X=862.123Y=808.170Z=239.758
Drillers control cabin, air-conditioning system
E M60 Work Package: 9999-Z99
John Smith
Rule2: X, Y, Z outside area limits
Accepted Manuscript Not Copyedited
Journal of Management in Engineering. Submitted January 24, 2013; accepted April 24, 2013; posted ahead of print April 26, 2013. doi:10.1061/(ASCE)ME.1943-5479.0000202
Copyright 2013 by the American Society of Civil EngineersJ. Manage. Eng.
Dow
nloa
ded
from
asc
elib
rary
.org
by
Lou
isvi
lle, U
nive
rsity
Of
on 1
0/07
/13.
Cop
yrig
ht A
SCE
. For
per
sona
l use
onl
y; a
ll ri
ghts
res
erve
d.

The iterative nature of concurrent engineering
Lack of integration between processes
Lack of integration between systems
Lack of timely information
Proceeding with partial information
Poor level of DQ/IQ in data sources and drawings
Uniqueness of engineering data
Acc
epte
d M
anus
crip
t N
ot C
opye
dite
d
Journal of Management in Engineering. Submitted January 24, 2013; accepted April 24, 2013; posted ahead of print April 26, 2013. doi:10.1061/(ASCE)ME.1943-5479.0000202
Copyright 2013 by the American Society of Civil EngineersJ. Manage. Eng.
Dow
nloa
ded
from
asc
elib
rary
.org
by
Lou
isvi
lle, U
nive
rsity
Of
on 1
0/07
/13.
Cop
yrig
ht A
SCE
. For
per
sona
l use
onl
y; a
ll ri
ghts
res
erve
d.

1. Problem FormulationThe research problem is perceived by practitioners or anticipated by researchers and provides the impetus for formulating the research effort and an opportunity for scholarly knowledge creation. It may include an initial empirical investigation of the problem. The specific problem is defined as an instance of a class of problems.
4. Formalization of LearningThe situated learning from an ADR project is further developed into general solution concepts for a class of field problems. Design principles are generated contributing to theory building.
3. Reflection and Learning
Conceptually moves from building a solution for a particular instance to applying that learning to a class of problems. It recognizes that the research process is more than solving a problem. Conscious reflection is critical to identify contributions to knowledge. The research process is adjusted based on early evaluation results to reflect the increasing understanding.
2. Building, Intervention, and EvaluationThe IT artifact is initially designed and is further shaped by organizational use and subsequent design cycles. It is a continuous and iterative process and interweaves the building of the artifact, intervention in the organization, and evaluation. Design principles are articulated for the class of systems. Depending on the innovation, there are two end points for the design continuum: IT-dominant and organization dominant.
Acc
epte
d M
anus
crip
t N
ot C
opye
dite
d
Journal of Management in Engineering. Submitted January 24, 2013; accepted April 24, 2013; posted ahead of print April 26, 2013. doi:10.1061/(ASCE)ME.1943-5479.0000202
Copyright 2013 by the American Society of Civil EngineersJ. Manage. Eng.
Dow
nloa
ded
from
asc
elib
rary
.org
by
Lou
isvi
lle, U
nive
rsity
Of
on 1
0/07
/13.
Cop
yrig
ht A
SCE
. For
per
sona
l use
onl
y; a
ll ri
ghts
res
erve
d.

External DB 2D CADtool
3D CADtool
EngineeringDB Files
Gateway
Data Warehouse
Rulesprocessing
ResultDatabase
RulesDatabase
Definerules
Display Result
SelectrulesSelect
rulesSelectrules
Developer
Projects
Require new rules
Acc
epte
d M
anus
crip
t N
ot C
opye
dite
d
Journal of Management in Engineering. Submitted January 24, 2013; accepted April 24, 2013; posted ahead of print April 26, 2013. doi:10.1061/(ASCE)ME.1943-5479.0000202
Copyright 2013 by the American Society of Civil EngineersJ. Manage. Eng.
Dow
nloa
ded
from
asc
elib
rary
.org
by
Lou
isvi
lle, U
nive
rsity
Of
on 1
0/07
/13.
Cop
yrig
ht A
SCE
. For
per
sona
l use
onl
y; a
ll ri
ghts
res
erve
d.

Rules Dimension# of
records checked
# of errors
% of errors
# of records checked
# of errors
% of errors
# of records checked
# of errors
% of errors
Rule3: Tags without drawing references Completeness 7259 73 1,01 4468 42 0,94 11837 267 2,26Rule6: Missing site code Completeness 4502 75 1,67 3629 94 2,59 8642 1018 11,78Rule7: Missing area code on tag Completeness 9041 8 0,09 5146 56 1,09 13702 143 1,04Rule8: Missing GA and Equipment Layout references in MEL Completeness 1685 482 28,61 585 234 40,00 1714 1035 60,39Rule9: Missing weight Completeness 4630 899 19,42 3245 1889 58,21 9270 4085 44,07Rule10: Missing mounted-on Completeness 3942 108 2,74 2672 508 19,01 7800 1888 24,21Rule13: Missing EX-class Completeness 3839 325 8,47 3939 724 18,38 11484 4117 35,85Rule14: Missing IP-grade Completeness 3839 445 11,59 3939 723 18,35 11484 3917 34,11
Rule15: Missing or inadequate description on tag Completeness 4629 39 0,84 3245 155 4,78 9270 513 5,53Rule16: Discipline code missing Completeness 8964 0 0,00 5120 5 0,10 12969 15 0,12Rule18: Missing mounted-on on valve Completeness 688 10 1,45 573 6 1,05 1470 0 0,00Rule19: Missing Manufacturer Completeness 4527 310 6,85 4578 1059 23,13 13077 3927 30,03Rule20: Missing Model Completeness 7649 319 4,17 4578 1074 23,46 13077 3987 30,49Rule17: Missing or illegal PO-number (Completeness)/consist 4506 128 2,84 3245 207 6,38 9270 1294 13,96Rule5: Incorrect drawing type in GA- and/or Layout-field Consistency 2363 28 1,18 2048 80 3,91 6214 1169 18,81Rule11: Documents with incorrect DocType Consistency 10869 36 0,33 7449 42 0,56 16385 1414 8,63Rule1: Area code different from master tag Logical Coherence 2741 26 0,95 2663 1734 65,11 8520 5626 66,03Rule2: X, Y, Z outside area limits Logical Coherence 699 79 11,30 432 14 3,24 1209 323 26,72Rule4: System code different from master tag Logical Coherence 2848 17 0,60 980 77 7,86 3613 491 13,59Rule12: Drawing referenced by tag, but not defined by Document Control Logical Coherence 85802 395 0,46 39080 8736 22,35 72971 1826 2,50TOTAL 175022 3802 2,17 101614 17459 17,18 243978 37055 15,19
TOTAL PER DIMENSIONCompleteness 65194 3093 4,74 45717 6569 14,37 125796 24912 19,80Consistency 17738 192 1,08 12742 329 2,58 31869 3877 12,17
Logical Coherence 92090 517 0,56 43155 10561 24,47 86313 8266 9,58
TestP Project A Project B
Acc
epte
d M
anus
crip
t N
ot C
opye
dite
d
Journal of Management in Engineering. Submitted January 24, 2013; accepted April 24, 2013; posted ahead of print April 26, 2013. doi:10.1061/(ASCE)ME.1943-5479.0000202
Copyright 2013 by the American Society of Civil EngineersJ. Manage. Eng.
Dow
nloa
ded
from
asc
elib
rary
.org
by
Lou
isvi
lle, U
nive
rsity
Of
on 1
0/07
/13.
Cop
yrig
ht A
SCE
. For
per
sona
l use
onl
y; a
ll ri
ghts
res
erve
d.