Embed Size (px)
DESCRIPTION
Citation preview

Int. J. Six Sigma and Competitive Advantage, Vol. 2, No. 1, 2006 23
Copyright © 2006 Inderscience Enterprises Ltd.
Improving customer delivery commitments the Six Sigma way: case study of an Indian small scale industry
Darshak A. Desai Mechanical Engineering Department, Sardar Vallabhbhai Patel Institute of Technology (SVIT), Vasad – 388 306, Dist. Anand, Gujarat, India E-mail: [email protected]
Abstract: Six Sigma has emerged as one of the most effective business improvement strategies. After its conception at Motorola, many success stories were charted by a number of multinationals. Small scale concerns are still not fetching the real benefits from the same. Much is available regarding its techniques, but very few studies are reported regarding its implementation roadmap for small concerns. This paper is an attempt to introduce Six Sigma to small scale sectors. The paper discusses the real life case where Six Sigma has been successfully applied at one of the Indian small-scale units to improve one of the core processes.
Keywords: Six Sigma; DMAIC methodology; high-level process map; Defects Per Million Opportunity (DPMO); BaseLine Six Sigma; small scale industry.
Reference to this paper should be made as follows: Desai, D.A. (2006) ‘Improving customer delivery commitments the Six Sigma way: case study of an Indian small scale industry’, Int. J. Six Sigma and Competitive Advantage, Vol. 2, No. 1, pp.23–47.
Biographical notes: Darshak A. Desai has been an academician for the last six years and has nine years of industrial background at various levels in the field of Design, Project and Marketing. He is presently Faculty in Mechanical Engineering at Sardar Vallabhbhai Patel Institute of Technology (SVIT), Vasad, Gujarat, India. His area of interest is operations and quality management. Apart from the project in question, he has also successfully undertaken the project of implementing Cost of Quality (COQ) systems in the small scale industry. He has published, as a coauthor, four books for polytechnic students, three in regional languages, and one in English, and presently two books for graduate engineering students are under way. He has also contributed to international book publications.
1 Introduction
Six Sigma is gaining momentum as one of the most effective improvement drives among a large number of multinational organisations, and its adoption is showing an upward trend. It is a business system with many statistical aspects, and it naturally fits the business systems of most companies. It is an operational system that speeds up improvement by getting the right projects conducted in the right way; Lucas James

24 D.A. Desai
improvement approach that seeks to find and eliminate causes of mistakes or defects in business processes by focusing on process outputs that are of critical importance to customers (Snee, 2004).
In statistical terms, Sigma (σ), as we know, is a letter in the Greek alphabet that has become the statistical symbol and metric of process variation. The sigma scale of measure is perfectly correlated to such characteristics as defects-per-unit, parts-per-million defectives and the probability of a failure. Six is the number of sigma measured in a process, when the variation around the target is such that only 3.4 outputs out of one million are defects under the assumption that the process average may drift over the long term by as much as 1.5 standard deviations. The technical concept of Six Sigma is to measure current performance and to determine how many Sigmas exist which can be measured from the current average until customer dissatisfaction occurs. On the occurrence of customer dissatisfaction, a defect results (Eckes, 2001).
Over the relatively short interval of time since Six Sigma was first conceived at Motorola, its application has been principally within large manufacturing companies and the question therefore remains how best to apply Six Sigma elsewhere, especially, in small- and medium-scale enterprises. Although Six Sigma has been implemented with success in many large corporations, there is still less documented evidence of its implementation in smaller organisations (Antony et al., 2005). Each organisation will have its own strengths and difficulties, some of which may only become apparent during the implementation of the Six Sigma improvement drive. One of the major advantages of Six Sigma as an improvement drive is the ability to introduce a common metric of customer-perceived quality, which should be applicable to any size and type of organisation.
The contribution of small scale industries (SSI) to the Indian economy cannot be ignored. SSI sector is strategically placed in the industrial population of the country and in the global economy as a whole. Owing to growing importance of supply-chain management issues in the global market environment, large firms are heavily dependant on small- to medium-sized enterprises (SMEs) for the provision of high-quality products and/or services at low costs. The increasing demand for high-quality products and highly capable business processes by large organisations has left no choice on the SMEs to consider the introduction of Six Sigma business strategy (Antony et al., 2005).
This paper is an attempt to introduce the Six Sigma business strategy to small scale sectors in India and remove the fallacy that it involves lots of statistics and immense implementation costs. The paper is in the form of case study illustrating the real-life case where define-measure-analyse-improve-control (DMAIC) methodology of Six Sigma strategy has been introduced at one of the small scale units to attack their chronic problem of failing to meet customer delivery commitments.
The case has been presented in the following sequence
• challenges and advantages of SSI sectors on Six Sigma initiatives compared to large organisations
• selection of Six Sigma over TQM and other business improvement strategies
• management approval on the Six Sigma project
• case explanations

Improving customer delivery commitments the Six Sigma way 25
• benefits of the project to the company
• lessons learned, things went great and difficulties faced
• next phase of the study.
2 Small scale industries
Small scale industries are at a pivotal position in the economic development of countries such as India. Their contributions in the employment generation as well as in exports are quite considerable. This is a growing sector of industrial population. Few highlights of the SSI sectors in India are listed below (Economic Survey, 2001–2002).
• Employment generation in SSI sectors has increased from 1.6 million in the year 1996–1997 to 2 millions in the year 2002–2003.
• The number of registered SSI sectors in the year 1996–1997 was 2.8 millions. This has increased to 3.6 millions during the year 2002–2003.
• It is also observed that the number of SSI units is growing at the average annual rate of 5.2%.
The definition of small industry is an important aspect of government policy as it identifies the target groups. The operational definition is based on investment criterion and according to this criterion, small scale industries are defined in terms of the value of fixed assets, excluding land and building, although the initial definition was based on the number of workers. The cut off investment limit for defining a small scale industry at present is rupees 10 million (Verma, 2005).
Small- and medium-sized enterprises are the life-blood of modern economics. The importance of SMEs to the economy of UK and the industrialised world as a whole cannot be over emphasised (Antony et al., 2005). Japan is the outstanding example of those countries, which have achieved rapid industrialisation through the small and medium industries. Likewise, Taiwan has produced 90% of its industrial output, coming out of small scale industries employing not more than 15 workers each. In India, this sector contributes 45% of the industrial production, 80% of industrial employment and 35% of total exports (Verma, 2005).
The contribution of SSI to GDP (gross domestic product) of India was to the tune of 37.94% in 1999–2000. While small scale industries have shown impressive growth, a disquieting feature is the growing sickness and non-performing assets in the sector (Kulkarni, 2002). Apart from the remedial measures of financial aids and government help suggested by Kulkarni (2002), something concrete need to be attempted by the respective industrial units for overall operational excellence and sustainable growth, to be competitive globally. Break through achievement strategy like Six Sigma is probably the need of the hour for the SSI sectors. Nevertheless, generally, Six Sigma is considered out of the reach of small scale industries. Lack of patience and resources to implement this strategy are the prime reasons for the same.

26 D.A. Desai
3 Literature survey
Before taking up the case explanations, let us take a brief review on the contemporary researches supporting the project in question in one-way or other.
Kuei and Madu (2003) suggest a novel perspective of Six Sigma saying that it is not only a quality management tool, but also an effective way to win customer satisfaction. They call it customer–centric Six Sigma quality and reliability management (CCSSQM), which is an extension of the traditional Six Sigma way. It views product quality and process reliability as keys to achieve Six Sigma and adopts a holistic view of quality. They indicate that by bringing product and process quality together, a customer-centric Six Sigma can be achieved. They define Customer–centred Six Sigma Quality management with three equations as below.
Customer–centred = Stakeholder focus
Six Sigma Quality = Meeting customer needs consistently and perfectly
Management = Increasing cultural acceptance, enhancing process capabilities and people capacities for Six Sigma.
This approach advocates Six Sigma drive purely based on customer requirements. Achieving product quality as per the specified standards alone would not be sufficient. For overall competitiveness and meeting customer requirements, the Six Sigma way would be the need of the hour.
The project of SSI in question has adopted this concept and applied DMAIC methodology on one of the most critical requirements of the customer, which is, getting product as per committed delivery schedules. Here, the stakeholder focus is on both the customer and the company. By solving the delivery commitment problem, both are going to be benefited.
Edgeman and Bigio (2004) modified the conventional aspect of SIPOC (supplier-inputs-processes-outputs-customers) business model in the context of Six Sigma improvement drive and presented as the reverse view of the SIPOC that regards it as COPIS in the following manner:
• the voice of the customer (VOC) is used to identify the needed outputs
• knowledge of those outputs is used, in turn, to configure process capable of providing those outputs
• those processes require specific inputs
• knowledge of the needed inputs assists in identifying appropriate suppliers.
As per them, following that line, Six Sigma emphasises acquisition of the clear VOC and distillation of it into critical to quality characteristics, translation into actionable information and ultimately delivery of superior processes, products and services that fulfil the VOC. The problem selected for the subject Six Sigma improvement drive, has this concept at the centre.
Apart from its break through impacts on the overall bottom-line, Six Sigma is still not penetrating the way it should be. Some of the researches in India and Singapore are highlighting this fact.

Improving customer delivery commitments the Six Sigma way 27
Kumar et al. (2002) have provided the exhaustive list of various quality management techniques, which the Indian industries are following at present. The list of techniques is divided in to four categories such as Management techniques, Analytical techniques, Idea-generation techniques and Data-collection techniques. It is observed that the application of Six Sigma problem-solving approach is very less. This shows the immediate need to make the SSI sectors aware of Six Sigma business improvement strategy by removing the misconception about it, that it is highly mathematical and costly to implement.
Khanna et al. (2002) highlighted the survey results and analysis of TQM status and quality tools being followed by Indian automobile sector. The survey focused on 23 key quality improvement drives. The weakest among these is Six Sigma. Only 5% of the respondents in Indian automobile organisations claimed to follow Six Sigma. The foremost reason for low implementation of Six Sigma in Indian automobile sector has been identified as lack of top management commitment. Seventy percent of top management teams have not shown interest in the implementation of Six Sigma approach because of the high cost involved in training the people for Green Belt, Black Belt and Master Black Belt. This is not confined to automobile sector only. The scenario at the industries as a whole, especially, small- and medium-scale units, is the same.
Man (2002) highlights the responses of Six Sigma in Singapore. He points out that a leading semiconductor foundry proclaims the ideology ‘Six Sigma in everything that we do’: that the basic work value is to achieve the Six Sigma standard. The proclamations are grand and well documented in the organisation’s corporate vision and mission statements and corporate business plan. The decisive moment comes when measurements are required on the key performance indicators, defects per opportunities and sigma levels. At this point the same organisation explains that Six Sigma is used to get people to adopt the mindset and that it is not ready to use the measurements and rigour of data to define sigma levels and standards. The contradiction is obvious indeed. Another semiconductor organisation at Singapore announces that Six Sigma is much too technical and encompasses the need for tracking data that are much too time consuming. As per Man (2002), in most cases the project is an evaluation of known solutions. The learning dimension is clouded by assumptions and judgments rather than clear measurements and facts. The project selection is based on direction from the upper management who prefer to explore their intuitions rather than use an intelligent questioning process to identify critical design and process issues. A study of the organisations that are recognised annually for their productivity and quality achievements in Singapore show that in 87% of cases the projects are based on low levels of analysis of equipment and performance tracking.
With this much background, the following text illustrates the case in question.
4 Case study
4.1 Challenges and advantages of SSI sectors on Six Sigma initiatives compared to large organisations
Table 1 illustrates challenges and advantages of the Indian SSI sector in taking up the Six Sigma drive for improvements compared to large organisations.

28 D.A. Desai
Table 1 Challenges and advantages of the Indian SSI sector
Challenges Advantages
Lack of time and resources for implementing the drive
Complete involvement of top management in the implementation drive
Ignorance about the strategic gains of Six Sigma as one of the most effective improvement methodologies
Ease of locating and arriving at the consensus for the most problematic area for initial trial of Six Sigma improvement drive
Misconception that Six Sigma involves lots of statistics which is beyond the range of common industrialists and it is a sort of luxury, which is being sold by the Management Consultants at very hefty fees
Convenience of keeping a close watch on the processes and experimenting with variables
Easier and faster response to change management program in the context of Six Sigma implementation. The benefits small size brings are speed, leanness and flexibility in responding to change
Comfortable with tradition of resorting to quick-fix solutions and curing the problems as and when encounter. That means, usually indifferent about investing time and money in the long term, permanent and strategic solutions Ease of keeping close to the customers and
locating the vital few Critical to Quality (CTQs), which matter most or can most easily be improved
Edgeman and Bigio (2004) argued the following points as the answer to why many industries are apathetic about Six Sigma:
• they believe that their existing culture and system, such as ISO 9000 and continuous improvement are sufficient to meet their needs
• they do not believe the managerial benefit to the organisation of adopting Six Sigma justifies its cost
• they do not understand Six Sigma or have the internal capability to assess its potential value to their organisation
• they regard the cost of hiring, training and retaining Six Sigma talents as prohibitive in view of what they believe the returns will be.
These points are strengthening the standpoint made above regarding challenges faced by SSI sector in implementing Six Sigma improvement drives.
The argument presented by Antony et al. (2005) in support of four major requirements for successful implementation of Six Sigma in any origination, regardless of size, as given by Waxer (2004) are matching with the challenges and advantages of Indian SSI sectors for implementing Six Sigma.
4.2 Selection of Six Sigma over TQM and other business improvement strategies
As the basic objective was to introduce the Six Sigma improvement drive to the concern, it was advisable to select one of the most chronic problems faced by them and then apply Six Sigma tools and techniques, step by step, to exhibit their application and finally arrive at the desired results.

Improving customer delivery commitments the Six Sigma way 29
Selecting the project for Six Sigma implementation generally needs brainstorming session and then approval by the top management. Accordingly, while discussing with key operative personnel and chief of the concern, the problem of their failure to keep delivery commitments to their customers emerged out unanimously. This was the chronic problem faced by them. While verifying on hard-core quality front, it was learnt that they are well placed. They have recently conducted a pilot run of calculating their cost of poor quality (COPQ) and it was found the figure was well within the recommended world-class level when expressed as percentage of sales. Their COPQ for the pilot run was 1.97% of their total sales. They have adopted the conventional quality costing approach of categorising quality costs as Prevention-Appraisal-Internal failure-External failure, as suggested by ISO 9004-1:1994.
As the need was to locate the root causes of failure in meeting delivery schedules, at first instance, this seemed to be a Production Planning problem and the best tool available could be theory of constraints (TOC) since it will help pinpoint the bottlenecks, and ultimately to streamline the production. But then, it needs to be assumed that there exist some bottlenecks in the system. This is rather perceiving the cause of the problem without investigating.
On the other hand, total quality management (TQM) is one of the most popular management strategies and a dream of most of the small and medium concerns. The fallacy prevailing among them is that it is the quick fix for all sort of problem and by TQM business grows magically. Nevertheless, the basic shortcoming of TQM as an improvement drive is its inability to show distinct results in numbers. Problem definition and improvements both remain intangible. Secondly, TQM is widespread, that is, it can be applied with out pinpointing any specific problem area. This generalised nature makes its impact weak and the fruits cannot be realised truly in relations to the efforts put in. Looking to the nature of the problem here, TQM would not prove appropriate since it is a long-term measure and rather a philosophy, not a strategy.
Lucas James (2002) strengthens the above argument by mentioning that a major advantage of Six Sigma is it does not have ‘quality’ or ‘statistics’ in its name. It is perceived to be a business system that improves the bottom line and only brings in technical details as needed; TQM is perceived to be a technical quality system owned by technical specialists rather than all employees. Six Sigma is simple and effective management structure is one of its strengths; management structure used by TQM cannot be described in such a succinct fashion. As an example of the operational effectiveness of Six Sigma, it is worthwhile to point out that GE‘s implementation is being widely imitated, while there was little copying of Kaizen programme, it tried to implement between 1988 and 1992.
Basu (2001) highlights the key success factors differentiating Six Sigma from TQM as below:
• emphasis on statistical science and measurement
• rigorous and structured training deployments plans (Champion, Master Black Belt, Black Belt and Green Belt)
• project-focused approach with a single set of problem-solving techniques such as DMAIC
• reinforcement of Juran tents (top management leadership, continuous education and annual savings plan).

30 D.A. Desai
Further, Snee (2004) illustrated following four aspects of the Six Sigma method that are not emphasised in TQM and many other improvement approaches.
• It places a clear focus on getting bottom line results.
• It builds on improvement methods that have shown to be effective and integrates the human and process elements of improvement.
• It sequences and links the improvement tools into an overall approach, through DMAIC improvement process.
• It creates an infrastructure of Champions, Master Black Belts, Black Belts and Green Belts that lead, deploy and implement the approach.
JIT and Lean Manufacturing could also be the candidates for the subject problem. However, once again here too we are fixing the cause without investigating it and then trying to design an improvement drive.
Before deciding on the improvement drive, the basic need is to locate the root causes and then accordingly attack the problem areas. For this, the DMAIC methodology of Six Sigma proved to be the best-fit technique. This methodology makes quantitative and specific definition of the problem, measures the present performance, analyses the root causes, decides on appropriate improvements based on root causes and maintains the improvements by suitable controls. The most prominent part of this methodology is that it does not assume the causes and design the solutions. It rather, makes systematic investigations based on the facts and figures to uncover the problem areas and then decides on the appropriate improvement drives.
4.3 Management approval on the Six Sigma project
Six Sigma implementation is a top-down approach. The CEO is usually the driving force; Lucas James (2002). As small companies are more agile, it is much easier to buy-in management support and commitment, as opposed to large organisations (Antony et al., 2005). As highlighted in the advantages (Table 1), in small industries, since the top management is involved right from the problem selection stage, it becomes rather easy to get final approval from them in starting the project. The company in question being small scale in nature, managed by a chief of the operations and couple of qualified and experienced executives, all were involved right from the problem selection stage.
As discussed in the challenges faced by SSI regarding Six Sigma (Table 1), here too the concern involved was having misapprehension that Six Sigma is purely a quality engineering technique involving much statistics, which is beyond their understanding. Further, since they believed that Six Sigma is only for hard-core quality improvement, it cannot be applied for the operational problem like not meeting delivery schedule, which was their chronic problem. Hence, they were unenthusiastic to go for Six Sigma to tackle their problem in question. On quality front as discussed above, they were quite comfortable but they were not enjoying the benefits of world-class quality and competitive and state of the art infrastructure what they were already having owing to the problem of failure in meeting delivery commitments.

Improving customer delivery commitments the Six Sigma way 31
A brief summary of all the measure they tried until now to tackle their problem in question was presented to them. They had tried many quick-fix solutions such as close control on the movement of materials on the shop floor, frequent follow-ups with the suppliers and sub-contractors etc., but could not get the expected results. The basic lacuna in all the improvement efforts they were putting was that they were assuming the causes of the problem and then attacking them. They never tried to dig into the real cause of the problem. They stick to the general belief that since delivery is the problem then solution lies in the production planning and control only.
On appraising the basics of DMAIC methodology, they realised that the chronic problem being faced by them needs the systematic treatment involving exact definition of the problem, analysis of facts and figures, uncovering the real root causes and then charting the suitable solution and ultimately holding the gains. It was appraised to them that for overall operational excellence and long-term sustainability, Six Sigma is the right strategy.
4.4 Case explanations
4.4.1 The company
The company selected for the study is a small scale general engineering firm engaged in manufacturing a variety of products falling under a broad product range of Sanitary Stainless Steel Valves and Fittings, catering to the demands of industries such as Dairy, Brewery, Winery, Cosmetics, Biotech, Pharmaceuticals etc. Operation is mainly of ‘Made to Order’ nature. Design and specifications as demanded by the customers are being met and the company reiterated that their capability is to provide a solution to a special need of the customer by modifying standard products and create new, tailor made design to fit specific and unique application. Around 90% of the company’s output is being exported, especially to USA.
4.4.2 DMAIC methodology
The original problem-solving process for Six Sigma developed from Motorola was MAIC which means Measurement-Analysis-Improvement-Control. Later, DMAIC instead of MAIC was advocated from GE where D stands for Definition. DMAIC is mostly used as a unique problem-solving process in manufacturing areas (Park, 2002).
4.4.3 Define
This phase defines the project. It identifies critical customer requirements and links them to business needs. It also defines a project charter and the business processes to be undertaken for Six Sigma. The saying that ‘well begin is half done’ is true in case of DMAIC methodology of Six Sigma drive also. The first phase ‘Define’ is one of the most critical phases of the whole technique. It defines the problem with specifications and time-period. This makes it clear to visualise the magnitude and intricacy of the problem. Therefore, if required, maximum time and efforts should be allocated to this phase in the DMAIC drive.
The following techniques were adopted in the subject project at Define stage (Eckes, 2001).

32 D.A. Desai
a creating the team charter
b identifying the customers of the project, their needs and requirements
c creating a high-level process map for the project.
a Creating team charter
The team charter is the most important element of any methodology. For the problem in question, following elements were considered in team charter
• the business case
• the problem statement
• goals and objectives.
The business case
A common problem with many initial Six Sigma drives is the project’s lack of impact on business. The proposed improvement drive should have strong impact on the strategic business objectives. The business case for the company in question is created keeping the following strategic business objective at the centre.
“To grow in business by satisfying customers on quality and delivery and adding more products and customers.”
For this strategic business objective, project of improving on customer delivery commitments was chosen as a result of the discussions held with the chief of the company and other senior executives.
The problem statement
As the problem area was well identified during business case discussions, now it was time to decide on the qualified problem statement. At first instance, it appeared that production planning and control (PPC) is the problem area and hence the problem statement should be …
“PPC is the problem area causing failure in meeting delivery commitments.”
As can be seen, this statement is violating many characteristics of a good problem statement as suggested by Eckes (2001). Here the most important elements of specificity and measurability are missing. Moreover, the statement is jumping directly to the perceived cause by saying that PPC is causing problem. What is causing problem is the truth that is to be uncovered by the project. If we know the real root cause, then the problem would not have been existed.
On further brainstorming, a second statement emerged as … “Not meeting internal production planning targets is causing failure in meeting delivery commitments.”
This too is not a qualified problem statement as many of the important characteristics of a good problem statement are missing here.
Consequently, a statement ‘Not meeting customer delivery commitments’ agreed upon as the preliminary statement. Here the aspects of time-period, specificity and measurability need to be built up on to make it a qualified problem statement.

Improving customer delivery commitments the Six Sigma way 33
As there were no data available regarding performance of the previous delivery commitments, a rigorous search was inevitable to define the problem statement appropriately. Therefore, the last five years data were searched meticulously, tapping all the communications regarding making commitments, agreement of the customers with it and then real dispatches of the committed items. Based on this search and the analysis thereafter, the problem statement was refined as below.
“Since last five years average success rate of meeting customer delivery commitments are 38% with average delay of 48 days from the date of committed delivery.”
Goals and objectives
It is important to set goals and objectives that are achievable within a 120–160-day period. A typical rule of thumb is to reduce the problem by 50% in the 120–160-day window (Eckes, 2001).
Accordingly, goals and objectives worked out for the problem in question and as per the rule of thumb, it is decided to have 50% improvement in the success rate of delivery commitments. Hence, a goal of 50% reduction in the total numbers of items delayed is decided.
b Identifying the customers, their needs and requirements
Depending upon the nature of the problem, customers of the project in question are the ultimate customers who are receiving the products of the company and paying the bills. For identifying requirements of the customers, the critical to quality (CTQ) tree being the most effective one, is applied here (Figure 1). This simple tool helps to move from general needs of the customers to the more specific requirements.
c Creating the High-Level Process Map
Here, in this last area of Define phase, a high-level picture of how the affected process currently operates is created. This helps in determining what in the process is not operating, as it should be. The High-Level Process Map is as shown in Figure 2.
Figure 1 CTQ tree

34 D.A. Desai
Figure 2 High-level process map
This high-level process map was created based on Suppliers-Inputs-Process-Outputs-Customers (SIPOC) model. The guidelines for creating high-level process map are as below (Eckes, 2001).
1 Define the process to be mapped. It is an obvious choice for the problem in question here, that the process to be selected for high-level mapping should be the one having direct impact on making delivery commitments to the customers. Hence, the decision for high-level process mapping was ‘The process of making delivery commitments to the customers’.
2 Establish the start and stop points of the process (process boundaries). As the process is of making delivery commitments, it is decided, after brainstorming with all involved, to have the following start and stop points.
“Start Point: Receipt of order and Stop Point: Dispatch of product”.
3 Determine the output of the process. It is obvious choice here that the output should be the ‘product’ dispatched to the customers.
4 Determine the customers of the process. Here, customers are the real customers of the firm who are paying the bills.
5 Determine the requirements of the customers. This is done in previous step of Define (CTQ tree).
Improving customer delivery commitments the Six Sigma way 35
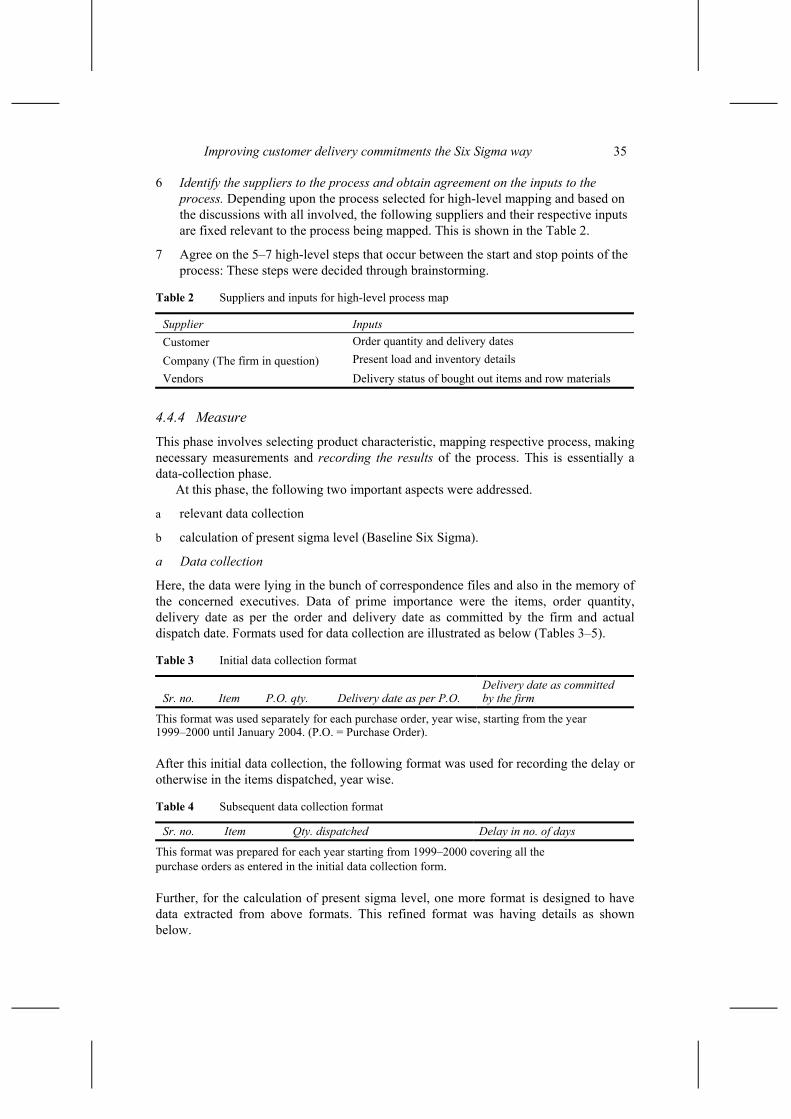
6 Identify the suppliers to the process and obtain agreement on the inputs to the process. Depending upon the process selected for high-level mapping and based on the discussions with all involved, the following suppliers and their respective inputs are fixed relevant to the process being mapped. This is shown in the Table 2.
7 Agree on the 5–7 high-level steps that occur between the start and stop points of the process: These steps were decided through brainstorming.
Table 2 Suppliers and inputs for high-level process map
Supplier Inputs Customer Order quantity and delivery dates
Company (The firm in question) Present load and inventory details Vendors Delivery status of bought out items and row materials
4.4.4 Measure
This phase involves selecting product characteristic, mapping respective process, making necessary measurements and recording the results of the process. This is essentially a data-collection phase.
At this phase, the following two important aspects were addressed.
a relevant data collection
b calculation of present sigma level (Baseline Six Sigma).
a Data collection
Here, the data were lying in the bunch of correspondence files and also in the memory of the concerned executives. Data of prime importance were the items, order quantity, delivery date as per the order and delivery date as committed by the firm and actual dispatch date. Formats used for data collection are illustrated as below (Tables 3–5).
Table 3 Initial data collection format
Sr. no. Item P.O. qty. Delivery date as per P.O. Delivery date as committed by the firm
This format was used separately for each purchase order, year wise, starting from the year 1999–2000 until January 2004. (P.O. = Purchase Order).
After this initial data collection, the following format was used for recording the delay or otherwise in the items dispatched, year wise.
Table 4 Subsequent data collection format
Sr. no. Item Qty. dispatched Delay in no. of days
This format was prepared for each year starting from 1999–2000 covering all the purchase orders as entered in the initial data collection form.
Further, for the calculation of present sigma level, one more format is designed to have data extracted from above formats. This refined format was having details as shown below.

36 D.A. Desai
Table 5 Refined format for present sigma level calculation
Sr. no. Item Qty. delayed Delay in no. of days
This format was prepared for each year as well as for overall data of last five years dispatches.
The operational definitions of quantity dispatched and quantity delayed were decided collectively as below: • quantity dispatched: number of items, from respective purchase order, dispatched
from the factory premises to the customer destinations. • quantity delayed: number of items not dispatched on committed dates.
These data then were used for present sigma level calculation through DPMO methodology as explained below.
b Baseline Six Sigma calculations
Present sigma levels were calculated for regular and urgent items based on DPMO method since the data were discrete.
Accordingly, for the project in question, the following items were identified for baseline Six Sigma calculation using DPMO methodology • unit: items dispatched • defect: items delayed with respect to commitments made by the firm • opportunity: CTQ as arrived in Define phase. (Success rate of all the items and
urgent items – two CTQs).
Accordingly, DPMO numbers were calculated and the corresponding sigma levels were traced out from the DPMO-Sigma level relation table.
The work of Measure phase ended here, after the calculation of the present performance level. Table 6 summarises this phase.
Table 6 Summary of measure phase
What to measure?
Type of data Operational definition
Data collection formats
Sampling (%)
Baseline Six Sigma
Success rate of the items dispatched
Discrete Dispatch of the products from factory premises on the date as committed to the customers
As shown above 100 2σ
Success rate of the urgent items dispatched
Discrete Dispatch of the urgent items from factory premises on the date as committed to the customers
As shown above 100 1.65σ

Improving customer delivery commitments the Six Sigma way 37
4.4.5 Analysis
In this phase, an action plan is created to close the ‘gap’ between how things currently work and how the organisation would like them to work in order to meet the goals for a particular product or service.
During this phase, a two-fold analysis was conducted as explained below.
a data analysis
b process analysis.
a Data analysis
Data collected during Measure phase were analysed on the following criteria for the last five years • overall delivery success rate, that is, the ratio of total numbers of items dispatched on
time over total items dispatched during that year • overall average delay in numbers of days year wise • product category-wise delivery success rate • contribution of different product groups in last five years sales • product category-wise contribution in delay year wise • product category-wise average delays in numbers of days year wise.
This analysis threw light on the problematic items in terms of their contribution to the delay. The problem product group was also having major share in sales turnover. This was the clear indication that improvement in the success rate and reduction in average delay in these categories can dramatically improve overall performance.
b Process analysis
In process analysis, the following tools and techniques were adopted • sub-process mapping • root-cause analysis (Open – Narrow – Close)
• open root cause analysis – Cause effect diagram
• narrow root cause analysis – Multi voting and Pareto charting
• close root cause analysis – Five-why technique.
Sub-process mapping
Sub-process map was created for the step of ‘comparing requirements with present load’ since this step was found the most critical in deciding the delivery dates and then committing the same to the customers. Since more thrust is on the data analysis, in this project, detailed sub-process mapping for each high-level step was eliminated.
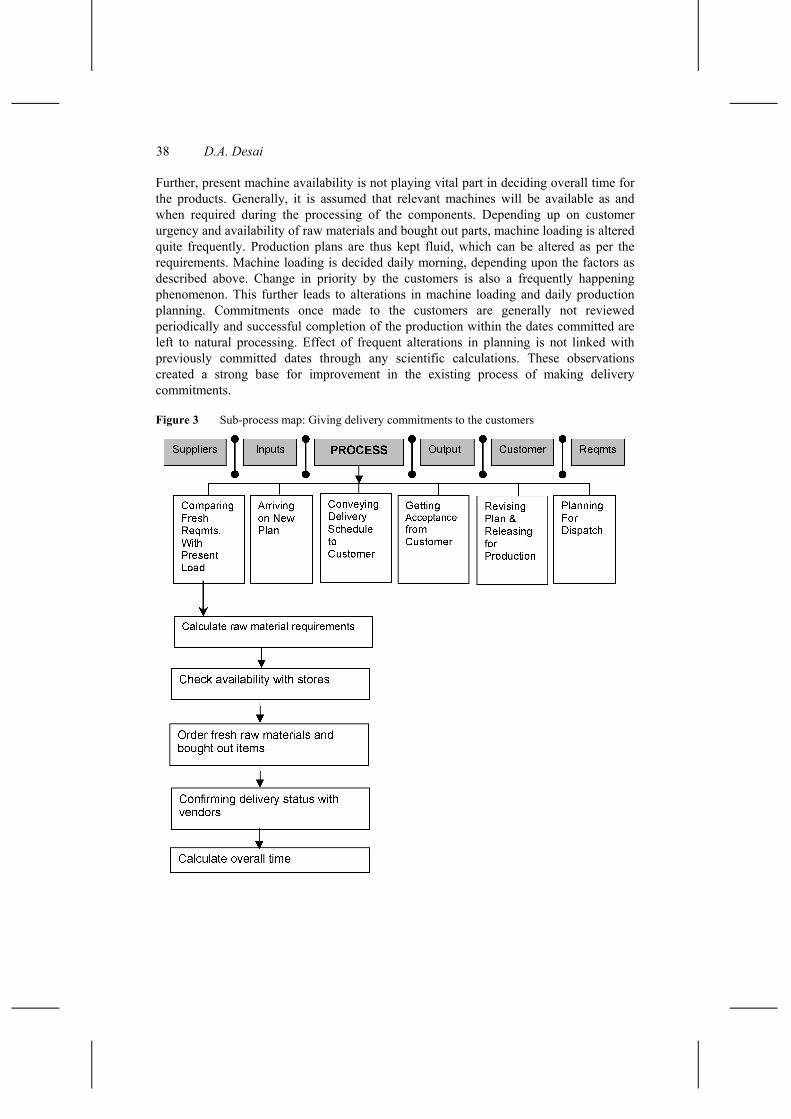
Figure 3 shows ‘as is’ process steps. As the steps indicate, the process on arriving on the overall time of the product is dependant on the internal process time of the product as well as the lead-time of the bought out items. On further investigation, it was learnt that the internal processing times of different products are arrived based on the past experience and not with the help of any time-study records of the respective products.
38 D.A. Desai
Further, present machine availability is not playing vital part in deciding overall time for the products. Generally, it is assumed that relevant machines will be available as and when required during the processing of the components. Depending up on customer urgency and availability of raw materials and bought out parts, machine loading is altered quite frequently. Production plans are thus kept fluid, which can be altered as per the requirements. Machine loading is decided daily morning, depending upon the factors as described above. Change in priority by the customers is also a frequently happening phenomenon. This further leads to alterations in machine loading and daily production planning. Commitments once made to the customers are generally not reviewed periodically and successful completion of the production within the dates committed are left to natural processing. Effect of frequent alterations in planning is not linked with previously committed dates through any scientific calculations. These observations created a strong base for improvement in the existing process of making delivery commitments.
Figure 3 Sub-process map: Giving delivery commitments to the customers

Improving customer delivery commitments the Six Sigma way 39
Root cause analysis: open
After rigorous brainstorming, 14 ideas were generated as the probable causes for the problem of ‘not meeting customer delivery commitments’. These initial ideas were categorised as shown in the Cause-Effect Diagram in Figure 4.
Root cause analysis: narrow
During this stage of analysis, multi-voting was done. Approach to multi-voting is subjective. Here, the team members were asked to vote each cause based on their understanding of the most probable to least probable root cause for the problem at hand. The causes were voted by the team on a scale of 1–5, with 5 as the most probable root cause for the problem at hand and 1 as the least probable cause.
Based on the result of multi-voting, the list of the probable root causes was reduced to ten from 14 causes. The causes that got average ranking 2 and below were dropped from the list. A revised list was then prepared as shown below in Table 7 and based on this result Pareto chart (Figure 5) was drawn for further analysis.
Figure 4 Cause-effect diagram

40 D.A. Desai
Table 7 Multi-voting result
Cause no. Cause Average ranking
1 No evaluation of past commitments 2.3 2 No scientific basis for commitments 2.7 3 No time-study data for commitment 2.7 4 Delay owing to raw materials 2.7 5 Developmental items 3 6 Frequent alterations in planning 3.3 7 P.O. wise status not readily available 3.3 8 Production capacity unknown for different product mix 3.3 9 Delay owing to bought out items 3.7 10 DMC is the bottleneck machine 4.3
Figure 5 Pareto diagram of probable root causes – multi-voting results
Root cause analysis: close
All the root causes as short-listed after multi-voting were scrutinised individually through the ‘five-why’ technique. A list of questionnaire was prepared for each cause asking why it occurred and then capturing the as many answers as possible for each question.

Improving customer delivery commitments the Six Sigma way 41
Questionnaire for ‘Five-Why’ technique
1 why DMC is becoming bottleneck?
2 why bought-out items are being delayed?
3 why frequent alterations in planning are made?
4 why P.O. wise status is not readily available?
5 why monthly/yearly production schedule is unknown for different product mix?
6 why developmental items are being delayed?
7 why commitments are given without the help of time-study data of the products?
8 why commitments are given without any scientific basis?
9 why raw materials are being delayed?
10 why there is no system for the evaluation of the past commitments?
Answers to the questions of five-why technique formed the basis for improvement efforts.
4.4.6 Improve
This phase involves improving processes/product performance characteristics for achieving desired results and goals. This phase involves application of scientific tools and techniques for making tangible improvements in profitability and customer satisfaction. At this phase, the following procedures were adopted.
a setting improvement targets
b designing improvement measures
c drawing improved process.
a Setting improvement targets
Present sigma level for overall delivery commitments was 2 as worked out during Measure phase. The approved thumb rule of 50% improvement in the first effort of Six Sigma drive was applied here to set targets which should result from the Improve measures. Accordingly, based on the last years sales data (9000 items dispatched, and total items delayed were 5580) targets worked out for 50% improvement, keeping the sales figures same for the following year (that is, total dispatch of 9000 items). As per the 50% improvement criteria, the total items allowed to be deled for next year would be 2790 (half of 5580). This is equivalent to 2.5 Sigma level based on DPMO calculations. Accordingly, target for urgent items were also set which turned out as 2.3 Sigma level.
b Designing improvement measures
Based on the root causes and the answers emerged from the five-why technique, the following improvement measures were worked out.
1 preparing Master Record of each product: it will have details pertaining to time and method study and process engineering
2 regular vendor rating

42 D.A. Desai
3 vendor development
4 conveying annual requirements, procurement patterns and pipeline requirements in advance to the vendors for effective planning at their end
5 keeping provision to stock raw materials and bought out items for the two most critical product categories, Butterfly Valves and Ball Valves, as identified in analysis phase
6 for developmental items, delivery commitments for the bulk lot should not be given until they converted into regular item
7 design and implement P.O. analysis as per the specially designed formats
8 production planning should be done as per Master Production Schedule and Machine Loading Chart.
A correlation was drawn indicating which improvement measure will address which route cause as shown in Table 8.
Table 8 Improvement measures and their relation with root causes
Root cause Addressed by the measure no. Delay owing to bought out items 2,3,4 and 5 Production capacity unknown for different product mix 1 P.O. wise status not readily available 7 Frequent alterations in planning 8 Developmental items 6 Delay owing to raw materials 2,3,4 and 5 No time-study data for commitment 1 No scientific basis for commitments 1,7 and 8 No evaluation of past commitments 7
The problem of one of the machines, DMC, becoming a bottleneck was addressed since the company installed a second machine of the same capacity. Hence, that root cause has been eliminated from the improvement drive.
c Drawing improved process
The ‘as is’ sub-process in the Measure phase modified incorporating the improvement measures and the revised sub-process drawn for the step of ‘comparing requirements with present load’ as in Figure 6.
4.4.7 Control
The basic objectives of this phase are to ensure that our processes stay in control after the improvement solution has been implemented and to quickly detect out of control state and determine the associated causes so that actions can be taken to control the problem before non-conformances are produced. Depending up on type of the problem and operating system of the concern, the following control measures were recommended:
• periodic review of the various solutions
• continuous watch on the success rate of meeting delivery commitments.

Improving customer delivery commitments the Six Sigma way 43
Figure 6 Improved process of making delivery commitments
4.5 Benefits of the project to the company
The objective of introducing the Six Sigma -DMAIC methodology to the firm by applying it on the most chronic problem faced by them was successfully achieved.
The implementation of it resulted in understanding the problem from all facets, qualitatively as well as quantitatively, and laying out the improvements through effective analysis of the roots of the problem.
The firm has set up a dedicated Industrial Engineering Department to implement and maintain the improvement measures laid down. The target set for improvement, that is, allowing 50% less quantity to be delayed, fetched multiple benefits to the concern, such as, converting developmental products into regular production, taking up new products development and expanding customer bases. These were not possible earlier since they were fully engrossed in pushing the items on committed dates and shortening the gaps between committed and actual dispatch schedules. All these put together, the firm reported around 25% increase in their turnover by satisfying existing customers and developing new business.
Apart from the primary benefit of introducing Six Sigma business improvement strategy to the firm, other major secondary benefits are summarised as below:

44 D.A. Desai
• The existing problem of poor performance in meeting customer delivery commitments was quantified making the reflections of the efforts put in by the firm clear on meeting delivery commitments for the period of last five years
• The problem that existed at the back of the mind of the chief of operations was made crystal clear with multidimensional datum
• The major ‘culprits’ causing the problem of failing in meeting delivery commitments were discovered
• The approach of DMAIC methodology was applied successfully to the existing problem and even though the grounds were not conducive for the full utilisation of different tools of the technique, effective improvements were drawn out compatible with the present operating system
• A wide-ranging system of effective planning of production, keeping the entire infrastructure in view, was set up leading to higher success rate of meeting delivery commitments
• Targets for the next year were set up for the overall success rate as well as for the urgent items.
4.6 Lessons learned, things went great and difficulties faced
One of the most important lessons learned, as agreed by the chief of the operations and others too was that never try to device corrective actions based on perceived causes. Until the application of DMAIC methodology, they were putting rigorous efforts to reduce the cycle time of the individual product. They were thinking that they must squeeze the total time to convert the raw material into finish products. This may improve the success rate of meting delivery commitments. However, the real causes were totally different, as uncovered through the project.
Moreover, the firm understood what makes a good Six Sigma project? As pointed out by Snee (2001) that project selection is the Achilles’ heel of Six Sigma. One quickly learns that if projects are not selected properly the Six Sigma initiatives can be at risk: Projects don’t deliver the expected bottom-line results, the organisation becomes frustrated with the effort, and, slowly but surely, attention and resources are focused on other initiatives. Selection of the chronic problem of not meeting delivery commitments and aligning it with the top most business objective, made the impact of project selection for Six Sigma crystal-clear to the firm.
The dimensions to successful Six Sigma projects, apart from project selection, as pointed out by Snee (2001) such as, baseline, goal and entitlement are well defined; support and approval of the top management, completion in a timely fashion (3–6 months), support and involvement in the project by a variety of functions and management review to keep the project focused on schedule were all incorporated in the project in question. This made the Six Sigma more clearly understood by the firm.
Apart from this, the fear regarding involvement of extensive statistics in Six Sigma was diluted and this breakthrough strategy, which was initially thought out of reach of the small scale entrepreneurs, appeared at top in the list of problem solving and improvement techniques.
Improving customer delivery commitments the Six Sigma way 45
Involvement of the chief of the operations throughout the project was one of the great things, since without top management commitment and devotion any improvement drive will not succeed in its true sense.
The firm being small scale engineering industry and operations purely of jobbing in nature, some of the typical hindrances that came across were lack of proper documentations, intractability of past records, unavailability of technical details and records of the products, such as bill of materials, processing time etc. These inherent limitations made the work of data collection quite cumbersome and made the Define phase tedious and lengthy. Much effort was diverted to proper data collection initially making the contribution of time and efforts at other phases limited. However, this was necessary as the authentic and sufficient data are the backbone of success of DMAIC methodology.
Validation of root causes that were fixed was done based on the approval of the chief of the operations and other key personnel. Ideally, brainstorming session need to be conducted for the same, but looking at number of root causes, time proved to be the major constraint. Each root cause fixed could not be examined for its occurrence frequency and therefore its impact on the problem. This is once again owing to fixing of large number of root causes. However, this was necessary as the problem was of such a nature requiring consideration on all the causes for overall improvement.
4.7 Next phase of the study
Application of Six Sigma methodology on one of the chronic problems uncovered the scope of following further study and research in the firm.
• The root causes fixed during this project can be taken up separately one by one and their individual impact on the problem can be further analysed with tools such as frequency distribution of occurrence of each root cause, correlation and regression analysis and design of experiments.
• Application of tools involving more statistical analysis. Since this was the introductory initiative, rigorous statistical analysis was not adopted.
• Application of DMAIC methodology at other areas such as, accounts receivable, shortening development time of the new products, reducing customer complaints etc. and ultimately deploying Six Sigma company-wide.
5 Conclusion
Overall, operational excellence is the basic success factor for SSI sectors to be competitive globally. They need to drop the slogan of satisfying customers and rigorously strive for customer delight. At the same time, overall economics also need to be kept under constant watch. SSI sectors are constantly on the alert to gain a competitive edge, using the many tools and techniques that have long been flaunted as a way to beat the competitions. Yet, there remain one basic constraint, that is, organisations that produce better quality products and services, on time, than their rivals beat the competition time and again. For global competitiveness, many techniques, such as Quality Circles, TQM, ISO Certifications, etc. are being tried. But still, the focus remains on specific problem

46 D.A. Desai
solving. The need of the hour is to strike global optima and not to waste time, money and energy in finding local optima. The SSI sectors need a breakthrough strategy, which can have multidirectional benefits in shorter duration.
Six Sigma has already immerged as one of the most effective business strategies in the large organisations, worldwide. Small industries are inherently capable of adopting Six Sigma as breakthrough strategy but they need to show the roadmap. The multiple gains achieved by this initial effort of Six Sigma on one of the problems of the company are attractive enough for them to deploy Six Sigma company-wide. Project by project application of Six Sigma in SSI sectors can strengthen their understanding about this strategy along with consolidating on the gains from it. Six Sigma among the small industries is a much-awaited movement, which can strengthen their bottom lines vis-à-vis contribute in uplifting global economy.
Acknowledgements
I would like to thank the editor and the reviewers for their creative comments, which helped me to formulate this paper in better shape. I would also like to thank the concern where the subject study was undertaken.
References Antony, J., Kumar, M. and Mandu, C. (2005) ‘Six sigma in small and medium sized UK
manufacturing enterprises: some empirical observations’, International Journal of Quality and Reliability Management, Vol. 22, No. 8, pp.860–874.
Basu, R. (2001) ‘Six Sigma to fit Sigma – What’s next in the evolution of Six Sigma? Agility, efficiency and sustainability integrated across the enterprise’, IIE Solutions, July, pp.28–33.
Eckes, G. (2001) The Six Sigma Revolution, How General Electric and Others Turned Process Into Profits, John Wiley & Sons, Inc., USA.
Economic Survey (2001–2002) Government of India, Ministry of Finance, Economic Division. Edgeman, R.L. and Bigio, D.L. (2004) ‘Six Sigma in metaphor: heresy or holy writ?’, Quality
Progress, January, pp.25–30. Khanna, V.K., Vrat, P., Sahay, B.S. and Shankar, R. (2002) ‘Six Sigma in Indian automobile
sector’, Productivity, Vol. 43, No. 2, pp.208–214. Kuei, C-H. and Madu, C.N. (2003) ‘Customer–centric Six Sigma quality and reliability
management’, International Journal of Quality and Reliability Management, Vol. 20, No. 8, pp.954–964.
Kulkarni, P.R. (2002) ‘Rehabilitation of sick small scale industry units’, Productivity, Vol. 43, No.1, pp.123–132.
Kumar, V., Garg, D. and Mehta, N.P. (2002) ‘JIT/TQM in Indian industries’, Productivity, Vol. 43, No. 2, pp.215–224.
Lucas James, M. (2002) ‘The essential Six Sigma’, Quality Progress, January, pp.27–31. Man, J. (2002) ‘Six Sigma: Singapore’s response to the DMAIC challenge’, Productivity, Vol. 43,
No. 2, pp.184–187. Park, S.H. (2002) ‘Six Sigma for productivity improvement: Korean business corporations’,
Productivity, Vol. 43, No. 2, pp.173–183.

Improving customer delivery commitments the Six Sigma way 47
Snee, R.D. (2001) ‘Dealing with the Achilles’ heel of Six Sigma Initiative – project selection is a key to success’, Quality Progress, March, pp.66–72.
Snee, R.D. (2004) ‘Six Sigma: the evolution of 100 years of business improvement methodology’, Int. J. Six Sigma and Competitive Advantage, Vol. 1, No. 1, pp.4–20.
Verma, R. (2005) ‘Performance of small-scale industries (pre and post reform period)’, Udyog Pragati, Vol. 29, No. 2, pp.35–41.
Waxer, C. (2004) ‘Is six sigma just for large companies? what about small companies?’, www.sixsigma.com/library/content.