Embed Size (px)
Citation preview

Multimed Tools ApplDOI 10.1007/s11042-012-1127-8
Improving 3D navigation techniques in multiscaleenvironments: a cubemap-based approach
Daniel Ribeiro Trindade · Alberto Barbosa Raposo
© Springer Science+Business Media, LLC 2012
Abstract Navigation in virtual 3D environments, especially those with multiscalefeatures, is still a problem for many users. In this regard, a good design of thenavigation interfaces is critical to ensure that the users navigate with the best possibleefficiency and comfort. In this paper, we present improvements for two well-knowninterfaces: f ly, including support to collision treatment and automatic navigationspeed adjustment in relation to scale, and examine, with automatic pivot point. Suchtechniques are based on the cubemap structure, which provides information aboutthe surrounding environment at each instant. Usability tests with both beginner andadvanced users revealed that the proposed techniques created a significant improve-ment in the execution of navigation tasks and a reduction in navigation errors.
Keywords Navigation · Multiscale environments · Cubemap · Interaction techniques
1 Introduction
With the development of new technologies and the increasing processing power ofcomputers, larger and more detailed 3D virtual environments are becoming morecommon. Accordingly, several navigation tools were created to help users to explorethese environments. However, despite the efforts of researchers, navigation in virtualenvironments is still problematic for many people.
D. R. Trindade · A. B. Raposo (B)Tecgraf/Department of Informatics, Pontifical Catholic University of Rio de Janeiro,Rio de Janeiro, Brazile-mail: [email protected]
D. R. Trindadee-mail: [email protected]

Multimed Tools Appl
There are a number of reasons for this. For example, when using a navigation tool,difficulty can arise from either a users’ lack of knowledge about the tools’ usage orfunction, or poor design of the tool itself [6]. Another frequent problem is relatedto the type of environment being explored. Multiscale virtual environments [15], forinstance, often require methods to allow the users to navigate through the differentscales of the environment. Multiscale environments provide information in differentlevels of detail, ranging from a single screw to an oil field spanning dozens of miles.
Our goal is to propose techniques that help users, especially novice ones, navigatethrough multiscale environments. The solutions proposed should satisfy two mainrequirements: a) maximum automation, therefore demanding minimal interventionby the user, and b) independence from the type of model being viewed, so thatnew types of objects can be viewed in the future without the need to develop newsolutions. Moreover, the solutions are intended to work on desktop setups, usingmouse and keyboard, as this setup is more common to most users [16].
In this paper, we improve on two well known navigation techniques. In the caseof the f ly technique, we added collision support and automatic speed adjustmentin relation to the scale; in the examine technique we added a way to automaticallydetermine the pivot point.
This paper is organized as follows. In Section 2 we present related work. Thecubemap concept is presented in Section 3. In Section 4, the navigation techniquesare described, and in Section 5 the results of usability tests are presented. Section 6concludes this article.
2 Related work
Navigation in virtual environments has been studied by many researchers. The maingoal of most of these studies is to propose and analyze techniques that facilitatethe task of exploring such environments. As an example, Ware and Osborne [19]proposed three different navigation tools: eyeball in hand, scene in hand, and f lyingvehicle control. They concluded that none of these three techniques by thenselvesare able to fulfill all user needs. The same conclusion was reached by Fitzmauriceet al. [6], who analyzed the behavior of some users of 3D applications and introducedtechniques to improve the interface of some tools. Also seeking to propose newinteraction solutions, Mackinlay et al. [13] introduced the point of interest (POI)technique, in which the user must first choose a destination point and then thecamera starts to move toward the chosen point, changing its speed in relation to theremaining distance. Tan et al. [17] proposed a hybrid solution in which the f ly andexamine tools are combined into a single interaction technique.
Multiscale environments were first introduced in the literature by Perlin andFox [15] and Bederson et al. [3], through the creation of the Pad and Pad++interfaces. These developments have been the focus of many researchers [7, 9, 22].To give users a sense of scale of the environment, Glueck et al. [8] provides a gridreference. This is modified consistently with the camera position: as the camera getscloser, the grid is subdivided in more pieces. As the scale of the grid is known, it ispossible to identify the scale of the objects by comparing these with the grid. Besidesthe grid reference, they also provides position pegs, which consist in projecting theobject on the grid. Through the size of this projection and a connection between this

Multimed Tools Appl
and the grid, it is possible to identify the relative distance of objects. Although theyprovide information that helps in identifying the scale, that is not used to modifyparameters related to navigation. Kopper et al. [12] presented a system that allowsthe user to navigate through the different scales of an environment. The hierarchyof the scene models is used to define the levels of scale. However, with this approachthe user is forced to issue a command to change between scales. Moreover, theadjustment of navigation parameters is only made at time of the command. Thus,one can say that the method proposed by Kopper et al. [12] is discrete in the sensethat the different scale levels are well defined regarding their form and their locationin the hierarchy of the scene. By contrast, the works presented by Ware and Fleet [20]and McCrae et al. [14] make continuous adjustments to the navigation parameters.Therefore the virtual environments do not require a well defined hierarchy of levelsof scale. Ware and Fleet [20] proposed adjusting the navigation speed of the f ly toolby using the depth information present in the Z buf fer. To this effect, they use thesmallest value resulting from scanning 15 lines of the Z buf fer. McCrae et al. [14]constructed a representation of the environment called cubemap, which providesinformation that allows the adjustment of parameters such as speed and clippingplanes, as well as offering collision support.
To deal with collisions, Baciu et al. [1, 2] presented image space based techniqueswhich consist of projecting the geometry onto an image using graphics hardwareand then checking for interference, usually by analyzing the Z buf fer. Calomeni andCeles [4] proposed the construction of a connectivity graph in preprocessing time.Through this graph, they are able to move the camera in order to avoid collisionswith the environment. This concept was also explored by Xiao and Hubbold [21],who used force fields rather than a connectivity graph. Nonetheless, a preprocessingstage is still required to compute the fields. McCrae et al. [14] proposed using a newstructure, which they call a cubemap, to help construct the force map with higherresolution while eliminating the preprocessing stage altogether.
Some of the problems related to the pivot point were identified by Fitzmauriceet al. [6] . In their work, the pivot point is chosen manually by the user via a menuoption. The pivot point is also drawn on the screen, which allows, according to theauthors, the users to have a better understanding of the behavior of the examinetool. To inspect objects, they use a widget called ViewCube [11]. This is a cube drawnon the corner of the screen and the object is rotated by means of this cube. Khanet al. [10] developed a new tool for object inspection called hovercam. When farfrom the object, this tool works like an examine. When close, it has the behavior of apan operation, making the camera to move parallel to the faces of the object. This isdone by continuous updating the pivot point to the nearest point of the scene. UnlikeFitzmaurice et al. [6], the choice of the pivot is automatic on hovercam. When theuse of hovercam begins, the camera is reoriented toward the location of the nearestpoint. However, this may conflict with the user intent of inspecting a specific object.For example, in a scene containing several objects, the camera could be reoriented toan object wich is not being visualized (because it is the closest one), when in fact theuser’s intent was to inspect another object that, although further, was in its angle ofvision. Moreover, their first implemented of hovercam required the pre-computationof a sphere-tree structure in order to determine the closest point. This was resolved ina second version, when McCrae et al. [14] reimplemented the tool using the cubemapdetermine the closest point.

Multimed Tools Appl
The techniques introduced in the present paper are also based on the cubemap.However, the approach taken to construct the cubemap and the navigation tech-niques based on it had to be modified in order to fulfill the requirements of ourapplications, as will be described in the following sections.
3 The cubemap
The purpose of the cubemap, as proposed by McCrae et al. [14], is to provideinformation about the virtual environment at a given moment. Given a cameraposition, this structure is constructed from 6 rendering passes, each in a differentdirection in order to cover the whole environment. The FOV of the camera is 90◦,therefore the combination of the 6 resulting frustums yields a cube. At each pass, ashader is used to calculate the distance from the fragment generated to the camera.The computed distance values are normalized in relation to the near and far values,and stored in the alpha channel of the positions related to the fragments. Renderingis made in 32-bit float images. This procedure is performed at each frame, or eachtime the camera position changes. The image resolution used for rendering does nothave to be high, since only an estimate needs to be obtained.
The cubemap construction process we implemented differs from the one describedby McCrae et al. [14] in two aspects: the orientation of the cubemap is the sameas that of the camera (McCrae et al. always used canonical directions); and theRGB channels of the images in the cubemap store a unit vector pointing from theposition of the generated fragment to the camera. The first change was necessaryto simplify the process of obtaining the distance from the viewer to the center ofthe screen, which will be important for the automatic speed adjustment techniquesof f ly (Section 4.1) and for the automatic definition of the pivot point in examine(Section 4.3). The second change simplifies the construction of the force map todetect collisions (Section 4.2).
4 Navigation techniques
In this section we will present the three improved navigation techniques.
4.1 Fly with automatic speed adjustment
Navigation speed is related to the scale of the environments to be explored. Largerenvironments require faster speeds, while the opposite is more convenient on smallerscales.
In several applications, the scale of the virtual world does not change much and iswell known, allowing a fixed navigation speed to be used. This is the case for manygames, for instance. Multiscale environments, however, require a way to estimate thecurrent scale in order to adjust the navigation speed accordingly.
McCrae et al. [14] use minDist, the minimum distance in the cubemap, as anestimation to determine the current scale the camera is at. Based on that, first wedeveloped a f ly tool which could be controlled by the user by pressing the arrowkeys of the keyboard to move the camera while guiding the direction of the motion

Multimed Tools Appl
with the mouse movements. Navigation speed was adjusted automatically accordingto this equation:
Vnav = k minDist (1)
where Vnav is the adjusted navigation speed and k is a parameter of unit 1/s thatcauses an increase or reduction in the acceleration applied to the camera. Wenoticed that two situations caused discomfort and disorientation for some users.The first situation is when k is too high. In this situation, when users move awayfrom the geometry, the camera accelerates too quickly, producing an effect similarto teleporting and making users lose their location. The second situation happens forlow k values, which can considerably increase the time required to reach the intendeddestination, making the navigation tedious. Thus, the value of k should be selectedin a way that it balances these extremes.
In face of the difficulty in determining a value for k that suited all users, we decidedto let the users define it manually, using the scroll button of the mouse. However, thisled to other problems. When navigating very close to an object, some users increasedthe k value to move faster but forgot to readjust it when the camera was distant fromthe geometry, falling into a situation where k is too high.
These examples revealed the disadvantage of using only minDist as an estimationto adjust the speed; when minDist is too low, it works as a break even when the userwishes to move faster. For instance, when navigating through a corridor, the user mayexperience slow navigation due to the closeness of the walls. Thus, it is convenient touse some other type of estimation.
With that goal in mind, we attempted to use the distance to the central point of thescreen. This seemed reasonable since this point represents momentarily the locationthe user wants to reach. Therefore, navigation speed started to be adjusted usingcenterDist, the distance from the camera to the center of the screen, rather thanminDist.
However, the use of centerDist resulted in a strange behavior. The motion ofthe camera started to present peaks of speed, giving the impression that it stoppedor accelerated instantly. The reason for this can be understood by observing thegraph in Fig. 1. This graph shows the behavior of the curves of the minDist andcenterDist estimations for one path followed by the camera in a time interval ofaround 6 seconds.
Fig. 1 Graph representing thebehavior of the minDist andcenterDist curves
Distance x Time
(s)
(m)
0
400
800
1200
1600
0.0 1 6
minDist
centerDist
2 3 4 5
Multimed Tools Appl
It can be seen that the minDist curve is smooth while the centerDist curve isnoisier, displaying some peak values that are completely inconsistent with the generalbehavior of the curve. This is related to the freedom the f ly tool gives to the user, whocan turn the camera to any direction at any time. At a given moment, the centralpoint of the screen may fall on an object that is distant from the camera. The userthen can turn the camera almost instantly toward a close-by object, leading the valueof centerDist to drop abruptly. This is reflected in the speed adjustment, creatinga steep deceleration. The opposite is also a problem. If, for example, the camerais inside an object and the user unwillingly points the camera toward an externalpoint, the camera will be subject to a fast acceleration and will be thrown outside theobject. These effects do not happen when minDist is used as estimation because it isindependent from the orientation of the camera.
To avoid the situations caused by the peak values of the centerDist curve, weapplied an exponential moving average (EMA):
EMAi = EMAi−1 + A(centerDisti − EMAi−1
)(2)
In (2), EMAi is the smoothed value of centerDisti at instant i, EMAi−1 is thevalue smoothed at instant i − 1, and A is a constant that influences how smooth thenew curve will be and how quickly this curve will converge to the centerDist values.The smaller A is, the smoother the curve will be and the higher the time needed forsuch convergence to take place. The maximum value of A = 1 is equivalent to theoriginal curve. Figure 2 shows the results of smoothing an interval of the centerDistcurve (represented by the darker line) for three different values of A.
By smoothing the centerDist curve, we can use it to adjust the speed.But one last problem remained: when the camera is near to an object but points to
a distant place, the navigation speed tends to quickly increase, since centerDist is far.This can lead to undesirable situations, such as when the camera is inside an objectand the user wants to view its exterior. In this case, the user needs to go outside of theobject and then point the camera toward the object again. When leaving the object,the camera might point to a distant location for a period of time long enough toincrease the speed too much. As a result, the camera could move away from theobject before the user is able to adjust the movement. This is because the scale
Fig. 2 Effect of applying theEMA to a curve
Distance x Time
(s)
(m)
1000
1100
1200
1300
1400
1500
2.0 2.4 2.8 3.2 3.6 4.0
Original CurveA = 0.1
A = 0.01
A = 0.04

Multimed Tools Appl
perception provided by minDist is no longer present. In such cases, minDist actsas a break, preventing the camera from moving far away too quickly.
To address this final issue, values of centerDist higher than n × minDist werediscarded. This way, minDist serves as a criterion to decide when a centerDist valueshould or not be considered inconsistent. We found that n = 10 worked well on ourstests.
This solution reflects a hybrid use of the minDist and centerDist estimations: whilecenterDist ensures that speed adjustment is closer to what the user intends, minDistacts as a break in cases where the speed would be too high. The result is increasedcomfort for the user when using this tool, as demonstrated by the usability tests.
4.2 Collision detection and treatment
Preventing the camera from cutting through objects in a virtual environment can becrucial in some situations [5]. In immersive environments, for example, colliding withan object can halt the immersion and leave the user disoriented. Another problemoccurs when a visualization involves a stereoscopy effect; in this case, a collision withan object in the scene can cause physical discomfort to the user’s eyes.
McCrae et al. [14] used information from the distance cube to obtain a collisionfactor that causes the camera to smoothly dodge the closest objects. The idea is thateach point in the cubemap located at a distance smaller than a given radius r producesa repulsion factor given by:
F(x, y, i) = w(dist(x, y, i)) norm(
pos(x, y, i) − camPos)
(3)
w(d) = e(r−d)2
σ2 (4)
where F(x, y, i) is the repulsion factor produced by point p referring to position(x, y) of image i of the cubemap. Value dist(x, y, i) is the distance from p to thecamera. The term pos(x, y, i) is the position of p in world space, and camPos is thecamera position. Function norm(v) indicates the normalized vector of v. In (4), σ isa parameter that indicates the smoothness of the collision factor. The higher σ is,the smoother the calculated factor. Considering a spherical region with radius r andcentered on the camera position, (4) results in determining a collision penalty thatgrows exponentially from the moment when point p enters this region.
The repulsion factors referring to (3) are computed for each position in thecubemap where d < r and then are combined into a single factor:
Fcollision = 1
6 cubeRes2
∑
x,y,i
F(x, y, i) (5)
where cubeRes is the resolution of the distance cube.When we applied the factor given by (5) to the camera, the f ly tool behaved
as described in the previous section: as the camera moves, Fcollision ensured thatit smoothly avoided the objects in its path. The behavior obtained is similar tothe assisted navigation described previously [4, 21], whereby the user can navigatethrough the environment without worrying about choosing a collision-free path asthe system is in charge of this task. It is a different approach from that used by

Multimed Tools Appl
McCrae et al. [14], who employed Fcollision combined with the POI technique, a morerestrictive solution which does not give the user total control over the camera whennavigation is being performed.
4.3 Examine with automatic pivot point
The examine tool allows any object or location in the scene to be inspected. Basically,its function corresponds to rotating the camera around a point, called the pivot point.In our test application, drag movements using the left mouse button made the camerarotate around the pivot point, which can be chosen by the user. Dragging verticallyor horizontally with the right mouse button caused the camera to zoom in or zoomout, respectively. When the scroll mouse button is present, it can also be used forzoom operations. In our implementation collision detection and treatment is nottaken into account when using the examine tool, since it would prevent certain formsof inspection to be performed. For example, zoom out operations can be used tochange the level of scale in which the camera is. If collision treatment is present, thecamera can get stuck due to a surface located behind it.
The location of the pivot point is crucial for the proper functioning of the examinetool. If it is not specified correctly, the camera can display behaviors which, from theuser’s point of view, would seem confusing. Figure 3 illustrates two of these cases.
In case (i), the pivot point (referred to as pivot in the image) is located outsidethe user’s field of vision, too distant from the object to be inspected. When theexamine tool is used, a mathematically correct rotation (from camera position 1 to 2)is made around the pivot. For the user, however, this operation leads to a completelyunexpected motion. This problem is worse when the pivot is located at a greatdistance from the model: the greater the distance, the higher the angular speed of thecamera and, as a consequence, the bigger the error as perceived by the user. Informalobservations showed that this situation occurred rather often in our test application.In the case of (ii), the pivot is within the viewing angle of the camera but is locatedoutside the object of interest. As seen in the image, pivot is beyond the model, andthe rotation around it has the effect of a pan operation.
Fig. 3 Problems related to the pivot point: (i) pivot point located outside the field of vision; (ii) pivotpoint mapped beyond the object

Multimed Tools Appl
Analyzing these situations, it can be concluded that they are basically caused byone reason: the pivot point is not located at a point that adequately corresponds tothe object to be examined.
Usually, 3D visualization applications that make use of the examine tool includea button (or any other interface item) that, when selected, allows a new pivot pointto be chosen. We observed that some people, even more experienced users, at somepoint forgot to select an adequate pivot point before starting to rotate around theobject of interest.
This occurred especially frequently when some users switched from the f ly to theexamine tool, as they attempted to rotate the camera around the object located infront of them before readjusting the pivot point. And, even when the users did notforget to perform this last operation, they reported feeling upset with the fact thatthey had to do it explicitly.
The solution we found for this was to automatically determine a pivot point at themoment the examine tool is activated. As mentioned before, the solution proposedby Khan et al. of doing this by setting the pivot point to minDist and reorienting thecamera could conflict with the user intent. We propose to use the point correspondingto the center of the screen as the new pivot. Doing this, it is possible to establish abehavior that seems natural from the user’s point of view. There is no reorientation ofthe camera and all the user needs to do is point the camera to the object of interestand then select the examine tool. It is reasonable to expect this feature, as in mostcases the users only decide to inspect an object once it is in front of them. However,the object might not necessarily be located exactly in the direction of the center ofthe screen; in fact, the pivot point could be mapped to an object behind the one theuser wishes to examine. In this case, the user would experience the effect of a panoperation, as shown in (ii) in Fig. 3. Another possibility is that the central point of thescreen does not correspond to any valid point in the geometry, and thus determiningpivot is impossible.
To avoid these problems, the smallest distance present on the front face of thedistance cube, minFront, is used. When the central point is not valid, pivot is adjustedto the point that is minFront away from the camera. This way, the angular speed ofthe rotation of the examine tool will be coherent with the scale in which the camerais located, preventing it from making excessively quick movements.
The minFront estimation is also used when the pivot point is automatic mappedto a distant point located behind the object. This may occurs when the object to beinspected is not located exactly in the center, but this contains valid geometry thatis far away from the object of interesting. If the pivot point is mapped to this point,the situation presented on (ii) in Fig. 3 should happen. To avoid this, we do not allowpivot to be adjusted to a point whose distance is greater than k × minFront. Wefound that k = 5 worked well on our tests. This solution does not solve the problemdefinitively, but reduces its occurence adequately.
5 User tests
The techniques presented in the previous section attempt to assist the users in thetask of exploring virtual environments. From the user’s point of view, this shouldresult in a more comfortable navigation experience and fewer errors.

Multimed Tools Appl
To verify this, usability tests were carried out with groups of users in order togather information about the solutions developed. These tests were planned andconducted based on the orientations provided by Tullis and Albert [18], and weredivided in two types, according with the procedures adopted and the informationgathered:
– Qualitative tests: to collect feedback from users, such as how they felt while usingthe software, what bothered them, and what could be improved. The time wasnot taken into account and users had more freedom to explore the environmentand make certain decisions.
– Quantitative tests: to collect quantitative information on how users interact withthe scene, like how often a collision occurs or how many times the user gotdisoriented. The time was tracked and users had to follow a pre-determined setof steps, without the freedom of changing them.
5.1 Test environment
The tests were performed using the SiVIEP viewer, a project under development byTecgraf/PUC-Rio in cooperation with Petrobras (Brazilian Oil & Gas Company).SiVIEP supports a comprehensive visualization of several types of models com-prising an oil exploration and production enterprise. For example, it is possible toload environments ranging from oil platforms to wells and reservoirs in a singlescene (Fig. 4). The main characteristic of the virtual environments resulting fromthis integration is that they are multiscale.
Two different versions of SiVIEP were used in the tests:
– Automated: this version supports the solutions discussed in the preceding sec-tions. The user does not have to worry about speed adjustment, collisions areprevented automatically, and the explicit use of the pivot-point tool is notnecessary.
– Manual: this version does not include any of the improved techniques previouslymentioned. The speed in the f ly tool must be adjusted manually with the mousescroll button, the user must be careful to not collide with the models, and thepivot-point tool has to be used always before beginning to inspect an object withthe examine tool.
Fig. 4 SiVIEP: visualization of an oil enterprise. In the first image, a complete oil field can beseen. Then the camera reaches the scale of a platform. Finally, the interior of the platform can benavigated
Multimed Tools Appl
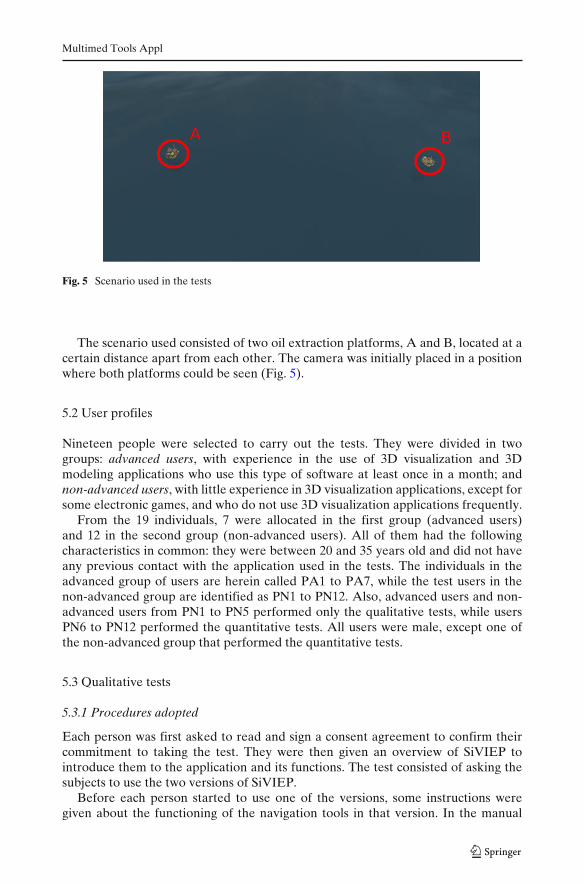
Fig. 5 Scenario used in the tests
The scenario used consisted of two oil extraction platforms, A and B, located at acertain distance apart from each other. The camera was initially placed in a positionwhere both platforms could be seen (Fig. 5).
5.2 User profiles
Nineteen people were selected to carry out the tests. They were divided in twogroups: advanced users, with experience in the use of 3D visualization and 3Dmodeling applications who use this type of software at least once in a month; andnon-advanced users, with little experience in 3D visualization applications, except forsome electronic games, and who do not use 3D visualization applications frequently.
From the 19 individuals, 7 were allocated in the first group (advanced users)and 12 in the second group (non-advanced users). All of them had the followingcharacteristics in common: they were between 20 and 35 years old and did not haveany previous contact with the application used in the tests. The individuals in theadvanced group of users are herein called PA1 to PA7, while the test users in thenon-advanced group are identified as PN1 to PN12. Also, advanced users and non-advanced users from PN1 to PN5 performed only the qualitative tests, while usersPN6 to PN12 performed the quantitative tests. All users were male, except one ofthe non-advanced group that performed the quantitative tests.
5.3 Qualitative tests
5.3.1 Procedures adopted
Each person was first asked to read and sign a consent agreement to confirm theircommitment to taking the test. They were then given an overview of SiVIEP tointroduce them to the application and its functions. The test consisted of asking thesubjects to use the two versions of SiVIEP.
Before each person started to use one of the versions, some instructions weregiven about the functioning of the navigation tools in that version. In the manual

Multimed Tools Appl
version, for instance, the users were asked to avoid crossing through the models inthe scene and instructed on how to make manual speed adjustments and to operatethe pivot-point tool. In the case of the automated version, the users were informedthat they did not have to worry about these aspects.
The users were asked to navigate to platform A using the f ly tool. Once there,they had to explore the internal area of the platform to select three objects inspectionwith the examine tool. Finally, the users were asked to navigate from platform A toplatform B.
After using each version, the users were asked to answer a questionnaire aimedat gathering their impressions about the tools used. This questionary consisted of thefollowing statements, here identified as S1, S2, S3, S4 and S5:
– S1: I did not have any dif f iculty with the speed adjustment of the f ly tool.– S2: I was able to perform the tasks without colliding with the environment.– S3: I did not have any dif f iculty with the pivot-point tool.– S4: I did not feel disoriented at any moment when navigating in the virtual
environment.– S5: I felt comfortable using the navigation tools.
Below each of these statements there was a scale of ten numbers, from 1 to 10, 1meaning that the user disagrees completely with the statement and 10 meaning thatthe user fully agrees with it. At the end of the form there was a blank space wherethe users could describe their general impressions and justify the grades given.
After both versions had been tested, the users were asked to fill out a final surveyconsisting of two written questions, identified as Q1 and Q2:
– Q1: Which of the two approaches did you prefer: the automated navigationtechniques or the manual techniques? Why?
– Q2: With regard to the approach you preferred, in your opinion could somethingbe improved? If af f irmative, what is it and why would it need to be improved?
Lastly, the order in which the versions were presented to each user was differentfrom test to test. The first person to take the test used the manual version first,and then the automated version second. The second took the test in the oppositeorder. This pattern was followed until the last user. This measure was taken with thepurpose of minimizing the learning effect of using the first version over the second.
5.3.2 Non-advanced group results
Tables 1 and 2 show the results obtained after testing the group of non-advancedusers. They include the responses to the 5 statements presented in the previous
Table 1 Results of theusability test for the manualversion (group ofnon-advanced users)
PN1 PN2 PN3 PN4 PN5 Avg
S1 7 8 10 9 5 7.8S2 6 5 7 7 2 5.4S3 6 9 8 7 3 6.6S4 4 8 7 9 1 5.8S5 5 8 9 10 4 7.2

Multimed Tools Appl
Table 2 Results of theusability test for theautomated version (group ofnon-advanced users)
PN1 PN2 PN3 PN4 PN5 Avg
S1 9 10 10 10 9 9.6S2 10 10 10 10 10 10.0S3 10 8 10 10 10 9.6S4 10 10 9 10 10 9.8S5 10 9 10 10 10 9.8
section. Table 1 provides the grades referring to the use of the manual version, whileTable 2 contains the grades given to the automated version. The final column in eachtable shows the average grade for each statement. For a better view of the generalresults, these averages are presented side by side in Fig. 6. The confidence intervalused in the generation of this graph was 90%.
We applied a two-tailed paired t-test to compare the average of the results forboth versions. We obtained t(4) = −6.43, p = 0.001, which affirms that this grouppreferred the automated version of the navigation. When using the manual version,users complained especially about the difficulty of controlling camera speed in ordernot to collide with the environment. One of the users, for instance, reported that“the program is somewhat abrupt, which makes its use difficult for someone whois not used to or does not have enough dexterity for 3D games and software”. Thelack of collision treatment created situations in which some people felt lost. Whenthese situations occurred, 2 of the 5 users mentioned that they would like to quitthe task.
The written answers confirm the statistic results. For question Q1, all users inthis group replied that they preferred the automated version rather than the manualone. In the justifications, most users mentioned that the techniques provided bythe automated version made navigation simpler, less prone to errors, and easier tocontrol. As for question Q2, none of these users considered that any improvementwas necessary to their preferred version.
Fig. 6 Comparative results between the manual and the automated version (group of non-advancedusers)

Multimed Tools Appl
Table 3 Results of theusability test for the manualversion (group of advancedusers)
PA1 PA2 PA3 PA4 PA5 PA6 PA7 Avg
S1 10 9 7 7 10 9 9 8.7S2 3 7 7 7 10 8 7 7.0S3 7 8 10 3 5 5 7 6.4S4 3 9 6 5 10 6 8 6.7S5 6 8 8 8 10 8 7 7.8
5.3.3 Advanced group results
Tables 3 and 4 show the results obtained after the application of the tests to thegroup of advanced users. The results are presented in the same format as those inthe previous section. Figure 7 also shows a comparison between the grades givento the manual version and those given to the automated version. The confidenceinterval was 90%.
We applied a two-tailed paired t-test to compare the average of the results forboth versions. We obtained t(4) = −2.1, p = 0.09, which does not allow us to affirmthat this group preferred the automated version of the navigation. Nevertheless, ascan be observed, the automated version received higher grades in all statements withthe exception of S1, which sought to evaluate the automatic speed adjustment of thef ly tool. Analyzing the justifications for the grades and the general comments madeby the users revealed some interesting points.
Almost all advanced users who gave a lower grade to the automatic speedadjustment reported that, when getting very close to an object, the camera wouldbecome too slow and it would take a while until they were able to move away fromthe object again. These users felt impatient, and this feeling was made worse by thefact that no control option was provided to allow them to momentarily increase thespeed. Nonetheless, the same users noted that the automatic adjustment was goodbecause it allowed them to be less concerned with the controls and helped them avoidsome errors, which is in agreement with the general comments made by the non-advanced users. In summary, the advanced users wished they were offered some sortof control which allowed them to make a more “customized” adjustment at certainmoments, while at the same time including automatic speed adjustment.
Another factor that contributed to the preference for the manual version in S1 wasthe manner in which the tests were conducted. Before the users began the manualversion test, they were asked to avoid cutting through (colliding with) objects inthe scene. This led them to be very cautious in relation to speed adjustment, thusavoiding possible difficulties they could face when using the manual version. Thiscaution may have contributed to the higher grades that resulted. However, this had anegative impact on the comfort experienced by the users: in order to avoid collidingwith the models, they were forced to stop often and readjust the navigation speed.
Table 4 Results of theusability test for theautomated version (group ofadvanced users)
PA1 PA2 PA3 PA4 PA5 PA6 PA7 Avg
S1 7 5 10 5 9 9 9 7.7S2 10 9 9 10 10 9 10 9.6S3 10 6 6 10 10 9 10 8.7S4 6 9 7 10 10 8 9 8.4S5 10 6 9 9 10 9 9 8.9

Multimed Tools Appl
Fig. 7 Comparative results between the manual and the automated version (group of advancedusers)
The greatest contributions of the automated version were related to statements S2and S3, which aimed at evaluating the efficacy of collision treatment and automaticpivot point, respectively. The users could easily notice the effects provided by thesetechniques and were very satisfied with their results. Some users expressly stated that,thanks to these techniques, they did not make certain errors and were able to focusless on interface issues. Finally, the grades given by the users in the advanced group tostatements S4 and S5 demonstrated that they felt more comfortable and experiencedfewer moments of disorientation while using the automated version. This was alsotrue for the non-advanced users.
Regarding the final survey question, 6 out of the 7 advanced users stated in Q1 thatthey preferred the automated version rather than the manual one. Only user PA2preferred the latter. In the justification, this user mentioned the problem with theautomatic speed adjustment and the lack of feedback to the user about the locationof the pivot point when using automatic adjustment. As a result of PA2 suggestions,we now draw the pivot point in the screen on recent versions of ours systens. LikeFitzmaurice et al. [6], we found that this also caused a improvement on the usage ofthe tools related to the pivot point.
Finally, in question Q2, which asks for suggestions about what could be improvedin the preferred version, all of them asked for some kind of control that allows themto momentarily increase the speed. This leads us to assume that advanced users havea greater tendency to prefer solutions that make the tools simple to use but that arenot completely automated. The opposite might be said of non-advanced users: dueto their lack of experience, they prefer approaches that minimize the need to adjustthe parameters of the navigation tools.
5.4 Quantitative tests
5.4.1 Procedures adopted
As in the qualitative tests described above, each user was asked to sign an agreementto confirm their commitment to taking the test. Then, the features and controls ofSiVIEP were presented.

Multimed Tools Appl
Each user had to follow a pre-determined set of steps, consisting of navigating tothe platform A using the f ly tool, finding three different objects to inspect using theexamine tool and travelling to platform B using again the f ly tool. A key diferencebetween this quantitative test and the previously described qualitative test is thatin the quantitative test users were not given the freedom to choose which objectsthey should examine, rather, the objects were assigned. To minimize learning effects,the objects to be examined in the manual version were different from those of theautomatic version. Thus, the difficulty in finding objects using the software for thesecond time should be the same. For the same reason, the procedure for changingthe order in which the versions were presented to a user was also used. The userswere also asked to avoid collisions when using the f ly tool.
There was no written questionnaire issued after the test of each version. Thetests were filmed, and the videos obtained were analyzed in order to determine thenumber of times that each of the following events occurred:
– A - Collision.– B - Incorrect adjustment of the pivot point.– C - Disorientation.– D - Usage of the reset button.
An occurrence of these events indicates an error or a bad user experience.The reset button sends the camera back to its original position. It was given to
users as an option to orient themselves again when a event of disorientation ocurred.When a user clicks this button, brought the user directly to the place where thecamera was before the disorientation event occurred.
The duration of the tests were also recorded. This was done as the users no longerhad the freedom to choose which objects should be examined. Also, users wereencouraged to relay their impressions verbally while performing the tests. This way,we could obtain extra information that could help explain the occurrence of eventslisted above.
5.4.2 Results
Tables 5 and 6 show the results of the quantitative tests for the occurrence of eventsA, B, C and D. Each row represents a different user, while the columns labeled A, B,C and D represent the number of times that the respective event happened. The lastcolumn contains the total number of events for a given user. Table 5 refers to resultsof the manual version. Table 6 refers to the automatic version. Figure 8 shows thetotal number of errors for manual and automatic versions for each user and facilitatesthe comparison between then.
Table 5 Number of events A,B, C and D for the manualversion
A B C D Total
PN6 5 1 3 0 9PN7 1 0 1 0 2PN8 2 0 0 0 2PN9 3 4 4 3 14PN10 3 5 6 0 14PN11 7 2 4 1 15PN12 5 1 1 0 7

Multimed Tools Appl
Table 6 Number of events A,B, C and D for the automaticversion
A B C D Total
PN6 0 3 1 0 4PN7 0 0 1 1 2PN8 0 0 0 0 0PN9 0 0 1 0 1PN10 0 0 1 0 1PN11 0 0 1 0 1PN12 0 0 0 0 0
The number of events in the manual version was greater than in the automaticversion for most users. This indicates that the automatic version was less prone toerrors and caused fewer uncomfortable situations. The exceptions are users PN8 andPN7, which will be discussed later.
As expected, there were no collisions (event A) for the automatic version since thesystem prevents them from occurring. In the manual version, it was observed thatthe collisions were related to the difficulty of controlling the camera speed. Thesecollisions often led to disorientation.
The incorrect adjustment of the pivot point was another factor responsible fordisorientation. Again, the highest incidence of this error occurred in the manualversion. The exception was user PN6: he had difficulty in orienting the camera sothat the object to be examined could be located in the center of the screen. Becauseof this, the automatic adjustment of the pivot point did not work the way expected.The result is that this user reported that he preferred to use the tool to manually setthe pivot point.
Table 7 contains the duration in seconds of the tests for each user. The lastcolumn indicates the relationship between the times spent on manual and automaticversions. For most users, the time required to complete the test was higher in themanual version. The main reason of this was that users spent a significant amountof time trying to correctly adjust the navigation speed. Moreover, the disorientationsituations also contributed to the increase in time.
Fig. 8 Comparative results between the manual and the automated version

Multimed Tools Appl
Table 7 Time spent toperform the tests
Manual Automatic Manual/Automatic
PN6 540 240 2.25PN7 215 380 0.56PN8 180 213 0.84PN9 535 230 2.32PN10 895 400 2.23PN11 720 480 1.5PN12 320 250 1.28
The exceptions again were users PN7 and PN8 (Fig. 9). During the tests, itwas found that these users had previous experiences that affected their navigationperformances. User PN8 reported that he plays 3D games very often. Hence, he hadno difficulty in manually controlling the camera on both versions and collided lightlywith the objects only twice. The time spent in the automatic version was slightlygreater than the time spent on the manual version, since the ability of user PN8allowed him to move faster through the scene using the manual adjustment of speed.Similarly to some members of the advanced group of users, user PN8 complained ofnot being able to adjust the speed in the automatic version.
With user PN7, it was discovered during the test that he had already used otherscientific visualization software in the past. The automatic version was tested first,and he spent a significant amount of time trying to use the navigation tools in SiVIEPthe same way he used tools on the other software. Only after some time did the userbecome better acquainted with the tools of SiVIEP. This contributed to the resultof the user requiring almost twice as much time in the automatic version versus themanual version. This event suggests another way to improve usability on our system:the investigation of the user’s experience with other software. With such information,we could identify possible improvements to be incorporated in our navigation tools.
Finally, at the end of the tests users were asked about which version they hadpreferred. Only users PN7 and PN8 chose the manual version. Again, the factor thatmotivated this choice was the lack of speed control in the automatic version. This isconsistent with the results reported in qualitative tests with the group of advancedusers.
Fig. 9 Comparative results between the times spent on manual and automatic versions

Multimed Tools Appl
6 Conclusions
This work presented techniques to assist and facilitate navigation in 3D virtualenvironments. They were based on the construction and maintenance of a datastructure called cubemap [14]. Improvements were proposed for the examine tool,with the development of a system to automatically determine the pivot point, and forthe f ly tool, in which collision support and automatic speed adjustment in relation tothe scale were implemented.
To verify the efficacy of the solutions proposed, usability tests were performed.The results allow us to conclude that the techniques presented here improve thenavigation experience of the users. From the 19 subjects of the usability tests, 16preferred the version of the application that included the techniques proposed. Inparticular, the automatic adjustment of the pivot point in the examine tool and thecollision support implemented in the f ly tool had a significant positive impact in userexperience.
Navigation in 3D environments still presents issues and provides plenty of chal-lenges. Multiscale environments, which are becoming more common, identify severalfurther navigation-related problems to be solved in the future. We believe thetechniques demonstrated in this work contribute to providing solutions to some ofthe problems identified regarding navigation in these environments.
Acknowledgements The authors thank Petrobras for this research support and for the softwareused in this research (SiVIEP). D. Trindade thanks CAPES and A. Raposo, FAPERJ and CNPq forthe individual support granted to this research.
References
1. Baciu G, Wong WSK (1997) Rendering in object interference detection on conventional graphicsworkstations. In: Proceedings of the 5th Pacific conference on computer graphics and applica-tions. IEEE Computer Society, Washington, DC, pp 51–58
2. Baciu G, Wong WSK, Sun H (1998) Recode: an image-based collision detection algorithm.In: Proceedings of the 6th Pacific conference on computer graphics and applications, pp 125–133. doi:10.1109/PCCGA.1998.732079
3. Bederson BB, Stead L, Hollan JD (1994) Pad++: advances in multiscale interfaces. In: CHI ’94:conference companion on human factors in computing systems. ACM, New York, pp 315–316.doi:10.1145/259963.260379
4. Calomeni A, Celes W (2006) Assisted and automatic navigation in black oil reservoir modelsbased on probabilistic roadmaps. In: I3D ’06: proceedings of the 2006 symposium on interactive3D graphics and games. ACM, New York, pp 175–182. doi:10.1145/1111411.1111443
5. de Sousa Rocha R, Rodrigues MAF (2008) An evaluation of a collision handling system usingsphere-trees for plausible rigid body animation. In: SAC ’08: proceedings of the 2008 ACMsymposium on applied computing. ACM, New York, pp 1241–1245. doi:10.1145/1363686.1363972
6. Fitzmaurice G, Matejka J, Mordatch I, Khan A, Kurtenbach G (2008) Safe 3d navigation.In: I3D ’08: proceedings of the 2008 symposium on interactive 3D graphics and games. ACM,New York, pp 7–15. doi:10.1145/1342250.1342252
7. Furnas GW, Bederson BB (1995) Space-scale diagrams: understanding multiscale interfaces.In: CHI ’95: proceedings of the SIGCHI conference on human factors in computing systems.ACM Press/Addison-Wesley, New York, pp 234–241. doi:10.1145/223904.223934
8. Glueck M, Crane K, Anderson S, Rutnik A, Khan A (2009) Multiscale 3d reference visualization.In: Proceedings of the 2009 symposium on interactive 3D graphics and games. ACM, New York,pp 225–232. doi:10.1145/1507149.1507186

Multimed Tools Appl
9. Jul S, Furnas GW (1998) Critical zones in desert fog: aids to multiscale navigation. In: UIST’98: proceedings of the 11th annual ACM symposium on user interface software and technology.ACM, New York, pp 97–106. doi:10.1145/288392.288578
10. Khan A, Komalo B, Stam J, Fitzmaurice G, Kurtenbach G (2005) Hovercam: interactive 3dnavigation for proximal object inspection. In: Proceedings of the 2005 symposium on interactive3D graphics and games. ACM, New York, pp 73–80. doi:10.1145/1053427.1053439
11. Khan A, Mordatch I, Fitzmaurice G, Matejka J, Kurtenbach G (2008) Viewcube: a 3d orientationindicator and controller. In: Proceedings of the 2008 symposium on interactive 3D graphics andgames. ACM, New York, pp 17–25. doi:10.1145/1342250.1342253
12. Kopper R, Ni T, Bowman DA, Pinho M (2006) Design and evaluation of navigation techniquesfor multiscale virtual environments. In: VR ’06: proceedings of the IEEE conference on virtualreality. IEEE Computer Society, Washington, DC, pp 175–182. doi:10.1109/VR.2006.47
13. Mackinlay JD, Card SK, Robertson GG (1990) Rapid controlled movement through a virtual 3dworkspace. SIGGRAPH Comput Graph 24(4):171–176. doi:10.1145/97880.97898
14. McCrae J, Mordatch I, Glueck M, Khan A (2009) Multiscale 3D navigation. In: I3D ’09: proceed-ings of the 2009 symposium on interactive 3D graphics and games. ACM, New York, pp 7–14.doi:10.1145/1507149.1507151
15. Perlin K, Fox D (1993) Pad: an alternative approach to the computer interface. In: SIGGRAPH’93: proceedings of the 20th annual conference on computer graphics and interactive techniques.ACM, New York, pp 57–64. doi:10.1145/166117.166125
16. Sousa Santos B, Dias P, Pimentel A, Baggerman JW, Ferreira C, Silva S, Madeira J (2009) Head-mounted display versus desktop for 3d navigation in virtual reality: a user study. MultimediaTools Appl 41(1):161–181. doi:10.1007/s11042-008-0223-2
17. Tan DS, Robertson GG, Czerwinski M (2001) Exploring 3d navigation: combining speed-coupled flying with orbiting. In: CHI ’01: proceedings of the SIGCHI conference on humanfactors in computing systems. ACM, New York, pp 418–425. doi:10.1145/365024.365307
18. Tullis T, Albert W (2008) Measuring the user experience: collecting, analyzing, and presentingusability metrics. Elsevier, Amsterdam
19. Ware C, Osborne S (1990) Exploration and virtual camera control in virtual three dimensionalenvironments. SIGGRAPH Comput Graph 24(2):175–183. doi:10.1145/91394.91442
20. Ware C, Fleet D (1997) Context sensitive flying interface. In: SI3D ’97: proceedings of the 1997symposium on interactive 3D graphics. ACM, New York, pp 127–130. doi:10.1145/253284.253319
21. Xiao D, Hubbold R (1998) Navigation guided by artificial force fields. In: CHI ’98: proceedingsof the SIGCHI conference on human factors in computing systems. ACM Press/Addison-Wesley,New York, pp 179–186. doi:10.1145/274644.274671
22. Zhang XL (2009) Multiscale traveling: crossing the boundary between space and scale. VirtualReal 13(2):101–115. doi:10.1007/s10055-009-0114-5
Daniel Ribeiro Trindade is a researcher at Computer Graphics Technology Group - Tecgraf/PUC-Rio. He received his MSc in computer science at the Pontifical Catholic University of Rio de Janeiro -PUC-Rio. He graduated in computer engineering at the Federal University of Espírito Santo, Brazil.His current interests include Virtual Reality, 3D interaction and computer graphics.

Multimed Tools Appl
Alberto Barbosa Raposo is an assistant professor at the Dept. of Informatics/PUC-Rio, project co-ordinator at Tecgraf/PUC-Rio and FAPERJ researcher. He received his BSc in electrical/computerengineering at the State University of Campinas, Brazil. His current interests include Virtual Reality,3D interaction, groupware, HCI, and computer graphics, with more than 120 publications in theseareas. His projects were supported by: Petrobras, CNPq, FINEP, FAPERJ and RNP. He is adistinguished young scholar of PUC-Rio, and also a NVIDIA academic partner.