Embed Size (px)
Citation preview
2014
Improvement
Workbook
Roadmaps and Tools for Driving Out Harm

Introduction to the WHA Partners for Patients Improvement Workbook
About the Improvement Workbook
The Improvement Workbook is a powerful tool for process improvement. Its design was greatly influenced by the Institute for Healthcare Improvement’s “Model for Improvement” as developed in the text “The Improvement Guide” by Lloyd Provost, et al. This workbook also includes elements of Transforming Care at the Bedside (TCAB) from the Robert Wood Johnson Foundation and the Comprehensive Unit Based Safety Program (CUSP) from Johns Hopkins Center for Innovation in Quality Hospital Care.
Purpose of the Improvement Workbook
The Improvement Workbook is intended to be used by cross functional teams working on a hospital improvement project or a unit/department implementing evidence based practices. Individuals may find the tools useful for learning about health care quality improvement.
Some sections of the workbook also address methods of systematic improvement for an organization, as well as best practices to establish a culture of improvement in a hospital.
How to Use the Improvement Workbook
Each section begins with a roadmap to help guide decision-making. The worksheets are designed to supplement process improvement activities but do not serve as a substitute for critical thinking. The team selects the worksheets that would most benefit their work. Examples are used to illustrate how to best use the worksheets.
Copies of blank worksheets are available on the WHA Quality Center website at: www.whaqualitycenter.org
Implement Best Practices
Systematic, Repeatable Improvement Method
Culture of Improvement

TABLE OF CONTENTS
Getting Started: Best Practices for Teams Introduction 0-0 Characteristics of Well Functioning Teams 0-1 Why Have a Meeting 0-2 Conducting an Effective Meeting 0-3 Conducting an Effective Meeting Checklist 0-4 Best Practices in Meeting Documentation 0-5 Project Charter Template - Users Guide 0-6 Project Charter Template 0-6a Meeting Agenda Format – Users Guide 0-7 Meeting Agenda Format 0-7a Meeting Minutes Format – Users Guide 0-8 Meeting Minutes Format 0-8a Alternatives to Meetings 0-9 Section 1: Understand Your System through Data and RCA Introduction 1-0 Roadmap for Understanding System Issues and Root Cause of Harm 1-0a Understand the Current Process – High Level Process Map 1-1 Understand the Current Process – Multiple Perspectives 1-2 Understand the Current Process – Cross Functional Mapping 1-3 Staff Harm Assessment 1-4 Staff Process Assessment 1-5 System Factor Analysis 1-6 System Factor Analysis Diagram 1-7 How to Use Driver Diagrams 1-8 Pareto Chart - Using Data to Determine Priorities 1-9 Failure Mode Effects Analysis (FMEA) Instructions 1-10 Failure Mode Effects Analysis (FMEA) Example 1-10a Failure Mode Effects Analysis (FMEA) Template 1-10b Section 2: Choosing Interventions and Implementing Process Measures Introduction 2-0 Roadmap for Implementing Process Measures 2-0a Intervention Decision Matrix - Users Guide 2-1 Intervention Decision Matrix 2-1a Model for Improvement 2-2 AIM Statement Worksheet 2-3 Process Evaluation Plan 2-4 Process Evaluation Worksheet 2-4a Data Collection Plan 2-5 Data Collection Template 2-5a

Section 3: Testing Best Practices by Designing Small Tests of Change Introduction 3-0Roadmap for Testing Best Practices with Small Tests of Change 3-0a PDSA Cycle 3-1 PDSA Planning Document - User Guide 3-2 PDSA Planning Document - Template 3-2a Design Plan for Small Tests of Change – User Guide 3-3 Design Plan for Small Tests of Change 3-3a Principles for Conducting Small Tests of Change 3-4 Troubleshooting Small Tests of Change 3-5 Implementing Process 3-6
Section 4: Know the Change is an Improvement: Putting Your Data to Work Introduction 4-0Roadmap for Putting your Data to Work 4-0a Using Run Charts 4-1 Digging Deeper Into Data 4-2 Best Practices for Data Sharing 4-3
Section 5: Spreading Best Practices Introduction 5-0Roadmap for Spreading Best Practices 5-0a Spread Planning Best Practices 5-1 Build the Evidence for Change 5-2 Best Practice Storyboard Template 5-2a Spread Planning Matrix 5-3 Spread Planning Matrix Worksheet 5-3a
Section 6: Sustaining Excellent Results Introduction 6-0Roadmap for Sustaining Excellent Results 6-0a Develop a Process Control Plan 6-1 Process Control Plan Worksheet 6-2 Leader Rounding Best Practices 6-3
Appendix A: Engaging Others Introduction A-0Communication Planning A -1 How to Conduct a Culture Check-Up A -2 Barrier Mitigation Process A -3 Identifying Barriers A -4 Identifying Barriers - Worksheet A -4a Action Planning A -5 Action Plan Framework A -5a
0-0
GETTING STARTED – BEST PRACTICES FOR TEAMS
This section provides information about getting a team off on the right foot.
This includes the importance of documenting your work. Teams that are transparent about their progress are less likely to encounter resistance during the implementation phase. Included in the section are guidelines for developing a team, when it makes sense to having a meetings, and alternatives to meetings.
To help with transparency and documentation we have recommended charter, agenda, and minute formats for you to use. Included with each of these is also an example if you have not used tools like these before. There are also checklists and quick tips to assist your team.

0-1
CHARACTERISTICS OF WELL FUNCTIONING TEAMS
Keep the following in mind…
• Teamwork improves the working environment • Teamwork keeps communication consistent • Teamwork relieves stress • Teamwork reduces errors • Teamwork keeps communication lines open
Open Communications…
• Creates and maintains a climate of trust and open, honest communication • Allows team members to talk openly with one another • Promotes the exchange of feedback • Provide team members to work through misunderstandings and conflicts
Commitment to a Common Purpose and Performance Goals…
• Keeps the purpose in the forefront of decision making and evaluations of team practices • Helps one another maintain the focus
Shared Responsibility…
• Allows team members to feel equally responsible for the performance of the team and its outcome
• Permits individuals to have primary roles for completing team tasks and remain flexible to do what is necessary to accomplish the team’s goals and tasks
Use of Resources and Talents…
• Utilizes the resources and talents of all the group members • Makes good use of the team’s creative talent by openly sharing skills and knowledge and
encourages learning from one another
Capacity for Self-Evaluation…
• Allows teams to stop and look at how well they are doing and what, if anything, may be hindering their performance and communication
Participative Leadership
• Provides opportunities for team members to participate in decision making • Allows team members to help set goals and develop strategies for achieving these goals • Allows team members to help identify tasks and decide how to approach and evaluate
them.
Source: http://www.nsba.org/sbot/toolkit/TeamSur.html

0-2
WHY HAVE A MEETING?
The most common reason to have a meeting is to discuss something face to face. It could be a new idea, a new opportunity, a problem, to brainstorm something, or reach a decision about something. It all comes down to discussion and face to face interaction.
Work communications is done through various methods (email, phone, websites etc.) and has made life easier and quicker. However they still cannot replace a face to face meeting. Discussing something face to face allows you to not only hear what is being said, giving you access to clues hidden in the speaker’s tone of voice, but it also allows you to see the speaker. The observation of body language and facial muscles is very important as it allows you to read the person’s reaction to what you are saying, as well as what they actually think about what they are saying.
Only 7% of communication is spoken, the other 93% is made up of tone (38%) and body language (55%). Although facts and figures are easily communicated through the various methods, an actual discussion or negotiation is best handled where you can see the other person and therefore are able to see for yourself what their tone and body have to say on the matter.
Making the Most of Your Meeting
Below are the primary reasons to have a meeting:
• To gather and impart information• To exchange ideas, views, opinions and suggestions• To discuss options• To solve problems• To make decisions• To devise plans
If the reasons listed above are not the main aims of the meeting, perhaps a meeting isn’t necessary? Meetings can be very successful by making those involved feel part of a team or they can be disastrous by leaving everyone present feeling confused and frustrated.
To make the most of your meeting, it is important to put some thought into what the meeting is supposed to accomplish, who should attend, what should be discussed, where the best place to have it is and when would be the most convenient date and time. Having decided on the basics, equally important is how the meeting is facilitated. If you are the chair ensure that you arrive in plenty of time. Greet everyone warmly and ensure that everyone is comfortable and able to pay attention without distractions.
Use your opening remarks to set the tone of the meeting, establish the purpose and then review the agenda. Give a short overview of each topic and what you need to achieve. For the first item on the agenda, does a decision have to be made or are you just looking to brainstorm?Source: http://www.nsba.org/sbot/toolkit/TeamSur.html

0-2
Making the Most of Your Meeting (continued)
During the meeting it is important to pay attention to the structure of items. For example: a step by step approach to problem solving encourages people to develop and evaluate alternative solutions. Without this, the meeting can dissolve into a free for all with the strongest voice dominating, no ideas being generated or the item being put on hold until the next meeting.
It is the facilitator’s job to guide the discussion, sometimes re-stating what has been discussed so everyone is on the same page. It is also up to the chair to keep control of the meeting, encourage open discussion and discourage disruptive or negative behavior. It is your job to get people to contribute effectively and to encourage diverse points of view.
At the end of the meeting summarize the topics discussed, actions agreed and those responsible. Thank everyone for coming and, if necessary, agree on the next meeting date. Meeting minutes are very helpful as a reminder to everyone of what happened during the meeting and what is needed to be done now, by whom and by what date. It is good practice to circulate the minutes as soon as possible after the meeting has taken place or send a brief communication about what tasks were assigned and what should be completed prior to the next meeting.

0-3
CONDUCTING AN EFFECTIVE MEETING
Preparation
• Decide on the purpose of the meeting. If it is only for discussion, do you really need tomeet?
• Develop a meeting plan (i.e. who, what, when, where, how, why, etc.)• Identify the meeting leader• Prepare and distribute the meeting agenda• Set up the meeting area (flip charts, laptops, or any items needed)
Beginning
• Start on time• Introduce the meeting leader• Allow team members to introduce themselves• Ask for a volunteer timekeeper and a volunteer
recorder• Review, change or revise the order of the agenda• Establish time limits• Review any prior meeting action items
Meeting Etiquette
• Be sure you are recognized before speaking – don’t interrupt others• Be brief and to the point• Make your point calmly• Keep an open mind and listen to others attentively• Listen without bias and respect other opinions• Understand what is said. If you don’t understand, ask for clarification.• Avoid side conversations• Come prepared to do what good for the hospital
Ending
• Develop action items (who, what, when, where, how)• Summarize the meeting with the group• Establish the date and time for a follow-up meeting• Evaluate the meeting and end on time
Next Steps
• Prepare and distribute the meeting summary or minutes• Follow up on action items

0-4
CONDUCTING AN EFFECTIVE MEETING CHECKLIST
A. Preparing for the Meeting
Decide on the purpose of the meeting. (If it is only for discussion, do you really need to meet?)
Develop a meeting plan (i.e., who, what, when, where, how, why, etc.). Identify the meeting leader. Prepare and distribute the meeting agenda. Set up the meeting area (flip charts, overhead projector or any items needed).
B. Beginning the Meeting
Start on time. Introduce the meeting leader. Allow team members to introduce themselves. Ask for a volunteer timekeeper and a volunteer recorder Review, change, or revise the order of the agenda. Establish time limits. Review any prior meeting action items.
C. Meeting Etiquette
Be sure you are recognized before speaking – don’t interrupt others. Be brief and to the point. Make your point calmly. Keep an open mind and listen to others attentively. Listen without bias and respect other opinions. Understand what is said. If you don’t understand, then please ask for clarification. Avoid side conversations. Avoid personal agendas. Come prepared to do what’s good for the hospital.
D. Ending the Meeting
Develop action items (who, what, when, where, how). Summarize the meeting with the group. Establish the date and time for a follow-up meeting. Evaluate the meeting. End on time.
E. The Next Steps
Prepare and distribute the meeting summary or minutes. Follow up on action items. Go to “Preparation” and start over for the next meeting.
0-5
BEST PRACTICES IN MEETING DOCUMENTATION
Teams may struggle if they:
Fail to document actions and decisions Fail to understand the barriers and limitations to the work Fail to adequately plan for next steps
Three basic documents can help to avoid these potential pitfalls:
Team or Project Charter
The Team or Project Charter is a document used to define the scope and boundaries of the work. This should be established early in the convening, and is considered a “living” document – one that may change as circumstances dictate.
Meeting Agendas
The Meeting Agenda serves to document participation as well as an effective meeting design tool. In addition, the agenda is a communication tool to the group as it includes subject matter and tasks due.
Meeting Minutes
The Meeting Minutes are a record of discussion, actions taken and decisions made. Minutes are a historical record of the team’s work.
In this section you will find completed examples of each tool as well as blank templates you may use or modify to meet your needs.

Project Charter Template
0-6
Project Title: Pressure Ulcer Prevention ProjectDate of Charter: April 1 Date of Last Revision: Project Sponsor: Project Leader(s): Who is accountable for the work?
Sue Smith, CNOJames Jones, RN
Description/Scope: What will this project accomplish? What is the time frame? What are the boundaries? How will it be managed going forward?
This initiative will improve the rate of pressure ulcer incidence on 4th Floor Med-Surg. This unit will review its practices for preventing pressure ulcers; adopt best practices where applicable, and develop process measures for tracking improvement.
Resources Needed: Who will be involved? What is their role?
Name:James Jones, RN Tim Smith Julie Brown Tanya Freeman Melanie Moore, APNP
Role:Facilitator Materials Mgmt representative 4th Floor Registered Nurse Nursing Assistant Wound Care Consultant
Decision-Making Authority: What are the levels of decision making? Who may make the decisions?
The team my bring recommendations to the unit council before moving forward with process changes. No funds may be expended without the approval of Sue Smith, CNO.
Method of Decision Making: How will decisions be made?
The team will work with consensus. If no agreement can be reached, Sue Smith will be consulted to assist with the decision.
Measures of Success and Goals: List measures and targets
1. Pressure Ulcer incidence will improve on 4th floor by 25% in 6 months.
2. Four eyed assessments are documented 100% of the time
Deliverables: What are the products of this effort?
• Documentation of PDSA cycles involving 4th floor staff
• Documented Work Instructions for Staff • Draft Procedures for Unit Council review
Linkages/Dependencies: What other departments or initiatives will this impact?
Staff participation on 4th will be needed for small tests of change. Materials & Supplies standardization committee will be consulted .
Meeting Schedule: When and how will the team meet?
Weekly, Wednesdays at noon for 4 weeks, then every other week until goals are met.
Submitted to: Is approval needed?
Quality Council Approved , meeting of April 15
Project Charter Template
0-6a
Project Title: Date of Charter: Date of Last Revision: Project Sponsor: Project Leader(s): Who is accountable for the work? Description/Scope:
What will this project accomplish? What is the time frame? What are the boundaries? How will it be managed going forward?
Resources Needed: Who will be involved? What is their role?
Name: Role:
Decision-Making Authority: What are the levels of decision making? Who may make the decisions?
Method of Decision Making: How will decisions be made?
Measures of Success and Goals: List measures and targets
Deliverables: What are the products of this effort?
Linkages/Dependencies: What other departments or initiatives will this impact?
Meeting Schedule: When and how will the team meet?Submitted to: Is approval needed?

0-7
Notes on using this Agenda Format
MEETING AGENDA
GROUP: LOCATION:
DATE: TIME: CALL INFORMATION:
TASKS PENDING ASSIGNED TO DATE DUE STATUS
Attendees: Name, Facilitator Name, Team Leader Name, Guest
Name Name Name Name
TIME TOPIC (Presenter) PURPOSE or DESIRED OUTCOME FOLLOW-UP
XX min Welcome & Review Agenda and Task Statuses (Facilitator)
XX min Topic (Name)
XX min
XX min Topic (Name)
XX min Plan Topics for Next Meeting
NEXT MEETING: DATE, TIME, LOCATION or CALL INFO
PARKING LOT TOPIC REVISIT WHEN STATUS
Use the task section to keep track of who is assigned work, and when it is due. After the meeting this section can be quickly completed and sent to attendees.
Be sure this information is complete and matches the appointment sent to attendees
Place your organizations name or logo here or key contact information
Use this section to keep track of meeting attendance. You may list unit or organizations
Note here if the topic is a presentation, discussion, brainstorming, etc OR if a decision or approval is needed
These items should appear on the next agenda task list
Estimate time needed. Be sure to manage the meeting to the times allotted
Be sure different people get to present topics
Use this section to capture good ideas, or topics for consideration at a later date
These topics should transfer to the next agenda
Check with attendees for next meeting availability
Source: Sam Kaner, A Facilitator’s Guide to Participatory Decision-Making

0-7a
MEETING AGENDA
GROUP: LOCATION:
DATE: TIME: CALL INFORMATION:
TASKS PENDING ASSIGNED TO DATE DUE STATUS
Attendees: Name, Facilitator Name, Team Leader
Name Name Name Name
TIME TOPIC (Presenter) PURPOSE or DESIRED OUTCOME FOLLOW-UP
XX min Welcome & Review Agenda and Task Statuses
XX min
XX min
XX min
XX min Plan Topics for Next Meeting
NEXT MEETING: DATE, TIME, LOCATION
PARKING LOT TOPIC REVISIT WHEN STATUS

0-8
MEETING MINUTES
GROUP: DATE: Day, Month, Year TIME: LOCATION:
TASKS PENDING ASSIGNED TO DATE DUE STATUS
ATTENDANCE XX/00 Members Attending Members Missing Meeting: Name, Name, Name
AGENDA TOPIC DISCUSSION STATUS DECISION and/or ASSIGNED TO
Changes to Agenda Notes
Topic Continue Complete
Topic Continue Complete
Topic Continue Complete
Next Meeting and Agenda items
PARKING LOT STATUS No Changes Notes on Changes:
NEXT MEETING: Day, Month, Year MINUTES SUBMITTED BY: Name
Source: Sam Kaner, A Facilitator’s Guide to Participatory Decision-Making
Document this information for future reference Place your organizations name or logo here or key contact information
Simply paste the list of topics from the agenda here
Use the task section to keep track of who is assigned work, and when it is due. After the meeting this section can be quickly completed and sent to attendees.
Follow-up with these members
If topics were altered from the original agenda, note so here
Summarize key elements of the discussion, rationale for decisions made or concerns and new topics brought up.
If documents or handouts were used you can hyperlink to those documents here. This is for easy future reference.
Clearly document any outcomes from the discussion here –include names
STATUS - Select one to indicate that an issue has been addressed – this keeps agendas from getting redundant
These items should make up next or future agenda, along with continued topics from above
Parking lot items may change on occasion – make notes her & on agenda
Transfer to next agenda Note who was responsible for this documentation
Monitor meeting attendance and watch for changes

0-8a
MEETING MINUTES
GROUP: DATE: TIME: LOCATION:
TASKS PENDING ASSIGNED TO DATE DUE STATUS
ATTENDANCE: Members Missing Meeting:
AGENDA TOPIC DISCUSSION STATUS DECISION and/or ASSIGNED TO
Changes to Agenda
Topic
Topic
Topic
Next Meeting and Agenda items
PARKING LOT STATUS No Changes Notes on Changes:
NEXT MEETING: MINUTES SUBMITTED BY:

0-9
ALTERNATIVES TO MEETINGS
One of the challenges about working in meetings is the difficulty in finding the right time for a group to meet. Coordinating calendars may take weeks before a time can be set. In a rapid cycle improvement environment, a formal meeting may not always be the best setting to move the work forward.
Consider the following options:
Quick Huddles
This is a great way to keep staff involved and continue making progress. Simply ask the group to briefly come together to report out, or gather feedback. This can be done anytime enough staff is around and has the time to huddle. Huddles should be no more than 5 minutes and should be used only for a narrowly focused topic. Be sure to write down notes of the discussion.
Feedback Boards
White boards or bulletin boards are another way to capture ideas, feedback, or problem solve. The board should be in a location that is easily accessed. This works well for one focused question. Write down a few instructions, if needed. Post-it notes work well since they can be collected and the information compiled for easy tracking.
E-mail Discussion Threads
If the group is brainstorming or providing feedback, using e-mail is an alternative. The main benefit is the conversation is documented as it takes place. The negative is that e-mail is subject to misinterpretation. If the topic is controversial or sensitive, a face to face meeting is always best. As long as the topic is focused and brief, e-mail can work well.
Brief Surveys
When a decision is needed, a short survey of 1-3 questions is a good way to get this information. This can be done on paper, but a web-based tool sent as a link in an e-mail is another option. The benefit to this method is the responses are tallied automatically. Remember to always share the results of the survey with those who participated.

1-0
SECTION 1 – EVIDENCE BASED INTERVENTIONS AND OUTCOMES
Beginning an improvement project can be overwhelming without a well
designed plan. Often that plan begins with understanding your current process or system. Healthcare processes can be very complex and often require a number of sources and perspectives to understand what is really going on. Using a combination of data and observations will provide a team with a greater understanding of what evidence based interventions will best improve their processes or systems.
This section includes tools to assist teams in understanding their current state. Process Maps, Staff Harm Assessments and Root Cause Analysis are all great ways to gain your staffs perspective on how your system works. Pairing the results of one (or several) of the above tools with a Pareto chart analysis will help teams validate what is truly occurring in the system. The Pareto tool provides a deeper dive into the key drivers of patient harm.
Once a team has a strong understanding of the current state and understands the causes of patient harm, the Driver Diagram can be used. The Driver Diagram will assist a team in choosing evidence based interventions that are directly tied to the outcomes they want to achieve. Upon completing activities in this section, a team should have a solid understanding of what interventions will improve their outcomes.

1-0a
ROADMAP FOR UNDERSTANDING YOUR SYSTEM
Do we have existing process measures in
place?
Conduct a Staff Harm AssessmentWorksheet 1-4,5
Analyze the results in a Pareto ChartWorksheet 1-9
Begin gathering process measures on
needed areas
Conduct a FMEA on existing processes/
tasksWorksheet 1-10
Do we have RCAs or Near Miss Reports from the last 6-12 months?
Review cases and use system factor analysis tool to identify system /process
risksWorksheets 1-6 and 1-7
Gather charts of 5 patients who recently had the procedure or
risk for harm
Identify 2-4 system factors or processes that have a high risk for
error
Use system factor analysis tool to identify system /
process risksWorksheets 1-6 and
1-7
Gain a Better Understanding through Systems Analysis
(Examine both process and outcome)
Process Review Outcomes Review
YES NO NOYES
Establish process measurement
Section 2
Consider documenting the processWorksheets 1-1,2,3

1-1
UNDERSTAND THE CURRENT PROCESS – HIGH LEVEL PROCESS MAP
The team needs to have a shared understanding about the process it is attempting to improve. A high-level process map creates a visual picture to help the team learn about the process. This should be at the 50,000 foot level within only 6-8 key steps in the process.
Actions:
1. Define the scope of the process (starting and ending points.)Hint: This should match the scope of your project and helps reinforce what is “out ofbounds.”
2. Identify the high level process steps (major steps of the process) in the order theyactually take place.Hint: If your high level process map has more than 6-8 steps or takes the team morethan about 30 minutes to complete, you are going into too much detail that will likely notbe helpful and will slow the team down.
3. Think about who performs each step and hand-offs between key people or departments.
Example for OR turnover Blank Template
Clean room & next case cart into OR
Transport patient
Bring case cart & equip. into OR
Open and setup
Transport
Anesthetize
Position and prep patient
Perform procedure
Starting Step
Ending Step

1-2
UNDERSTAND THE CURRENT PROCESS – MULTIPLE PERSPECTIVES
In addition to describing the current situation using a simple flow chart, the problem can be viewed from five perspectives: when, where, what, who and why. By doing this we are often able to narrow our focus. The following are questions related to the five perspectives:
1. When does the problem occur? (example: on the weekend, at night)2. Where does the problem occur? (example: only in the OR, in patient bathrooms)3. Who is involved when the problem occurs? (example: CNAs, RNs)4. What are the symptoms of the problem? (example: test results are not on the cart at the
time of report)5. Why does the problem occur at the places indentified above? (example: supplies are not
handy at the bedside)
Note: You don’t have to have an observation for all of the first four perspectives – the goal here is to narrow your focus. This will help you also narrow your set of actions and ensure your actions are accurately matched to your problem. You do need to have observations as to why the problem is occurring so you know what needs to be fixed.
Actions:
1. Identify theories as to each of the perspectives including why the problem is occurring.2. Determine if you have data to prove or disprove these theories.
Perspective Process Theories How could you prove or disprove this theory?
When
Where
Who
What
Why

1-3
UNDERSTAND THE CURRENT PROCESS – CROSS FUNCTIONAL PROCESS MAPPING
Hand-offs between departments can be a weak spot in a process. It may be useful to examine the points of transition between one area and another.
These are the basic steps to create a cross-functional process map:
1. Draw horizontal or vertical lines to represent each of the roles identified. Use verticallines if you have up to three roles and horizontal lines for more than three roles.
2. Add a label to each lane with the name of the role or group involved in the process.3. Place process steps in the lanes of the role that performs that step. Put them in a logical
order moving from top to bottom if using vertical lanes or left to right if using horizontallanes.
4. Draw lines between each step and label the line with the information or objects beingpassed from step to step.
5. Decision steps need at least two paths based on the possible outcomes of the decision.Have the decision lines go to different process steps based on the result.
Emergency Room Radiology Laboratory Inpatient Unit
Optional – It may be helpful to number each step and create a description of that step. This is useful if a simple process map is needed to describe more detail in that step.
Physician enters orders in EMR
EMR Orders sent to department
Clerk monitors for new orders
Lab staff checks hourly for new orders
Sends text to radiology staff
Staff on duty visits ER
Find appropriate staff person
Admitting RN reviews results
Gather samples
Run tests
Admission Orders received

1-4
STAFF HARM ASSESSMENT FORM
Purpose:
The purpose is to tap into your knowledge and experiences at the frontlines of patient care to find out what risks are present on your unit that have or could jeopardize patient safety. This may be done with a focus on overall patient safety or can be customized to a specific patient care process.
Who Should Complete:
This may vary - the entire unit or just those impacted by a specific process.
How to Complete:
Provide as much detail as possible when answering the two questions. Drop off your completed assessment form in the location designated by the _______________________________ team.
When to Complete:
Assessing harm should be considered an iterative process with no defined end (like a moving bicycle wheel.) It can be filled out by any health care provider at any time. At the very least, all health care providers should complete this form semi-annually.
Name (optional): ______________________________________________________________________________________
Job Category: __________________________________________________________________________________________
Date: _____________________________
Unit: ___________________________________________________________________________________________________
Please describe how you think the next patient in your unit/clinical area will be harmed (insert the name of the process being evaluated if the assessment is specific to a single process): _________________________________________________________________________________________________________________________________________________________________________________________________________________________________________________________________________________________________________________________________
Please describe what you think can be done to prevent or minimize this harm: _________________________________________________________________________________________________________________________________________________________________________________________________________________________________________________________________________________________________________________________________
Thank you for helping to improve safety in your workplace!

1-5
STAFF PROCESS ASSESSMENT FORM
Purpose:
The purpose is to tap into your knowledge and experiences at the frontlines of patient care to find out what process failures are present on your department or unit that adversely impact the patient experience, or create waste and redundancy in the department or unit.
Who Should Complete:
This may vary - the entire unit or just those impacted by a specific process.
How to Complete:
Provide as much detail as possible when answering the two questions. Drop off your completed assessment form in the location designated by the _________________________________________ team.
When to Complete:
Assessing opportunities for improvement should be considered an iterative process with no defined end (like a moving bicycle wheel.) It can be filled out by any health care provider at any time. At the very least, this form could be used at the beginning of an improvement effort, and then as a post-implementation evaluation.
Name (optional): ______________________________________________________________________________________
Job Category: __________________________________________________________________________________________
Date: _____________________________
Unit: ___________________________________________________________________________________________________
Please describe how you think the __________________ process fails to work in the department/unit: _________________________________________________________________________________________________________________________________________________________________________________________________________________________________________________________________________________________________________________________________
Please describe what you think can be done to prevent these process failures: _________________________________________________________________________________________________________________________________________________________________________________________________________________________________________________________________________________________________________________________________
Thank you for helping to improve our work for our patients!

SYSTEM FACTOR ANALYSIS
System factor analysis is a process for gaining a better understanding of a wider range of opportunities for improvement. The analysis provides greater understanding of most contributing factors to why a system is not producing the results you expect. Use a system factor analysis when you do not have a little good understanding of the processes and data is limited. The analysis will provide opportunities for improvement and guide you as to which processes are most important to measure.
CONTRIBUTING FACTORS Yes No Unknown
PATIENT RISK FACTORS: Were there any clinical factors that may have contributed to the event?
External Factors: Were there socioeconomic factors?
Task Factors: Is there a policy/procedure associated with this event? Was it followed? If not, why?
Staffing Adequacy Factors:
Were we staffed to staffing matrix?
Was the skill mix appropriate for assigned tasks?
All involved staff competencies up to date?

Caregiver Factors: Was there anything unusual going on? Did the caregiver feel uncomfortable with the patient/task?
Team/Communication Factors: Was hand-off communication clear and accurate? Was there a cohesive team structure? Did fear play a factor?
Training/Education Factors: Was the provider knowledgeable about the process? Did the provider follow established processes? Did the provider seek supervision or help?
Environmental/Equipment Factors: Did equipment failures contribute to the event? Was the appropriate equipment available?
1-6

1-7
SYSTEM FACTOR ANALYSIS DIAGRAM
Use this diagram when summarizing a system factor analysis. When a contributing factor is identified you can use the chart below to map out your action plan for improvement. Below you can list the significant contribution factors, identify how they can be improved, and then who will be responsible for resolving the issue.
Opportunities for Contributing Factors: Improvement (What) Who When Resolution

1-8
HOW TO USE DRIVER DIAGRAMS
Driver diagrams illustrate what actions could be taken to influence an outcome and how key factors are related to the desired outcome. This is an important teaching tool for team members. Driver diagrams help explain what is important and why it is necessary to change or improve processes. Be sure to explain your analysis to others.
Several key questions to consider when developing your own or reviewing a driver diagram:
1. Does the AIM align with the hospital goals? Is it a priority right now? 2. Which of these do we take into consideration now? Do we account for all the drivers? 3. Do we have data on any of these processes? If we have data, is the performance good?
Who would need to be involved in the change?
Once you review the driver diagram related to your hospitals experience, prioritize those processes that need improvement in order to achieve the AIM:
1. This is important because of Medicare penalties. 2. Our EMR does stratify risk and we implemented a d/c form last year. We may hire a
community liaison. 3. We haven’t formally implemented Teach Back and our follow up calls aren’t consistent.
We have two priorities to work on in six months.

1-9
PARETO CHART - USING DATA TO DETERMINE PRIORITIES
You can analyze existing data to determine key drivers of an outcome. One of the ways to do that is to use a Pareto chart. Using feedback gathered on the Staff Harm or Staff Process Assessment, group the responses into like categories, then tally the number in each category.
Why use a Pareto Chart?
A Pareto chart is a bar graph where the lengths of the bars represent the frequency of an event or category, and are arranged with the longest bars on the left and the shortest to the right. In this way the chart shows which categories contribute more to the issue. This is based off the Pareto Principle. The principle states that for many situations, roughly 80% of the adverse outcomes come from 20% of the causes. You can also use existing data. See the readmissions example below. Heart Failure and Acute Myocardial Infarction patients are about 80% of all readmissions.
When to Use a Pareto Chart • When analyzing data about the frequency of problems or causes in a process • When there are many problems or causes you want to focus on, but only have resources
for the most significant • When analyzing broad causes by looking at their specific components • When communicating with others about your data in a visual way
Where to find a template - An example template and instructions are on the WHA Quality Center.
Pts confused about meds No follow-up visit Couldn’t get to Dr. office Can’t do home exercise Can’t read instructions No one home to help with care

1-10
FMEA – FAILURE MODES AND EFFECTS ANALYSIS
Failure Modes and Effects Analysis (FMEA) is a systematic, proactive method for evaluating a process to identify where and how it might fail and to assess the relative impact of different failures, in order to identify the parts of the process that are most in need of change. FMEA includes review of the following:
• Steps in the process • Failure modes (What could go wrong?) • Failure causes (Why would the failure happen?) • Failure effects (What would be the consequences of each failure?)
Teams use FMEA to evaluate processes for possible failures and to prevent them by correcting the processes proactively rather than reacting to adverse events after failures have occurred. This emphasis on prevention may reduce risk of harm to both patients and staff. FMEA is particularly useful in evaluating a new process prior to implementation and in assessing the impact of a proposed change to an existing process. Instructions:
Step 1 – Select a process to evaluation Step 2 – Recruit a multidisciplinary team Step 3 – List the steps in the process – In most cases only problematic or frequently
occurring steps need to be listed and evaluated. Step 4 – Have the team list failure modes and codes – failure modes are anything
that could go wrong, including minor and rare problems. Then for each failure mode listed, identify possible causes.
Step 5 – For each failure mode, have the team assign a Risk Priority Number (RPN) – assigning RPNs (1-10) helps the team prioritize areas to focus on and can also help in assessing opportunities to improve.
Step 6 – Evaluate the results - by applying the following formula to the three scores: Likelihood of occurrence score x Likelihood of detection score x Severity score = RPN From there, choose 2-4 steps with the highest RPNs and focus on those processes for improvement efforts.
Step in Process
Failure Mode
Failure Causes
Failure Effects
Likelihood of
Occurrence (1-10)
Likelihood of
Detection (1-10)
Severity (1-10)
Risk Profile
Number (RPN)
Actions to Reduce Occurrence of
Failure

1-10a
FAILURE MODE AND EFFECTS ANALYSIS - ORDER AND DELIVERY OF VTE PROPHYLAXIS EXAMPLE
Step in Process
Process Description
Failure Mode
Failure Causes Failure Effects Likelihood of
Occurrence (1-10)
Likelihood of
Detection (1-10)
Severity (1-10)
Risk Profile
Number (RPN)
Actions to Reduce Occurrence of
Failure
1 Provider completes risk assessment, orders prophylaxis
Does not complete assessment/ orders
• Forgets to complete
• No standard order
• Time constraints
• Orders not in CPOE
Patient does not receive prophylaxis
5 4 3 60(5 x 4 x 3 = 60)
Put order set in CPOE System Create daily report to ensure orders are completed
Incorrect risk assigned to pt.
No standard order set linking risk factors and contraindications
Patient receives incorrect prophylaxis
2 8 5 80 Create standard order set based on best practices
2 Clinical support delivers prophy
Failure to complete prophy
Number catheters ordered vs. number used
Patient does not receive prophylaxis
4 8 3 96
3 Change in pt. VTE risk level
Likelihood of occurrence: Assign a score between 1 and 10, with 1 meaning “very unlikely to occur” and 10 meaning “very likely to occur.” Likelihood of detection: Assign a score between 1 and 10, with 1 meaning “very likely to be detected” and 10 meaning “very unlikely to be detected.” Severity: Assign a score between 1 and 10, with 1 meaning “very unlikely that harm will occur” and 10 meaning “very likely that severe harm will occur.” In patient care examples, a score of 10 for harm often denotes death.

1-10b
FAILURE MODE AND EFFECTS ANALYSIS TEMPLATE
Step in Process
Process Description
Failure Mode
Failure Causes Failure Effects Likelihood of
Occurrence (1-10)
Likelihood of
Detection (1-10)
Severity (1-10)
Risk Profile
Number (RPN)
Actions to Reduce Occurrence of
Failure
1
2
3
4
5
Likelihood of occurrence: Assign a score between 1 and 10, with 1 meaning “very unlikely to occur” and 10 meaning “very likely to occur.” Likelihood of detection: Assign a score between 1 and 10, with 1 meaning “very likely to be detected” and 10 meaning “very unlikely to be detected.” Severity: Assign a score between 1 and 10, with 1 meaning “very unlikely that harm will occur” and 10 meaning “very likely that severe harm will occur.” In patient care examples, a score of 10 for harm often denotes death.

2-0
SECTION 2 – IMPLEMENTING PROCESS MEASURES
We have all experienced improvement projects that have failed. Despite
how great the idea or how many resources were spent in development, when a project lacks that right type of improvement methodology, it will most often struggle. This section is designed to provide you with the knowledge and methodology you will need to run a successful improvement project.
The previous section focused on system and process evaluation, identifying the root causes of harm and determining where to prioritize improvement efforts. This section will help identify suggested evidence based practices and determine which strategies may have the most impact in improving the system. Once interventions are chosen, this section will provide a highly effective methodology to guide improvement efforts called the “IHI Model for Improvement.”

2-0a
ROADMAP FOR CHOOSING INTERVENTIONS AND PROCESS MEASURES
Identify 2-4 system factors or processes that have a high risk for error
Identify measures on WHA quality center PfP encyclopedia of measures that align
with your findings (or speak to your improvement advisor for ideas)
Develop a Process Measure Data Collection Plan
Worksheet 2-5
Create data displays that are meaningful to front-line staff
Update data displays no less than once per month
Responsible data submitter(s) learns the data reporting process
Enter outcome and process measure data
into WHA Quality Center on a monthly basis
Review data at team meetings, department meetings, and with other affected groups
External
Internal
KEY STEPS1) Identify Metrics2) Determine if evidence is available that shows the process is impactful3) How will data be collected? (manual, EMR, other)4) Who will be responsible for collecting/displaying/reporting?5) When will the data be collected?6)How will the data be displayed?
After Goals have been met, determine need and frequency of
data monitoring inSection 6
Begin process improvement work
Section 3
Determine aims, goals and key measures Worksheet 2-2 or 2-3
Select processes to actively improveWorksheet 2-1 or 2-4
2-1
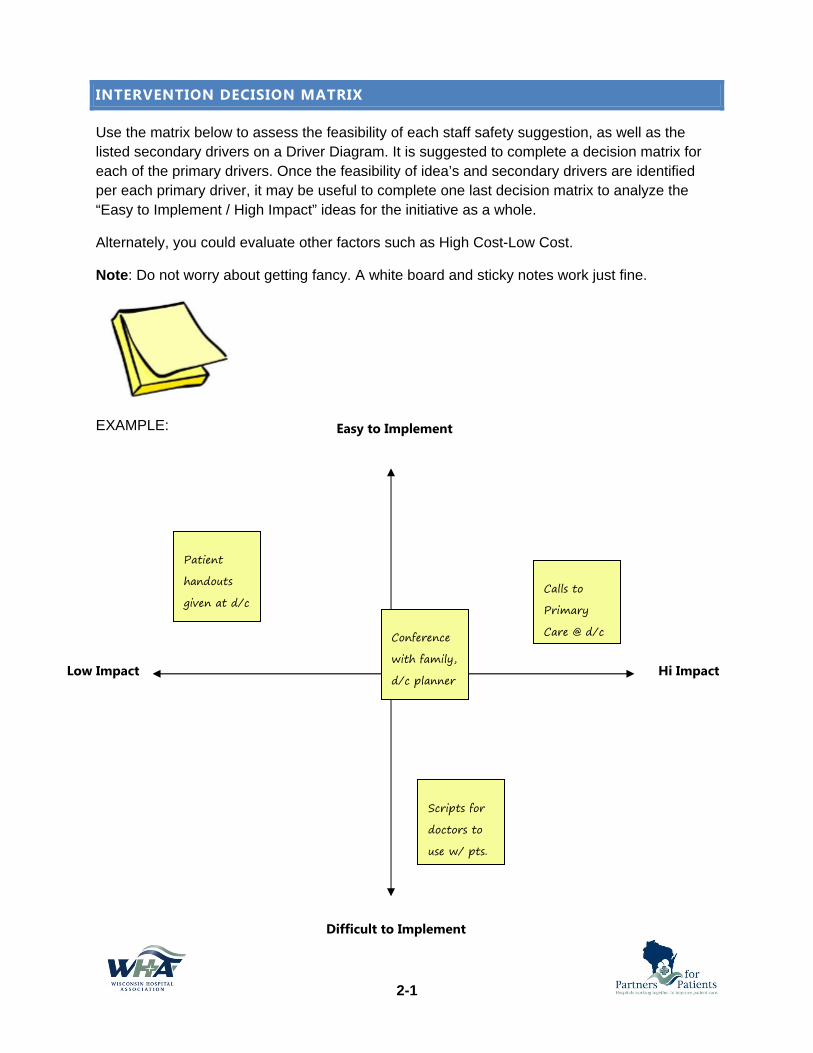
INTERVENTION DECISION MATRIX
Use the matrix below to assess the feasibility of each staff safety suggestion, as well as the listed secondary drivers on a Driver Diagram. It is suggested to complete a decision matrix for each of the primary drivers. Once the feasibility of idea’s and secondary drivers are identified per each primary driver, it may be useful to complete one last decision matrix to analyze the “Easy to Implement / High Impact” ideas for the initiative as a whole.
Alternately, you could evaluate other factors such as High Cost-Low Cost.
Note: Do not worry about getting fancy. A white board and sticky notes work just fine.
EXAMPLE: Easy to Implement
Difficult to Implement
Low Impact Hi Impact
Conference with family, d/c planner
Patient handouts given at d/c
Scripts for doctors to use w/ pts.
Calls to Primary Care @ d/c

2-1a
INTERVENTION DECISION MATRIX
Use the matrix below to assess the feasibility of each staff safety suggestion, intervention or secondary drivers on a Driver Diagram. Note: Do no worry about getting fancy. A white board and sticky note work just fine.
Easy to Implement
Difficult to Implement
Low Impact Hi Impact

2-2
MODEL FOR IMPROVEMENT WORKSHEET
100% of DC’ed Patients will have a primary care follow-up appointment by May
Define these for your improvement:
100% of Discharge Instructions given to patients will have the date, time, and provider recorded.
Introduce appt making process on the unit
1) Test discharging RN making appts.
2) Test HUC making appts.

2-2
Define these for your improvement:

2-3
AIM STATEMENT WORKSHEET
Draft your AIM statement:
We will: Improve Increase Decrease
The: Quality Number/Amount Percentage
Of (the process): __________________________________________________________________________________
On (the location): _________________________________________________________________________________
For (the clinical condition and/or patient population):
____________________________________________________________________________________________________
____________________________________________________________________________________________________
From (the baseline): ______________________________________________________________________________
To (the goal): _____________________________________________________________________________________
By (timeframe): ___________________________________________________________________________________
Our AIM Statement is:
___________________________________________________________________________________________________
___________________________________________________________________________________________________
___________________________________________________________________________________________________
2-4
PROCESS EVALUATION PLAN
Materials Needed:
1. Results from your baseline data analysis (preferably a Pareto analysis) 2. Responses from staff harm assessment 3. Any other baseline data 4. Printout of the process evaluation template
Process:
1. Review the data and information gathered during your baseline collection period. 2. Once all processes are listed, go through each process one by one and determine:
a. If there is clinical evidence that suggests this process is a driver of outcomes b. If your site has any existing or easily accessible data on this process c. How well your site currently performs this process
Note: Leave the last column blank until you have performed this review on all processes.
3. Once you have analyzed all your processes, use the last column to determine if you will actively work on improving the process. 4. Upon selecting the process your team will work to improve, transfer the process name over to the Data Collection Plan to analyze how
you will best collect and monitor data to track your improvement.
2-4
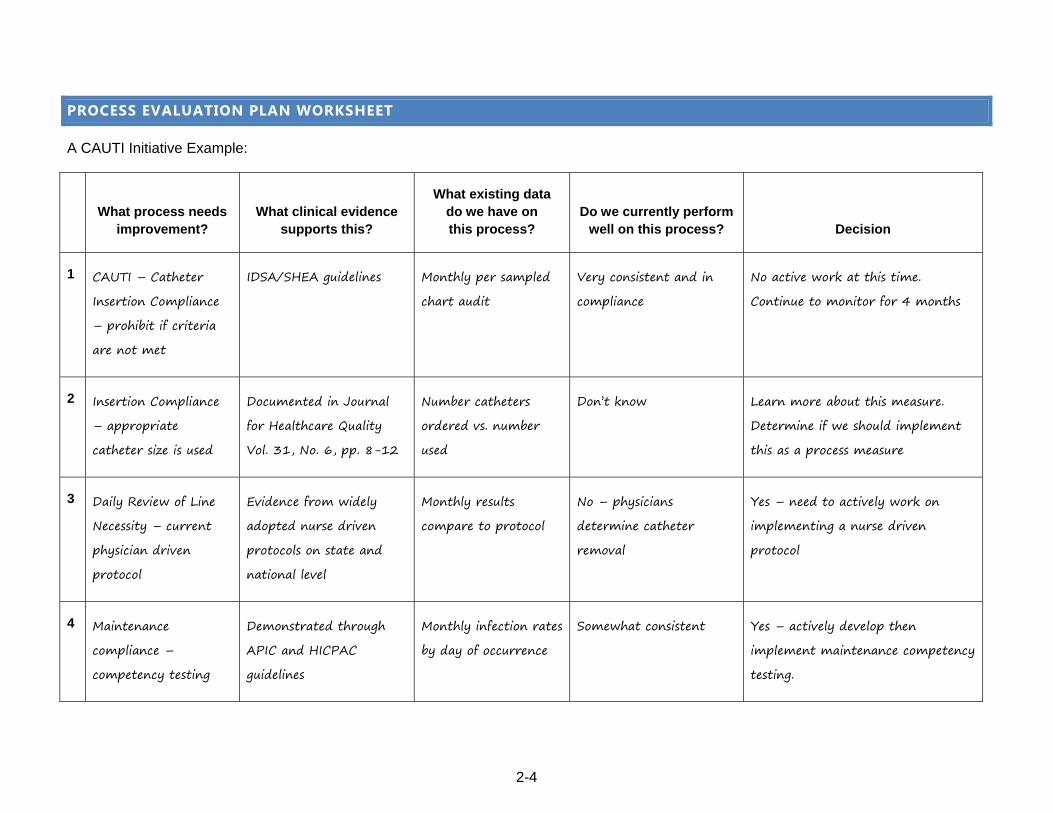
PROCESS EVALUATION PLAN WORKSHEET
A CAUTI Initiative Example:
What process needs
improvement?
What clinical evidence
supports this?
What existing data do we have on this process?
Do we currently perform
well on this process?
Decision
1 CAUTI – Catheter Insertion Compliance – prohibit if criteria are not met
IDSA/SHEA guidelines Monthly per sampled chart audit
Very consistent and in compliance
No active work at this time. Continue to monitor for 4 months
2 Insertion Compliance – appropriate catheter size is used
Documented in Journal for Healthcare Quality Vol. 31, No. 6, pp. 8-12
Number catheters ordered vs. number used
Don’t know Learn more about this measure. Determine if we should implement this as a process measure
3 Daily Review of Line Necessity – current physician driven protocol
Evidence from widely adopted nurse driven protocols on state and national level
Monthly results compare to protocol
No – physicians determine catheter removal
Yes – need to actively work on implementing a nurse driven protocol
4 Maintenance compliance – competency testing
Demonstrated through APIC and HICPAC guidelines
Monthly infection rates by day of occurrence
Somewhat consistent Yes – actively develop then implement maintenance competency testing.

2-4a
PROCESS EVALUATION PLAN - TEMPLATE
What process needs
improvement?
What clinical evidence
supports this?
What existing data do we have on this process?
Do we currently perform
well on this process?
Decision
1
2
3
4

2-5
DATA COLLECTION PLAN
Materials Needed: 1. Results from your Process Evaluation Template 2. Printout of the Data Collection Plan
Process:
1. Write down all the processes that were identified in the Process Evaluation template that will be actively working on in the first column.
2. Use the Data Collection Plan by filling out each column to accomplish the following: a. Determine what you want to know about each process (what process metric will you use to understand your performance.) b. Identify how, who and when data will be collected for each metric. c. What type of data display will be used (run chart, bar chart, etc.) and where the data will be displayed.
Process
What question needs to be answered?
What is our metric? What is the rationale for tracking this
metric?
How will data be collected? (include
special tools or technology needed)
Responsibility Party
Collection Timeframe
How will the data be
presented?
1 CAUTI – Daily review of line necessity. Switch to RN protocol.
Are our conducted reviews consistent with our protocol and guidelines? (HICPAC Guidelines Cat iA)
Numerator: Daily review of catheter necessity performed consistent with guidelines Denominator: Number of patients with urinary catheter at time of obs.
Ensure indwelling catheters are removed promptly when no longer required
Daily chart audit Infection Control Coordinator or designee
Collect daily for 4 weeks
Run Chart posted on unit bulletin boards

2-5a
DATA COLLECTION PLAN TEMPLATE
Process
What question needs to be answered?
What is our metric? What is the rationale for tracking this
metric?
How will data be collected? (include
special tools or technology needed)
Responsibility Party
Collection Timeframe
How will the data be
presented?
1
2
3
4

3-0
SECTION 3 – DESIGNING SMALL TESTS OF CHANGE
The most important aspect of improvement is involving the people who do
the work, in changing how they do the work. Careful design of small tests of change is an effective method to do so. In this section we will breakdown the Plan-Do-Study-Act (PDSA) cycle into practical steps for teams to follow. Often times, if small tests are not designed well, you may unintentionally increase resistance to change. To help effectively design small tests of change we have provided examples and recommended tools to follow.

3-0a
ROADMAP FOR TESTING BEST PRACTICES THROUGH SMALL TESTS OF CHANGE
Select a process for staff to implement a new or best
practice
Define the Small Test needed and Determine which hospital
staff should participate Worksheet 3-3
Ask for a few volunteers to participate
Gather staff feedback about the test, and document
Expand the process with more patients and / or more staff
Plan for small scale test(One patient, one day)
Worksheet 3-4
Conduct ~3 Test Cycles
Compile staff feedback; prioritize list of changes
Team meets to discuss staff recommendations and
approve changes
Expand by involving more staff in the process
Continue Test Cycles
Stop when the critical number of staff have
participated
Determine Measures of Success and plan for change using the
PDSA cycle Worksheets 3-1 and 3-2
Review Process Data
If process is stable, go to ImplementationWorksheet 3-6

3-1
PLAN – DO – STUDY – ACT CYCLE
PDSA is a systematic approach to making changes that will result in improvement. It is designed to help your team stay on track and gradually introduce change to the staff that will need to change what they do for a better outcome.
The PDSA Cycle for Learning and Improvement
ActWhat changes
are to be made? Next cycle?
StudyComplete the
analysis of the data. Compare
data to predictions. Summarize what
was learned.
Plan
Objective, questions and predictions (why.) Plan to carry out the cycle (who, what, where, when.)
Do
Carry out the plan. Document problems and unexpected observations. Begin analysis of the data.

3-2
PLAN – DO – STUDY – ACT PLANNING DOCUMENT
Use this form to organize the overall purpose of the improvement
AIM Statement: What are we trying to accomplish? Conduct four-eyed pressure ulcer assessments at least daily for all patients on MSP by June.
Measures: How will we know that a change is an improvement? How Much? By When?
1. Hospital Acquired Pressure Ulcers Rate Zero occurrence June
2. Daily Pressure Ulcer assessment is documented daily in patient record 90% June
Tests of Change: What change can we make that will result in improvement?
PLAN What changes are to be made?
DO What do we predict? Plan who, what, where, when?
STUDY Carry out the plan, document observations Begin analysis of the data
ACT What are the findings? What was learned? What is next?
1. Pt . care staff can demonstrategood four-eyed assessment
50% of staff are familiar and use good technique
Hands on training conducted; over 70% of staff could demonstrate technique; 90% new staff very good
Training was given to those needing it. Need to regularly assess ability to perform (esp. new staff).

3-2a
PLAN – DO – STUDY – ACT PLANNING DOCUMENT
AIM Statement: What are we trying to accomplish?
Measures: How will we know that a change is an improvement? How Much? By When?
1.
2.
3.
Tests of Change: What change can we make that will result in improvement?
PLAN What changes are to be made?
DO What do we predict? Plan?
STUDY Document observations:
ACT What is next?
1.
2.
3.
4.

3-3
DESIGN PLAN FOR SMALL TESTS OF CHANGE – ANNOTATED AND COMPLETED EXAMPLES
Initiative: _______________________________________________ Intervention: ________________________________________________
Smallest Change: _______________________________ Scope: ____________________ Total # of Staff Impacted: ____________________
Planned Testing Timeframe: __________________________________________________ Total # of Staff to Test: ______________________
Test Description Test Plan Testers Lesson(s) Learned Decision Adaptation
1 Adapt Adopt Abandon
2 Adapt Adopt Abandon
Example
1 Two volunteer RNs will test the assessment tool with one of their patients.
During day shift on Monday or Tuesday. Gather feedback on Wednesday.
Sue, Rob Prefer 1 page vs 2. Took over 30 minutes to complete.
Adapt Adopt Abandon
Removed the 3 questions on medications. Pharmacy will review with pt.
2 Four volunteer RNs will test the assessment tool with one or two of their patients.
During day shift on Thursday or Friday. Gather feedback on Monday.
Sue, Rob, Janet, Cindy
Form is easy to use. Time to complete varied from 5 – 20 minutes. Instructions could be clearer.
Adapt Adopt Abandon
Clarified instructions on form. Provided “How to ask…” training sheet.
What are you trying to do? Specifically what are you asking people to do? What is the change?
What is the smallest level of involvement? Who needs to change? # RNs need to change
Estimate how long the testing will take # to help test
What will you ask your testers to do? What and how?
What will the testers be asked to do after the change?
When? Where?
When? Where?
Who? What happened? What is the decision based on the testing?
What is the specific change needed?

3-3a
DESIGN PLAN FOR SMALL TESTS OF CHANGE
Initiative: _______________________________________________ Intervention: ________________________________________________
Smallest Change: _______________________________ Scope: ____________________ Total # of Staff Impacted: ____________________
Planned Testing Timeframe: __________________________________________________ Total # of Staff to Test: ______________________
Test Description Test Plan Testers Lesson(s) Learned Decision Adaptation
1 Adapt Adopt Abandon
2 Adapt Adopt Abandon
3 Adapt Adopt Abandon
4 Adapt Adopt Abandon
5 Adapt Adopt Abandon
3-4
PRINCIPLES FOR CONDUCTING SMALL TESTS OF CHANGE
Preparation
1. Identify who will be impacted by the change: a. Who will have to change how they work b. How many in those roles will be impacted c. Who has to buy in
2. Teach those to be impacted the rationale for the change. 3. Introduce that audience to the specifics of the intervention to be
tested. 4. Clarify the expectations around participation – use volunteers to start. 5. Be very clear about the role of the volunteers:
a. Trial b. Provide feedback c. Make suggestions
6. Have a process measure related to the tests showing the improvement with data.
Design Principles
1. The purpose is to involve and learn from those who do the work AND to speed up the rate of innovation adoption.
2. Carefully identify the scope of the change: a. All patient care staff b. Only nurses c. Only day shift
3. Begin with the smallest unit of change possible and apply the Rule of 1’s: a. 1 Staff person b. 1 Team c. 1 Hour d. 1 Patient
4. Alternately, begin two levels down from where you would normally start: a. One month one day one shift b. One day one shift one hour
5. Draft your plan ahead of time knowing it might change. 6. Plan for easy and efficient collection of feedback from your testers (huddles are
recommended). 7. Spread systematically (exponentially if possible):
a. One hour, 2 hours, 4 hours, 8 hours OR 2 nurses, 4 nurses, 8 nurses, 16 nurses, 32 nurses
b. Pair an experienced tester with someone new to the changed process 8. Quickly turnaround the learning and begin a new test with the modifications in place.

3-4
When Testing Doesn’t Go Well
1. Don’t quit! 2. Huddle with all testers together to get group feedback. 3. Drop back a level or two on the testing plan and conduct the testing again with the
recommended changes. 4. If struggles continue, specifically gather feedback from those who are resistant and
determine root causes for resistance to the change. 5. Redesign the testing and continue.
Move to Implementation
1. When most of the target audience or those impacted by the change have had an opportunity to participate or at least provide feedback.
2. When the new process is done consistently. 3. When the new process is stable and can be documented for purposes of training,
procedure or policy.

3-5
TROUBLESHOOTING SMALL TESTS OF CHANGE
Why is conducting Small Tests of Change so hard?
How might we design our small tests differently to address this issue?
Takes time away from the work of the staff
• Ensure the focus of the test is patient care. • Keep the “ask” and the test simple, and very clear. • Gather feedback in brief hallway huddles rather than scheduling
meetings.
Only a small group of staff are willing; get burned out
• Mix up the involvement away from the same people • Try pairing your willing testers with someone who will “try it
once”. • Is participating in small tests an expectation of staff, and if so, do
they know this.
Staff are uncomfortable with trying new things, so getting ‘buy-in’ is hard
• Design the test so it is only slightly different from what is familiar – break the task down.
• Take time to explain the reason for the change, or show some evidence that it is better for patient care.
• Allow staff to decline participation twice
Maintaining momentum after initial enthusiasm is really challenging
• Celebrate small wins; such as reaching the goal of 70% of staff participating in small tests.
• Post the PDSAs and Test of Change logs for all staff to see. • Recognize staff for participating in tests of change • Ensure managers show appreciation for those helping • Celebrate results in patient outcomes.
People disagree about how to proceed
• Conduct small tests incorporating both ideas. • Involve the same staff in tests for each approach.
Not everyone agrees the change is important
• Check for lack of knowledge; is the staff person aware of the evidence?
• Check for lack of understanding; is ‘how’ the change happening clear to staff?
• Lastly, have a dialogue about the reasons for disagreement.
Collecting the ‘in process’ data is really hard
• Stick to very simple counts; use easy check sheets, etc. • Ensure it can be collected during patient care time. • Use a fun approach, if you can (red or blue marbles, stickers). • Collect data once in a while instead of all the time. • Collect only a sample; just enough to learn

3-5
It’s hard to get the right people involved, such as those with experience (they are too busy), or those with strong opinions.
• Start with the core team, then with those who are willing. • Show that others are willing to test and trial. • Ask again! • Discuss - Find out what they would need to be able to
participate.
It’s tough to get the authority to make a change.
• Document your plan first; be specific and present it to leaders. • Ask for permission to try 3 cycles of small tests before reporting
back. • Present results and data from the testing; propose next steps. • Ask leaders directly about concerns or feedback.
Keeping the focus on the patient is a challenge; sometimes change becomes all about the staff
• Explore how the change improves patient care.
• Document these findings and post where all staff can see.
• Be willing to ask “how does this help our patients?”
What we are trying to do gets easily misinterpreted by the staff as its transmitted through “the grapevine”
• Be super transparent, and be prepared to address misinformation by talking to staff, informally or formally.
• Talk about testing, document your testing, put documentation where staff can see it.
• Ask staff, frequently, if they have any questions about small tests of change.
Making the scope of the change small enough isn’t in our nature, we like to “just do it”
• Just do it, and you’ll be doing it again, ….and again, ….and again. • Stick to the Rule of 1s. (One patient, one nurse, one day) • You can always go back and get smaller.
Work on improvement isn’t acknowledged
• Acknowledgement can come from yourself – Celebrate! • Recognize others amongst your colleagues to senior leaders. • Use your internal communication channels – newsletters or
intranet to provider acknowledgement of improvement work – especially results!
It’s time consuming to get the information/data we need.
• Search for other sources of help to collect data: volunteers or students?
• Are you simplifying the data you need? • Are you collecting “just enough to learn from”?
It hard to keep the new practice going once the staff move on to something new
• Do you know who is accountable for “keeping it going”? • Are there regular “check-ups”? • Is the data tracked over time, and displayed for all to see?

3-6
PROCESS FOR IMPLEMENTING A NEW OR CHANGED PROCESS
After using Small Tests of Change cycles to gradually introduce change to the staff - and once the changes are stable enough to document and train others – it is time to formally implement the new or changed process. Implementation should be carefully planned as any other aspect of the improvement project.
The diagram below suggests the key steps needed to conduct a good implementation:

4-0
SECTION 4 – PUTTING YOUR DATA TO WORK
Putting your data to work means presenting and analyzing data in ways that
help make it easier to understand and act on the results. Too often teams never fully reap the benefits of their data because they submit it to a regulatory body and fail to learn from the results. However, this section provides tools to make data more useful to teams.
Turning data into useful information can be done in a variety of ways. Run charts, control charts, Pareto diagrams, histograms and dozens of other tools can help teams analyze their data better and gather more meaning from it. These tools are used to increase the team’s knowledge about the process beyond anecdotal observations; providing the team with the information they need to make data-driven decisions.
In this section we provide two tools to help teams start to use data more meaningfully. We begin with guidelines for creating and analyzing run charts. This includes how to identify patterns, shifts/trends, special cause variation and pitfalls to avoid. The second tool is an instruction guide to segmenting data. This tool is useful for teams who still have more questions that can’t be answered through a simple run chart. By the end of this section, data collection/displays should be used for more than just meeting regulatory requirements, they should be used as a method to help monitor and drive future improvement efforts.

4-0a
ROADMAP FOR PUTTING YOUR DATA TO WORK

4-1
USING RUN CHARTS
Once your data is collected, the next step is to analyze it dynamically using a run chart. A run chart will provide a visual display that will help you monitor progress and make decisions. It is important to analyze run charts correctly. If not, you may make incorrect decisions and create more variation in your system. This section will provide you the essential run chart knowledge and skills and including:
1. Collecting and sorting your data in tables for easy run chart development2. Understand the elements of a run chart3. Three essential rules for identifying change in your run chart4. Recommended pitfalls to avoid when analyzing run charts5. Suggested talking points when explaining the results of your data
Graphing Your Data
Month Numerator Denominator
Elements of a Run Chart
• Measure (y-axis)• Time (x-axis)• Data• Median

4-1
Median vs. Mean (Average)
Why Median vs. Mean? Median is not as influenced by astronomical points like the Mean.
Baseline
(Months)
Number of CAUTI’s/1000 Catheter Days
Median Average
January 15 13
(15+18+20+16+13+45+18) / 7= 21
February 18 15
March 20 16
April 16 18
May 13 18
June 45 20
July 18 45
Rules to Identify Non-Random Patterns
• A shift in the process or too many data points in a run (six or more consecutivepoints above or below the median)
• A trend (five or more consecutive points all increasing or decreasing)• An “astronomical” data point
Recognizing Patterns
4-1
Pitfalls to Avoid
• Assuming you have a shift or trend before you do• Overreaction to one data point• Not being able describe outliers• Not being used as feedback• Make visible to the staff making the change• Data is too old to analyze current test of change
Data Talking Points
Don’t over-react to one point. Understand what drove that point and how it relates to your overall performance over time.
If the data is showing improvement, how will you sustain that level of performance? How can you help spread your best practice to others?
Explaining Your Data
If the outcome data isn’t showing improvement:
• Does this truly reflect your overall quality on this measure or is this an aberration?• Will your current level of involvement and planned changes correct this?• How can you use this data display to motivate others within your facility to help?• How can you reach out to others to learn successful best practices?
If the process data isn’t showing improvement:
• Do you need more small tests of change (PDSA) cycles?• Is the process already performing at the best possible level?• Is what your measuring really reflect your process change?
Where to find run chart templates Multiple example templates and instructions are available on the WHA Quality Center

4-2
DIGGING DEEPER INTO DATA
At some point during your work, a simple run chart will not provide you with the detail you need to continuously make improvements. You will need do dig deeper into the drivers of your outcomes and segmentation is one way of getting there.
What is Segmentation?
Segmentation is the process of classifying information into groups that share common characteristics. For example, in healthcare it can be valuable to know which segments of a population are most likely to be readmitted without certain inventions related to discharge planning and follow-up. The more data you have, as well as different types of data, the more useful segmentation analysis will be.
When to segment data?
Often times run charts for your process and outcome measures can provide a team with enough data to continue to drive their improvement. However, once you have removed most of the “low-hanging fruit”, it can be quite difficult to improve if the interventions are not specific to the right situation or patient. If a team is not seeing improvement or has reached a point where they plateau, it may be time to take a deeper dive and segment out your data.
How to segment?
Segmenting can be done a number of ways. Common ways to segment include by age, diagnosis, gender, procedure, etc. However, in improvement work you may have to think of creative ways to segment your data to see where your processes are leading to patient harm. Examples could include time of day errors occur, days of the week, medication types, type of support system outside the hospital, etc. To segment data you could use the Pareto chart earlier in the workbook to create categories/groups, or you can create a simple bar chart. As shown on the next page.

4-2
Where to get the data?
Segmenting usually involves looking at a large amount of data and often times this data cannot be collected manually. You may need to recruit the help of your IT department or other reporting services and talk though what information you are looking for to get a meaningful set of data that you can segment into different groups.
Example
This example looks at Insulin related adverse drug events over the course of several months. This group decided to look at time of day their events where occurring.
By segmenting the data this group was able to see most of their adverse drug events related to insulin occurred in early and late morning. With a little more digging they found that although they had worked to improve lunch and dinner meal time coordination with insulin, the staff working in the early morning had never been involved in the process. By segmenting the data, they were able to focus on improving their process for coordinating breakfast as well and improve their outcomes. Not all situations may work out so clearly, so teams may have to segment their data in different ways.
Template
Group Frequency
Example: Age 18-28 III
Fill out the table with your segmented data and then if needed create a bar chart to visually see which segment is leading to the most patient harm or errors.

4-3
BEST PRACTICES FOR DATA SHARING
In order for staff to learn from data, it is vital that the data is shared with them. Below is a checklist of things to consider in order to get the most out of your data.
Frequently update the data – weekly or monthly is best.
Data is displayed where people doing the work can see it.
Results are viewed and discussed in a group.
Displays are simple and easy to understand.
Link key process changes to the data (Using annotation – see example)
Clearly define who will collect the data and keep it current

5-0
SECTION 5 – SPREADING CHANGED PROCESSES
Once changes have shown results, and the processes are becoming stable
the next step is spreading the improvements to units or departments doing similar work. Too often one area of a hospital finds a safer or more efficient way, but that practice is never shared. The result is uneven performance, meaning patients may experience high quality, safer care in some areas of the hospital, but not all.
Spreading change processes requires careful planning and finding the right balance between replicating the process, yet allowing for some differences based on the unit culture or particular requirements. Typically, a systematic process improvement will be adopted more quickly with each new department – because many of the ‘bugs’ have been worked out in advance. However, each department is different and those staff will need to adapt and adopt the process through cycles of change. It would be a mistake to simply hand off the tools, procedures, and policies to another area and expect them to be followed.
The tools in this section are designed to guide the planning for spread, and see it through to the successful adoption by another unit or department.

5-0a
ROADMAP FOR SPREADING BEST PRACTICES
Has process measure data improved with small test of
change group?
Has outcome data improved?
Have new processes been adopted by a critical
number of staff
Is there leadership support for spreading beyond pilot
area Worksheet 5-1
Are your process, tools, and work instructions
stable?
Is there a pull for change (i.e. other areas are interested or asking
questions)
Launch systematic improvement process in other area(s)
Worksheet 5-3. 5-3a
*If needed, see techniques for engaging others (appendix)
YES
Continue to monitor
YES
NO
Continue series of tests with
additional staff
Have you conducted
several cycles of testing?
Determine if process aligns with measurement and continue testing
and trialing process changes
NO
NO
YES
NO
YES
NO
YES
NOBuild the evidence to support
spread Worksheet 5-2 or use an A3 Template
YES
NO Educate other area(s) and build the case for change*
YES
Pilot members coach or aid other area(s) in PDSA
process

5-1
SPREAD PLANNING BEST PRACTICES
When transferring a new process to another unit or department it is best to recall what the change was like in your area.
Was everyone immediately convinced of the need to change?Did everyone easily adapt to the change?
Generally, the answer would be “No”. So it is important to remember that another department will have similar challenges. The leadership will need to be on board with the change, staff will need to know the evidence and rationale for change, and they will need to conduct their own process for testing and adopting the process.
Here are some tips when planning to spread to another department or unit:
Are the leaders involved in favor of the change?
• Each leader of the new unit/department must believe that the new way will be worthwhileto adopt and will commit to ensuring the people and resources are available.
Are the process, data, and outcomes in a form that can be shared with others who are unfamiliar with the process?
• Have a “change package” ready to share with others including references, definedmeasures, tools, other supporting materials. A storyboard is very useful.
Has there been a conversation between the experienced staff and the staff new to the process?
• It is a good idea to have the experience staff meet with new staff that will be impacted bythe change. They will hear “first hand” what the process was like and can get theirquestions answered by those who do the work.
Is the expectation for adopting the change clear to everyone?
• Setting an aim and goals, developing a team charter, and an estimated timeline forcompletion will help the process move forward.
Is there a team of staff who will lead and agree to participate in the tests of change?
• In advance, having a group who will ‘champion’ this effort and see it through is vital. Thisgroup can also reach out to the experience team for advice.
Is there a means to capture similar process and outcome data on the new unit?
• It is a good idea to use the same process measures when adopting a change in a newunit. Data will show how effective the change is spreading and reinforce the process forthe next unit to be involved.

5-2
BUILDING THE EVIDENCE FOR CHANGE
In document 5-2 (Spread Planning Best Practices), a list of tips were provided to make sure you had the right people and tasks in place to begin successfully spreading your change. One tool that can often capture multiple audiences and documents all the tasks that need to be completed is a well thought out storyboard. These storyboards are often called “A3s” and have been adopted from best practice quality improvement strategies. These reason these are successful is because they include the following:
• A rationale for why change is needed• Data supporting how both the process and outcomes have improved with your
interventions• Clear expectations on what it takes to implement the process, including documented
small tests of change• Lessons learned and what can be improved in future spread/implementation• And perhaps most importantly, having everything on one piece of paper keeps the
information concise, but allows for those not involved to understand the new change andhave a thoughtful conversation
Below is a brief example to show a storyboard may look like that you could use to share with leadership or frontline staff to help build the evidence for change:

TOPIC:DATE:
Lessons LearnedLessons LearnedOutcome MeasureOutcome MeasureOpportunity/Root Opportunity/Root
Cause AnalysisCause Analysis
HOSPITAL:DATE:
1. Describe the key issues resulting in the performance gap or opportunity forimprovement.
Cause AnalysisCause AnalysisPlace Run Chart here 1. What will be done differently as a
result of this improvement process
Process MeasuresProcess MeasuresProcess MeasuresProcess Measures
Test CyclesTest Cycles1 Briefly describe tests and trails
Follow UpFollow Up
1. What are the next steps?
Place Run Chart here
2
3
p
5-2a
4

5-3
SPREAD PLANNING MATRIX
Once a new process is established and improvement is evident through data, it is time to spread the process to other areas of the hospital. In order to spread successfully, the following should be in place:
• The process has been stable (few changes or adaptations) for 2-3 months, and is adopted fully by the staff.• The process is documented as a work instruction, procedure and/or policy.• Experienced staff in the pilot unit are available to teach and mentor others on the process.• It is possible to measure implementation and the resulting outcome on the new unit or department
The matrix below is helpful to organize the effort to spread several processes across the hospital.
Process Description A Hourly rounding Pilot Unit: Med-Surg 4
Process Description B Safety Huddles Pilot Unit: ICU
Process Description C Pyxis “Quiet zone” Pilot Unit: OB
Process Description D VTE Prevention bundle Pilot Unit: Med-Surg 2
Unit/Dept. Mo June July August September October November
Med-Surg 2 D C B D
Cardiac 3 Go-Live C Note: CPOE A A
Med-Surg 4 A C Note: CPOE D

5-3a
SPREAD PLANNING MATRIX WORKSHEET
Team Lead: Initiative:
Process Description A Pilot Unit:
Process Description B Pilot Unit:
Process Description C Pilot Unit:
Process Description D Pilot Unit:
Month
Unit/Department
6-0
SECTION 6 – SUSTAINING EXCELLENT RESULTS
Careful planning for some level of ongoing measurement will help ensure
you are able to sustain your measured improvement. People become frustrated when good results are lost over time. Use the sustainability plan in this section to plan for monitoring key measures and building accountability into your system by identify when, who and what will happen if the measure is not performing at your desired level. There are also guidelines in this section about decreasing the frequency of certain measures and when it is appropriate to discontinue measures so that resources aren’t wasted.

6-0a
ROADMAP FOR SUSTAINING EXCELLENT RESULTS
Step 4. Integrate new process into new hire curriculum. New hires stepping into the middle of quality initiatives are unlikely to sustain quality improvements without training of vital information on processes.
Step 2. Schedule refresher training in advance. Refresher training ensures the maintenance and improvement of vital skills. High risk patient care processes should have frequent refreshers. (More than annual training)
Step 5. Perform leadership rounding. Leadership rounding provides an opportunity for review of the most current data, and to see sustained performance. Leaders doing rounds should meet to discuss what is going well and what needs to be addressed. Worksheet 6-3
Step 3. Collect and Share data. The data hospitals collect is most useful when it is available to frontline staff. Best Practices include: A. Critical process and outcome measures are updated no less than quarterly B. Data is displayed graphically over time, preferably in run charts that include benchmarks/goals for frontline staff C. Key outcome data is reviewed on a dashboard at a Quality Council or with another senior leader group
Also consider displaying data in common spaces, sharing it in meetings, emailing it or celebrating it through small events.
Step 1. Develop a Process Control Plan when the measure is acceptable for 6 months/or 6 data points of continued improvement. Worksheets 6-1 and 6-2 The process control plan includes: A list of key processes, process owners, frequency of data collection, and flags that trigger action when data is not acceptable or within control (such as 3 months of declining trend). Share the process control plan with the appropriate oversight committee or quality department

6-1
DEVELOP A PROCESS CONTROL PLAN
It is important to continue monitoring the process even after the improvement project is completed. If you don’t plan this carefully, the measures will be lost and it is highly likely that any improvement gained will be lost. This is where the Process Control Plan can be very helpful. This allows you not only to plan out what to continue to measure, but who will be responsible for taking action if the measure “backslides”.
Which measures are the most important measures to continue? • Outcome measure – especially those that indicate patient harm • Measures that are publicly reported and/or included in payment penalty or incentive
programs
How often should measures be collected? If the process is well established and the results are consistently at a high level of performance, you may be able to cut back how often the data is collected. Consider gradually cutting back by one time period – from monthly to quarterly; from quarterly to semi-annual, from semi-annual to annual spot checks. When can we stop measuring? If the measure is critical to patient safety or hospital operations, you may not be able to ever discontinue a measure. However, a good rule of thumb to ensure a new process is “locked in” is to keep measuring or consider decreasing the frequency of the measure until you have six consecutive data points that meet the established target.
Example: If you have a goal of 98% hand washing compliance, and have been collecting the data monthly, you would not switch to quarterly monitoring or stop monitoring this until you have six months in a row >98%. If you have five months >98%, and then slip to 92%, the six month count would start over.
Using the Process Control Plan Worksheet The worksheet provides spaces for the team to document the measures that need to be tracked, when action needs to be taken if the measure it not at goal, and who and what action will be taken to work to get the results back to or above goal.
List of Key Processes & Associated Measures
Process Owner
Frequency Data Needs to be Collected & Monitored
Level at Which Action is Required
SSI – Preadmission Skin Cleansing
Jane Smith Collected Monthly – Survey 10 Patients
3 Consecutive Months Less than 100%
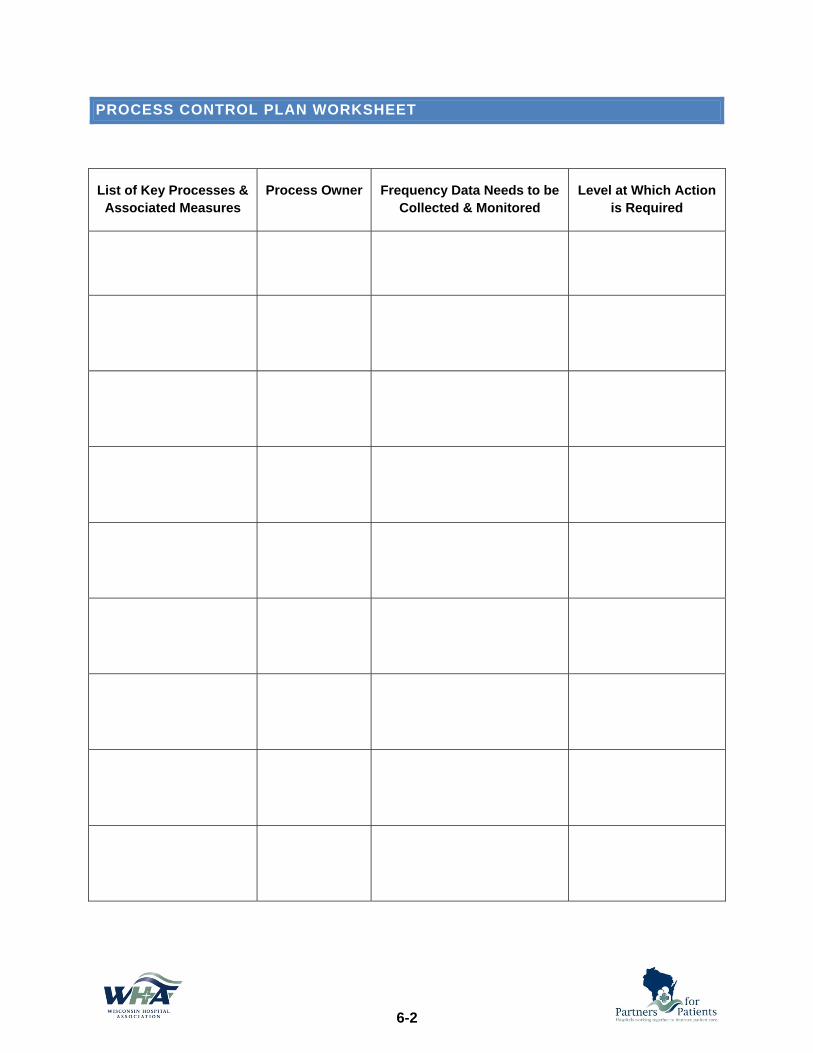
6-2
PROCESS CONTROL PLAN WORKSHEET
List of Key Processes & Associated Measures
Process Owner Frequency Data Needs to be Collected & Monitored
Level at Which Action is Required

6-3
BEST PRACTICES FOR LEADERSHIP ROUNDING One practice for ensuring improvement is sustained is to involve leaders in regular review of results. Leadership rounds are scheduled, structured activities in which executive, managers and even board members purposefully walk through their organizations talking to staff and patients. Leadership rounding is done because it provides a number of benefits:
• Trust and Credibility – demonstrate leaders are interested in the day-to-day processes and quality of care being performed.
• Communication – facilitates two-way communication between leaders and staff. Leaders can personally reinforce strategic messages.
• Process Improvement – leaders obtain first-hand knowledge and are better able to monitor, identify, and aid in making improvements.
• Recognition– Leaders come away with a renewed appreciation for the quality and commitment of their staff and spot “wins” that can be shared with others.
Rounds can be performed by leaders in any area of the organization and at any level of leadership. They can be done individually or by a group of executives. As a best practice, rounds should be a permanent and regularly-scheduled part of a leader’s daily routine. Below are some FAQs about rounding: Who should round? Any leader (such as executive, managerial, team leaders, etc.) at any level of the organization. It is particularly important for C-level executives because they can become the most isolated from the day-to-day activities in individual departments or at the point of service. How Often Should You Round? Frequency is less important than consistency when it comes to rounding. Rounding can happen daily, weekly or even monthly, depending on the purpose and level of the executive or manager. How Should You Round? To be effective, regardless of your plan, rounding needs to be positive and based on open and direct communication. It can’t be blame or fault-based. If you see something wrong or spot incorrect behavior, recognize what is being done correctly first, then correct in a positive manner. What Questions Should You Ask Staff? On the next page is list of questions that can be used to help get the conversation started and off on a positive note. Staff will often struggle at first to give you meaningful feedback. You need to be patient and persistent and assure them that you really want to know. They will often say “everything” or “nothing” – ask them to give you specific examples.

6-3
Example Questions: Here are some example questions that can aid in uncovering opportunities for improvement:
• What is going well today? / What is working well for you?
• Who may I thank for doing a great job? / Tell me a story of a co-worker or physician who
has done something you would definite as excellent for our patients.
• Are you aware of anything that may pose a safety risk to our patients or employees?
• Have you recognized or reported any good catches recently?
• What keeps you awake at night regarding patient safety? / What is one way we can
improve patient safety?
• Do you have the tools and equipment to do your job well?
• What training could we offer that would assist you in caring for your patients?
• Custom questions: Ask questions around current improvement efforts: How is the new
medication reconciliation process working? / What outcomes are you seeing with your
small tests of change around reducing falls?
• Is there anything I can be doing differently to support you? / I always want to improve
my leadership, can you tell me one thing I could be doing differently or better?
• Do you have any questions for senior leadership?
Finally, to make leadership rounding effective there needs to be follow through and
communication. Communicate with an employee during your next rounding with any results of
your follow up actions to their input or provide recognition for valuable feedback. Good follow
through builds trust and demonstrates to employees their input is valuable and contributing to
improving care.

A-0
APPENDIX A – ENGAGING OTHERS
About Engaging Others
Involving a cross-functional group of people can be both rewarding and challenging. Once an improvement project is launched, barriers can arise. Most often, these barriers are related to communication issues, the organizational culture, or interpersonal dynamics. Progress can be slowed if these are not addressed effectively.
Communication Strategies
If challenges with participation or buy-in arise, teams may wish to review their communication planning. Worksheets to examine the current state of communication around a change effort are provided.
Conducting a Culture Check-Up
A component of the Comprehensive Unit Based Safety Program, the Culture Check-Up Tool is effective for learning of barriers that may be impeding best practice adoption among staff.
Barrier Mitigation Tool
At times a “deep dive” may be necessary to better understand the cultural and interpersonal factors that impede standards of practice. The Barrier Mitigation Tools are a set of useful approaches to uncovering issues and taking steps to resolve them.

A-1
COMMUNICATION PLANNING
Keeping others in the loop is important to ensure they are aware of any changes made and are comfortable enough to “buy” into the changes. Your communication should use several different pathways:
This tool will help you identify the different audiences and how you might reach them:
Who should know? What do they need to know? How do we let them know?
Staff in the unit or department
Patients and families
Physicians
Leadership
Others?
Communication
8
different ways

A-2
HOW TO CONDUCT A CULTURE CHECK-UP
Problem Statement
Improving culture in a patient care area takes time. Guided culture conversations surface and address patient safety issues while respecting the wisdom and feedback of frontline caregivers.
What is Culture?
Simply put, culture is a consensus view of “the way we do things around here.” One person’s attitude is an opinion. Everyone’s attitude is a culture or climate. No matter what instrument you use to assess the patient safety or process improvement culture, your culture assessment results provide a snapshot of the various climates in your patient care area, including safety climate, teamwork climate, perceptions of management, working conditions, job satisfaction and stress recognition. Caregiver responses were grouped together to provide results for your patient care area.
Purpose of Tool
The purpose of this tool is to provide structure to a more actionable culture conversation using the specific survey items, from a unit’s assessment of patient safety culture, rather than the summary scores (e.g., safety climate.) You may also use an example of a specific process problem as the core of the conversation. Patient care areas that first assess culture before implementing an intervention use the feedback from frontline caregivers to identify potential barriers, as well as strengths that can be better utilized. Focusing the culture conversation on group-level data depersonalizes the discussion and fosters improvement in the context of the local realities of care delivery. This tool can be used to target a result for improvement shortly after the cultural issues (between survey administrations) and monitor the progress of culture change.
Who Should Use This Tool?
• Clinical departmental designee or improvement team lead • Patient care area managers • Hospital executives as part of executive partnerships or executive participants in the
program
How to Use This Tool?
This tool can be used to structure a series of meetings or a single meeting by using specific survey questions that are both diagnostic and related to clinical/operational outcomes to guide team discussion. Do not personalize the discussion; rather consider the framework a means for moving forward. Remember, attitudes reflect the norms, values and beliefs in the unit that make up the culture. This exercise will help you to better understand your culture and consider interventions in a context that facilitates improvement.
A-2
Copyright ©2007 The Quality and Safety Research Group Release 8.0, Revised 2/16/10.
Check-Up Process
1. Convene a representative group of frontline caregivers for a 30-60 minute discussion. This can be informal over lunch breaks or a formal agenda item for unit/departmental meetings. As a rule of thumb, five to seven caregivers of mostly mid-level seniority will facilitate a rich discussion.
2. Review the unit patient safety culture survey results and select an item where responses indicate a need for improvement. This can be an item where the average response is three or below or a domain score with less than 60% agreement. Alternately you may present a specific example of a process problem.
3. Assign a recorder to complete the Culture Item Discussion Form to document the issues that surface and suggested improvement actions.
4. Use active listening skills to guide participant feedback. This is not a meeting to rationalize or justify issues but rather a time to focus on identifying opportunities to improve local culture.
5. Conclude the meeting with agreement on making at least one change that could positively affect the cultural issue discussed and commit to revisit whether the change resulted in improvement.
Guiding the Discussion
Review your item-level results and consider discussing any item where scores indicate an opportunity for improvement. If you have trend data across years, you could choose an item that changed significantly. Choose an item from your results as the primary discussion starter during your culture check-up.
Survey item or issue for discussion:
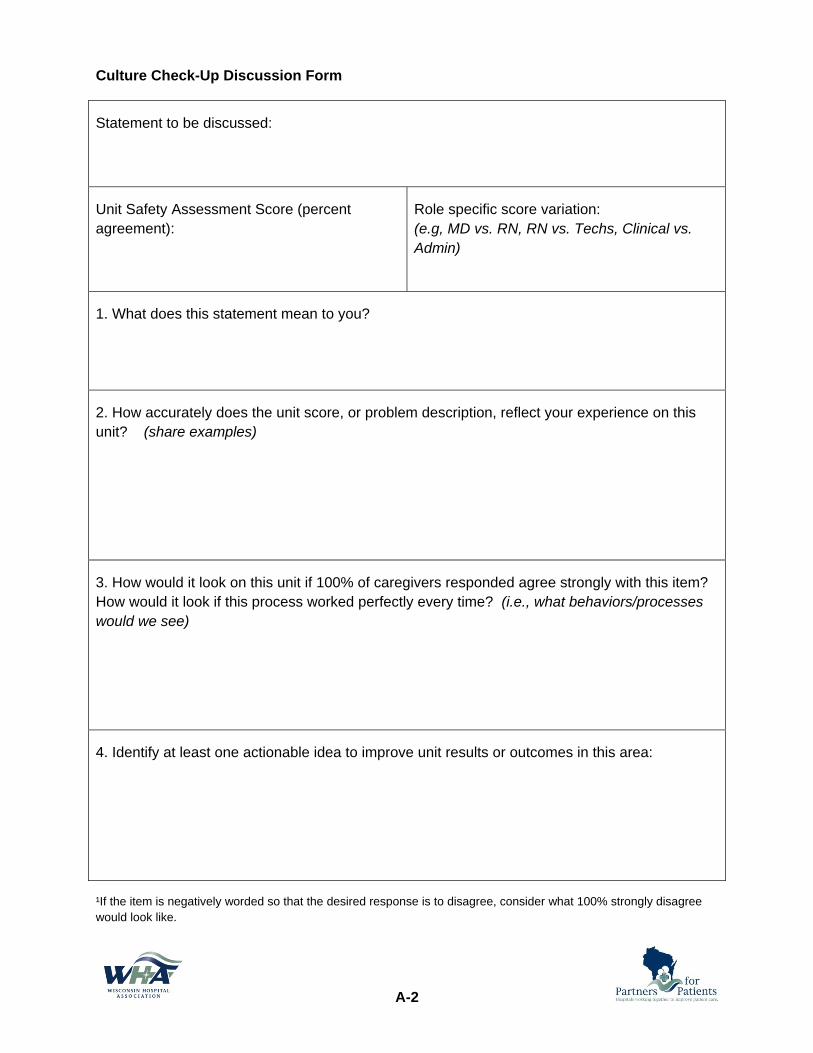
A-2
Culture Check-Up Discussion Form
Statement to be discussed:
Unit Safety Assessment Score (percent agreement):
Role specific score variation: (e.g, MD vs. RN, RN vs. Techs, Clinical vs. Admin)
1. What does this statement mean to you?
2. How accurately does the unit score, or problem description, reflect your experience on this unit? (share examples)
3. How would it look on this unit if 100% of caregivers responded agree strongly with this item? How would it look if this process worked perfectly every time? (i.e., what behaviors/processes would we see)
4. Identify at least one actionable idea to improve unit results or outcomes in this area:
¹If the item is negatively worded so that the desired response is to disagree, consider what 100% strongly disagree would look like.

A-3
BARRIER MITIGATION PROCESS
Problem Statement: Having a consistent process, procedure and guidelines may significantly improve patient safety. However, adherence to these evidence-based guidelines remains highly variable both within and between units, hospitals and states. Tools to identify factors which hinder guideline adherence (i.e. barriers) and approaches to mitigating these barriers within individual clinical units are also lacking.
Purpose of Tool: Since particular barriers and the corresponding solutions may differ between individual clinical units, this tool was designed to help frontline staffs systematically identify and prioritize barriers to guideline or intervention adherence within their own care setting. This tool also provides a framework for developing an action plan targeting at eliminating or mitigating the effects of the identified barriers.
Who Should Use This Tool? Both frontline clinicians (e.g., physicians and nurses) and non-clinicians (e.g., unit administrator, unit support staff, hospital quality officer) within the care setting being targeted by a particular quality improvement initiative should use this tool. Frequently, team members are a subcommittee of the unit’s quality improvement team.
How to Use This Tool: This document summarizes the three step process and provides more detailed explanations and sample forms for each step.
Step 1: Assemble the Team and Identify Barriers
Compose a diverse team from the department or unit where the care takes place. Several different team members should work independently to identify and record barriers to guideline adherence in the targeted clinical area. They should do this by way of observing the process being impacted by the guideline, asking about this process and actually walking through a simulation of the process or, if appropriate, real clinical practice.
Step 2: Compile and Summarize the Barrier Information
Upon completion of all data collection, an assigned team member should compile all of the barrier data recorded by the several investigators. This team member should then summarize this information and record any suggestions provided by observers to improve adherence.
Step 3: Develop an Action Plan for Each Targeted Barrier
The team should review all suggested actions to eliminate/mitigate the selected high priority barriers, and prioritize these for action. Next, individual actions should be determined for the next improvement cycle, and launch the improvement work.
© 2009 The Johns Hopkins Quality & Safety Research Group Version: 05152009.

A-4
BARRIER MITIGATION – IDENTIFY BARRIERS
Identify Barriers
Several team members should work independently to identify barriers to consistent guideline/process adherence in the targeted clinical area. Utilizing different modes of data collection facilitates obtaining an accurate and complete picture of the factors influencing guideline/process adherence. Observe:
• Observe a few clinicians engaged in the tasks related to the guideline/process. • Remember that your role is to observe – so cause as little distraction as possible. • Focus more on observing than documentation during the observation period. Jotting
a few notes is okay, but wait to complete the Barrier Identification form until immediately following the observation period.
• Along with recording the barriers to achieving consistent adherence to the guideline/process that were witnessed, indicate any steps in the process that were skipped and workarounds (i.e., improvised process steps or factors that facilitated guideline/process adherence.)
Discuss: • Ask various staff members about the factors influencing guideline/process
adherence. • This may include informal discussions, interviews, focus groups and brief surveys. • Assure the confidentiality of staff responses. • Also ask staff about the problems they face and any ideas they have regarding
potential solutions for improving guideline/process adherence: o Are the staff aware that the guideline/process exists? o Do the staff believe that the guideline/process is appropriate for their patients? o Do the staff have any suggestions to improve guideline/process adherence?
Walk the Process:
• Consciously follow the guideline/process during a simulation, or if appropriate, during real clinical practice.
• Reviewers should continue collecting data until no new barriers are identified upon new data collection and a comprehensive understanding of good practices and barriers to guideline/process adherence is achieved. This process should take approximately three to six hours.
The reviewers should record all potential reasons that clinicians were experiencing difficulties with adhering to the guideline/process (i.e., guideline/process barriers) and factors encouraging guideline/process adherence (i.e., guideline/process facilitators) in the form. Additionally, within the observation form, reviewers should indicate the method of data collection (e.g., observation, survey, focus, group, informal discussion, interview or walking the process), the associate who collected the data and the clinical unit from which the data was collected. © 2009 The Johns Hopkins Quality & Safety Research Group Version: 05152009.

A-4a
Barrier Identification Form: Identify barriers to process, procedure or guideline/process adherence by observing, asking about and walking the process.
Process:
Method: Observer: Unit:
Factors Barrier(s) Potential Actions
PROVIDER
Knowledge of the process: What are the elements of the process, procedure or guideline/process?
Attitude: What do you think about the process, procedure or guideline/process?
Current practice habits: What do you currently do (or not do?)
Perceived process adherence: How often do you do everything right?
GUIDELINE/PROCESS
Evidence supporting the process: How does adherence affect the workload?
Applicability to unit patients: Does this apply to the unit’s patients?
Ease of complying with process: How does adherence affect the workload?

A-4a
SYSTEM
Task: Who is responsible for following the guideline/process?
Tools & technologies: What supplies and equipment are available/used?
Decision support: How often are aids available and used?
Physical environment: How does the unit layout affect adherence?
Organizational structure: How does the organizational structure (e.g., staffing affect adherence?)
Administrative support: How does the administration affect adherence?
Performance monitoring/feedback: How does the unit know it is following the guideline/process?
Unit culture: How does the unit culture affect adherence?
Other:
A-5
BARRIER MITIGATION - ACTION PLANNING
Develop an Action Plan for Each Targeted Barrier
As a team, list and review the potential actions to eliminate/mitigate the selected high priority barriers in the Framework for the Development of an Action Plan as suggested by the observers in Step 2. Next identify any additional potential actions using brainstorming techniques and record these in the Framework for the Development of an Action Plan as well.
Next, collectively select individual actions for the next improvement cycle based on the potential impact of each action on the barrier as far as improving guideline adherence (if the action is successfully implemented) and the feasibility of effectively implementing the action based on the resources currently available.
It is critical to closely examine the feasibility of implementing an action. For example, placing a sink within each patient’s room may increase the frequency of clinicians washing their hands, but may not be as cost effective as placing a dispenser for hand sanitizer within each patient’s room. For each action, the group should assign an appropriate leader, performance measures and follow-up dates to evaluate progress.
This information should be recorded in the Framework for the Development of an Action Plan as well.
© 2009 The Johns Hopkins Quality & Safety Research Group Version: 05152009.
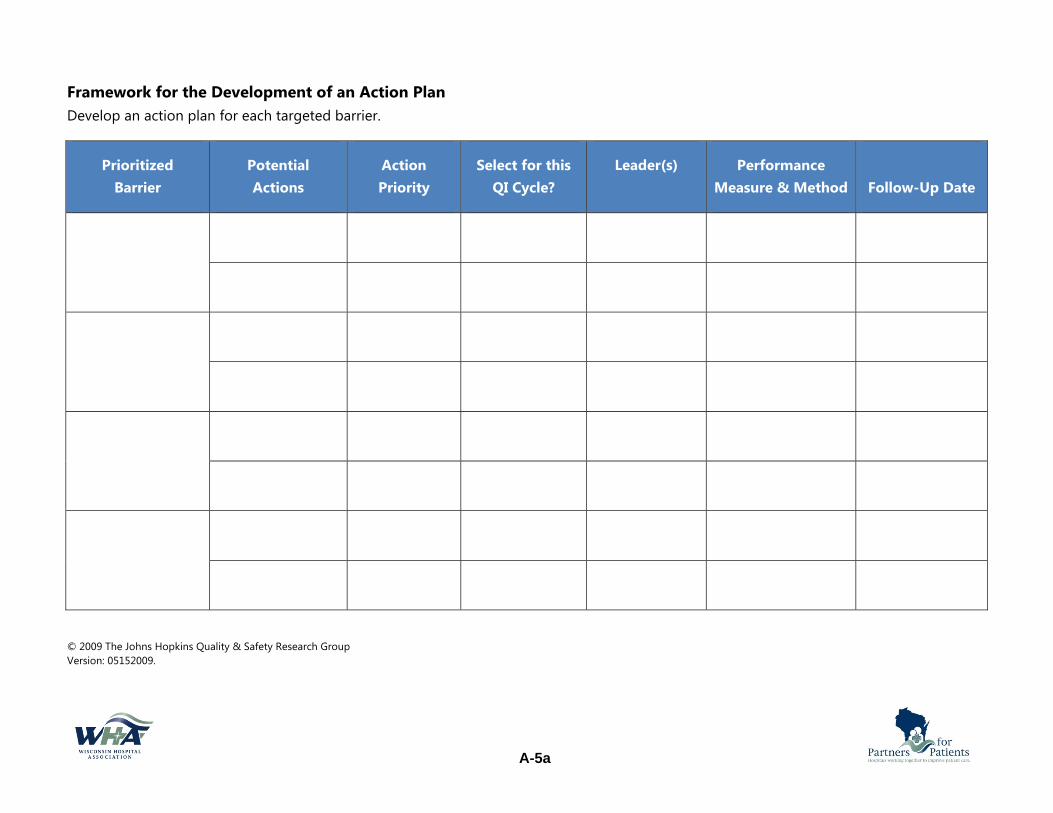
A-5a
Framework for the Development of an Action Plan Develop an action plan for each targeted barrier.
Prioritized Barrier
Potential Actions
Action Priority
Select for this QI Cycle?
Leader(s) Performance Measure & Method
Follow-Up Date
© 2009 The Johns Hopkins Quality & Safety Research Group Version: 05152009.

REFERENCES
Publications
The Improvement Guide: A Practical Approach to Enhancing Organizational Performance – Gerald Langley, Ronald Moen, Kevin Nolan, Thomas Nolan, Clifford Norman, Lloyd P. Provost. Jossey-Bass; 2nd edition
Facilitator's Guide to Participatory Decision-Making / Edition 2 BY SAM KANER, CATHERINE TOLDI, DUANE BERGER, LENNY LIND, SARAH FISK. Jossey-Bass Business and Management Ser. 2007
Websites
Johns Hopkins Center for Innovation in Quality Patient Care - CUSP http://www.hopkinsmedicine.org/innovation_quality_patient_care/areas_expertise/improve_patient_safety/cusp/
Institute for Healthcare Improvement http://www.ihi.org/
Hospital Research and Education Trust http://www.hret.org/
Acknowledgement
Additional content was provided through the creative collaboration of the WHA Quality Improvement staff:
Kelly Court Travis Dollak Jill Hanson Tom Kaster Jana Klinge Stephanie Sobczak
For copies of this improvement workbook, contact the WHA Quality Staff by calling 608-274-1820.


