Embed Size (px)
Citation preview

Expert Systems with Applications 38 (2011) 15122–15133
Contents lists available at ScienceDirect
Expert Systems with Applications
journal homepage: www.elsevier .com/locate /eswa
Improvement of new automatic differential fuzzy clustering using SVM classifierfor microarray analysis
Indrajit Saha a,⇑, Ujjwal Maulik b, Sanghamitra Bandyopadhyay c, Dariusz Plewczynski a
a Interdisciplinary Centre for Mathematical and Computational Modeling (ICM), University of Warsaw, 02-106 Warsaw, Polandb Department of Computer Science and Engineering, Jadavpur University, Kolkata 700 032, West Bengal, Indiac The Machine Intelligence Unit, Indian Statistical Institute, Kolkata 700 108, West Bengal, India
a r t i c l e i n f o a b s t r a c t
Keywords:Differential evolutionFuzzy clusteringGenetic algorithmSupport vector machineBiological significance test
0957-4174/$ - see front matter � 2011 Elsevier Ltd. Adoi:10.1016/j.eswa.2011.05.094
⇑ Corresponding author.E-mail addresses: [email protected] (I. Saha), d
Maulik), [email protected] (S. Bandyopadhyay), dzynski).
In recent year, the problem of clustering in microarray data has been gaining significant attention. How-ever most of the clustering methods attempt to find the group of genes where the number of cluster isknown a priori. This fact motivated us to develop a new real-coded improved differential evolution basedautomatic fuzzy clustering algorithm which automatically evolves the number of clusters as well as theproper partitioning of a gene expression data set. To improve the result further, the clustering method isintegrated with a support vector machine, a well-known technique for supervised learning. A fraction ofthe gene expression data points selected from different clusters based on their proximity to the respec-tive centers, is used for training the SVM. The clustering assignments of the remaining gene expressiondata points are thereafter determined using the trained classifier. The performance of the proposed clus-tering technique has been demonstrated on five gene expression data sets by comparing it with the dif-ferential evolution based automatic fuzzy clustering, variable length genetic algorithm based fuzzyclustering and well known Fuzzy C-Means algorithm. Statistical significance test has been carried outto establish the statistical superiority of the proposed clustering approach. Biological significance testhas also been carried out using a web based gene annotation tool to show that the proposed methodis able to produce biologically relevant clusters of genes. The processed data sets and the matlab versionof the software are available at http://bio.icm.edu.pl/�darman/IDEAFC-SVM/.
� 2011 Elsevier Ltd. All rights reserved.
1. Introduction
The advent of microarray technologies have now made it possi-ble to have a global and simultaneous view of the expression levelsfor many thousands of genes over different time points during dif-ferent biological processes (Sharan, Maron-Katz, & Shamir, 2003).Microarray technology has applications in the areas of medicaldiagnosis, bio-medicine, gene expression profiling, etc. (Alizadehet al., 2000; Bandyopadhyay, Maulik, & Wang, 2007; Eisen, Spell-man, Brown, & Botstein, 1998; Lockhart & Winzeler, 2000). Usually,the gene expression values during a biological experiment aremeasured at different time points. Clustering (Everitt, 1993;Hartigan, 1975; Jain & Dubes, 1988; Maulik & Bandyopadhyay,2002), an important microarray analysis tool, is used to identify thesets of genes with similar expression profiles. Clustering methodspartition the input space into K regions depending on somesimilarity/dissimilarity metric where the value of K may or may
ll rights reserved.
[email protected] ([email protected] (D. Plewc-
not be known a priori. The main objective of any clusteringtechnique is to produce a K � n partition matrix U(X) of the givendata set X, consisting of n patterns, X = {x1,x2, . . . ,xn}. The partitionmatrix may be represented as U = [uk,j], k = 1,2, . . . ,K andj = 1,2, . . . ,n, where uk,j is the membership of pattern xj to the kthcluster. For fuzzy clustering of the data, 0 6 uk,j 6 1, i.e. uk,j denotesthe degree of belongingness of pattern xj to the kth cluster.
Determining the appropriate number of clusters from a givenmicroarray data set is an important consideration in clustering.For this purpose, and also to validate the obtained partitioning,cluster validity indices like Xie and Beni (1991), I (Maulik &Bandyopadhyay, 2002), Silhouette index (Rousseeuw, 1987) havebeen proposed in the literature. The measure of validity of the clus-ters should be such that it will be able to impose an ordering of theclusters in terms of its goodness. The classical approach of determin-ing the number of clusters is to apply a given clustering algorithm fora range of K values and to evaluate a certain validity function of theresulting partitioning in each case (Bandyopadhyay & Maulik, 2001;Bezdek, 1981; Bras Silva, Brito, & Pinto da Costa, 2006; Chou, Su, &Lai, 2004; Gath & Geva, 1989; Kim & Ramakrishna, 2005;Krishnapuram & Freg, 1992; Maulik & Bandyopadhyay, 2002; Wang& Zhang, 2007). The partitioning exhibiting the optimal validity is

Fig. 1. Gene expression matrix.
I. Saha et al. / Expert Systems with Applications 38 (2011) 15122–15133 15123
chosen as the true partitioning. This method for searching an opti-mal number of clusters depend on the selected clustering algorithm,whose performance may depend on the initial cluster centers.
In 1995 a new floating point encoded evolutionary algorithmfor global optimization, called differential evolution (DE) (Storn &Price, 1995, 1997; Price, Storn, & Lampinen, 2005) was proposed.differential evolution uses a special kind of differential operator,and recently, it has been applied in different fields of engineeringand science (Omran, Engelbrecht, & Salman, 2005; Maulik & Saha,2009; Maulik, Bandyopadhyay, & Saha, 2009). However, in all thecases the number of clusters is known a priori. This fact motivatedus to provide a new version of DE algorithm called improved differ-ential evolution (IDE), which is faster than DE. Thereafter it hasbeen extended in the frame work of fuzzy clustering where num-ber of clusters has been identified automatically. The improvedvariant of differential evolution differs from the classical differen-tial evolution in the process of mutation. While doing the mutationit uses three vectors, one representing the local best and the otherthe global best which are adaptive in nature and third one is se-lected randomly. The objective of this paper is twofold. First, itaims at the automatic determination of the optimal number ofclusters using improved differential evolution based automaticfuzzy clustering (IDEAFC). Second, to improve the result further,the clustering method is integrated with a support vector machine(Burges, 1998) based on proximity of the data point to the respec-tive cluster centers.
The performance of the improved differential evolution basedautomatic fuzzy clustering followed by SVM classiffication(IDEAFC-SVM) has been demonstrated on five real-life geneexpression data sets, viz., Yeast Sporulation, Yeast Cell Cycle,Arabidopsis Thaliana, Human Fibroblasts Serum and Rat CNS data.The superiority of the proposed technique, as compared to differ-ential evolution based automatic fuzzy clustering, variable lengthgenetic algorithm (Bandyopadhyay & Pal, 2001) based fuzzy clus-tering (VGAFC) (Maulik & Bandyopadhyay, 2003) and well knownFCM (Bandyopadhyay, 2005; Bezdek, 1981; Pal & Bezdek, 1995),is demonstrated both quantitatively and visually. The superiorityof the IDEAFC clustering technique has been proved to be statisti-cally significant through statistical tests. Finally a biological signif-icance test has been conducted to establish that the proposedtechnique produces functionally enriched clusters.
The rest of the article is organized as follows: the next sectiondiscusses the structure of a microarray dataset. In Section 3 de-scribes some well known clustering algorithms along with somecluster validity indices. Section 4 describes the proposed improveddifferential evolution based fuzzy clustering technique. Section 5presents the experimental results conducted on five publicly avail-able benchmark microarray data sets with Wilcoxons rank sumtest. Section 6 describes the Integrating fuzzy clustering techniquewith SVM classifier along with experimental results. Section 7 pre-sents biological significance test. Finally Section 8 concludes thearticle.
2. Structure of microarray data
A microarray is a small chip onto which a large number of DNAmolecules (probes) are attached in fixed grids. The chip is made ofchemically coated glass, nylon, membrane or silicon. Each grid cellof a microarray chip corresponds to a DNA sequence. For cDNAmicroarray experiment, the first step is to extract RNA from a tis-sue sample and amplification of RNA. Thereafter two mRNA sam-ples are reverse-transcribed into cDNA (targets) labelled usingdifferent fluorescent dyes (red-fluorescent dye Cy5 and green-fluorescent dye Cy3). Due to the complementary nature of the
base-pairs, the cDNA binds to the specific oligonucleotides on thearray. In the subsequent stage, the dye is excited by a laser so thatthe amount of cDNA can be quantified by measuring the fluores-cence intensities (Domany, 2003; Eisen et al., 1998). The log ratioof two intensities of each dye is used as the gene expressionprofiles
gene expression level ¼ log2IntensityðCy5ÞIntensityðCy3Þ ð1Þ
A microarray experiment typically measures the expression levelsof large number of genes across different experimental conditionsor time points. A microarray gene expression data consisting of ngenes and m conditions can expressed as a real valued n �m matrixM = [gij], i = 1,2, . . . ,n, j = 1,2, . . . ,m. Here each element gij representsthe expression level of the ith gene at the jth experimental condi-tion or time point (Fig. 1).
The raw gene expression data may contain noise and also suf-fers from some variations arising from biological experimentsand missing values. Hence before applying any clustering algo-rithm, some preprocessing of the data is required. Two widely usedpreprocessing techniques are missing value estimation and nor-malization. Normalization is a statistical tool for transforming datainto a format that can be used for meaningful cluster analysis (Kim,Lee, & Bae, 2006; Shannon, Culverhouse, & Duncan, 2003). Amongvarious kinds of normalization techniques, the most used is the oneby which each row of the matrix M is standardized to have mean 0and variance 1.
3. Clustering algorithms and validity measure
This section describes some well known clustering methods andcluster validity measures.
3.1. Clustering algorithms
3.1.1. Fuzzy C-meansFuzzy C-means (FCM) (Bandyopadhyay, 2005; Bezdek, 1981) is
a widely used technique that uses the principles of fuzzy sets toevolve a partition matrix U(X) while minimizing the measure
Jm ¼Xn
j¼1
XK
k¼1
umk;jD
2ðzk; xjÞ; 1 6 m 61 ð2Þ
where n is the number of gene, K represents number of clusters, u isthe fuzzy membership matrix (partition matrix) and m denotes thefuzzy exponent. Here xj is the jth gene and zk is the centre of kthcluster, and D(zk,xj) denotes the distance of gene xj from the centreof the kth cluster.
FCM algorithm starts with random initial K cluster centers, andthen at every iteration it finds the fuzzy membership of each geneto every cluster using the following equation

15124 I. Saha et al. / Expert Systems with Applications 38 (2011) 15122–15133
uk;i ¼1
Dðzk ;xiÞ
� � 1m�1
PKj¼1
1Dðzj ;xiÞ
� � 1m�1
; for 1 6 k 6 K; 1 6 i 6 n ð3Þ
for 1 6 k 6 K; 1 6 i 6 n, where D(zk,xi) and D(zj,xi) are the distancesbetween xi and zk, and xi and zj respectively. The value of m, the fuz-zy exponent, is taken as 2. Note that while computing uk,i using Eq.(3), if D(zj,xi) is equal to zero for some j, then uk,i is set to zero for allk = 1, . . . ,K, k – j, while uk,i is set equal to one. Based on the member-ship values, the cluster centers are recomputed using the followingequation
zk ¼Pn
i¼1umk;ixiPn
i¼1umk;i
; 1 6 k 6 K ð4Þ
The algorithm terminates when there is no further change in thecluster centers. Finally, each gene is assigned to the cluster to whichit has maximum membership. The main disadvantages of the FuzzyC-means clustering algorithms are (1) it depends much on the ini-tial choice of the centre and (2) it often gets trapped into some localoptimum.
3.2. Variable length genetic algorithm based fuzzy clustering
A variable length GA based fuzzy clustering (VGAFC) techniquehas been proposed in Maulik and Bandyopadhyay (2003), wherereal valued encoding of cluster centers is used. The algorithm auto-matically evolves the number of clusters as well as the partitioningand minimizes the Xie–Beni (XB) Xie and Beni (1991) cluster valid-ity index. Let {z1,z2, . . . ,zK} be the set of K cluster centers encoded ina chromosome. The XB index is defined as a function of the ratio ofthe total variation r to the minimum separation sep of the clusters.Here r and sep can be written as
rðU; Z; XÞ ¼XK
k¼1
Xn
j¼1
u2k;jD
2ðzk; xjÞ ð5Þ
and
sepðZÞ ¼ mink–ikzk � zik2 ð6Þ
where k�k is the euclidean distance norm, and D(zk,xj), as mentionedearlier, is the distance between the pattern xk and the cluster centrezi. The XB index is then written as
XBðU; Z; XÞ ¼ rðU; Z; XÞn� sepðZÞ ð7Þ
Note that when the partitioning is compact and good, value r ofshould be low while sep should be high, thereby yielding lower val-ues of the Xie–Beni (XB) index. The objective is therefore to mini-mize the XB index for achieving proper clustering. Since thenumber of clusters is considered to be variable, the chromosomelengths of different chromosomes in the same population areallowed to vary (Maulik & Bandyopadhyay, 2003). Elitism is incor-porated in order to keep track of the best chromosome obtainedso far.
3.3. Cluster validity indices
3.3.1. I indexA cluster validity index I , proposed in Maulik and
Bandyopadhyay (2002) is defined as follows:
IðKÞ ¼ 1K� E1
EK� DK
� �p
ð8Þ
where K is the number of clusters. Here,
EK ¼XK
k¼1
Xn
i¼1
uk;ikzk � xik ð9Þ
and
DK ¼ maxk–jkzk � zjk ð10Þ
The index I is a composition of three factors, namely, 1K ; E1
EKand DK.
The first factor will try to reduce index I as K is increased. The sec-ond factor consists of the ratio of E1, which is constant for a givenmicroarray data set, to EK, which decreases with increase in K. Tocompute E1 the value of K in Eq. (9) is taken as one, i.e.; all thegenes are considered to be in the same cluster. Hence, becauseof this term, index I increases as EK decreases. This, in turn, indi-cates that formation of more number of clusters, which are com-pact in nature, would be encouraged. Finally, the third factor, DK
(which measures the maximum separation between two clustersover all possible pairs of clusters), will increase with the value ofK. However, note that this value is upper bounded by the maxi-mum separation between two genes in the gene expression dataset. Thus, the three factors are found to compete with and balanceeach other critically. The power p is used to control the contrastbetween the different cluster configurations. In this article, wehave taken p = 2.
3.3.2. Silhouette indexSilhouette index (Rousseeuw, 1987) is a cluster validity index
that is used to judge the quality of any clustering solution C. Sup-pose a represents the average distance of a gene from the othergenes of the cluster to which the gene is assigned, and b representsthe minimum of the average distances of the gene from the genesof the other clusters. Now the silhouette width s of the gene isdefined as:
s ¼ b� amax a; bf g ð11Þ
Silhouette index s(C) is the average Silhouette width of all the genesand it reflects the compactness and separation of clusters. The valueof Silhouette index varies from �1 to 1 and higher value indicatesbetter clustering result.
4. Proposed DE based automatic fuzzy clustering
4.1. Classical DE algorithm
Differential evolution is a relatively recent heuristic designed tooptimize problems over continuous domains. In DE, each decisionvariable is represented in the vector by a real number. As in anyother evolutionary algorithm, the initial population of DE is gener-ated randomly, and then evaluated. The kth individual vector of thepopulation at time-step (generation) t has l components, i.e.,
Gk;lðtÞ ¼ ½Gk;1ðtÞ;Gk;2ðtÞ; . . . ;Gk;lðtÞ� ð12Þ
For each target vector Gk(t) that belongs to the current population,three randomly selected vectors from the current population isused. In other words the dth component of each trial offspring isgenerated as follows
#k;lðt þ 1Þ ¼ Gi;lðtÞ þ FðGn;lðtÞ � Gm;lðtÞÞ ð13Þ
In order to increase the diversity of the perturbed parameter vec-tors, crossover is introduced. To this end, the trial vector:
Uk;lðt þ 1Þ ¼ ½Uk;1ðt þ 1Þ;Uk;2ðt þ 1Þ; . . . ;Uk;lðt þ 1Þ� ð14Þ

Fig. 2. Vector encoding scheme in the proposed method. A total of six cluster centers have been encoded for a gene expression data set. Only the activated cluster centershave been shown as circles.
I. Saha et al. / Expert Systems with Applications 38 (2011) 15122–15133 15125
is formed, where
Ujk;lðt þ 1Þ ¼
#jk;lðt þ 1Þif randjð0;1Þ 6 CR or j ¼ randðkÞ
Gk;lðtÞif randjð0;1Þ > CR and j – randðkÞ
8>>><>>>:
ð15Þ
In Eq. (15), randj(0,1) is the jth evaluation of a uniform randomnumber generator with outcome 2 [0,1]. CR is the crossoverrate 2 [0,1] which has to be determined by the user. rand(k) is arandomly chosen index 2 {1,2, . . . ,d} which ensures that Uk,l(t + 1)gets at least one parameter from #k,l(t + 1). To decide whether ornot it should become a member of generation G + 1, the trial vectorUk,l(t + 1) is compared to the target vector Gk,l(t) using the greedycriterion. If vector Uk,l(t + 1) yields a smaller cost function valuethan Gk,l(t), then Uk,l(t + 1) is set to Gk,l(t); otherwise, the old valueGk,l(t) is retained. The processes of mutation, crossover and selectionare executed for a fixed number of iterations. The best vector seenup to the last generation provides the solution to the clusteringproblem.
4.2. Improved differential evolution
In improved differential evolution (IDE) an approach has beenintroduced during mutation to push the trial vector quicklytowards the global optima. The crossover and selection are sameas original DE. In the mutation process, that deals with three vec-tors, two of them represent the global best (GBest) and local best(LBest) respectively. In each generation a (alpha) is computed as
11þexpð�ð1=generationÞÞ and uses as a mutation factor as in Eq. (16). Notethat as number of generations increases the value of a decreasesin the range between [1,0.5]. In impMutation at initial stage LBest(best vector in current population) has more contribution forevolving the mutant vector than in the later stage. As the contribu-tion of LBest for the mutant vector decreases with generation, con-tribution of GBest (best vector evaluated till the currentgeneration) increases. Fig. 3 describes the different steps of IDEalgorithm
#i;lðt þ 1Þ ¼ GGBest;lðtÞ þ aðGLBest;lðtÞ � Gj;lðtÞÞ ð16Þ
4.3. Vector and masker representation for automatic clustering
In the proposed method, for n genes, in d time points, and for auser-specified maximum number of clusters Kmax, a vector is repre-sented as a real numbers of dimension l = Kmax � d whereas maskerhas Kmax entries of binary numbers 0 and 1, each of which controlswhether the corresponding cluster is to be activated (i.e., to bereally used for classifying the gene expression data) or not. Notethat the number of maskers used is same as the size of the popu-
lation. In each generation masker is updated with random binaryvalues except the best one of the previous generation. Fig. 2 showa vector that contains six cluster centers in three dimensionalspace and a randomly generated masker of size same as the num-ber of cluster centers. The activated centers have circled in Fig. 2where the value of the corresponding masker cell is 1. Rest of thecenters in that vector are not participated during fuzzy clustering.
4.4. Fitness function
Once the encoded centers of the vectors are activated by themasker, the activated centers are goes under the process of fitnessfunction. Let {z1,z2, . . . ,zK} be the set of activated K cluster centersencoded in a vector. The XB index (Xie & Beni, 1991) is definedas a function of the ratio of the total variation r to the minimumseparation sep of the clusters. Here r and sep can be written as
rðU; Z; XÞ ¼XK
k¼1
Xn
j¼1
u2k;jD
2ðzk; xjÞ; ð17Þ
and
sepðZÞ ¼ mink–ikzk � zik2; ð18Þ
where k�k is the euclidean distance norm, and D(zk,xj), as mentionedearlier, is the distance between the pattern xk and the cluster centrezi. The XB index is then written as
XBðU; Z; XÞ ¼ rðU; Z; XÞn� sepðZÞ ð19Þ
Note that when the partitioning is compact and good, value r ofshould be low while sep should be high, thereby yielding lower val-ues of the Xie-Beni (XB) index. The objective is therefore to mini-mize the XB index for achieving proper clustering. Accordingly ineach generation the fitness of the vectors are computed. Fig. 3describe the different steps of IDEAFC algorithm. Note that if thenumber of activated point contain in a masker is less than two itis reinitialized.
5. Experimental results
In order to establish the effectiveness of the proposed DEAFCand IDEAFC algorithms, their performance is compared with a var-iable length genetic algorithm and an iterated version of the FCM isused in terms of cluster validity indices (Bezdek & Pal, 1998) likeXB (Xie & Beni, 1991), I (Maulik & Bandyopadhyay, 2002) andSilhouette index s(C) (Rousseeuw, 1987). FCM is a widely used par-titioned clustering algorithm. The objective of FCM technique is touse the principles of fuzzy sets to evolve a partition matrix U(X)while minimizing the Jm index. It is known that FCM algorithmsometimes gets stuck at some suboptimal solution (Groll & Jakel,

Fig. 3. Algorithm of IDEAFC.
15126 I. Saha et al. / Expert Systems with Applications 38 (2011) 15122–15133
2005). In the iterated FCM (IFCM), the FCM algorithm is run for dif-ferent values of K starting from 2 to
ffiffiffinp
, n being the number of geneexpression data points. For each K, it is executed 50 times and therun giving the best Jm value is taken. Among these best solutionsfor different K values, the solution producing the minimum XBindex value is chosen as the best partitioning. The VGAFC algo-rithm is implemented in the same way as in Maulik and Bandyo-padhyay (2003) which also try to find the number of clustersautomatically. Moreover, to investigate the effects of the changesmade in the classical DE algorithm, we have compared the IDEAFCwith an classical DE-based automatic fuzzy clustering (DEAFC)method, which uses the same vector representation scheme andfitness function as the IDEAFC.
5.1. Gene expression data sets
Five real life gene expression data sets namely, Yeast Sporula-tion, Yeast Cell Cycle, A. Thaliana, Human Fibroblasts Serum andRat CNS are considered for experiment.
5.1.1. Yeast SporulationThis data set (Chu et al., 1998) consists of 6118 genes measured
across 7 time points (0, 0.5, 2, 5, 7, 9 and 11.5 h) during thesporulation process of budding yeast. The data are then log-transformed. The Sporulation data set is publicly available atthe website http://www.cmgm.stanford.edu/pbrown/sporulation.Among the 6118 genes, the genes whose expression levels didnot change significantly during the harvesting have been ignoredfrom further analysis. This is determined with a threshold levelof 1.6 for the root mean squares of the log2-transformed ratios.The resulting set consists of 474 genes.
5.1.2. Yeast Cell CycleThe Yeast Cell Cycle data set was extracted from a dataset that
shows the fluctuation of expression levels of approximately 6000genes over two cell cycles (17 time points). Out of these 6000
genes, 384 genes have been selected to be cell-cycle regulated(Cho et al., 1998). This data set is publicly available at the followingwebsite: http://www.faculty.washington.edu/kayee/cluster.
5.1.3. A. ThalianaThis data set consists of expression levels of 138 genes of
A. Thaliana. It contains expression levels of the genes over 8 timepoints viz., 15 min, 30 min, 60 min, 90 min, 3 h, 6 h, 9 h, and 24 h(Reymonda, Webera, Damonda, & Farmera, 2000). It is availableat http://www.homes.esat.kuleuven.be/thijs/Work/Clustering.html.
5.1.4. Human Fibroblasts SerumThis data set (Iyer et al., 1999) contains the expression levels of
8613 human genes. The data set has 13 dimensions correspondingto 12 time points (0, 0.25, 0.5, 1, 2, 4, 6, 8, 12, 16, 20 and 24 h) andone unsynchronized sample. A subset of 517 genes whose expres-sion levels changed substantially across the time points have beenchosen. The data is then log2-transformed. This data set can bedownloaded from http://www.sciencemag.org/feature/data/984559.shl.
5.1.5. Rat CNSThe Rat CNS data set has been obtained by reverse transcrip-
tion-coupled PCR to examine the expression levels of a set of 112genes during rat central nervous system development over 9 timepoints (Wen et al., 1998). This data set is available at http://www.faculty.washington.edu/kayee/cluster. All the data sets arenormalized so that each row has mean 0 and variance 1.
5.2. Performance metrics
For evaluating the performance of the clustering algorithms, XB(Xie & Beni, 1991), I (Maulik & Bandyopadhyay, 2002) and Silhou-ette index s(C) (Rousseeuw, 1987) are used for five real life gene

Table 2Average XB, I and s(C) indices values over 50 runs of different algorithms for the fivegene expression data sets.
Data sets Algorithms XB I s(C)
Yeast Sporulation IDEAFC 0.2842 1.6688 0.6053DEAFC 0.3603 1.0715 0.5331VGAFC 0.4714 0.6251 0.4417IFCM 0.6027 0.2073 0.3184
Yeast Cell Cycle IDEAFC 0.8252 2.6442 0.4340DEAFC 0.9063 2.1063 0.3631VGAFC 0.9916 1.8744 0.2866IFCM 1.1733 1.0417 0.1983
Arabidopsis Thaliana IDEAFC 0.5744 1.9003 0.3297DEAFC 0.6613 1.3341 0.2641VGAFC 0.6942 0.9273 0.1903IFCM 0.7992 0.3363 0.1007
Human Fibroblasts Serum IDEAFC 0.7823 1.2093 0.4025DEAFC 0.8466 1.0424 0.3461VGAFC 0.9210 0.9062 0.2728IFCM 1.3271 0.4233 0.1662
Rat CNS IDEAFC 0.5797 1.9319 0.3853DEAFC 0.6322 1.3042 0.3127VGAFC 0.7166 0.8013 0.2551IFCM 0.8341 0.3211 0.1702
I. Saha et al. / Expert Systems with Applications 38 (2011) 15122–15133 15127
expression data sets, respectively. Also, two cluster visualizationtools namely Eisen plot and cluster profile plot have been utilized.
5.2.1. Eisen PlotIn Eisen plot Eisen et al. (1998) (see Fig. 5(a) for an example),
the expression value of a gene at a specific time point is repre-sented by coloring the corresponding cell of the data matrix witha color similar to the original color of its spot on the microarray.The shades of red represent higher expression levels, the shadesof green represent lower expression levels and the colors towardsblack represent absence of differential expression. In our represen-tation, the genes are ordered before plotting so that the genes thatbelong to the same cluster are placed one after another. The clusterboundaries are identified by white colored blank rows.
5.2.2. Cluster profile plotThe cluster profile plot (see Fig. 5(b) for an example) shows for
each cluster the normalized gene expression values (light green) ofthe genes of that cluster with respect to the time points. Also, theaverage expression values of the genes of a cluster over differenttime points are plotted as a black line together with the standarddeviation within the cluster at each time point.
5.3. Input parameters
The IDEAFC and DEAFC algorithms are executed for 100 gener-ations with population size 20. The crossover probability (CR) usedfor DEAFC and IDEAFC are taken to be 0.8. The mutation factors (Fand a) for DEAFC and IDEAFC algorithms are set to 0.8 and
11þexpð�ð1=generationÞÞ respectively. The VGA based fuzzy clustering algo-rithm is also executed for 100 generations with population size 20.The crossover and mutation probabilities are taken to be 0.8 and0.3, respectively. The FCM algorithm is executed till it convergesto the final solution for different number of clusters. The numberof clusters for the Sporulation, Cell Cycle, Arabidopsis, Serum andRat CNS data sets are 6, 5, 4, 6 and 6, respectively. This conformsto the findings in the literature (Chu et al., 1998; Sharan et al.,2003; Wen et al., 1998; Xu, Olman, & Xu, 2001).
5.4. Results
Tables 1 and 2 provides result of 50 consecutive runs of thealgorithms for different gene expression data sets. Table 1 givesthe number of clusters found by the different algorithms as wellas the number of time. Clearly IDEAFC is able to find the actualnumber of clusters in most of the runs. For example, for Yeast Spor-ulation gene expression data set the IDEAFC provides six clustersactually present in the gene expression data set 48-times out of50. Tables 2 reports the average values of three cluster validitymeasures in 50 consecutive runs. For example, for Yeast Sporula-tion gene expression data set, the average value of s(C) producesby IDEAFC algorithm is 0.6053. Whereas the s(C) value produceby DEAFC, VGAFC and IFCM are 0.5331, 0.4417 and 0.3184 respec-
Table 1Comparing the number of clusters and number of times OC found on the geneexpression data sets.
Data sets OC by different algorithms/no. of times to get OC out of 50 runs
IDEAFC DEAFC VGAFC IFCM
Sporulation 6/48 8/42 8/35 10/38Cell Cycle 5/46 8/41 9/38 9/35Thaliana 4/46 3/42 5/44 6/38Serum 6/44 7/41 8/38 10/36Rat CNS 6/45 4/42 4/39 8/37
OC denotes the obtained number of clusters.
tively. The superiority of IDEAFC algorithm is also evident from theperformance parameters obtained for all other gene expressiondata sets as well as Fig. 4 which demonstrate the range ofsolutions.
5.5. Statistical significance test
To establish that IDEAFC is significantly superior compared tothe other algorithms, a non-parametric statistical significance testcalled Wilcoxon’s rank sum test for independent samples(Hollander & Wolfe, 1999) has been conducted at the 5% signifi-cance level. All other methods considered here are probabilisticin nature, i.e., they may produce different clustering results in dif-ferent runs depending on the initialization. It has been found thatin all the runs, IDEAFC produces better s(C) value compared toother algorithms. Four groups, corresponding to the four algo-rithms (1. IDEAFC, 2. DEAFC, 3. VGAFC, 4. IFCM), have been createdfor each gene expression data set. Each group consists of the s(C)index scores produced over 50 runs of the corresponding algo-rithm. The median values of each group for all the gene expressiondata sets are reported in Table 3.
As is evident from Table 3, the median values of s(C) scores forIDEAFC are better than those for the other algorithms. To establishthat this goodness is statistically significant, Table 4 reports thep-values produced by Wilcoxon’s rank sum test for comparison oftwo groups (group corresponding to IDEAFC and a group corre-sponding to some other algorithm) at a time. As a null hypothesis,it is assumed that there is no significant difference between themedian values of two groups. Whereas, the alternative hypothesisis that there is significant difference in the median values of thetwo groups. All the p-values reported in the table are less than0.05 (5% significance level). This is strong evidence against the nullhypothesis, indicating that the better median values of theperformance metric produced by IDEAFC is statistically significantand has not occurred by chance.
6. Integrating differential fuzzy clustering with support vectormachines
6.1. Support vector machines
Support vector machine (SVM) classifiers are inspired by sta-tistical learning theory and they perform structural risk

IDEAFC DEAFC VGAFC IFCM
0.3
0.35
0.4
0.45
0.5
0.55
0.6
Silh
ouet
te In
dex
IDEAFC DEAFC VGAFC IFCM
0.15
0.2
0.25
0.3
0.35
0.4
0.45
Silh
ouet
te In
dex
(a) (b)
IDEAFC DEAFC VGAFC IFCM0.05
0.1
0.15
0.2
0.25
0.3
0.35
Silh
ouet
te In
dex
IDEAFC DEAFC VGAFC IFCM
0.1
0.15
0.2
0.25
0.3
0.35
0.4
0.45
Silh
ouet
te In
dex
(c) (d)
IDEAFC DEAFC VGAFC IFCM
0.15
0.2
0.25
0.3
0.35
0.4
Silh
ouet
te In
dex
(e)Fig. 4. Change of s(C) for different clustering algorithm on (a) Yeast Sporulation (b) Yeast Cell Cycle (c) Arabidopsis Thaliana (d) Human Fibroblasts Serum and (e) Rat CNS.
Table 3Median values of the s(C) index for the five gene expression data sets over 50consecutive runs of different algorithms.
Algorithms Sporulation Cell Cycle Thaliana Serum Rat CNS
IDEAFC 0.6102 0.4271 0.3201 04273 0.3918DEAFC 0.5251 0.3521 0.2718 0.3325 0.3301VGAFC 0.4401 0.2918 0.2018 0.2801 0.2615IFCM 0.3241 0.1853 0.1172 0.1626 0.1731
Table 4p-values produced by Wilcoxon’s rank sum test comparing IDEAFC with otheralgorithms.
Data sets p-Values
DEAFC VGAFC IFCM
Sporulation 0.0032 0.00042 5.02e�006Cell Cycle 0.0046 0.00062 7.14e�006Thaliana 0.0013 0.00032 4.52e�006Serum 0.0062 0.00083 8.07e�006Rat CNS 0.0051 0.00068 7.62e�006
15128 I. Saha et al. / Expert Systems with Applications 38 (2011) 15122–15133
minimization on a nested set structure of separating hyperplanes(Vapnik, 1998). Viewing the input data as two sets of vectors ina d-dimensional space, an SVM constructs a separating hyper-plane in that space, one which maximizes the margin between
the two classes of points. To compute the margin, two parallelhyperplanes are constructed on each side of the separating
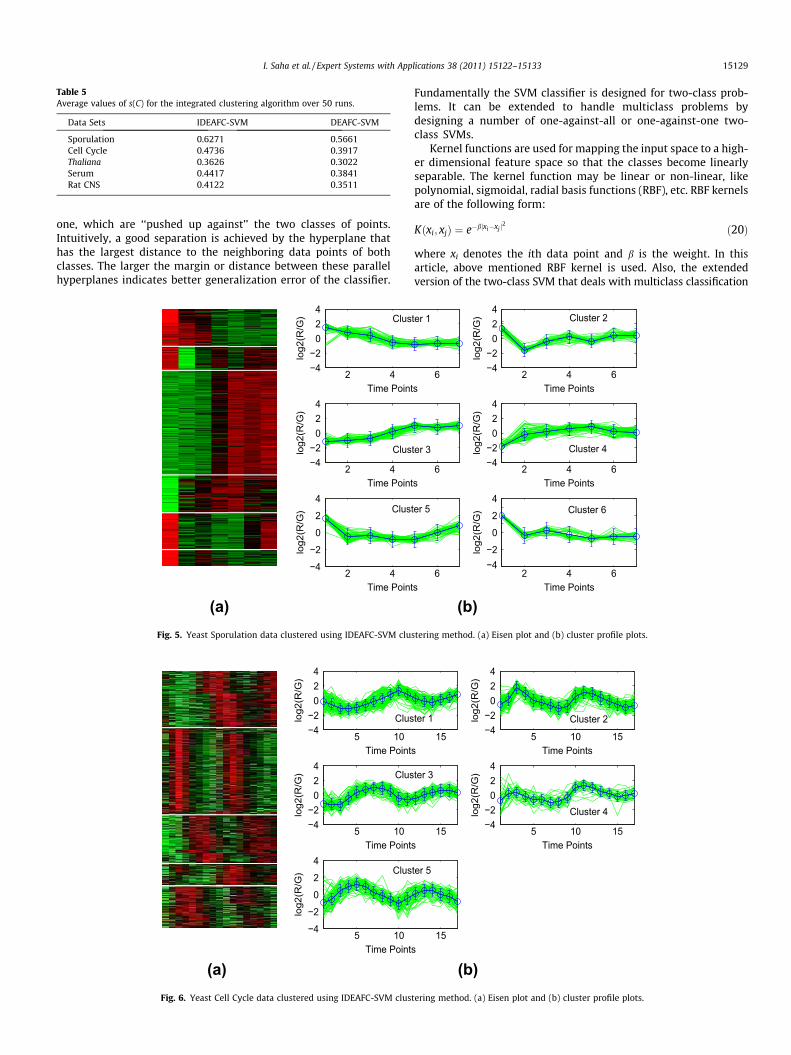
Table 5Average values of s(C) for the integrated clustering algorithm over 50 runs.
Data Sets IDEAFC-SVM DEAFC-SVM
Sporulation 0.6271 0.5661Cell Cycle 0.4736 0.3917Thaliana 0.3626 0.3022Serum 0.4417 0.3841Rat CNS 0.4122 0.3511
I. Saha et al. / Expert Systems with Applications 38 (2011) 15122–15133 15129
one, which are ‘‘pushed up against’’ the two classes of points.Intuitively, a good separation is achieved by the hyperplane thathas the largest distance to the neighboring data points of bothclasses. The larger the margin or distance between these parallelhyperplanes indicates better generalization error of the classifier.
2 4−4−2
024
Time Point
log2
(R/G
)
2 4−4−2
024
Time Point
log2
(R/G
)
2 4−4−2
024
Time Point
log2
(R/G
)
Clus
Clus
Clus
(a)Fig. 5. Yeast Sporulation data clustered using IDEAFC-SVM clu
5 10−4−2
024
Time Point
log2
(R/G
)
5 10−4−2
024
Time Point
log2
(R/G
)
5 10−4−2
024
Time Point
log2
(R/G
)
Clus
Clus
Clus
(a)Fig. 6. Yeast Cell Cycle data clustered using IDEAFC-SVM clus
Fundamentally the SVM classifier is designed for two-class prob-lems. It can be extended to handle multiclass problems bydesigning a number of one-against-all or one-against-one two-class SVMs.
Kernel functions are used for mapping the input space to a high-er dimensional feature space so that the classes become linearlyseparable. The kernel function may be linear or non-linear, likepolynomial, sigmoidal, radial basis functions (RBF), etc. RBF kernelsare of the following form:
Kðxi; xjÞ ¼ e�bjxi�xj j2 ð20Þ
where xi denotes the ith data point and b is the weight. In thisarticle, above mentioned RBF kernel is used. Also, the extendedversion of the two-class SVM that deals with multiclass classification
6s
2 4 6−4−2
024
Time Points
log2
(R/G
)6
s2 4 6−4
−2024
Time Pointslo
g2(R
/G)
6s
2 4 6−4−2
024
Time Points
log2
(R/G
)
ter 1 Cluster 2
ter 3 Cluster 4
ter 5 Cluster 6
(b)stering method. (a) Eisen plot and (b) cluster profile plots.
15s
5 10 15−4−2
024
Time Points
log2
(R/G
)
15s
5 10 15−4−2
024
Time Points
log2
(R/G
)
15s
ter 1 Cluster 2
ter 3
Cluster 4
ter 5
(b)tering method. (a) Eisen plot and (b) cluster profile plots.

2 4 6 8−4
−2
0
2
4
Time Points
log2
(R/G
)
2 4 6 8−4
−2
0
2
4
Time Points
log2
(R/G
)
2 4 6 8−4
−2
0
2
4
Time Points
log2
(R/G
)
2 4 6 8−2
−1
0
1
2
3
Time Points
log2
(R/G
)
Cluster 1 Cluster 2
Cluster 3 Cluster 4
(a) (b)Fig. 7. Arabidopsis Thaliana data clustered using IDEAFC-SVM clustering method. (a) Eisen plot and (b) cluster profile plots.
15130 I. Saha et al. / Expert Systems with Applications 38 (2011) 15122–15133
problem by designing a number of one-against-all two-class SVMs,is used here. For example, a K-class problem is handled with Ktwo-class SVMs.
6.2. Proposed method
This section describes the proposed scheme for combining thedifferential fuzzy clustering algorithm (IDEAFC or DEAFC)described in Section 3 with the SVM classifier. The combined ap-proaches are named as IDEAFC-SVM, DEAFC-SVM. This is moti-vated by the fact due to the presence of training points,supervised classification usually performs better than the unsuper-vised classification or clustering. In this article we have exploitedthis advantage while selecting some training points using im-proved differential evolution based fuzzy clustering techniqueand the concept of proximity of the points from the respective
2 4 6 8−4−2
024
Time Points
log2
(R/G
)
2 4 6 8−4−2
024
Time Points
log2
(R/G
)
2 4 6 8−4−2
024
Time Points
log2
(R/G
)
Cluster
Cluster
Cluste
(a)Fig. 8. Human Fibroblasts Serum data clustered using IDEAFC-SVM
cluster centers. The basic steps are described below. The basicsteps are described below.
BeginStep 1: Execute IDEAFC or DEAFC to obtain a best solution
vector consisting of cluster centers.Step 2: Select 50% of gene expression data points from each
cluster which are nearest to the respective clustercenters. The class labels of the points are set to therespective cluster number.
Step 3: Train a SVM classifier with the gene expression datapoints selected in step 2.
Step 4: Generate the class labels for the remaining geneexpression data points using the trained SVMclassifier.
End
10 12 2 4 6 8 10 12−4−2
024
Time Points
10 12 2 4 6 8 10 12−4−2
024
Time Points
log2
(R/G
)
10 12 2 4 6 8 10 12−4−2
024
Time Points
log2
(R/G
)lo
g2(R
/G) 1 Cluster 2
3 Cluster 4
r 5 Cluster 6
(b)clustering method. (a) Eisen plot and (b) cluster profile plots.

2 4 6 8−4−2
024
Time Points
log2
(R/G
)
2 4 6 8−4−2
024
Time Points
log2
(R/G
)
2 4 6 8−4−2
024
Time Points
log2
(R/G
)
2 4 6 8−4−2
024
Time Points
log2
(R/G
)
2 4 6 8−4−2
024
Time Points
log2
(R/G
)
2 4 6 8−4−2
024
Time Points
log2
(R/G
)
Cluster 1
Cluster 3
Cluster 5 Cluster 6
Cluster 4
Cluster 2
(a) (b)Fig. 9. Rat CNS data clustered using IDEAFC-SVM clustering method. (a) Eisen plot and (b) cluster profile plots.
I. Saha et al. / Expert Systems with Applications 38 (2011) 15122–15133 15131
6.3. Results
Table 5 show the results in terms of s(C) obtained by theintegrated clustering algorithm for the five gene expression datasets, respectively. It can be seen from the table that irrespectiveof the clustering method used in the proposed algorithm, theperformance gets improved after the application of SVM. Forexample, in case of Yeast Sporulation, the s(C) values produceby IDEAFC is 0.6053 while this gets improved to 0.6271 whenSVM is used. Similar results are found for other data sets also.The results demonstrate the utility of adopting the approach pre-sented in this paper, irrespective of the clustering method used(see Figs. 5–9).
IDEAFC−SVM DEAFC−SVM VGAFC IFCM0
10
20
30
40
50
−log
10(p
−val
ues)
Fig. 10. Boxplots of the p-values of the most significant GO terms of all the clustershaving at least one significant GO term as obtained by different algorithms for YeastSporulation data. The p-values are log-transformed for better readability.
7. Biological significance
The biological relevance of a cluster can be verified based on thestatistically significant Gene Ontology (GO) annotation database(http://www.db.yeastgenome.org/cgi-bin/GO/goTermFinder). Thisis used to test the functional enrichment of a group of genes interms of three structured, controlled vocabularies (ontologies),viz., associated biological processes, molecular functions and bio-logical components. The degree of functional enrichment (p-value)is computed using a cumulative hypergeometric distribution. Thismeasure the probability of finding the number of genes involved ina given GO term (i.e., process, function, component) within a clus-ter. From a given GO category, the probability p of getting k ormore genes within a cluster of size n, can be defined as (Tavazoie,Hughes, Campbell, Cho, & Church, 1999):
p ¼ 1�Xk�1
i¼0
f
i
� �g � f
n� i
� �
g
n
� � ð21Þ
where f and g denote the total number of genes within a categoryand within the genome, respectively. Statistical significance isevaluated for the genes in a cluster by computing the p-value foreach GO category. This signifies how well the genes in the clustermatch with the different GO categories. If the majority of genes in
a cluster have the same biological function, then it is unlikely thatthis takes place by chance and the p-value of the category will beclose to 0. The biological significance test for Yeast Sporulationdata has been conducted at the 1% significance level. For differentalgorithms, the number of clusters for which the most significantGO terms have a p-value less than 0.01 (1% significance level) areas follows: IDEAFC-SVM – 6, DEAFC-SVM – 8, VGAFC – 8 and IFCM– 10. In Fig. 10, the boxplots of the p-values of the most significantGO terms of all the clusters having at least one significant GO termas obtained by the different algorithms are shown. The p-values arelog-transformed for better readability. It is evident from the figurethat the boxplot corresponding to IDEAFC-SVM method has lowerp-values (i.e., higher-log10(p � value)). This indicates that the clus-ters identified by IDEAFC-SVM are more biologically significantand functionally enriched compared to the other algorithms. Asan illustration, Table 6 reports the three most significant GO terms(along with the corresponding p-values) shared by the genes ofeach of the 6 clusters identified by IDEAFC-SVM technique(Fig. 5). As is evident from the table, all the clusters produced byIDEAFC-SVM clustering scheme are significantly enriched with

Table 6The three most significant GO terms and the corresponding p-values for each of the 6clusters of Yeast Sporulation data as found by IDEAFC-SVM clustering technique.
Clusters Significant GO term p-Values
Cluster1
Fungal-type cell wall – GO:0009277 8.49E�07External encapsulating structure – GO:0030312 2.38E�06Cell wall – GO:0005618 2.38E�06
Cluster2
Preribosome – GO:0030684 9.41E�27Ribosome biogenesis – GO:0042254 5.94E�18Ribonucleoprotein complex biogenesis – GO:0022613 4.99E�17
Cluster3
Ascospore wall assembly – GO:0030476 3.03E�33Spore wall assembly – GO:0042244 3.03E�33Sporulation resulting in formation of a cellular spore –GO:0030435
9.90E�31
Cluster4
M phase of meiotic cell cycle – GO:0051327 3.24E�26Meiosis – GO:0007126 3.24E�26Meiotic cell cycle – GO:0051321 3.93E�26
Cluster5
Cytosolic ribosome – GO:0022626 9.35E�54Cytosolic part – GO:0044445 9.18E�49Ribosomal subunit – GO:0033279 4.41E�47
Cluster6
Glycolysis – GO:0006096 1.93E�12Glucose catabolic process – GO:0006007 6.18E�11Hexose catabolic process – GO:0019320 2.23E�10
15132 I. Saha et al. / Expert Systems with Applications 38 (2011) 15122–15133
some GO categories, since all the p-values are less than 0.01 (1%significance level). This establishes that the proposed IDEAFC-SVM clustering scheme is able to produce biologically relevantand functionally enriched clusters
8. Conclusion
In this article an improved differential evolution based fuzzyclustering for automatic cluster evolution technique has beendescribed for the analysis of microarray gene expression data sets.The problem of fuzzy clustering has been modeled as one of opti-mization of a cluster validity measure. An improved version of dif-ferential evolution technique has been used as a stochasticoptimization tool. Results on different gene expression date setsindicate that IDEAFC consistently performs better than DEAFC,VGAFC and IFCM clustering techniques. To improve the perfor-mance of clustering further a SVM classifier is trained with a frac-tion of gene expression data points selected from each clustersbased on the proximity to the respective cluster centers. Subse-quently the remaining gene expression data points are reassignedusing the trained SVM classifier. Experimental results indicate thatthis approach is likely to yield better results irrespective of the ac-tual clustering technique adopted.
As a scope of further research, the use of kernel functions otherthan RBF may be studied. The IDE based algorithm can also be ex-tended for solving multiobjective optimization problems using theconcept of amount of dominance (Bandyopadhyay, Saha, Maulik, &Deb, 2008). A sensitivity analysis of the developed technique withrespect to different setting of the parameters, including the frac-tion of the points to be used for training the SVM, needs to be car-ried out. The authors are currently working in these directions.
Acknowledgment
This work was also supported by the Polish Ministry of Educa-tion and Science (Grants N301 159735, N518 409238, and others).
References
Alizadeh, A. A., Eisen, M. B., Davis, R., Ma, C., Lossos, I., Rosenwald, A., et al. (2000).Distinct types of diffuse large b-cell lymphomas identified by gene expressionprofiling. Nature, 403, 503–511.
Bandyopadhyay, S. (2005). An efficient technique for superfamily classification ofamino acid sequences: Feature extraction, fuzzy clustering and prototypeselection. Fuzzy Sets and Systems, 152, 5–16.
Bandyopadhyay, S., & Maulik, U. (2001). Nonparametric genetic clustering:Comparison of validity indices. IEEE Transactions on Systems, Man, andCybernetics, Part C, 31(1), 120–125.
Bandyopadhyay, S., Maulik, U., & Wang, J. T. (2007). Analysis of biological data: A softcomputing approach. World Scientific.
Bandyopadhyay, S., & Pal, S. K. (2001). Pixel classification using variable stringgenetic algorithms with chromosome differentiation. IEEE Transactions onGeoscience and Remote Sensing, 39(2), 303–308.
Bandyopadhyay, S., Saha, S., Maulik, U., & Deb, K. (2008). A simulated annealingbased multi-objective optimization algorithm: AMOSA. IEEE Transactions onEvolutionary Computation, 12(3), 269–283.
Bezdek, J. C. (1981). Pattern recognition with fuzzy objective function algorithms. NewYork: Plenum.
Bezdek, J. C., & Pal, N. R. (1998). Some new indexes of cluster validity. IEEETransactions on Systems, Man and Cybernetics, 28(3), 301–315.
Bras Silva, H., Brito, P., & Pinto da Costa, J. (2006). A partitional clustering algorithmvalidated by a clustering tendency index based on graph theory. PatternRecognition, 39(5), 776–788.
Burges, C. L. C. (1998). A tutorial on support vector machines for patternrecognition. Data Mining and Knowledge Discovery, 2, 121–167.
Cho, R. J., Campbell, M. J., Winzeler, E. A., Steinmetz, L., Conway, A., Wodica, L., et al.(1998). A genome-wide transcriptional analysis of mitotic cell cycle. MolecularCell, 2, 65–73.
Chou, H. C., Su, M. C., & Lai, E. (2004). A new cluster validity measure and itsapplication to image compression. Pattern Analysis and Applications, 7, 205–220.
Chu, S., DeRisi, J., Eisen, M., Mulholland, J., Botstein, D., Brown, P. O., et al. (1998). Thetranscriptional program of sporulation in budding yeast. Science, 282, 699–705.
Domany, E. (2003). Cluster analysis is of gene expression data. Journal of StatisticalPhysics, 110(3–6), 1117–1139.
Eisen, M. B., Spellman, P. T., Brown, P. O., & Botstein, D. (1998). Cluster analysis anddisplay of genome-wide expression patterns. Proceedings of the NationalAcademy of Sciences, 14863–14868.
Everitt, B. S. (1993). Cluster analysis (3rd ed.). Halsted Press.Gath, I., & Geva, A. (1989). Unsupervised optimal fuzzy clustering. IEEE Transactions
on Pattern Analysis and Machine Intelligence, 11, 773–781.Groll, L., & Jakel, J. (2005). A new convergence proof of fuzzy c-means. IEEE
Transactions on Fuzzy System, 13, 717–720.Hartigan, J. A. (1975). Clustering algorithms. Wiley.Hollander, M., & Wolfe, D. A. (1999). Nonparametric Statistical Methods, 2nd Ed.Iyer, V. R., Eisen, M. B., Ross, D. T., Schuler, G., Moore, T., Lee, J., et al. (1999). The
transcriptional program in the response of the human fibroblasts to serum.Science, 283, 83–87.
Jain, A. K., & Dubes, R. C. (1988). Algorithms for clustering data. Englewood Cliffs, NJ:Prentice-Hall.
Kim, S. Y., Lee, J. W., & Bae, J. S. (2006). Effect of data normalization on fuzzyclustering of DNA microarray data. BMC Bioinformatics, 7(134).
Kim, M., & Ramakrishna, R. (2005). New indices for cluster validity assessment.Pattern Recognition Letters, 26(15), 2353–2363.
Krishnapuram, R., & Freg, C. P. (1992). Fitting an unknown number of lines andplanes to image data through compatible cluster merging. Pattern Recognition,25(4), 433–439.
Lockhart, D. J., & Winzeler, E. A. (2000). Genomics, gene expression and DNA arrays.Nature, 405, 827–836.
Maulik, U., & Bandyopadhyay, S. (2002). Performance evaluation of some clusteringalgorithms and validity indices. IEEE Transactions on Pattern Analysis andMachine Intelligence, 24(12), 1650–1654.
Maulik, U., & Bandyopadhyay, S. (2002). Performance evaluation of some clusteringalgorithms and validity indices. IEEE Transactions on Pattern Analysis andMachine Intelligence, 24(12), 1650–1654.
Maulik, U., & Bandyopadhyay, S. (2003). Fuzzy partitioning using a real-codedvariable-length genetic algorithm for pixel classification. IEEE Transactions onGeoscience and Remote Sensing, 41(5), 1075–1081.
Maulik, U., Bandyopadhyay, S., & Saha, I. (2009). Integrating clustering andsupervised learning for categorical data analysis. IEEE Transactions on Systems,Man and Cybernetics Part-A. doi:10.1109/TSMCA.2010.2041225.
Maulik, U., & Saha, I. (2009). Modified differential evolution based fuzzy clusteringfor pixel classification in remote sensing imagery. Pattern Recognition, 42(9),2135–2149.
Omran, M., Engelbrecht, A., & Salman, A. (2005). Differential evolution methods forunsupervised image classification. In Proceedings of IEEE international conferenceon evolutionary computation (Vol. 2, pp. 966–973).
Pal, N. R., & Bezdek, J. C. (1995). On cluster validity for the Fuzzy C-Means model.IEEE Transactions on Fuzzy Systems, 3, 370–379.
Price, K., Storn, R., & Lampinen, J. (2005). Differential evolution – A practical approachto global optimization. Berlin: Springer.
Reymonda, P., Webera, H., Damonda, M., & Farmera, E. E. (2000). Differential geneexpression in response to mechanical wounding and insect feeding inarabidopsis. Plant Cell, 12, 707–720.
Rousseeuw, P. J. (1987). Silhouettes: A graphical aid to the interpretation andvalidation of cluster analysis. Journal of Computational and Applied Mathematics,20, 53–65.
Shannon, W., Culverhouse, R., & Duncan, J. (2003). Analyzing microarray data usingcluster analysis. Pharmacogenomics, 4(1), 41–51.

I. Saha et al. / Expert Systems with Applications 38 (2011) 15122–15133 15133
Sharan, R., Maron-Katz, A., & Shamir, R. (2003). Click and expander: A system forclustering and visualizing gene expression data. Bioinformatics, 19, 1787–1799.
Storn, R., & Price, K. (1995). Differential evolution – A simple and efficient adaptivescheme for global optimization over continuous spaces, Technical Report TR-95-012, International Computer Science Institute, Berkley.
Storn, R., & Price, K. (1997). Differential evolution – A simple and efficient heuristicstrategy for global optimization over continuous spaces. Journal of GlobalOptimization, 11, 341–359.
Tavazoie, S., Hughes, J., Campbell, M., Cho, R., & Church, G. (1999). Systematicdetermination of genetic network architecture. Nature Genetics, 22, 281–285.
Vapnik, V. (1998). Statistical learning theory. New York, USA: Wiley.Wang, W., & Zhang, Y. (2007). On fuzzy cluster validity indices. Fuzzy Sets and
Systems, 158(19), 2095–2117.Wen, X., Fuhrman, S., Michaels, G. S., Carr, D. B., Smith, S., Barker, J. L., et al. (1998).
Large-scale temporal gene expression mapping of central nervous systemdevelopment. Proceedings of the National Academy of Sciences, 95, 334–339.
Xie, X. L., & Beni, G. (1991). A validity measure for fuzzy clustering. IEEE Transactionson Pattern Analysis and Machine Intelligence, 13, 841–847.
Xu, Y., Olman, V., & Xu, D. (2001). Minimum spanning trees for gene expression dataclustering. Genome Informatics, 12, 24–33.


![Effective Face Recognition Using Bag of Features with ...bebis/JEI2016.pdf · SVM classifier is very high, we use a linear SVM solver, Pegasos [27], with the help of additive kernels,](https://img.dokumen.tips/doc/110x75/5e78c72a2c30a75d19512d7c/effective-face-recognition-using-bag-of-features-with-bebis-svm-classifier.jpg)


![ABC-SVM: Artificial Bee Colony and SVM Method for Microarray … · 2016-07-05 · selection problem has been shown to be NP-hard [3]. Therefore, ... background about Artificial Bee](https://img.dokumen.tips/doc/110x75/5f3ee95a03b44a552c534858/abc-svm-artificial-bee-colony-and-svm-method-for-microarray-2016-07-05-selection.jpg)