Embed Size (px)
Citation preview
Improvement of chemotherapy patient flow andscheduling in an outpatient oncology clinic*
Bohui Lianga, Ayten Turkcana†, Mehmet Erkan Ceyhanb, Keith Stuartba Department of Mechanical and Industrial Engineering, Northeastern University, Boston, MA 02115
b Lahey Hospital and Medical Center, Burlington, MA 01805
[email protected], [email protected], [email protected], [email protected]
Due to increasing demand, the oncology clinics have been experiencing higher workloads and increasing
delays in laboratory, pharmacy, and chemotherapy administration areas. In this study, we worked with
an oncology clinic where patients receive chemotherapy treatment. A discrete event simulation model is
developed to evaluate the operational performance in the clinic and to identify initiatives for improvement in
process flow, scheduling and staffing. A mathematical programming model is developed to generate balanced
appointment schedules for oncologist visit and chemotherapy treatment. Our results show that patient
waiting times and clinic total working times can be reduced and a more balanced resource utilization can
be achieved by using better scheduling methods.
Key words : Discrete event simulation, appointment scheduling, patient flow, oncology, chemotherapy
1. Introduction
Cancer patients often receive multiple treatments including chemotherapy, radiotherapy, and
surgery from different specialists for extended periods of time. Services such as blood work, phys-
ical exam, drug preparation, and chemotherapy administration, are required to be performed in
different facilities such as laboratories, clinics, pharmacies, and treatment rooms. The services in
each facility are performed by multiple resources such as phlebotomists, nurses, pharmacists, and
medical oncologists. Clinic administrators face the difficult decision of improving efficiency in this
complex multi-facility environment. The coordination of these services and resources is critical for
timely and efficient treatment of patients. In this study, our aim is to show that delays due to
inefficient care delivery can be eliminated by better coordination, planning, and scheduling.
This study is performed in the Department of Hematology and Oncology in Lahey Hospital
and Medical Center, Burlington MA. We consider chemotherapy patients who come to the clinic
according to their appointment times for oncologist visit and/or chemotherapy treatment, and
∗ This is an accepted manuscript of an article published by Taylor & Francis (http://wwww.tandfonline.com/) in
International Journal of Production Research on 11 Dec 2014, DOI: 10.1080/00207543.2014.988891
† Corresponding author
1
Liang et al.: Improvement of chemotherapy patient flow and scheduling in an outpatient oncology clinic2
go through multiple stages (oncologist visit, lab, pharmacy, chemotherapy administration). They
require multiple resources (oncologists, nurses, chairs, pharmacists, phlebotomists) at each stage of
the process. Uncertainties such as unpunctual arrivals, delays in laboratory and pharmacy areas,
increase or decrease in treatment durations due to side effects or dose changes, cancellations,
and add-ons, occur during a typical clinic day. All these uncertainties affect patient flow and
staff workflow. Patients experience long waiting times due to delays in laboratory, pharmacy, and
chemotherapy administration areas, and providers and staff experience an unbalanced workload
throughout the day. Reducing patient waiting times is among the highest priorities for quality
improvement and patient satisfaction in outpatient cancer treatment facilities (Gesell and Gregory,
2004). Appointment scheduling that does not consider the availability of clinic resources and nursing
care requirements is determined to be the main cause of delays and unbalanced workload (Gruber
et al., 2003; Chabot and Fox, 2005). In this study, our aim is the incorporate the actual resource
requirements into coordination and scheduling of appointments to minimize patient waiting times
and balance clinic workload.
We use discrete event simulation to model the patient flow in the oncology clinic and test the
impact of different operational decisions on patient waiting times, resource utilizations and over-
time. The model considers multiple patient classes with varying routings and resource requirements,
unpunctual arrivals, and stochastic service times and treatment durations. Earlier simulation stud-
ies, which proposed changing the arrival rates to have a smoother workload, did not develop a
method to find a schedule that considers the dependencies between oncologist and chemother-
apy appointments. In this study, we propose an optimization model to determine a coordinated
appointment schedule for oncology and infusion clinics with the objective of balancing workload
and resource utilization for both processes during the day. This study is one of the few studies
that considers all the complexities and uncertainties that occur in multi-facility healthcare systems
with multiple patient classes and varying patient routings.
The remainder of the paper is organized as follows. A brief review of the existing studies in
the literature is provided in Section 2. The clinic environment including patient flow, patient mix,
and clinic resources is explained in detail in Section 3. In Section 4, the appointment scheduling
in current practice and proposed optimization model to find a balanced appointment schedule are
explained. The details of the simulation model and the computational results are given in Sections
5 and 6. The last section provides concluding remarks.
Liang et al.: Improvement of chemotherapy patient flow and scheduling in an outpatient oncology clinic3
2. Literature review
Simulation is one of the most commonly used approach to model clinic environments with several
complexities. In oncology clinics, simulation is used to find the best scheduling method, test the
impact of different scheduling methods on clinic performance, and determine the optimal resource
levels. The studies by Ahmed, ElMekkawy, and Bates (2011), Yokouchi et al. (2012), Tanaka
(2013), and Woodall et al. (2013) consider the patient flow for chemotherapy treatment only.
Ahmed, ElMekkawy, and Bates (2011) and Yokouchi et al. (2012) use simulation to determine the
best appointment scheduling rules by changing arrival rates, and nurse schedules by changing the
number of nurses at each time interval. The objectives are minimizing patient waiting times and
maximizing throughput. Tanaka (2013) uses simulation to test different scheduling rules based on
bin-packing algorithms and determine the time allocated for pre-treatment process, preparation
and nursing. Woodall et al. (2013) use simulation based optimization to determine the optimal
nurse schedules with the objective of minimizing expected waiting times. Shashaani (2011) first
determines the appointment schedule using a deterministic integer programming model, and then
uses it as an input to the simulation model to evaluate the impact of variability in service times on
key performance measures such as patient waiting times. Shashaani (2011) considers the impact
of oncologist appointments while determining the optimal appointment times in the mathematical
programming model, but do not consider the patient flow for oncologist visits in the simulation
model.
It is difficult to optimize scheduling and patient flow in oncology clinics without considering the
patient flow in upstream stages (i.e. oncologist appointment), because patient flow from upstream
stage might incur start time limits, uncertainties (cancellations, add-ons), and delays in down-
stream stages (i.e. chemotherapy treatment). It is important to consider both stages (oncologist and
infusion appointments) simultaneously for better coordination of appointment schedules, improved
patient flow and more balanced resource utilization in oncology clinics. There are only a few sim-
ulation studies that consider patient flow for both oncologist and chemotherapy appointments.
Sepulveda et al. (1999) use discrete event simulation to determine the impact of alternative floor
layouts, number of patients scheduled per day and a new building plan. The simulation model
helps decision maker to identify bottlenecks and analyze patient flow before building a new facility.
Baesler and Sepulveda (2001) integrate simulation, goal programming and genetic algorithm to
find the best combinations of control variables (i.e. resources) to meet the predetermined goals of
patient waiting time, chair utilization, clinic total working time and nurse utilization. Matta and
Patterson (2007) use simulation to evaluate the impact of different patient arrival rates, resource
Liang et al.: Improvement of chemotherapy patient flow and scheduling in an outpatient oncology clinic4
levels (i.e. additional nurses, doctors), queuing policies, and an express testing center for a group
of patients. None of these simulation studies propose an optimization method to determine the
appointment schedules for oncologist and chemotherapy appointments.
There are studies that use optimization methods to solve appointment scheduling problem, but
most of them consider chemotherapy appointments only. Turkcan, Zeng, and Lawley (2012) propose
an integer programming model to determine appointment times, nurse and chair assignments with
the objective of minimizing the maximum completion of all treatments while satisfiying nurse and
chair availability constraints. Shashaani (2011) extends the daily appointment scheduling model of
Turkcan, Zeng, and Lawley (2012) by incorporating patient preferences, staggered nurse schedules,
and start time constraints (i.e. start after the completion of oncologist appointment). Santibanez
et al. (2012) propose a multi-objective integer programming model to schedule all patients consid-
ering nurse capacity with the objectives of satisfying patients’ time preferences, pharmacy capacity,
balancing workload between nurses, balancing workload of each nurse throughout the day and
assigning clinical trial patients to specialized nurses. These three studies assume all patients that
should be scheduled are known in advance. Sevinc, Sanli, and Goker (2013) propose a multiple
knapsack model for offline scheduling (where all patients are known) and two heuristics based
on best-fit bin packing algorithm for online scheduling where patients are added to the schedule
dynamically. Hahn-Goldberg et al. (2014) use constraint programming to develop a template sched-
ule based on historical data and update the template dynamically when appointment requests that
do not fit the template arrive. The proposed model determines the start times of drug preparation
and treatment stages while not exceeding the pharmacy, nurse, and chair capacities at any time
throughout the day.
To the best of our knowledge, Sadki, Xie, and Chauvin (2011) is the only study that deter-
mines both oncologist and chemotherapy appointments simultaneously using a mixed-integer pro-
gramming (MIP) model. The proposed MIP model determines the oncologist start times, patient
appointment times, and injection start times with the objective of minimizing a weighted com-
bination of patient waiting time and makespan (clinic total working time). The proposed model
assumes punctual arrivals, no idle time between patients of the same oncologist, and no cancella-
tions. The patients see their oncologist as soon as they arrive. The chemotherapy treatment starts
after the oncologist sees the patient, the pharmacy prepares the drug and a chemotherapy bed
becomes available. The nurses and pharmacists are assumed to have enough capacity and their
availability is not considered in the proposed model.

Liang et al.: Improvement of chemotherapy patient flow and scheduling in an outpatient oncology clinic5
In this study, we use optimization and simulation approaches to improve chemotherapy patient
flow and scheduling in an outpatient oncology clinic. We develop a mathematical programming
model that evenly distributes patients into time slots to balance the workload throughout the
day for oncologist and chemotherapy appointments. Instead of determining a scheduling tem-
plate, we use the optimal schedule to determine a probability matrix that shows the probability
of assigning different patients types (categorized according to their treatment durations) to dif-
ferent appointment times. With the probability matrix, the scheduler does not have to know the
whole day demand and can schedule the patients as they arrive sequentially. We develop a discrete
event simulation model that closely mimics the complex flow of chemotherapy patients in a real
clinic environment. The simulation model incorporates several environmental complexities includ-
ing unpunctual arrivals, stochastic oncologist and chemotherapy appointment durations (functions
of scheduled appointment durations), add-ons, cancellations, and nurse workflow. It also considers
multiple patient classes characterized by appointment types, laboratory test requirement, treat-
ment durations, oncologist visit durations, and nursing times. The simulation model is used to
evaluate the current performance and test alternative operational decisions to improve performance
measures such as patient waiting times and clinic overtime.
3. Clinic Environment
We worked with The Hematology and Oncology Clinic at Lahey Hospital and Medical Center in
Burlington, MA. The clinic provides care for patients with blood disorders and cancer. Patients
come to the clinic for consultation or follow-up with the oncologist and for chemotherapy treatment.
Patients arrive to the clinic according to their appointment times and go through several processes
before being seen by the medical oncologist and/or receive chemotherapy treatment.
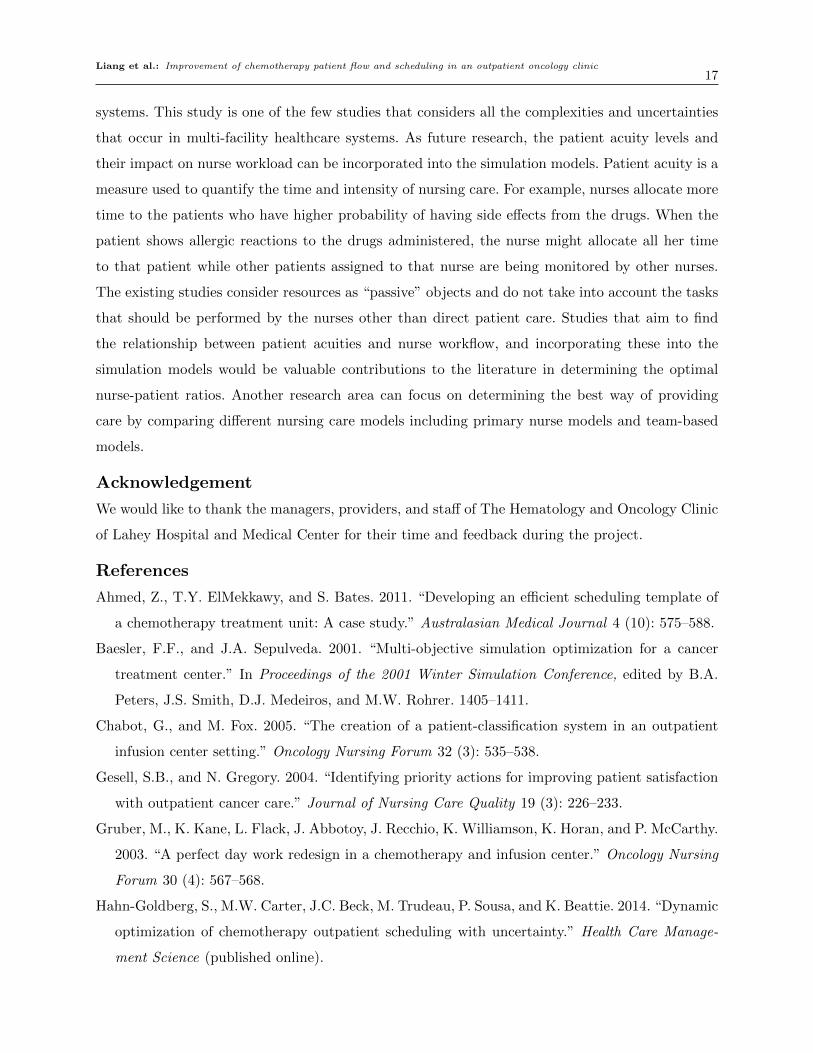
3.1. Patient flow
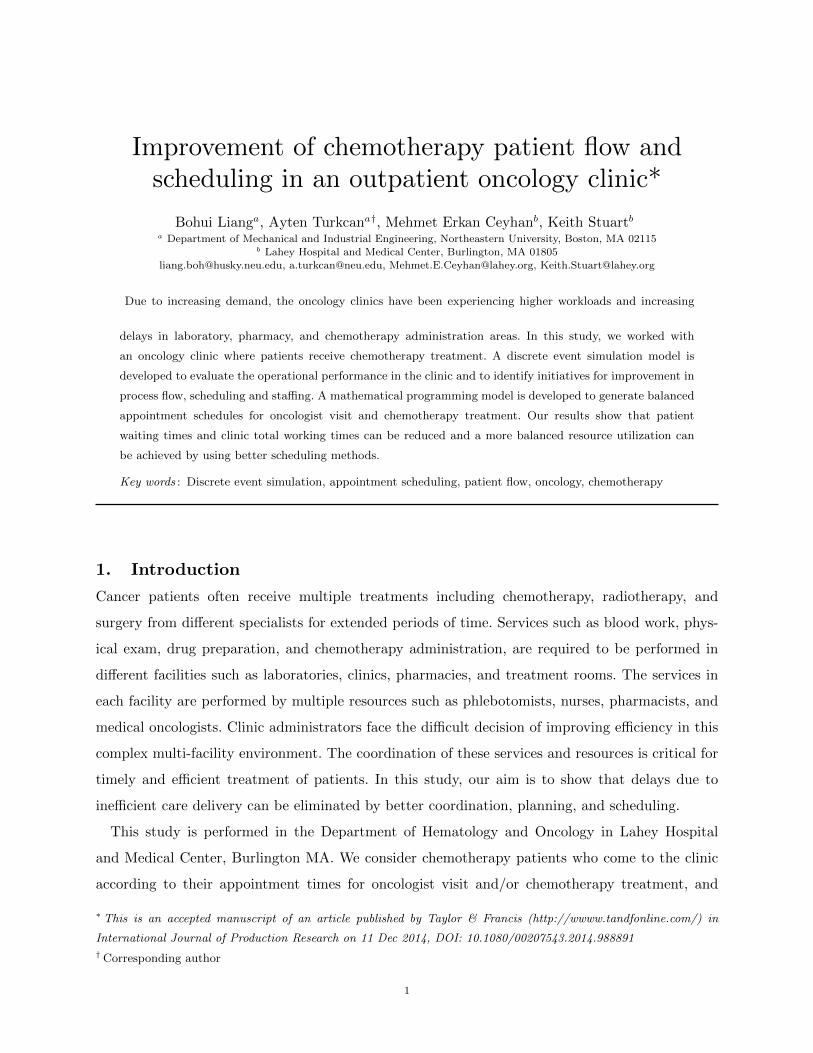
Figure 1 shows the patient flow in the hematology and oncology clinic. When patient arrives to the
clinic, appointment scheduling coordinator (ASC) verifies patient information, prints medication
list, and updates patient status in oncology information system. After check-in, a medical assistant
(MA) prepares patient’s chart. When the vital room becomes available, MA calls the patient from
waiting room and takes vital signs. If the patient needs laboratory tests, then blood is drawn by
the medical assistant in the lab room. However, if the patient has a PORT, the blood can be drawn
only by a registered nurse (RN) in the infusion clinic. The patient waits in the waiting room until
an RN becomes available for blood draw. The blood sample is sent to the central lab and the
patient waits until the lab results are received. The patients who need lab tests are told to arrive

Liang et al.: Improvement of chemotherapy patient flow and scheduling in an outpatient oncology clinic6
one hour early to the clinic to have enough time for blood draw and laboratory tests. After the test
results are received, MA takes the patient who has an oncologist appointment to an available exam
room and notifies the oncologist. If the patient has both oncologist and infusion appointments,
he/she receives chemotherapy after the oncologist appointment. If the patient has a chemotherapy
appointment, RN assesses patient condition (test results, vital signs, and drug dose) before the
treatment can start. If the patient’s health status is good enough to receive the treatment on that
day, he/she is seated on a chemotherapy chair and pharmacy is informed for drug preparation.
When the drug is ready, RN picks up the drug and starts the treatment. While the patient is on
the chair, RN continuously monitors patient status. When the treatment is completed, RN finishes
the treatment and patient is discharged. The dotted lines in Figure 1 show the time stamps we
get from the information system. We use these time stamps to determine patient mix, scheduled
and actual oncologist visit and chemotherapy treatment durations, appointment schedules, arrival
times, patient waiting times, and time in system for each patient type.
[Insert Figure 1 here]
3.2. Patient mix
The patients are first divided into three groups based on the appointments they have on a given day:
i) patients with oncologist appointment only (Type O); ii) patients with chemotherapy appointment
only (Type C); and iii) patients with both oncologist and chemotherapy appointments (Type OC).
The oncologist appointment durations change according to provider practice, and whether patient
is a new or an existing patient. The oncologists allocate 10 to 30 minutes for existing patients and
40 to 60 minutes for new patients. The chemotherapy treatment durations depend on chemotherapy
protocols and show a high variability (range from 30 to 360 minutes). Based on current patient
mix, approximately 45% of infusion appointments are scheduled for 30 minutes. The patients who
are scheduled for their first chemotherapy treatment require additional nursing time for education.
In order to allocate more nursing time to new patients, we determined whether the patient is a
new patient or not. Patients who need lab tests require additional resources. Therefore, we further
classified each patient group as i) patients who need lab tests; and ii) patients who need lab tests
and have PORT access.
4. Appointment scheduling4.1. Current practice
Patient access to the oncology clinic is guaranteed through appointments. The patients who have to
see their oncologists and receive chemotherapy on the same day are scheduled based on oncologist
Liang et al.: Improvement of chemotherapy patient flow and scheduling in an outpatient oncology clinic7
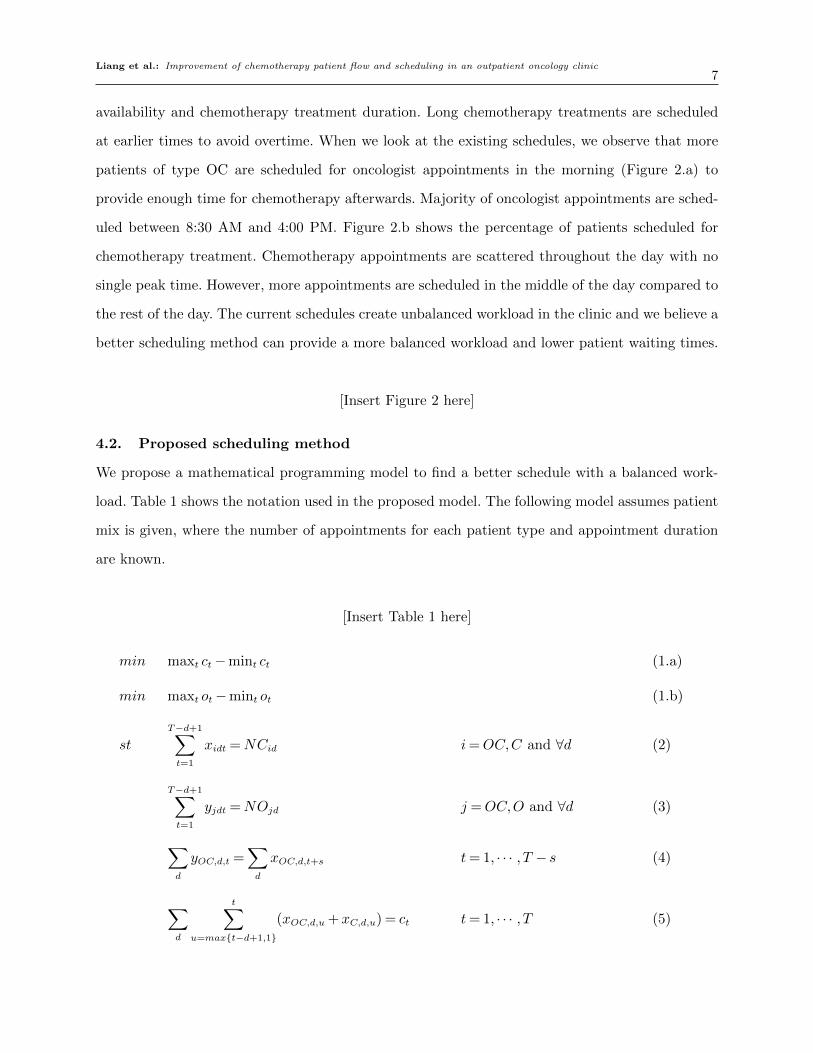
availability and chemotherapy treatment duration. Long chemotherapy treatments are scheduled
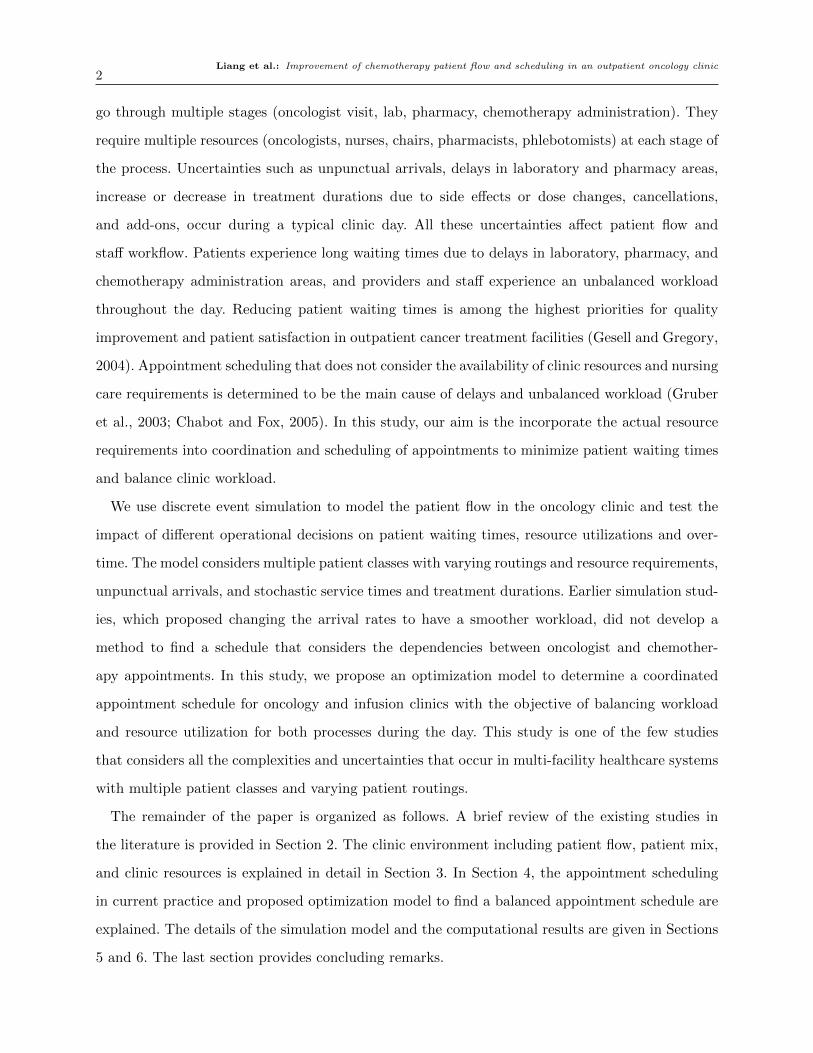
at earlier times to avoid overtime. When we look at the existing schedules, we observe that more
patients of type OC are scheduled for oncologist appointments in the morning (Figure 2.a) to
provide enough time for chemotherapy afterwards. Majority of oncologist appointments are sched-
uled between 8:30 AM and 4:00 PM. Figure 2.b shows the percentage of patients scheduled for
chemotherapy treatment. Chemotherapy appointments are scattered throughout the day with no
single peak time. However, more appointments are scheduled in the middle of the day compared to
the rest of the day. The current schedules create unbalanced workload in the clinic and we believe a
better scheduling method can provide a more balanced workload and lower patient waiting times.
[Insert Figure 2 here]
4.2. Proposed scheduling method
We propose a mathematical programming model to find a better schedule with a balanced work-
load. Table 1 shows the notation used in the proposed model. The following model assumes patient
mix is given, where the number of appointments for each patient type and appointment duration
are known.
[Insert Table 1 here]
min maxt ct−mint ct (1.a)
min maxt ot−mint ot (1.b)
stT−d+1∑t=1
xidt =NCid i=OC,C and ∀d (2)
T−d+1∑t=1
yjdt =NOjd j =OC,O and ∀d (3)
∑d
yOC,d,t =∑d
xOC,d,t+s t= 1, · · · , T − s (4)
∑d
t∑u=max{t−d+1,1}
(xOC,d,u +xC,d,u) = ct t= 1, · · · , T (5)

Liang et al.: Improvement of chemotherapy patient flow and scheduling in an outpatient oncology clinic8
∑d
t∑u=max{t−d+1,1}
(yOC,d,u + yO,d,u) = ot t= 1, · · · , T (6)
∑d(xOC,d,t +xC,d,t)∑
d(NCOC,d +NCC,d)≤ Rt∑T
t=1Rt
t= 1, · · · , T (7)
ct ≤ F t= 1, · · · , T (8)
ot ≤ Pt t= 1, · · · , T (9)
xidt, ct ≥ 0 and integer i=OC,C and ∀d, t (10.a)
yjdt, ot ≥ 0 and integer j =OC,O and ∀d, t (10.b)
The first objective (1.a) minimizes the difference between maximum and minimum number of
chairs occupied to find a balanced chair utilization. The second objective (1.b) minimizes the
difference between maximum and minimum number of exam rooms occupied at each time slot.
Constraints (2) and (3) make sure all patients are scheduled for chemotherapy and oncologist
appointments. When the patient has both oncologist and chemotherapy appointment, there should
be enough slack time between the appointments, which is satisfied by constraint (4). Constraints (5)
and (6) determine the number of chairs and exam rooms occupied at each time slot. Chemotherapy
treatment can start only when a nurse is available and constraint (7) is used to limit the number of
treatment starts based on the number of nurses. Constraints (8) and (9) are the capacity constraints
for chairs and providers. Constraint (10.a) and (10.b) are the integrality constraints.
We solved the proposed model in two stages. In the first stage, we solved the model with the first
objective (1.a) and constraints (2), (5), (7), (8), and (10.a) to determine the number of chemother-
apy appointments that should be scheduled at each time slot. Once chemotherapy appointments
are determined, the number of oncologist appointments for the patients who have both appoint-
ments are given as inputs to the second model with the second objective (1.b) and constraints (3),
(4), (6), (9), and (10.b) to determine the number of oncologist appointments for other patients.
Figures 2.c and 2.d show the proposed schedules for oncologist and chemotherapy appointments,
respectively. According to the optimal oncologist appointment schedule, the last two appointment
slots are allocated to type O patients, because those patients do not need chemotherapy treatment
on the same day. For chemotherapy appointments, most type C patients are scheduled in early
morning because their appointments do not need to be coordinated with the physician schedule.
Even though the proposed mathematical programming model is supposed to be solved as an
integer programming model, we solve the problem as a linear programming model and use the
Liang et al.: Improvement of chemotherapy patient flow and scheduling in an outpatient oncology clinic9
results to determine a probability matrix. Table 2 shows the optimal probability matrix used to
determine the appointment times for the proposed scheduling method. The appointment schedules
are generated sequentially as the appointment requests are realized one at a time without knowing
the future requests. In the simulation model, when a patient entity is generated, we first deter-
mine the patient type according to the current patient mix. If the patient is of type C or OC, the
chemotherapy appointment duration is determined randomly according to the current patient mix.
Based on the chemotherapy appointment duration, the appointment time is determined according
to the probability matrix. For example, if the appointment duration is generated as 270 minutes,
then the probability of assigning an appointment time of 7:30am is 0.5241, the probability of
assigning an appointment time of 8:00am is 0.0313, and so on. If the patient is of type OC or O,
then the appointment duration for the oncologist visit is determined. For patients of type O, the
appointment time is determined based on an empirical probability distribution that depends on
the number of oncologist appointments at each half-hour interval. For patients of type OC, the
oncologist appointment time is one hour before the chemotherapy appointment. In both cases, the
availability of the oncologist is checked. If the oncologist is not available, then another oncologist
appointment time is determined randomly for Type O patients, and the chemotherapy appointment
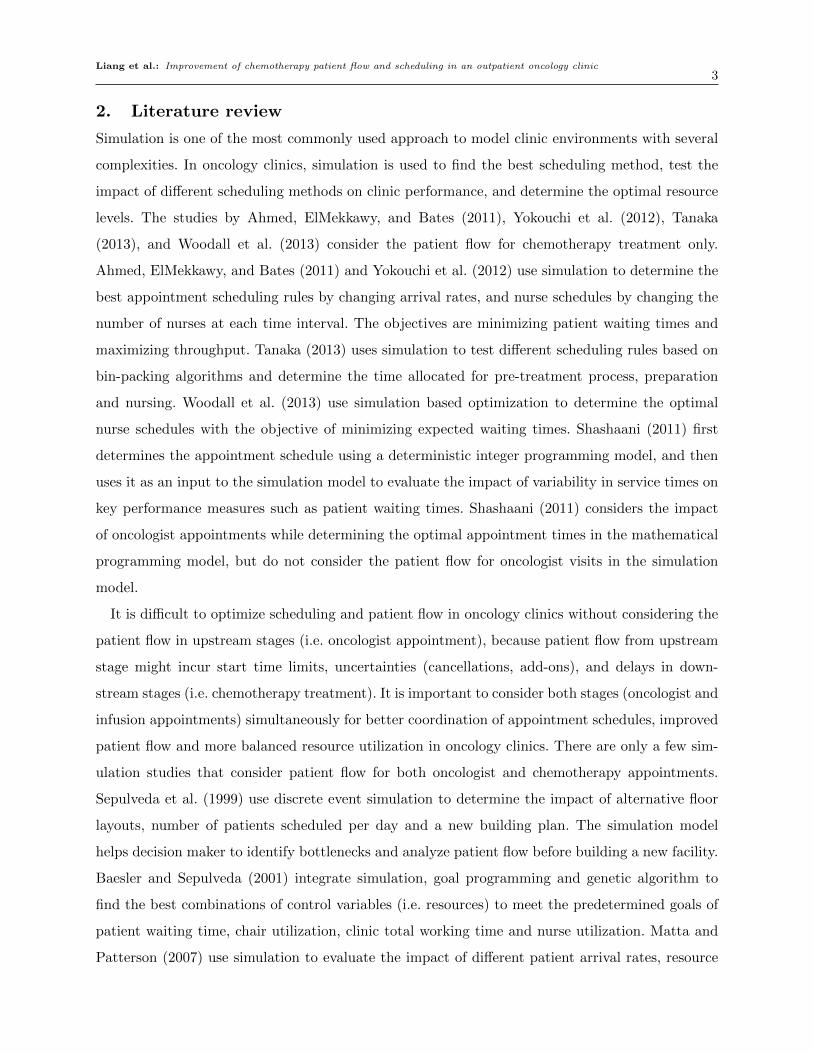
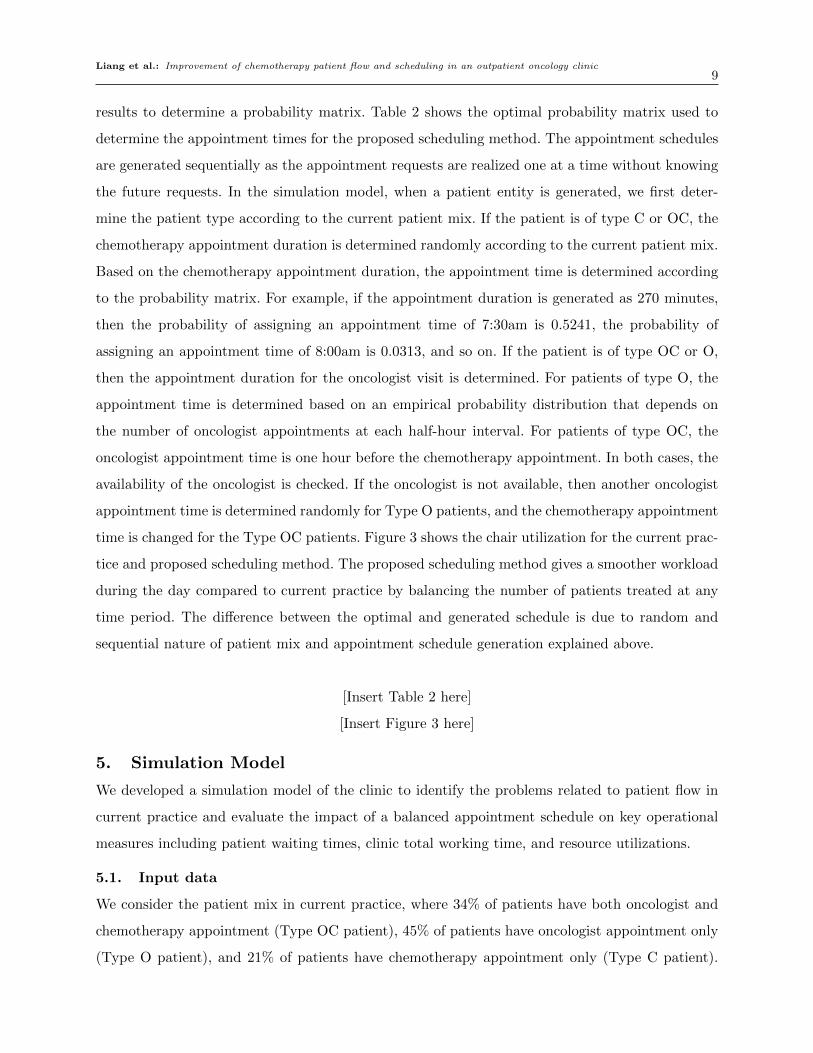
time is changed for the Type OC patients. Figure 3 shows the chair utilization for the current prac-
tice and proposed scheduling method. The proposed scheduling method gives a smoother workload
during the day compared to current practice by balancing the number of patients treated at any
time period. The difference between the optimal and generated schedule is due to random and
sequential nature of patient mix and appointment schedule generation explained above.
[Insert Table 2 here]
[Insert Figure 3 here]
5. Simulation Model
We developed a simulation model of the clinic to identify the problems related to patient flow in
current practice and evaluate the impact of a balanced appointment schedule on key operational
measures including patient waiting times, clinic total working time, and resource utilizations.
5.1. Input data
We consider the patient mix in current practice, where 34% of patients have both oncologist and
chemotherapy appointment (Type OC patient), 45% of patients have oncologist appointment only
(Type O patient), and 21% of patients have chemotherapy appointment only (Type C patient).

Liang et al.: Improvement of chemotherapy patient flow and scheduling in an outpatient oncology clinic10
The percentages of patients who need laboratory tests are 56%, 9% and 19% for Type OC, Type
O and Type C patients, respectively. The percentages of patients who need laboratory test and
have PORT access are 71%, 11%, and 83%, respectively.
We consider unpunctual arrivals and uncertain service times. Table 3 shows all the distributions
used in the simulation model. In order to determine the arrival times, the difference between the
appointment time and arrival time is calculated. However, since the patients who need lab tests
are asked to arrive one hour early to their appointment to have enough time for lab tests, we
fitted different arrival time distributions for each patient type. For example, the patients who have
oncologist appointment only (type O patients) and need lab test arrive on the average 72.9 minutes
early to their oncologist appointment.
[Insert Table 3 here]
The oncologist appointment and chemotherapy treatment durations might be longer or shorter
than the scheduled durations due to several reasons. For example, difficulty in intravenous (IV)
access or side effects of drugs might increase treatment durations. The side effects of chemotherapy
drugs might lead to cancellations after the treatment starts. To consider the actual durations in
the simulation model, we fitted distributions for the ratio between actual and scheduled durations.
We use different distributions for short infusions (treatment duration ≤ 60 minutes) and long
infusions (treatment duration > 60 minutes). For example, if a patient is scheduled for a 30-minute
chemotherapy treatment, the actual treatment duration will be 30×2.33×Beta(1.21,2.7) minutes.
That means, the actual treatment duration changes between zero and 70 minutes and the expected
value is 21.6 minutes (21.6 = 30× 2.33× 0.72 where 0.72 is the expected value for Beta(1.21,2.7))
for 30 minute appointments.
We included all other stages of the patient flow process including registration/check-in, taking
vitals, blood draw, lab turnover time, pharmacy time for drug preparation, and nursing time to
start and finish chemotherapy. In order to determine the service time distributions at these stages,
we collected data from the oncology information system, performed additional time studies and
received expert opinion. The clinic has 3 ASCs, 6 MAs, 12 oncologists, 2 pharmacists, 18 chairs and
9 full-time nurses. We assume the number of ASCs, MAs, oncologists, and pharmacists are fixed.
The number of nurses and chairs is considered as an experimental factor in the computational
study section.
Liang et al.: Improvement of chemotherapy patient flow and scheduling in an outpatient oncology clinic11
5.2. Discrete event simulation model
We used Anylogic simulation software to model the patient flow in the oncology clinic. The patients
are generated according to the current patient mix in the clinic as explained in Section 3.2. The
appointment times are determined based on the scheduling method. For the patients who have two
appointments, chemotherapy appointment time is determined first to reduce overtime. In current
practice, the schedulers leave a 30-minute gap between oncologist and chemotherapy appointments
(chemotherapy appointment time ≥ oncologist appointment time + oncologist appointment dura-
tion + 30 minutes).
For verification of the simulation model, we performed statistical analysis to compare the simu-
lation outputs with the real data. We took 100 replications for five days and compared the results
with the real data collected over five days. Table 4 shows the confidence intervals for the simulation
model and the real system data. The results show that there is no significant difference between
the results, which confirms the validity of the simulation model.
[Insert Table 4 here]
6. Computational study
We consider five experimental factors to show the impact of appointment scheduling on clinic
performance in a clinic environment with several complexities including multiple processes and
resources, unpunctual arrivals, delays, add-ons and cancellations. The factor levels can be seen in
Table 5. The first factor is the patient volume. In current practice, patient volume varies signifi-
cantly from day to day due to the treatment guidelines that should be followed strictly and lack of
advanced planning methods to provide a more balanced workload among days. Since the average
performance over all these varying patient volume scenarios would be misleading in determining
the best operational policies, the patient volume is used as an experimental factor, where 80, 100,
and 120 patients per day correspond to low, medium, and high volume days, respectively.
The second factor is the mean difference between appointment times and arrival times. In cur-
rent practice, the patients who need laboratory tests are asked to arrive one hour early for their
appointments. Based on our analysis, we also identified that other patients who do not need labo-
ratory test arrive 30 minutes early for their appointment. During data collection and the validation
phases of our study, we realized that the total time for initial check-in, vital signs, blood draw and
lab turnover was less than one hour. We thought a shorter time difference between appointment
time and arrival time would reduce the total patient waiting times. We consider three factor levels

Liang et al.: Improvement of chemotherapy patient flow and scheduling in an outpatient oncology clinic12
to determine the impact of the mean difference between appointment time and arrival times on
patient waiting times. The first factor level of (60, 30) corresponds to current practice. The second
factor level of (45, 15) and third factor level of (30, 5) assume patients who need laboratory test
arrive on the average 45 and 30 minutes early to the clinic, respectively. The other patients arrive
on the average 15 and 5 minutes early to the clinic, respectively. The main aim of choosing the
time difference between appointment time and arrival time as an experimental factor is to find the
best time difference so that the clinic managers can change their policy of asking the patient to
arrive one hour early for their appointment.
The third factor is the percentage of patients who need laboratory tests. This factor is important,
because the patients who need lab tests arrive to the clinic earlier and use additional resources
(MA or nurse for blood draw, lab technician for blood test), different than the other patients.
Although the chemotherapy protocols determine the need for laboratory tests, the patients might
choose to have the test at another location and have the results sent to the clinic. The percentage of
patients who need laboratory test might increase when patients prefer to have the test on the day
of appointment in the clinic. As more patients who need lab tests arrive to the clinic, it will cause
additional delays for other patients due to increased workload for MAs, nurses, and lab technicians.
The current percentages of patients who need tests are 55%, 9% and 19% for type OC, type O
and type C patients, respectively. We considered 20% and 40% increase with respect to current
percentages as the other factor levels.
[Insert Table 5 here]
The fourth factor is the appointment scheduling method and nurse schedules. In this study, our
aim is to show that better scheduling methods can improve patient flow by reducing patient waiting
times and clinic overtime. In order to compare the proposed scheduling appointment scheduling
method with current practice, we considered three factor levels. The first factor level corresponds
to the current practice. In current practice, staggered nurse schedules are used where nurses start
working at different times. According to the current appointment scheduling method used in the
clinic, less number of patients are scheduled in early morning hours, which shows that staggered
nurse schedules are taken into consideration. The second factor level, which uses the proposed
scheduling method and staggered nurse schedule, is chosen to show the impact of the proposed
appointment scheduling method alone. The proposed appointment scheduling method has the
potential to provide a more balanced workload throughout the day. However, when a staggered
nurse schedule is used, the number of available nurses should be considered in determining the

Liang et al.: Improvement of chemotherapy patient flow and scheduling in an outpatient oncology clinic13
optimal schedule. In order to match available number of nurses and chemotherapy appointments
in each time slot, less patients are scheduled in the early morning hours. The third factor level
with proposed scheduling method and non-staggered nurse schedule is chosen to show the impact
of changing the appointment scheduling method and nurse schedules together. The non-staggered
nurse schedule assumes same starting times for all nurses and the proposed appointment scheduling
method reduces the clinic total working time by scheduling more patients in the early morning
hours.
The fifth factor is the number of nurses and chairs for the chemotherapy treatment stage. The
clinic currently has 9 nurses and 18 chairs for chemotherapy patients. In most of the oncology
clinics, the number of nurses is adjusted based on patient volume. In order to show the importance
of determining the right staffing level, we use the number of nurses as an experimental design
factor. Even though the number of chairs does not change in a clinic, we assume it is not safe to
have the same number of patients with less number of nurses. Therefore, we consider the number
of staffed chairs instead of the actual number of chairs. The number of staffed chairs gives the
maximum number of patients that can simultaneously be treated with the available nurses without
compromising the safety of the patients. We consider 15 staffed chairs for 8 nurses and 18 staffed
chairs for 9 nurses in order to measure the impact of change in staffing level on clinic performance.
In a literature review paper by Jun, Jacobson, and Swisher (1999), it is mentioned that “effective
and efficient patient flow is indicated by high patient throughput, low patient waiting times, a short
length of stay at the clinic, and low clinic overtime, while maintaining adequate staff utilization
rates and low physician idle time”. In this study, patient waiting times, total time in system and
the total clinic working hours (which can be used to measure clinic overtime and the patient
throughput) are used as the performance measures. The improvement in patient flow is measured by
the amount of reduction in patient waiting time and total clinic working time. Patient waiting time
to see the provider, and for chemotherapy treatment are calculated with respect to appointment
time and arrival time. If a patient arrives early, the waiting time before the appointment time is
not included in the calculations. However, chemotherapy patients who need lab tests are asked to
arrive early for their appointments. They go through several processes and they wait between the
processes due to limited resources. Instead of just looking at the waiting times from appointment
time, we consider the total waiting time to show the importance of coordination between stages.
Total working time shows the difference between the time last patient leaves the system and the
clinic start time.

Liang et al.: Improvement of chemotherapy patient flow and scheduling in an outpatient oncology clinic14
6.1. Results
The simulation model is run for a single day and replicated 100 times for each factor combination,
resulting in 16200 (3× 3× 3× 3× 2× 100) simulation runs. We performed ANOVA to analyze
the main and interaction effects of all factors on the performance measures. The main effects of
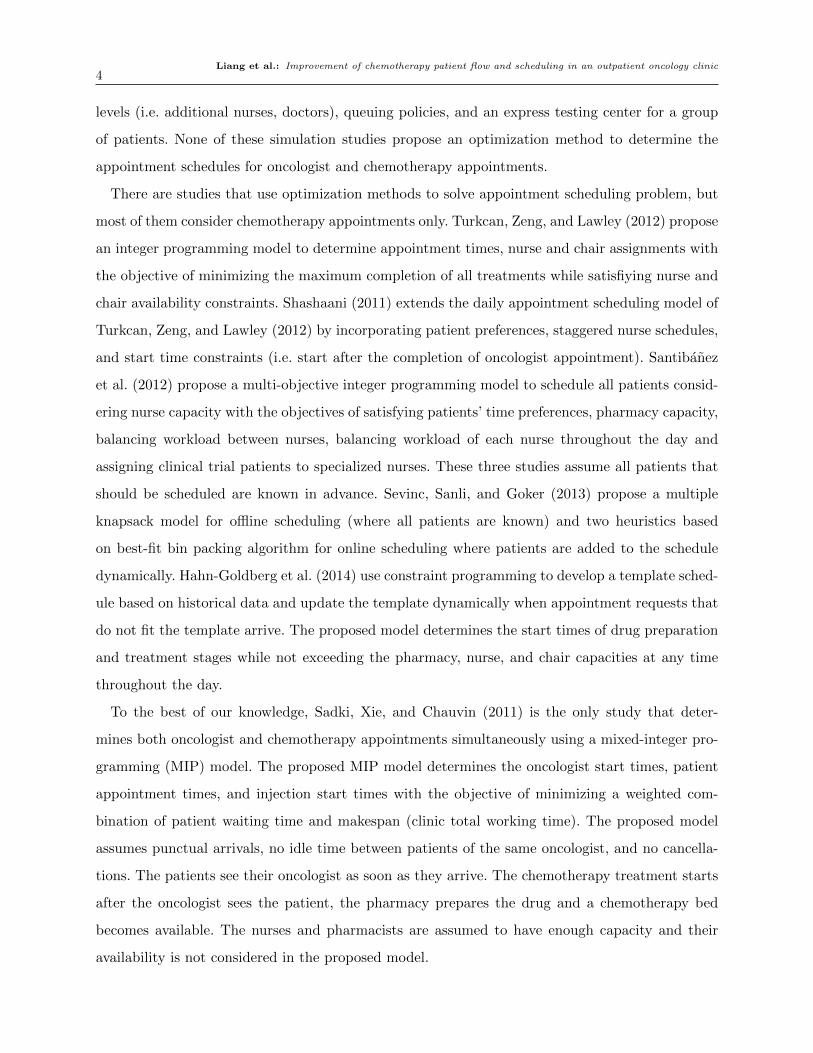
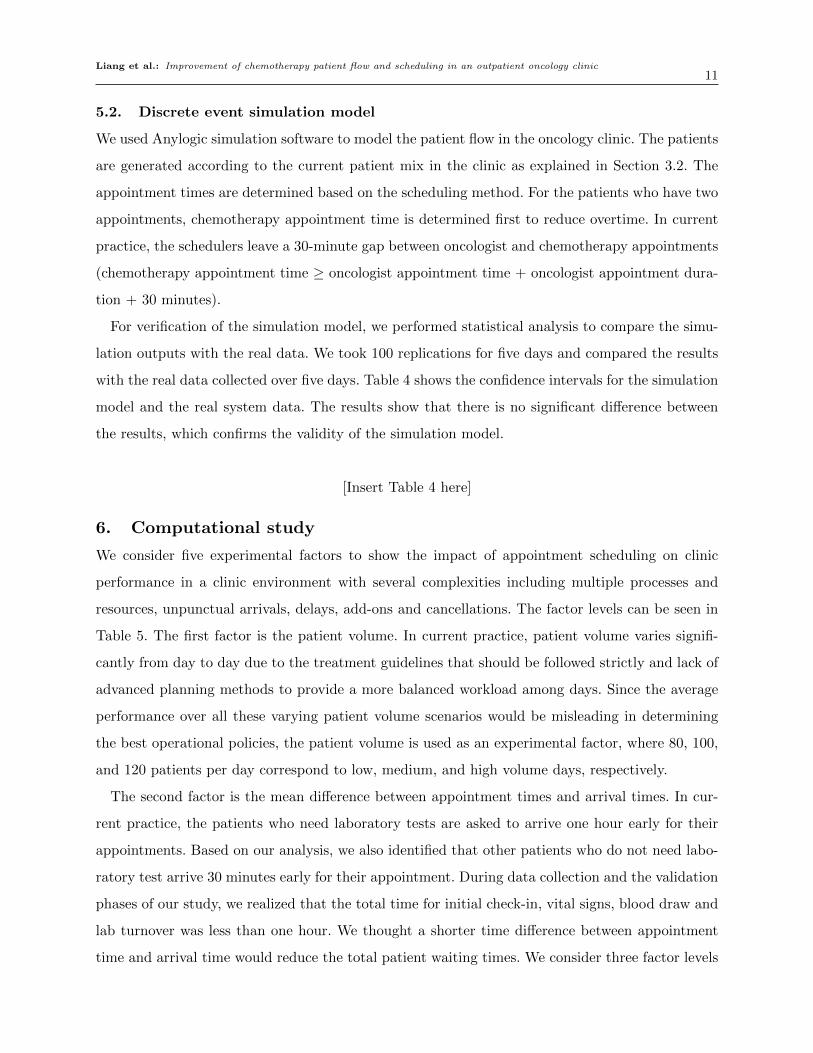
five factors are found to be significant for all performance measures. Figure 4 shows the selected
significant interaction effects on performance measures.
[Insert Figure 4 here]
Figures 4.a and 4.b show the interaction effect of scheduling method and patient volume on
total waiting time and total working time, respectively. The proposed scheduling method gives
lower patient waiting time compared to the current scheduling method. The effect of the proposed
scheduling method is more significant when the patient volume is high. That means, using a more
balanced schedule becomes more important especially when the workload is high. When the patient
volume is low (80 patients/day), the waiting times are close to each other for all scheduling methods.
The proposed scheduling method gives lower total working time compared to the current scheduling
method. The proposed scheduling method with staggered nurse schedule gives 21 minutes lower
total working time compared to the current method. The non-staggered nurse schedule gives 14
minutes lower total working time compared to the staggered nurse schedule since more patients
are scheduled in the early morning hours.
Figure 4.c shows the interaction plot between the scheduling method and the arrival times. The
proposed algorithm gives lower patient waiting time to see the provider compared to the current
practice. The same figure shows that the waiting time to see the provider is 15 minutes for the
patients who arrive (60, 30) minutes early to their appointment and it increases to 21 minutes
if they arrive (45, 15) minutes early. However, we would like to note that the waiting times are
calculated from the appointment time, and do not include the time from arrival to appointment
time. If we include the waiting time due to early arrival, the patients who arrive much earlier
than their appointment time would actually end up waiting more than other patients who arrive
later. For example, when the patients arrive (45, 15) minutes early, even though the waiting time
increases by 6 minutes (from 15 minutes to 21 minutes) compared to patients who arrive (60, 30)
minutes early, they save 15 minutes of waiting time, which results in 9 minutes lower waiting time.
The interaction plot between the arrival time and the laboratory test rate shows that the arrival
time is critical especially when more patients need laboratory tests (see Figure 4.d).
Liang et al.: Improvement of chemotherapy patient flow and scheduling in an outpatient oncology clinic15
Figures 4.e and 4.f show the effect of number of resources on total working time. When the
number of resources increases, the decrease in clinic total working time is higher for high patient
volume and high percentage of patients who need laboratory tests. Figures 4.g and 4.h show the
interaction effect of scheduling method and number of resources on waiting time for chemotherapy
treatment and total working time, respectively. When the clinic has less resources, the proposed
algorithm gives a higher improvement in patient waiting time for Type C patients compared to
current practice (7 minutes (22%) improvement for 15 chairs, 8 nurses, and 4 minutes (15%)
improvement with 18 chairs, 9 nurses). The effect of using the proposed scheduling algorithm
with staggered nurse schedule instead of current appointment schedule on total working hours is
higher when number of resources is high. The effect of using a non-staggered schedule instead of a
staggered schedule has a higher effect on total working time when number of resources is low.
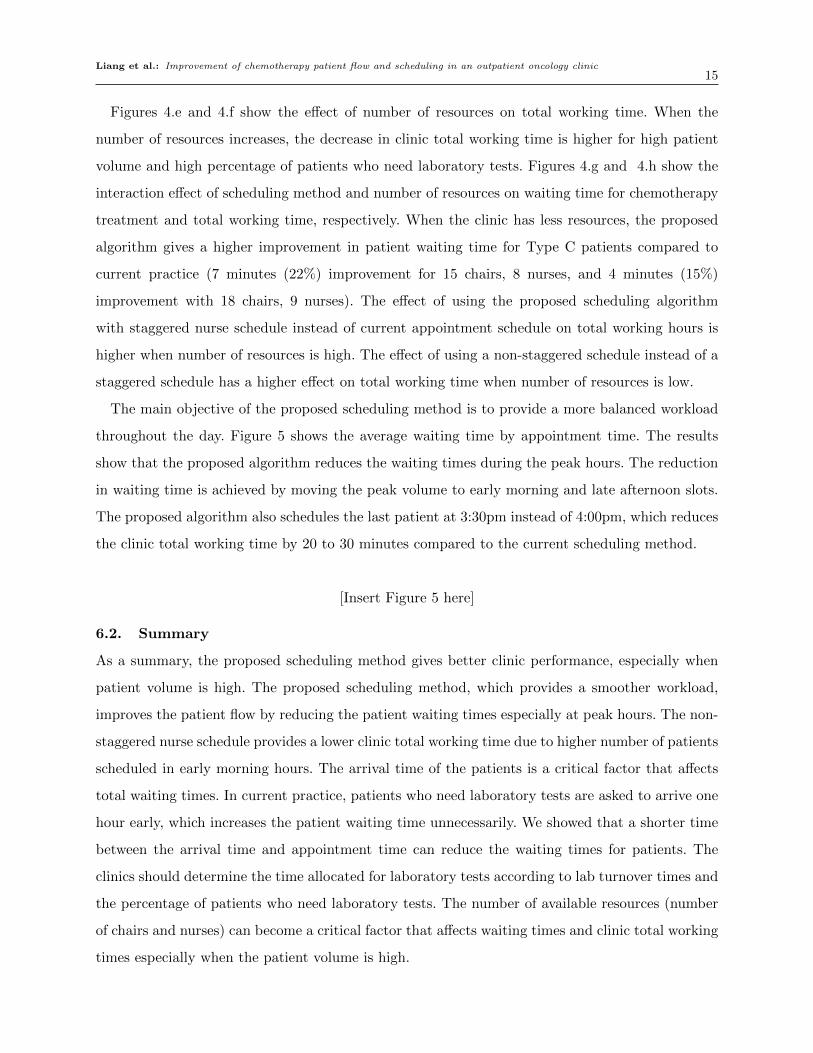
The main objective of the proposed scheduling method is to provide a more balanced workload
throughout the day. Figure 5 shows the average waiting time by appointment time. The results
show that the proposed algorithm reduces the waiting times during the peak hours. The reduction
in waiting time is achieved by moving the peak volume to early morning and late afternoon slots.
The proposed algorithm also schedules the last patient at 3:30pm instead of 4:00pm, which reduces
the clinic total working time by 20 to 30 minutes compared to the current scheduling method.
[Insert Figure 5 here]
6.2. Summary
As a summary, the proposed scheduling method gives better clinic performance, especially when
patient volume is high. The proposed scheduling method, which provides a smoother workload,
improves the patient flow by reducing the patient waiting times especially at peak hours. The non-
staggered nurse schedule provides a lower clinic total working time due to higher number of patients
scheduled in early morning hours. The arrival time of the patients is a critical factor that affects
total waiting times. In current practice, patients who need laboratory tests are asked to arrive one
hour early, which increases the patient waiting time unnecessarily. We showed that a shorter time
between the arrival time and appointment time can reduce the waiting times for patients. The
clinics should determine the time allocated for laboratory tests according to lab turnover times and
the percentage of patients who need laboratory tests. The number of available resources (number
of chairs and nurses) can become a critical factor that affects waiting times and clinic total working
times especially when the patient volume is high.

Liang et al.: Improvement of chemotherapy patient flow and scheduling in an outpatient oncology clinic16
7. Conclusion
A discrete event simulation model was developed to model the complex flow of chemotherapy
patients in oncology clinics. The model considers multiple patient classes with varying routings and
resource requirements, unpunctual arrivals, uncertainties in service and treatment durations, add-
ons, and cancellations. The model is used to evaluate the performance of a real clinic and to test
alternative operational decisions to improve system performance. Earlier simulation studies, which
proposed changing the arrival rates to have a smoother workload, did not develop any scheduling
method to find a schedule that considers the dependencies between oncologist and chemother-
apy appointments. We developed an optimization model to determine a coordinated appointment
schedule for oncology and infusion clinics. The proposed scheduling method determines the num-
ber of oncologist and chemotherapy appointments with the objective of minimizing the deviation
between low and high utilization time slots. The impact of the proposed scheduling method is tested
using the simulation model that incorporates several uncertainties of a real clinic environment.
The computational results showed that scheduling methods that aim to balance the workload
provides lower patient waiting times and clinic total working times. Using a better scheduling
method becomes more important especially when patient volume is high. The operational decisions
that are not determined based on the actual data can cause unnecessary waiting times. For example,
asking the patient to arrive one hour early can cause high waiting times, especially when the
lab turnover time is much less. The decrease in patient waiting times during peak hours and the
decrease in total clinic working time show the improvement in patient flow by using advanced
scheduling methods and operational decisions based on actual data.
We presented our results to clinic managers and they decided to implement the scheduling
method to reduce patient waiting times during peak hours. Currently, we are working on developing
a scheduling template as a guideline for the schedulers. The clinic managers also decided to do an
analysis of lab turnover times to understand the effect of patient volume throughout the day and
determine the optimal time that should be allocated for the patients who need laboratory tests to
minimize patient waiting times. The clinic also started scheduling the last patient half hour early
so that overtime can be reduced.
The operational difficulties in oncology clinics are common to any other healthcare system where
patients are seen in different departments/clinics on the same day and require a large number
of resources (physicians, nurses, pharmacists, technicians, medical assistants). Multiple patient
classes, varying patient routings, day-of-week and time of day differences in patient volume and
resource availabilities complicate the process of improving the efficiency of these multi-facility
Liang et al.: Improvement of chemotherapy patient flow and scheduling in an outpatient oncology clinic17
systems. This study is one of the few studies that considers all the complexities and uncertainties
that occur in multi-facility healthcare systems. As future research, the patient acuity levels and
their impact on nurse workload can be incorporated into the simulation models. Patient acuity is a
measure used to quantify the time and intensity of nursing care. For example, nurses allocate more
time to the patients who have higher probability of having side effects from the drugs. When the
patient shows allergic reactions to the drugs administered, the nurse might allocate all her time
to that patient while other patients assigned to that nurse are being monitored by other nurses.
The existing studies consider resources as “passive” objects and do not take into account the tasks
that should be performed by the nurses other than direct patient care. Studies that aim to find
the relationship between patient acuities and nurse workflow, and incorporating these into the
simulation models would be valuable contributions to the literature in determining the optimal
nurse-patient ratios. Another research area can focus on determining the best way of providing
care by comparing different nursing care models including primary nurse models and team-based
models.
Acknowledgement
We would like to thank the managers, providers, and staff of The Hematology and Oncology Clinic
of Lahey Hospital and Medical Center for their time and feedback during the project.
References
Ahmed, Z., T.Y. ElMekkawy, and S. Bates. 2011. “Developing an efficient scheduling template of
a chemotherapy treatment unit: A case study.” Australasian Medical Journal 4 (10): 575–588.
Baesler, F.F., and J.A. Sepulveda. 2001. “Multi-objective simulation optimization for a cancer
treatment center.” In Proceedings of the 2001 Winter Simulation Conference, edited by B.A.
Peters, J.S. Smith, D.J. Medeiros, and M.W. Rohrer. 1405–1411.
Chabot, G., and M. Fox. 2005. “The creation of a patient-classification system in an outpatient
infusion center setting.” Oncology Nursing Forum 32 (3): 535–538.
Gesell, S.B., and N. Gregory. 2004. “Identifying priority actions for improving patient satisfaction
with outpatient cancer care.” Journal of Nursing Care Quality 19 (3): 226–233.
Gruber, M., K. Kane, L. Flack, J. Abbotoy, J. Recchio, K. Williamson, K. Horan, and P. McCarthy.
2003. “A perfect day work redesign in a chemotherapy and infusion center.” Oncology Nursing
Forum 30 (4): 567–568.
Hahn-Goldberg, S., M.W. Carter, J.C. Beck, M. Trudeau, P. Sousa, and K. Beattie. 2014. “Dynamic
optimization of chemotherapy outpatient scheduling with uncertainty.” Health Care Manage-
ment Science (published online).

Liang et al.: Improvement of chemotherapy patient flow and scheduling in an outpatient oncology clinic18
Jun, J.B., S.H. Jacobson, and J.R. Swisher. 1999. “Application of discrete-event simulation in
health care clinics: A survey.” Journal of the Operational Research Society 50 (2): 109–123.
Matta, M.E., and S.S. Patterson. 2007. “Evaluating multiple performance measures across several
dimensions at a multi-facility outpatient center.” Health Care Management Science 10 (2): 173–
194.
Sadki, A., X. Xie, and F. Chauvin. 2011. “Appointment scheduling of oncology outpatients.” In
2011 IEEE Conference on Automation Science and Engineering (CASE), 513–518.
Santibanez, P., R. Aristizabal, M.L. Puterman, V.S. Chow, W. Huang, C. Kollmannsberger,
T. Nordin, N. Runzer, and S. Tyldesley. 2012. “Operations research methods improve chemother-
apy patient appointment scheduling.” Joint Commission Journal on Quality and Patient Safety
38 (12): 541–543.
Sepulveda, J.A., W.J. Thompson, F.F. Baesler, M.I. Alvarez, and L.E. Cahoon. 1999. “The use of
simulation for process improvement in a cancer treatment center.” In Proceedings of the 1999
Winter Simulation Conference, edited by P.A. Farrington, H.B. Nembhard, D.T. Sturrock, and
G.W. Evans. 1541–1548.
Sevinc, S., U.A. Sanli, and E. Goker. 2013. “Algorithms for scheduling of chemotherapy plans.”
Computers in Biology and Medicine 43 (12): 2103–2109.
Shashaani, S. 2011. “Chemotherapy patient scheduling and uncertainty.” Master’s thesis. Purdue
University.
Tanaka, T. 2013. “Infusion chair scheduling algorithms based on bin-packing heuristics.” Master’s
thesis. Binghamton University.
Turkcan, A., B. Zeng, and M. Lawley. 2012. “Chemotherapy operations planning and scheduling.”
IIE Transactions on Healthcare Systems Engineering 2 (1): 31–49.
Woodall, J.C., T. Gosselin, A. Boswell, M. Murr, and B.T. Denton. 2013. “Improving patient access
to chemotherapy treatment at Duke Cancer Institute.” Interfaces 43 (5): 449–461.
Yokouchi, M., S. Aoki, H. Sang, R. Zhao, and S. Takakuwa. 2012. “Operations analysis and appoint-
ment scheduling for an outpatient chemotherapy department.” In Proceedings of the 2012 Winter
Simulation Conference, edited by C. Laroque, J. Himmelspach, R. Pasupathy, O. Rose, and
A. M. Uhrmacher. 907–918.
Liang et al.: Improvement of chemotherapy patient flow and scheduling in an outpatient oncology clinic19
PT checks in with ASC at registration
desk
MA prepares PT’s chart while PT is in the waiting room
Need blood test?
Does patient have PORT?
Yes
NoDoes PT have
oncologist appointment?
PT’s blood is drawn in the lab by MA
No
PT’s blood is drawn in infusion room by
RN
Yes
Consultation with the
oncologist
Oncologist appt.
(Type OC & O)
RN picks up the drug
Chemotherapyappt.
(Type C)
Have chemotherapy
appt. followed?
Yes(Type OC)
Discharged
No(Type O)
Checked-In
In waiting room
PT’s vital signs are taken by MA
Vital signs done
Lab test done
Check out
RN notifies pharmacy to
prepare the drugs when the chair is
available
In exam room
PT goes back to waiting room to
wait for chemotherapyChemo waiting
Mix drug
Pharmacy prepares the drugs
Drug delivered
In infusion room
PT receives chemotherapy treatment in
infusion room
Vit
al s
ign
s an
d la
bR
egis
trat
ion
/ch
eck-
inC
on
sult
atio
nC
hem
oth
erap
y
PT waits for lab test results in the waiting
room
PT: patient;ASC: appointment scheduling coordinator;MA: medical assistant;RN: registered nurse;OC: oncologist and chemotherapy appointments;O: oncologist appointment only;C: chemotherapy appointment only.
Yes
No
Figure 1 Patient flow

Liang et al.: Improvement of chemotherapy patient flow and scheduling in an outpatient oncology clinic20
0"
0.02"
0.04"
0.06"
0.08"
0.1"
0.12"
0.14"
7:30"AM"
8:00"AM"
8:30"AM"
9:00"AM"
9:30"AM"
10:00"AM
"
10:30"AM
"
11:00"AM
"
11:30"AM
"
12:00"PM
"
12:30"PM
"
1:00"PM"
1:30"PM"
2:00"PM"
2:30"PM"
3:00"PM"
3:30"PM"
4:00"PM"
4:30"PM"
Percen
tage)of)a
ppointmen
ts)per)day)
Type"OC"appts." Type"O"appts."
0"
0.02"
0.04"
0.06"
0.08"
0.1"
0.12"
0.14"
7:30"AM"
8:00"AM"
8:30"AM"
9:00"AM"
9:30"AM"
10:00"AM
"
10:30"AM
"
11:00"AM
"
11:30"AM
"
12:00"PM
"
12:30"PM
"
1:00"PM"
1:30"PM"
2:00"PM"
2:30"PM"
3:00"PM"
3:30"PM"
4:00"PM"
4:30"PM"
Percen
tage)of)a
ppointmen
ts)per)day)
Type"OC"appts." Type"C"appts."
(a) (b)
0"
0.01"
0.02"
0.03"
0.04"
0.05"
0.06"
0.07"
7:30"AM"
8:00"AM"
8:30"AM"
9:00"AM"
9:30"AM"
10:00"AM
"
10:30"AM
"
11:00"AM
"
11:30"AM
"
12:00"PM
"
12:30"PM
"
1:00"PM"
1:30"PM"
2:00"PM"
2:30"PM"
3:00"PM"
3:30"PM"
Percen
tage)of)a
ppointmen
ts)per)day)
Type"OC"appts" Type"O"appts"
0"
0.01"
0.02"
0.03"
0.04"
0.05"
0.06"
0.07"
7:30"AM"
8:00"AM"
8:30"AM"
9:00"AM"
9:30"AM"
10:00"AM
"
10:30"AM
"
11:00"AM
"
11:30"AM
"
12:00"PM
"
12:30"PM
"
1:00"PM"
1:30"PM"
2:00"PM"
2:30"PM"
3:00"PM"
3:30"PM"
Percen
tage)of)a
ppointmen
ts)per)day)
Type"OC"appts" Type"C"appts"
(c) (d)
Figure 2 Distribution of appointment times for each patient type; a) oncologist appointment times for current
practice, b) chemotherapy appointment times for current practice, c) proposed oncologist appointment
times, and d) proposed chemotherapy appointment times
NCid Total number of patients of type i with chemotherapy appointment duration d (i =OC,C)NOjd Total number of patients of type j with oncologist appointment duration d (j =OC,O)T Total number of slots in the planning horizonRt Number of nurses available at time slot tPt Number of physicians available at time tF Number of chairss Slack time required between oncologist and chemotherapy appointmentsxidt Number of patients of type i with appointment duration d scheduled to start chemotherapy at time tyjdt Number of patients of type j with appointment duration d scheduled to start oncologist visit at time tct Number of chairs occupied at time slot tot Number of exam rooms occupied at time slot t
Table 1 Notation

Liang et al.: Improvement of chemotherapy patient flow and scheduling in an outpatient oncology clinic21
Time 30 60 90 120 150 180 210 240 270 300 330 360 390
7:30 AM 0.0006 0.0023 0.0000 0.0000 0.1216 0.2046 0.0079 0.3137 0.5241 0.1686 0.0276 0.0266 0.0498
8:00 AM 0.0387 0.0024 0.0000 0.0017 0.0082 0.0111 0.0079 0.2049 0.0313 0.2088 0.0406 0.2650 0.9502
8:30 AM 0.0843 0.0024 0.0000 0.0017 0.0082 0.0104 0.0032 0.0523 0.0006 0.1766 0.1543 0.2488
9:00 AM 0.0868 0.0024 0.0000 0.0003 0.0076 0.0042 0.0538 0.0529 0.0015 0.1185 0.2744 0.2492
9:30 AM 0.0907 0.0024 0.0000 0.0203 0.0002 0.0033 0.0466 0.0295 0.0680 0.1153 0.2539 0.2105
10:00 AM 0.0930 0.0024 0.0000 0.0207 0.0000 0.0038 0.0551 0.0522 0.0682 0.1038 0.2490
10:30 AM 0.1039 0.0022 0.0000 0.0158 0.0017 0.0035 0.0398 0.0238 0.0748 0.1070 0.0001
11:00 AM 0.0476 0.0095 0.0001 0.0583 0.0098 0.0916 0.1014 0.2084 0.2243 0.0015
11:30 AM 0.0929 0.0211 0.0000 0.0422 0.0396 0.0368 0.0581 0.0617 0.0073
12:00 PM 0.0611 0.0864 0.0000 0.0805 0.1505 0.1928 0.1754 0.0007
12:30 PM 0.0491 0.0742 0.0000 0.0691 0.1413 0.1613 0.4423
1:00 PM 0.0744 0.0526 0.0670 0.0579 0.1885 0.2614 0.0086
1:30 PM 0.0749 0.1159 0.0733 0.0000 0.3137 0.0154
2:00 PM 0.0051 0.0216 0.0000 0.6279 0.0092
2:30 PM 0.0226 0.1801 0.8517 0.0038
3:00 PM 0.0315 0.4197 0.0079
3:30 PM 0.0429 0.0026
Table 2 Chemotherapy appointment time vs. duration
0"
0.2"
0.4"
0.6"
0.8"
1"
7:30"AM"
8:00"AM"
8:30"AM"
9:00"AM"
9:30"AM"
10:00"AM
"
10:30"AM
"
11:00"AM
"
11:30"AM
"
12:00"PM
"
12:30"PM
"
1:00"PM"
1:30"PM"
2:00"PM"
2:30"PM"
3:00"PM"
3:30"PM"
4:00"PM"
4:30"PM"
5:00"PM"
Number'of'chairs'occupied'(propor2on)'
Current"prac:ce"
Op:mal"schedule"
Generated"schedule"based"on"op:mal"probability"matrix"
Figure 3 Number of chairs occupied during the day (proportion over all chairs)

Liang et al.: Improvement of chemotherapy patient flow and scheduling in an outpatient oncology clinic22
Processes Distribution Fitted/Expert OpinionArrival time − appointment time
Type OC patient with lab −Normal(63, 44) Fitted (p=0.0484)Type OC patient without lab −Normal(50, 54) Fitted (p=0.133)Type O patient with lab −Normal(73, 42) Fitted (p>0.15)Type O patient without lab −Normal(29, 41) Fitted (p=0.015)Type C patient with lab −Normal(60, 31) EstimatedType C patient without lab −Normal(19, 60) Fitted (p=0.0139)
Actual / scheduled durationOncologist appointment Lognormal(0.068, 0.502) p>0.15Chemotherapy (scheduled ≤ 60 min) 2.33 * Beta(1.21, 2.7) p>0.15Chemotherapy (scheduled > 60 min) 1.57 * Beta(1.25, 1.6) p>0.15
Other service timesCheck-in Triangular (0.5, 1, 2) Expert opinionTime to get the chart ready Lognormal (1.019, 0.716)−2.5 Fitted (adjusted) (p=0.267)Taking vital signs Triangular(3, 5, 10) Expert opinionBlood draw in lab Erlang(3.98, 2)+0.5 Fitted (p=0.024)Blood draw in infusion room Triangular(2.5, 11.6, 36.5) Fitted (p>0.75)Lab turnover time Triangular(5, 15, 30) Expert opinionRN assesses patient condition Triangular(1, 2, 10) Expert opinionPharmacy time Weibull(10.5, 1.42)−1.5 Fitted (adjusted) (p>0.75)RN starts chemo (new patient) Triangular(25, 30, 45) Expert opinionRN starts chemo (established patient) Triangular(5, 10, 15) Expert opinionRN finishes chemo Triangular(2, 5, 10) Expert opinion
Table 3 Distribution functions used in the simulation model
Performance measures Actual SimulatedMean 95% CI Mean 95% CI
Waiting time to see the provider (oncologist) 11.70 [10.06, 13.35] 11.71 [11.49, 11.93]Waiting time for treatment (Type OC) 11.18 [7.59, 14.77] 8.49 [8.20, 8.79]Waiting time for treatment (Type C) 19.07 [12.86, 25.28] 20.49 [19.94, 21.04]Time in system 132.23 [121.47, 142.76] 123.46 [121.57, 125.36]
Table 4 Comparison of actual data with simulation output
Factors Level I Level II Level IIIPatient volume 80 patients/day 100 patients/day 120 patients/dayMean difference between appointmenttime and arrival time
(60, 30) minutes (45, 15) minutes (30, 5) minutes
(patients with lab, patients without lab)Percentage of patients who need lab test Current rate 20% increase 40% increaseAppointment scheduling method (AS) Current AS Proposed AS Proposed ASNurse schedule (NS) Staggered NS Staggered NS Non-staggered NSNumber of chairs and nurses 15 chairs, 8 nurses 18 chairs, 9 nurses
Table 5 Experimental factors

Liang et al.: Improvement of chemotherapy patient flow and scheduling in an outpatient oncology clinic23
Proposed ASNon-staggered NS
Proposed AS Staggered NS
Current AS Staggered NS
65
60
55
50
45
40
Schedule
Mea
n (m
inut
es)
80 Pt./day100 Pt./day120 Pt./day
Volume
Interaction plot for total waiting timeData Means
Proposed ASNon-staggered NS
Proposed AS Staggered NS
Current AS Staggered NS
710
700
690
680
670
660
650
640
630
Schedule
Mea
n (m
inut
es)
80 Pt./day100 Pt./day120 Pt./day
Volume
Interaction plot for clinic total working timeData Means
(a) (b)
Proposed ASNon-staggered NS
Proposed AS Staggered NS
Current AS Staggered NS
26
24
22
20
18
16
14
12
Schedule
Mea
n (m
inut
es)
(30,5)(45,15)(60,30)
Arrval
Interaction plot for waiting time to see the providerData Means
(c) (d)
(18,9)(15,8)
700
690
680
670
660
650
640
Number of chairs and nurses
Mea
n (m
inut
es)
80 Pt./day100 Pt./day120 Pt./day
Volume
Interaction plot for clinic total working timeData Means
(18,9)(15,8)
680
675
670
665
660
Number of chairs and nurses
Mea
n (m
inut
es)
+0%+20%+40%
Lab
Interaction plot for clinic total working timeData Means
(e) (f)
Proposed ASNon-staggered NS
Proposed AS Staggered NS
Current AS Staggered NS
690
680
670
660
650
640
Schedule
Mea
n (m
inut
es)
(15,8)(18,9)
nurseschairs andNumber of
Interaction plot for clinic total working timeData Means
(g) (h)
Figure 4 Two-way interaction effect of experimental factors on patient waiting time and total clinic working
time

Liang et al.: Improvement of chemotherapy patient flow and scheduling in an outpatient oncology clinic24
0
10
20
30
40
50
60
70
80
90
100
Ave
rage
tot
al w
aiti
ng ti
me
(mim
utes
)
80 Pt./day
100 Pt./day
120 Pt./day
Current appointment scheduling with staggered
nurse schedule
Proposed appointment scheduling method with
staggered nurse schedule
Proposed appointment scheduling method with
non-staggered nurse schedule
Figure 5 Average total waiting time by appointment time


![[hal-00521712, v1] A Survey of Pipelined Workflow Scheduling: …€¦ · A Survey of Pipelined Work ow Scheduling: Models and Algorithms 3 (such as SmartKiosk [KRC + 99], a computerized](https://img.dokumen.tips/doc/110x75/5f9e17a285657e6ce80bf9ec/hal-00521712-v1-a-survey-of-pipelined-workflow-scheduling-a-survey-of-pipelined.jpg)


![Antiangiogenic Scheduling of Chemotherapy Improves ...[CANCER RESEARCH 60, 1878–1886, April 1, 2000] Antiangiogenic Scheduling of Chemotherapy Improves Efficacy against Experimental](https://img.dokumen.tips/doc/110x75/5f0d25fa7e708231d438e9b7/antiangiogenic-scheduling-of-chemotherapy-improves-cancer-research-60-1878a1886.jpg)