Embed Size (px)
Citation preview

Improvement and validation of
dynamical malaria models in Africa
Inaugural - Dissertation
zur
Erlangung des Doktorgrades
der Mathematisch-Naturwissenschaftlichen Fakultät
der Universität zu Köln
vorgelegt von
Edmund Ilimoan Yamba
aus Saboba, Ghana
Köln 2016

Berichterstatter (Gutachter): Prof. Dr. Bülent Tezkan (Vorsitzender)Prof. Dr. Susanne CrewellProf. Dr. Andreas H. FinkProf. Dr. Adrian P. TompkinsDr. Volker Ermert (Beisitzer)
Tag der mündlichen Prüfung: 25. October 2016
i

AbstractOvercoming the serious public health burden of malaria in Africa especially the sub-Saharan Africa requires a detailed understanding of malaria epidemiology in the re-gion. To contribute to this effect, this work embarked on several research steps.The first part of this study investigated the impact of climatic and environmental factorson seasonal malaria transmission in the Africa. Monthly Entomological InoculationRate (EIRm) data initially gathered from different malaria locations across the regionvia a literature review was utilized for this purpose. The results revealed that rain-fall was the primary climatic determinant of malaria seasonality at markedly seasonalrainfall areas such as Sahel and Eritrea. But its impact at bimodal rainfall distributedand more humid zones was more complex. Temperature was not a limiting factor ofmalaria seasonality in Africa except for East Africa where it can delay the impact ofrainfall. The seasonal peaking characteristics malaria were mostly unimodal. At zonescharacterised by bimodal rainfall distributions, the peaks were frequently associatedwith the first rainfall maximum of the year. Seasonal malaria intensity anti-correlatedwith elevation and population density. Though seasonal malaria transmission is drivenmainly by An. gambiae, An funestus and An. arabiensis, the vectors had competingand complex individual impact on seasonality. The findings of this section have im-portant implications for the disease control especially the spatial and temporal targetof malaria interventions and resource allocation. Besides, it provides information re-garding future malaria modelling efforts and the validation and evaluation of existingweather-driven malaria models.The second part of the study validated seasonal malaria transmission in Africa sim-ulated by two malaria models using the observed EIRm data. The models includethe 2010 version of the Liverpool Malaria Model (LMM2010) and the VECtor-bornedisease community model of the international centre for theoretical physics,TRIeste(VECTRI). The goal was to determine the accuracy of both models in simulating sea-sonal malaria transmission in Africa. The validation revealed that LMM2010 and VEC-TRI error ranges were generally within or about the same as the standard deviationof the observed EIRm data though larger errors were detected for Guinea and someindividual monthly minor differences. Both models also agreed with observations thatthe seasonal peaking behaviour of malaria was predominantly unimodal. However,transmission peaks in the models tend to be delayed by one month in the Sahel andEritrea area. Both models further agreed with observed values of a seasonality indexthat the seasonal malaria transmission contrast is closely linked with the latitudinalvariation of climatic covariates such as rainfall in Africa. VECTRI revealed a strongerability in capturing the levels of malaria endemicity in East Africa than LMM2010. Thehydrology model in VECTRI poorly captures seasonal malaria transmission at perma-nent water body locations. Though both models had loopholes, inferences from thevalidation conclude that they could realistically reproduce the seasonal evolution ofthe disease in Africa as a function of climate and environment. The findings, therefore,
ii
provides the basis for further review and refinement of the models by their developersto stage them as best fundamental tools for seasonal malaria prediction.In the third part of this work, a formulated simple model of immunity to malaria andincorporated into VECTRI was evaluated. Also, the section performed a one-at-a-time sensitivity study of VECTRI parameter settings to its output variability. The re-sults revealed that the immunity model enabled VECTRI to simulate different levels ofmalaria for Africa by reducing transmission rates at increased exposure of humans tomalaria. The simple immunity model also substantially improved the seasonal malariasimulations of VECTRI by reducing its output error. The one-at-a-time sensitivityanalysis performed on VECTRI parameter settings revealed parameters showing thestrongest variation of the model output. The most sensitive parameter settings con-sisted of survival probabilities (i.e. adult vector and larval survival), threshold temper-atures (i.e. minimum temperature for larval survival and that for the sporogonic cycle),degree days (i.e. larvae growth), and hydrological components (i.e. total evaporationand infiltration losses). The new immunity model represents a helpful tool for futuremalaria modelling effort, and its refinement for consideration in VECTRI is necessary.Parameters contributing most to VECTRI output variability require additional researchto strengthen knowledge base to reduce VECTRI output uncertainty.
iii

ZusammenfassungNur ein besseres Verständnis der Malariaepidemiologie südlich der Sahara wird es er-möglichen die ernsthafte Belastung der öffentlichen Gesundheit durch diese Krankheitzu überwinden. Die vorliegende Doktorarbeit soll dazu einen Beitrag leisten, indemsie die Malariasaison genauer untersucht. Analysiert wird sowohl die Bedeutung vonklimatischen und umgebungsbedingten Antrieben als auch der Einfluss durch unter-schiedliche Mückenarten. Außerdem validiert und analysiert sie wetterangetriebene,dynamisch-mathematische Malariamodelle, welche realistische Simulationen von epi-demiologischen Malariacharakteristika erstellen.Diese erste Studie dieser Arbeit untersucht den Einfluss von klimatischen und umge-bungsbedingten Faktoren auf die saisonale Verteilung der Malariaübertragung. Hier-für wurde zunächst die Literatur in Bezug auf monatliche Werte der entomologischeInokulationsrate (EIRm) ausgewertet. Die EIRm-Werte wurden für unterschiedlicheMalariastandorte innerhalb von Subsahara-Afrika zusammengetragen. Für Gebiete mitstark saisonalen Regenfällen hat der Niederschlag den größten klimatischen Einflussauf die Malariasaison. Für Gebiete, die eine bimodale Regenverteilung aufweisen undfeuchter sind, ist der Einfluss komplex. Die Temperatur stellt in Subsahara-Afrikabis auf Ausnahme von Ostafrika keinen limitieren Faktor für die Malariaverbreitungdar. Die Analyse der Spitzen der saisonalen Malariaübertragung zeigt, dass meistunimodale Verteilungen auftreten. Bei bimodaler Niederschlagsverteilung steht dieSpitze in der Malariaübertraugung oft in Verbindung mit dem ersten Regenmaximumdes Jahres. Die Intensität der Malariasaison ist antikorrelliert mit der Höhenlage undBevölkerungsdichte. Obgleich die Malariasaison meist durch An. gambiae, An funes-tus und An. arabiensis bestimmt wird, besitzen diese Vektoren einen konkurrierenden,komplexen und individuellen Einfluss auf die Saisonalität. Trotzdem die verwende-ten Daten einige Unsicherheiten aufweisen hat der erste Teil der vorliegende Arbeitwichtige Implikationen für die zeitliche und räumliche Durchführung von Malari-abekämpfungsmaßnahmen und das zur Verfügung stellen von Ressourcen. Die er-ste Studie hält ebenfalls Informationen in Bezug auf die Validierung und Bewertungvon wetterangetriebenen Malariamodellen und für zukünftige Malariamodellierungenbereit.Die zweite Studie validiert die Ausgabe des LMM2010 (Engl.: “2010 version of the Liv-erpool Malaria Model) und von VECTRI (Engl. “VECtor-borne disease communitymodel of the international centre for theoretical physics,TRIeste”). Die Validierungzeigt, dass die Modelle auf der Basis von Klima- und Umgebungsvariablen in der Lagesind eine realistische Malariasaison zu simulieren. Die Fehler von LMM2010 und VEC-TRI bewegen sich meist innerhalb der Standardabweichung der Beobachtungsdaten.Allerdings wurden für Guinea größere Fehler ausfindig gemacht and es traten ebenfallskleinere Abweichungen für individuelle Monate auf. Die Charakteristika der Malari-aübertragungsspitzen stimmen bei beiden Modellen mit den Beobachtungen überein,bei denen hauptsächlich unimodale Verteilungen auftraten. Die simulierten Spitzen in
iv

der Malariaübertragung treten für den Sahel und Eritrea meist einen Monat später aufals beobachtet. Die Modelle simulieren in etwa den gleichen Malariasaisonalitätsindexwie beobachtet. Letzterer hängt stark von der geographischen Breite und klimatischenKovariaten wie dem Niederschlag ab. VECTRI trifft die Malariaverhältnisse für Gebi-ete mit permanentem Wasserangebot nicht sehr gut. Insgesamt zeigen aber die Ergeb-nisse der zweiten Studie, dass beide Modelle in der Lage sind für Subsahara-Afrikarealistische saisonale Malariaübertragungsraten zu simulieren. Diese Studie lieferteine Grundlage für weitere Revisionen und Verbesserungen dieser wetterangetriebe-nen Modelle, wodurch Werkzeuge entstehen könnten, die eine Malariavorhersage er-möglichen.Ein neues einfaches Immunitätsmodul von VECTRI wurde abschließend in der drit-ten Studie der Doktorarbeit untersucht. Dieses Modul ermöglicht VECTRI unter-schiedliche Malarianiveaus für Subsahara-Afrika zu simulieren indem die Malariaüber-tragung reduziert wird, falls Menschen stark der Malaria ausgesetzt sind. Dieses ein-fache Immunitätsmodul war in der Lage den Modellfehler von VECTRI in Bezug aufsaisonale Malariaübertragungsraten zu verkleinern. Eine Sensitivitätsanalyse wurdefür die Modellparameter von VECTRI durchgeführt, wobei für jeden Modelllauf im-mer nur ein Parameter geändert wurde. Die am stärksten sensitiven Parameter stellenÜberlebenswahrscheinlichkeiten (Mücken und Larven), Schwellwerttemperaturen (Min-imaltemperatur für das Larvenüberleben und für den sporogonischen Zyklus), Grad-tage (Larvenentwicklung) und hydrologische Komponenten (Verdunstungs- und Infil-trationsparameter) dar. Die letzte Studie zeigt, dass dieses einfache Immunitätsmodulein hilfreiches Werkzeug darstellt und dass dieses weiter verbessert werden sollte.Darüber hinaus informiert dieser Teil der Arbeit über weitere Modellparameter, dieeingehender erforscht werden müssen.
v

Contents
Acronyms 1
1 Introduction 2
1.1 The research background . . . . . . . . . . . . . . . . . . . . . . . . 2
1.2 Statement of the Problem . . . . . . . . . . . . . . . . . . . . . . . . 3
1.3 Research questions . . . . . . . . . . . . . . . . . . . . . . . . . . . 4
1.4 Objectives . . . . . . . . . . . . . . . . . . . . . . . . . . . . . . . . 4
1.5 Organization of the thesis . . . . . . . . . . . . . . . . . . . . . . . . 5
2 Literature review 6
2.1 Malaria and the Plasmodium parasite . . . . . . . . . . . . . . . . . . 6
2.1.1 The genus Plasmodium life cyle . . . . . . . . . . . . . . . . 6
2.1.2 Epidemiology and burden of malaria . . . . . . . . . . . . . . 7
2.2 Malaria transmission drivers . . . . . . . . . . . . . . . . . . . . . . 9
2.2.1 Vector species . . . . . . . . . . . . . . . . . . . . . . . . . . 9
2.2.2 Meteorological factors . . . . . . . . . . . . . . . . . . . . . 10
2.2.3 Environmental factors . . . . . . . . . . . . . . . . . . . . . 10
2.2.4 Human factors . . . . . . . . . . . . . . . . . . . . . . . . . 12
2.3 Entomological metrics for malaria transmission . . . . . . . . . . . . 13
2.3.1 Human Biting Rate . . . . . . . . . . . . . . . . . . . . . . . 13
2.3.2 CircumSporozoite Protein Rate . . . . . . . . . . . . . . . . 14
2.3.3 Entomological Inoculation Rate . . . . . . . . . . . . . . . . 14
vi

2.4 Weather-driven dynamical mathematical malaria models . . . . . . . 15
3 Impact of climate and environment on seasonal malaria transmission 17
3.1 Background . . . . . . . . . . . . . . . . . . . . . . . . . . . . . . . 17
3.2 Materials and methods . . . . . . . . . . . . . . . . . . . . . . . . . 19
3.2.1 Materials . . . . . . . . . . . . . . . . . . . . . . . . . . . . 19
3.2.2 Methods . . . . . . . . . . . . . . . . . . . . . . . . . . . . 21
3.3 Results . . . . . . . . . . . . . . . . . . . . . . . . . . . . . . . . . . 22
3.4 Discussion . . . . . . . . . . . . . . . . . . . . . . . . . . . . . . . . 25
3.5 Summary and conclusions . . . . . . . . . . . . . . . . . . . . . . . 31
4 Validation of LMM2010 and VECTRI 33
4.1 Background . . . . . . . . . . . . . . . . . . . . . . . . . . . . . . . 33
4.2 Data and methods . . . . . . . . . . . . . . . . . . . . . . . . . . . . 34
4.2.1 Data . . . . . . . . . . . . . . . . . . . . . . . . . . . . . . . 34
4.2.2 Methods . . . . . . . . . . . . . . . . . . . . . . . . . . . . 35
4.3 Results . . . . . . . . . . . . . . . . . . . . . . . . . . . . . . . . . . 37
4.4 Discussion . . . . . . . . . . . . . . . . . . . . . . . . . . . . . . . . 43
4.5 Summary and conclusions . . . . . . . . . . . . . . . . . . . . . . . 48
5 Modelling immunity to malaria and VECTRI parameter sensitivity 50
5.1 Background . . . . . . . . . . . . . . . . . . . . . . . . . . . . . . . 50
5.2 Methods . . . . . . . . . . . . . . . . . . . . . . . . . . . . . . . . . 51
5.2.1 Brief description of VECTRI . . . . . . . . . . . . . . . . . . 51
5.2.2 Modelling immunity to malaria . . . . . . . . . . . . . . . . 52
5.2.3 Evaluation of the immunity model . . . . . . . . . . . . . . . 55
5.3 Sensitivity of VECTRI parameter settings . . . . . . . . . . . . . . . 55
5.4 Results and discussion . . . . . . . . . . . . . . . . . . . . . . . . . 56
5.4.1 The simple immunity model . . . . . . . . . . . . . . . . . . 56
vii

5.4.2 Sensitivity test . . . . . . . . . . . . . . . . . . . . . . . . . 60
5.5 Summary and conclusions . . . . . . . . . . . . . . . . . . . . . . . 62
6 Conclusions and recommendations 63
6.1 Summary and discussions . . . . . . . . . . . . . . . . . . . . . . . . 63
6.2 Study weakness . . . . . . . . . . . . . . . . . . . . . . . . . . . . . 65
6.3 Conclusions and study significance . . . . . . . . . . . . . . . . . . . 65
6.4 Recommendations and future outlook . . . . . . . . . . . . . . . . . 66
A Appendix 68
A.1 Categorization of data locations . . . . . . . . . . . . . . . . . . . . 68
A.2 Observed EIRm data uncertainties . . . . . . . . . . . . . . . . . . . 69
Bibliography 73
viii

List of Tables
3.1 Number of locations and data amount at each climate zone . . . . . . 19
4.1 EIR Seasonality Index . . . . . . . . . . . . . . . . . . . . . . . . . 36
5.1 VECTRI default parameters and their dimensions . . . . . . . . . . . 56
A.1 Malaria locations and their characteristics . . . . . . . . . . . . . . . 71
A.2 Table A.1 continuou . . . . . . . . . . . . . . . . . . . . . . . . . . . 72
ix

List of Figures
2.1 The life cycle of the genus Plasmodium parasite . . . . . . . . . . . . 6
2.2 Projected changes in malaria incidence rates by country, 2000–2015 . 8
2.3 The distribution of three most dominant malaria vectors in Africa . . . 9
3.1 Geographical distribution of data locations in sub-Saharan Africa . . . 20
3.2 Annual distribution of the number of EIRm observations . . . . . . . . 21
3.3 Seasonality of observed EIRm compared with rainfall and temperatureover sub-Saharan Africa . . . . . . . . . . . . . . . . . . . . . . . . 23
3.4 Peak characteristics of EIRm over sub-Saharan Africa . . . . . . . . . 24
3.5 Cross correlation between EIRm and rainfall . . . . . . . . . . . . . . 25
3.6 Comparism of EIRm seasonality at different elevations . . . . . . . . 26
3.7 Seasonality of EIRm at different population density settings . . . . . . 26
3.8 Comparison of EIRm seasonality at different settings of hydrology . . 27
3.9 Geographical distribution and sympatric association of malaria vectors 28
3.10 Seasonal patterns of EIRm from three dominant malaria vectors . . . . 28
4.1 Monthly MAE of LMM2010 and VECTRI . . . . . . . . . . . . . . . 38
4.2 Monthly MBE of LMM2010 and VECTRI . . . . . . . . . . . . . . . 39
4.3 Seasonal peaking behaviour of EIRmm over sub-Saharan Africa . . . . 40
4.4 EIR peak months at unimodal distributed areas . . . . . . . . . . . . 41
4.5 Peak months at bimodal EIR distributed areas . . . . . . . . . . . . . 41
4.6 Distribution of EIR Seasonality Index with latitude . . . . . . . . . . 42
4.7 Malaria endemicity in East Africa . . . . . . . . . . . . . . . . . . . 43
x

4.8 Cross correlation between VECTRI simulated EIRm and rainfall com-pared to observed . . . . . . . . . . . . . . . . . . . . . . . . . . . . 44
4.9 Cross correlation between LMMm simulated EIRm and rainfall com-pared to observed . . . . . . . . . . . . . . . . . . . . . . . . . . . . 45
4.10 VECTRI simulated EIRm for different settings hydrology . . . . . . . 46
5.1 The structural layout of VECTRI model . . . . . . . . . . . . . . . . 52
5.2 Schematic diagram of the simple immunity model . . . . . . . . . . . 53
5.3 Simulated annual malaria cases and EIRa for sub-Saharan Africa . . . 57
5.4 Sensitivity of immunity parameter settings to seasonal malaria outcome 59
5.5 Mean Absolute Error of model simulated EIRm to the observed . . . . 60
5.6 Sensitivity of VECTRI simulated EIRa to its parameters settings . . . 61
xi

AcronymsEIR Entomological Inoculation Rate . . . . . . . . . . . . . . . 3
EIRm monthly Entomological Inoculation Rate. . . . . . . . . . . 3
LMM2010 2010 version of the Liverpool Malaria Model . . . . . . . . 3
VECTRI VECtor-borne disease community model of the internationalcentre for theoretical physics, TRIeste . . . . . . . . . . . . 3
Pl. Plasmodium. . . . . . . . . . . . . . . . . . . . . . . . . . 6
An. Anopheles. . . . . . . . . . . . . . . . . . . . . . . . . . . 6
AG An. gambiae. . . . . . . . . . . . . . . . . . . . . . . . . . 25
AF An. funestus. . . . . . . . . . . . . . . . . . . . . . . . . . 25
AA An. arabiensis. . . . . . . . . . . . . . . . . . . . . . . . . 25
AN An. nili . . . . . . . . . . . . . . . . . . . . . . . . . . . . 25
AM An. moucheti . . . . . . . . . . . . . . . . . . . . . . . . . 25
HBR Human Biting Rate . . . . . . . . . . . . . . . . . . . . . . 13
WHO World Health Organization . . . . . . . . . . . . . . . . . . 13
HLC Human Landing Catches . . . . . . . . . . . . . . . . . . . 14
PSC Pyrethrum Spray Catches . . . . . . . . . . . . . . . . . . . 14
LTC Light Traps Catches. . . . . . . . . . . . . . . . . . . . . . 14
CSPR CircumSporozoite Protein Rate. . . . . . . . . . . . . . . . 14
ELISA Enzyme-Linked Immunosorbent Assay. . . . . . . . . . . . 14
PCR Polymerase Chain Reaction. . . . . . . . . . . . . . . . . . 14
ibpp infectious mosquito bites per person . . . . . . . . . . . . . 19
Pd Population density. . . . . . . . . . . . . . . . . . . . . . . 21
GPDWv3 Gridded Population Density data of the World, version 3 . . 21
PWB Permanent Water Body . . . . . . . . . . . . . . . . . . . . 22
ARCv2 African Rainfall Climatology version 2. . . . . . . . . . . . 19
ERAI European Centre for Medium-Range Weather Forecasts(ECMWF) Interim Reanalysis . . . . . . . . . . . . . . . . 20
SY Start Year . . . . . . . . . . . . . . . . . . . . . . . . . . . 19
SM Start Month . . . . . . . . . . . . . . . . . . . . . . . . . . 19
EY End Year. . . . . . . . . . . . . . . . . . . . . . . . . . . . 19
EM End Month . . . . . . . . . . . . . . . . . . . . . . . . . . 19
1

CHAPTER 1
Introduction
1.1 The research backgroundMalaria over the course of history has taken a huge toll on both human life and de-velopment in endemic countries (Hay et al. 2010). Some countries in the temperateclimate managed to eliminate it (Killeen et al. 2002). Others are engaged in elimina-tion strategies (Feachem et al. 2010). Africa especially the sub-Sahara however, is stilloccupied with control efforts (Feachem et al. 2010). The disease remains one of thepressing public health problems in the region (Guerra et al. 2008) despite a reductionin its burden over the last decade (WHO 2015). The difficulty in eliminating malariain the region is due to a complex interplay of many factors (Caminade et al. 2014).The main one being the suitability of climate and environment of the area for malariatransmission (Caminade et al. 2014) that enables the dominance of efficient vectors ofthe disease (Murray et al. 2012, Sinka et al. 2010). The resistance of malaria parasitesto antimalarials (Gregson and Plowe 2005) and malaria vectors to insecticides (Choiet al. 2004, Coetzee and Fontenille 2004) are additional challenges. Other factors in-clude the low socioeconomic status of the region (Tshikuka et al. 1996) and perhapslack of political will.
Climate and environmental covariates reportedly impact on the development dynamicsof both the vectors and parasite (Craig et al. 1999, Gething et al. 2011, Kirby andLindsay 2009). Their influence trickles further on the behaviour of the vectors, theirdensity and the number of infective mosquito bites a person receives per unit time(Fontenille et al. 1997, Molineaux and Gramiccia 1990). As a result, a temporal andspatial variability of the disease transmission occurs in Africa particularly the sub-Saharan Africa (Mbogo et al. 1995, Robert et al. 2003, Shililu et al. 2003). Anotherinfluence of malaria transmission dynamics in the sub-region is linked to the levelof immunity acquired by the dwelling population (Molineaux et al. 1988). Due toacquired immunity to malaria, the disease infection moves differentially within thedifferent age groups and gender of the sub-Saharan African population (Doolan et al.2009, Mandal et al. 2011).
To eliminate malaria in Africa may require a complete trace of the disease progressionpath. This includes an understanding of the influence of climate and environmental fac-tors including vector type and immune status of the population at stake on the diseaseseasonality. These, coupled with strengthening health systems, developing infrastruc-ture and poverty reduction, will accelerate the elimination process. Since the systemicinteraction of malaria is dynamic, the use of dynamical mathematical malaria mod-els is necessary. These models can provide an explicit framework to understand andanalyze the complex transmission pathways of the disease (Dobson and Carper 1992,
2

Bibliography
Mandal et al. 2011, Patz et al. 2003).
1.2 Statement of the ProblemStudies about the impact of climate and environment including vector type on malariaseasonality in Africa exist. But a comprehensive assessment of the disease in thisregard using observed monthly Entomological Inoculation Rate (EIRm) data across awide range of different epidemiological settings in the region is scarce. Some previousattempts (Craig et al. 1999, Ermert et al. 2011b, Grover-Kopec et al. 2006, Tanser et al.2003) relied on model simulated or other surrogates data. Other works that used Ento-mological Inoculation Rate (EIR) data (Mabaso et al. 2007, Roca-Feltrer et al. 2009)either lumped data from different climate settings or provided no adequate informationabout the individual influence of climatic and environmental variables. Many otherstudies (Briet et al. 2008, Giha et al. 2005, Kleinschmidt et al. 2001, Mabaso et al.2005, Teklehaimanot et al. 2004, Thomson et al. 1999, Yé et al. 2007) relied on preva-lence or clinical malaria cases gathered from hospitals or clinics. But prevalence orcase data are problematic because they are a cluster of different transmission windows(Reiner Jr et al. 2015). Besides, there are enormous variations in health seeking be-haviour of humans and health policies (Afrane et al. 2012). Hence, evidence of theimpact of climate and environment on seasonal malaria transmission in Africa espe-cially the sub-Saharan is unconsolidated and require further probe.
Moreover, VECtor-borne disease community model of the international centre for the-oretical physics, TRIeste (VECTRI) (Tompkins and Ermert 2013) and 2010 versionof the Liverpool Malaria Model (LMM2010) (Ermert et al. 2011a), are weather-drivendynamical mathematical malaria models. They are scientifically sound and found tosimulate realistic malaria transmission rates for epidemic and endemic areas in Africa(Ermert et al. 2011a, Tompkins and Ermert 2013). They have contributed to the under-standing of malaria transmission dynamics in the region (Caminade et al. 2014, Ermertet al. 2012; 2013, Tompkins and Di Giuseppe 2015). But despite their acceptability andapplication in the area, their simulation of seasonal malaria patterns for the region hasnot been extensively validated and evaluated with observed data from many differentlocations across the region. It means then that their seasonal malaria simulations maynot be representative of the local conditions of the area. This applies in particularsince most locations of the region are meteorologically different from those that wereused during model calibration and validation. For these reasons, their prediction ca-pabilities, accuracy and generality of their simulated malaria seasonality compared tomeasured values are largely not maximized and indefensible.
The last but not the least, VECTRI is a regionally scaled, high resolution (on the orderof 1-5 km) model that innovatively incorporates vector-host interaction and accountsfor population density and surface hydrology (Tompkins and Ermert 2013). Despite itsnovelty and provision of adequate approximations of biological and epidemiologicalfeatures of malaria in Africa (Caminade et al. 2014, Tompkins and Di Giuseppe 2015),immunity to malaria is missing in its formulations. Since immunity is an importantmalaria transmission determinant in sub-Saharan Africa (Doolan et al. 2009), its ab-sence in VECTRI suggests the model may be unable to describe the overall malariatransmission dynamics in the region quantitatively. Also, VECTRI parameter settings
3

Bibliography
have not been optimized to determine their relative importance to malaria outcome.Since parameter settings are most influential on model output (Chitnis et al. 2008), de-termining their sensitivity to the model outcome is critical for VECTRI validation andguide for future research efforts (Hamby 1994).
1.3 Research questionsTo find solutions to the identified problems this research addresses the following ques-tions:
1. Can we use EIRm data to understand how climate and environment includingmosquito type influence seasonal malaria transmission in Africa?
(a) How do climatic factors such as rainfall and temperature influence seasonalmalaria transmission?
(b) How do hydrological settings such as irrigation and permanent water bod-ies affect malaria seasonality?
(c) Is malaria seasonality different at population density domains such as ur-ban, peri-urban and rural areas?
(d) Does malaria seasonality differ at different elevations?
(e) How do vector type and their distribution in various climatological settingsaffect malaria seasonality?
2. Do VECTRI and LMM2010 simulate realistic seasonal malaria patterns in Africaas a function of climate and environment?
3. Can a model of immunity to malaria be formulated to understand its impact onseasonal malaria transmission in Africa?
4. Does incorporating immunity into VECTRI make it more realistic and reliablefor seasonal malaria study in Africa?
5. How does VECTRI parameter settings influence its seasonal malaria outcome?
(a) Can we optimize the parameter settings of VECTRI to determine their rel-ative importance to VECTRI simulation of seasonal malaria?
(b) Which parameters of VECTRI contribute most to its output variability andrequire additional research to reduce the uncertainty or are insignificant andcan be eliminated from the model settings?
1.4 ObjectivesThe study seeks to achieve the following objectives:
1. Determine the impact of climatic and environmental variables including mosquitospecies on malaria seasonality in Africa.
4

Bibliography
2. Verify the accuracy of LMM2010 and VECTRI in simulating seasonal malariatransmission in Africa as a function of climate and environment.
3. Evaluate the reliability of a formulated simple model of immunity to malaria inAfrica.
4. Improve VECTRI’s simulation of seasonal malaria by incorporating the formu-lated immunity model into its structure.
5. Ascertain the relative importance of VECTRI parameter settings to its seasonalmalaria simulations through a sensitivity study.
1.5 Organization of the thesisThe research is organized into the following chapters: In chapter one the motivationto this study encompassing problem statement, research questions, and objectives arepresented.Chapter two reviews the literature on the Plasmodium parasite prevalence, burden,transmission drivers, metrics for estimation malaria transmission, and weather-drivendynamical mathematical malaria models.In chapter three, the impact of climatic and environmental factors including vectorspecies on seasonal malaria transmission using spatial EIRm data is presented.Chapter four uses EIRm data to validate and evaluate the accuracy of VECTRI andLMM2010 in simulating seasonal epidemiological patterns of malaria in Africa.In Chapter five, the reliability of a formulated simple model of immunity to malariais evaluated. The chapter also examines whether or not an inclusion of the immunitymodel into VECTRI structure improved its simulation of seasonal malaria transmis-sion in Africa. Besides, the relative importance of VECTRI parameter settings to itsseasonal malaria simulations was examined through a sensitivity study. The thesis isconcluded in chapter six with summary, discussions and future outlooks.
5

CHAPTER 2
Literature review
2.1 Malaria and the Plasmodium parasiteMalaria is a life-threatening vector-borne disease caused by the genus Plasmodiumparasite (WHO 2015). Primary route of human infection is through bites of sporo-zoites infected female Anopheles (An.) mosquitoes during blood meal (Ross 1897).Infection can also take place via shared contaminated sharps (eg. needles, blades,syringes), mother to child during pregnancy and delivery, blood transfusion and organtransplant (WHO 2014). Symptoms may include fever, headache, muscle aches, chills,tiredness, nausea, vomiting and diarrhoea (Laishram et al. 2012, WHO 2000). Com-plicated symptoms may involve the nervous, respiratory and renal systems (Trampuzet al. 2003). Five species of the parasite causes disease in humans namely Plasmod-ium (Pl.) falciparum, vivax, malariae, ovale and knowlesi (Singh and Daneshvar 2013,WHO 2015).
2.1.1 The genus Plasmodium life cyle
Figure 2.1: The life cycle of the genus Plasmodium parasite. Source: JHSPHOPEN-Courseware (2016)
6
Bibliography
The parasite’s life cycle is reportedly complex, involving sexual and asexual devel-opmental stages and alternates between the female An. mosquito (the vector) and thehuman host (Aron 1988, Aron and May 1982). The five human species informedlyexhibit similar life cycle (Gueirard et al. 2010) as illustrated diagrammatically in Fig-ure 2.1.
During a blood meal, a sporozoite-infected female An. mosquito injects some of thesporozoites (fewer than 100 (Ponnudurai et al. 1991, Rosenberg et al. 1990)) into thehuman bloodstream. The inoculated sporozoites find their way into the liver and invadethe liver cells called hepatocytes (Bailey 1988, Mota et al. 2001). While in the liver,they undergo asexual multiplication (schizogony) for a period (about 9-14 days for Pl.falciparum, 12-17 days for Pl. vivax and 18-40 days for Pl. malariae (Warrell 2002)) toform merozoites (Bousema et al. 2014, Josling and Llinas 2015). Matured merozoitesexit the hepatocytes after fracturing them and occupy the red blood cells (erythrocytes).In the blood, they engage in a cycle of erythrocytes invasion and rupture. First, theyenlarge into trophozoite after conquering the red blood cell. The trophozoites undergoasexual divisions to form schizonts. Matured schizonts then rupture freeing the newlyformed merozoites (about 15 to 30 (Homann 2008)) into the blood that re-invade newerythrocytes (Miller et al. 2002). This cycle repeats about 1-3 days, infecting thousandsof red blood cells of the host leading to illness and complications if not treated (Diebneret al. 2000).
Some of the merozoite (<10%) leave the asexual replication cycle and develop intosexual forms of the parasite, called gametocytes (Josling and Llinas 2015). A femaleAn. mosquito having a blood meal on an infected human may ingest these gametocytes.In the mosquito midgut, the gametocytes develop further into male and female gameteswhich fuse to form diploid zygotes. The Zygotes develop into ookinetes that burrowthrough the mosquito midgut wall and form oocysts. After a period of growth in themosquito gut (12 days for Pl. falciparum (Anderson and May 1991, Bruce-Chwattet al. 1973) ), the oocyst bursts and release the newly formed sporozoites into the bodycavity of the mosquito. The sporozoites then maneuver their way into the mosquitosalivary glands where they remain in wait for another human infection cycle (Bousemaet al. 2014, Josling and Llinas 2015).
2.1.2 Epidemiology and burden of malaria
Malaria occurs throughout most of the tropical and subtropical regions of the world(see Figure 2.2). Africa especially the sub-Saharan is, however, the most malaria trou-bled region (Guerra et al. 2008). For instance, out of about 214 million new cases and438000 malaria deaths estimated worldwide in 2015, 88% of the cases and 90% ofthe deaths (especially children under five years) were from the African region (WHO2015). The disease remains perennial in most parts and one of the major public healthconcerns of the area (Grover-Kopec et al. 2006), despite a reduction in incidence andmortality rates by 42% and 66% respectively between 2000 and 2015 (WHO 2015).The poorest and marginalised communities are often the most severely affected (Gallupand Sachs 2001).
Of the five human species, Pl. falciparum and vivax pose the greatest public health
7

Bibliography
Figure 2.2: Projected changes in malaria incidence rates by country, 2000–2015. Source:(WHO 2015)
challenge (WHO 2015). Pl. falciparum is said to be the deadliest and the most widespreadin the tropics especially Africa (Guerra et al. 2008, Guyatt and Snow 2001, Hammerichet al. 2002, Hay et al. 2010, McQueen and McKenzie 2004). Pl. vivax is supposedlyrare in Africa with cases constrained to Madagascar and parts of the Horn (Gethinget al. 2012, Mendis et al. 2001). Much of vivax (about 80-90%) occur in the MiddleEast, Asia, and the Western Pacific, with about 10-15% in Central and South Amer-ica (Mendis et al. 2001). Pl. vivax rarely cause death but inflicts debilitating fever,chills, nausea, vomiting, and myalgia (Baird 2004). Pl. malariae, ovale and knowlesicontribute a small proportion of malaria infection (Doolan et al. 2009, WHO 2015).Pl. malariae is widespread in sub-Saharan Africa, much of south-east Asia, Indone-sia and many of the islands of the western Pacific (Collins and Jeffery 2007). Pl.ovale is naturally distributed in sub-Saharan Africa and the islands of the western Pa-cific (Collins and Jeffery 2005). Pl. knowlesi (the zoonosis) is widely distributed insouth-east especially in Malaysia (Cox-Singh and B 2008, Singh and Daneshvar 2013,White 2008). Sympatric and co-infection of the parasite species have been reported.In Africa, Pl. malariae is frequently found in sympatry with Pl. falciparum (Collinsand Jeffery 2007). In Burkina Faso for instance, Gneme et al. (2013) found Pl. fal-ciparum co-existing with malariae and ovale. Similar co-infection interactions in thesub-region have also been reported in other studies such as McKenzie et al. (2002) andBousema et al. (2008).
8

Bibliography
2.2 Malaria transmission drivers
2.2.1 Vector species
Figure 2.3: The distribution of three most dominant malaria vectors in Africa. Source: Sinkaet al. (2012)
The high prevalence, morbidity and mortality rates of malaria in sub-Saharan Africais partly blamed on the dominance of the most efficient malaria vectors in the region(Guerra et al. 2008, Hay et al. 2009). Reported dominant species include An. gambiaecomplex (gambiae ss, arabiensis, melas, merus), funestus, nili and moucheti (Coet-zee et al. 2000, Coetzee and Fontenille 2004, Levine et al. 2004, Lindsay et al. 1998,Murray et al. 2012, Sinka et al. 2010). An. gambiae complex class (especially An.gambiae ss and arabiensis) and An. funestus have been observed as the most efficientvectors in the region(Sinka et al. 2010, White 1974). Their geographic distributionand the sympatric association is displayed in Figure 2.3. Collins and Besansky (1994)indicates that a chunk of malaria cases in Africa are attributed almost entirely to thesethree vectors. According to Coosemans et al. (1992), they are responsible for most ofthe malaria cases due to their high anthropophilic behaviour (although An. arabiensisis less anthropophilic when cattle feeding opportunity exists). Besides, An. gambiaeand funestus are long-lived vectors (high longevity).
9
Bibliography
2.2.2 Meteorological factors
RainfallRainfall has been linked with malaria since the early days of the disease research (Gill1920). Rainfall reportedly provide the aquatic sites needed by gravid malaria vectors tolay their eggs to develop into adult vector through stages of larvae and pupae (Martenset al. 1995, Molineaux 1988, Reiter 2001). Emerging adults then disperse accordingto their flight range (Kar et al. 2014). Besides, rainfall informedly provide humid-ity (at least 60%) suitable for vector survival (Reiter 2001, Thompson et al. 2005).Studies (Craig et al. 1999, Gill 1920) have reported a correlation between the onsetof rainy season and an increase in vector abundance. For instance, in a prospectiveanalysis of malaria epidemic associated with El Niñoin in Ugandan highlands, Lind-blade et al. (1999) found that rainfall anomaly correlated positively with vector densityone month later. Rainfall has also resulted in malaria epidemics at malaria-free zones.For instance, Fontaine et al. (1961) report that the 1958 malaria epidemics outbreak inEthiopia was a due to an unusually high rainfall amount. Lindsay and Martens (1998)also attributed the 1940 malaria outbreak in Nairobi Kenya to rain. Moderate rainis beneficial for the immature mosquitoes (water-bound stages) to strive and survive.But excessive rain may result in higher water levels, high flow velocities and floodingof water impoundments which are detrimental to their survival (Martens et al. 1995,Paaijmans et al. 2007).
TemperatureTemperature regulates the rate of development and survivorship of both the vector andthe parasite (Bayoh and Lindsay 2003; 2004, Beck-Johnson et al. 2013, Martens et al.1995). According to Craig et al. (1999), the minimum temperature required for thedevelopment of Plasmodium falciparum and vivax approximates to 18◦C and 15◦C,respectively. High (low) temperature is reported to shorten (lengthen) the time requiredfor mosquito and parasite maturation (le Sueur and Sharp 1991, Rueda et al. 1990).Teklehaimanot et al. (2004) indicate that larval development may take more than 45days at 16◦C compared to only 10 days at 30◦C. Craig et al. (1999) reports that thesporogonic cycle might take about 9 to 10 days at temperatures of 28◦C but ceaseat temperatures below 16◦C. Other studies (Bayoh and Lindsay 2003; 2004, Beier1998) have suggested that the speed of the gonotrophic cycle which determines thefeeding frequency of mosquitoes and the proportions of infective mosquitoes is alsotemperature regulated. Regarding vector survival, Craig et al. (1999) put forward thatthe daily vector survival is about 90% at temperatures between 16◦C and 36◦C withpeak survival at temperatures between 28◦C to 32◦C. Kirby and Lindsay (2009) pointout that temperatures above 40◦C are often fatal to mosquitoes (Kirby and Lindsay2009).
2.2.3 Environmental factors
ElevationMalaria transmission intensity varies with altitude due to associated changes in tem-perature (Drakeley et al. 2005). Cool temperatures at high elevations unlike at lowelevations limit malaria transmission. For instance, Bodker et al. (2003) found highmalaria transmission intensity at lowlands than at highland areas at six villages in theUsambara Mountains in Tanzania along an altitude transect from 300m to 1700m.
10

Bibliography
In Papua New Guinea, Attenborough et al. (1997) established that the proportions ofmosquitoes with malaria circumsporozoite antigens diminished with increasing alti-tude along a transect from 170 to 1000m. At different altitudes in western highlands ofKenya, Akhwale et al. (2004) detected that high prevalence of Plasmodium falciparuminfection at lowland villages was concomitant with high anaemia than at highland ar-eas. In Tanzania, Balls et al. (2004) found in seven villages located at altitudes between300m to 1650m a decline in splenomegaly risk with increasing height. Again in Tan-zania, Maxwell et al. (2003) found that EIR were 17 times greater at the low-elevatedlocation than at high-elevated areas.
Population densityPopulation density differentiates malaria transmission intensity between rural, peri-urban and urban settings (Tompkins and Ermert 2013, Vercruysse et al. 1983). Amongthese settings, a general trend of increasing malaria transmission from urban to peri-urban and to rural centres have been reported (Hay et al. 2005, Keiser et al. 2004, Wanget al. 2005). For instance, in sub-Saharan African cities, Robert et al. (2003) found thatthe annual mean EIR increased from 7.1 at the city centres to 45.8 at peri-urban areasto 167.7 at rural locations. In Burkina Faso, Modiano et al. (1999) found epidemio-logical profiles and clinical malaria patterns to be high in rural settings than at urbanenvironments. This pattern is explained by the fact that, the increase in populationdensity from the countryside to cities result in a decrease in biting ratios (Kelly-Hopeand McKenzie 2009). Additionally, polluted breedings grounds and access to publichealth services in urban areas also lowers transmission (Hay et al. 2005).
However, some studies reported otherwise. In Libreville, Gabon, Mourou et al. (2012)recorded high EIR in the most central and urbanized quarter than at the peripheral area.At Cotonou in Benin, Wang et al. (2006) reported high prevalence rates of parasitemia(9.0%) in the intermediate than the center (2.6%) and periphery (2.5%). Reasons forthis pattern has been blamed on localized differences in environmental settings. Ac-cording to De Silva and Marshall (2012), high malaria in urban areas may be due tolow socioeconomic status and adaptation of malaria vectors to the urban environment.Added, most African cities grow outwards with relatively under-developed or poorlyserviced settlements in peri-urban areas (Byrne 2007). Such development activitiesare accompanied by open pits and burrows which serve as a source of vector breedingleading to high malaria. Some suburban dwellers may engage in agriculture for liveli-hood which provides breeding grounds for mosquitoes due to the formation of shallowwater between seed beds (Adiamah et al. 1993, De Silva and Marshall 2012).
Temporal and permanent water bodiesTemporal and permanent water impoundments supposedly serve as potential habitatfor water-bound stages of malaria vectors (Fillinger et al. 2009, Kar et al. 2014). Stud-ies have established the relationship between water bodies and malaria transmission.In Kenya, Zhou et al. (2007) found that Anopheles gambiae and funestus populationsdecreased with increasing distance from the Yala river. In Ethiopia, Lautze et al. (2007)noted that malaria case rates among people living within 3km of the Koka reservoir was1.5 times greater than those between 3-6km and 2.3 times higher than those within 6-9km off the reservoir. Temporal breedings sites such as puddles and ponds get water forbreeding only in the rainy season. Permanent breeding sites such as rivers, lakes, and
11

Bibliography
streams contain water year round and tend to support a year-round malaria transmis-sion (Gianotti et al. 2009). Droughts may slow down or stop water flow in permanentwater bodies, increasing their ability to support vector breeding (Haque et al. 2010).Flooding of water bodies due to excessive rainfall could alternatively form puddles andponds at the margins of the impoundment providing a second channel through whichthe disease-enhancing effect of the reservoir may operate (Lautze et al. 2007). Soilmoisture at the surroundings of these permanent water bodies due to rise in ground-water level and reduction in infiltration loss may boost possible breeding grounds byincreasing the lifespan of temporary puddles and ponds (Tompkins and Ermert 2013).
IrrigationCrop irrigation schemes are said to pose considerable risk to malaria especially at epi-demic zones (Keiser et al. 2005, Kibret et al. 2014, Muturi et al. 2006). Irrigated fieldsare known to provide breeding sites for many species of mosquitoes, ideally membersof the An. gambiae complex such as An. arabiensis which prefer to breed in open sunlitpools (Carnevale et al. 1999, Snow 1983, White 1974). Irrigated cultivation may there-fore extend the breeding season thereby increasing the annual duration of the diseasestransmission. Irrigation may also elevate relative humidity in dry regions aiding vectorsurvival (Ijumba and Lindsay 2001). There is no clear malaria transmission pattern be-tween irrigated and non-irrigated settlements. For instance, Coosemans (985b) foundin Burundi that the vectorial capacity of An. gambiae s. l. was 150 times higher inrice irrigated scheme than in adjacent areas. In Bobo Dioulasso, Burkina Faso, Robertet al. (1985) determined that the number of infective bites received in a rice growingarea was similar to that in a control area. In Tanzania, Ijumba (1997) detected that thenumber of infective mosquito bites at Lower-Moshi irrigation scheme was 2.6 timeslower than at the control village. This suggests that, irrigation may frequently generatehigh vector numbers but does not necessarily translate into increased risk of exposureto malaria.
2.2.4 Human factors
ImmunityHuman immune response to malaria infection is one of the essential features of thedisease dynamics in sub-Saharan Africa (Molineaux et al. 1988). Malaria burden ishigh in children below 5-years of age and pregnant women than adults in the sub-region(WHO 2015). Mandal et al. (2011) explains that the differential burden of the diseaseis due to their immune status and time spent in the area. Doolan et al. (2009) alludesthe reduced risk in older children and adults to acquired protective immunity resultingfrom the cumulative product of many years of heavy exposure to the antigen. Otherstudies (Baird et al. 1991; 2003) suggest that the acquisition of immunity by the olderfolks may be due to intrinsic factors linked with aged that enables a quick immuneresponse than children below 5 years. Unlike endemic areas, the disease burden atepidemic zones where continuous exposure does not occur, cuts across all ages (WHO2015).
Different stages of immunity to malaria have been reported namely clinical, anti-disease and anti-parasite immunity (Doolan et al. 2009, Filipe et al. 2007). Baird(2004) points out that clinical immunity develops after 5-15 years of continuous expo-
12

Bibliography
sure to malaria antigens in sub-Saharan Africa. The onset of anti-parasite immunity ishowever thought to correlate with adolescences (Doolan et al. 2009, Langhorne et al.2008). In Western Kenya for instance, Kurtis et al. (2001) found the onset of anti-parasite immunity to correlate with puberty from 15years and above. The numberof exposure needed to acquire resistance is uncertain. Gupta et al. (1999b) suggestthat across a broad range of transmission intensities, one or two malaria infections isenough to acquire immunity. In other works (Baird 1995, Baird et al. 1991, Ciuca et al.1934), ranges of 4-6 malaria infections is reported as the required number of exposurefor immunity develop.Just as new infections are needed to boost acquired immunity, it is however lost in theabsence of exposure to new infections (Aron 1983). For instance, Struik and Riley(2004) and Jennings et al. (2006) found that clinical disease emerged only in migrantsfrom endemic settings who remained away for at least 3-5 years. Filipe et al. (2007)found a half-life of 5 years for clinical immunity but 20 years for anti-parasite immu-nity. In another study, Färnert et al. (2015) noticed that sub-Saharan African immi-grants who lived for more than 15 years in Sweden had a similar risk as non-immunetravellers.
Parasite clearanceAccording to White (2011), parasite clearance is a measure of therapeutic response.Immunity enhances parasite clearance in malaria (Yorke and Macfie 1924). An in-crease in immunity lowers parasite counts and accelerate parasite clearance. Con-versely, a decline in immunity, for example, a reduction in transmission, decelerateparasite clearance rate. Parasite clearance duration is further shortened with the aid ofantimalarials (Gomes et al. 2008, White et al. 1989). For instance, Tangpukdee et al.(2008) indicated that antimalarial chemotherapy for uncomplicated and complicatedmalaria takes three and five days respectively. Pukrittayakamee et al. (2008) found alonger range of about 2-504 hours of gametocyte clearance time which also correlatedwith the asexual parasite clearance time. The resistance of the parasite to antimalarialsmay also dictate the clearance time. For example, a drug that will usually clear parasitewithin 3 days may take longer than that in the case of resistance. Self-clearance (with-out antimalarials) with antibodies alone may take a longer time (Cohen et al. 1961).In a longitudinal study of recovery rates in Nigeria, Bekessy et al. (1976) noticed aself-clearance time of about 625 and 52 days in infants and adults (> 44 ) respectively.Added, Macdonald (1950) found an average self-clearance time of about 200 days ina study analysing parasites rates in infants. Similar studies (Eyles and Young 1951,Jeffery and Eyles 1954) in malaria-naive adults found a mean self-clearance durationof about 200-300 days.
2.3 Entomological metrics for malaria transmission
2.3.1 Human Biting Rate
Human Biting Rate (HBR) is defined as the number of mosquito bites a person receivesper unit time Tusting et al. (2014). Mathematically, it is expressed as the product ofthe Anopheline density/capture to people and the average number of persons bitten byone mosquito at a unit time (Baird et al. 2002, Hay et al. 2000, WHO 1975). Stan-dard methods recognised by World Health Organization (WHO) for estimating HBR
13

Bibliography
in the field include indoor and outdoor Human Landing Catches (HLC), PyrethrumSpray Catches (PSC), and Light Traps Catches (LTC). Among the methods, HLC isconsidered the most direct technique as it directly samples human biting mosquitoes(Le Goff et al. 1997, WHO 1975). HLC is, however, both capital and labour intensive,technically difficult to replicate, unethical in areas of drug-resistant malaria, subjectedto biases of collectors and their attraction to mosquito (Fontenille et al. 2001, Kilamaet al. 2014, Tusting et al. 2014). Unlike HLC, PSC and LTC depend largely on thebehaviour of mosquitoes rather than directly feeding on humans (Hay et al. 2000). Forthis reason, Tusting et al. (2014) note that PSC and HLC may likely overestimate truebiting rates, particularly when scores of mosquitoes are biting. Besides, people willoften devise ways to avoid a large number of mosquito bites.
2.3.2 CircumSporozoite Protein Rate
CircumSporozoite Protein Rate (CSPR) refers to the proportion of the biting mosquitoes(HBR samples) with sporozoites in their salivary glands (Baird et al. 2002, Hay et al.2000, WHO 1975). Standard WHO methods for estimating CSPR includes Dissection(of the thorax of the mosquitoes to help reveal potential sporozoites under the mi-croscope), Enzyme-Linked Immunosorbent Assay (ELISA) and Plasmodium-specificPolymerase Chain Reaction (PCR) (Durnez et al. 2011, Hay et al. 2000). According toDurnez et al. (2011), dissection and microscopic examination of the salivary glands ofindividual mosquitoes are labour intensive and not practical for assaying a high numberof mosquitoes. ELISA is considered more advantageous in the sense that the collectedmosquitoes can be stored until processed and the method is as well able to distinguishthe different human Plasmodium species by species-specific monoclonal antibodies(Burkot et al. 1984, Durnez et al. 2011). Moreover, ELISA techniques are less sensi-tive compared to Dissection, especially when small numbers of sporozoites are presentin the salivary glands (Beier et al. 1990). On the contrary, others studies (Beier et al.1990, Durnez et al. 2011) have indicated that ELISA techniques could overestimatesporozoite rate since it does not only detect sporozoites in the salivary glands, but alsoin other mosquito tissues. PCR assays can detect as few as ten sporozoites (Tassanaka-jon et al. 1993) in contrast to ELISA which requires at least 100 sporozoites (Beieret al. 1987). As put forward by (Durnez et al. 2011), PCR is disadvantageous in that itdetects not only the sporozoites but also all the Plasmodium DNA present.
2.3.3 Entomological Inoculation Rate
EIR is expressed as the product of the number of mosquitoes attempting to feed onhumans (HBR) and the fraction of the feeding mosquitoes that are actively infective(CSPR) (Bruce-Chwatt 1985, Macdonald 1957). In simple terms, it is the number ofinfectious mosquito bites a person receives per unit time. EIR is regarded as the gold-standard malariometric (Shaukat et al. 2010, Tusting et al. 2014). First and foremost,it can directly quantify parasite-infected mosquitoes and their propensity to transmitthe parasites to humans (MARA 1998, Shaukat et al. 2010). For this reason, it can beused to quantify the impact of vector control and anti gametocytocidal drugs (Shaukatet al. 2010). Secondly, EIR satisfactorily produces an overall estimate of the exposureof a population to malaria parasite (Beier et al. 1999, Takken and Lindsay 2003). It cantherefore be used as a legible assessor of malaria endemicity and epidemic risk (Burkotand Graves 1995, Onori and Grab 1980). The last but not the least, Tusting et al. (2014)
14

Bibliography
argues that EIR estimates are easily interpreted by policymakers and national malariacontrol program managers alike.
On the contrary, Hay et al. (2000) point out that uncertainties in EIR estimates maybe huge since the different methods for determining HBR and CSPR are not standard-ised. Besides, unskilled labour (few trained specialists) are usually involved duringmosquito sampling. The number of sample mosquitoes may, therefore, be largely bi-ased and for that matter may subject estimated EIR to limited precision and accuracy(Fontenille et al. 2001, Kilama et al. 2014, Tusting et al. 2014). Also, estimated EIRdoes not directly translate into malaria incidence or clinical disease and does not accu-rately represent exposure when interventions are in place (Tusting et al. 2014). More-over, it fails to capture local level transmission variability determined by the habits,genetics and physiology of different vector species, spatial heterogeneity of vectorhabitats, immune status of the local human population or anti-mosquito strategies em-ployed by local communities (Takken and Lindsay 2003).
2.4 Weather-driven dynamical mathematical malariamodels
Mathematical modelling of malaria dates back to Sir Ronald Ross (Ross 1915) as thepioneer. Macdonald (1957) and Anderson and May (1991) later reasserted Ross’ ideas.Further studies expanded these pioneering models by including factors such as varyingpopulation size (Chitnis et al. 2006, Ngwa and Shu 2000, Torres-Sorando and Ro-driguez 1997), environment (Parham and Michael 2010), socio-economic, age andimmunity (Aron 1988, Filipe et al. 2007, Yang 2000). Generally, mathematical modelsof malaria transmission have provided an understanding of the disease progression andtransmission dynamics (Dobson and Carper 1992, Mandal et al. 2011). According toParham and Michael (2010), they have helped address multiplicative exposure effects,non-linear feedback pathways, spatiotemporal heterogeneities and complex transmis-sion dynamics of the disease. Models of malaria can be used to quantify both currentand future changes in malaria progression (Patz et al. 2003) as well as compare theeffects of control strategies used individually or in packages (Chitnis et al. 2008).
Weather-driven dynamical mathematical models of malaria are championing the progressof the disease research. For instance, based on the effect of mean rainfall and tempera-ture on the biology of malaria transmission, Craig et al. (1999) proposed a fuzzy logicmodel of the distribution of stable malaria transmission in sub-Saharan Africa. Parhamand Michael (2010) developed a simple model that allows novel insights into the ef-fects of rainfall and temperature on mosquito population and malaria transmission dy-namics. Using a simple mathematical model, Lindsay and Birley (1996) examined theinfluence of temperature on the ability of Anopheles maculipennis to transmit falci-parum vivax. Hay et al. (2002) employed regression approach to investigate reports onlong-term meteorological trends in four high-altitude sites in East Africa.In 2010, some fundamental processes of the weather-driven Liverpool Malaria Model(Hoshen and Morse 2004) were modified by Ermert et al. (2011a) through an exten-sive literature survey regarding entomological and parasitological malaria variables.The calibration and validation of the modifed verstion of the model herein referred to
15

Bibliography
as LMM2010 are detailed Ermert et al. (2011b). More recently, Tompkins and Ermert(2013) introduced a regional scale, high resolution, dynamical malaria model in 2013known as VECTRI. The model accounts for the impact of temperature and rainfallvariability on the development cycles of both the vector and the parasite as well as en-vironmental factors such as population density and surface hydrology. Bomblies et al.(2008) also introduced a modeling approach that explicitly incorporates hydrologicvariability into vector abundance and then malaria incidence. Bomblies et al. (2009)represented the impacts of hydrological variability at the village scale and demon-strated through computer model simulations the importance of high resolution hydro-logical variability for the prediction of village-scale malaria transmission.
16

CHAPTER 3
The impact of climatic and environmental factorsincluding mosquito type on seasonal malariatransmission in Africa
AbstractIt is long understood that climate and environment influence malaria transmission inAfrica. But there has been no comprehensive assessment in this regard using EIRm
data. Previous attempts mostly relied on malaria prevalence or case data gatheredfrom hospitals. But these metrics unlike EIR are aggregates of different windows oftransmission and hence unsuitable for linking climatic and environmental drivers to amalariometric outcome. In this study, the seasonality of EIRm was analysed with thegoal to understand how changes in the conditions of climatic and environmental factorsincluding malaria vector type impacted on seasonal malaria transmission in Africa. Aliterature search for EIRm data across different locations over the region enabled theanalysis. The results revealed that rainfall was the primary climatic factor explainingmalaria seasonality at markedly seasonal rainfall areas such as Sahel and Eritrea. Butat bimodal rainfall distributed and more humid zones, its impact was complex. Thetemperature was not a limiting factor of malaria seasonality in sub-Saharan Africa ex-cept for East Africa where it was able to delay the impact of rainfall. The peakingcharacteristics of seasonal malaria were mostly unimodal. In the case of bimodal rain-fall distributions, peaks were frequently associated with the first rainfall maximum ofthe year. Seasonal malaria intensity was anti-correlated with elevation and populationdensity. Permanent water bodies and irrigation intensified and altered the seasonaltransmission pattern from seasonal to perennial in areas of unstable transmission suchas Sahel and Eritrea. Though seasonal malaria was collectively driven mainly by AG,AF and AA, they had a competing and complex individual impact on seasonality. Thestudy is a step forward in malaria research as it demonstrated a more detailed analysiscompared to existing literature. Though the utilised data was associated with someuncertainties, the findings have important implications for malaria control regardingthe spatial and temporal target of malaria interventions and resource allocation. Italso informs about future malaria modelling efforts and a guide on the validation andevaluation of the seasonal outcome of existing weather-driven malaria models for theregion.
3.1 BackgroundMalaria transmission in Africa reportedly exhibits seasonality (Mbogo et al. 1995,Shililu et al. 2003). The seasonal fluctuations of the disease are an epitome of endemicand epidemic signals. The disease also varies both temporally and spatially especiallybetween climatic and ecological zones (Kasasa et al. 2013, Kelly-Hope and McKenzie
17
Bibliography
2009, Okello et al. 2006, Robert et al. 2003, Yeshiwondim et al. 2009). The variabil-ity and periodic signatures of malaria are mostly blamed on changes in climatic andenvironmental covariates over space and time (Beier 1998, Kirby and Lindsay 2009,Onori and Grab 1980, Thompson et al. 2005). Understanding malaria seasonality is,therefore, fundamental for effective planning and implementation of control activi-ties (Molineaux et al. 1988). Knowledge of the influence of climate and environmenton seasonal malaria transmission facilitates the measurement and description of geo-graphic patterns, risk and burden of malaria (Gething et al. 2011, Reiner Jr et al. 2015).
Studies on malaria seasonality in Africa exist. Some studies have shown the tim-ings and duration of malaria season (Tanser et al. 2003) or predicted the number ofmonths during which the disease transmission is possible (Craig et al. 1999, Grover-Kopec et al. 2006) using climate suitability in a given month as the hallmark. Manyother works used malaria cases or prevalence data gathered from hospitals or clinicsas metrics (Briet et al. 2008, Giha et al. 2005, Hay et al. 998a, Kleinschmidt et al.2001, Mabaso et al. 2005, Teklehaimanot et al. 2004, Thomson et al. 1999, Yé et al.2007). Others came out with working definitions for malaria seasonality (since thereis no precise definition) using EIR (Ermert et al. 2011b) or both EIR and malaria cases(Roca-Feltrer et al. 2009).
But, previous works examining the impact of climatic and environmental factors onseasonal malaria transmission in sub-Saharan Africa using EIRm as a metric are scarce.Mabaso et al. (2007) came close to this subject but used a seasonality index (Markham1970) that is deficient in irrigated and bimodal rainfall areas. Besides, they lumpedup EIRm data from different climate settings in their analysis without decoupling theirindividual effect. Malaria cases or prevalence data on the other hand are unsuitablefor linking factors of climate and environment to seasonal malaria since they are ag-gregates of different temporal transmission windows (Reiner Jr et al. 2015). Besides,health seeking behaviour of humans and health policies differ (Afrane et al. 2012).But unlike clinical cases, EIR directly quantifies parasite-infected mosquitoes and theirpropensity to transmit the parasites to humans (MARA 1998). Also, EIR determinants(i.e. Human Biting Rate (HBR) and CircumSporozoite Protein Rate (CSPR) ) are de-pendent on the conditions of climate and environment (Appawu et al. 2004, Fontenilleet al. 1997, Shililu et al. 2003). EIR estimates, therefore, can directly relate the human-biting activity of Anopheles vectors and the risk of humans to malaria infections toclimate and environment (MARA 1998, Vittor et al. 2006).
In this study, spatial EIRm data were used to examine the impact of climatic and envi-ronmental factors including mosquitoes type on seasonal malaria transmission acrosssub-Saharan Africa. The EIRm data were gathered from different areas across the re-gion through a literature survey. The study then tested the hypothesis that rainfall isthe primary climatic determinant of malaria seasonality and not temperature in thesub-region. The study further demonstrated that seasonal peaking characteristics ofmalaria have a high tendency towards single maxima than double or any other regime.The work also verified that the influence of elevation and population density on malariaseasonality is much to do with intensity than the timings whiles permanent water bod-ies and irrigation impacted on both seasonal intensity and duration. The last but notthe least, the study showed that seasonal malaria transmission in sub-Saharan Africa is
18

Bibliography
governed by a sympatric association of AG, AF and AA.
3.2 Materials and methods
3.2.1 Materials
EIRm dataA review of literature for EIRm [units: infectious mosquito bites per person (ibpp)]data was conducted. Firstly, the entomological database (unpublished) of Swiss Trop-ical Institute of Medicine, Basel, Switzerland was consulted. This database consistsmainly of EIRm and other entomological parameters digitised from published articleson entomological surveys in Africa. The EIRm data obtained therein were verified fromtheir original articles where possible for certainty. Secondly, the compiled entomolog-ical and parasitological literature archive of Ermert et al. (2011b) (their additional file2) was utilised. EIRm data from articles of Ermert et al. (2011b) database that wereunavailable in the Basel database were digitised using an R package (Poisot 2011).Thirdly, an online search for more EIRm data was explored using search method pre-viously employed by Beier et al. (1999). Badu et al. (2013) also shared their EIRm
data on malaria transmission intensity and dynamics in a mountainous forest region ofGhana.
The EIRm data gathered were then subjected to a relevancy test previously used byBeier et al. (1999) and Hay et al. (2000). Thus, EIRm data from a study was relevantif the study 1) employed WHO recommended methods for mosquito sampling andsporozoites detection (see section 2.3.1 a and 2.3.2) 2) period was at least one yearwith mosquitoes sampled every month or during the transmission season and 3) wasconducted at a time where vector control measures were previously not applied.Figure 3.2 shows the distribution (number of monthly observations in a year) of EIRm
data considered after the relevancy test. The study analysis used EIRm data betweenthe period 1983-2013 since more observations were within that period. Besides, therainfall data (African Rainfall Climatology version 2 (ARCv2) dataset) are availablefrom 1983 onwards. The number of locations and length of EIRm data observed ateach zone is displayed in Table 3.1. The geographical locations of the EIRm dataare displayed in Figure 3.1. The classification of the locations into climate zones,hydrology and population density as well as uncertainties pertaining to the observedEIRm data are detailed in Appendix A. Other details of the locations such as name,longitude, latitude, Start Year (SY), Start Month (SM), End Year (EY) and End Month(EM) are outlined in Table A.1 of Appendix A.
Table 3.1: Number of locations and amount of EIRm data available at each zoneNumber of locations with n [year] of available data
Zone 1 [year] 2 [years] 3 [years] 4 [years] 5 [year] Total number of locationsSahel 18 6 3 0 1 28Savanna 16 1 0 0 0 17Guinea 24 9 0 0 0 33Cameroon 22 0 0 0 0 22Eritrea 10 0 0 0 0 10EEA 39 2 2 0 0 43
Rainfall and temperature timeseries
19

Bibliography
−10˚
−10˚
0˚
0˚
10˚
10˚
20˚
20˚
30˚
30˚
40˚
40˚
50˚
50˚
−10˚ −10˚
−5˚ −5˚
0˚ 0˚
5˚ 5˚
10˚ 10˚
15˚ 15˚
−10˚
−10˚
0˚
0˚
10˚
10˚
20˚
20˚
30˚
30˚
40˚
40˚
50˚
50˚
−10˚ −10˚
−5˚ −5˚
0˚ 0˚
5˚ 5˚
10˚ 10˚
15˚ 15˚
Rural locations:Neutral PWB Irrigated
Periurban locations:Neutral PWB Irrigated
Urban locations:Neutral PWB Irrigated
West Africa (WA) East Africa (EA)
Sahel
Savanna
Guinea
Cameroon
Eritrea
Ethiopia
Equatorial
East Africa
(EEA)
500 1000 1250 1500 2000 3000 4000 6000
[m]
Figure 3.1: The geographical distribution of observed EIRm data locations in sub-SaharanAfrica. The proximity of many sites was so close that they could not be explicitly resolved onthe map. Rural: Red coloured locations, Peri-urban: Yellow coloured locations and Urban: Bluecoloured locations. Circles: locations devoid of permanent water bodies or irrigation activities(Neutral), Inverted triangles: locations with permanent water bodies (PWB), Star: locations withirrigation.
Local weather station observations in sub-Saharan Africa were consulted for rainfalland temperature data. But these stations were found to have incomplete records, mostlynot located at the malaria study locations and were inadequately distributed in theregion. For this reason, surrogate data products were utilised.
Regarding rainfall, the ARCv2 dataset (Novella and Thiaw 2013) was utilised. ARCv2is a gridded daily precipitation estimation dataset centred over Africa at 0.1◦ spatialresolution and available from 1983 to present. The daily records for each of the malarialocation were extracted for the period 1983-2013 using their geographical coordinates.About 3.01% (341 days) of data gaps (same date cutting across all sites) existed dueto technical challenges. These shortcomings were replaced with daily climatologicalvalues (1983-2013). Monthly values were then estimated from the complete dailyrecords.
Regarding temperature, the daily European Centre for Medium-Range Weather Fore-casts (ECMWF) Interim Reanalysis (ERAI) dataset (Dee et al. 2011) was utilised.ERAI is a global atmospheric reanalysis data available from 1979-present at a spatialresolution of 0.75◦. Both minimum and maximum temperature were extracted for theperiod 1983-2013 for each location. Temperature difference resulting from differencesin elevation between malaria locations and ERAI heights were corrected. This wasdone by assuming that, in a standard atmosphere, temperature decreased with altitudeat a constant rate of -6.5◦C/1000m up to the tropopause as shown in the equation be-
20

Bibliography
0
50
100
150
200
250
Ob
serv
ati
on
s [
mo
nth
s ]
1960 1965 1970 1975 1980 1985 1990 1995 2000 2005 2010
Year
EIR observations in sub−Saharan Africa
Figure 3.2: Annual distribution of the number of EIRm observations in sub-Saharan Africa
low:
T = To − 6.5h[m]
1000m(3.1)
where T is the corrected temperature, To is the extracted temperature and h is the dif-ference in height between the malaria location height and ERAI height. The meantemperature for each location was then calculated by finding the average between theminimum and maximum values. Monthly values were then estimated for each temper-ature variable.
The choice of the surrogate data products was based on their reliability, good tempo-ral and spatial resolution, longest daily records for sub-Saharan Africa and as recom-mended by other works such as (Awange et al. 2016).
Population density (Pd) dataInformation regarding whether a malaria location was rural, periurban or urban wasmissing in most studies. Hence, Pd values for each location was extracted from theGridded Population Density data of the World, version 3 (GPDWv3) (CIESIN-CIAT2005) using their geographical longitude and latitude position points. Each locationwas grouped into rural, peri-urban and urban area using the definition of urbanizationby Hay et al. (2005) (see details in appendix A).
3.2.2 Methods
Pair-wise comparismThe seasonal distribution of EIRm was pair-wise compared with the correspondingmonthly series of rainfall and temperature. The goal was to examine any association,
21

Bibliography
degree of seasonal variability and contrast between the pairs throughout the year. EIRm
data from rural-neutral locations were used (the rest were excluded) to ensure the in-fluence was climate alone as possible.
Like the climatic factors, a pair-wise comparison of EIRm time series of environmentalsettings including vector type was made. Regarding hydrology, EIRm time series oflocations with PWB, irrigation and Neutral (used as control check) were contrasted.Regarding population density, EIRm time series from urban, peri-urban and rural set-tings were contrasted. Similarly, time series of elevations between 0 and 1500m atintervals of 500m were compared. The limit to 1500m was due to unavailability ofEIRm beyond that height. Concerning vector type, dominant and efficient malaria vec-tors were identified, and their EIRm time series contrasted. The comparison was subjectto data from the same climate without jeopardising the effects of other environmentalvariables that may have the potential impact on the output.
EIR peak characteristicsThe charateristics of the observed EIRm regarding the behaviour of peaks in a yearwere analysed for each zone. On a EIRm time series, a peak was defined as a localmaxima with two points on either side being smaller than it. Two points interval waschosen due to the rather short EIRm time series length (12 months). At the boundariesof the time series (January and December) where the condition of two points on eitherside was insufficient, the time series was extended by repeating January and Februaryvalues to allow for investigation at those boundaries. After peaks had been identified,peak relevancy criterion was further applied. That is, a peak was considered relevant ifits amplitude (A) was greater than the sum of the mean (µ) and standard deviation (σ)of the EIRm of that timeseries (i.e., A > µ + σ ). Seasonal regimes namely unimodal,bimodal or trimodal malaria transmission were then classified for each zone using thepeaks.
Cross-correlationThe EIRm time series were also cross-correlated with that of rainfall at lags of 0-11months. The aim was to examine the delay between the onset of suitable rainfallconditions for malaria transmission and malaria season onset. Only lags of positivecorrelations were examined. The delay period corresponded with the lag(s) with thestrongest positive correlation (i.e., one with Pearson’s correlation coefficients (R) ≥0.5). Permanent Water Body (PWB) and irrigated locations were exempted from thecross-correlation analysis to ensure the influence was climate alone.
3.3 ResultsPair-wise comparismFigure 3.3 compares the seasonality of EIRm with that of rainfall and temperature for
each climate zone. At Sahel (panel a) and Eritrea (panel e), a short rainfall season witha peak in August was observed. The duration of the EIR season was also notably briefand correlated with rainfall at a late period of about one month (peak in September).The full temperature range was warmer (range: 20◦C - 37◦C) and anti-correlated withboth rainfall and EIRm. At the rest of the zones (Savanna, Guinea, Cameroon andEEA), seasonal rainfall distributions were mainly bimodal. EIR season at each the
22

Bibliography
050
100150200250300
EIR
m [
ibp
p]
Sahel (a)
0
50
100
150
200
RR
[m
m]
23 22 23 23 22 18 7 2 3 1 10 160 1 0 0 1 5 16 21 20 22 13 7
15
20
25
30
35
40
Tx,T
m,T
n [
°C
]
0
50
100
150
EIR
m [
ibp
p]
Savanna (b)
0
50
100
150
200
RR
[m
m]
6 4 4 4 0 0 0 0 1 2 2 33 5 6 6 10 10 10 10 9 8 8 1
15
20
25
30
35
40
Tx,T
m,T
n [
°C
]
0
20
40
60
80
EIR
m [
ibp
p]
Guinea (c)
0
50
100
150
200
RR
[m
m]
17 19 17 8 4 4 2 5 2 4 8 127 5 7 12 20 20 21 18 19 17 16 12
20
25
30
Tx,T
m,T
n [
°C
]
0
50
100
150
200
EIR
m [
ibp
p]
Cameroon (d)
0
50
100
150
200
250
RR
[m
m]
4 4 2 2 2 2 0 2 3 5 4 59 9 11 11 11 11 13 11 10 8 9 8
20
22
24
26
Tx,T
m,T
n [
°C
]
0
10
20
30
40
50
EIR
m [
ibp
p]
1 2 3 4 5 6 7 8 9 101112
Month
Eritrea (e)
0
50
100
150
200
RR
[m
m]
9 8 7 9 7 9 4 4 2 4 5 60 1 2 0 2 0 5 5 7 5 4 3
15
20
25
30
35
40
Tx,T
m,T
n [
°C
]
0
50
100
150
EIR
m [
ibp
p]
1 2 3 4 5 6 7 8 9 101112
Month
EEA (f)
0
50
100
150
RR
[m
m]
7 11 15 6 7 6 5 7 8 10 10 612 14 10 18 18 19 20 17 16 14 14 18
15
20
25
30
Tx,T
m,T
n [
°C
]
var avgEIR RR Tn Tm Tx
Figure 3.3: Seasonal patterns of EIRm compared with that of rainfall and temperature oversub-Saharan Africa. Gray shaded area: variability of EIRm between minimum and maximum.Black star-dotted line: average EIRm. Rainfall: RR (blue line). Temperature: minimum (Tn,brown), mean (Tm, light red), maximum (Tx, red). Green and brown numbers show number ofmonths suggesting presence and absence of malaria respectively.
zones was mainly year-round and more intense in rainy season (see green numbers).However, EIR peaks were irregular with that of rainfall unlike at Sahel or Eritrea. Thetemperature at these zones also anti-correlated with EIRm and rainfall, but was slightlycolder at Cameroon and EEA (range: 18◦C and 27◦C) compared to that of Guinea orSavanna.
Peak characteristicsIn Figure 3.4, the seasonal peaking behaviour of EIRm over sub-Saharan Africa is illus-trated. At Sahel (panel a), EIRm distribution was outrightly unimodal. At the Savannazone (panel b), both unimodal and bimodal distribution were observed. But peakswere significantly unimodal than bimodal in the area. At Guinea (panel c), observedregimes were unimodal, bimodal and trimodal. However, peaks were again frequentlyunimodal than the other regimes. Peak characteristics at Cameroon (panel d) and EEA(f) were unimodal, bimodal and no peaks. But the zone was frequently unimodal andless bimodal with insignificant suggestions of no peaks. At Eritrea (panel e) both uni-modal and bimodal distribution were found with outstanding unimodal characteristicsthan bimodal.
Cross-correlationFigure 3.5 displays the lags and their corresponding Pearson’s correlation coefficient
between observed EIRm and rainfall. At Sahel (panel a), positive correlations variedbetween 0-3 lags with a significant (≥ 0.5) delay at 1 month. At Savanna (panel b),Guinea (panel c), and Cameroon (panel d), positive correlations ranged between delaysof 0-2 months but were all insignificant (< 0.5). Positive correlations at Eritrea (panele) were found between 0-2 lags with significant delay at 1 month like the Sahel. Thatof EEA (panel f) were observed between 0-3 lags with an insignificant peak at lag 2.
23

Bibliography 0
20
40
60
80
100
Fre
qu
en
cy
[%
] Sahel(a)
obs=22
None Unimodal Bimodal Trimodal
0
20
40
60
80
100
Savanna (b)
obs=10
None Unimodal Bimodal Trimodal
0
20
40
60
80
100F
req
ue
nc
y [
%] Guinea (c)
obs=24
None Unimodal Bimodal Trimodal
0
20
40
60
80
100
Cameroon (d)
obs=13
None Unimodal Bimodal Trimodal
0
20
40
60
80
100
Fre
qu
en
cy
[%
] Eritrea (e)
obs=9
None Unimodal Bimodal Trimodal
0
20
40
60
80
100
EEA (f)
obs=24
None Unimodal Bimodal Trimodal
Figure 3.4: Peak characteristics of EIRm over sub-Saharan Africa. obs: number of observa-tions
ElevationThe relationship between malaria seasonality and elevation are displayed alongside
with rainfall and temperature in figure 3.6. Generally, the timings, duration and peakseasons were similar at all elevations, but the intensity differed. EIR intensity wasinversely proportional to altitude, i.e., decreased with increasing elevation. Rainfalldistribution was similar at all elevations. Temperature range decreased as height in-creased.
Population densityIn Figure 3.7, the seasonality of malaria at rural, periurban and urban malaria locationsare compared. Averagely, EIR season was year-round at all settings. However, theseasonal intensity decreases from rural settings to periurban areas to urban settings.
Effect of hydrologyIn Figure 3.8 the temporary differences in malaria between neutral (which served as acontrol), PWB and irrigated locations are compared. At Sahel (upper row), the lengthof the season was longer and highly intense at PWB and irrigated sites than at controlareas. At the Savanna zone (second row), EIR distribution at control areas was similarto that of irrigated areas though a longer duration and high intensity at PWB locationswas observed. At Guinea and Cameroon, year-round transmission was the case atall settings, but EIR intensity was again high at PWB and irrigated locations than atcontrol sites.
Vector typeFigure 3.9 shows the geographical distribution of malaria vectors identified from the
24

Bibliography−1.0
−0.5
0.0
0.5
1.0
R c
oe
ffic
ien
t
Sahel (a)23 23 23 23 23 23 23 23 23 23 23 23
0 1 2 3 4 5 6 7 8 9 10 11
Savanna (b)10 10 10 10 10 10 10 10 10 10 10 10
0 1 2 3 4 5 6 7 8 9 10 11
−1.0
−0.5
0.0
0.5
1.0R
co
eff
icie
nt
Guinea (c)24 24 24 24 24 24 24 24 24 24 24 24
0 1 2 3 4 5 6 7 8 9 10 11
Cameroon (d)13 13 13 13 13 13 13 13 13 13 13 13
0 1 2 3 4 5 6 7 8 9 10 11
−1.0
−0.5
0.0
0.5
1.0
R c
oe
ffic
ien
t
Eritrea (e)
−1.0
−0.5
0.0
0.5
1.0
Lag [ months ]
9 9 9 9 9 9 9 9 9 9 9 9
0 1 2 3 4 5 6 7 8 9 10 11
EEA (f)
Lag [ months ]
25 25 25 25 25 25 25 25 25 25 25 25
0 1 2 3 4 5 6 7 8 9 10 11
Figure 3.5: Cross correlation between EIRm and rainfall at lags of 0 to 11 months. Brownnumbers (top of panels): number of monthly observations.
publications. They include An. gambiae (AG), An. funestus (AF), An. arabiensis(AA), An. nili (AN) and An. moucheti (AM). Among them, AG, AF and AA were themost dominant and in sympatry. AA was concentrated at areas with highly seasonalrainfall such as the Sahel or the drier Savannah areas in East Africa. AF was limitedto relatively humid areas in the West and East. AG was adaptive to all the variableecology of the sub-region. The AN and AM were confined to moist areas aroundCameroon.
Figure 3.10 shows the monthly contribution of AG, AF and AA (the three most domi-nant malaria vectors) to infectious bites in sub-Saharan Africa. At Sahel (panel a) andEritrea (panel e), exposure to infectious bites from the sympatric vectors was markedlyseasonal with monthly distribution following that of rainfall. EIRm contribution amongthe sympatric vectors was also keenly competitive. AG and AF were the sympatric vec-tors at Savanna (panel b), Guinea (panel c) and Cameroon (panel d). AG inoculationsmostly exceeded that of AF at Savanna and Guinea, especially in the rainy season.At Cameroon however, EIRm contributions from both vectors were highly competitiveexcept in the second rainy season where AF inoculations dominate that of AG for threemonths. At EEA (panel f), AA inoculations were mostly higher followed by that ofAG. Exposure to AF bites was least among the three vectors.
3.4 DiscussionImpact of temperature The pair-wise comparison results revealed the full seasonaltemperature window for sub-Saharan Africa to be about 18◦C - 37◦C. This tempera-
25

Bibliography 0
20
40
60
80
100
120
EIR
m [
ibp
p]
1 2 3 4 5 6 7 8 9 10 11 12
Month
H <= 500m (a)
3 3 5 1 0 0 0 0 0 1 1 02 2 0 4 5 5 5 5 5 4 4 5
1 2 3 4 5 6 7 8 9 10 11 12
Month
500m < H <= 1000m (b)
2 4 4 1 1 1 1 2 3 2 2 11 0 0 3 3 3 3 2 1 2 2 3
1 2 3 4 5 6 7 8 9 10 11 12
Month
1000m < H <= 1500m (c)
0
50
100
150
200
250
RR
[mm
]
0 1 2 1 1 1 0 1 1 2 2 02 2 1 2 2 2 3 2 2 1 1 3
10
15
20
25
30
35
Tx,T
m,T
n [
°C
]
variability avgEIR RR Tn Tm Tx
Figure 3.6: Seasonality of EIRm at different elevations in EEA. Gray shaded area: variabil-ity of EIRm between minimum and maximum. Black star-dotted line: average EIRm. Rain-fall: RR (blue line). Temperature: minimum (Tn, brown), mean (Tm, light red), maximum (Tx,red). Green and brown numbers show the number of months suggesting presence and absence ofmalaria respectively.
01020304050607080
EIR
m [
ibp
p]
1 2 3 4 5 6 7 8 9 101112
Month
Rural (a)
9 10 8 2 0 1 0 2 0 2 5 74 3 5 7 13 12 12 10 11 9 8 6
1 2 3 4 5 6 7 8 9 101112
Month
Periurban (b)
6 6 4 2 1 0 0 2 0 1 2 40 0 2 4 5 6 6 4 6 5 4 2
1 2 3 4 5 6 7 8 9 101112
Month
Urban (c)
050
100
150200250300
RR
[m
m]
2 3 5 4 3 3 2 1 2 1 1 13 2 0 1 2 2 3 4 2 3 4 4
variability avgEIR RR
Figure 3.7: Seasonality of EIRm at different Pd settings at the Guinean zone of West Africa.Gray Shaded area: EIRm variability between minimum and maximum. Black star-dotted line:average EIRm. Rainfall: RR (blue line). Green and brown numbers: number of monthly observa-tions suggesting malaria and no malaria respectively.
ture range coincidently falls within the required window (range: 18◦C - 40◦C, opti-mum: 22◦C - 32◦C (Craig et al. 1999)) for malaria transmission. This means that thetemperature boundary conditions for gonotrophic and sporogonic cycles (Macdonald1957) are widely suitable throughout the year in the entire region. Therefore, theremay be no possible biological delay between the onset of appropriate temperature con-ditions and malaria season onset. The anti-correlation between temperature and EIRm
is mainly due to the influence of rainfall on the seasonal distribution of temperature(Collins 2011). In a previous study, Mabaso et al. (2007) found minimum temperatureas one of the important determinants of EIR seasonality. In this study, however, alltemperature variables were largely within the range of malaria transmission. More-over, there was little temporal and spatial temperature variation in the entire region.Thus, the impact of temperature may be insignificant since the mosquito and parasitebiology are influenced by the extent of the diurnal temperature variation (Paaijmanset al. 2010; 2009). Though the temperature was slightly low at EEA (especially mini-mum temperature) compared to other zones, the effect may only likely delay the impactof rainfall on vector population at this zone. These findings demonstrate that, thoughtemperature is necessary for malaria transmission, it is essentially not a major playerin malaria transmission explaining EIR seasonality in Sub-Saharan Africa.
26

Bibliography 0
100
200
300
400
EIR
m [
ibp
p]
Sahel Neutral (a)
19 18 19 19 19 16 5 1 0 0 6 130 1 0 0 0 3 14 18 19 19 13 6
Sahel PWB (b)
2 4 6 6 8 3 1 0 0 0 0 014 12 10 10 8 13 15 16 16 16 16 16
Sahel Irrigated (c)
0
50
100
150
200
250
RR
[m
m]
4 4 4 4 2 0 1 1 1 1 1 41 1 1 1 3 5 4 4 4 4 4 1
0
50
100
150
EIR
m [
ibp
p]
Savanna Neutral (d)
6 4 4 4 0 0 0 0 1 2 2 3
3 5 6 6 10 10 10 10 9 8 8 1Savanna PWB (e)
0 0 0 0 0 0 0 0 0 0 0 0
2 2 2 2 2 2 2 2 2 2 2 1Savanna Irrigated (f)
0
50
100
150
200
250
RR
[m
m]1 0 1 1 0 0 0 0 0 0 0 0
1 2 5 5 6 6 6 6 6 6 6 0
0
20
40
60
80
EIR
m [
ibp
p]
Guinea Neutral (g)
9 10 8 2 0 1 0 2 0 2 5 74 3 5 7 13 12 12 10 11 9 8 6
Guinea PWB (h)
0 0 1 0 0 0 0 0 0 0 0 02 2 1 2 2 2 2 2 2 2 2 2
1 2 3 4 5 6 7 8 9 101112
Month
Guinea Irrigated (i)
050
100150200250300
RR
[m
m]
3 1 1 0 0 0 0 0 0 0 0 09 11 11 8 12 12 12 12 12 12 12 12
0100200300400500600
EIR
m [
ibp
p]
1 2 3 4 5 6 7 8 9 101112
Month
Cameroon Neutral (j)
4 4 2 2 2 2 0 2 3 5 4 57 7 9 9 9 9 11 9 8 6 7 6
1 2 3 4 5 6 7 8 9 101112
Month
Cameroon PWB (k)
050
100150200250300
RR
[m
m]
0 0 0 1 1 2 1 0 0 0 0 07 7 7 6 6 5 6 7 7 7 7 7
EIR variabilityaverage EIRRR (ARCv2)
Figure 3.8: Comparison of the seasonal distribution of EIRm at different settings of hydrol-ogy. Involves rural malaria locations only. Left column: Neutral areas (control), Middle column:PWB, and right column: Irrigated: Grey Shaded: EIR variability. Black star-dotted line: aver-age EIR. Blue line: Rainfall (RR). Green and brown numbers indicate the number of monthlyobservations suggesting presence and no malaria respectively.
Impact of rainfall Regarding rainfall, the results revealed a strong positive relation-ship between the seasonal distributions of rainfall and EIRm at each zone. The high cor-relation clearly manifest that rain mostly controlled the timings, duration and variabil-ity of EIRm seasonality. This applies in particular since rainfall provides the mediumfor vector breeding (Kar et al. 2014, Molineaux 1988) and essential humidity (at least60%) for vector survival (Thompson et al. 2005). Moreover, the timings and lengthof EIR season also strongly correlated with that of rainfall from the northern fringes(such as Sahel and Eritrea) towards equatorial areas (such as Cameroon and EEA).This pattern indicates that the degree of malaria seasonality is closely linked with thelatitudinal variation in rainfall in the region. The findings are also comparable to resultsof previous studies (Craig et al. 1999, Gething et al. 2011, Hay et al. 2009, Kiszewskiet al. 2004, MARA 1998) that have used climate variables to developed malaria maps.
The EIRm peaking behaviour can be attributed to the influence of rainfall on vectorpersistence. At Sahel and Eritrea, rainfall is highly seasonal (Nicholson 2013) andlimits the mosquito population during the long dry season. But transmission bouncesback with single peak in the short rainy season when suitable water requirements aremet for vector breeding. At bimodal rainfall areas (Savanna, Guinea Cameroon andEEA), mosquito populations do not go through the annual growth and decline cycleslike at Sahel and Eritrea. They persist at more stable levels (Craig et al. 1999). The dryperiod at these zones are short, hence local factors such as water containers, sporadicrain showers and humidity may maintain a greater population of the vectors within
27

Bibliography
−20˚
−20˚
−10˚
−10˚
0˚
0˚
10˚
10˚
20˚
20˚
30˚
30˚
40˚
40˚
50˚
50˚
−30˚ −30˚
−20˚ −20˚
−10˚ −10˚
0˚ 0˚
10˚ 10˚
20˚ 20˚
AG
AF
AA
AN
AM
Figure 3.9: Geographical distribution and sympatric association of malaria vectors in sub-Saharan Africa. Malaria vectors contributing to each location EIRm identified from the articles.The proximity of many sites was so close that the display of the vectors could not be explicitlyresolved on the map.
0
5
10
15
20
25
EIR
m [
ibp
p]
Sahel (a)
0
5
10
15Savanna (b)
0
50
100
150
200
RR
[m
m]
0
5
10
15
EIR
m [
ibp
p]
Guinea (c)
0
10
20
30
40
50
60Cameroon (d)
0
50
100
150
200
250R
R [
mm
]
0
5
10
15
EIR
m [
ibp
p]
1 2 3 4 5 6 7 8 9 10 11 12
Month
Eritrea (e)
0
10
20
30
1 2 3 4 5 6 7 8 9 10 11 12
Month
EEA (f)
0
50
100
150
RR
[m
m]
AG AF AA
Figure 3.10: Seasonal patterns of EIRm from three most dominant malaria vectors in sub-Saharan Africa. RR: rainfall (blue line)
28

Bibliography
this period. Besides, vectors may also adopt mechanisms that may maximise theirsurvival chances during these short dry period (Grover-Kopec et al. 2006, Patz et al.2003). The onset of the first rainy season will accelerate vector population growthwith pronouced peaks in this season. However, vector breeding habitats may becomeflooded, flushing out and killing some water-bound stage vectors during the secondrainy season. This is because the annual rainfall totals are high in these zones and thetwo rainy seasons consolidate each other in terms of water amount. This will lead toa decline in vector population in the second rainfall season rather than an increase.Besides, over-population of water-bound vector in the second rainy season may alsolimit available resources for their survival resulting in their death. Hence, the infuenceof rainfall on vector persistence may result in high tendency towards unimodal EIRm
distribution than bimodal.
The cross-correlation analysis showed the pause between the onset of suitable rainfallconditions and malaria season onset. The vector persistence phenomena again explainthe different lag pattern. The delay of 1 month at Sahel and Eritrea is due to the lim-iting nature of rainfall on vector population. Since temperature is already warmer andoptimum for malaria transmission, the biological delay may not be long when vectorpopulation bounces back in the rainy season. This also explains why malaria transmis-sion is markedly seasonal at those locations. At Savanna, Guinea and Cameroon, thelag was predominantly zero suggesting no delay in malaria season onset after rainfallseason onset. As highlighted afore, vectors at these zones may persist year-round. Theyear-round vector persistence additionally explains why malaria transmission at thesezones are year-round. On the other hand, the two months maximum lag at EEA wasinsignificant. This can be attributed to the relatively colder temperature influenced bythe complex interplay of topography and large inland water bodies in the area (Indejeet al. 2000). Hence periods at which rainfall temporarily coincides with temperaturefor transmission to occur takes a longer time. Hence the sporogonic and gonotrophiccycles takes longer days to complete (le Sueur and Sharp 1991, Rueda et al. 1990).
Previous works on cross-correlation analysis using EIR data were scarce for compar-ison. However studies using malaria cases for cross-correlations reported longer lagperiod than observed in this study. For instance, Briet et al. (2008) cross-correlatedmalaria cases with rainfall in Sri Lanka and found that the disease time series werelagging 0-3 months behind rainfall. Again predicting malaria epidemics in the Kenyanhighlands using climate data Githeko and Ndegwa (2001) found the association be-tween rainfall (and unusually high maximum temperatures) and the number of in-patient malaria cases 3-4 months later. These longer delays additionally provide in-formation on why malaria case data are not suitable for linking climate variables tomalariometric outcome directly.
AltituteThe intensity of EIRm and temperature were inversely proportional to elevation. Thus,malaria transmission is higher at low altitudes and low/free at higher elevations. Thedecrease in intensity towards higher elevations is due to the limiting nature of cool tem-peratures at high elevations on malaria transmission (Drakeley et al. 2005). Previousstudies have also reported similar findings. In Tanzania, Maxwell et al. (2003) sampledmosquitoes and found that EIR was about 17 times greater at a lowland than highland
29

Bibliography
area. In an entomological survey in Papua New Guinea, Attenborough et al. (1997)identified that the proportions of mosquitoes with malaria circumsporozoite antigenswere inversely proportional to altitude. In similar studies not using EIR (Akhwale et al.2004, Balls et al. 2004, Bodker et al. 2003), similar patterns were observed. Though thestudy was confined within altitudes below 1500m due to insufficient data, the resultsstill demonstrate that altitude is a useful proxy for temperature in malaria transmis-sion. Temperature therefore, is the chief factor controlling the difference in malariatransmission intensity between lowland and highland areas and can, therefore, serve asproxy for elevation and the disease transmission measurements.
HydrologyThe high intensity and longer seasonal duration of EIRm at PWB and irrigated loca-tions than at control areas is due to the impact of impounded water bodies on vectorpopulation. They aid transmission both in dry and wet (more intense) seasons as theirexistence increases the vector population (Fillinger et al. 2009). This means that in-habitants in areas invaded by PWB or irrigation will be exposed to higher malaria riskthan those away. Results from previous studies in this regard that directely used EIRm
were scare for comparison. However surrogates metrics from such studies revealedsimilar patterns. In an entomological study in Kenya, Zhou et al. (2007) found thatAn. gambiae and An. funestus populations decreased with increasing distance fromthe Yala river. In Burundi, Coosemans (985b) found the vectorial capacity of An. gam-biae s. l. to be 150 times higher in the rice irrigation scheme than in adjacent areas.On the other hand, EIRm intensity at Savanna (panel f of Figure 3.8) for irrigated areaswas lower than that of control locations. This irregularity has also been reported. InBobo Dioulasso, Burkina Faso, Robert et al. (1985) determined that the number of in-fective bites received in a rice growing area was similar to that in a control area. In theLower-Moshi rice irrigation scheme in Tanzania, Ijumba (1997) found that the numberof infective bites was 2.6 times lower in an irrigated area than in the control viallage.This irregularity seems to suggest that there is likely no simple relationship betweenirrigation and seasonal exposure to malaria.
Population densityObservation of the impact of Pd showed a decrease in malaria intensity from rural ar-eas to urban locations. This pattern is because increasing Pd from villages to urbanareas results in a reduction in biting ratios (Hay et al. 2005, Kelly-Hope and McKenzie2009). Additionally, polluted breedings grounds and access to public health servicesin urban areas also lowers transmission (Hay et al. 2005). Some research has demon-strated this clear conventional trend (Hay et al. 2005, Keiser et al. 2004, Wang et al.2005). For instance, in a review of malaria transmission in sub-Saharan African cities,Robert et al. (2003) found that annual mean EIRs decreased from the city centres torural areas (7.1 at city centres, 45.8 in periurban areas, and 167.7 in rural areas). InBurkina Faso, Modiano et al. (1999) found epidemiological profiles and clinical pat-terns to be high in the countryside than at urban environments.
Vector typeThe dominant malaria vectors identified corroborate other works (Coetzee et al. 2000,Lindsay et al. 1998, Sinka et al. 2010). The distribution patterns of their ecologicalconfinements suggest an influence of climatological factors on habitat preference. For
30

Bibliography
instance the isolation of AA to drier savannah areas may be due to its preference forsunlit breeding sites with relatively limited emergent vegetation (Coetzee et al. 2000,Sinka et al. 2010). The sympatric association of the vectors also validates existing liter-ature. For instance AG reportedly occur in sympatry with AF and AA with all sustain-ing perenial parasite innoculation (Charlwood et al. 2003, Elissa et al. 2003). Collinsand Besansky (1994) indicates that almost all malaria cases in Africa are entirely at-tributed to these three vectors. The high contribution of these vectors to infectious bitesmay also be explained largely by their high anthropophilic attitude (Coosemans et al.1992). The predominance of AG and AF than AA may also be explained by their highlongevity (Coosemans et al. 1992). AG and AF are predominant throughout the yearwith former more in the rainy season and the latter more in the dry season (Adja et al.2011, Nkuo-Akenji et al. 2006). The longevity of these vectors also accounts for thestability of malaria in parts of Africa where they exist.
3.5 Summary and conclusionsThe study examined the seasonality of EIRm in sub-Saharan Africa with the goal to un-derstand how climatic and environmental factors impacted on seasonal malaria trans-mission in the sub-region. The work revealed that 1) rainfall is the primary climaticfactor limiting malaria seasonality in the Sahel and Eritrea. But its impact on bimodalrainfall distributed and more humid zones was more complicated. 2) Temperature isnot a limiting factor of malaria seasonality except at equatorial East Africa where it candelay the impact of rainfall. 3) The peaking characteristics of seasonal malaria (EIRm)were mostly unimodal. In cases of bimodal rainfall distributions, peak malaria trans-mission are frequently associated with the first rainfall maximum of the year. 4) Theseasonal malaria intensity was anti-correlated with elevation and population density.5) Permanent water bodies and irrigation intensified and altered malaria transmissionpattern from seasonal to perennial especially in areas such as Sahel and Eritrea. 6)Though seasonal malaria was driven mainly by AG, AF and AA, these vectors had acompeting and complex individual impact on seasonality.
Though EIR data are scarce (Hay et al. 2005, Kelly-Hope and McKenzie 2009), thestudy relied on EIRm data that were within reach and does not claim to have identi-fied all EIRm data available across sub-Saharan Africa. The study also acknowledgesthat the observed EIRm time series were both spatially and temporally limited and un-available for many settings due to the labour and capital intensive nature involved inits collection. These challenges coupled with inherent uncertainties in EIRm data dur-ing collection (see Appendix A) could have an adverse impact on the outcome of thisstudy. Future EIRm estimates should, therefore, focus on areas of unavailable data inorder to consolidate the spatial homogeneity of EIR data distribution.
Despite the uncertainties in the EIRm data, the results consolidate evidence of the linkbetween seasonal malaria transmission with climate and environment. It informs ourunderstanding of the impact of climate and environment on vector biology, transmis-sion intensity, clinical disease and mortality risks. The use of EIRm provided the meansto directly relate human risk to infectious mosquito bites to climate and environment.It therefore provides valuable information for improvement and validation of weather-driven dynamical mathematical malaria models for estimation of seasonal malaria in
31

Bibliography
the area. The study also supplements previous works describing clinical patterns ofmalaria infection and morbidity. It can help stakeholders establish a robust frameworkfor monitoring, forecasting and control of malaria. Thus, information from this studymay aid the spatial targeting of malaria interventions and resource allocation optimisa-tion at locations where climatic and environmental diversity results in seasonal malariatransmission heterogeneity. For instance, year-round malaria chemoprevention in chil-dren and pregnant women is cost-effective at perennial transmission settings than atmarkedly seasonal transmission settings (Cairns et al. 2012). Temperature surveil-lance and monitoring at highlands areas is necessary since climate change is expectedto move malaria to such locations. Elevation can also serve as a proxy for temperaturein malaria transmission measurements for an optimum appropriation of control mea-sures. Malaria vector surveillance and monitoring operations are necessary at locationsinvaded by permanent water bodies and irrigation for appropriate application of con-trol measures. Access to public health services and poverty alleviation in the rural areais needed to curb the high malaria transmission.
32

CHAPTER 4
The accuracy of VECTRI and LMM2010 in simulatingseasonal malaria transmission in Africa as a function ofclimate and environment
AbstractVECTRI and LMM2010 are novel weather-driven dynamical mathematical malaria mod-els that have been applied in Africa to predict epidemic and endemic malaria. Butranges of their seasonal malaria simulations has not been validated with observed datafrom malaria locations across different climatic and environmental settings in the re-gion. Therefore, information as to whether or not they realistically follow the sea-sonal evolution of the disease in the region as a function of climate and environmentis lacking. In this study, monthly Entomological Inoculation Rate (EIRm) data wasused to validate ranges of seasonal malaria simulated by both VECTRI and LMM2010
with the goal of examining their seasonal malaria simulation accuracy. The EIRm datawere gathered from different epidemiological settings across Africa via literature sur-vey. The validation revealed that LMM2010 and VECTRI error ranges were generallywithin or about the same as the standard deviation of the observed data though largererrors were detected for Guinea and some individual monthly minor differences. Bothmodels also agreed with observations that the seasonal peaking behaviour of malariais predominantly unimodal. However, transmission peaks in the models tend to be de-layed by one month in the Sahel and Eritrea area. Both models further agreed withobserved values of a seasonality index that the seasonal malaria transmission contrastis closely linked with the latitudinal variation of climatic covariates such as rainfall inAfrica. VECTRI revealed a stronger ability in capturing the levels of malaria endemic-ity in East Africa than LMM2010. The hydrology model in VECTRI poorly capturesseasonal malaria transmission at permanent water body locations. Though both hadloopholes, the validation revealed they could realistically reproduce the seasonal evo-lution of the disease in Africa as a function of climate and environment. The findings,therefore, provides the basis for further review and refinement of the models by theirdevelopers to stage them as best fundamental tools for seasonal malaria prediction.
4.1 BackgroundMathematical models of malaria transmission have provided a framework for under-standing the complex transmission dynamics of the disease (Dobson and Carper 1992,Mandal et al. 2011, Parham and Michael 2010). Hence, they are useful in decision-making processes regarding malaria control. For instance, malaria models have helpedquantify current and future changes in the disease progression (Patz et al. 2003) andused to evaluate the impact of intervention strategies applied individually or in pack-ages (Chitnis et al. 2008).
33

Bibliography
The LMM2010 (Ermert et al. 2011a) and the VECTRI (Tompkins and Ermert 2013), aresuch innovative weather-driven dynamical mathematical malaria models. They havebeen applied in Africa to predict epidemic and endemic malaria for the region. Forinstance, Ermert et al. (2012) used LMM2010 to assess the impact of climate change ondisease in Africa. Revisiting a previously assessed potential impact of climate changeon the seasonality of malaria in Africa, Ermert et al. (2013) compared data from theMalaria Atlas Project (MAP) and LMM2010. Using ECMWF monthly and seasonalclimate forecast, Tompkins and Di Giuseppe (2015) applied VECTRI to predict thepotential of malaria in Africa. Caminade et al. (2014) used biased-corrected rainfalland future temperature projections from climate models to compare the metrics of fiveimpact malaria models, among which VECTRI is one, at a global scale for three futuretime periods of the 2030s, 2050s, and 2080s.
Despite the useful application of both models in understanding malaria transmission inAfrica, their seasonal simulation of malaria has not been validated with observed datafrom different settings of climate and environment across the region. Validation of theirseasonal malaria outcome is necessary since the disease locations used during theircalibrations are meteorologically different from other areas of the area. The results ofthe validation will inform about the extent to which their seasonal malaria simulationrepresent the local malaria conditions of the different epidemiological settings of theregion. Thus, the accuracy and generality of seasonal malaria they predict for Africawill be maximised and known. This will assist both model developers in their planstowards refinement as good malaria forecasting tools.
This study validates and evaluates seasonal malaria simulated for sub-Saharan Africaby LMM2010 and VECTRI. The goal is to understand whether both models follow theseasonal evolution of the disease in the region as a function of climate and environmentto a large extent. Ranges of EIRm simulated by both models were pair-wise comparedwith field observed EIRm data. A review of both model skills enabled the test of theproposition that 1) The error ranges of EIRm simulated by LMM2010 and VECTRIwere generally within or about the same as the standard deviation of the observed data.2) The seasonal peaking behaviour of EIRm predicted by both models was similar tothe observed. 3) The simulated seasonal malaria contrast of LMM2010 and VECTRIwere akin to that of the observed and linked with the latitudinal variation of climaticcovariates such as rainfall. 4) The models were able to capture the different levels ofmalaria endemicity in East Africa. 5) The hydrology model in VECTRI enabled it tocapture seasonal malaria transmission at permanent water body locations very well.
4.2 Data and methods
4.2.1 Data
Observed EIRm [units: ibpp]Observed EIRm data were gathered from many malaria locations across sub-SaharanAfrica (see Figure 3.1). Data collection methods, sources and inclusion criteria aredetailed in Chapter 3. Inherent uncertainties associated with the field EIRm data aswell as the categorization of data locations into climate zones, hydrology and Pd aredescribed in Appendix A. The study analysis used EIRm data between the period 1983-
34

Bibliography
2013 since more observations were within that period (see Figure 3.2). Besides, therainfall data (ARCv2 dataset) are available from 1983 onwards.
Model inputContinuous daily time series of rainfall and temperature forms the input data for LMM2010
and VECTRI. Regarding rainfall, the ARCv2 daily dataset (Novella and Thiaw 2013)was utilised. For temperature, the ERAI daily dataset (Dee et al. 2011) was used. Boththe temperature and rainfall time series spanned from 1983-2013. Pd is an extra inputdata of VECTRI and utilized in the model calculation of mosquito biting ratio (Tomp-kins and Ermert 2013). The Pd data used was that of the GPDWv3 (CIESIN-CIAT2005). Details about these input data products and processing steps are described inChapter 3.
Model outputLMM2010 and VECTRI (v1.4) were driven with the daily input data from 1983-2013 foreach malaria location (see Figure 3.1). To attain equilibrium, the initial climate forcingof 1983 was repeated in both model simulations for 23 years before passing in the otheryears. The output of LMM2010 and VECTRI comprised of several variables includingEIR, HBR, and CSPR. Following the reason, that available field observed data forvalidation was only EIRm, the daily EIR simulated by both models were processed tomonthly and used for analysis.
4.2.2 Methods
Pair-wise comparismVECTRI and LMM2010 simulated EIRm were pair-wise compared with the observed.The error contrast between the pairs (i.e. LMM2010 vs observed and VECTRI vs ob-served) was measured with Mean Absolute Error (MAE). The MAE was defined as thearithmetic average of the absolute differences between the observed (Oi) and predicted(Pi) values (Legates and McCabe Jr 1999) of EIRm:
MAE =1
n[n∑i=1
∣∣Pi −Oi|] (4.1)
where n is the number of observations. MAE can range from zero to a large positivevalue (Moriasi et al. 2007, Willmott et al. 1985). According to Singh et al. (2004),MAE values ≤ half the standard deviation (σ) of the observed data are low and appro-priate for model evaluation. In this study, Singh et al. (2004) idea of error significancewas adapted. Errors of VECTRI and LMM2010 in simulating EIRm were consideredlow if MAE ≤ σ of the observed EIRm. The decision to use full σ instead of half σwas based on the coarse nature of the observed EIRm (see Appendix A).Mean Bias Error was also applied to the pairs to measure the tendency of EIRm simu-lated by both models to be larger or smaller than the observed counterpart. The MBEwas defined as the average of the differences between Pi and Oi pairs (Gupta et al.1999a, Wilks 1995):
MBE =1
n[n∑i=1
(Pi −Oi)] (4.2)
35

Bibliography
Table 4.1: Seasonality index (SI) of EIR and the corresponding seasonal regimeSeasonal EIR regime Seasonal Index (SI)Very equable ≤ 0.19Equable with a definate EIR season 0.20− 0.39Rather seasonal with a short period without EIR 0.4− 0.59Seasonal 0.6− 0.79Markely seasonal with longer period without EIR 0.8− 0.99Most EIR in 3 months or less 1.00− 1.19Extreme, almost all EIR in 1 to 2 months ≥ 1.20
MBE value closed to zero indicates equal distribution between negative and positiveerrors (Gupta et al. 1999a). Like MAE, the monthly biases of both models were lowand acceptable if MBE ≤ σ of the observed EIRm. Malaria locations in the vicin-ity of permanent water bodies and irrigation were excluded in both MAE and MBEcalculations.
Peak characteristicsThe time series of EIRm simulated by LMM2010 and VECTRI were analysed regardingpeak behaviour in a year and compared with that of the observed for each zone. Onan EIRm time series within a year, a peak was defined as a local maximum with twopoints on either side being smaller than it. Details on how peaks were identified aredescribed in Chapter 3 (see section 3.2.2). The peak analysis was done for each year ofavailable EIRm of all locations except permanent water bodies and irrigated locations.
Relative seasonalityThe seasonal contrasts in malaria amounts within a year rather than whether or not amonth had malaria, was assessed. This was done by quantifying the seasonal contrastin EIRm amount with a seasonality index (SI) (Walsh and Lawler 1981) previouslyapplied to rainfall. The index was defined as the sum of the absolute deviations ofEIRm from the overall monthly mean (EIRµ), divided by the annual EIR (EIRa).
SI =1
EIRa
12∑n=1
∣∣EIRm − EIRµ|. (4.3)
Estimated SI values from both models were then compared with the observed. Thechoice of this index was due to its advantage of showing differences in relative sea-sonality even at areas with two seasonal malaria peaks. Ranges of SI values and theircorresponding seasonal regimes are presented in Table 4.1. Again malaria locations inthe vicinity of permanent water bodies and irrigation were excluded.
EndemicityThe ability of the models to differentiate levels of malaria endemicity in the regionwas investigated. To achieve this, the definition of endemicity by Beier et al. (1999)was utilized. LMM2010 and VECTRI simulated EIR for East Africa were categorizedinto high (EIRa > 100), mild (EIRa between 10-100), low (EIRa between 1-10),very low (EIRa between 0-1) and no transmission (EIRa = 0). These categorizedlevels of transmission were then contrasted with elevation and validated with the ob-
36
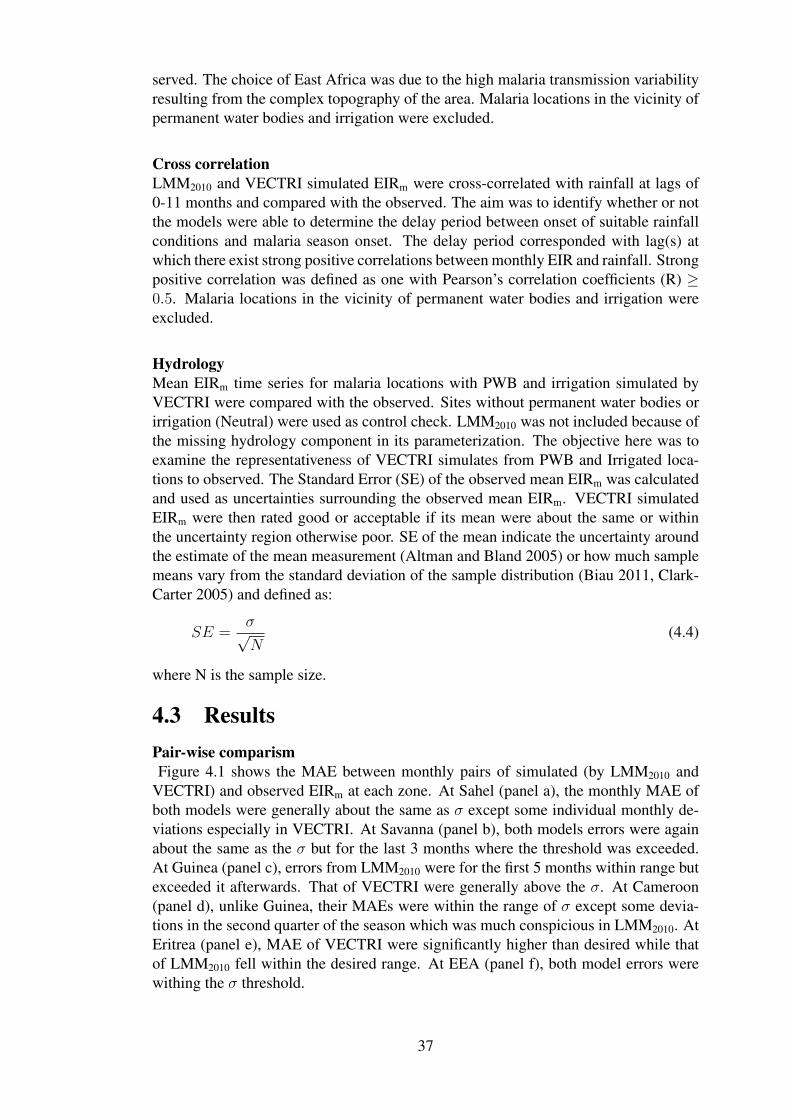
Bibliography
served. The choice of East Africa was due to the high malaria transmission variabilityresulting from the complex topography of the area. Malaria locations in the vicinity ofpermanent water bodies and irrigation were excluded.
Cross correlationLMM2010 and VECTRI simulated EIRm were cross-correlated with rainfall at lags of0-11 months and compared with the observed. The aim was to identify whether or notthe models were able to determine the delay period between onset of suitable rainfallconditions and malaria season onset. The delay period corresponded with lag(s) atwhich there exist strong positive correlations between monthly EIR and rainfall. Strongpositive correlation was defined as one with Pearson’s correlation coefficients (R) ≥0.5. Malaria locations in the vicinity of permanent water bodies and irrigation wereexcluded.
HydrologyMean EIRm time series for malaria locations with PWB and irrigation simulated byVECTRI were compared with the observed. Sites without permanent water bodies orirrigation (Neutral) were used as control check. LMM2010 was not included because ofthe missing hydrology component in its parameterization. The objective here was toexamine the representativeness of VECTRI simulates from PWB and Irrigated loca-tions to observed. The Standard Error (SE) of the observed mean EIRm was calculatedand used as uncertainties surrounding the observed mean EIRm. VECTRI simulatedEIRm were then rated good or acceptable if its mean were about the same or withinthe uncertainty region otherwise poor. SE of the mean indicate the uncertainty aroundthe estimate of the mean measurement (Altman and Bland 2005) or how much samplemeans vary from the standard deviation of the sample distribution (Biau 2011, Clark-Carter 2005) and defined as:
SE =σ√N
(4.4)
where N is the sample size.
4.3 ResultsPair-wise comparismFigure 4.1 shows the MAE between monthly pairs of simulated (by LMM2010 and
VECTRI) and observed EIRm at each zone. At Sahel (panel a), the monthly MAE ofboth models were generally about the same as σ except some individual monthly de-viations especially in VECTRI. At Savanna (panel b), both models errors were againabout the same as the σ but for the last 3 months where the threshold was exceeded.At Guinea (panel c), errors from LMM2010 were for the first 5 months within range butexceeded it afterwards. That of VECTRI were generally above the σ. At Cameroon(panel d), unlike Guinea, their MAEs were within the range of σ except some devia-tions in the second quarter of the season which was much conspicious in LMM2010. AtEritrea (panel e), MAE of VECTRI were significantly higher than desired while thatof LMM2010 fell within the desired range. At EEA (panel f), both model errors werewithing the σ threshold.
37

Bibliography0
50
100
MA
E [
ibp
p]
Sahel (a)23 23 23 23 23 23 23 23 23 23 23 23
0
20
40
Savanna (b)9 9 10 10 10 10 10 10 10 10 10 4
0
10
20
30
MA
E [
ibp
p]
Guinea (c)24 24 24 20 24 24 23 23 21 21 24 24
0
20
40
60
80
Cameroon (d)13 13 13 13 13 13 13 13 13 13 13 13
0
10
20
30
40
MA
E [
ibp
p]
1 2 3 4 5 6 7 8 9 101112
Month
Eritrea (e)9 9 9 9 9 9 9 9 9 9 9 9
0
10
20
30
40
1 2 3 4 5 6 7 8 9 101112
Month
EEA (f)19 25 25 24 25 25 25 24 24 24 24 24
standard deviation vectri lmm
Figure 4.1: Monthly MAE of LMM2010 and VECTRI. Grey shaded region: σ of the observedEIRm. MAE is Low and acceptable if its ≤ σ. Green numbers: number of monthly observationsinvolved.
Figure 4.2 displays the MBE between monthly pairs of simulated and observed EIRm
at each zone. At Sahel (panel a), both models generally over-estimated EIRm. How-ever, the monthly bias errors were generally within the range of σ except some minormonthly hitches, especially in VECTRI. At the Savanna zone (panel b), LMM2010
under- and over-simulated EIRm towards mid and last 3 months of the season respec-tively. VECTRI in general over-estimated EIRm in most parts of the season. However,the bias errors were within ranges of σ of the observed but for the last 3 months ofthe season. At the Guinean zone (panel c), VECTRI generally over-estimated EIRm.LMM2010, however, under-simulated EIRm in first 5 months but over-estimated EIR therest of the season. VECTRI biases were generally slightly above the σ. LMM2010 bi-ases were within the ranges of σ except the last 2 months of the season. At Cameroon(panel d) both models displayed a similar bias pattern. They either over- or under-simulated EIRm. Bias errors were within ranges of σ. At Eritrea (panel e) VECTRIover-simulated EIRm with biases outside the ranges of σ of the observed. LMM2010
under- and over-estimated EIRm but its biases fell within ranges of σ. At EquatorialEast Africa (panel f), both models under-estimated EIR with biases within ranges of σof the observed.
Peak characteristicsFigure 4.3 illustrates the seasonal regimes of EIRm distribution simulated by LMM2010
and VECTRI compared to that of observed. At Sahel (panel a), the observed EIRm dis-tribution unequivocally indicated unimodal distribution. Both model simulates highlyagreed with the observed though few observations of both models (quite visible in
38

Bibliography −80−60−40−20
020406080
MB
E [
ibp
p]
Sahel (a)15 15 15 15 15 15 15 15 15 15 15 15
−40
−20
0
20
40
Savanna (b)9 9 9 9 9 9 9 9 9 9 9 9
−30
−20
−10
0
10
20
30M
BE
[ib
pp
]
Guinea (c)18 18 18 18 18 18 18 18 18 18 18 18
−80−60−40−20
020406080
Cameroon (d)13 13 13 13 13 13 13 13 13 13 13 13
−20
−10
0
10
20
30
40
MB
E [
ibp
p]
1 2 3 4 5 6 7 8 9 101112
Month
Eritrea (e)9 9 9 9 9 9 9 9 9 9 9 9
−40−30−20−10
010203040
1 2 3 4 5 6 7 8 9 101112
Month
EEA (f)25 25 25 25 25 25 25 25 25 25 25 25
standard deviation vectri lmm
Figure 4.2: Monthly MBE of LMM2010 and VECTRI. Same as figure 4.1 but for MBE
VECTRI) suggested bimodality. At Savanna zone (panel b), unimodal and bimodalEIR distribution were suggested by both models and the observed. However, numberof observations suggesting bimodality were few compared to unimodality. At Guinea(panel c) uni- and bimodal were conspicuous though there were few suggestions oftrimodal by observed data. At Cameroon (panel d) and EEA (f), though few obser-vations suggested no peaks, unimodal and bimodal distribution were suggested withunimodality more pronounced than bimodality. Similar to Savanna, Eritrea (panel e)displayed both uni- and bimodality. But the percentage of observations suggesting bi-modal distribution were far too less considering the total number of monthly observa-tions involved. In summary, both models and the observed suggested that the tendencytowards unimodal EIR distribution was more likely at all zones than any other regimes.In Figure 4.4 and 4.5, EIR peak months at unimodal and bimodal distributed areas arerespectively illustrated. At unimodal areas ( Figure 4.4), seasonal peak dates estimatedby both models and observed varied widely at all zones. At Sahel (panel a) and Eritrea(panel b), both models and observed peaks were most frequent in September, a monthbehind rainfall and in October by only both models two months behind rainfall. At theSavanna, peak months widely varied between May and November. At Guinea, peaksmostly varied between May-July and were often earlier than rainfall. At Cameroonand EEA, peak months were more visible in May/June.At bimodally distributed areas (Figure 4.5) the number of observations for observedEIRm were too few compared to that of the models. At Sahel, only both models sug-gested bimodal peaks in July and October. At Savanna, first and second peaks occuredin June/July and October/November respectively. At Guinea, Cameroon and EEA,the first season peaks were spread between March and July and the second mostly inOctober-November. At Eritrea, bimodality was visible in the observed EIRm, but thenumber of observations were too few to be considered hence likely fake.
39

Bibliography 0
20
40
60
80
100
Fre
qu
en
cy
[%
] Sahel(a)
#obs=22
#lmm=455
#vect=453
None Unimodal Bimodal Trimodal
0
20
40
60
80
100
Savanna (b)
#obs=10
#lmm=279
#vect=279
None Unimodal Bimodal Trimodal
0
20
40
60
80
100F
req
ue
nc
y [
%] Guinea (c)
#obs=24
#lmm=554
#vect=434
None Unimodal Bimodal Trimodal
0
20
40
60
80
100
Cameroon (d)
#obs=13
#lmm=372
#vect=279
None Unimodal Bimodal Trimodal
0
20
40
60
80
100
Fre
qu
en
cy
[%
] Eritrea (e)
#obs=9
#lmm=229
#vect=207
None Unimodal Bimodal Trimodal
0
20
40
60
80
100
EEA (f)
#obs=24
#lmm=473
#vect=237
None Unimodal Bimodal Trimodal
observed lmm vectri
Figure 4.3: Seasonal peaking behaviour of EIRm over sub-Saharan Africa Number of obser-vations for models and observed are printed in the panel for each zone.
Relative seasonalityThe degree of EIR seasonality with respect to latitude simulated by LMM2010 and
VECTRI are validated with observed and displayed in Figure 4.6. At both regions,simulated (LMM2010 and VECTRI) and observed SI values were low at equatorialregions, increased with increasing latitudes towards the northern fringes such as theSahel and Eritrea where highest SI values were observed. In WA, observed and sim-ulated SI values both ranged between 0.2 at equatorial areas to about 2 in the Sahel.The pattern of LMM2010 (panel a) and VECTRI (panel c) simulated SI values wereboth comparable to that of the observed at WA and EA. Unlike WA where the scatterof SI values were seemingly uniform, SI values in EA were widely dispersed at theequatorial East Africa. In general, the degree of EIR seasonality was closely linked tolatitudinal variation in climatic covariates such as rainfall in both West and East Africa,which both models were able to mimic well.
EndemicityIn Figure 4.7, the association between malaria endemicity and elevation are displayed.The field observed data (panel a) showed a decrease in endemicity from low to highelevations. In other words, malaria transmission intensity decreased from high to notransmission at low to high elevations respectively. VECTRI simulates (panel b) wereable to mimic similar transmission pattern as the observed. LMM2010 simulates (panelc) were patchy.
VECTRI simulated EIRm cross-correlated with rainfallFigure 4.8 displays the lags and their corresponding Pearson’s correlation coefficient
40

Bibliography
0
20
40
60
80
100
Fre
qu
en
cy [
%]
1 2 3 4 5 6 7 8 9 10 11 12
Sahel (a)
0
50
100
150
200
#obs=22
#lmm=448
#vect=393
1 2 3 4 5 6 7 8 9 10 11 12
Eritrea (b)
0
50
100
150
200
RR
[ m
m ]
#obs=7
#lmm=219
#vect=201
0
20
40
60
80
100
Fre
qu
en
cy [
%]
1 2 3 4 5 6 7 8 9 10 11 12
Savanna (c)
0
50
100
150
200
#obs=9
#lmm=233
#vect=215
1 2 3 4 5 6 7 8 9 10 11 12
Guinea (d)
0
50
100
150
200
RR
[ m
m ]
#obs=19
#lmm=440
#vect=354
0
20
40
60
80
100
Fre
qu
en
cy [
%]
1 2 3 4 5 6 7 8 9 10 11 12
Month
Cameroon (e)
0
50
100
150
200
250
#obs=8
#lmm=317
#vect=197
1 2 3 4 5 6 7 8 9 10 11 12
Month
EEA (f)
0
50
100
150
RR
[ m
m ]
#obs=16
#lmm=361
#vect=182
observed lmm vectri
Figure 4.4: EIR peak months at unimodal distributed areas
0
20
40
60
80
100
Fre
qu
en
cy [
%]
1 2 3 4 5 6 7 8 9 10 11 12
Sahel (a)
0
50
100
150
200
#obs=0
#lmm=14
#vect=120
1 2 3 4 5 6 7 8 9 10 11 12
Eritrea (b)
0
50
100
150
200
RR
[ m
m ]
#obs=4
#lmm=20
#vect=10
0
20
40
60
80
100
Fre
qu
en
cy [
%]
1 2 3 4 5 6 7 8 9 10 11 12
Savanna (c)
0
50
100
150
200
#obs=2
#lmm=92
#vect=126
1 2 3 4 5 6 7 8 9 10 11 12
Guinea (d)
0
50
100
150
200
RR
[ m
m ]
#obs=8
#lmm=226
#vect=160
0
20
40
60
80
100
Fre
qu
en
cy [
%]
1 2 3 4 5 6 7 8 9 10 11 12
Month
Cameroon (e)
0
50
100
150
200
250
#obs=8
#lmm=110
#vect=140
1 2 3 4 5 6 7 8 9 10 11 12
Month
EEA (f)
0
50
100
150
RR
[ m
m ]
#obs=12
#lmm=142
#vect=84
observed lmm vectri
Figure 4.5: Peak months at bimodal EIR distributed areas
41

Bibliography
0.0
0.4
0.8
1.2
1.6
2.0
Se
as
on
al
ind
ex
−10 −5 0 5 10 15 20
LMM2010 WA (a)
−10 −5 0 5 10 15 20
LMM2010 EA (b)
0.0
0.4
0.8
1.2
1.6
2.0
Se
as
on
al
ind
ex
−10 −5 0 5 10 15 20
Latitude [°]
VECTRI WA (c)
−10 −5 0 5 10 15 20
Latitude [°]
VECTRI EA (d)
Model Observed
Figure 4.6: Scatter diagram of EIR SI with latitude. Panel a: West Africa (WA), Panel b: EastAfrica (EA). m is the slope, e is the error in slope and s is the level of significance in slope
from cross-correlation between VECTRI simulated EIR and rainfall compared to ob-served. At Sahel (panel a), the observed and VECTRI showed positive correlations at0-3 lags. The observed correlations were significant at 0-2 lags while that of VECTRIwere significant at 1-3 lags. At Eritrea (panel b), the observed demonstrated positivecorrelations at 0-2 lags while that of VECTRI were 0-3 lags. The observed correlationswere significant at 0-1 lags while VECTRI were significant at 1-2 lags. At Savanna(panel c) and Guinea (panel d), positive correlations of the observed ranged at 0-2lags with peak correlation at 0 lag. That of VECTRI ranged from 0-3 lags at Savannawith peaks at 1-2 lags and 0-2 at Guinea with peaks at 0-1 lags. At Cameroon, bothobserved and VECTRI displayed insignificant positive correlations varying between0-2 lags with peak at 0 lag for the observed and at lag 1 for VECTRI. At EEA, bothobserved at VECTRI showed positive correlations at 0-3 lags with peak at 1-2 lags.
LMM2010 simulated EIRm cross-correlated with rainfallSimilar to Figure 4.8, the corresponding cross-correlations of LMM2010 output con-
trasted with the observed are displayed in Figure 4.9. At Sahel (panel a), both theobserved and LMM2010 showed positive correlations at 0-3 lags. LMM2010 correla-tions were significant at 1-2 lags as that of observed was at 0-2 lags. At Eritrea (panelb), the observed demonstrated positive correlations at 0-2 lags while that of LMM2010
were 0-3 lags. The observed correlations were significant at 0-1 lags while LMM2010
were significant at 2-3 lags. At Savanna (panel c) and Guinea (panel d), positive cor-relations of the observed ranged at 0-2 lags with peak correlation at 0 lag. That ofLMM2010 ranged 0-5 lags at Savanna with peaks at 1-2 lags and 0-3 at Guinea withpeak at lag 1. At Cameroon, both observed and LMM2010 displayed insignificant pos-itive correlations at 0-2 lags and 0-3 lags respectively with both peaking at lag 0. At
42

Bibliography0
5001000150020002500
Ele
vatio
n [
m]
(a)16 14 12 5 2
High
Mild
Low
Very−
Low
NO
(b)10 17 10 1 11
High
Mild
Low
Very−
Low
NO
0500
1000150020002500
Ele
va
tio
n [
m]
(c)10 3 9 11 16
High
Mild
Low
Very−
Low
NO
Observed (a)VECTRI (b)LMM2010 (c)
Figure 4.7: Malaria endemicity in East Africa. Excludes all locations in the vicinity of perma-nent water bodies and irrigation.
EEA, both observed and LMM2010 displayed positive correlations at 0-3 lags with peakat 1-2 lags.
Hydrology: Permanent water bodies and irrigationFigure 4.10 displays the seasonality of VECTRI simulated EIRm for malaria locationsat different settings of hydrology compared with the observed. At Sahel (upper row),the intensity of the simulated EIRm for PWB and irrigated locations were higher thanat control areas. At Savanna, simulations for PWB locations were lower than controlsites while that of irrigated areas were higher. Simulations for PWB areas at Guineaand Cameroon were also lower than control areas. However, VECTRI estimations forcontrol and irrigated areas at Guinea were largely over-estimated.
4.4 DiscussionThe main aim of this study was to validate and evalute seasonal malaria simulated byVECTRI and LMM2010 with the goal to determine whether they realistically predictrepresentative seasonal malaria for Africa as a function of climate and environment.This section provides a detailed discussion of the various aspects investigated withreferences to results of previous studies where possible.
Pair-wise comparismThe results of MAE and MBE showed that though some individual monthly errors ofboth models were slightly higher than expected (e.g. at Savanna), majority of the errorswere either about the same or within the acceptable range. Of course these individualmonthly deviations were expected since it is impossible for the models to be able todefine the precise edges of each EIRm value at each zone. This is because they arenot be able to capture all the small scale ecological variability and temporal changesin transmission risk. Besides, both models are still under development and have not
43

Bibliography −1.0
−0.5
0.0
0.5
1.0
R c
oeff
icie
nt
Sahel VECTRI (a)141414141414141414141414
0 1 2 3 4 5 6 7 8 9 1011
Eritrea VECTRI (b)9 9 9 9 9 9 9 9 9 9 9 9
0 1 2 3 4 5 6 7 8 9 1011
−1.0
−0.5
0.0
0.5
1.0
R c
oeff
icie
nt
Savanna VECTRI (c)9 9 9 9 9 9 9 9 9 9 9 9
0 1 2 3 4 5 6 7 8 9 1011
Guinea VECTRI (d)181818181818181818181818
0 1 2 3 4 5 6 7 8 9 1011
−1.0
−0.5
0.0
0.5
1.0
R c
oeff
icie
nt
Lag [month]
Cameroon VECTRI (e)131313131313131313131313
0 1 2 3 4 5 6 7 8 9 1011Lag [month]
EEA VECTRI (f)242424242424242424242424
0 1 2 3 4 5 6 7 8 9 1011
Observed EIR vectri simulated EIR
Figure 4.8: Cross correlation between VECTRI simulated EIRm and rainfall compared toobserved. VECTRI: brown box-plots, Observed:green box-plots. Brown numbers (top of panels)indicate the number of monthly observations
incoporated all malaria transmission factors such as immunity, urbanization, socio-economic status and interventions into their algorithsms. Hence, they are not able tocurrently represent completely the overall transmission pattern. Apart from both modellimitations, the observed EIRm data used for validation had limitations. The observedEIRm data were too coarse (i.e., EIRm data were mostly available for shorter period(1year), at different years for the various malaria locations). Again, EIRm samplingbiases during collection (Hay et al. 2000, Shaukat et al. 2010), inhomogeneous distri-bution of study areas and digitization of EIRm values from their articles could have anegative impact on the outcome.
The over-estimation of EIRm by both models at warmer zones (such as Sahel, Eritreaand Savanna) and under-estimation at colder zones (such as Cameroon and EEA) maybe due to the use of mean temperature by the models for the simulation. Studies haveshown that, the typical approach of using mean temperatures in malaria studies under-estimate parasite development under cold conditions and overestimate under warmerconditions Blanford et al. (2013). This is explained by the fact that mosquito and par-asite biology are influenced not only by average temperature but also by the extent ofthe diurnal temperature variation (Paaijmans et al. 2010; 2009).Besides, the error contrast was higher in VECTRI simulations than that of LMM2010
One reason is that VECTRI is likely sensitive to population density used in the calcu-lation of biting ratios. LMM2010 uses a fixed population density of 100 persons/km2
while that of VECTRI depended on the location involved. Sites with density wellbelow 50 persons/km2 or well above 100 persons/km2 may results in VECTRI over-
44

Bibliography −1.0
−0.5
0.0
0.5
1.0
R c
oeff
icie
nt
Sahel LMM2010 (a)141414141414141414141414
0 1 2 3 4 5 6 7 8 9 1011
Eritrea LMM2010 (b)9 9 9 9 9 9 9 9 9 9 9 9
0 1 2 3 4 5 6 7 8 9 1011
−1.0
−0.5
0.0
0.5
1.0
R c
oeff
icie
nt
Savanna LMM2010 (c)9 9 9 9 9 9 9 9 9 9 9 9
0 1 2 3 4 5 6 7 8 9 1011
Guinea LMM2010 (d)181818181818181818181818
0 1 2 3 4 5 6 7 8 9 1011
−1.0
−0.5
0.0
0.5
1.0
R c
oeff
icie
nt
Lag [month]
Cameroon LMM2010 (e)131313131313131313131313
0 1 2 3 4 5 6 7 8 9 1011Lag [month]
EEA LMM2010 (f)242424242424242424242424
0 1 2 3 4 5 6 7 8 9 1011
Observed EIR lmm simulated EIR
Figure 4.9: Same as figure 4.8 but for LMM2010
estimating or under-estimating EIRm respectively compared to LMM2010. This patternwas therefore expected since most locations in Sahel and Eritrea have lower densityvalues than at Cameroon and EEA. Another factor that may be responsible for theVECTRI under-estimation at relatively colder areas such as Cameroon and EEA maybe due to the water temperature parameterization. The water temperature offset whichcontrols the upper limit of the mean temperature may make it much colder for VECTRIvector resolution compared to LMM2010 which has no such parameterization.
On the other hand, the under-estimation of EIRm by LMM2010 most often from the on-set towards mid-season may be due to its sensitivity to ideal rain rate value of 1 mm/dayfor eggs laying. The condition seems not satisfied since rainfall amount is largely lowat those times of the year. The ideal value of 1 mm/day in LMM2010 is much sensitive torainfall compared to moderate rain rates of 0 to 20 mm/day in VECTRI. This moderateVECTRI value is likely disadvantageous at highly seasonal rainfall zones like Saheland Eritrea as it results in the background trasmission during dry periods. Towards theend of the year, both models generally over-estimated EIRm,particularly in the warmerzones. This may likely be due to higher vector population simulated which appear tobe long-lived especially in LMM2010 than VECTRI.
Peak characteristicsVECTRI and LMM2010 were also able to reproduce the different malaria distributionregimes (no peaks, unimodal, bimodal and trimodal distributions) as identified by theobserved at each zone. These regimes are due to the impact that different rainfalldistribution patterns in a year have on vector population and their biting activity at a
45
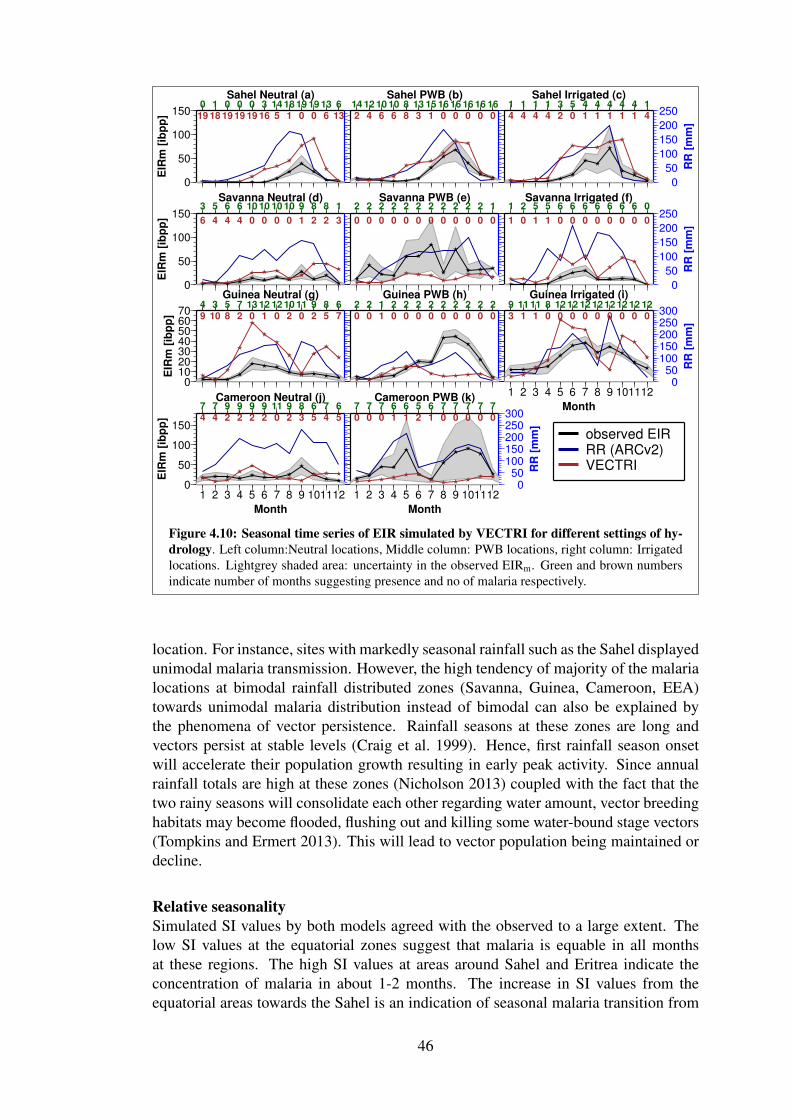
Bibliography0
50
100
150
EIR
m [
ibp
p]
Sahel Neutral (a)
19 18 19 19 19 16 5 1 0 0 6 130 1 0 0 0 3 14 18 19 19 13 6
Sahel PWB (b)
2 4 6 6 8 3 1 0 0 0 0 014 12 10 10 8 13 15 16 16 16 16 16
Sahel Irrigated (c)
0
50
100
150
200
250
RR
[m
m]
4 4 4 4 2 0 1 1 1 1 1 41 1 1 1 3 5 4 4 4 4 4 1
0
50
100
150
EIR
m [
ibp
p]
Savanna Neutral (d)
6 4 4 4 0 0 0 0 1 2 2 3
3 5 6 6 10 10 10 10 9 8 8 1Savanna PWB (e)
0 0 0 0 0 0 0 0 0 0 0 0
2 2 2 2 2 2 2 2 2 2 2 1Savanna Irrigated (f)
0
50
100
150
200
250
RR
[m
m]
1 0 1 1 0 0 0 0 0 0 0 0
1 2 5 5 6 6 6 6 6 6 6 0
010203040506070
EIR
m [
ibp
p]
Guinea Neutral (g)
9 10 8 2 0 1 0 2 0 2 5 74 3 5 7 13 12 12 10 11 9 8 6
Guinea PWB (h)
0 0 1 0 0 0 0 0 0 0 0 02 2 1 2 2 2 2 2 2 2 2 2
1 2 3 4 5 6 7 8 9 101112
Month
Guinea Irrigated (i)
050
100150200250300
RR
[m
m]
3 1 1 0 0 0 0 0 0 0 0 09 11 11 8 12 12 12 12 12 12 12 12
0
50
100
150
EIR
m [
ibp
p]
1 2 3 4 5 6 7 8 9 101112
Month
Cameroon Neutral (j)
4 4 2 2 2 2 0 2 3 5 4 57 7 9 9 9 9 11 9 8 6 7 6
1 2 3 4 5 6 7 8 9 101112
Month
Cameroon PWB (k)
050
100150200250300
RR
[m
m]
0 0 0 1 1 2 1 0 0 0 0 07 7 7 6 6 5 6 7 7 7 7 7
observed EIRRR (ARCv2)VECTRI
Figure 4.10: Seasonal time series of EIR simulated by VECTRI for different settings of hy-drology. Left column:Neutral locations, Middle column: PWB locations, right column: Irrigatedlocations. Lightgrey shaded area: uncertainty in the observed EIRm. Green and brown numbersindicate number of months suggesting presence and no of malaria respectively.
location. For instance, sites with markedly seasonal rainfall such as the Sahel displayedunimodal malaria transmission. However, the high tendency of majority of the malarialocations at bimodal rainfall distributed zones (Savanna, Guinea, Cameroon, EEA)towards unimodal malaria distribution instead of bimodal can also be explained bythe phenomena of vector persistence. Rainfall seasons at these zones are long andvectors persist at stable levels (Craig et al. 1999). Hence, first rainfall season onsetwill accelerate their population growth resulting in early peak activity. Since annualrainfall totals are high at these zones (Nicholson 2013) coupled with the fact that thetwo rainy seasons will consolidate each other regarding water amount, vector breedinghabitats may become flooded, flushing out and killing some water-bound stage vectors(Tompkins and Ermert 2013). This will lead to vector population being maintained ordecline.
Relative seasonalitySimulated SI values by both models agreed with the observed to a large extent. Thelow SI values at the equatorial zones suggest that malaria is equable in all monthsat these regions. The high SI values at areas around Sahel and Eritrea indicate theconcentration of malaria in about 1-2 months. The increase in SI values from theequatorial areas towards the Sahel is an indication of seasonal malaria transition from
46

Bibliography
perennial through to epidemic or malaria free at Sahelian regions. The pattern alsosuggest that the degree of malaria seasonality is closely linked to latitudinal variationin climatic covariates such as rainfall. The wide spread of SI values in East Africa,especially at EEA, buttresses the fact that seasonal malaria transmission in that regionis highly variable.
This approach of quantifying EIR seasonality contrast is scarcely applied in malariastudies hence unique. Previously, Mabaso et al. (2007) applied Markham’s concentra-tion index (Markham 1970) in analyzing the relationship between seasonality in EIRand environmental factors in sites across sub-Saharan Africa. They found that season-ality of rainfall, minimum temperature, and irrigation were important determinants ofseasonality in EIR. While their approach is entirely different from that applied in thisstudy, the degree of malaria seasonality closely linked to latitudinal variation in cli-matic covariates as rainfall agrees with their results. However, their index (Markham1970) is very deficient at locations with two seasonal malaria (Mabaso et al. 2007)unlike the the index applied in this study (Walsh and Lawler 1981).
EndemicityEvaluating the association between malaria endemicity and elevation showed that en-demicity decreased from high endemicity at lower elevations to no transmission at highaltitudes. The decrease in intensity towards higher elevations is because cool temper-atures at high elevations unlike at low elevations limit malaria transmission (Drakeleyet al. 2005). The inability of LMM2010 to reproduce similar pattern may be because itwas not calibrated with data from East Africa. LMM2010 performs better in West Africawhere it was calibrated than in East Africa. Previous studies have also reported similarfindings. In Tanzania, Maxwell et al. (2003) sampled mosquitoes and found that EIRwas about 17 times greater at a lowland than highland area. In an entomological sur-vey in Papua New Guinea, Attenborough et al. (1997) identified that the proportion ofmosquitoes with malaria circumsporozoite antigens declined with increasing altitude.In similar studies not using EIR (Akhwale et al. 2004, Balls et al. 2004, Bodker et al.2003), similar patterns were observed.
Cross-correlationSignificant lags of positive association varied between 0-3 months at all zones, andboth model simulates were generally within this range. Though previous works oncross-correlation analysis between EIR and rainfall were scarce, studies using malariacases in that regard reported similar ranges. For instance, Briet et al. (2008) cross-correlated malaria cases with rainfall in Sri Lanka and found malaria time series lag-ging between 0-3 months behind rainfall. Again predicting malaria epidemics in theKenyan highlands using climate data Githeko and Ndegwa (2001) found the associ-ation between rainfall (and unusually high maximum temperatures) and the numberof inpatient malaria cases 3-4 months later. Despite the fact that simulated lags werewithin ranges of the observed, significant peak lags differed. Model simulated peaklags were mostly 1 month later than the observed except EEA. This suggests that thevector loading in the models after the onset of suitable climatic conditions are likelyslow (slow spin).
47

Bibliography
HydrologyThe attempt in this section was geared towards the assessment of how well the elabo-rate hydrology model in VECTRI can replicate EIR seasonality at PWB and irrigatedareas. At Savanna, Guinea and Cameroon where EIRm values from PWB locationswere lower than control locations was due to VECTRI’s sensitivity to population den-sity. Sites involved in these areas had population density greater than 200 persons perkm2. As elaborated in the previous sections, VECTRI largely underestimates biting ra-tios for locations with population density well above 100 persons per km2. The watertemperature offset as elaborated afore coupled with the traditional use of mean temper-ature may also have contributed to the low values at Cameroon. Despite these hitches(which are refineble), VECTRI performance at Sahel and irrigated areas at Savannaand Guinea were comparable to the observed though over-estimations were obvious.
4.5 Summary and conclusionsRanges of EIRm simulated by LMM2010 and VECTRI for sub-Saharan Africa werevalidated with observed EIRm data gathered from different climatic and environmentalsettings across Africa. The goal was to determine whether or not the models couldrealistically simulate characteristic seasonal malaria patterns in Africa as a function ofclimate and environment.
LMM2010 and VECTRI error ranges were generally within or about the same as theaccepted standard deviation of the observed data. It is, however, worth noting that,larger errors were detected for Guinea and some individual monthly minor differencesoccurred. Besides, both models agreed with the observed on speculations regardingmalaria peaking characteristics that, malaria distribution was predominantly unimodal.However, it was noted that maximum malaria transmission peaks in the models tendto be delayed by one month in the Sahel and Eritrea area. Both models further agreedwith the observed values of a seasonality index that the disease progression was closelylinked with the latitudinal variation of climatic covariates such as rainfall. VECTRIrevealed a stronger ability in capturing the levels of malaria endemicity in East Africathan LMM2010. VECTRI does not capture very well malaria transmission at permanentwater body locations.
The comparability of LMM2010 and VECTRI error ranges to standard deviations of theobserved EIRm coupled with their agreement with the validated steps in general, con-firmed the hypothesis that they could reproduce realistic EIRm for the African region.It is therefore concluded that both models could mimic the seasonal malaria transmis-sion dynamics in Africa as a function of climate and environment to a large extent.While both models in their current state can be used as early malaria warning system,VECTRI has more advantage at highland areas in East Africa than LMM2010 since itwas able to mimic malaria endemicity pattern correctly. The identified loopholes inboth models provide the basis for further review and refinement of the models by theirdevelopers to stage them as best fundamental tools for seasonal malaria prediction.
The sparsity and paucity of the observed EIRm both in time and space could have hadan adverse impact on both model output. Future studies should focus on using morecondensed and homogeneously distributed EIRm data for validation. Moreover, while
48

Bibliography
the conventional use of mean temperatures by the models to simulate EIRm might beappropriate under certain conditions, it may likely over- or under-estimate EIRm atwarmer and colder zones respectively. Future developments should therefore focus onthe use of diurnal daily temperature ranges rather than mean. This is important sincethe biology of the malaria vectors and parasite is influenced by both average temper-ature and the extent of the diurnal temperature variation that occurs throughout theday. In addition, optimizing the parameter settings of both models through a sensitiv-ity study is important in order to determine their relative importance to model output.This has the advantage of resolving their simulation hitches resulting from parametersettings. Besides, inclusion of other transmission factors such as immunity, urbaniza-tion and interventions into their algorithms is necessary. It will enable the models todescribe the overall malaria transmission dynamics in the region quantitatively. Theserecommendations forms the focus of the next chapter.
49

CHAPTER 5
An evaluation of a simple model of immunity to malariaand sensitivity of VECTRI paramter settings to thespread of malaria in Africa
AbstractVECTRI model has provided adequate approximations to biological and epidemio-logical features of malaria in Africa. But immunity to malaria which is an importantdeterminant of the disease in the region is missing in its formulations. Besides, thesensitivity of VECTRI parameter settings to its output variability has also not beenanalyzed. Thus, VECTRI is currently unable to describe the overall malaria trans-mission dynamics in the region quantitatively and qualitatively. This study utilized anew simple model of immunity in VECTRI and performed a one-at-a-time sensitivitystudy of VECTRI parameter settings to its output variability. The findings revealedthat the immunity model enabled VECTRI to simulate different levels of malaria forAfrica by reducing transmission rates at increased exposure of humans to malaria. Thesimple immunity model also substantially improved the seasonal malaria simulationsof VECTRI by reducing its output error. The one-at-a-time sensitivity analysis per-formed on VECTRI parameter settings revealed parameters that show the strongestvariation of the model output. The most sensitive parameters include the adult vectorsurvival probability, the minimum temperature for larval survival, larvae growth de-gree days, the minimum temperature for sporogonic cycle, base daily larval survivalrate, and total evaporation and infiltration losses. The new immunity model representsa helpful tool for future malaria modelling effort, and its refinement for considerationin VECTRI is necessary. Parameters contributing most to VECTRI output variabilityrequire additional research to strengthen knowledge base to reduce VECTRI outputuncertainty.
5.1 BackgroundHuman immune response to malaria infection is one of the essential features of the dis-ease’s dynamics in Africa (Molineaux et al. 1988). The differential movement of infec-tion among different age groups and gender in the region is attributed to their immunestatus (Mandal et al. 2011). Children below 5-years of age and pregnant women are themost burdened by malaria due to their lack of protective immunity (WHO 2015). Olderchildren (> 5years) and adults have reduced risks due to acquired protective immunity.The build-up of protective immunity is due to the cumulative product of many yearsof heavy exposure to malaria (Doolan et al. 2009). Additional reasons are associatedwith intrinsic factors linked with aged that enables a quick immune response of olderchildren and adults (Baird et al. 1991; 2003). But due to lack of continuous exposureto malaria at epidemic zones, the disease burden cuts across all ages (WHO 2015).
50

Bibliography
Some malaria models (Aron 1988, Filipe et al. 2007, Gatton and Cheng 2004) haveincorporated immunity into their algorithms. Incorporating immunity into malariamodels makes them more realistic especially regarding their prediction of malaria andevaluation of the outcome of vaccination programmes (Koella 1991). Since presumedbase values of model parameters are usually not error-free, other models (Chitnis et al.2008) have optimized their parameter settings to determine their sensitivity and robust-ness to malaria outcome (Hamby 1994).The VECTRI is a weather-driven dynamical mathematical malaria model. It has pro-vided adequate approximations of biological and epidemiological features of malariain Africa (Caminade et al. 2014, Tompkins and Di Giuseppe 2015). But the immuneresponse of human subjects to malaria is missing in its formulations. The absenceof immunity in the model presupposes that VECTRI is currently unable to describethe overall malaria transmission dynamics in the region quantitatively. This is evidentsince immunity is an important malaria transmission determinant in Africa (Doolanet al. 2009). Also, VECTRI parameter settings have not been optimized to determinetheir relative importance to model output. Since parameter settings are most influentialon a model result (Chitnis et al. 2008), a study of parameter sensitivity to model resultsis critical for model validation and guide for future research efforts (Hamby 1994).
In this study, a new simple model of immunity to malaria was used in VECTRI with theaim of understanding the effect of immunity to inform future malaria modelling efforts.An additional goal was to determine whether inclusion of immunity into VECTRI im-proved its malaria prediction capability for Africa. Moreover, the parameter settingsof VECTRI were optimized through a sensitivity study with the aim of determiningparameters that contributed most to VECTRI output variability. The study outcomewill reveal how the simple immunity module enabled VECTRI to simulate differentlevels of malaria for Africa as well as improved the seasonal malaria simulations er-rors in VECTRI. The study will further show how a one-at-a-time sensitivity analysisperformed on VECTRI parameter settings revealed parameters that show the strongestvariation of the model output and require additional research to reduce VECTRI outputuncertainty.
5.2 Methods
5.2.1 Brief description of VECTRI
When a pathogen invades a population, it categorises the population into compartmentsbased on infection status (Crompton et al. 2014). Following this ideology, VECTRIformulated malaria parasite progression in the vector and host populations using anarray of bins approach. The various stages of explicit resolution are depicted schemat-ically in Figure 5.1.
The larvae life cycle is divided into fractional bins. Vectors lay eggs into the firstbin. The eggs advance a number of bins at a fractional growth rate dependent on thelocal water temperature to the last bin where they develop into adult mosquitoes. At theadult stage, a two-dimensional array of bins consisting the gonotrophic and sporogoniccycles are resolved. The first gonotrophic bin consists of gravid vectors searching fora blood meal. Successful vectors advance regarding egg development to the final bin
51

Bibliography
Figure 5.1: The structural layout of VECTRI model. The top row shows the larvae statusdivided into a series of bins representing the fractional development state. The ’X’ in each binrepresents the density of larvae in a specific fractional growth stage. The middle block representsthe vector state in two dimensions: the egg development within the female and the infectivestate. The lower row models the host infective state. The curved arrows represent the progressiondirection of the larvae, vector and host state, while the straight red arrows mark the parasitetransmission pathways between host and vector. Source:Tompkins and Ermert (2013)
(where new eggs are laid) at a rate dependent on ambient temperature. The vectoris recycled to the first meal-searching bin upon becoming gravid again. During theblood meal, a proportion of the biting vectors become infected by an infective hostand progress in the sporogonic dimension at a rate also determined by temperature.Upon reaching the last bin, they become infective to humans and remain so untilldeath. In the human host population, the first bin represents the fraction of the hostpopulation Susceptible (S) to malaria infection. Upon getting infected, the susceptiblesprogresses a number of bins representing the Exposed (E)-fraction incapable of passingon the infection to others though infected, and the Infectious (I)- capable of infectingthe susceptible individuals via vectors that feed on them. The set of equations andparameterization associated with each of the stages are detailed in the original articleTompkins and Ermert (2013).
5.2.2 Modelling immunity to malaria
Incorporation of immunity into malaria models One way to incorporate immunityinto malaria models is to consider a separate immune compartment in human host pop-ulation (Chitnis et al. 2006, Dietz et al. 1974, Laneri et al. 2010, Ngwa and Shu 2000,Yang 2000). Another way is to use immunity functions (Cairns et al. 2011, Filipe et al.2007, Okell et al. 2008). The former approach was applied in VECTRI since it is acompartmental model. Thus, immunity was implemented by extending the compart-mental classes of the human host population to include those that Recovered (R) from
52

Bibliography
Figure 5.2: Schematic diagram of the simple immunity model incorporated into VECTRI
infections. The schematic representation of the compartmental extension is displayedin Figure 5.2 and Fortran programmed by Dr. Adrian Tompkins (the original author ofVECTRI). Human subjects leaving the infectious class gained permanent, temporal orno immunity (Ngwa and Shu 2000, Yang 2000). Thus, it was considered that infectioushumans (Ih) that recovered from infections joined the recovered compartment (Rh) ifpartial immunity was attained. Otherwise, they move directly back to the susceptibleclass (Sh). It was also assumed that about 95% of the infected individuals subsequentlyrecovered from infections and acquired temporal protection to severe disease. The restof the 5% either recovered without immunity and returned directly to the susceptibleclass or died of the infection.
Acquisition of immunityPrecise onset of immunity is yet unknown. Some studies suggest it is developed after 5-15 years of continuous and heavy exposure to infections (Baird 2004). Others indicateonly one or two successful malaria infections accross a broad range of transmissionintensities is necessary (Gupta et al. 1999b). Ranges of 3-6 malaria episodes have alsobeen reported (Baird 1995, Baird et al. 1991, Ciuca et al. 1934). In this work, theacquisition of partial immunity depended on the number of infectious mosquito bites(EIR) the recovering group accumulated in a year (EIRa) (see Figure 5.2). Thus, theygained immunity and moved to the Rh class if the EIRa is at least 100 ibpp, else theyjoined Sh group. The choice of 100 ibpp in a year was to reflect the slow build up ofimmunity to parasitaemia (Baird 1995). The duration of building effective immunitywas right after recovery from the disease. It was considered that exposure to newinfections by the Rh class boosted the immunity they acquired (Doolan et al. 2009).The mathematical formulation of the rate of acquisition of immunity, q, was given as:
q = exp−EIRa
tau(5.1)
53

Bibliography
where
tau =−100
ln(0.05)(5.2)
Immuned individuals infect biting mosquitoes with a lower probability than non-immunesubjects since acquired immunity decrease the infectivity of gametocytes to mosquitoes(Buckling and Read 2001, Drakeley et al. 2006). As a result, it was considered that therecovered group still infected vectors at a low rate. The infection probability of 0.04was adapted from Ermert et al. (2011a).
Loss of acquired immunityThe acquired immunity was assumed temporal and lasted only for T years in the ab-sence of new infections (Doolan et al. 2009). Reported period of decay of acquiredimmunity to malaria varies. Clinical immunity is reported to have a half-life of at least3-5 years (Filipe et al. 2007, Jennings et al. 2006, Struik and Riley 2004). Anti-parasiteimmunity which develops later in life has been found to last more 15 years (Filipe et al.2007, Färnert et al. 2015). Since the study focus regards temporal protection againstsevere disease, a shorter half of 3 years was chosen. Thus, it was considered thatindividuals of the Rh class lost the acquired immunity after 3 years of unable to ac-cummulate atleast 100 ibpp. Once the immunity is lost, they moved back directly tothe Susceptible class (see Figure 5.2). The duration of loss was expressed in days as:
T =−X ∗ 365
ln(0.05)(5.3)
where X is the duration of the acquired immunity in years.
Parasite clearanceThe study assumed that treatment is sought by patients since people will most likelyseek treatment for clinical symptoms of malaria. With antimalarials clearance time isshorter (Gomes et al. 2008, White et al. 1989) though depends on the therapy used.Artimisinin based therapies may take about 2-7 days (Baird 2005, Brandts et al. 1997).Antimalarial chemotherapy for uncomplicated and complicated malaria found about3 and 5 days respectively (Tangpukdee et al. 2008). Plasmodium Vivax gametocyteclearance time which correlated with asexual parasite clearance time lasted up to 21days (Pukrittayakamee et al. 2008). Since it may take several days before treatment issought, the study assumed a maximum of 20 days clearance time. For instance, youngchildren and adults seeking treatment at formal sectors reported mean duration of 6and 6.4 days of fever (Mota et al. 2009). The reciprocal of the clearance time gave therate of clearance.
Additional considerationsThe utilized immunity model was simple with minimal parameters. The reason wasdue to the fact that many details of acquired immunity are unknown and are thus diffi-cult to parameterize (Baird et al. 2003). The primary goal was to reproduce observedepidemiological malaria trends in Africa. The age dependency features of immunity(Karp and Auwaerter 2007, Mandal et al. 2011, Yamana et al. 2013) was exemptedby assuming a homogeneously mixed population of humans. The various types and
54

Bibliography
stages of development of immunity (Filipe et al. 2007, Gupta et al. 1999b, Yang et al.1997) were exempted. Though the interaction of the mosquito immune system affectsPlasmodium parasites (Crompton et al. 2014), this was not considered in the vectorpopulation since they do not recover from infections but are regulated by mortality(Chitnis et al. 2006). Parameter values of the immunity model were taking from lit-erature where possible otherwise assumptions were made based on the current under-standing of immunological processes in the host population.
5.2.3 Evaluation of the immunity model
Evaluation of the immunity model VECTRI (v1.4) was driven with daily timeseriesof rainfall and temperature from 1983-2013 for malaria locations accross sub-SaharanAfrica (see Figure 3.1). The ARCv2 daily dataset (Novella and Thiaw 2013) wasutilized as the rainfall product. In terms of temperature, the ERAI dataset (Dee et al.2011) was used. Details on these input products are given in chapter 3. Equilibriumruns by VECTRI was achieved by repeating the 1983 climate forcing data for 23 timesbefore passing on the rest of the 29 years (1984-2013).
Simulated annual malaria cases and exposure to infectious bites (EIRa) were thencontrasted with time to determine the influence of immunity on the pattern of clinicalcases. Sensitivity of the immunity parameters to seasonal malaria cases was addi-tionally evaluated. The baseline parameter values of the immunity model were variedusing values gathered from literature and observed the associated changes in seasonalclinical malaria cases.
To examine whether the incorporated immunity improved VECTRI’s malaria predic-tive capability or not, an evaluation of VECTRI seasonal malaria outcome was carriedout. Observed EIRm gathered from malaria sites across sub-Saharan Africa were pair-wise compared with VECTRI simulated EIRm. The error contrast between them wasthen measured with Mean Absolute Error (MAE). VECTRI errors were consideredlow if its MAE was within the standard deviation (SD) of the observed EIRm. Thestatistical formulations of these error indices are given in Chapter 4.
5.3 Sensitivity of VECTRI parameter settingsThe impact of VECTRI parameter settings to its malaria outcome was performedthrough a sensitivity study. The essence was to discover parameters that had highimpact on the VECTRI predicted malaria outcome. Several methods of parameter sen-sitivity analyses utilized for various modelling situations exist (Downing et al. 1985,Hamby 1994). In this work, a one-at-a-time design was applied. The method involvedvarying each parameter value independently by a factor (e.g. ±20% (Hamby 1995)or ±SD (standard deviation) (Downing et al. 1985)) while holding all others constant(O’Neill et al. 1980). Here, baseline values of malaria model parameter settings weregathered from literature where possible and evaluated the sensitivity at their minimumand maximum values. Parameters where further information about other base valuedistribution were scare, the sensitivity was evaluated at ±50% of their base values.Details of VECTRI baseline parameters settings, the gathered ranges and the associ-ated ±50% are presented in Table 5.1. The associated changes in annual EIR EIRa
55

Bibliography
Table 5.1: VECTRI default parameters and their dimensions. Inclusive are ranges of parameterbase values and 50% change when ranges were scarce. References (Ref) to the ranges: A: Tompkinsand Ermert (2013); B: Ermert et al. (2011a); C: Chitnis et al. (2008); D: as refereced in text and E:Craig et al. (1999) .
Parameter Description Unit Value Range Ref ±50% +50% -50%Negg Eggs laid per female vector eggs 80 5 - 290 B - 290 5Degg Days for egg hatching days 1.0 - - 0.5 1.5 0.5Dpupae Days for pupae stage days 1.0 - - 0.5 1.5 0.5KL,Craig Larvae growth degree days Kday 5.54e-3 - - 2.77e-3 8.31e-3 2.77e-3TL,max Maximum water temperature for larvae survival ◦C 38.0 34.0 - 38.0 A - 38.0 34.0TL,min Minimum water temperature for larvae survival ◦C 16.0 16.0 - 18.0 A - 18.0 16.0Kflush Minimal daily survival of L1 larvae - 1.0 - - 0.5 1.5 0.5τflush Larvae-flushing rainfall e-folding factor mm/day 20 - - 10.0 30.0 10.0ML4 Larval mass constant mg 0.45 - - 0.225 0.675 0.225ML,max Larvae biomass carry capacity of pools mg/m2 300 - - 150 450 150PLsurv Base daily larval survival rate - 0.987 0.527 - 0.987 A,B - 0.987 0.527Kw Pond growth rate factor m−1 1e-3 - - 5e-4 1.5e-3 5e-4E+I Total evaporation and infiltration losses mm/day 250 - - 125 375 125Wfmax Max default water fraction - 0.2 - - 0.1 0.3 0.1Twat Water temperature offset to air temperature K 0.5 - - 0.25 0.75 0.25Vt,indoor Proportion of time spent indoor resting - 0.5 - - 0.25 0.75 0.25Vsuccess Blood meal success rate per day - 0.5 - - 0.25 0.75 0.25τzoo Zoophilicity rate Km−2 30.e-6 - - 15e-6 45.e-6 15.e-6τanthro Minimum anthropophilic bite rate - 0.05 - - 0.025 0.075 0.025Hclear Host parasite clearance rate days 20 3 - 21 D - 21 3Pihv Transmission probability from host to vector - 0.2 0.064 - 0.8 B - 0.8 0.064Prhv Transmission probability from immune host to vector - 0.04 - - 0.02 0.06 0.02Pivh Transmission probability from vector to host - 0.3 0.01 - 0.46 B - 0.46 0.01Rimm Infectious bites needed to acquire immunity year−1 100 - - 50 150 50Rτ loss of acquired immunity days 365 365 - 609 D - 609 365Tgono Minimum temperature for gonotrophic cycle ◦C 7.7 4.5 - 9.9 A,B - 9.9 4.5Dgono Gonotrophic cycle degree days days 37.1 36.5 - 65.4 A,B - 65.4 36.5Tsporo Minimum temperature for sporogonic cycle ◦C 16.0 14.2 - 19.0 A,B - 19.0 14.2Dsporo Sporogonic cycle degree days days 111.0 111.0 - 204.4 B - 204.4 111.0TV,min Minimum temperature below which vector dies ◦C 5.0 4.0 - 6.0 E - 6.0 4.0TV,max Maximum temperature above which vector dies ◦C 39.9 39.9 - 42.0 E - 42.0 39.9PV surv Vector survival probability - 0.96 0.45 - 0.99 B - 0.99 0.45Hlatent Latent period in host days 20 9 - 26 A,B,C - 26 9Hdetect Malaria detection in host blood days 9 - - 4.5 13.5 4.5Hmdeath Malaria induced host death rate days−1 0.02 - - 0.01 0.03 0.01
was then measured using a sensitivity coefficient (φ) defined as:
φi =%∆Y
%∆Xi
(5.4)
where ∆ X is the percentage change in parameter value at i while ∆ Y is the associatedpercentage change in output (EIRa). The choice of this method was based on itscomputational ease and practicality (Hamby 1995).
5.4 Results and discussion
5.4.1 The simple immunity model
Figure 5.3 displays simulated annual malaria cases and exposure to infectious bites(EIRa) for malaria locations subjected to different climate conditions in Africa. Inthe first place, a strong inter-annual signal in both simulated malaria cases and EIRa
was observed in all zones. The high variability is expected since Africa supports sub-stantially heterogeneous ranges of malaria risk which vary temporally and spatially(Mbogo et al. 1995).
Among the climatologically different zones, simulated malaria cases differed. Simu-lated cases without immunity (red line) are higher at all zones than simulated cases
56

Bibliography
100
150
200
250
EIR
a [
ib
pp
]
Sahel (a)
1.4
1.6
1.8
2.0
2.2
2.4R= −0.43 sig= 98.37
100
150
200
250Savanna (b)
1.8
2.0
2.2
2.4
2.6
2.8
3.0
Cases
R= −0.04 sig= 18.70
50
100
150
200
250
EIR
a [
ib
pp
]
Guinea (c)
1.8
2.0
2.2
2.4
2.6
2.8
3.0R= 0.28 sig= 87.49
60
80
100
120
140
Cameroon (d)
1.6
1.8
2.0
2.2
2.4
2.6
Cases
R= 0.58 sig= 99.94
0
50
100
150
EIR
a [
ib
pp
]
1985 1990 1995 2000 2005 2010
Time [ Years ]
Eritrea (e)
0.4
0.6
0.8
1.0
1.2
1.4
1.6
1.8R= 0.79 sig= 100.00
20
30
40
50
60
70
1985 1990 1995 2000 2005 2010
Time [ Years ]
EEA (f)
0.6
0.8
1.0
1.2
1.4
1.6
1.8
Cases
R= 0.64 sig= 99.99
EIRa Cases+imm Cases−imm
Figure 5.3: Simulated annual malaria cases and EIRa for sub-Saharan Africa. SimulatedEIRa:black line, simulated malaria cases with incorporated immunity model:Green line, simulatedcases without the immunity model:red line. Green printed numbers:Correlation between EIRa andmalaria cases with incorporated immunity model.
when immunity was introduced (green line). This means that the proposed immunitywas able to dampen the effect of increased exposure to infectious bites. Moreover,malaria cases were high at Sahel (panel a), Savanna (panel c), Guinea (panel d) andpartly low at Cameroon (panel e) than observed at Eritrea (panel e) and EEA (panelf). At zones of higher malaria cases, EIRa were mostly ≥100 ibpp but ranged between10-100 ibpp at Eritrea and EEA. This pattern corroborates reports of areas of intenseand moderate malaria transmission in Africa (Beier et al. 1999) respectively. Thus, themodel is apparently able to distinguish between probable areas of stable and unstablemalaria spots in the region. The annual cases at Cameroon are low (which should notbe the case) because the model is under-simulating infectious inoculations rates for thearea (see details in Chapter 4).
Regarding the correlation between cases (green line) and EIRa (black line), it can beobserved that correlation coefficient are low at Sahel, Savanna and Guinea. This againis a confirmation of locations with the highest impact of immunity due to the expo-sure of inhabitants to severe infectious mosquito bites. At these zones, initial malariacases were usually high but decreased with increasing exposure to infectious bites astime progressed. This pattern is a clear manifestation of the build up of immunity. Inthe first instance, those areas exhibit intense transmission which satisfies the condition
57

Bibliography
(EIRa≥100) to acquire immunity. At the beginning of exposure to infectious bites,cases are high since the human subjects had no immunity (which need time to be acti-vated). As exposure to infectious bites intensified, immunity is activated and boostedby the sustained high infectious bites. Hence, the downward movement of cases isthe consequence of the effect of the slow build up of immunity that reduced subjectsthat would have suffered from clinical disease. The relatively low malaria cases at Sa-hel(panel a) compared to other high transmission zones (panel b and c) is attributed tothe highly seasonal nature of malaria due to the markedly seasonal nature of rainfall inthe area (Nicholson 2000).
However, at zones of low transmission (panel e and f), the progression of cases withtime rather correlated strongly with infectious bites confirming low or lack of immu-nity. This behaviour is because the annual exposure to infectious bites were not intenseenough (EIRa < 100 ibpp) for subjects to acquire any sustainable immunological mem-ory in order to suppress clinical disease. Some individual year exposure may result inthe acquisition of immunity but may decay fast due to lack of continuous intense infec-tion. Studies have reported malaria transmission at such zones as low, stable endemicrisk or epidemic prone zones (Craig et al. 1999, Shililu et al. 2003). Low or lack of im-munity at such areas is therefore not surprising. An occurrence of epidemics in thoseregions may have devastating consequences such as high risk of stillbirths (Wort et al.2006).
The outcome of this model confirms known reports that human subjects at stablemalaria transmission zones acquired immunity due to continuous heavy exposure thanthose at unstable areas (Doolan et al. 2009, Langhorne et al. 2008, Mandal et al. 2011).The immunity model also demonstrated that zones of greater acquired resistance re-sulting from exposure to high inoculations rendered the inhabitants more resilient andless vulnerable to malaria epidemics that may be associated with climate anomaliesthan areas with low or no immunity. Hence the risk of a location to clinical malariacases depended on the level of acquired immunity. These deductions suggest that theimmunity model is able to mimic the general pattern of observed malaria transmissionin Africa.
Immunity parameter sensitivityThe sensitivity of seasonal malaria case outcome to immunity model parameter set-
tings are displayed in Figure 5.4. Panel (a) shows the results of the settings to differentinfectious bites needed to acquire immunity. Without immunity (black line), caseswere high. When immunity was included (Green line, default), cases lowered. Thiswas expected because infected subjects acquired some form of protection against clin-ical disease resulting in the reduction of prevailing malaria cases. Lowering the defaultthreshold condition to gaining immunity (red) further reduced cases. This suggest thata build up an active immunity in those who recover from the disease when exposed toleast infections could reduce the number of cases. Hence for areas of intense trans-mission, clinical cases will be far lower. But, prevailing malaria cases increased whenthe default threshold was increased (brown). This is because the exposure amount andtime required for acquired protection against clinical disease was lengthened therebylowering the immunological memory.
58

Bibliography 0.0
0.1
0.2
0.3
0.4
0.5
Ca
se
s [
fra
c]
1 2 3 4 5 6 7 8 9 10 11 12
Month
Acquisition (a)
0 100 50 150
0.0
0.1
0.2
0.3
0.4
0.5
Ca
se
s[f
rac
]
1 2 3 4 5 6 7 8 9 10 11 12
Month
Halflife (b)
0 3yr 2yrs 5yrs
0.0
0.1
0.2
0.3
0.4
0.5
Ca
se
s [
fra
c]
1 2 3 4 5 6 7 8 9 10 11 12
Month
Clearance (c)
0 20 10 90
0.0
0.1
0.2
0.3
0.4
0.5
Ca
se
s[f
rac
]
1 2 3 4 5 6 7 8 9 10 11 12
Month
Rhv probability(d)
0 0.04 0.01 0.08
Figure 5.4: Sensitivity of immunity parameter settings to seasonal malaria outcome. Panela): EIRa at which immunity is acquired, b): durations at which the acquired immunity is lost, c):days of parasite clearace by non-immuned subjects and d): probabilities that immuned subjectsinfected the vector mosquito. Black shows cases without immunity. Green is the default setings,Red and brown are for settings below and above default respectively.
Panel (b) displays the behaviour of seasonal malaria cases when the half-life of immu-nity was reduced from 3yrs(green) to 2yrs(red) and increased from 3yrs to 5yrs(brown).Reducing the decay period of acquired immunity increased cases and increasing it de-creased cases substantially. The pattern was expected because, shortening the half-lifemeant a reduction in immunological retention memory of the host, resulting in higherclinical cases. The vice versa is applicable when the threshold was increased.
Similar to panel (b), panel (c) showed that malaria cases were on the high when clear-ance time was reduced from 20 to 10 days (red) but on the low when clearance timewas increased to 90 days (brown). The 90 days clearance time reflects somewhat theidea that immunity is build at a slow rate (Day and Marsh 1991). Delayed clearancetime allowed sufficient time for host memory receptive to recognise parasites strains,hence the acquisition of immunity and lower clinical cases. The faster clearance time(10days) assumed the fact that individuals sort treatment when sick and so will clearinfections in a matter of few days. High cases however suggest that though individualsmay be exposed to substantial transmission, clearance of infections in few days viaantimalarials may not result in the acquisition of immunity. This applies in particularto individuals without prior exposure to infections.
In panel (d) changes in the probability of immune subjects to infect the mosquito ispresented. Unlike other cases, there was no substantial change in seasonal cases whenthe probability was varied. This was expected because immuned subject infectionrates are far lower than that of the infectious and for that matter will not result in anysubstantial change.
59

Bibliography
ImprovementFigure 5.5 displays the MAE indices of immunity incorporated VECTRI (v1.4) simu-
0
20
40
60
80
100
MA
E [
ib
pp
]
Sahel (a)23 23 23 23 23 23 23 23 23 23 23 23
0
10
20
30
40
Eritrea (b)9 9 9 9 9 9 9 9 9 9 9 9
0
10
20
30
40
50
MA
E [
ib
pp
]
Savanna (c)10 10 10 10 10 10 10 10 10 10 10 10
0
10
20
30
Guinea (d)24 24 24 24 24 24 24 24 24 24 24 24
0
20
40
60
80
MA
E [
ib
pp
]
1 2 3 4 5 6 7 8 9 101112
Month
Cameroon (e)13 13 13 13 13 13 13 13 13 13 13 13
0
10
20
30
40
1 2 3 4 5 6 7 8 9 101112
Month
EEA (f)25 25 25 25 25 25 25 25 25 25 25 25
STDev VECTRI_v1.4 VECTRI_v1.3
Figure 5.5: Mean Absolute Error of model simulated EIRm to the observed. The grey shadedregion is the standard deviation of the observed EIRm. The black line is MAE of VECTRI withoutimmunity and red with immunity.
lated EIRm and that of VECTRI without immunity (v1.3). The error significance weremeasured using the standard deviation (SD) of the observed EIRm. MAE was con-sidered high (low) if above (within) the SD of the observed. The figure revealed thaterror indices of VECTRI incorporated immunity were mainly lower and within the SDof the observed at all the climatologically different zones of sub-Saharan Africa thanVECTRI without immunity. This clearly validates that inclusion of immunity into thestructure of VECTRI model improved its seasonal simulation of malaria outcome sub-stantially. The inclusion of immunity makes VECTRI more realistic and reliable formalaria study in the African region. As identified in Chapter 4, the fact that the modeldid not include all transmission factors in its algorithms is one the challenges regardingoutput certainty. Though it is impossible for the model to be able to define the preciseedges of each EIRm value, an inclusion of other missing factors will reduce VECTRIsimulation error as revealed in this test study.
5.4.2 Sensitivity test
Figure 5.6 displays the sensitivity of EIRa to the different parameters of VECTRI. Thesensitivity coefficient, φ shows the factor of change in EIRa when the correspondingparameter was evaluated at their minimum range/-50% (green line) and at maximumrange/+50% (red line) of their baseline values. The maximum/+50% and minimum/-50% ranges are indicated in Table 5.1.
60

Bibliography
−2
0
2
4
6
8
10
Se
nsitiv
ity c
oe
ffic
ien
t
Evaluated at max range/+50% and min range/−50%
36
PV
surv
TLm
inK
LC
raig
Tsporo
Vbsuccess
EI
MLm
ax
Wfm
ax1
Dsporo
ML4
Kw
Dgono
Hla
tent
Pih
vP
rhv
Hcle
ar
Tgono
Piv
hK
flush
Negg
TA
Uzoo
Tw
at
Rta
uR
imm
Vtindoor
Hm
death
TV
min
TV
max
TLm
ax
Tauflush
TA
Uanth
roP
Lsurv
Dpupae
Degg
Dblo
od
Increased Decreased Variability
Figure 5.6: Sensitivity of VECTRI simulated EIRa to its parameters settings Parameter basevalues evaluated at maximum range/+50% (red line) and at minimum range/-50% (Green line).Grey shade: variability of the parameter at maximum and minimum. The brown number 36 is themaximum sensitive coefficient for PVsurv
VECTRI simulated EIRa was sensitive to quite a number of parameters. However, themost sensitive parameter was PVsurv, the underlying adult vector survival probability.Increasing PVsurv translates to increasing the adult vector lifespan and for that mattertheir population leading to higher inoculations. The default probability value (See Ta-ble 5.1) is too high making the vectors to be long-lived than expected. However, whenPVsurv was evaluated at the minimum range, the output coefficient was low. Hence,increasing the survivial probability will results in model overestimation. Moreover,TLmin (Minimum water temperature for larvae survival) was found to be a sensitive pa-rameter. This parameter impacts on the fractional growth rate of larvae which followsa degree day concept based on a linear function of water temperature (Twat). Optimumwater temperature accelerates larvae growth rate but below TLmin larvae growth ceases.In VECTRI, this fractional growth rate is directly proportional to Twat-TLmin. There-fore, increasing TLmin meant lowering Water temperature, hence slowing down larvaegrowth rate. This will lead to a reduction in the number of maturing vectors joining thebiting population. Exposure to infectious inoculations will then be reduced in effect.
Other parameters include larvae growth degree days, minimum temperature for sporo-gonic cycle, base daily larval survival rate, and total evaporation and infiltration losses.In general, the sign of the computed sensitivity coefficient (i.e. whether EIRa increased(decreased) when a parameter was (increased(decreased)) for all the parameters agreedwith the intuitive expectation. It was also observed that most sensitive parameters wererelated to vectors (water-bound and adults). One can, therefore, link the relative impor-tance of these parameters to malaria transmission and prevalence through their impacton mosquito biting rates. This suggests strategies towards control of vector populatione.g. insecticide-treated bed nets and indoor residual spraying which have proven usefulin previous studies (Hawley et al. 2003, Sharma et al. 2005).
61

Bibliography
5.5 Summary and conclusionsA simple model of immunity to malaria (with limited parameters though capturedmany of the important aspects of the role of immunity in malaria transmission) wasutilized in VECTRI. This allowed for simulation of clinical malaria case and observa-tion of the effects of acquired immunity to malaia at climatologically different malariazones in Africa. The sensitivity of the parameter settings of VECTRI were addition-ally analyzed through a one-at-a-time sensitivity analysis by evaluating the sensitivitycoefficient of EIRa to model parameters.
The analysis showed that the simple immunity module enabled VECTRI to simulatedifferent levels of malaria for sub-Saharan Africa by reducing transmission rates atincreased malaria exposure of humans. The immunity module also substantially im-proved the seasonal malaria simulations of VECTRI by reducing its error. The sensitiv-ity analysis revealed parameters that show the strongest variation of the model output.The most sensitive parameter settings consisted of the adult vector survival probability,minimum temperature for larval survival, larvae growth degree days, minimum tem-perature for sporogonic cycle, base daily larval survival rate, and total evaporation andinfiltration losses.
It can, therefore, be concluded that areas with high immunity rendered the inhabitantsmore resilient and less vulnerable to malaria epidemics that may be associated withe.g. climate anomalies than areas with low or no immunity. This has important impli-cations for control and future malaria modelling efforts. The substantial reduction ofthe models’ simulation errors makes it more reliable and better tool for malaria fore-cast and control in Africa. Parameters contributing most to VECTRI output variabilityrequire additional research to strengthen knowledge base to reduce VECTRI outputuncertainty, especially at Cameroon and EEA. These parameters are also critical whenvalidating and using VECTRI as a guide for future research.
62
CHAPTER 6
Conclusions, recommendations and future outlook
6.1 Summary and discussionsMalaria burden in Africa especially the sub-Saharan Africa remains a serious com-plex public health problem despite its reduction over the last decade (WHO 2015).Overcoming malaria challenges in the region requires advancing our understanding ofmalaria epidemiology in the area. This thesis contributes to this effect by investigat-ing the impact of climatic and environmental drivers including malaria vector type onseasonal malaria transmission dynamics in Africa. The study further validated andanalyzed weather-driven dynamical mathematical malaria models that are used to pro-vide adequate approximations of seasonal epidemiological features of malaria in thearea.
Regarding the impact of climatic and environmental factors on seasonal malaria trans-mission, the study found rainfall as the primary climatic factor limiting malaria sea-sonality in the region. This applies in particular to markedly seasonal rainfall areassuch as the Sahel and Eritrea but not necessarily at bimodal rainfall distributed or morehumid zones which were more complex. These findings were contrary to literaturee.g. Mabaso et al. (2007). Again disagreeing with literature (Mabaso et al. 2007),temperature was not a limiting factor of malaria seasonality in Africa except for EastAfrica where it was able to delay the impact of rainfall. Unlike this work, most studies(Mabaso et al. 2007, Roca-Feltrer et al. 2009) do not explicitly delineate the influenceof the differing climatic zones and environmental settings as applied in this study butsort of lump information which is problematic.This work also revealed that the peaking characteristics of seasonal malaria weremostly unimodal. In the case of bimodal rainfall distributions, the malaria transmissionpeak was frequently associated with the first rainfall maximum of the year. Most stud-ies have concentrated on showing the start, end and duration of malaria season (Craiget al. 1999, Ermert et al. 2011b, Grover-Kopec et al. 2006, Tanser et al. 2003) but peakcharacteristics are scarce. The finding consolidates this research gap indicating a sig-nificant forward step in malaria studies. Seasonal malaria intensity was anti-correlatedwith elevation and population density which corroborates literature. Though seasonalmalaria was driven mainly by An. gambiae, An funestus, An. arabiensis, these vectorshave a competing and complex individual impact on seasonality.Studies using EIRm to investigate malaria seasonality are scarce due to lack of stan-dardized and geolocated EIR data (Hay et al. 2005, Kelly-Hope and McKenzie 2009).For this reason, numerous studies have relied on malaria cases which are not suitablemetric since cases or prevalence are different aggregated temporal windows of trans-mission (Reiner Jr et al. 2015). But, unlike the traditional use of malaria case data,
63
Bibliography
the conscious effort in gathering EIRm through literature survey has enabled us to di-rectly relate the risk of humans to malaria infections (due to the human-biting activityof Anopheles vectors) to climate and environment.
In the second part, the study validated and evaluated the seasonal ranges of EIRm sim-ulated by LMM2010 and VECTRI for Africa with observed EIRm data. The goal was toexamine their seasonal malaria simulation accuracy. Findings of the study revealed thatboth models could reproduce realistic seasonal malaria transmission rates for Africa.For instance, LMM2010 and VECTRI simulation error ranges were generally withinor about the same as the standard deviation of the observed EIRm data despite thesignificant deviations detected for Guinea and some individual monthly minor differ-ences. Concerning peak characteristics, both models agreed with observations that themalaria distribution was predominantly unimodal. However, the maximum malariatransmission peaks in the models tend to be delayed by one month especially in theSahel and Eritrea area. Both models further agreed with observed values of an indexof the malaria seasonality, which was closely linked to the latitudinal variation of cli-matic covariates such as rainfall.Malaria seasonality varies at highland areas especially East Africa (Drakeley et al.2005). For instance, Maxwell et al. (2003) sampled mosquitoes and found that EIRwas about 17 times greater at lowland than highland area. VECTRI revealed a strongerability in capturing the levels of malaria endemicity in at such zones than LMM2010.LMM2010 performed better in West Africa where it was calibrated than in East Africa.The inability of LMM2010 to reproduce similar pattern in East Africa may be because itwas not calibrated with data from the area. Also, unlike VECTRI, it lacks componentssuch as population density and hydrology. The hydrology model in VECTRI does notcapture very well malaria transmission at permanent water body locations and needsfurther review. Despite these hitches, findings of this study maximize the seasonalmalaria prediction accuracy, generality and reliability of both models.
The utilized simple immunity model enabled VECTRI to simulate different levels ofmalaria for Africa. It was able to reduce transmission rates at increased exposure ofhumans to malaria. It also substantially improved the seasonal malaria simulations ofVECTRI by reducing its error. The outcome was expected because malaria burdendiffer in Africa (Mandal et al. 2011) following the immune status of inhabitants basedon exposure intensity and age (Mandal et al. 2011, Molineaux et al. 1988). Though theimmunity model was not age-structured, its ability to mimic similar malaria patternsrepresent a significant improvement and a helpful tool. A refinement of this model isnecessary for full implementation in VECTRI.The one-at-a-time sensitivity analysis performed on VECTRI parameter settings re-vealed parameters that show the strongest variation of the model output. The mostsensitive parameter settings consisted of the adult vector survival probability, the min-imum temperature for larval survival, larvae growth degree days, the minimum tem-perature for sporogonic cycle, base daily larval survival rate, and total evaporation andinfiltration losses. This finding provides information about parameters that needs addi-tional research for improvement of model output variability. The sensitive parameterswere found to be related to vectors both at the water bound stages and adults. One can,therefore, link the relative importance of these parameters to malaria transmission andprevalence through their impact on mosquito biting rates. This suggest vector control
64

Bibliography
strategies such as insecticide-treated bed nets and indoor residual spraying which haveproven useful in previous studies (Hawley et al. 2003, Sharma et al. 2005).
6.2 Study weaknessThe sparsity and paucity of accurate measurement of EIRm data were the primarychallenges of this study. Standardized and geolocated EIRm data are scarce becauseits measurements are both labour and capital intensive (Hay et al. 2005, Kelly-Hopeand McKenzie 2009). For this reason, the field observed EIRm data used were sparsespatially and temporally (see Table 3.1). For instance, the spatial distribution of datalocations was inhomogeneous, abundant in some countries and very sparse in others(see Figure 3.1). This characteristic can provide limiting and misleading results ofapproaches of statistical applications such as computation of averages. Moreover, thetime series of the observed EIRm surveillances were rarely available in the long-termfor many settings. Monthly values of about a year and on rare occasions above a yearwere mostly available (see Table 3.1) and differed in SY and SM of records betweenlocations (see Table A.1). Again, the rather short nature of the EIRm time series limitedthe investigation of year-year variations in malaria seasonality which is particularly im-portant for naturally seasonal malarious areas such as the Sahel. Thus, surveys carriedout during epidemic years, may not give a realistic view of those conducted in non-epidemic years (MARA 1998). Details of the data weakness are outlined in AppendixA.
Meteorological time series of local weather station observations located at the malarialocations are usually ideal for this kind of study. But these observation stations were in-adequately distributed in the area, contained incomplete records and mostly not locatedat the malaria study locations. For this reason, the study relied on surrogate meteoro-logical data products such as ARCv2 and ERAI. The use of the surrogate productsmay likely over-estimate or under-estimate rainfall and temperature records of loca-tions which will have adverse consequence especially on the LMM2010 and VECTRIoutput.
6.3 Conclusions and study significanceFindings of the study regarding the impact of climatic and environmental factors in-cluding malaria vector type on seasonal malaria transmission seasonality have impor-tant implications for malaria control and possible elimination in Africa. It suggeststhat temporal and spatial target of malaria interventions and resource allocation op-timization should focus on the rainy seasons. Areas of seasonal transmission sever-ity identified will aid the choice and cost effectiveness of an intervention. For in-stance, year-round malaria chemoprevention in children and pregnant women is cost-effective at perenial transmission settings such as Savanna, Guinea and Cameroon thanat markedly seasonal transmission settings such as Sahel and Eritrea.The findings of this work also consolidate evidence of the link between seasonalmalaria transmission patterns and climate and environment. Our understanding of theimpact of climate and environment on vector biology, transmission intensity, clinicaldisease and mortality risks has been widely informed. The outcome also supplementprevious works describing clinical patterns of malaria infection and morbidity that will
65

Bibliography
help stakeholders establish a robust framework for monitoring, forecasting and con-troll. EIRm can, therefore, be used as the gold-standard metric for evaluating seasonalmalaria outcome of weather driven dynamical mathematical malaria models as a func-tion of climate and environment.Following to the impact of climate change on temperature suitability for malaria trans-mission at highland areas (Alemu et al. 2011, Parham and Michael 2010), temperaturesurveillance and monitoring at elevated areas is necessary to curb the prolifiration ofmalaria vectors. Elevation measurements can also serve as proxy for temperature inmalaria transmission measurements which can be usefull for optimum appropriationof control measures. Malaria vector surveillance and monitoring operations are alsonecessary at malaria locations invaded by permanent water bodies and irrigation forappropriate application of control tools. Access to public health services and povertyalleviation at rural areas is needed to curb the high malaria transmission.
The work on the accuracy of LMM2010 and VECTRI in simulating seasonal malariafor Africa has maximized our convictions on their reliability. It is therefore concludedthat, both models can realistically mimic seasonal malaria transmission dynamics inAfrica as a function of climate and environment to a large extent. While both modelsin their current state can be used as early malaria warning system, VECTRI may havemore advantage in highland areas such as East Africa over LMM2010. The findings ofthis work therefore provide the basis for further review and refinement of both modelsby their developers regarding identified hitches and inclusion of other missing malariatransmission factors.
The immunity model widened our understanding of the impact of immunity on malariaseasonality in Africa and informed about future malaria modelling efforts in the region.The study indicated that locations with high immunity rendered the inhabitants moreresilient and less vulnerable to malaria risk. Hence, monitoring of climate anomaliesat areas with low immunity is needed to prepare for associated malaria epidemics inthose areas. Moreover, the sensitivity of VECTRI output depended on the choice of pa-rameter values and assumptions upon which it operates. It is, therefore, important thatVECTRI output and its parameter values be tested against field observations when us-ing the model for public policy and health decision makings. Parameters contributingmost to VECTRI output variability are critical when validating and using VECTRI as aguide for future research. They require additional research to increase their knowledgebase for adjustment.
6.4 Recommendations and future outlookAn examination of the map of the geographical distribution of EIRm study sites (Fig-ure 3.1) showed that, data locations were spatially inhomogeneous across sub-SaharanAfrica. This pattern seems to suggest a preferential selection of study sites, especiallylocations where malaria is recognized as either a local health problem or has a stronghistorical basis. Future EIRm surveillance should spread to parts of the region withoutobservations. It should also seek to extend the EIRm timeseries of already observedlocations though costly and labour intensive. Moreover, a team of international net-work with the mandate to map EIRm data via standard methods in a grid-based systemin needed to record the spatial distribution of malaria transmission in Africa more
66

Bibliography
closely(Hay et al. 2000).
A political will by African governments and efforts to building a dense network ofground meteorological station measurement across Africa is necessary. This could bedeployed on a pilot basis until areas are covered. Resolving issues with meteorologicalmeasurements will aid immensely not only in malaria research but also other vector-borne diseases such as dengue fever, yellow fever and zika virus. Future studies lookforward to reconstructing meteorological time series for the EIRm data locations usingdata from available station measurements. This can be used for similar studies incomparison with surrogate observations.
Malaria vector type, their behaviour and distribution are one of the important factors ofseasional malaria transmission. An. gambiae, funestus and arabiensis were identifiedas the most dominant,treacherous, sympathric and overall malaria causing vectors inAfrica. Both VECTRI and LMM2010 formulations are limitted to literature on An.gambiae complex only. Future modeling efforts should therefore include that of An.funestus. Future works should also explicitly identify and include the anthropohilicbehaviour of these three primary vectors and presence of animals such as cattle at amalaria location. The inclusion of these malaria vector dynamics may improve modelestimation of malaria seasonality in the region.
Although the simple immunity model utilized in VECTRI improved its seasonal sim-ulations substantially, its refinement to include age-structure is necessary. This isimportant since malaria infection moves differentially within age groups in endemicareas. Since infections are higher in children than in adults (Baird et al. 2003), the age-structured model should involve different transmission probabilities of gametocytesfrom children, immune and non-immune adults to mosquitoes. Besides, the interac-tion of the mosquito immune system affects Plasmodium parasites transmission to thehost (Crompton et al. 2014). The inclusion of immune processes of the vector intomodels is very useful.
While the conventional use of mean temperatures by the models to simulate EIRm
might be appropriate under certain conditions, it may likely over- or under-estimateEIRm at warmer and colder zones respectively. This characteristic was evident in thisstudy. Future developments should, therefore, focus on the use of diurnal daily tem-perature ranges rather than mean. This is important since the biology of the malariavectors and parasite is influenced by both average temperature and the extent of thediurnal temperature variation that occurs throughout the day.
To conclude, information from the impact of climatic and environmental factors onseasonal malaria transmission, model validation and improvement for effective sea-sonal malaria prediction are valuable. This information coupled with strengtheninghealth systems, developing infrastructure and poverty reduction in sub-Saharan Africamay contribute immensely to maximum control and ultimate elimanation of malaria.
67

Appendix A
Appendix
A.1 Categorization of data locationsFirst, the malaria locations were grouped into zones of similar climate (see Figure 3.1).The purpose was to decouple and avoid lumping data from climates of dissimilar char-acteristics. The step was important since different climate settings impact on seasonalmalaria transmission differently. The sub-Saharan Africa was first and foremost di-vided into two broad sections: the West (longitudes ≤ 20◦) and the East (longitudes >20◦). Using the climate information of Omotosho and Abiodun (2007), the West wassubgrouped into latitudinal bands of Sahel (latitudes ≥ 10◦), Savanna (8◦ <= latitudes< 10◦), Guinea (5◦ <= latitudes <8◦) and Cameroon area (latitudes < 5◦). East Africahas a sophisticated climate unlike the West due to the existence of complex topographyand large inland water bodies (Indeje et al. 2000). For this reason and as a matter ofsimplicity, the East was crudely subdivided into Eritrea (latitudes ≥ 10◦), Ethiopia (5◦
<= latitudes < 10◦) and Equatorial East Africa (latitudes < 5◦). It was then assumedthat climate variation within each sub-division was meagre to result in any significantdifferences in seasonal malaria transmission. The analysis of malaria seasonality wasthen limitted to each zone.
Secondly, each malaria location was identified as either rural (R), peri-urban (PU)or urban (U) setting. The approach was necessary because malaria transmission espe-cially intensity reportedly depends on Pd type of the location (Kelly-Hope and McKen-zie 2009, Tompkins and Ermert 2013, Vercruysse et al. 1983). In the articles fromwhich data were digized, the Pd status of most of the locations were unavailable anddifficult to identify. Hence, the identification of the Pd status of each location wasbased on the following steps. 1) the Pd values for each site were extracted from theGPDWv3 (CIESIN-CIAT 2005) using their geographical longitude and latitude posi-tion points. But the GPDWv3 data were available for only 1990, 1995 and 2000. Thismeant that locations where surveys are conducted outside these dates, had no Pd data(though available for 1990, 1995 and 2000). To find Pd values for such locations, theannual rate of change in density per location was calculated from the available dates(1990,1995 and 2000). The determined rate of change was then used to estimate the Pdvalue for such locations. 2) Using the definition of urbanisation by Hay et al. (2005)each location was classified as rural (Pd≤ 250), peri-urban (250<pd≤1000 ) and urban(Pd > 1000). See table A.1
Thirdly, water impoundments and irrigation provide potential habitat for water-boundstages of malaria vectors (Fillinger et al. 2009, Kar et al. 2014). They pose considerablerisk to malaria especially at epidemic zones (Keiser et al. 2005, Muturi et al. 2006).For this reason, each malaria location was identified as either Neutral (N), Irrigated (I)
68

Bibliography
or Permanent Water Body (PWB) depending on the type of hydrology pertaining thelocation. The hydrology information of each location was obtained from the respectivearticles from data were digitized. Locations characterised by water bodies such asrivers, streams, dams, swamps, marshland and lakes were said to be pwb. Those withongoing irrigation activities and double croping associated with crops such as rice andsugarcane were regarded as irrigated. Locations without irrigation and PWBs wereregarded as neutral. See table A.1.
A.2 Observed EIRm data uncertaintiesInherent uncertainties may characterise observed EIRm data as a result of errors ema-nating from the estimation of HBR and CSPR (Shaukat et al. 2010). Note that EIR insimple terms is the product of HBR and CSPR.First, the different mosquito sampling methods (HLC, PSC and LTC) are not standard-ized (Fontenille et al. 2001, Githeko et al. 1996). Estimated HBR from each methodand for that matter EIR may differ and may not accurately represent the levels of ex-posure experienced by individuals in a study community (Kilama et al. 2014). Forinstance, the most direct mosquito sampling technique is HLC (Tusting et al. 2014,WHO 1975) as it directly samples human biting mosquitoes (Le Goff et al. 1997). But,PSC and LTC depend largely on the mosquito behaviour rather than directly feedingon humans (Hay et al. 2000). They may therefore likely overestimate true biting rates(Mboera 2005) since mosquitoes are collected off human baits.
Secondly, estimates of HBR and CSPR need to be repeated every day of the monthfor at least a year or a complete transmission season (Hay et al. 2000). But due tothe capital and labour intensive nature of the methods, HBR and CSPR estimates areconducted in few days (most often one or two days) of the month and the averagedaily value is determined. The product of the average daily value and the numberof days of the month yield the monthly estimate. The insufficient sampling days canbe problematic especially in areas where mosquitoes are rare or are rarely infected.Besides, few trained specialist are mostly involved, and the sampling is subjected tocollector skills, collector attraction to mosquitoes as well as instrumental errors. Thesebiases may limit the precision and accuracy of estimated EIRm (Fontenille et al. 2001,Kilama et al. 2014, Tusting et al. 2014).
Thirdly, long-term EIRm surveillances were rarely available for many settings. Monthlytime series of about a year and on rare occasions above a year were mostly available(see Table 3.1) and differed in SY and SM of records between locations (see Table A.1).Thus, surveys carried out during epidemic years, may not give a realistic view of thoseconducted in non-epidemic years (MARA 1998).
The fourth uncertainty is the inhomogeneous distribution of data locations (see Fig-ure 3.1), abundant in some countries and very sparse in others. The entomological sur-veys appeared to be concentrated mainly in areas where malaria is known to be preva-lent (MARA 1998). These characteristics in effect can be very limiting and sometimesbe misleading regarding the application of statistical approaches such as computingaverage values.
69

Bibliography
The last but not the least, the EIRm data used in this study were manually digitised fromfigures of articles in which they were published using an R package (Poisot 2011). Theaccuracy of the digitised EIR values will also then be subject to the precision of theindividual digitising the data.
70

Bibliography
Table A.1: Malaria locations and their characteristicsCountry site lon lat elevation Pd Hydrology SY SM EY EM RefBenin Gbegame 2.41 6.36 6 U N 1987 1 1987 12 Akogbeto et al. (1992)Benin Ladji 2.43 6.39 2 U N 1987 1 1987 12 Akogbeto et al. (1992)Benin St. Ritha Nord 2.40 6.38 4 U N 1987 1 1987 12 Akogbeto et al. (1992)Burkina Faso Balonguen -1.49 12.04 343 R N 2000 12 2001 11 Ilboudo-Sanogo et al. (2010)Burkina Faso Dande -3.08 10.90 275 R N 1983 1 1984 12 Robert et al. (1985)Burkina Faso Guinghin Nord -1.55 12.37 305 U N 1984 3 1985 2 Rossi et al. (1986)Burkina Faso Karangaso -4.63 11.22 366 R pwb 1988 3 1989 2 Robert et al. (1988)Burkina Faso Kologh-Naba -1.54 12.38 292 U N 1984 3 1985 2 Rossi et al. (1986)Burkina Faso Kongodjan -5.02 10.90 480 R pwb 1983 1 1984 12 Robert et al. (1985)Burkina Faso Lena -3.88 11.30 307 R N 1999 1 2001 12 Dabire et al. (2008)Burkina Faso Nongremassm -1.50 12.30 310 U N 1984 3 1985 2 Rossi et al. (1986)Burkina Faso St. Camille -1.50 12.36 299 U N 1984 3 1985 2 Rossi et al. (1986)Burkina Faso Tago -4.38 11.67 308 R N 1983 1 1983 12 Robert et al. (1985)Burkina Faso Tensobtenga -1.30 12.30 295 R pwb 2000 12 2001 11 Ilboudo-Sanogo et al. (2010)Burkina Faso VK4 -4.27 11.52 288 R I 1983 1 1984 12 Robert et al. (1985)Burkina Faso VK6 -4.27 11.52 288 R I 1983 1 1984 12 Robert et al. (1985)Cameroon Nkol-Bikok 11.52 3.87 728 U pwb 1989 3 1990 2 Fondjo et al. (1992)Cameroon Nkol-Bisson 11.00 3.00 760 R pwb 1989 4 1990 3 Fondjo et al. (1992)Cameroon Ebogo 11.47 3.40 659 R N 1991 4 1992 3 Njan Nloga et al. (1993)Cameroon Ebolakounou 12.13 3.93 701 R N 1997 6 1998 5 Meunier et al. (1999)Cameroon Ekombitie 11.83 3.12 693 R pwb 2007 1 2007 12 Fils et al. (2010)Cameroon Esuke-camp 9.31 4.10 279 R N 2004 10 2005 9 Tanga et al. (2011)Cameroon Idenau 9.05 4.02 359 R N 2001 8 2002 7 Bigoga et al. (2007)Cameroon Koundou 12.12 3.90 705 R N 1997 6 1998 5 Meunier et al. (1999)Cameroon Likoko 9.23 4.22 1933 R N 2002 10 2003 9 Tanga and Ngundu (2010)Cameroon Limbe 9.18 4.03 185 R N 2001 8 2002 7 Bigoga et al. (2007)Cameroon Mbebe 10.12 3.38 70 R pwb 1989 4 1990 3 Le Goff et al. (1997)Cameroon Ndogpassi 10.13 3.08 72 R N 2011 1 2011 12 Antonio-Nkondjio et al. (2012)Cameroon Nsimalen Ekoko 12.12 3.82 699 R pwb 1991 4 1992 3 Manga et al. (1995)Cameroon Nsimalen Mefou 11.57 3.70 680 R pwb 1991 4 1992 3 Manga et al. (1995)Cameroon Sanaga 11.52 4.92 474 R pwb 1989 4 1990 3 Carnevale et al. (1992)Cameroon Simbock-Block6 11.50 3.83 717 U pwb 1999 1 1999 12 Antonio-Nkondjio et al. (2002)Cameroon Tiko 9.28 4.07 182 R N 2001 8 2002 7 Bigoga et al. (2007)Chad Goulmoun 15.20 10.39 324 R I 2006 6 2007 5 Kerah-Hinzoumbé et al. (2009)DRC Kimbangu 15.31 -4.36 295 U N 1988 9 1989 8 Coene (1993)DRC Kwamutu 15.28 -4.47 346 U N 1988 9 1989 8 Coene (1993)DRC Mbansale 15.17 -4.33 289 R pwb 1990 5 1991 4 Karch et al. (1993)Eritrea Adibosqual 38.65 14.69 1482 R N 1999 1 1999 12 Shililu et al. (2003)Eritrea Anseba-Adiboqual 37.81 16.48 894 R N 1999 10 2000 9 Shililu et al. (2004)Eritrea Anseba-Hagaz 37.81 16.48 894 R N 1999 10 2000 9 Shililu et al. (2004)Eritrea Dasse 37.50 14.93 916 R N 1999 1 1999 12 Shililu et al. (2003)Eritrea Debub-Mai-Aini 39.15 14.95 1809 R N 1999 10 2000 9 Shililu et al. (2004)Eritrea Gash-Barka-Dasse 37.64 15.41 610 R N 1999 10 2000 9 Shililu et al. (2004)Eritrea Gash-Hiletsidi 37.64 15.41 610 R N 1999 10 2000 9 Shililu et al. (2004)Eritrea Hagaz 38.27 15.68 883 R N 1999 1 1999 12 Shililu et al. (2003)Eritrea Hiletsidi 36.66 15.13 586 R N 1999 1 1999 12 Shililu et al. (2003)Eritrea Maiaini 39.09 14.81 1554 R N 1999 1 1999 12 Shililu et al. (2003)Ethiopia Baka-Boro 36.52 8.58 1316 R I 2010 2 2011 1 Jaleta et al. (2013)Ethiopia Chano 37.58 6.10 1211 R N 2009 5 2010 4 Massebo and Lindtjørn (2013)Ethiopia Dirama 38.42 8.17 2031 PU PW 2008 7 2010 6 Animut et al. (2013)Ethiopia Hobe 38.48 8.02 1834 PU PW 2008 7 2010 6 Animut et al. (2013)Ethiopia Machara 36.42 8.58 1351 R N 2010 2 2011 1 Jaleta et al. (2013)Ethiopia Wama-Kusaye 36.49 8.59 1319 R I 2010 2 2011 1 Jaleta et al. (2013)Gabon Benguia 10.37 -0.53 37 R N 2003 5 2004 4 Elissa et al. (2003)Gabon Dienga 12.68 -1.87 772 R N 2003 5 2004 4 Elissa et al. (2003)Ghana Abotanso -1.28 6.88 374 R N 2004 9 2005 8 Badu et al. (2013)Ghana Gyidim -1.08 6.80 408 R N 2003 11 2005 10 Badu et al. (2013)Ghana Hwidiem -2.35 6.93 186 R N 2003 11 2005 10 Badu et al. (2013)Ghana Kintampo -1.73 8.06 354 R N 2003 11 2005 10 Dery et al. (2010)Ghana KND-Irrigated -1.44 10.76 212 R I 2001 6 2002 5 Appawu et al. (2004)Ghana KND-Lowland -1.44 10.76 212 R N 2001 6 2002 5 Appawu et al. (2004)Ghana KND-Highland -1.44 10.76 212 R N 2001 6 2002 5 Appawu et al. (2004)Ghana LowCost -1.55 6.63 250 U N 2003 11 2005 10 Badu et al. (2013)Ghana NHDSS -1.29 10.89 287 R pwb 2001 11 2004 10 Kasasa et al. (2013)Ivory Coast Alloukoukro -5.15 7.69 334 R pwb 1991 1 1992 12 Dossou-Yovo et al. (1995)Ivory Coast Batouapleu -8.32 6.79 243 R I 1998 4 1999 3 Briët et al. (2003)Ivory Coast Beoue -7.87 6.55 268 R N 1998 4 1999 3 Briët et al. (2003)Ivory Coast Bepleu -8.05 7.00 285 R N 1998 4 1999 3 Briët et al. (2003)Ivory Coast Bietouo -8.13 6.90 283 R N 1998 4 1999 3 Briët et al. (2003)Ivory Coast Binguebougou -5.81 9.53 357 R N 1996 12 1997 11 Briët et al. (2003)Ivory Coast Dar-es-Salam -5.01 7.71 325 PU N 1991 1 1992 12 Dossou-Yovo et al. (1998)Ivory Coast Bouake-Kennedy -5.01 7.69 351 PU N 1991 1 1992 12 Dossou-Yovo et al. (1998)Ivory Coast Bouake-Sokoura -5.05 7.68 361 PU N 1991 1 1992 12 Dossou-Yovo et al. (1998)Ivory Coast Tolakouadiokro -5.04 7.73 331 PU I 1991 1 1992 12 Dossou-Yovo et al. (1998)Ivory Coast Bouake-Zone -5.06 7.70 367 PU I 1991 1 1992 12 Dossou-Yovo et al. (1998)Ivory Coast Bouenneu -8.23 6.93 251 R I 1998 4 1999 3 Briët et al. (2003)Ivory Coast Danta -8.16 7.02 272 R N 1998 4 1999 3 Briët et al. (2003)Ivory Coast Douandrou -7.92 6.54 237 R N 1998 4 1999 3 Briët et al. (2003)Ivory Coast Douedy-Guezon -7.75 6.57 266 R N 1998 4 1999 3 Briët et al. (2003)
71

Bibliography
Table A.2: Table A.1 continuouCountry site lon lat elevation pd Hydrology SY SM EY EM RefIvory Coast Fapaha -5.83 9.49 361 R N 1996 12 1997 11 Briët et al. (2003)Ivory Coast Finneu -8.15 7.00 274 R I 1998 4 1999 3 Briët et al. (2003)Ivory Coast Folofonkaha -5.21 8.58 328 R N 1996 12 1997 11 Briët et al. (2003)Ivory Coast Gbahouakaha -5.41 9.50 345 R I 1996 12 1997 11 Briët et al. (2003)Ivory Coast Gbontegleu -8.24 6.97 257 R N 1998 4 1999 3 Briët et al. (2003)Ivory Coast Glopaoudy -7.63 6.54 234 R N 1998 4 1999 3 Briët et al. (2003)Ivory Coast Kabolo -4.99 8.19 268 R N 1996 12 1997 11 Briët et al. (2003)Ivory Coast Kaforo -5.67 9.29 329 R N 1996 12 1997 11 Briët et al. (2003)Ivory Coast Kombolokoura -5.88 9.33 366 R N 1996 12 1997 11 Briët et al. (2003)Ivory Coast Meantouo -8.14 6.89 277 R N 1998 4 1999 3 Briët et al. (2003)Ivory Coast Nanbekaha -5.69 9.29 320 R I 1996 12 1997 11 Briët et al. (2003)Ivory Coast Nombolo -5.83 9.41 379 R I 1996 12 1997 11 Briët et al. (2003)Ivory Coast Nongotchenekaha -5.40 9.52 332 R I 1996 12 1997 11 Briët et al. (2003)Ivory Coast Ounandiekaha -5.17 8.36 286 R N 1996 12 1997 11 Briët et al. (2003)Ivory Coast Pepleu -8.20 6.95 256 R I 1998 4 1999 3 Briët et al. (2003)Ivory Coast Petionara -5.12 8.43 277 R N 1996 12 1997 11 Briët et al. (2003)Ivory Coast Pohan -7.93 6.54 249 R N 1998 4 1999 3 Briët et al. (2003)Ivory Coast Seileu -8.17 7.10 337 R N 1998 4 1999 3 Briët et al. (2003)Ivory Coast Tioroniaradougou -5.64 9.36 361 R N 1996 12 1997 11 Briët et al. (2003)Ivory Coast Vetouo -8.12 6.96 280 R I 1998 4 1999 3 Briët et al. (2003)Ivory Coast Yotta -8.19 7.15 340 R N 1998 4 1999 3 Briët et al. (2003)Ivory Coast Zeale -8.16 6.99 265 R I 1998 4 1999 3 Briët et al. (2003)Ivory Coast Ziglo -7.80 6.57 256 R N 1998 4 1999 3 Briët et al. (2003)Ivory Coast Zoleu -8.31 6.81 236 R I 1998 4 1999 3 Briët et al. (2003)Kenya Ahero 34.92 -0.18 1152 PU I 1989 8 1990 7 Githeko et al. (1993)Kenya Asembo 34.40 -0.18 1148 PU N 1988 3 1989 2 Taylor et al. (1990)Kenya Kameichiri 37.30 -0.65 1188 PU N 2004 4 2005 3 Muturi et al. (2008)Kenya Kilifi 39.85 -3.63 18 PU N 1990 12 1991 11 Mbogo et al. (1993)Kenya Kisian 34.67 -0.07 1246 PU pwb 1985 10 1988 9 Beier et al. (1990)Kenya Loboi 35.98 -0.47 2285 PU pwb 1994 1 1994 12 Aniedu (1997)Kenya Mbuinjeru 37.32 -0.72 1141 PU N 2004 4 2005 3 Muturi et al. (2008)Kenya Mumias 34.49 0.34 1311 PU I 1995 5 1996 4 Shililu et al. (1998)Kenya Murinduko 37.45 -0.57 1311 PU N 2004 4 2005 3 Muturi et al. (2008)Kenya Perkerra 35.98 -0.47 2285 PU I 1994 1 1994 12 Aniedu (1997)Kenya Saradidi 34.24 -0.02 1221 R N 1985 10 1988 9 Beier et al. (1990)Kenya Sokoke 39.82 -3.52 125 R N 1990 12 1991 11 Mbogo et al. (1993)Madagascar Manarintsoa 47.42 -19.00 1290 R I 1988 10 1989 9 Lepers et al. (1991)Madagascar Saharevo 48.10 -18.82 873 R pwb 2003 10 2004 9 Andrianaivolambo et al. (2010)Madagascar Ambodifotatra 49.88 -17.00 3 R pwb 1988 11 1989 10 Lepers et al. (1991)Mali Sotuba -7.91 12.66 323 R N 1998 1 1998 12 Sagara et al. (2002)Mozambique CdSLCMPC 32.57 -25.92 35 PU N 1985 1 1985 12 Zharov (1992)Mozambique Manhica 32.81 -25.40 20 R I 2001 10 2002 9 Aranda et al. (2005)Senegal Affiniam-Diagobel -16.37 12.65 12 R N 1985 1 1986 12 Faye et al. (1994)Senegal Barkedji -14.88 15.28 349 R N 1994 6 1996 5 Lemasson et al. (1997)Senegal Dielmo -16.42 13.72 32 R PWB 1990 4 1995 3 Fontenille et al. (997a)Senegal Diohine -16.52 14.50 8 R pwb 1995 1 1995 12 Robert et al. (1998)Senegal Kotiokh -16.56 14.49 7 R pwb 1995 1 1995 12 Robert et al. (1998)Senegal Ndiop -16.36 15.95 6 R N 1993 5 1996 4 Fontenille et al. (997a)Senegal Ngayokheme -16.43 14.53 11 R N 1995 1 1995 12 Robert et al. (1998)Senegal Takeme-Ousseuk -16.20 12.80 21 R N 1985 1 1986 12 Faye et al. (1994)Senegal Wassadou -13.33 13.35 26 R pwb 1992 9 1993 8 Faye et al. (1995)Sierra Leone Bayama -11.67 8.00 102 R pwb 1990 11 1991 10 Bockarie et al. (1995)Sierra Leone Mendewa -11.48 8.17 325 R N 1990 1 1990 12 Bockarie et al. (1994)Sierra Leone Nyandeyama -11.62 8.12 118 R N 1990 1 1990 12 Bockarie et al. (1994)Tanzania Bagamoyo 38.44 -5.07 1093 R N 1995 10 1996 9 Bodker et al. (2003)Tanzania Balangai 38.46 -4.93 1230 R N 1995 10 1996 9 Bodker et al. (2003)Tanzania Chasimba 38.82 -6.58 36 R N 1992 1 1992 12 Shiff et al. (1995)Tanzania Chekereni 37.36 -3.38 763 PU I 1994 7 1995 6 Ijumba et al. (2002)Tanzania Idete 36.48 -8.10 295 R N 1992 7 1994 6 Charlwood et al. (1998)Tanzania Kerege 39.03 -6.57 36 R pwb 1992 1 1992 12 Shiff et al. (1995)Tanzania Kisangasangeni 37.39 -3.39 759 PU N 1994 7 1995 6 Ijumba et al. (2002)Tanzania Kongo 38.83 -6.53 19 R pwb 1992 1 1992 12 Shiff et al. (1995)Tanzania Kwameta 38.47 -5.08 671 R N 1995 10 1996 9 Bodker et al. (2003)Tanzania Kwamhanya 38.46 -5.06 596 R N 1995 10 1996 9 Bodker et al. (2003)Tanzania Magundi 38.47 -5.09 671 R N 1995 10 1996 9 Bodker et al. (2003)Tanzania Mapinga 39.07 -6.60 59 R N 1992 1 1992 12 Shiff et al. (1995)Tanzania Matimbwa 38.87 -6.50 21 R pwb 1992 1 1992 12 Shiff et al. (1995)Tanzania Michenga 36.63 -8.12 258 R pwb 1989 5 1991 4 Lyimo (1993)Tanzania Milungui 38.36 -4.76 1636 R N 1995 10 1996 9 Bodker et al. (2003)Tanzania Mvuleni 37.33 -3.39 786 PU N 1994 7 1995 6 Ijumba et al. (2002)Tanzania Namawala 36.40 -8.15 289 R N 1990 8 1991 7 Smith et al. (1993)Tanzania Yombo 38.85 -6.57 36 R N 1992 1 1992 12 Shiff et al. (1995)Tanzania Zinga 38.98 -6.52 22 R N 1992 1 1992 12 Shiff et al. (1995)Uganda Apac-Olami 32.72 1.98 1053 R N 2001 6 2002 5 Okello et al. (2006)Uganda Arua-Cilio 31.02 3.18 976 PU N 2001 6 2002 5 Okello et al. (2006)Uganda Jinja-School 33.22 0.43 1166 U N 2001 6 2002 5 Okello et al. (2006)Uganda Kabale-villages 30.00 -1.25 1888 PU N 1997 10 1998 9 Lindblade et al. (1999)Uganda Kanungu-Kihihi 29.70 0.75 758 R N 2001 6 2002 5 Okello et al. (2006)Uganda Kyenjojo-Kasiina 30.62 0.62 1361 R N 2001 6 2002 5 Okello et al. (2006)Uganda Tororo-Namwaya 34.02 0.77 1143 PU N 2001 6 2002 5 Okello et al. (2006)
72

Bibliography
Adiamah, J. H., Koram, K. A., Thompson, M. C., Lindsay, S. W., Todd, J., and Greenwood, B. M.(1993). Entomological risk factors for severe malaria in a peri-urban area of the gambia. Ann TropMed Parasitol, 87(5):491–500.
Adja, A. M., N’Goran, E. K., Koudou, B. G., Dia, I., Kengne, P., Fontenille, D., and Chandre, F. (2011).Contribution of an. funestus, an. gambiae, and an. nili (diptera:culicidae) to the perenial malariatransmission in the southern and western forest areas of cote d’ivoire. Ann Trop Med Parasitol,105(1):13–24.
Afrane, Y. A., Githeko, A. K., and Yan, G. (2012). The ecology of anopheles mosquitoes under climatechange: case studies from the effects of environmental changes in east africa highlands. Annals ofthe New York Academy of Sciences, 1249:204–210.
Akhwale, W. S., Lum, J. K., Kaneko, A., Eto, H., Obonyo, C., Björkman, A., and Kobayakawa, T.(2004). Anemia and malaria at different altitudes in the western highlands of kenya. Acta Tropica,91(2):167–175.
Akogbeto, M., Modiano, D., and Bosman, A. (1992). Malaria transmission in the lagoon area ofcotonou, benin. Parassitologia, 34(1-3):147–154.
Alemu, A., Abebe, G., Tsegaye, W., and Golassa, L. (2011). Climatic variables and malaria transmissiondynamics in jimma town, south west ethiopia. Parasit Vectors, 4(30).
Altman, D. G. and Bland, J. M. (2005). Standard deviations and standard errors. BMJ, 331:903.
Anderson, R. M. and May, R. M. (1991). Infectious diseases of humans: dynamics and control. OxfordUniversity Press, London.
Andrianaivolambo, L., Domarle, O., Randrianarivelojosia, M., Ratovonjato, J., Le Goff, G., Talman, A.,Ariey, F., and Robert, V. (2010). Anthropophilic mosquitoes and malaria transmission in the easternfoothills of the central highlands of madagascar. Acta tropica, 116(3):240–245.
Aniedu, I. (1997). Dynamics of malaria transmission near two permanent breeding sites in baringodistrict, kenya. The Indian journal of medical research, 105:206–211.
Animut, A., Balkew, M., Gebre-Michael, T., and Lindtjørn, B. (2013). Blood meal sources and entomo-logical inoculation rates of anophelines along a highland altitudinal transect in south-central ethiopia.Malaria journal, 12(1):1.
Antonio-Nkondjio, C., Awono-Ambene, P., Toto, J.-C., Meunier, J.-Y., Zebaze-Kemleu, S., Nyambam,R., Wondji, C. S., Tchuinkam, T., and Fontenille, D. (2002). High malaria transmission intensity ina village close to yaounde, the capital city of cameroon. Journal of medical entomology, 39(2):350–355.
Antonio-Nkondjio, C., Defo-Talom, B., Tagne-Fotso, R., Tene-Fossog, B., Ndo, C., Lehman, L. G.,Tchuinkam, T., Kengne, P., and Awono-Ambene, P. (2012). High mosquito burden and malariatransmission in a district of the city of douala, cameroon. BMC infectious diseases, 12(1):1.
73

Appawu, M., Owusu-Agyei, S., Dadzie, S., Asoala, V., Anto, F., Koram, K., Rogers, W., Nkrumah, S.,Hoffman, S. L., and Fryauff, D. J. (2004). Malaria transmission dynamics at a site in northern ghanaproposed for testing malaria vaccines. Trop Med Int Health, 9:164–170.
Aranda, C., Aponte, J. J., Saute, F., Casimiro, S., Pinto, J., Sousa, C., Rosario, V. D. O., Petrarca,V., Dgedge, M., and Alonso, P. (2005). Entomological characteristics of malaria transmission inmanhica, a rural area in southern mozambique. Journal of medical entomology, 42(2):180–186.
Aron, J. L. (1983). Dynamics of acquired immunity boosted by exposure to infection. Math Biosci,64(2):249–259.
Aron, J. L. (1988). Mathematical modelling of immunity to malaria. Math Biosci, 90(1-2):385–396.
Aron, J. L. and May, R. M. (1982). The population dynamics of malaria, in population dynamics ofinfectious disease (R. M. Anderson ED.). Chapman and Hall, London.
Attenborough, R. D., Burkot, T. R., and Gardner, D. S. (1997). Altitude and the risk of bites frommosquitoes infected with malaria and filariasis among the mianmin people of papua new guinea.Trans R Soc Trop Med Hyg, 91:8–10.
Awange, J. L., Ferreira, V. G., Forootan, E., Khandu, Andam-Akorful, S. A., Agutu, N. O., and He,X. F. (2016). Uncertainties in remotely sensed precipitation data over africa. International Journalof Climatology, 36:303–323.
Badu, K., Brenya, R. C., Timmann, C., Garms, R., and Kruppa, T. F. (2013). Malaria transmission in-tensity and dynamics of clinical malaria incidence in a mountaneous forest region of ghana. MalariaWorld Journal, 4(14):4–14.
Bailey, N. T. J. (1988). The Biomathematics of malaria, in: Malaria: Principles and Practice ofMalariology. Oxford Uni. Press, London.
Baird, J. K. (1995). Host age as a determinant of naturally acquired immunity to plasmodium falciparum.Parasitol Today, 11(3):105–111.
Baird, J. K. (2004). Chloroquine resistance in plasmodium vivax. Antimicrob. Agents Chemother,48(11):4075–4083.
Baird, J. K. (2005). Effectiveness of antimalarial drugs. N Engl J Med, 352(15):1565–77.
Baird, J. K., Bangs, M. J., Maquire, J. D., and Barcus, M. J. (2002). Epidemiological Measure of Riskof Malaria. In Methods in Molecular Medicine. Malaria Methods and Protocols. Humana Press, Inc,Totowa, N J, 72 edition.
Baird, J. K., Jones, T. R., Danudirgo, E. W., Basri, H., Annis, B. A., Bangs, M. J., Wiady, I., and Masbar,S. (1991). Age-dependent acquired immunity against plasmodium falciparum among people with 2years exposure to hyperendemic malaria. Am J Trop Med Hyg, 45(1):65–76.
Baird, J. K., Krisin, Barcus, M. J., Elyazar, I. R. F., Bangs, M. J., Maguire, J. D., Fryauff, D. J., Richie,T. L., Sekartuti, and Kalalo, W. (2003). Onset of clinical immunity to plasmodium falciparum amongjavanese migrants to indonesian papua. Ann Trop Med Parasitol, 97(6):557–564.
Balls, M. J., Bodker, R., Thomas, C. J., Kisinza, W., Msangeni, H. A., and Lindsay, S. W. (2004). Effectof topography on the risk of malaria infection in the usambara mountains, tanzania. Trans R Soc TropMed Hyg, 98:400–408.
Bayoh, M. N. and Lindsay, S. W. (2003). Effect of temperature on the development of the aquatic stagesof anopheles gambiae sensu stricto (diptera: Culicidae). Bull Entomol Res, 93(5):375–381.
Bayoh, M. N. and Lindsay, S. W. (2004). Temperature-related duration of aquatic stages of the afrotrop-ical malaria vector mosquito anopheles gambiae in the laboratory. Med Vet Entomol, 18:174–179.
74

Beck-Johnson, L. M., Nelson, W. A., Paaijmans, K. P., Read, A. F., Thomas, M. B., and Bjornstad, O. N.(2013). The effect of temperature on anopheles mosquito population dynamics and the potential formalaria transmission. PLoS One, 8(11):e79276.
Beier, J. C. (1998). Malaria parasite development in mosquitoes. Annu Rev Entomol, 43:519–543.
Beier, J. C., Killen, G. F., and Githure, J. I. (1999). A short report: Entomologic inoculation rate andplasmodium falciparum malaria prevalence in africa. Am. J. Trop. Med. Hyg, 61(1):109–113.
Beier, J. C., Perkins, P. V., Koros, J. K., Onyango, F. K., Gargan, T. P., Wirtz, R. A., Koech, D. K., andRoberts, C. R. (1990). Malaria sporozoite detection by dissection and elisa to assess infectivity ofafrotropical anopheles (diptera: Culicidae). Journal of Medical Entomology, 27:377–384.
Beier, J. C., Perkins, P. V., Wirtz, R. A., Whitmire, R. E., Mugambi, M., and Hockmeyer, W. T. (1987).Field evaluation of an enzyme-linked immunosorbent assay (elisa) for plasmodium falciparum sporo-zoite detection in anopheline mosquitoes from kenya. Am J Trop Med Hyg, 36:459–468.
Bekessy, A., Molineaux, L., and Storey, J. (1976). Estimation of incidence and recovery rates of plas-modium falciparum parasitaemia from longitudinal data. Bull World Health Organ, 54(6):685–693.
Biau, D. J. (2011). Standard deviation and standard error. Clin Orthop Relat Res, 469:2661–2664.
Bigoga, J. D., Manga, L., Titanji, V. P. K., Coetzee, M., and Leke, R. G. F. (2007). Malaria vectors andtransmission dynamics in coastal south-western cameroon. Malaria Journal, 6(1):1.
Blanford, J. I., Blanford, S., Crane, R. G., Mann, M. E., Paaijmans, K. P., Schreiber, K. V., and Thomas,M. B. (2013). Implications of temperature variation for malaria parasite development across africa.Sci Rep, 3(1300).
Bockarie, M. J., Barnish, G., Maude, G. H., Greenwood, B. M., et al. (1994). Malaria in a ruralarea of sierra leone. iii. vector ecology and disease transmission. Annals of tropical medicine andparasitology, 88(3):251–262.
Bockarie, M. J., Barnish, G., Touré, Y. T., et al. (1995). Vectorial capacity and entomological inoc-ulation rates of anopheles gambiae in a high rainfall forested area of southern sierra leone. Tropi-cal medicine and parasitology: official organ of Deutsche Tropenmedizinische Gesellschaft and ofDeutsche Gesellschaft fur Technische Zusammenarbeit (GTZ), 46(3):164–171.
Bodker, R., Akida, J., Shayo, D., Kisinza, W., Msangeni, H. A., Pedersen, E. M., and Lindsay, S. W.(2003). Relationship between altitude and intensity of malaria transmission in the usambara moun-tains, tanzania. J Med Entomol, 40(5):706–717.
Bomblies, A., Duchemin, J.-B., and Eltahir, E. A. B. (2008). Hydrology of malaria: model developmentand application to a sahelian village. Water Resources Research, 44.
Bomblies, A., Duchemin, J.-B., and Eltahir, E. A. B. (2009). A mechanistic approach for accuratesimulation of village scale malaria transmission. Malaria Journal, 8(223).
Bousema, J. T., Drakeley, C. J., Mens, P. F., Arens, T., Houben, R., Omar, S. A., Gouagna, L. C.,Schallig, H., and Sauerwein, R. W. (2008). Increased plasmodium falciparum gametocyte productionin mixed infections with p. malariae. Am. J. Trop. Med. Hyg, 78(3):442–448.
Bousema, T., Okell, L., Felger, I., and Drakeley, C. (2014). Asymptomatic malaria infections: de-tectability, transmissibility and public health relevance. Nature Reviews Microbiology, 12(12):833–840.
Brandts, C. H., Ndjave, M., Graninger, W., and Kremsner, P. G. (1997). Effect of paracetamol onparasite clearance time in plasmodium falciparum malaria. Lancet, 350(9079):704–709.
Briët, O. J. T., Dossou-Yovo, J., Akodo, E., Van De Giesen, N., and Teuscher, T. M. (2003). Therelationship between anopheles gambiae density and rice cultivation in the savannah zone and forestzone of cote d’ivoire. Tropical Medicine & International Health, 8(5):439–448.
75

Briet, O. J. T., Vounatsou, P., and Amerasinghe, P. H. (2008). Malaria seasonality and rainfall seasonalityin sri lanka are correlated in space. Geospatial Health, 2(2):183–190.
Bruce-Chwatt, L. J. (1985). Essential malariology. Heinemann, London, 2nd edition.
Bruce-Chwatt, L. J., Draper, C. C., and Konfortion, P. (1973). Seroepidemiologic evidence of eradica-tion of malaria from mauritius. Lancet, 2:547–551.
Buckling, A. and Read, A. F. (2001). The effect of partial host immunity on the transmission of malariaparasites. Proc Biol Sci, 268(1483):2325–2330.
Burkot, T. R. and Graves, P. M. (1995). The value of vector-based estimates of malaria transmission.Annals of Tropical Medicine and Parasitology, 89:125–134.
Burkot, T. R., Williams, J. L., and Schneider, I. (1984). Identification of plasmodium falciparum infectedmosquitoes by a double antibody enzyme-linked immunosorbent assay. American Journal of TropicalMedicine and Hygiene, 33:783–788.
Byrne, N. (2007). Urban malaria risk in sub-saharan africa: where is the evidence? Travel Medicineand Infectious Disease, 5(2):135–137.
Cairns, M., Ghani, A., Okell, L., Gosling, R., Carneiro, I., Anto, F., and et al (2011). Modelling theprotective efficacy of alternative delivery schedules for intermittent preventive treatment of malariain infants and children. PLoS ONE, 6(4):e18947.
Cairns, M., Roca-Feltrer, A., Garske, T., Wilson, A. L., Diallo, D., Milligan, P. J., Ghani, A. C., andGreenwood, B. M. (2012). Estimating the potential public health impact of seasonal malaria chemo-prevention in african children. Nature Communications, 3(881).
Caminade, C., Kovats, S., Rocklov, J., Tompkins, A. M., Morse, A. P., Colon-Gonzalez, F. J., Stenlund,H., Martens, P., and Lloyd, S. J. (2014). Impact of climate change on global malaria distribution.PNAS, 111(9):3286–3291.
Carnevale, P., Goff, G., TOTO, J.-C., and Robert, V. (1992). Anopheles nili as the main vector of humanmalaria in villages of southern cameroon. Medical and veterinary entomology, 6(2):135–138.
Carnevale, P., Guillet, P., Robert, V., Fontenille, D., Doannio, J., Coosemans, M., and Mouchet, J.(1999). Diversity of malaria in rice growing areas of the afrotropical region. Parassitologia, 41:273–276.
Charlwood, J. D., Smith, T., Lyimo, E., Kitua, A. Y., Masanja, H., Booth, M., Alonso, P. L., andTanner, M. (1998). Incidence of plasmodium falciparum infection in infants in relation to exposure tosporozoite-infected anophelines. The American journal of tropical medicine and hygiene, 59(2):243–251.
Charlwood, J. D., Thompson, R., and Madsen, H. (2003). Observations on the swarming and matingbehaviour of anopheles funestus from southern mozambique. Malaria Journal, 2(2).
Chitnis, N., Cushing, J. M., and Hyman, J. M. (2006). Bifurcation analysis of a mathematical model formalaria transmission. SIAM J Appl Math, 67(1):24–45.
Chitnis, N., Hyman, J. M., and Cushing, J. M. (2008). Determining important parameters in the spread ofmalaria through the sensitivity analysis of a mathematical model. Bulletin of Mathematical Biology,70:1272–1296.
Choi, K. S., Christian, R., Nardini, L., Wood, O. R., Agubuzo, E., Muleba, M., Munyati, S., Makuwaza,A., Koekemoer, L. L., Brooke, B. D., Hunt, R. H., and Coetzee, M. (2004). Insecticide resistance androle in malaria transmission of anopheles funestus populations from zambia and zimbabwe. Parasitesand Vectors, 7(464).
CIESIN-CIAT (2005). Gridded population of the world, version 3 (gpwv3): Popula-tion density grid. palisades, ny: Nasa socioeconomic data and applications center (sedac).http://dx.doi.org/10.7927/H4XK8CG2. Assessed:20-05-2015.
76

Ciuca, M., Ballif, L., and Chelarescu-Vieru, M. (1934). Immunity in malaria. Transactions of the RoyalSociety of Tropical Medicine and Hygiene, 27(6):619–622.
Clark-Carter, D. (2005). Standard error. In: Everitt BS, Howell D, eds. Encyclopedia of Statistics inBehavioral Science. Vol 4. Hoboken. NJ: John Wiley and Sons, Ltd.
Coene, J. (1993). Malaria in urban and rural kinshasa: the entomological input. Medical and veterinaryentomology, 7(2):127–137.
Coetzee, M., Craig, M., and le Sueur, D. (2000). Distribution of african malaria mosquitoes belongingto the anopheles gambiae complex. Parasitology Today, 16(2):149–151.
Coetzee, M. and Fontenille, D. (2004). Advances in the study of anopheles funestus, a major vector ofmalaria in africa. Insect Biochem Mol Biol, 34:599–605.
Cohen, S., McGregor, I. A., and Carrington, S. (1961). Gamma-globulin and acquired immunity tohuman malaria. Nature, 192:733–737.
Collins, F. H. and Besansky, N. J. (1994). Vector biology and the control of malaria in africa. Science,264(5167):1874–5.
Collins, J. M. (2011). Temperature variability over africa. Journal of Climate, 24:3649–3666.
Collins, W. E. and Jeffery, G. M. (2005). Plasmodium ovale: parasite and disease. Clin Microbiol Rev,18(3):570–581.
Collins, W. E. and Jeffery, G. M. (2007). Plasmodium malariae: parasite and disease. Clin MicrobiolRev, 20(4):579–592.
Coosemans, M., Wéry, M., Mouchet, J., and Carnevale, P. (1992). Transmission factors in malariaepidemiology and control in africa. Memorias do Instituto Oswaldo Cruz, Rio de Janeiro, 87(Suppl.III):385–391.
Coosemans, M. H. (1985b). Comparison de l’endemie malarienne dans une zone de riziculture et dansune zone de cultture de coton dans la plaine de la rusizi, burundi. Annales de la Societe Belge deMedecine Tropicale, 65(2):187–200.
Cox-Singh, J. and B, S. (2008). Knowlesi malaria: newly emergent and of public health importance?Trends in Parasitology, 24(9):406–410.
Craig, M. H., Snow, R. W., and le Seur, D. (1999). A climate-based distribution model of malariatransmission in sub-saharan africa. Parasitology Today, 15(3):105–111.
Crompton, P. D., Moebius, J., Portugal, S., Waisberg, M., Hart, G., Garver, L. S., Miller, L. H., Bar-illas, C., and Pierce, S. K. (2014). Malaria immunity in man and mosquito: insights into unsolvedmysteries of a deadly infectious disease. Annu Rev Immunol, 32:157–187.
Dabire, K., Diabate, A., Pare-Toe, L., Rouamba, J., Ouari, A., Fontenille, D., and Baldet, T. (2008). Yearto year and seasonal variations in vector bionomics and malaria transmission in a humid savannahvillage in west burkina faso. Journal of Vector Ecology, 33(1):70–75.
Day, K. P. and Marsh, K. (1991). Naturally acquired immunity to plasmodium falciparum. ImmunolToday, 12(3):A68–71.
De Silva, P. M. and Marshall, J. M. (2012). Factors contributing to urban malaria transmission in sub-saharan africa: a systematic review. Journal of Tropical Medicine, 2012.
Dee, D. P., Uppala, S. M., Simmons, A. J., Berrisford, P., Poli, P., Kobayashi, S., and et al (2011). Theera-interim reanalysis: configuration and performance of the data assimilation system. QuarterlyJournal of the Royal Meteorological Society, 137(656):553–597.
77

Dery, D. B., Brown, C., Asante, K. P., Adams, M., Dosoo, D., Amenga-Etego, S., Wilson, M., Chan-dramohan, D., Greenwood, B., and Owusu-Agyei, S. (2010). Patterns and seasonality of malariatransmission in the forest-savannah transitional zones of ghana. Malaria journal, 9(314).
Diebner, H. H., Eichner, M., Molineaux, L., Collins, W. E., Jeffery, G. M., and Dietz, K. (2000). Mod-elling the transmission of asexual blood stages of plasmodium falciparum to gametocytes. J TheorBiol, 202(2):113–127.
Dietz, K., Molineaux, L., and Thomas, A. (1974). A malaria model tested in the african savannah. BullWorld Health Organ, 50(3-4):347–357.
Dobson, A. P. and Carper, R. J. (1992). Global warming and potential changes in host-parasite anddisease vector relationships. Pages 201–217 in R. Peters and T. Lovejoy, eds. Global warming andbiodiversity. Yale University Press, New Haven, Conn.
Doolan, D. L., Dobano, C., and Baird, J. K. (2009). Acquired immunity to malaria. Clinical Microbiol-ogy Reviews, 22(1):13–36.
Dossou-Yovo, J., Doannio, J., Diarrassouba, S., and Chauvancy, G. (1998). Impact d’aménagements derizières sur la transmission du paludisme dans la ville de bouaké, côte d’ivoire. Bull Soc Pathol Exot,91(4):327–33.
Dossou-Yovo, J., Doannio, J., Riviere, F., and Chauvancy, G. (1995). Malaria in cote d’ivoire wetsavannah region: the entomological input. Tropical medicine and parasitology: official organ ofDeutsche Tropenmedizinische Gesellschaft and of Deutsche Gesellschaft fur Technische Zusamme-narbeit (GTZ), 46(4):263–269.
Downing, D. J., Gardner, R. H., and Hoffman, E. O. (1985). An examination of response-surfacemethodologies for uncertainty analysis in assessment models. Technometrics, 27(2):151–163.
Drakeley, C., Sutherland, C., Bousema, J. T., Sauerwein, R. W., and Targett, G. A. T. (2006). The epi-demiology of plasmodium falciparum gametocytes: weapons of mass dispersion. Trends Parasitol,22(9):424–430.
Drakeley, C. J., Carneiro, I., Reyburn, H., Malima, R., Lusingu, J. P. A., Cox, J., Theander, T. G., Nkya,W. M. M. M., Lemnge, M. M., and Riley, E. M. (2005). Altitude-dependent and -independent varia-tions in plasmodium falciparum prevalence in northeastern tanzania. Journal of Infectious Diseases,191:1589–1598.
Durnez, L., Bortel, W. V., Denis, L., Roelants, P., Veracx, A., Trung, H. D., Sochantha, T., and Coose-mans, M. (2011). False positive circumsporozoite protein elisa: a challenge for the estimation of theentomological inoculation rate of malaria and for vector incrimination. Malaria Journal, 10(195).
Elissa, N., Migot-Nabias, F., Luty, A., Renaut, A., Toure, F., Vaillant, M., Lawoko, M., Yangari, P.,Mayombo, J., Lekoulou, F., et al. (2003). Relationship between entomological inoculation rate,plasmodium falciparum prevalence rate, and incidence of malaria attack in rural gabon. Acta tropica,85(3):355–361.
Ermert, V., Fink, A. H., Jones, A. E., and Morse, A. P. (2011a). Development of a new version ofthe liverpool malaria model. i. refining the parameter settings and mathematical formulation of basicprocesses based on literature review. Malaria Journal, 10(35).
Ermert, V., Fink, A. H., Jones, A. E., and Morse, A. P. (2011b). Development of a new version of theliverpool malaria model. ii. calibration and validation for west africa. Malaria Journal, 10(62).
Ermert, V., Fink, A. H., Morse, A. P., and Paeth, H. (2012). The impact of regional climate change onmalaria risk due to greenhouse forcing and land-use changes in tropical africa. Environmental HealthPerspectives, 120:77–84.
Ermert, V., Fink, A. H., and Paeth, H. (2013). The potential effects of climate change on malariatransmission in africa using bias-corrected regionalised climate projections and a simple malariaseasonality model. Climatic Change, 120:741–754.
78

Eyles, D. E. and Young, M. D. (1951). he duration of untreated or inadequately treated plasmodiumfalciparum infection in the human host. J Natl Malaria Soc, 10(4):327–336.
Faye, O., Gaye, O., Faye, O., and Diallo, S. (1994). La transmission du paludisme dans des villageséloignés u situés en bordure de la mangrove au sénégal. Bulletin de la Société de pathologie exotique,87(3):157–163.
Faye, O., Gaye, O., Fontenille, D., Sy, N., Konate, L., Hébrard, G., Hervé, J.-P., Trouillet, J., Diallo,S., and Mouchet, J. (1995). Comparaison de la transmission du paludisme dans deux faciès épidémi-ologiques au sénégal: la zone côtière sahélienne et la zone méridionale soudanienne. Dakar Médical,40(2):201–207.
Feachem, R. G. A., Phillips, A. A., Hwang, J., Cotter, C., Wielgosz, B., Greenwood, B. M., Sabot, O.,Rodriguez, M. H., Abeyasinghe, R. R., Ghebreyesus, T. A., and Snow, R. W. (2010). Shrinking themalaria map: progress and prospects. Lancet, 376(9752):1566–1578.
Filipe, J. A. N., Riley, E. M., Drakeley, C. J., Sutherland, C. J., and C, G. A. (2007). Determinationof the processes driving the acquisition of immunity to malaria using a mathematical transmissionmodel. Plos Comput Biol, 3(12):e255.
Fillinger, U., Sombroek, H., Majambere, S., van Loon, E., Takken, W., and Lindsay, S. W. (2009).Identifying the most productive productive sites breeding sites for malaria mosquitoes in the gambia.Malaria Journal, 8(62).
Fils, E. M. B., Ntonga, P. A., Belong, P., and Messi, J. (2010). Contribution of mosquito vectors inmalaria transmission in an urban district of southern cameroon. Journal of Entomology and Nema-tology, 2(2):13–17.
Fondjo, E., Robert, V., Le Goff, G., Toto, J., Carnevale, P., Kalema, M., and Hughlett, S. (1992). Lepaludisme urbain à yaoundé (cameroun). ii: Etude entomologique dans deux quartiers peu urbanisés.commentaire. Bulletin de la Société de pathologie exotique, 85(1):57–63.
Fontaine, R. E., Najjar, A. E., and Prince, J. S. (1961). The 1958 malaria epidemics in ethiopia. Am JTrop Med Hyg, 10(6):795–803.
Fontenille, D., Lochouarn, L., Diagne, N., Sokhna, C., Lemasson, J., Diatta, M., Konate, L., Faye, F.,Rogier, C., and Trape, J. F. (1997). Malaria transmission in urban sub-saharan africa. Am. J. Trop.Med. Hyg., 56:247–253.
Fontenille, D., Lochouarn, L., Diatta, M., Sokhna, C., Dia, I., Diagne, N., Lemasson, J.-J., Ba, K.,Tall, A., Rogier, C., and Trape, J.-F. (1997a). Four years entomological study of the transmission ofseasonal malaria in senegal and the bionomics of anopheles gambiae and a. arabiensis. Am. J. Trop.Med. Hyg., 91(6):647–652.
Fontenille, D., Meunier, J. Y., Nkondjio, C. A., and Tchuinkam, T. (2001). Use of circumsporozoiteprotein enzyme-linked immunosorbent assay compared with microscopic examination of salivaryglands for calculation of malaria infectivity rates in mosquitoes (diptera: Culicidae) from cameroon.Journal of Meidical Entomology, 38:451–454.
Färnert, A., Wyss, K., Dashti, S., and Naucler, P. (2015). Duration of residency in a non-endemic areaand risk of severe malaria in african immigrants. Clin Microbiol Infect, 21(5):494–501.
Gallup, J. L. and Sachs, J. D. (2001). The economic burden of malaria. Am. J. Trop. Med. Hyg, 64:85–96.
Gatton, M. L. and Cheng, Q. (2004). Modeling the development of acquired clinical immunity toplasmodium falciparum malaria. Infect Immun, 72(11):6538–6545.
Gething, P. W., Elyazar, I. R. F., Moyes, C. L., Smith, D. L., Battle, K. E., and et al (2012). A long ne-glected world malaria map: Plasmodium vivax endemicity in 2010. PLoS Negl Trop Dis, 6(9):e1814.
79

Gething, P. W., Patil, A. P., Smith, D. L., Guerra, C. A., Elyazar, I., Johnston, G. L., Tatem, A. J., andHay, S. I. (2011). A new world malaria map: Plasmodium falciparum endemicity in 2010. MalariaJournal, 10(378):1475–2875.
Gianotti, R. L., Bomblies, A., and Eltahir, E. A. B. (2009). Hydrologic modelling to screen poten-tial environmental management methods for malaria vector control in niger. Water Resour Res,45:W08438.
Giha, H. A., El-Ghazali, G., A-Elgadir, T. M. E., A-Elbasit, I. E., Eltahir, E. M., Baraka, O. Z., Khier,M. M., Adam, I., Troye-Blomberg, M., Theander, T. G., and Elbashir, M. I. (2005). Clinical patternof severe plasmodium falciparum malaria in sudan in an area characterized by seasonal and unstablemalaria transmission. Trans R Soc Trop Med Hyg, 99(4):243–251.
Gill, C. A. (1920). The relationship between malaria and rainfall. Indian J Med Res, 37:618–632.
Githeko, A., Mbogo, C., Atieli, F., Juma, F., et al. (1993). Plasmodium falciparum sporozoite andentomological inoculation rates at the ahero rice irrigation scheme and the miwani sugar-belt inwestern kenya. Annals of tropical medicine and parasitology, 87(4):379–391.
Githeko, A. K., Mbogo, C. N. M., Curtis, C. F., Lines, J., and Lengeler, C. (1996). Entomologicalmonitoring of large-scale vector-control interventions. Parasitology Today, 12:127–128.
Githeko, A. K. and Ndegwa, W. (2001). Predicting malaria epidemics in kenyan highlands using climatedata: a tool for decision makers. Glob Change Hum Health, 2:54–63.
Gneme, A., Guelbeogo, W. M., Riehle, M. M., Tiono, A. B., Diarra, A., Kabre, G. B., Sagnon, N., andVernick, K. D. (2013). Plasmodium species occurrence, temporal distribution and interaction in achild-aged population in rural burkina faso. Malar J, 12(67-10):1186/1475–2875–12–67.
Gomes, M., Ribeiro, I., Warsame, M., Karunajeewa, H., and Petzold, M. (2008). Rectal artemisininsfor malaria: a review of efficacy and safety from individual patient data in clinical studies. BMCInfectious Diseases, 8(39):10.1186/1471–2334–8–39.
Gregson, A. and Plowe, C. V. (2005). Mechanisms of resistance of malaria parasites to antifolates.Pharmacol Rev, 57:117–145.
Grover-Kopec, E. K., Blumenthal, M. B., Ceccato, P., Dinku, T., Omumbo, J. A., and Connor, S. J.(2006). Web-based climate information resources for malaria control in africa. Malaria Journal,5(38).
Gueirard, P., Tavares, J., Thiberge, S., Bernex, F., Ishino, T., Milon, G., Franke-Fayard, B., Janse,C. J., Menard, R., and Amino, R. D. (2010). Development of the malaria parasite in the skin of themammalian host. Proc Natl Acad Sci U S A, 107(43):18640–5.
Guerra, C. A., Gikandi, P. W., Tatem, A. J., Noor, A. M., Smith, D. L., Hay, S. L., and Snow, R. W.(2008). The limits and intensity of plasmodium falciparum transmission: implications for malariacontrol and elimination worldwide. Plos Med, 5:e38.
Gupta, H. V., Sorooshian, S., and Yapo, P. O. (1999a). Status of automatic calibration for hydro-logic models: Comparison with multilevel expert calibration. Journal of Hydrology Engineering,4(2):135–143.
Gupta, S., Snow, R. W., Donnelly, C. A., Marsh, K., and Newbold, C. (1999b). Immunity to non-cerebralsevere malaria is acquired after one or two infections. Nat Med, 5(3):340–343.
Guyatt, H. L. and Snow, R. W. (2001). The epidemiology and burden of plasmodium falciparum-relatedanemia among pregnant women in sub-saharan africa. Am. J. Trop. Med. Hyg, 64(1,2):36–44.
Hamby, D. M. (1994). A review of techniques for parameter sensitivity analysis of environmentalmodels. Environmental Monitoring and Assessment, 32:135–154.
Hamby, D. M. (1995). A comparison of sensitivity analysis techniques. Health Phys, 68(2):195–204.
80

Hammerich, A., Campbell, O. M., and Chandramohan, D. (2002). Unstable malaria transmission andmaternal mortality experiences from rwanda. Trop Med Int Health, 7(7):573–576.
Haque, U., Hashizume, M., Glass, G. E., Dewan, A. M., Overgaard, H. J., and Yamamoto, T. (2010).The role of climate variability in the spread of malaria in the bangladeshi highlands. PLoS ONE,5:e14341.
Hawley, W. A., ter Kuile, F. O., Steketee, R. S., and et al (2003). Implications of the western kenyapermethrin-treated bed net study for policy, program implementation, and future research. Am J TropMed Hyg, 68(4):168–73.
Hay, S I Cox, J., Rogers, D. J., Randolph, S. E., Stern, D. I., Shanks, G. D., Myers, M. F., and Snow,R. W. (2002). Climate change and the resurgence of malaria in the east african highlands. Nature,415(6874):905–9.
Hay, S. I., Guerra, C. A., Tatem, A. J., Atkinson, P. M., and Snow, R. W. (2005). Urbanization, malariatransmission and disease burden in africa. Nat Rev Microbiol, 3(1):81–90.
Hay, S. I., Rogers, D. J., Toomer, J. F., and Snow, R. W. (2000). Annual plasmodium falciparumentomological inoculation rates(eir) across africa: literature survey, internet access and review. TransR Soc Trop Med Hyg., 94(2):113–127.
Hay, S. I., Snow, R. W., and Rogers, D. J. (1998a). Predicting malaria seasons in kenya using multitem-poral meteorological satellite sensor data. Trans R Soc Trop Med Hyg, 92(1):12–20.
Hay, S. L., Guerra, C. A., Gething, P. W., Patil, A. P., Tatem, A. J., and Noor, A. M. e. a. (2009). Aworld malaria map: plasmodium falciparum endemicity in 2007. Plos Med, 6(3):e1000048.
Hay, S. L., Okiro, E. A., Gething, P. W., Patil, A. P., Tatem, A. J., Guerra, C. A., and Snow, R. W.(2010). Estimating the global clinical burden of plasmodium falciparum malaria in 2007. Plos Med,7:e1000290.
Homann, M. V. (2008). Human genetic factors involved in immunity to Plasmodium falciparum infec-tion. PhD thesis, Department of Immunology, The Wenner-Gren Institute, Stockholm University,Sweden.
Hoshen, M. B. and Morse, A. P. (2004). A weather-driven model of malaria transmission. MalariaJournal, 3(32).
Ijumba, I. N. (1997). The impact of rice and sugarcane irrigation on malaria transmission in theLower Moshi area in northern Tanzania. PhD thesis, Danish Bilharziasis Laboratory, University ofCopenhagen.
Ijumba, J. N. and Lindsay, S. W. (2001). Impact of irrigation on malaria in africa: paddies paradox.Med Vet Entomol, 15:1–11.
Ijumba, J. N., Shenton, F. C., Clarke, S. E., Mosha, F. W., and Lindsay, S. W. (2002). Irrigated cropproduction is associated with less malaria than traditional agricultural practices in tanzania. Trans RSoc Trop Med Hyg, 96(5):476–80.
Ilboudo-Sanogo, E., Tiono, B. A., Sagnon, N., Cuzin Ouattara, N., Nébié, I., and Sirima, S. (2010).Temporal dynamics of malaria transmission in two rural areas of burkina faso with two ecologicaldifferences. Journal of medical entomology, 47(4):618–624.
Indeje, M., Semazzi, F. H. M., and Ogallo, L. J. (2000). Enso signals in east african rainfall seasons.International Journal of Climatology, 20:19–46.
Jaleta, K. T., Hill, S. R., Seyoum, E., Balkew, M., Gebre-Michael, T., Ignell, R., and Tekie, H. (2013).Agro-ecosystems impact malaria prevalence: large-scale irrigation drives vector population in west-ern ethiopia. Malaria journal, 12(1):1.
81

Jeffery, G. M. and Eyles, D. E. (1954). The duration in the human host of infections with a panamastrain of plasmodium falciparum. Am J Trop Med Hyg, 3(2):219–224.
Jennings, R. M., De Souza, J. B., Todd, J. E., Armstrong, M., Flanagan, K. L., and et al (2006). Importedplasmodium falciparum malaria: are patients originating from disease-endemic areas less likely todevelop severe disease? a prospective, observational study. Am J Trop Med Hyg, 75(6):1195–1199.
JHSPHOPEN-Courseware (2016). Life cycle of the malaria parasite from epidemiology of infectiousdiseases. http://ocw.jhsph.edu. Copyright c© Johns Hopkins Bloomberg School of PublicHealth. Creative Commons BY-NC-SA. Accessed: March 26, 2016.
Josling, G. A. and Llinas, M. (2015). Sexual development in plasmodium parasites: knowing when it’stime to commit. Nature Reviews Microbiology, 13(9):573–587.
Kar, N. P., Kumar, A., Singh, O. P., Carlton, J. M., and Nanda, N. (2014). A a review of malariatransmission dynamics in forest ecosystems. Parasites and Vectors, 7(265).
Karch, S., Garin, B., Asidi, N., Manzambi, Z., Salaun, J. J., and Mouchet, J. (1993). Moustiquairesimprégnées contre le paludisme au zaïre. In Annales de la Société belge de Médecine tropicale,volume 73, pages 37–53.
Karp, C. L. and Auwaerter, P. G. (2007). Coinfection with hiv and tropical infectious diseases. i. proto-zoal pathogens. Clin Infect Dis, 45(9):1208–13.
Kasasa, S., Asoala, V., Gosoniu, L., Anto, F., Adjuik, M., Tindana, C., Smith, T., Owusu-Agyei, S.,and Vounatsou, P. (2013). Spatio-temporal malaria transmission patterns in navrongo demographicsurveillance site, northern ghana. Malaria Journal, 12(63).
Keiser, J., Caldas De Castro, M., Maltese, M. F., Bos, R., Tanner, M., Singer, B. H., and Utzinger, J.(2005). Effect of irrigation and large dams on the burden of malaria on a global and regional scale.Am. J. Trop. Med. Hyg., 72(4):392–406.
Keiser, J., Utzinger, J., Caldas De Castro, M., Smith, T. A., Tanner, M., and Singer, B. H. (2004).Urbanization in sub-saharan africa and implication for malaria control. American Journal of TropicalMedicine and Hygiene, 71(2):118–127.
Kelly-Hope, L. A. and McKenzie, F. E. (2009). The multiplicity of malaria transmission: a reviewof entomological inoculation rate measurements and methods across sub-saharan africa. MalariaJournal, 8(19).
Kerah-Hinzoumbé, C., Péka, M., Antonio-Nkondjio, C., Donan-Gouni, I., Awono-Ambene, P., Samè-Ekobo, A., and Simard, F. (2009). Malaria vectors and transmission dynamics in goulmoun, a ruralcity in south-western chad. BMC infectious diseases, 9(1):1.
Kibret, S., Wilson, G. G., Tekie, H., and Petros, B. (2014). Increased malaria transmission aroundirrigation schemes in ethiopia and the potential of canal water management for malaria vector control.Malaria Journal, 12(360).
Kilama, M., Smith, D. L., Hutchinson, R., Kigozi, R., Yeka, A., Lavoy, G., Kamya, M. R., Staedke,S. G., Donnelly, M. J., Drakeley, C., Greenhouse, B., Dorsey, G., and Lindsay, S. W. (2014). Estimat-ing the annual entomological inoculation rate for plasmodium falciparum transmitted by anophelesgambiae s.l. using three sampling methods in three sites in uganda. Malaria Journal, 13(111).
Killeen, G. F., Fillinger, U., Kiche, I., Gouagna, L. C., and Knols, B. G. (2002). Eradication of anophelesgambiae from brazil: lessons for malaria control in africa? Lancet Infect Dis, 2:618–627.
Kirby, M. J. and Lindsay, S. W. (2009). Effect of temperature and inter-specific competition on thedevelopment and survival of anopheles gambiae sensu stricto and anopheles arabiensi larvae. ActaTrop, 109(2):118–123.
Kiszewski, A., Mellinger, A., Spielman, A., Malaney, P., Sachs, S. E., and Sachs, J. (2004). A globalindex representing the stability of malaria transmission. Am J Trop Med Hyg, 70(5):486–498.
82

Kleinschmidt, I., Sharp, B. L., Clarke, G. P., Curtis, B., and Fraser, C. (2001). Use of generalized linearmixed models in the spatial analysis of small-area malaria incidence rates in kwazulu natal, southafrica. Am J Epidemiol, 153(12):1213–21.
Koella, J. C. (1991). On the use of mathematical models of malaria transmission. Acta Trop, 49(1):1–25.
Kurtis, J. D., Mtalib, R., Onyango, F. K., and Duffy, P. E. (2001). Human resistance to plasmodiumfalciparum increases during puberty and is predicted by dehydroepiandrosterone sulfate levels. InfectImmun, 69(1):123–128.
Laishram, D. D., Sutton, P. L., Nanda, N., Sharma, V. L., Sobti, R. C., Carlton, J. M., and Joshi, H.(2012). The complexities of malaria disease manifestations with a focus on asymptomatic malaria.Malaria Journal, 11(29).
Laneri, K., Bhadra, A., Ionides, E. L., Bouma, M., Dhiman, R. C., Yadav, R. S., and et al. (2010).Forcing versus feedback: Epidemic malaria and monsoon rains in northwest india. PLoS ComputBiol, 6(9):e1000898.
Langhorne, J., Ndungu, F. M., Sponaas, A. M., and Marsh, K. (2008). Immunity to malaria: morequestions than answers. Nat Immunol, 9(7):725–732.
Lautze, J., McCartney, M., Kirshen, P., Olana, D., Jayasinghe, G., and Spielman, A. (2007). Effect ofa large dam on malaria risk: The koka reservoir in ethiopia. Tropical Medicine and InternationalHealth, 12(8):982–989.
Le Goff, G., Carnevale, P., Fondjo, E., and Robert, V. (1997). Comparison of three sampling methods ofman-biting anophelines in order to estimate the malaria transmission in a village of south cameroon.Parasite, 4:75–80.
le Sueur, D. and Sharp, B. L. (1991). Temperature-dependent variation in anopheles merus larval headcapsule width and adult wing length: implications for anopheline taxonomy. Med Vet Entomo, 5:55–62.
Legates, D. R. and McCabe Jr, G. J. (1999). Evaluating the use of “goodness-offit” measures in hydro-logic and hydroclimatic model validation. Water Resources Research, 35(1):233–241.
Lemasson, J.-J., Fontenille, D., Lochouarn, L., Dia, I., Simard, F., Ba, K., Diop, A., Diatta, M., andMolez, J.-F. (1997). Comparison of behavior and vector efficiency of anopheles gambiae and an. ara-biensis (diptera: Culicidae) in barkedji, a sahelian area of senegal. Journal of Medical Entomology,34(4):396–403.
Lepers, J. P., Fontenille, D., Rason, M. D., Chougnet, C., Astagneau, P., Coulanges, P., and Deloron,P. (1991). Transmission and epidemiology of newly transmitted falciparum malaria in the centralhighland plateaux of madagascar. Annals of tropical medicine and parasitology, 85(3):297–304.
Levine, R. S., Peterson, A. T., and Benedict, M. Q. (2004). Geographic and ecologic distributions of theanopheles gambiae complex predicted using a genetic algorithm. Am J Trop Med Hyg, 70(2):105–109.
Lindblade, K. A., Walker, E. D., Onapa, A. W., Katungu, J., and Wilson, M. L. (1999). Highland malariain uganda: prospective analysis of an epidemic associated with el nino. Trans R Soc Trop Med Hyg,93(5):480–487.
Lindsay, S. W. and Birley, M. H. (1996). Climate change and malaria transmission. Ann. Trop MedParasit, 90(6):573–88.
Lindsay, S. W. and Martens, W. J. M. (1998). Malaria in the africa highlands: past present and future.Bull World Health Organ, 76(1):33–45.
Lindsay, S. W., Parson, L., and Thomas, C. J. (1998). Mapping the ranges and relative abundance ofthe two principal africa malaria vectors, anopheles gambiae sensu stricto and an. arabiensis, usingclimate data. Proc. R. Soc. Lond. B, 265:847–854.
83

Lyimo, E. O. K. (1993). Bionomics of the malaria mosquito Anopheles gambiae sensu lato in southeastTanzania.
Mabaso, M., Craig, M., Vounatsou, P., and Smith, T. (2005). Towards empirical description of malariaseasonality in southern africa: the example of zimbabwe. Trop Med Int Health, 10:909–918.
Mabaso, M. L. H., Craig, M., Ross, A., and Smith, T. (2007). Environmental predictors of the season-ality of malaria transmission in africa: the challenge. Am. J. Trop. Med. Hyg., pages 33–38.
Macdonald, G. (1950). The analysis of malaria parasite rates in infants. Trop Dis Bull, 47(10):915–938.
Macdonald, G. (1957). The Epidemiology and Control of Malaria. Oxford University Press, London.
Mandal, S., Sarkar, R. R., and Sinha, S. (2011). Mathematical models of malaria - a review. MalariaJournal, 10(202).
Manga, L., Toto, J., and Carnevale, P. (1995). Malaria vectors and transmission in an area deforested fora new international airport in southern cameroon. In ANNALES-SOCIETE BELGE DE MEDECINETROPICALE, volume 75, pages 43–43. INSTITUTE OF TROPICAL MEDICINE.
MARA (1998). Towards an atlas of malaria risk in africa. towards an atlas of malaria transmission inafrica: First technical report of the mara/arma. Technical Report 30, South African Medical ResearchCouncil, IDRC, Canada and Wellcome Trust, UK.
Markham, C. G. (1970). Seasonality of precipitation in the united states. Ann. Ass. Am. Geogr., 60:593–597.
Martens, W. J. M., Niessen, L. W., Rotmans, J., Jetten, T. H., and Mcmichael, A. J. (1995). Potentialimpact of global climate-change on malaria risk. Environ Health Persp., 103(5):458–464.
Massebo, F. and Lindtjørn, B. (2013). The effect of screening doors and windows on indoor density ofanopheles arabiensis in south-west ethiopia: a randomized trial. Malaria journal, 12(1):1.
Maxwell, C. A., Chambo, W., Mwaimu, M., Magogo, F., Carneiro, I. A., and Curtis, C. F. (2003).Variation of malaria transmission and morbidity with altitude in tanzania and with introduction ofalphacypermethrin treated nets. Malaria Journal, 2(28).
Mboera, L. E. G. (2005). Sampling techniques for adult afrotropical malaria vectors and their reliabilityin the estimation of entomological inoculation rate. Tanzania Health Research Bulletin, 7:117–124.
Mbogo, C. M., Snow, R. W., Khamala, C. P., Kabiru, E. W., Ouma, J. H., Githure, J. I., Marsh, K., andBeier, J. C. (1995). Relationships between plasmodium falciparum transmission by vector popula-tions and the incidence of severe disease at nine sites on the kenyan coast. Am. J. Trop. Med. Hyg.,52:201–206.
Mbogo, C. N., Snow, R. W., Kabiru, E. W., Ouma, J. H., Githure, J. I., Marsh, K., and Beier, J. C. (1993).Low-level plasmodium falciparum transmission and the incidence of severe malaria infection on thekenyan coast. Am J Trop Med Hyg, 49:245–253.
McKenzie, F. E., Jeffery, G. M., and Collins, W. E. (2002). Plasmodium malariae infection boostsplasmodium falciparum gametocyte production. Am. J. Trop. Med. Hyg, 67(4):411–414.
McQueen, P. G. and McKenzie, F. E. (2004). Age-structured red blood cell susceptibility and thedynamics of malaria infections. Proc. Natl. Acad. Sci, 101(24):9161–9166.
Mendis, K., Sina, B. J., Machesini, P., and Carter, R. (2001). The neglected burden of plasmodium vivaxmalaria. Am. J. Trop. Med. Hyg, 64S:97–106.
Meunier, J. Y., Safeukui, I., Fontenille, D., and Boudin, C. (1999). [malaria transmission in an areaof future vaccination in equatorial forest of south cameroon]. Bulletin de la Societe de pathologieexotique (1990), 92(5):309–312.
84
Miller, L. H., Baruch, D. I., Marsh, K., and Doumbo, O. K. (2002). The pathogenic basis of malaria.Nature, 415:673–9.
Modiano, D., Sirima, B. S., Sawadogo, A., Sanou, I., Paré, J., Konaté, A., and Pagnoni, F. (1999).Severe malaria in burkina faso: urban and rural environment. Parasitologia, 41(1-3):251–254.
Molineaux, L. (1988). The epidemiology of human malaria as an explanation of its distribution, includ-ing some implications for its control, volume 2. Churchill Livingstone, Edinburgh.
Molineaux, L. and Gramiccia, G. (1990). The garki project : research on the epidemiology and controlof malaria in the sudan savanna of west africa. Technical report, World Health Organization, Geneva.
Molineaux, L., Muir, D. A., Spencer, H. C., and Wernsdorfer, W. H. (1988). The epidemiology ofmalaria and its measurement. In Malaria: principles and practice of malariology (Wernsdorfer, W.H.and McGregor, I., eds), volume 2. Churchill Livingstone, Edinburgh.
Moriasi, D. N., Arnold, J. G., Van Liew, M. W., Bingner, R. L., Harmel, R. D., and Veith, T. L.(2007). Model evaluation guidelines for systematic quantification of accuracy in watershed simu-lations. Trans. ASAE, 50(3):885–900.
Mota, M. M., Pradel, G., Vanderberg, J. P., Hafalla, J. C., Frevert, U., Nussenzweig, R. S., Nussenzweig,V., and Rodriguez, A. (2001). Migration of plasmodium sporozoites through cells before infection.Science, 291(5501):141–144.
Mota, R. E., Lara, A. M., Kunkwenzu, E. D., and Lalloo, D. G. (2009). Health seeking behavior afterfever onset in a malaria-endemic area of malawi. Am J Trop Med Hyg, 81(6):935–943.
Mourou, J. R., Coffinet, T., Jarjaval, F., Cotteaux, C., Pradines, E., Godefroy, L., Kombila, M., andPages, F. (2012). Malaria transmission in libreville: results of a one year survey. Malaria Journal,11(40).
Murray, C. J., Rosenfeld, L. C., Lim, S. S., Andrews, K. G., Foreman, K. J., Haring, D., Fullman, N.,Naghavi, M., Lozano, R., and Lopez, A. D. (2012). Global malaria mortality between 1980 and2010: a systematic analysis. Lancet, 379:413–31.
Muturi, E., Shililu, J., Jacob, B., Gu, W., Githure, J., and Novak, R. (2006). Mosquito species diversityand abundance in relation to land use in riceland agroecosystem in mwea, kenya. J Vector Biol,31:129–137.
Muturi, E. J., Muriu, S., Shililu, J., Mwangangi, J., Jacob, B. G., Mbogo, C., Githure, J., and Novak,R. J. (2008). Effect of rice cultivation on malaria transmission in central kenya. The American journalof tropical medicine and hygiene, 78(2):270–275.
Ngwa, G. A. and Shu, W. S. (2000). A mathematical model for endemic malaria with variable humanand mosquito populations. Math Comput Model, 32(7-8):747–763.
Nicholson, S. E. (2000). The nature of rainfall variability over africa on time scales of decades tomillenia. Global and Planetary Change, page 137–158.
Nicholson, S. E. (2013). The west african sahel: a review of recent studies on the rainfall regime and itsinterannual variability. ISRN Meteorol, 2013:1–32.
Njan Nloga, A., Robert, V., Toto, J., and Carnevale, P. (1993). Anopheles moucheti, vecteur principaldu paludisme au sud-cameroun. Bulletin de Liaison et de Documentation-OCEAC, 26(2):63–67.
Nkuo-Akenji, T., Ntonifor, N. N., Ndukum, M. B., Kimbi, H. K., Abongwa, E. L., Nkwescheu, A.,Anong, D. N., Songmbe, M., Boyo, M. G., Ndamukong, K. N., and Titanji, V. P. K. (2006). En-vironmental factors affecting malaria parasite prevalence in rural bolifamba, south-west cameroon.African Journal of Health Sciences, 13:40–46.
Novella, N. S. and Thiaw, W. M. (2013). African rainfall climatology version 2 for famine early warningsystems. Journal of Aplied Meteorology and Climatology, 52:588–606.
85

Okell, L. C., Drakeley, C. J., Bousema, T., Whitty, C. J., and Ghani, A. C. (2008). Modelling the impactof artemisinin combination therapy and long-acting treatments on malaria transmission intensity.PLoS Med, 5(11):e226.
Okello, P. E., Van Bortel, W., Byaruhanga, A. M., Correwyn, A., Roelants, P., Talisuna, A.,D’Alessandro, U., and Coosemans, M. (2006). Variation in malaria transmission intensity in sevensites throughout uganda. Am J Trop Med Hyg, 75(2):219–225.
Omotosho, J. B. and Abiodun, B. J. (2007). A numerical study of moisture build-up and rainfall overwest africa. Meteorol Appl, 14:209–225.
O’Neill, R. V., Gardner, R. H., and Mankin, J. B. (1980). Analysis of parameter error in a nonlinearmodel. Ecological Modelling, 8:297–311.
Onori, E. and Grab, B. (1980). Indicators for the forecasting of malaria epidemics. Bulletin of the WorldHealth Organisation, 58(1):91–98.
Paaijmans, K. P., Blanford, S., Bell, A. S., Blanford, J. I., Read, A. F., and Thomas, M. B. (2010).Influence of climate on malaria transmission depends on daily temperature variation. Proc Natl AcadSci USA, 107(33):15135–15139.
Paaijmans, K. P., Read, A. F., and Thomas, M. B. (2009). Understanding the link between malaria riskand climate. Proc Natl Acad Sci USA, 106(33):13844–13849.
Paaijmans, K. P., Wandago, M. O., Githeko, A. K., and Takken, W. (2007). Unexpected high loses ofanopheles gambiae lavae due to rainfall. PLoS One, 2(11):e1146.
Parham, P. E. and Michael, E. (2010). Modeling the effects of weather and climate change on malariatransmission. Environmental Health Perspectives, 118(5):620–626.
Patz, J. A., Githeko, A. K., McCarty, J. P., Hussein, S., Confalonieri, U., and de Wet, N. (2003). Cli-mate change and infectious diseases. In: McMichael AJ, Campbell-Lendrum DH, Corvalan CF, EbiKL, Githeko AK, editors. Climate change and human health: risks and responses. World HealthOrganization, Geneva.
Poisot, T. (2011). The digitize package: extracting numerical data from scatterplots. The R Journal,3(1).
Ponnudurai, T., Lensen, A. H. W., Van Gemert, G. J., Bolmer, M. G., and Meuwissen, J. H. (1991).Feeding behaviour and sporozoite ejection by infected anopheles stephensi. Trans. R. Soc. Trop.Med. Hyg, 85(2):175–180.
Pukrittayakamee, S., Imwong, M., Singhasivanon, P., Stepniewska, K., Day, N. J., and White, N. J.(2008). Effects of different antimalarial drugs on gametocyte carriage in p. vivax malaria. Am J TropMed Hyg, 79(3):378–384.
Reiner Jr, R. C., Geary, M., Atkinson, P. M., Smith, D. L., and Gething, P. W. (2015). Seasonality ofplasmodium falciparum transmission: a systematic review. Malaria Journal, 14(343).
Reiter, P. (2001). Climate change and mosquito borne diseases. Environmental Health Perspectives,pages 223–234.
Robert, V., Dieng, H., Lochouarn, L., Traore, S., Trape, J.-F., Simondon, F., and Fontenille, D. (1998).La transmission du paludisme dans la zone de niakhar, sénégal. Tropical Medicine & InternationalHealth, 3(8):667–677.
Robert, V., Gazin, P., Boudin, C., Molez, J. F., Oudreaogo, V., and Carnevale, P. (1985). La transmissiondu paludisme en zone de savane arboree et en zone rizicole des environs de bobo dioulasso (burkinafaso). Annales de la Societe Belge de Medecine Tropicale, 65(2):201–214.
Robert, V., Macintyre, K., Keating, J., Trape, J. F., Duchemin, J. B., Warren, M., and C, B. J. (2003).Malaria transmission in urban sub-saharan africa. Am J. Trop. Med. Hyg., 68(2):169–176.
86

Robert, V., Ouari, B., Ouedraogo, V., and Carnevale, P. (1988). Etude écologique des culicidae adulteset larvaires dans une rivière en vallée du kou, burkina faso. Acta tropica, 45(4):351–359.
Roca-Feltrer, A., Schellenberg, J. R. M. A., Smith, L., and Carneiro, I. (2009). A simple method fordefining malaria seasonality. Malaria Journal, 8(276).
Rosenberg, R., Wirtz, R. A., Schneider, I., and Burge, R. (1990). An estimation of the number of malariasporozoites ejected by a feeding mosquito. Trans R Soc Trop Med Hyg, 84(2):209–212.
Ross, R. (1897). On some peculiar pigmented cells found in two mosquitos fed on malarial blood.British Medical Journal, 2:1786–1788.
Ross, R. (1915). Some priori pathometric equations. Br Med J, 1:447–546.
Rossi, P., Belli, A., Mancini, L., and Sabatinelli, G. (1986). [a longitudinal entomologic survey on thetransmission of malaria in ouagadougou (burkina faso)]. Parassitologia, 28(1):1–15.
Rueda, L. M., Patel, K. J., Axtell, R. C., and Stinner, R. E. (1990). Temperature-dependent develop-ment and survival rates of culex quinquefasciatus and aedes aegypti(diptera: Culicidae). Journal ofMedical Entomology, 27:892–898.
Sagara, I., Sangaré, D., Dolo, G., Guindo, A., Sissoko, M., Sogoba, M., Niambélé, M. B., Yalcoué, D.,Kaslow, D. C., Dicko, A., et al. (2002). A high malaria reinfection rate in children and young adultsliving under a low entomological inoculation rate in a periurban area of bamako, mali. The Americanjournal of tropical medicine and hygiene, 66(3):310–313.
Sharma, S. N., Shukla, R. P., Raghavendra, K., and Subbarao, S. K. (2005). Impact of ddt spraying onmalaria transmission in bareilly district, uttar pradesh, india. J Vector Borne Dis, 42(2):54–60.
Shaukat, A. M., Bremen, J. G., and McKenzie, F. E. (2010). Using the entomological inoculation rateto assess the impact of vector control on malaria parasite transmission and elimination. MalariaJournal, 9(112).
Shiff, C. J., Minjas, J. N., Hall, T., Hunt, R. H., Lyimo, S., and Davis, J. R. (1995). Malaria infectionpotential of anopheline mosquitoes sampled by light trapping indoors in coastal tanzanian villages.Medical and veterinary entomology, 9(3):256–262.
Shililu, J., Ghebremeskel, T., Mengistu, S., Fekadu, H., Zerom, M., Mbogo, C., Githure, J., Novak,R., Brantly, E., and Beier, J. C. (2003). High seasonal variation in entomologic inoculation rates ineritrea, a semi-arid region of unstable malaria in africa. Am. J. Trop. Med. Hyg., 69(6):607–613.
Shililu, J., Ghebremeskel, T., Seulu, F., Mengistu, S., Fekadu, H., Zerom, M., Asmelash, G., Sintasath,D., Mbogo, C., Githure, J., et al. (2004). Seasonal abundance, vector behavior, and malaria parasitetransmission in eritrea. Journal of the American Mosquito Control Association, 20(2):155–164.
Shililu, J., Maier, W., Seitz, H., and Orago, A. (1998). Seasonal density, sporozoite rates and entomo-logical inoculation rates of anopheles gambiae and anopheles funestus in a high altitude sugarcanegrowing zone in western kenya. Tropical Medicine and International Health, 3(9):706–710.
Singh, B. and Daneshvar, C. (2013). Human infections and detection of plasmodium knowlesi. ClinicalMicrobiology Reviews, 26(2):165–184.
Singh, J., Knapp, H. V., and Demissie, M. (2004). Hydrologic modeling of the iroquois river watershedusing hspf and swat. Technical Report ISWS CR 2004-08, Department of Natural Resources and theIllinois State Geological Survey, Illinois State Water Survey.
Sinka, M. E., Bangs, M. J., Manguin, S., Coetzee, M., Mbogo, C. M., Hemingway, J., Patil, A. P.,Temperley, W. H., Gething, P. W., Kabaria, C. W., Okara, R. M., Van Boeckel, T., Godfray, H. C. J.,Harbach, R. E., and Hay, S. I. (2010). The dominant anopheles vectors of human malaria in africa,europe and middle east: Occurrence data, distribution maps and bionomic precis. Parasites andVectors, 3(117).
87

Sinka, M. E., Bangs, M. J., Manguin, S., Rubio-Palis, Y., Chareonviriyaphap, T., Coetzee, M., Mbogo,C. M., Hemingway, J., Patil, A. P., Temperley, W. H., Gething, P. W., Kabaria, C. W., Burkot, T. R.,Harbach, R. E., and Hay, S. I. (2012). A global map of dominant malaria vectors. Parasites andVectors, 4(5:69).
Smith, T., Charlwood, J. D., Kihonda, J., Mwankusye, S., Billingsley, P., Meuwissen, J., Lyimo, E.,Takken, W., Teuscher, T., and Tanner, M. (1993). Absence of seasonal variation in malaria para-sitaemia in an area of intense seasonal transmission. Acta tropica, 54(1):55–72.
Snow, F. (1983). Mosquito production and species succession from an area of irrigated rice felds in thegambia, west africa. Journal of Tropical Medicine and Hygiene, 86:237–245.
Struik, S. S. and Riley, E. M. (2004). Does malaria suffer from lack of memory? Immunol Rev,201:268–290.
Takken, W. and Lindsay, S. W. (2003). Ecological aspect for application of genetically modifiedmosquitoes. Kluwer academic publishers, Netherlands.
Tanga, M. C. and Ngundu, W. I. (2010). Ecological transition from natural forest to tea plantations:effect on the dynamics of malaria vectors in the highlands of cameroon. Transactions of the RoyalSociety of Tropical Medicine and Hygiene, 104(10):659–668.
Tanga, M. C., Ngundu, W. I., and Tchouassi, P. D. (2011). Daily survival and human blood indexof major malaria vectors associated with oil palm cultivation in cameroon and their role in malariatransmission. Tropical Medicine & International Health, 16(4):447–457.
Tangpukdee, N., Krudsood, S., Srivilairit, S., Phophak, N., Chonsawat, P., Yanpanich, W., Kano, S., andWilairatana, P. (2008). Gametocyte clearance in uncomplicated and severe plasmodium falciparummalaria after artesunate-mefloquine treatment in thailand. Korean J Parasitol, 46(2):65–70.
Tanser, C. F., Brian, S., and le Sueur, D. (2003). Potential effect of climate change on malaria transmis-sion in africa. Lancet Infect Dis, 362:1792–1798.
Tassanakajon, A., Boonsaeng, V., Wilairat, P., and Panyim, S. (1993). Polymerase chain reaction detec-tion of plasmodium falciparum in mosquitoes. Trans R Soc Trop Med Hyg, 87:273–275.
Taylor, K. A., Koros, J. K., Nduati, J., Copeland, R. S., Collins, F. H., and Brandling-Bennett, A. D.(1990). Plasmodium falciparum infection rates in anopheles gambiae, an. arabiensis, and an. funestusin western kenya. The American journal of tropical medicine and hygiene, 43(2):124–129.
Teklehaimanot, H. D., Lipsitch, M., Teklehaimanot, A., and Schwartz, J. (2004). Weather-based pre-diction of plasmodium falciparum malaria in epidemic-prone regions of ethiopia i. patterns of laggedweather effects reflects biological mechanisms. Malaria Journal, 3(41).
Thompson, M. C., Mason, S. J., Phindela, T., and Connor, S. J. (2005). Use of rainfall and sea surfacetemperature monitoring for malaria early warning in bostwana. Am J Trop Med Hyg, 73(1):214–221.
Thomson, M. C., Connor, S. J., D’Alessandro, U., Rowlingson, B., Diggle, P., Cresswell, M., andGreenwood, B. (1999). Predicting malaria infection in gambian children from satellite data and bednet use surveys: the importance of spatial correlation in the interpretation of results. Am J Trop MedHyg, 61(1):2–8.
Tompkins, A. M. and Di Giuseppe, F. (2015). Potential predictability of malaria in africa using ecmwfmonthly and seasonal climate forecast. Journal of applied meteorology and climatology, 54:521–540.
Tompkins, A. M. and Ermert, V. (2013). A regional-scale, high resolution dynamical malaria model thataccounts for population density, climate and surface hydrology. Malaria Journal, 12(65).
Torres-Sorando, L. and Rodriguez, D. J. (1997). Models of spatio-temporal dynamics in malaria. EcolModel, 104:231–240.
88

Trampuz, A., Jereb, M., Muzlovic, I., and Prabhu, R. M. (2003). Clinical review: Severe malara. CriticalCare, 7(4):315–323.
Tshikuka, J. G., Scott, M. E., Gray-Donald, K., and Kalumba, O. N. (1996). Multiple infection withplasmodium and helminths in communities of low and relatively high socio–economic status. Annalsof Tropical Medicine and Parasitology, 90:277–293.
Tusting, L. S., Bousema, T., Smith, D. L., and Drakeley, C. (2014). Measuring changes in plasmodiumfalciparum transmission: precission, accuracy and cost of metrics. Advance Parasitol, 84:151–208.
Vercruysse, J., Jancloes, M., and van de Velden, L. (1983). Epidemiology of seasonal falciparum malariain an urban area in senegal. Bull World Health Org, 61:821–831.
Vittor, A. Y., Gilman, R. H., Tielsch, J., Glass, G., Shields, T., Lozano, W. S., Pinedo-Cancino, V., andPatz, J. A. (2006). The effect of deforestation on the human-biting rate of anopheles darlingi, theprimary vector of falciparium malaria in the peruvian amazon. Am. J. Trop. Med. Hyg, 74(1):3–11.
Walsh, R. P. D. and Lawler, D. M. (1981). Rainfall seasonality spatial patterns and change through time.Weather, 36:201–208.
Wang, S. J., Lengeler, C., Smith, T. A., Vounatsou, P., Akogbeto, M., and Tanner, M. (2006). Rapidurban malaria appraisal (ruma) iv: epidemiology of urban malaria in cotonou (benin). MalariaJournal, 5(45).
Wang, S. J., Lengeler, C., Smith, T. A., Vounatsou, P., Diadie, D. A., Pritroipa, X., Convelbo, N.,Kientga, M., and Tanner, M. (2005). Rapid urban malaria appraisal (ruma) i: epidemiology of urbanmalaria in ouagadougou. Malaria Journal, 4(43).
Warrell, D. A. (2002). Clinical features of malaria. Essential Malariology. Edited by: Warrell, D A,Gilles, H M. Oxford University Press, New York.
White, G. B. (1974). Anopheles gambiae complex and disease transmission in africa. Transactions ofthe Royal Society of Tropical Medicine and Hygiene., 68:278–302.
White, N. J. (2008). Plasmodium knowlesi:the fifth human malaria parasite. Clinical Infectious Dis-eases, 46:172–173.
White, N. J. (2011). The parasite clearance curve. Malaria Jour, 10(278).
White, N. J., Krishna, S., Waller, D., Craddock, C., Kwiatkowski, D., and Brewster, D. (1989). Opencomparison of intramuscular chloroquine and quinine in children with severe chloroquine-sensitivefalciparum malaria. Lancet, 2(8675):1313–1316.
WHO (1975). Manual on Practical Entomology. Part II. Methods and Techniques. World Health Orga-nization, Geneva.
WHO (2000). Severe falciparum malaria. Transactions of the Royal Society of Tropical Medicine andHygiene., 94(S1).
WHO (2014). World malaria report. Transactions of the Royal Society of Tropical Medicine and Hy-giene.
WHO (2015). World malaria report. Technical report, World Health Organization.
Wilks, D. S. (1995). Statistical Methods in Atmospheric Sciences. Academic Press, San Diego.
Willmott, C. J., Ackleson, S. G., Davis, R. E., Feddema, J. J., Klink, K. M., Legates, D. R., O’Donnel,J., and Rowe, C. M. (1985). Statistics for the evaluation and comparison of models. Journal ofGeophysical Research, 90(c5):8995–9005.
Wort, U. U., Hastings, I., Mutabingwa, T. K., and Brabin, B. J. (2006). The impact of endemic andepidemic malaria on the risk of stillbirth in two areas of tanzania with different malaria transmissionpatterns. Malaria Journal, 5(89).
89

Yamana, T. K., Bomblies, A., Laminou, I. M., Duchemin, J. B., and Eltahir, E. A. (2013). Linking envi-ronmental variability to village-scale malaria transmission using a simple immunity model. ParasitesVectors, 6(226).
Yang, H. M. (2000). Malaria transmission model for different levels of acquired immunity andtemperature-dependent parameters (vector). Revista de Saúde Pública, 34(3):223–231.
Yang, H. M., Coutinho, F. A. B., and Massad, E. (1997). Acquired immunity on a schistosomiasistransmission model-fitting the data. J Theor Biol, 188(4):495–506.
Yeshiwondim, A. K., Gopal, S., Hailemariam, A. T., Dengela, D. O., and Patel, H. P. (2009). Spatialanalysis of malaria incidence at the village level in areas with unstable transmission in ethiopia. IntJ Health Geogr, 8(5).
Yorke, W. and Macfie, J. W. S. (1924). Observations on malaria made during treatment of generalparalysis. Trans R Soc Trop Med Hyg, 18:13–44.
Yé, Y., Louis, V. R., Simboro, S., and Sauerborn, R. (2007). Effect of meteorological factors on clin-ical malaria risk among children: an assessment using village-based meteorological stations andcommunity-based parasitological survey. BMC Public Health, 7(101).
Zharov, A. A. (1992). Observations on malaria vectors in mozambique. i. the status of anopheles pop-ulations before the start of mosquito control. Meditsinskaia parazitologiia i parazitarnye bolezni,(3):23.
Zhou, G., Munga, S., Minakawa, N., Githeko, A. K., and Yan, G. (2007). Spatial relationship betweenadult malaria vector abundance and environmental factors in western kenya highlands. Am J TropMed Hyg, 77:29–35.
90

Acknowledgment
This work would not have been possible without the kind support and help of manyindividuals and organizations. I would like to extend my sincere thanks to all of them.
First and foremost, I would like to express my sincere gratitude to Prof. Dr A. H. Finkunder whose supervision I studied and undertook this thesis. His patience, motivation,profound knowledge and continued interest in the work is unmeasurable. My heartfeltgratitude also goes to him for providing me funds to complete my thesis after thefunding contract from Catholic Academic Exchange Service (KAAD) ended. All in all,he availed himself like a father and ensured my study was successful. I am profoundlyindebted to him.
Besides my advisor, I would also like to acknowledge with much appreciation the cru-cial role of the rest of my supervisory committee members: Dr Volker Ermert and DrAdrian Tompkins. I could not imagine having a better supervisory board without them.They were ready and availed themselves anytime their services were needed. An ex-ample is our Skype conference calls. Your insightful comments and encouragement,but also your hard questions incented me to widen my research from various perspec-tives. My sincere thanks to Dr Adrian Tompkins, who agreed and hosted me at ICTPat the request of my supervisor during my research visit in May 2015. I am deeplygrateful to Prof. Dr Susanne Crewell for standing in for Prof. Dr Andreas A. H. Finkas my supervisor and first reviewer of the work. Sincere gratitude to Prof. Dr BülentTezkan for playing the role as the chairman of the review committee. I am honouredyou all were part of my formation.
The acknowledgement would not be complete without the mention of KatholischerAkademischer Ausländer-Dienst (KAAD). This work would not have started in thefirst place if not for their hospitality and generosity. KAAD sponsored my Masterstudies in Ghana, and I was privileged to be supported again for this PhD studies. I amespecially grateful to the African Department team: Dr Marko Kuhn (Head), SimoneSaure (immediate past desk officer), Jana Geerken (Current desk officer) and GiselaSahler (Secretary). Your smiles were always comforting and welcoming. You are ateam of difference; God bless you all.
Special gratitude goes to Dr Leonard K. Amekudzi (Department of Physics, KNUST)for his constant concern, suggestions and encouragement. He gave me the best trainingas my supervisor during my Master studies at KNUST and stayed in touch like a father,ensuring that I completed this work successfully. You are a man of difference, and I
91

will forever remain indebted to you.
Sincere thanks go to Dr Olivier Briët ( Swiss Tropical Institute, University of Basel,Basel, Switzerland ) and Dr Kingsley Badu (Kumasi Centre for Collaborative Researchin Tropical Medicine) for their generosity in sharing with me their entomologicaldatabase. I am grateful to Prof. Dr Ellis Owusu-Dabo (director of KCCR, Ghana),Prof. Dr S. K. Danour (Department of Physics, KNUST), Prof. Dr K. Preko (De-partment of Physics, KNUST) and Mr Kingsley Victor Yimbilmor Kayan (KintampoHealth Research Centre) who were supportive during my data collection in Ghana.
I would like to thank the staff and colleagues of the Institute of Geophysics and Me-teorology for the pleasant working atmosphere. I am especially grateful to membersof the Regional Climate Research and Tropical Meteorology group. Your willingnessto help enabled me to overcome various difficulties. Special gratitude to Roderick vander Linden, for being an awesome office mate and colleague. I am glad I met you all.
To my late parents Ubor Yamba Jajol and Mrs Margaret Yamba, I am incredibly grate-ful for your wise counsel and sympathetic ear. You were always there for me until yourunfortunate demise. You will forever remain in my memory bank. May your souls restin perfect peace.
Finally, to my friends Rev. Fr. Magnus I., Jackline Ogolla, Samuel Kunji, John Udi-mar, Samuel Acheampong, Marian Osei, Emmanuel Tasun and Bernice Mawong, yourencouragement and support are much appreciated and duly acknowledged.To Jackline Ogolla, you are a God-sent-friend to me and all who know you. You re-mained impressive whenever life got rough. I owe you a lot of gratitude. God blessyou.
I appreciate the efforts of all those who have assisted me in any way; God bless youall.
92

Declaration
I hereby declare that this thesis is my own work towards the PhD and that, to the bestof my knowledge, it contains no material previously published by another person normaterial which has been accepted for the award of any other degree of the University,except where due acknowledgement has been made in the text.
Cologne, 25th October 2016.
(Edmund Ilimoan Yamba)
93
Lebenslauf
Persönliche Angaben
Name: Edmund Ilimoan YambaAddress: St. Charles Lwanga Parish
Post Office Box 2Saboba, N/R, Ghana
Geburtstag: 27.05.1983Geburtsort: Saboba-GhanaFamilienstand: ledigStaatsangehörigkeit: GhanaerEmail: [email protected]
Schulbildung
1996 – 1999 Gaala E. P. Junior High School, SabobaBECE
1999 – 2001 St. Charles Senior High School, TamaleSSSCE
2003 – 2007 Kwame Nkrumah University of Science and TechnologyBSc Physics
2008 – 2010 Kwame Nkrumah University of Science and TechnologyMSc Geophysics
Berufliche Tätigkeiten
2007 – 2010 Kwame Nkrumah University of Science and TechnologyLehrassistent/Demonstrator
2011 – 2012 Saboba Senior High SchoolPhysiklehrer
94


![1. Gutachter: Prof. Dr. A. Khoukaz 2. Gutachter: Dr. C ... · chungsgegenstand der Dissertation von Michael Papenbrock f ur eine pola-risierte Strahlzeit [Pap12a]. Die Begrundung](https://img.dokumen.tips/doc/110x75/5d5aa9ea88c99373678b6751/1-gutachter-prof-dr-a-khoukaz-2-gutachter-dr-c-chungsgegenstand.jpg)


