Embed Size (px)
Citation preview

Biogeosciences, 10, 2539–2552, 2013www.biogeosciences.net/10/2539/2013/doi:10.5194/bg-10-2539-2013© Author(s) 2013. CC Attribution 3.0 License.
EGU Journal Logos (RGB)
Advances in Geosciences
Open A
ccess
Natural Hazards and Earth System
Sciences
Open A
ccess
Annales Geophysicae
Open A
ccess
Nonlinear Processes in Geophysics
Open A
ccess
Atmospheric Chemistry
and Physics
Open A
ccess
Atmospheric Chemistry
and Physics
Open A
ccess
Discussions
Atmospheric Measurement
Techniques
Open A
ccess
Atmospheric Measurement
Techniques
Open A
ccess
Discussions
Biogeosciences
Open A
ccess
Open A
ccess
BiogeosciencesDiscussions
Climate of the Past
Open A
ccess
Open A
ccess
Climate of the Past
Discussions
Earth System Dynamics
Open A
ccess
Open A
ccess
Earth System Dynamics
Discussions
GeoscientificInstrumentation
Methods andData Systems
Open A
ccess
GeoscientificInstrumentation
Methods andData Systems
Open A
ccess
Discussions
GeoscientificModel Development
Open A
ccess
Open A
ccess
GeoscientificModel Development
Discussions
Hydrology and Earth System
Sciences
Open A
ccess
Hydrology and Earth System
Sciences
Open A
ccess
Discussions
Ocean Science
Open A
ccess
Open A
ccess
Ocean ScienceDiscussions
Solid Earth
Open A
ccess
Open A
ccess
Solid EarthDiscussions
The Cryosphere
Open A
ccess
Open A
ccess
The CryosphereDiscussions
Natural Hazards and Earth System
SciencesO
pen Access
Discussions
Improved quantification of microbial CH 4 oxidation efficiency inarctic wetland soils using carbon isotope fractionation
I. Preuss, C. Knoblauch, J. Gebert, and E.-M. Pfeiffer
Institute of Soil Science, University of Hamburg, Hamburg, Germany
Correspondence to:I. Preuss ([email protected])
Received: 9 November 2012 – Published in Biogeosciences Discuss.: 4 December 2012Revised: 12 March 2013 – Accepted: 18 March 2013 – Published: 16 April 2013
Abstract. Permafrost-affected tundra soils are significantsources of the climate-relevant trace gas methane (CH4). Theobserved accelerated warming of the arctic will cause deeperpermafrost thawing, followed by increased carbon mineral-ization and CH4 formation in water-saturated tundra soils,thus creating a positive feedback to climate change. AerobicCH4 oxidation is regarded as the key process reducing CH4emissions from wetlands, but quantification of turnover rateshas remained difficult so far. The application of carbon sta-ble isotope fractionation enables the in situ quantification ofCH4 oxidation efficiency in arctic wetland soils. The aim ofthe current study is to quantify CH4 oxidation efficiency inpermafrost-affected tundra soils in Russia’s Lena River deltabased on stable isotope signatures of CH4. Therefore, depthprofiles of CH4 concentrations andδ13CH4 signatures weremeasured and the fractionation factors for the processes ofoxidation (αox) and diffusion (αdiff ) were determined.
Most previous studies employing stable isotope fractiona-tion for the quantification of CH4 oxidation in soils of otherhabitats (such as landfill cover soils) have assumed a gastransport dominated by advection (αtrans= 1). In tundra soils,however, diffusion is the main gas transport mechanism anddiffusive stable isotope fractionation should be consideredalongside oxidative fractionation. For the first time, the sta-ble isotope fractionation of CH4 diffusion through water-saturated soils was determined with anαdiff = 1.001± 0.000(n = 3). CH4 stable isotope fractionation during diffusionthrough air-filled pores of the investigated polygonal tun-dra soils wasαdiff = 1.013± 0.003 (n = 18). Furthermore, itwas found thatαox differs widely between sites and horizons(meanαox = 1.017± 0.009) and needs to be determined ona case by case basis. The impact of both fractionation fac-tors on the quantification of CH4 oxidation was analyzed by
considering both the potential diffusion rate under saturatedand unsaturated conditions and potential oxidation rates. Fora submerged, organic-rich soil, the data indicate a CH4 oxi-dation efficiency of 50 % at the anaerobic–aerobic interfacein the upper horizon. The improved in situ quantification ofCH4 oxidation in wetlands enables a better assessment ofcurrent and potential CH4 sources and sinks in permafrost-affected ecosystems and their potential strengths in responseto global warming.
1 Introduction
With a global warming potential 25 times as high as thancarbon dioxide on a century time scale (Forster et al., 2007),methane (CH4) is an important greenhouse gas in the cli-mate system. Much research effort focuses on identifyingthe global CH4 sources and sinks to estimate not only theircurrent strength but also their potential in response to land-use change and global warming (Walter et al., 2007; Dlu-gokencky et al., 2009; Keppler et al., 2006). In the focus ofthis study are arctic wetlands, which hold enormous amountsof organic carbon (Tarnocai et al., 2009; Zubrzycki et al.,2013) and are significant sources of CH4 (Wille et al., 2008;Tagesson et al., 2012). With the observed accelerated warm-ing of the Arctic, deeper permafrost thawing will cause in-creased carbon mineralization and CH4 formation in water-saturated tundra soils, bearing the potential to cause positivefeedback to climate change (Anisimov, 2007; Schuur et al.,2009;Akerman and Johansson, 2008).
One of the key processes regulating wetland CH4fluxes is aerobic microbial CH4 oxidation (Segers, 1998;Whalen, 2005) that is performed by methanotrophic bacteria.
Published by Copernicus Publications on behalf of the European Geosciences Union.
2540 I. Preuss et al.: Improved quantification of microbial CH4 oxidation
CH4 is formed in the final step of anaerobic microbial degra-dation of organic matter and is released from wetlands viathree transport mechanisms: (1) diffusion along the concen-tration gradient between wetland soil and atmosphere, (2)ebullition in the form of gas bubbles due to CH4 supersat-uration, and (3) plant-mediated transport through gas con-ducting tissue known as aerenchyma (Joabsson et al., 1999;Lai, 2009; Whalen, 2005; Kutzbach et al., 2004). In con-trast to the other two pathways, the slow diffusive flux facil-itates extended contact of CH4 with methanotrophic bacte-ria. This pathway may allow more than 90 % of the availableCH4 to be oxidized to CO2 before it reaches the soil sur-face (Roslev and King, 1996; Sundh et al., 1995). The extentto which the CH4 produced is oxidized, the CH4 oxidationefficiency, is controlled by the key factors (1) rate of micro-bial oxidation (Wang et al., 2004) and (2) rate of diffusionof CH4 (Curry, 2009; Duenas et al., 1994). These parame-ters are mainly governed by the abundance and compositionof methane oxidizing microbial communities and the envi-ronmental factors CH4 and oxygen (O2) availability, soil air-filled porosity and soil-water content.
To quantify the CH4 oxidation efficiency, several meth-ods including batch or column laboratory experiments and insitu measurements are currently employed; yet, each displaysdifferent limitations (Huber-Humer et al., 2009). Gas push-pull tests (GPPT) inject and extract a defined volume of agas mixture of a reactive gas (e.g., CH4) and a conservativetracer (e.g., argon) into and from the soil, and the microbialturnover is quantified by analyzing the breakthrough curvesof the gases (Streese-Kleeberg et al., 2011). GPPTs are noteasily applicable at sites with low oxidation rates and highwater saturation (Gomez et al., 2008; Urmann et al., 2007),such as tundra wetlands, and have only been successfully ap-plied in near-surface soils with a cylinder driven 50 cm intothe soil (Nauer and Schroth, 2010). Furthermore, mass bal-ance calculations using loading and surface flux measure-ments to determine the fraction of oxidized CH4, e.g., inbiofilters or landfill cover soils (Powelson et al., 2007; Cabralet al., 2010; Gebert et al., 2003), are difficult to apply in wet-lands since loading rates cannot be quantified in these opensystems.
In addition to the above-mentioned methods, studies inlandfill cover soils and swamp forests determined the CH4oxidation efficiency by measuring the changes in the ra-tio of two stable CH4 isotopologues,13CH4 and 12CH4(Nozhevnikova et al., 2003; Chanton et al., 2008a; De Viss-cher et al., 1999, 2004; Happell et al., 1994; Liptay et al.,1998). The approach utilizes the fact that isotopic fraction-ation occurs when CH4 is oxidized: the remaining CH4becomes heavier and the produced CO2 becomes lighter(Barker and Fritz, 1981) as the light isotopologue12CH4 isoxidized more readily by methanotrophic bacteria than theheavier13CH4. The isotopic fractionation factorα is definedas the change in isotopic composition between reactant (Q)
and product (P ):
α =R(13C/12C)Q
R(13C/12C)P, (1)
whereR is the isotope ratio of heavier13C and lighter12C.The enrichment of13C in CH4 is measured as isotopic abun-dance relative to a standard, expressed in theδ notation(δ13C):
δ13C=Rsample
Rstandard−1, (2)
where Rsample is the isotope ratio13C/12C of the sam-ple and Rstd is the 13C/12C ratio of the reference stan-dard VPDB (Vienna Peedee Belemnite;Rstd= 0.0112372)(McKinney et al., 1950).
Additionally to oxidation fractionation, Mahieu (2008) hasshown through a model-based isotope approach that isotopicfractionation by diffusion should also be accounted for, giventhat the faster diffusive transport of the lighter isotope causesan enrichment of the heavier isotope in the remaining gasphase. In air, the diffusion coefficient of12CH4 exceeds thatof 13CH4 by a factor of 1.0195 due to mass differences.No fractionation is expected when advection dominates gastransport (Bergamaschi et al., 1998; Chanton, 2005).
For field applications the so-called “open-system equa-tion” by Monson and Hayes (1980) is then applied to de-termine the CH4 oxidation efficiency (Mahieu et al., 2008):
fox=(δE−δP )
(αox−αtrans), (3)
wherefox is the fraction of CH4 oxidized in the soil;δE istheδ13C of emitted CH4 relative to VPDB;δP is theδ13C ofproduced CH4 relative to VPDB;αox is the isotopic fraction-ation factor of oxidation;αtrans is the isotopic fractionationfactor of transport.
While for the microbial oxidation process isotopic frac-tionation factors ranging between 1.003 and 1.049 havebeen reported (Cabral et al., 2010; Templeton et al., 2006;Reeburgh et al., 1997), fractionation factors for gas transportare scarce and calculations of CH4 oxidation efficiencies forlandfill cover soils predominantly have assumedαtrans= 1,supposing that gas transport of CH4 is dominated by advec-tion (Liptay et al., 1998). To our knowledge, the isotopicfractionation factor for diffusion has so far not been deter-mined for soils, but only for a glass bead (diameter 2–3 mm)porous medium withαdiff = 1.0178± 0.001 (De Visscher etal., 2004).
The objective of the current study is to improve a methodfor the quantification of microbial CH4 oxidation efficiencyin arctic wetlands based on the isotopic fractionation ofCH4 oxidation (αox) and gas transport (αtrans). The firstmeasurement-based data of stable isotope fractionation dur-ing CH4 diffusion (αdiff ) through both water-saturated and
Biogeosciences, 10, 2539–2552, 2013 www.biogeosciences.net/10/2539/2013/
I. Preuss et al.: Improved quantification of microbial CH4 oxidation 2541
unsaturated wetland soils are presented. Furthermore, theimpact of both isotopic fractionation factors on the quan-tification of CH4 oxidation is estimated considering boththe potential CH4 diffusion rate at different soil-water con-tents and the potential CH4 oxidation rates in the soil. CH4oxidation efficiency calculations are carried out with envi-ronmental data from a water-saturated tundra soil in Rus-sia’s Lena River delta, showing a CH4 oxidation efficiencyof up to 50 %.
2 Materials and methods
2.1 Study area
With its 32 000 km2 the Lena River delta is the largest deltaof the circum-arctic land masses. Situated at the north coastof Siberia, it belongs to the area of continuous permafrostwith an arctic continental climate characterized by both lowtemperatures and precipitation (Boike et al., 2008). Inves-tigations were carried out on Samoylov Island (72.22◦ N,126.30◦ E) situated in the southern-central part of the delta.Samples were taken during two expeditions in 2009 and2010 in the eastern part of the island that is characterizedby wet polygonal tundra, a permafrost feature typical for ex-tensive areas of arctic lowland tundra (French, 1996). Its mi-crorelief consists of homogeneously spread soil units of de-pressed centers of low-centered ice wedge polygons (here-inafterpolygon center) and their elevated surrounding rims.The soils only thaw in the upper part (< 60 cm) during thesummer (active layer) and are rich in organic matter (Zubrzy-cki et al., 2013). According to the land cover classification ofSchneider et al. (2009), the land cover class wet sedge-andmoss-dominated tundra (WT) is the most important source ofCH4 in the Lena River delta. It consists of the subclasses drysites (62.2 % cover), very wet sites (7.8 %), overgrown wa-ter (14.8 %) and water (15.2 %) (Schneider et al., 2009). Thisstudy investigated four polygon centers with differing watertables, thus representing all subclasses except the open waterbodies: a polygonal pond with a permanent water level abovethe soil surface, two saturated polygon centers (A and B) witha changing water level close to the soil surface, and an unsat-urated polygon center with a distinctly lower water level.
2.2 Soil sampling, storage and analysis
Soil samples were taken from every identified pedogenichorizon from the active layer of four polygon centers inpits which had been excavated to the frozen ground. Mixedsoil samples were collected in plastic bags, refrozen in thefield and kept frozen until arrival in the laboratory. In ad-dition, three undisturbed soil cores (100 cm3, height 4 cm)were retrieved from each horizon, stored either cooled (sam-ples 2009) or frozen (samples 2010) until further analysis.
Prior to analysis of the mixed organic samples, all livingroots and plant material were removed. All mixed soil sam-ples were air dried. The dried organic samples were cutinto 2–5 mm pieces and the mineral samples were sieved (to< 2 mm). Subsequently, the samples were milled and dried at105◦C. Total carbon and nitrogen were measured with an el-emental analyzer (VarioMAX; Elementar, Hanau, Germany).Electrical conductivity (LF 90, WTW) and soil pH (CG 820,Schott) were determined in a suspension of 10 g of fresh soilin 50 mL of distilled water.
2.3 Vegetation analysis
Plant species were investigated according to the approach ofBraun-Blanquet (1964) in three plots of 0.25 m2 at each site.The species dominance ofCarex aquatiliswas estimated asthe percentage of the basal area covering the plots.
2.4 Pore-water sampling, storage and gas concentrationanalyses
To measure profiles of CH4 concentration and stable isotope(SI) ratio, pore-water samples were taken at several depthsin the polygon center via perforated stainless steel tubes (∅
3.18 mm), sampling 5 mL for concentration and 50 mL for SIanalyses. Samples were conserved in vials or serum bottlesflushed with nitrogen and containing sodium chloride, thusforming a saturated saline solution after injection. To liber-ate dissolved CO2, 100 µL of 10 % HCl solution was addedafterwards.
Gas analyses were carried out at the field station onSamoylov Island and in the laboratory in Germany withgas chromatographs (both GC 7890, Agilent Technologies,Germany) equipped with a PorapakQ column (2 mm ID,1.8 m length) separating CH4 and CO2. CH4 concentrationwas measured with a flame ionization detector (FID) andconcentration of CO2 with a thermal conductivity detector(TCD). Oven, injection, FID and TCD temperatures were40, 75, 250 and 180◦C, respectively. Helium served as thecarrier and make-up gas. The injection volume was 200 µLand samples were measured twice. Pore-water gas concen-trations were calculated from the concentration measuredand the headspace volume and pressure (pressure gaugeLEO1, Fa. Keller, Switzerland) by applying Henry’s Lawand corrected for the partition of CH4 between the aque-ous and the gaseous phase by using the solubility coefficientβ = 0.00867 mL mL−1 for solubility of CH4 in a saturatedsaline solution at 20◦C (Yamamoto et al., 1976; Kutzbachet al., 2004; Seibt et al., 2000). For calibration, CH4 stan-dard gases of 1.7 and 200 ppmv, 1, 10 and 50 vol. % wereused. Uncertainty due to manual injection onto the columnis < 1 % for the standards> 200 ppmv and< 18 % for the1.7 ppmv standard.
www.biogeosciences.net/10/2539/2013/ Biogeosciences, 10, 2539–2552, 2013
2542 I. Preuss et al.: Improved quantification of microbial CH4 oxidation
Oxygen depth profiles were measured with a Fi-box 3-trace v3 planar trace oxygen minisensor(Presens, Regensburg, Germany).
2.5 Isotope ratio mass spectrometry
Samples were analyzed in duplicate by gas chromatogra-phy isotope ratio mass spectroscopy (GC-IRMS, Delta Plus,ThermoScientific, Dreieich, Germany) with a 25 m capil-lary column (Poraplot, 0.32 mm ID). Analytical replicateprecision generally was< 0.2 ‰. For samples with near-atmospheric CH4 concentrations, a preconcentration sys-tem (PreCon, ThermoScientific, Dreieich, Germany) wasused (Brand, 1995) with standard error of replicate mea-surements generally less than 0.5 ‰. Injected sample vol-umes varied with sample concentrations (0.01–6 mL).Valuesare expressed relative to VPDB (Vienna Pee Dee Belem-nite Standard) using the reference standard NGS3 8561(δ13C =−73.27 ‰ VPDB; NIST, Gaithersburg, USA).
2.6 Potential CH4 oxidation rates
Potential CH4 oxidation rates were determined for horizonsof one saturated polygon center (saturated polygon center A)and the polygonal pond in batch cultures. Homogenized soilmaterial (cut to< 2 mm, 4 g) with in situ water content wasdistributed in a thin layer over the side wall in flat-walled cul-ture bottles (50 mL) to prevent substrate limitation effects.The flasks were closed with gas-tight butyl rubber stoppersthrough which CH4 was added, giving an initial concentra-tion of 1.5± 0.3 %. Three flasks per sample were incubatedhorizontally in the dark at 4◦C for a few hours up to severalweeks, depending on the oxidation rate.
CH4 concentration in the headspace was measured overtime by gas chromatography and oxidation rates were calcu-lated from the declining CH4 by linear regression analysisusing 6–8 measurement points (R2 > 0.81,p < 0.01).
2.7 Analysis of soil gas diffusivity
To analyze the effective diffusion coefficient for each soilhorizon, the water content in the three undisturbed soilcores collected from each horizon of the polygon centerswas adjusted to field capacity (0.3 kPa) on a sand bath. Af-terwards, they were installed on top of cylindrical metalchambers of approximately 3 L volume, (Rolston, 1986).The chambers were filled with an initial CH4 concentra-tion of 3.5± 0.3 mmol L−1 (experiment runs> 10 h) and6.7± 0.3 mmol L−1 (experiment runs> 10 h), which couldonly escape via diffusion through the soil core cylin-ders. Methanotrophic activity was blocked by addition of0.8 mmol L−1 acetylene. Diffusion was monitored by gaschromatography and rates were calculated via the decrease ofCH4 concentration inside the chamber over time. The inhibi-tion of CH4 oxidation by acetylene was verified by placing asoil core into a jar with an atmosphere of 3.5 mmol L−1 CH4
and 0.8 mmol L−1 acetylene. No CH4 concentration changewas detected over a period of three days.
To study the effect of pore-size distribution on diffusiv-ity, samples of the unsaturated polygon center were consec-utively drained in a pressure-plate apparatus (Richards andFireman, 1943) using pressure heads of 6 kPa (drainage ofmacropores:> 50 µm∅), 30 and 100 kPa (drainage of meso-pores: 50–10 µm and≤ 10 µm∅), rerunning the experimentat each water content. Fick’s first law was transformed tocalculate the effective diffusion coefficientDeff [m2 s−1]as follows:
Deff= −JCH4
(dc
dx
)−1
, (4)
whereJCH4 is the diffusive CH4 flux (mol m−2 s−1), dx isthe distance of which diffusion occurs through, i.e., height ofcylinder (m), and dc is the concentration difference betweenchamber and atmosphere (mol m−3).
The final value ofDeff for each soil core was calculatedas an average of six individual measurements. Experimentswere either carried out at room temperature or, when run formore than one day, in an incubator at 20◦C and 98–100 %relative humidity to minimize evaporation effects. Molarconcentrations were corrected for temperature and pressureaccording to the ideal gas law. Soil cores were weighed ateach dewatering stage to determine the water content and air-filled porosity. The chambers were tested for leaks with thefirst experimental setup using a resin casted core.
The experimental setup was modified with a second cham-ber to determine the diffusion through water-saturated soils.First, the diffusion chamber was filled with distilled wa-ter adjusted to pH 2 with phosphoric acid and initiallycontained 1.44 mmol L−1 CH4 and 0.8 mmol L−1 acetylene.Three water-saturated soil cores of the uppermost horizonof the saturated polygon center B were installed on top ofthe chamber. Then a second chamber (1.4 L volume) was in-stalled on top of the cylinder containing the undisturbed soilsample. The top chamber was subsequently filled with dis-tilled water at pH 2. With this experimental setup, CH4 dif-fusion from the bottom chamber through the water-saturatedsoil sample into the top chamber could be measured. Within4 h the solution of the bottom chamber was sampled 3–4times by collecting 3 mL water with a syringe and a hypo-dermic needle through a rubber stopper at one side of thechamber and simultaneously injecting 3 mL of the initial so-lution at the other side of the chamber. Samples were con-served in vials flushed with nitrogen and containing sodiumchloride. Experiments were run consecutively and at 20◦C tominimize expansion effects of the solutions. Gas diffusivitywas calculated from the decreasing gas concentration in thebottom chamber.
To prevent CH4 production in the water-saturated soilsamples during diffusion measurements, the undisturbedsoil samples were set into a solution of 10 mmol L−1
Biogeosciences, 10, 2539–2552, 2013 www.biogeosciences.net/10/2539/2013/
I. Preuss et al.: Improved quantification of microbial CH4 oxidation 2543
2-bromoethane-sulfonate (an inhibitor of methanogenesis)dissolved in distilled water for more than five days priorto the experiment. The inhibition of methanogenesis andCH4 oxidation in the second experimental setup was ver-ified by placing the treated soil cores into jars with dis-tilled water adjusted to pH 2 and 1.44 mmol L−1 CH4 and0.8 mmol L−1 acetylene. Neither a decrease nor increase ofCH4 was detected.
After the diffusion experiments, core samples were driedto a constant weight at 105◦C and the total porosity wasdetermined by helium pycnometry (AccuPyc II 1340, Mi-cromeritics, Norcross, USA). The volumetric water contentwas subtracted from the total porosity to obtain the air-filledporosity.
2.8 Determination ofαox and αdiff
To determine the fractionation factors for oxidation and dif-fusion, gas samples from the batch oxidation experimentmeasurements and gas or water samples from the diffusionchambers were analyzed forδ13CH4 composition.
Both experimental setups are closed systems where a lim-ited supply of reactant, CH4, undergoes an irreversible con-version to a product, CO2, which is either constantly re-moved (in the diffusion experiment) or remains in the sys-tem (in the batch experiment) without further reacting withthe reactant. In this respect, closed system kinetic fraction-ation behaves like open system fractionation, where CH4 isconstantly removed. Assuming Rayleigh (1896) open systemfractionation, the isotopic fractionation factor was calculatedbased on the approach described in Coleman et al. (1981):
δ13Ct ∼= (((1/α)−1)×ln(Mt/M0)) + δ13C0, (5)
whereM0 is the concentration of CH4 at time 0,Mt is theconcentration of CH4 at time t , δ13C0 is theδ13C value ofCH4 at time 0, andδ13Ct is theδ13C value of CH4 at timet . From the slope (m) of the linear regression between thedifferences in CH4 isotope values (δ13Ct − δ13C0) and thefraction of the remaining CH4 concentration (ln(Mt /M0)) theisotopic fractionation factor can be derived as follows:
α=1
(m+1). (6)
Fractionation factors were determined for three replicateseach with at least five gas samples. The fractionation fac-tor for diffusion at water saturation was determined for threereplicates with 3–4 water samples each.
2.9 CH4 oxidation efficiency calculations
The isotopic fractionation factorsαox and αdiff were thenused to calculate the CH4 oxidation efficiency from theδ13CH4 isotopic signatures at different soil depths of the sat-urated polygon center A sampled on 19 July 2009. Calcula-tions were made for horizons where both a decrease in con-centration and an enrichment of13C in CH4 were observed
and diffusion was assumed to be the main occurring trans-port mechanism (αtrans=αdiff ) using Eq. (3). Comparatively,to determine the CH4 oxidation efficiency under the assump-tion that no fractionation by transport occurs, the calculationswere repeated withαtrans= 1. In addition, calculations wereconducted with the mean, minimum and maximum of bothfractionation factors of all investigated sites to estimate theirimpact onfox.
To account for a potential impact of temperature on theisotopic fractionation during CH4 oxidation, calculationswere additionally conducted with a temperature-dependentcorrection forαox, decreasing with rising temperature by3.9× 10−4 ◦C−1 (Chanton et al., 2008b).
2.10 Statistical analyses
Statistical analyses were performed using OriginPro 8G(OriginLab Corporation, USA). The relationship betweenair-filled porosity and soil gas diffusion was curve fitted andexamined with a one-way ANOVA. Correlations between ox-idation rate andαox and between diffusion coefficients andαdiff were tested with Pearson’s correlation analysis. Isotopicfractionation factors of different sites were compared withone-way ANOVAs and a post-hoc Tukey’s honestly signifi-cant differences test (Tukey’s).
3 Results
3.1 Soil and vegetation characteristics
In the depressed polygon centers, drainage was impeded bythe underlying permafrost. Thus, the soils of the polygoncenters were mostly water saturated with a varying waterlevel close to the surface. All polygon centers were character-ized by reducing conditions facilitating anaerobic degrada-tion of organic matter. The two saturated polygon centers andthe unsaturated polygon center showed a very high organiccarbon content in the upper horizons (> 120 mg g−1 OC, des-ignated as Oi according to US Soil Taxonomy (2010), Ta-ble 1). Subjacent horizons (A, Oi) showed an accumulationof humified organic matter mixed with fine sand bands andhydromorphic features (Bg). According to the US Soil Tax-onomy, the soils of these three polygon centers were classi-fied asTypic Aquorthel(USDA, 2010), and asHistic Crysolsaccording to the World Reference Base (WRB, 2006).
The saturated polygonal pond was characterized by a moreuniform accumulation of organic carbon across the profile(ranging around 60 mg g−1 OC), containing fine sand andshowing features of gleying. The soil of this polygon centerwas classified asTypic Aquorthel(USDA, 2010), andTypicCryosol(WRB, 2006).
The total porosity of the upper horizons ranged around90 %, decreasing within the profile to 50 %. Accord-ingly, air-filled porosity at field capacity was high inthe top horizons (> 18 %) and the bulk density was low
www.biogeosciences.net/10/2539/2013/ Biogeosciences, 10, 2539–2552, 2013
2544 I. Preuss et al.: Improved quantification of microbial CH4 oxidation
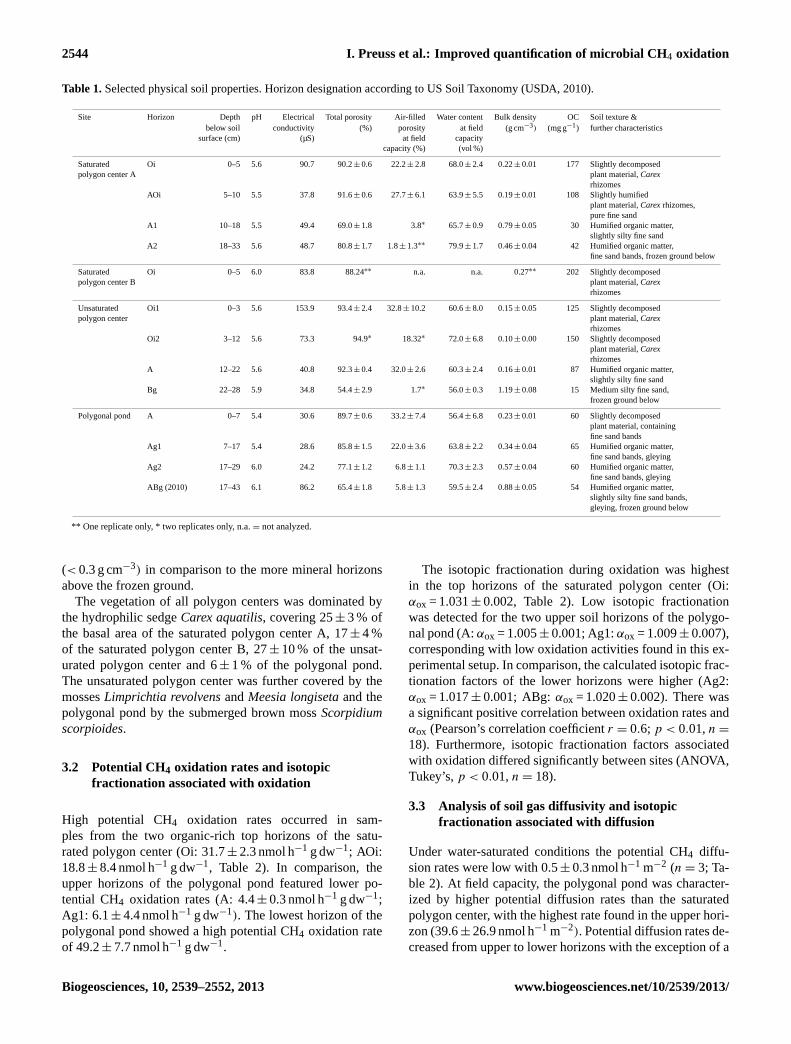
Table 1.Selected physical soil properties. Horizon designation according to US Soil Taxonomy (USDA, 2010).
Site Horizon Depth pH Electrical Total porosity Air-filled Water content Bulk density OC Soil texture &below soil conductivity (%) porosity at field (g cm−3) (mg g−1) further characteristics
surface (cm) (µS) at field capacitycapacity (%) (vol %)
Saturated Oi 0–5 5.6 90.7 90.2± 0.6 22.2± 2.8 68.0± 2.4 0.22± 0.01 177 Slightly decomposedpolygon center A plant material,Carex
rhizomesAOi 5–10 5.5 37.8 91.6± 0.6 27.7± 6.1 63.9± 5.5 0.19± 0.01 108 Slightly humified
plant material,Carexrhizomes,pure fine sand
A1 10–18 5.5 49.4 69.0± 1.8 3.8∗ 65.7± 0.9 0.79± 0.05 30 Humified organic matter,slightly silty fine sand
A2 18–33 5.6 48.7 80.8± 1.7 1.8± 1.3∗∗ 79.9± 1.7 0.46± 0.04 42 Humified organic matter,fine sand bands, frozen ground below
Saturated Oi 0–5 6.0 83.8 88.24∗∗ n.a. n.a. 0.27∗∗ 202 Slightly decomposedpolygon center B plant material,Carex
rhizomes
Unsaturated Oi1 0–3 5.6 153.9 93.4± 2.4 32.8± 10.2 60.6± 8.0 0.15± 0.05 125 Slightly decomposedpolygon center plant material,Carex
rhizomesOi2 3–12 5.6 73.3 94.9∗ 18.32∗ 72.0± 6.8 0.10± 0.00 150 Slightly decomposed
plant material,Carexrhizomes
A 12–22 5.6 40.8 92.3± 0.4 32.0± 2.6 60.3± 2.4 0.16± 0.01 87 Humified organic matter,slightly silty fine sand
Bg 22–28 5.9 34.8 54.4± 2.9 1.7∗ 56.0± 0.3 1.19± 0.08 15 Medium silty fine sand,frozen ground below
Polygonal pond A 0–7 5.4 30.6 89.7± 0.6 33.2± 7.4 56.4± 6.8 0.23± 0.01 60 Slightly decomposedplant material, containingfine sand bands
Ag1 7–17 5.4 28.6 85.8± 1.5 22.0± 3.6 63.8± 2.2 0.34± 0.04 65 Humified organic matter,fine sand bands, gleying
Ag2 17–29 6.0 24.2 77.1± 1.2 6.8± 1.1 70.3± 2.3 0.57± 0.04 60 Humified organic matter,fine sand bands, gleying
ABg (2010) 17–43 6.1 86.2 65.4± 1.8 5.8± 1.3 59.5± 2.4 0.88± 0.05 54 Humified organic matter,slightly silty fine sand bands,gleying, frozen ground below
** One replicate only, * two replicates only, n.a.= not analyzed.
(< 0.3 g cm−3) in comparison to the more mineral horizonsabove the frozen ground.
The vegetation of all polygon centers was dominated bythe hydrophilic sedgeCarex aquatilis, covering 25± 3 % ofthe basal area of the saturated polygon center A, 17± 4 %of the saturated polygon center B, 27± 10 % of the unsat-urated polygon center and 6± 1 % of the polygonal pond.The unsaturated polygon center was further covered by themossesLimprichtia revolvensandMeesia longisetaand thepolygonal pond by the submerged brown mossScorpidiumscorpioides.
3.2 Potential CH4 oxidation rates and isotopicfractionation associated with oxidation
High potential CH4 oxidation rates occurred in sam-ples from the two organic-rich top horizons of the satu-rated polygon center (Oi: 31.7± 2.3 nmol h−1 g dw−1; AOi:18.8± 8.4 nmol h−1 g dw−1, Table 2). In comparison, theupper horizons of the polygonal pond featured lower po-tential CH4 oxidation rates (A: 4.4± 0.3 nmol h−1 g dw−1;Ag1: 6.1± 4.4 nmol h−1 g dw−1). The lowest horizon of thepolygonal pond showed a high potential CH4 oxidation rateof 49.2± 7.7 nmol h−1 g dw−1.
The isotopic fractionation during oxidation was highestin the top horizons of the saturated polygon center (Oi:αox = 1.031± 0.002, Table 2). Low isotopic fractionationwas detected for the two upper soil horizons of the polygo-nal pond (A:αox = 1.005± 0.001; Ag1:αox = 1.009± 0.007),corresponding with low oxidation activities found in this ex-perimental setup. In comparison, the calculated isotopic frac-tionation factors of the lower horizons were higher (Ag2:αox = 1.017± 0.001; ABg:αox = 1.020± 0.002). There wasa significant positive correlation between oxidation rates andαox (Pearson’s correlation coefficientr = 0.6; p < 0.01,n =
18). Furthermore, isotopic fractionation factors associatedwith oxidation differed significantly between sites (ANOVA,Tukey’s,p < 0.01,n = 18).
3.3 Analysis of soil gas diffusivity and isotopicfractionation associated with diffusion
Under water-saturated conditions the potential CH4 diffu-sion rates were low with 0.5± 0.3 nmol h−1 m−2 (n = 3; Ta-ble 2). At field capacity, the polygonal pond was character-ized by higher potential diffusion rates than the saturatedpolygon center, with the highest rate found in the upper hori-zon (39.6± 26.9 nmol h−1 m−2). Potential diffusion rates de-creased from upper to lower horizons with the exception of a
Biogeosciences, 10, 2539–2552, 2013 www.biogeosciences.net/10/2539/2013/

I. Preuss et al.: Improved quantification of microbial CH4 oxidation 2545
Table 2. Potential methanotrophic activity, potential rates of CH4 diffusion and isotopic fractionation factors for diffusion and oxidationcalculated for the different horizons of the studied sites. Potential diffusion rates of the saturated polygon center A and the polygonal pondwere determined at field capacity (0.3 kPa) and of the saturated polygon center B at water saturation; n.a.= not analyzed.
Water potential Site Horizon Mean depth Potential CH4 αox Potential CH4 αdiffbelow soil oxidation rate, (mean± SD) diffusion rate, (mean± SD)
surface, nmol h−1 g dw−1 nmol h−1 m−2
cm (mean± SD) (mean± SD)
Water saturated Saturated polygon Oi 2.5 n.a. n.a. 0.5± 0.3 1.001± 0.000center B
0.3 kPa
Saturated polygon Oi 2.5 31.7± 2.3 1.031± 0.002 9.8± 6.2 1.014± 0.003center A
AOi 7.5 18.8± 8.4 1.023± 0.002 8.8± 4.2 1.014± 0.001
Polygonal pond A 3.5 4.4± 0.3 1.005± 0.001 39.6± 26.9 1.010± 0.003Ag1 12.5 6.1± 4.4 1.009± 0.007 17.0± 11.3 1.013± 0.002Ag2 25 7.3± 1.8 1.017± 0.001 2.9± 0.7 1.011± 0.000ABg (2010) 33 49.2± 7.7 1.020± 0.002 9.6± 1.5 1.017± 0.001
Fig. 1. Relationship between air-filled porosity and soil gas diffusion (effective diffusion coefficient)with exponential fit, n= 64. Star marks diffusion coefficient of CH4 (D = 2.2× 10⁻⁵ m2 s−1) in freeair at 20 ◦C and 101.33 kPa given by Coward and Georgeson (1937).figure
34
Fig. 1. Relationship between air-filled porosity and soil gas diffu-sion (effective diffusion coefficient) with exponential fit,n = 64.Star marks diffusion coefficient of CH4 (D = 2.2× 10⁻⁵ m2 s−1)
in free air at 20◦C and 101.33 kPa given by Coward andGeorgeson (1937).
mid-range rate (9.6± 1.5 nmol h−1 m−2) in the lowest hori-zon of the polygonal pond.
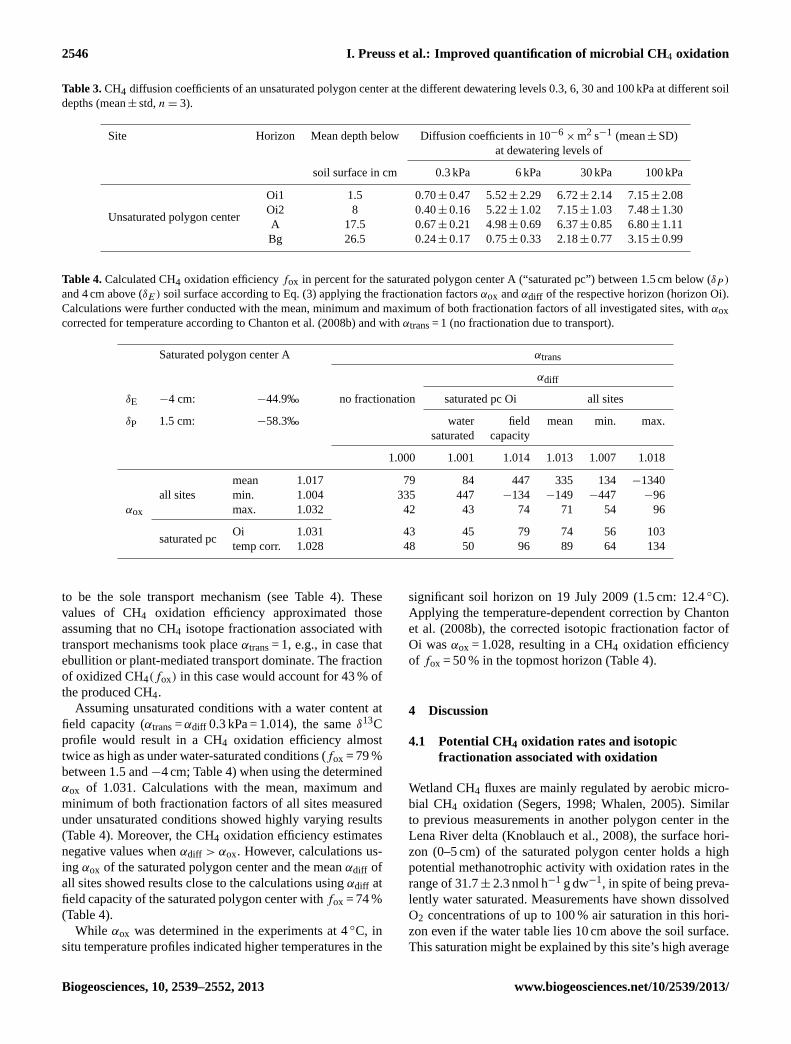
Diffusion tests under different water contents showed thatdiffusion predominantly took place through macropores ineach horizon of both sites (see Table 3). Once the macrop-ores were drained (6 kPa), the diffusion was faster than atfield capacity, but did not change strongly during furtherdrainage. The lowest horizon was characterized by the lowestdiffusion coefficient in each case. Diffusivity measurementsat different water contents showed that the diffusion coef-ficient exponentially increased with an increasing volumeof air-filled pore space (R2
= 0.9, p < 0.001, n = 64,Deff =−8.27237× 10⁻⁷
+ 8.89081× 10⁻⁷ x e(2.71241x8a)
where8a is the air-filled pore space, Fig. 1).
Isotopic fractionation by diffusion under unsaturated con-ditions ranged between 1.007 and 1.018 (Table 2). Values forαdiff did not correlate significantly with diffusion coefficients(Pearson’s correlation coefficientr = −0.1; p > 0.05, n =
18) and did not differ significantly between sites (ANOVA,Tukey’s, p > 0.05, n = 18), with a meanαdiff = 1.013±
0.003. Almost no isotopic fractionation by diffusion was de-tected under water-saturated conditions withαdiff = 1.001±
0.000 (n = 3).
3.4 CH4 oxidation efficiency calculations
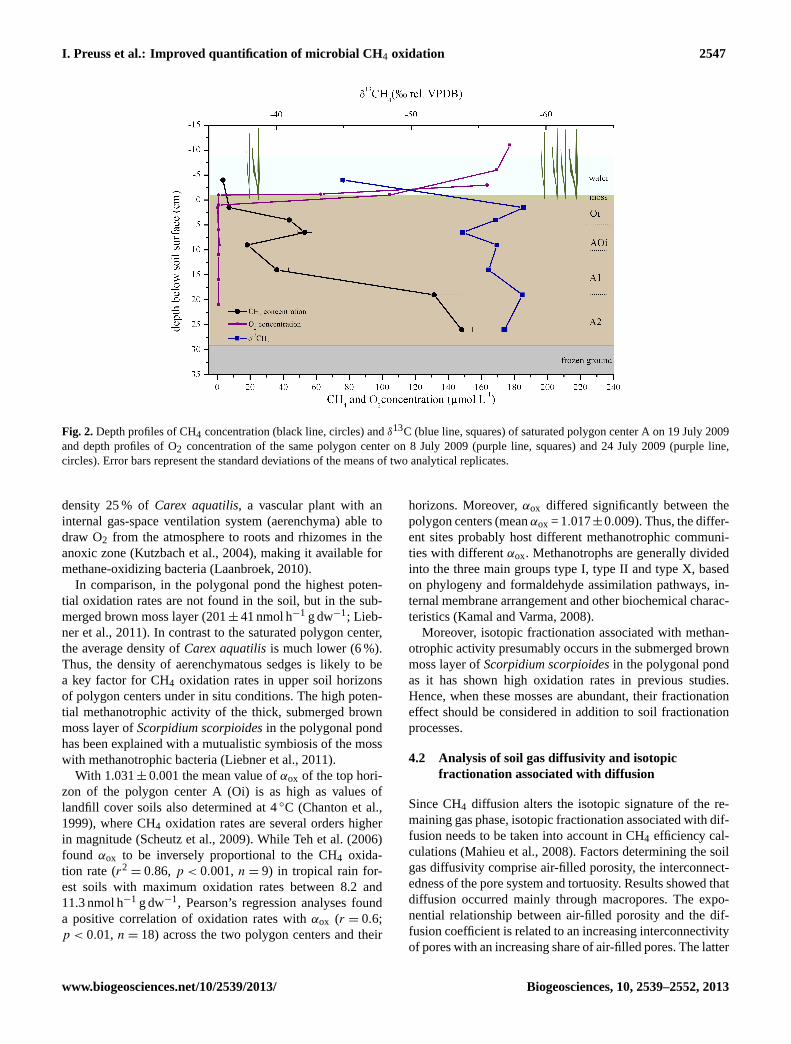
To investigate the potential impacts of the measured iso-topic fractionation factors on the oxidation efficiency esti-mates, the CH4 oxidation efficiency was calculated basedon the stable carbon isotope signatures of CH4 sampledin the soil-water phase of the saturated polygon center Aon 19 July 2009 (see Fig. 2). During sampling, theTypicAquorthelfeatured a water level 9 cm above soil surface anda thawing depth of 30 cm.
The highest CH4 concentration was found close to thefrozen ground and decreased from there to 9 cm by 88 %.A CH4 concentration peak at 6.5 cm was followed by a fur-ther decrease to near-atmospheric concentrations towards thewater surface (4 cm above soil surface in the pond water).Concurrently, theδ13C values of CH4 fluctuated between thefrozen ground and 9 cm within 2.5 ‰ (−56.8 ± 1.1‰), de-creasing between 6.5 and 1.5 cm from−53.8‰ to −58.3‰and then increasing towards the water surface (−44.9‰).Two O2 profile measurements during the same month (Fig. 2)showed that O2 was depleted (< 3 µmol L−1) within the firsthorizon (Oi); thus, the main part of oxidation presumablyonly occurred close to the soil surface.
Employing the isotopic fractionation factors(Oi αox = 1.031; αtrans=αdiff = 1.001 for water-saturatedconditions) a CH4 oxidation efficiency offox = 45 % wasassessed between 1.5 and−4 cm by assuming diffusion
www.biogeosciences.net/10/2539/2013/ Biogeosciences, 10, 2539–2552, 2013
2546 I. Preuss et al.: Improved quantification of microbial CH4 oxidation
Table 3.CH4 diffusion coefficients of an unsaturated polygon center at the different dewatering levels 0.3, 6, 30 and 100 kPa at different soildepths (mean± std,n = 3).
Site Horizon Mean depth below Diffusion coefficients in 10−6× m2 s−1 (mean± SD)
at dewatering levels of
soil surface in cm 0.3 kPa 6 kPa 30 kPa 100 kPa
Unsaturated polygon center
Oi1 1.5 0.70± 0.47 5.52± 2.29 6.72± 2.14 7.15± 2.08Oi2 8 0.40± 0.16 5.22± 1.02 7.15± 1.03 7.48± 1.30A 17.5 0.67± 0.21 4.98± 0.69 6.37± 0.85 6.80± 1.11Bg 26.5 0.24± 0.17 0.75± 0.33 2.18± 0.77 3.15± 0.99
Table 4.Calculated CH4 oxidation efficiencyfox in percent for the saturated polygon center A (“saturated pc”) between 1.5 cm below (δP )
and 4 cm above (δE) soil surface according to Eq. (3) applying the fractionation factorsαox andαdiff of the respective horizon (horizon Oi).Calculations were further conducted with the mean, minimum and maximum of both fractionation factors of all investigated sites, withαoxcorrected for temperature according to Chanton et al. (2008b) and withαtrans= 1 (no fractionation due to transport).
Saturated polygon center A αtrans
αdiff
δE −4 cm: −44.9‰ no fractionation saturated pc Oi all sites
δP 1.5 cm: −58.3‰ water field mean min. max.saturated capacity
1.000 1.001 1.014 1.013 1.007 1.018
mean 1.017 79 84 447 335 134−1340all sites min. 1.004 335 447 −134 −149 −447 −96
αox max. 1.032 42 43 74 71 54 96
saturated pcOi 1.031 43 45 79 74 56 103temp corr. 1.028 48 50 96 89 64 134
to be the sole transport mechanism (see Table 4). Thesevalues of CH4 oxidation efficiency approximated thoseassuming that no CH4 isotope fractionation associated withtransport mechanisms took placeαtrans= 1, e.g., in case thatebullition or plant-mediated transport dominate. The fractionof oxidized CH4(fox) in this case would account for 43 % ofthe produced CH4.
Assuming unsaturated conditions with a water content atfield capacity (αtrans=αdiff 0.3 kPa = 1.014), the sameδ13Cprofile would result in a CH4 oxidation efficiency almosttwice as high as under water-saturated conditions (fox = 79 %between 1.5 and−4 cm; Table 4) when using the determinedαox of 1.031. Calculations with the mean, maximum andminimum of both fractionation factors of all sites measuredunder unsaturated conditions showed highly varying results(Table 4). Moreover, the CH4 oxidation efficiency estimatesnegative values whenαdiff > αox. However, calculations us-ing αox of the saturated polygon center and the meanαdiff ofall sites showed results close to the calculations usingαdiff atfield capacity of the saturated polygon center withfox = 74 %(Table 4).
While αox was determined in the experiments at 4◦C, insitu temperature profiles indicated higher temperatures in the
significant soil horizon on 19 July 2009 (1.5 cm: 12.4◦C).Applying the temperature-dependent correction by Chantonet al. (2008b), the corrected isotopic fractionation factor ofOi wasαox = 1.028, resulting in a CH4 oxidation efficiencyof fox = 50 % in the topmost horizon (Table 4).
4 Discussion
4.1 Potential CH4 oxidation rates and isotopicfractionation associated with oxidation
Wetland CH4 fluxes are mainly regulated by aerobic micro-bial CH4 oxidation (Segers, 1998; Whalen, 2005). Similarto previous measurements in another polygon center in theLena River delta (Knoblauch et al., 2008), the surface hori-zon (0–5 cm) of the saturated polygon center holds a highpotential methanotrophic activity with oxidation rates in therange of 31.7± 2.3 nmol h−1 g dw−1, in spite of being preva-lently water saturated. Measurements have shown dissolvedO2 concentrations of up to 100 % air saturation in this hori-zon even if the water table lies 10 cm above the soil surface.This saturation might be explained by this site’s high average
Biogeosciences, 10, 2539–2552, 2013 www.biogeosciences.net/10/2539/2013/
I. Preuss et al.: Improved quantification of microbial CH4 oxidation 2547
Fig. 2. Depth profiles of CH4 concentration (black line, circles) and δ13C (blue line, squares) of saturatedpolygon center A on 19 July 2009 and depth profiles of O2 concentration of the same polygon centeron 8 July 2009 (purple line, squares) and 24 July 2009 (purple line, circles). Error bars represent thestandard deviations of the means of two analytical replicates.
35
Fig. 2.Depth profiles of CH4 concentration (black line, circles) andδ13C (blue line, squares) of saturated polygon center A on 19 July 2009and depth profiles of O2 concentration of the same polygon center on 8 July 2009 (purple line, squares) and 24 July 2009 (purple line,circles). Error bars represent the standard deviations of the means of two analytical replicates.
density 25 % ofCarex aquatilis, a vascular plant with aninternal gas-space ventilation system (aerenchyma) able todraw O2 from the atmosphere to roots and rhizomes in theanoxic zone (Kutzbach et al., 2004), making it available formethane-oxidizing bacteria (Laanbroek, 2010).
In comparison, in the polygonal pond the highest poten-tial oxidation rates are not found in the soil, but in the sub-merged brown moss layer (201± 41 nmol h−1 g dw−1; Lieb-ner et al., 2011). In contrast to the saturated polygon center,the average density ofCarex aquatilisis much lower (6 %).Thus, the density of aerenchymatous sedges is likely to bea key factor for CH4 oxidation rates in upper soil horizonsof polygon centers under in situ conditions. The high poten-tial methanotrophic activity of the thick, submerged brownmoss layer ofScorpidium scorpioidesin the polygonal pondhas been explained with a mutualistic symbiosis of the mosswith methanotrophic bacteria (Liebner et al., 2011).
With 1.031± 0.001 the mean value ofαox of the top hori-zon of the polygon center A (Oi) is as high as values oflandfill cover soils also determined at 4◦C (Chanton et al.,1999), where CH4 oxidation rates are several orders higherin magnitude (Scheutz et al., 2009). While Teh et al. (2006)found αox to be inversely proportional to the CH4 oxida-tion rate (r2
= 0.86, p < 0.001,n = 9) in tropical rain for-est soils with maximum oxidation rates between 8.2 and11.3 nmol h−1 g dw−1, Pearson’s regression analyses founda positive correlation of oxidation rates withαox (r = 0.6;p < 0.01, n = 18) across the two polygon centers and their
horizons. Moreover,αox differed significantly between thepolygon centers (meanαox = 1.017±0.009). Thus, the differ-ent sites probably host different methanotrophic communi-ties with differentαox. Methanotrophs are generally dividedinto the three main groups type I, type II and type X, basedon phylogeny and formaldehyde assimilation pathways, in-ternal membrane arrangement and other biochemical charac-teristics (Kamal and Varma, 2008).
Moreover, isotopic fractionation associated with methan-otrophic activity presumably occurs in the submerged brownmoss layer ofScorpidium scorpioidesin the polygonal pondas it has shown high oxidation rates in previous studies.Hence, when these mosses are abundant, their fractionationeffect should be considered in addition to soil fractionationprocesses.
4.2 Analysis of soil gas diffusivity and isotopicfractionation associated with diffusion
Since CH4 diffusion alters the isotopic signature of the re-maining gas phase, isotopic fractionation associated with dif-fusion needs to be taken into account in CH4 efficiency cal-culations (Mahieu et al., 2008). Factors determining the soilgas diffusivity comprise air-filled porosity, the interconnect-edness of the pore system and tortuosity. Results showed thatdiffusion occurred mainly through macropores. The expo-nential relationship between air-filled porosity and the dif-fusion coefficient is related to an increasing interconnectivityof pores with an increasing share of air-filled pores. The latter
www.biogeosciences.net/10/2539/2013/ Biogeosciences, 10, 2539–2552, 2013

2548 I. Preuss et al.: Improved quantification of microbial CH4 oxidation
effect has been observed in the same magnitude for mineralsoils with lower air-filled porosities (Gebert et al. (2011),Deff = 1.319× 10⁻⁷ x e(8a/0.116)
−1.477× 10⁻⁷), but is lesspronounced at higher porosities in comparison to mineralsoils where the effects of tortuosity play a larger role. Soilswith a larger air-filled porosity warrant higher diffusive gassupply of both O2 into the uppermost soil horizon and CH4escaping from lower horizons.
This finding is in line with the low diffusion coefficientsof the lowest horizon of the unsaturated polygon center (Ta-ble 3), which is characterized by higher bulk density and lessair-filled porosity (Table 1). The higher potential diffusionrates at field capacity in the polygonal pond compared tothe saturated polygon center might derive from the polygonalpond’s higher mineral content creating a lower tortuosity.
Furthermore, the soil-water content strongly controls thediffusivity through determining the pore space available forgas phase transport and thus the fractionation by diffusion.Under water-saturated conditions almost no isotopic frac-tionation occurred (αdiff = 1.001± 0.000). Under unsaturatedconditions the isotopic fractionation by diffusion ranged be-tween the theoretical maximum value in airαdiff = 1.0195and the low isotopic fractionation during air–water gastransfer of αdiff = 1.0008 (Knox et al., 1992). The meanαdiff = 1.013± 0.003 of the study sites at field capacity islower than the maximum value ofαdiff = 1.0178± 0.001 as-sumed for sandy landfill cover soils (De Visscher et al.,2004), which is slightly less than the theoretical value ofαdiff = 1.0195 in air. The fractionation factor determined byDe Visscher et al. (2004) used glass beads, which presum-ably feature both a lower tortuosity and a higher pore inter-connectedness than the peaty tundra soils. The higher diffu-sion coefficient in the porous medium (5.54× 10⁻⁶ m2 s−1)
could facilitate isotopic fractionation by diffusion. Measure-ments in this study showed no correlation between diffusioncoefficients andαdiff , but might show a different relationshipwith higher concentration gradients as found in landfill habi-tats where CH4 concentrations up to 60 % are found at thebottom of cover soils (Cabral et al., 2010).
4.3 CH4 oxidation efficiency calculations
The observed decrease in CH4 concentration between thelower and the upper horizons of the saturated polygon cen-ter A cannot be explained by oxidation since no oxygen wasavailable in these depths. Anaerobic oxidation of methane(AOM) was not considered since it is coupled to the reduc-tion of electron acceptors such as sulfate, ferric iron, nitrateand nitrite (Blazewicz, 2012), and concentrations of theseelectron acceptors are too low in the organic-rich soils stud-ied (Fiedler, 2004). In addition, AOM would cause a changein isotopic signatures, which was not detected here. Thus, thedecrease in CH4 concentration must originate from the differ-ent transport mechanisms (diffusive, advective or ebullitivewith αtrans= 1). Moreover, the increase of CH4 concentration
and lowerδ13CH4 values between 6.5 and 1.5 cm imply fur-ther CH4 production in a horizon where fresh organic ma-terial is available for microbial degradation. In this horizonCH4 production and oxidation occur in close proximity.
Calculations indicated a CH4 oxidation efficiency of up to50 % in the first 1.5 cm of the saturated polygon center whereoxygen is present. The highest methanotrophic activity ex-pectedly occurs at the anaerobic–aerobic interface since theratio of CH4 to O2 is optimal here (Dedysh, 2002). An oxi-dation efficiency of this magnitude seems reasonable and hasbeen described before; e.g., peat cores from a fresh watermarsh reached up to 32 % oxidation efficiency under water-saturated conditions (Roslev and King, 1996).
Wetlands inhabited by vascular plants show plant-mediated CH4 transport as the predominant transport mech-anism (Van Der Nat and Middelburg, 1998), which may ac-count for up to two-thirds of the total flux in a water-saturatedpolygon center of the Siberian tundra (Kutzbach et al., 2004).The site used for the current study is characterized by anaverage density ofCarex aquatilisof 25 %. The downwardtransport of O2 of these plants is accompanied by an upwarddiffusion of CH4 from the rhizosphere along the concen-tration gradient (Lai, 2009). This passive transport mecha-nism is accompanied by isotopic fractionation resulting in theemission of lighter CH4 (Chanton and Whiting, 1996; Chasaret al., 1999). However, plant-mediated transport does not af-fect the CH4 efficiency calculations as the CH4 bypasses theaerobic layer and is therefore not available for oxidation.
Fractionation associated with diffusion can obscure cal-culations of total CH4 production and oxidation. Since theeffects of diffusion and oxidation on the isotopic signatureof the remaining gas phase are of opposite direction, ne-glecting diffusive fractionation by settingαtrans to 1 causesan underestimation of CH4 oxidation; a lighter isotopic sig-nature is observed that could misleadingly be interpreted asless oxidation efficiency. Therefore, the isotopic fractiona-tion factor of transport is subtracted from the fractionationof oxidation in the CH4 efficiency calculation. As a result,the calculated efficiency increases since the shift inδ13C val-ues is caused by a smaller difference betweenαox andαtrans.However, results show that isotope fractionation by diffusiononly plays a substantial role under unsaturated conditions.Thus, under water-saturated conditionsαtranscan be assumedto be 1. For the presented study sites of the polygonal tun-dra in the Siberian Lena River delta it seems plausible touse the meanαdiff = 1.013 under unsaturated conditions forCH4 oxidation efficiency calculations when diffusion is thepredominant transport mechanism sinceαdiff did not differsignificantly between sites. On the contrary, isotopic frac-tionation factors associated with oxidation differ strongly be-tween sites and need to be determined for each oxic horizonof interest. The isotopic fractionation factors presented in thecurrent study might be higher than under in situ conditionssince they were determined in laboratory experiments apply-ing high initial CH4 concentrations (Templeton et al., 2006).
Biogeosciences, 10, 2539–2552, 2013 www.biogeosciences.net/10/2539/2013/

I. Preuss et al.: Improved quantification of microbial CH4 oxidation 2549
As previously mentioned by Nihous (2010), the calculatedoxidation efficiency is only as reliable as the knowledge ofthe isotopic fractionation factors since slight variations in theadoptedαox andαtrans change the outcome strongly. Espe-cially under unsaturated conditions, the predominant trans-port mechanism has to be considered to obtain trustworthyoxidation efficiency values. Here, supplemental CH4 emis-sion measurements might help.
Including temperature-dependent corrections for the iso-topic fractionation factors into the oxidation efficiency cal-culations results in higher oxidation efficiencies. Tyler etal. (1994) showed that the correlation between temperatureand isotopic fractionation factor decreased with soil depthranging between 4.3–5.0× 10⁻⁴ ◦C−1. Further, Knoblauchet al. (2008) found with SI probing of microbial PLFAs thatthe community active in situ is dominated by type I methan-otrophs and that rising temperatures increase the importanceof type II in soils of the same area. Type II bacteria showa lower CH4 oxidation activity and a lowerαox than type I(Zyakun and Zakharchenko, 1998). Differences in the car-bon isotopic fractionation are due to the type of methanemonooxygenase (MMO) expressed by the cells, the mech-anism for assimilation of cell carbon and the type of cellularphysiology (Jahnke et al., 1999). Each process of the firstCH4 oxidation step (adsorption and desorption from the cellwall and conversion to methanol) may proceed at a specificrate with a specific isotopic fractionation (Nihous, 2010).Thus, it is assumed that microbial communities of differentecosystems react unequally to temperature, and universal ap-plications of correction factors seem problematic. Nonethe-less, it is likely thatαox is directly influenced by soil temper-ature, and neglecting it might underestimate the CH4 oxida-tion efficiency.
The presented study shows that isotope fractionation bydiffusion could play an important role in wetland soils underunsaturated conditions resulting in higher calculated CH4 ox-idation efficiencies. However, these calculations have beenconducted withδ13C profiles of water-saturated conditions.Thus, future measurements and CH4 oxidation efficiency cal-culations need to be conducted for different water level con-ditions of the studied sites as they drive the strength of oxi-dation processes.
5 Conclusions
The isotopic fractionation factors presented here enable thecalculation of the potential CH4 oxidation efficiency in arc-tic wetland soils. To determine CH4 oxidation efficiency, theisotopic fractionation factors associated with oxidation needto be determined for the oxic horizons of the site of inter-est since they strongly differ from site to site and horizon tohorizon. Furthermore, the contribution of diffusion to othersimultaneously occurring transport mechanisms has to be es-timated by means of the interpretation of unsaturated/water-
saturated conditions and both the CH4 concentration and SIsoil profiles. A mean value ofαdiff = 1.013 may be appliedfor the investigated polygonal tundra sites under unsaturatedconditions, while under water saturationαdiff = 1.001 can beused. The experimental setup to determine the potential CH4oxidation efficiency at 4◦C gives conservative estimates. Iffeasible, isotopic fractionation factors should be determinedat temperatures occurring in situ. To deepen the understand-ing of CH4 oxidation efficiencies of northern wetland soils,it is essential to study soils of different hydrological regimes.These calculations could then provide the basis for an im-proved estimation of current CH4 sources and sinks andtheir potential strength in response to environmental changeand global warming, especially in permafrost-affected soils,which bear the potential to cause a positive feedback to cli-mate change.
Acknowledgements.The authors would like to thank the membersof the joint Russian–German expeditions LENA 2009 and 2010 andthe staff of the Alfred Wegener Institute, Research Unit Potsdam,for logistical, technical and administrative support. Special thanksgo to Susanne Liebner for the O2 profile measurements and toSvetlana Evgrafova for additional pore-water sampling in 2010.Birgit Schwinge, Volker Kleinschmidt and Stephanie Langer fromthe Institute of Soil Science are acknowledged for their help withlaboratory analyses and Benjamin Runkle for editing the English.This project is funded by the German Science Foundation throughthe Cluster of Excellence Integrated Climate System Analysis andPrediction (CliSAP), KlimaCampus Hamburg.
Edited by: P. Overduin
References
Akerman, H. J. and Johansson, M.: Thawing permafrost and thickeractive layers in sub-arctic Sweden, Permafrost Periglac., 19,279–292, 2008.
Anisimov, O. A.: Potential feedback of thawing permafrost to theglobal climate system through methane emission, Environ. Res.Lett., 2, 1–7,doi:10.1088/1748-9326/2/4/045016, 2007.
Barker, J. F. and Fritz, P.: Carbon isotope fractionation during mi-crobial methane oxidation, Nature, 293, 289–291, 1981.
Bergamaschi, P., Lubina, C., Konigstedt, R., Fischer, H., Veltkamp,A. C., and Zwaagstra, O.: Stable isotopic signatures (delta C–13,delta D) of methane from European landfill sites, J. Geophys.Res.-Atmos., 103, 8251–8265, 1998.
Blazewicz, S. J., Petersen, D. G., Waldrop, M. P., and Firestone, M.K.: Anaerobic oxidation of methane in tropical and boreal soils:Ecological significance in terrestrial methane cycling, J. Geo-phys. Res.-Biogeosci., 117, G02033, blackboxPlease provide doilink., 2012.
www.biogeosciences.net/10/2539/2013/ Biogeosciences, 10, 2539–2552, 2013

2550 I. Preuss et al.: Improved quantification of microbial CH4 oxidation
Boike, J., Wille, C., and Abnizova, A.: Climatology and summerenergy and water balance of polygonal tundra in the Lena RiverDelta, Siberia, J. Geophys. Res.-Biogeo., 113, 1–15, G03025,doi:10.1029/2007JG000540, 2008.
Brand, W. A.: PreCon: A Fully Automated Interface for the Pre-GcConcentration of Trace Gases on Air for Isotopic Analysis, Isot.Environ. Healt. S., 31, 277–284, 1995.
Braun-Blanquet, J.: Pflanzensoziologie, Springer, Wien, 1964.Cabral, A. R., Capanema, M. A., Gebert, J., Moreira, J. F., and Jug-
nia, L. B.: Quantifying Microbial Methane Oxidation Efficien-cies in Two Experimental Landfill Biocovers Using Stable Iso-topes, Water Air Soil Poll., 209, 157–172,doi:10.1007/s11270-009-0188-4, 2010.
Chanton, J. P.: The effect of gas transport on the isotope sig-nature of methane in wetlands, Org. Geochem., 36, 753–768,doi:10.1016/j.orggeochem.2004.10.007, 2005.
Chanton, J. P. and Whiting, G. J.: Methane stable isotopic distri-butions as indicators of gas transport mechanisms in emergentaquatic plants, Aquat. Bot., 54, 227–236, 1996.
Chanton, J. P., Rutkowski, C. M., and Mosher, B.: QuantifyingMethane Oxidation from Landfills Using Stable Isotope Analysisof Downwind Plumes, Envir. Sci. Tech., 33, 3755–3760, 1999.
Chanton, J. P., Glaser, P. H., Chasar, L. S., Burdige, D. J., Hines,M. E., Siegel, D. I., Tremblay, L. B., and Cooper, W. T.:Radiocarbon evidence for the importance of surface vegeta-tion on fermentation and methanogenesis in contrasting typesof boreal peatlands, Global Biogeochem. Cy., 22, GB4022,doi:10.1029/2008gb003274, 2008a.
Chanton, J. P., Powelson, D. K., Abichou, T., Fields, D., and Green,R.: Effect of Temperature and Oxidation Rate on Carbon-isotopeFractionation during Methane Oxidation by Landfill Cover Mate-rials, Envir. Sci. Tech., 42, 7818–7823,doi:10.1021/es801221y,2008b.
Chasar, L. S., Chanton, J. P., Glaser, P. H., and Siegel, D. I.: Methaneconcentration and stable isotope distribution as evidence of rhi-zospheric processes: Comparison of a fen and bog in the GlacialLake Agassiz Peatland complex, XVIth International BotanicalCongress, St Louis, Missouri, ISI:000089309600023, 655–663,1999.
Coleman, D. D., Risatti, J. B., and Schoell, M.: Fractionation ofcarbon and hydrogen isotopes by methane-oxidizing bacteria,Geochim. Cosmochim. Ac., 45, 1033–1037, 1981.
Coward, H. F. and Georgeson, E. H. M.: 226, The diffusion coeffi-cient of methane and air, J. Chem. Soc. (Resumed), 1085–1087,226,doi:10.1039/JR9370001085, 1937.
Curry, C. L.: The consumption of atmospheric methane by soilin a simulated future climate, Biogeosciences, 6, 2355–2367,doi:10.5194/bg-6-2355-2009, 2009.
De Visscher, A., Thomas, D., Boeckx, P., and Van Cleem-put, O.: Methane Oxidation in Simulated Landfill CoverSoil Environments, Envir. Sci. Tech., 33, 1854–1859,doi:10.1021/es9900961, 1999.
De Visscher, A., De Pourcq, I., and Chanton, J.: Isotopefractionation effects by diffusion and methane oxidation inlandfill cover soils, J. Geophys. Res.-Atmos., 109, 1–8,doi:10.1029/2004jd004857, 2004.
Dedysh, S. N.: Methanotrophic Bacteria of AcidicSphagnum Peat Bogs, Microbiology, 71, 638–650,doi:10.1023/a:1021467520274, 2002.
Dlugokencky, E. J., Bruhwiler, L., White, J. W. C., Emmons, L.K., Novelli, P. C., Montzka, S. A., Masarie, K. A., Lang, P. M.,Crotwell, A. M., Miller, J. B., and Gatti, L. V.: Observational con-straints on recent increases in the atmospheric CH4 burden, Geo-phys. Res. Lett., 36, 1–5, L18803,doi:10.1029/2009gl039780,2009.
Duenas, C., Fernandez, M. C., Carretero, J., Perez, M., and Liger,E.: Consumption of methane by soils, Environ. Monit. Assess.,31, 125–130,doi:10.1007/bf00547187, 1994.
Fiedler, S., Wagner, D., Kutzbach, L., and Pfeiffer, E. M.: Ele-ment redistribution along hydraulic and redox gradients of low-centered polygons, Lena Delta, northern Siberia, Soil ScienceSociety of America Journal, 68, 1002-1011, 2004.
Forster, P., Ramaswamy, V., Artaxo, P., Berntsen, T., Betts, R., Fa-hey, D. W., Haywood, J., Lean, J., Lowe, D. C., Myhre, G.,Nganga, J., Prinn, R., Raga, G., Schulz, M., and Van Dorland,R.: Changes in Atmospheric Constituents and in Radiative Forc-ing, in: Climate Change 2007: The Physical Science Basis, Con-tribution of Working Group I to the Fourth Assessment Reportof the Intergovernmental Panel on Climate Change, edited by:Solomon, S., Qin, D., Manning, M., Chen, Z., Marquis, M., Av-eryt, K. B., Tignor, M., and Miller, H. L., Cambridge, UK andNY, NY, USA, 2007.
French, H. M.: The Periglacial Environment, 2nd Edn., LongmanSingapore, 376 pp., 1996.
Gebert, J., Groengroeft, A., and Miehlich, G.: Kinetics of microbiallandfill methane oxidation in biofilters, Waste Manage., 23, 609–619, 2003.
Gebert, J., Groengroeft, A., and Pfeiffer, E.-M.: Relevance of soilphysical properties for the microbial oxidation of methane inlandfill covers, Soil Biol. Biochem., 43, 1759–1767, 2011.
Gomez, K., Gonzalez-Gil, G., Schroth, M. H., and Zeyer, J.: Trans-port of methane and noble gases during gas push-pull tests invariably saturated porous media, Envir. Sci. Tech., 42, 2515–2521,doi:10.1021/es072036y, 2008.
Happell, J. D., Chanton, J. P., and Showers, W. S.: The influence ofmethane oxidation on the stable isotopic composition of methaneemitted from Florida swamp forests, Geochim. Cosmochimi.Ac., 58, 4377–4388, 1994.
Huber-Humer, M., Roder, S., and Lechner, P.: Approaches to assessbiocover performance on landfills, Waste Manage., 29, 2092–2104,doi:10.1016/j.wasman.2009.02.001, 2009.
Jahnke, L. L., Summons, R. E., Hope, J. M., and Des Marais, D.J.: Carbon isotopic fractionation in lipids from methanotrophicbacteria II: the effects of physiology and environmental param-eters on the biosynthesis and isotopic signatures of biomarkers,Geochim. Cosmochim. Ac., 63, 79–93, 1999.
Joabsson, A., Christensen, T. R., and Wallen, B.: Vascular plant con-trols on methane emissions from northern peatforming wetlands,Trends Ecol. Evol., 14, 385–388, 1999.
Kamal, S. and Varma, A.: Peatland Microbiology, in: Microbiologyof Extreme Soils, edited by: Dion, P., and Nautiyal, C. S., SoilBiology, Springer Berlin Heidelberg, 177–203, 2008.
Keppler, F., Hamilton, J. T. G., Brass, M., and Rockmann, T.:Methane emissions from terrestrial plants under aerobic condi-tions, Nature, 439, 187–191,doi:10.1038/nature04420, 2006.
Knoblauch, C., Zimmermann, U., Blumenberg, M., Michaelis,W., and Pfeiffer, E. M.: Methane turnover and temperatureresponse of methane-oxidizing bacteria in permafrost-affected
Biogeosciences, 10, 2539–2552, 2013 www.biogeosciences.net/10/2539/2013/
I. Preuss et al.: Improved quantification of microbial CH4 oxidation 2551
soils of northeast Siberia, Soil Biol. Biochem., 40, 3004–3013,doi:10.1016/j.soilbio.2008.08.020, 2008.
Knox, M., Quay, P. D., and Wilbur, D.: Kinetic IsotopicFractionation During Air-Water Gas Transfer of O2, N2,CH4, and H2, J. Geophys. Res.-Oceans, 97, 20335–20343,doi:10.1029/92jc00949, 1992.
Kutzbach, L., Wagner, D., and Pfeiffer, E. M.: Effect of microreliefand vegetation on methane emission from wet polygonal tundra,Lena Delta, Northern Siberia, Biogeochemistry, 69, 341–362,2004.
Laanbroek, H. J.: Methane emission from natural wetlands:interplay between emergent macrophytes and soil micro-bial processes, A mini-review, Ann. Bot., 105, 141–153,doi:10.1093/aob/mcp201, 2010.
Lai, D. Y. F.: Methane Dynamics in Northern Peatlands: A Review,Pedosphere, 19, 409–421, 2009.
Liebner, S., Zeyer, J., Wagner, D., Schubert, C., Pfeiffer, E.-M.,and Knoblauch, C.: Methane oxidation associated with sub-merged brown mosses reduces methane emissions from Siberianpolygonal tundra, J. Ecol., 99, 914–922,doi:10.1111/j.1365-2745.2011.01823.x, 2011.
Liptay, K., Chanton, J., Czepiel, P., and Mosher, B.: Use of stableisotopes to determine methane oxidation in landfill cover soils, J.Geophys. Res.-Atmos., 103, 8243–8250, 1998.
Mahieu, K., De Visscher, A., Vanrolleghem, P. A., and Van Cleem-put, O.: Modelling of stable isotope fractionation by methane ox-idation and diffusion in landfill cover soils, Waste Management,28, 1535–1542,doi:10.1016/j.wasman.2007.06.003, 2008.
McKinney, C. R., McCrea, J. M., Epstein, S., Allen, H. A., andUrey, H. C.: Improvements in mass spectrometers for the mea-surement of small differences in isotope abundance ratios, Rev.Sci. Instrum., 21, 724–730,doi:10.1063/1.1745698, 1950.
Monson, K. D. and Hayes, J. M.: Biosynthetic control of the nat-ural abundance of carbon 13 at specific positions within fattyacids in Escherichia coli, Evidence regarding the coupling offatty acid and phospholipid synthesis, J. Biol. Chem., 255, 1435–1441, 1980.
Nauer, P. A. and Schroth, M. H.: In Situ Quantification of Atmo-spheric Methane Oxidation in Near-Surface Soils, Vadose ZoneJ., 9, 1052–1062,doi:10.2136/vzj2009.0192, 2010.
Nihous, G. C.: Notes on the temperature dependenceof carbon isotope fractionation by aerobic CH4-oxidising bacteria, Isot. Environ. Healt. S., 46, 133–140,doi:10.1080/10256016.2010.488724, 2010.
Nozhevnikova, A., Glagolev, M., Nekrasova, V., Einola, J., Sor-munen, K., and Rintala, J.: The analysis of methods for mea-surement of methane oxidation in landfills, Water Sci. Technol.,48, 45–52, 2003.
Powelson, D. K., Charlton, J. P., and Abichou, T.: Methaneoxidation in biofilters measured by mass-balance and sta-ble isotope methods, Envir. Sci. Technol., 41, 620–625,doi:10.1021/es061656g, 2007.
Rayleigh, J. W. S.: Theoretical Considerations respecting the Sepa-ration of Gases by Diffusion and Similar Processes, Philos. Mag.,42, 493–498, 1896.
Reeburgh, W. S., Hirsch, A. I., Sansone, F. J., Popp, B. N., and Rust,T. M.: Carbon kinetic isotope effect accompanying microbial ox-idation of methane in boreal forest soils, Geochim. Cosmochim.Ac., 61, 4761–4767, 1997.
Richards, L. A. and Fireman, M.: Pressure plate apparatus for mea-suring moisture sorption and transmission by soil, Soil Sci., 56,395–404, 1943.
Rolston, D. E.: Gas diffusivity, in: Methods of Soil Analysis, Part1. Physical and Minerological Methods – Agronomy MonographNo. 9, 2nd Edn., American Society of Agronomy – Soil Sci. Soc.America, 1986.
Roslev, P. and King, G. M.: Regulation of methane oxidation ina freshwater wetland by water table changes and anoxia, FemsMicrobiol. Ecol., 19, 105–115, 1996.
Scheutz, C., Kjeldsen, P., Bogner, J. E., De Visscher, A., Gebert,J., Hilger, H. A., Huber-Humer, M., and Spokas, K.: Micro-bial methane oxidation processes and technologies for mitiga-tion of landfill gas emissions, Waste Manage. Res., 27, 409–455,doi:10.1177/0734242x09339325, 2009.
Schneider, J., Grosse, G., and Wagner, D.: Land cover classifi-cation of tundra environments in the Arctic Lena Delta basedon Landsat 7 ETM+ data and its application for upscalingof methane emissions, Remote Sens. Environ., 113, 380–391,doi:10.1016/j.rse.2008.10.013, 2009.
Schuur, E. A. G., Vogel, J. G., Crummer, K. G., Lee, H., Sickman,J. O., and Osterkamp, T. E.: The effect of permafrost thaw onold carbon release and net carbon exchange from tundra, Nature,459, 556–559, 2009.
Segers, R.: Methane production and methane consumption: a reviewof processes underlying wetland methane fluxes, Biogeochem-istry, 41, 23–51, 1998.
Seibt, A., Hoth, P., and Naumann, D.: Gas solubility in formationwaters of the North German Basin – implications for geothermalenergy recovery, in: Proceedings World Geothermal Congress2000, Kyushu-Tohoku, Japan, 1713–1718, 2000.
Streese-Kleeberg, J., Rachor, I., Gebert, J., and Stegmann, R.: Useof gas push-pull tests for the measurement of methane oxidationin different landfill cover soils, Waste Manage., 31, 995–1001,2011.
Sundh, I., Mikkela, C., Nilsson, M., and Svensson, B. H.: Potentialaerobic methane oxidation in a Sphagnum-dominated peatland,Controlling factors and relation to methane emission, Soil Biol.Biochem., 27, 829–837, 1995.
Tagesson, T., Molder, M., Mastepanov, M., Sigsgaard, C., Tam-storf, M. P., Lund, M., Falk, J. M., Lindroth, A., Christensen, T.R., and Strom, L.: Land-atmosphere exchange of methane fromsoil thawing to soil freezing in a high-Arctic wet tundra ecosys-tem, Glob. Change Biol., 18, 1928–1940,doi:10.1111/j.1365-2486.2012.02647.x, 2012.
Tarnocai, C., Canadell, J. G., Schuur, E. A. G., Kuhry, P., Mazhi-tova, G., and Zimov, S.: Soil organic carbon pools in the north-ern circumpolar permafrost region, Glob. Biogeochem. Cy., 23,doi:10.1029/2008gb003327, 2009.
Teh, Y. A., Silver, W. L., Conrad, M. E., Borglin, S. E., and Carlson,C. M.: Carbon isotope fractionation by methane-oxidizing bac-teria in tropical rain forest soils, J. Geophys. Res., 111, G02001,doi:10.1029/2005jg000053, 2006.
Templeton, A. S., Chu, K. H., Alvarez-Cohen, L., and Conrad, M.E.: Variable carbon isotope fractionation expressed by aerobicCH4-oxidizing bacteria, Geochim.t Cosmochim. Ac., 70, 1739–1752,doi:10.1016/j.gca.2005.12.002, 2006.
Tyler, S. C., Crill, P. M., and Brailsford, G. W.:13C/12C Fraction-ation of methane during oxidation in a temperate forested soil,
www.biogeosciences.net/10/2539/2013/ Biogeosciences, 10, 2539–2552, 2013
2552 I. Preuss et al.: Improved quantification of microbial CH4 oxidation
Geochim. Cosmochim. Ac., 58, 1625–1633, 1994.Urmann, K., Gonzalez-Gil, G., Schroth, M. H., and Zeyer, J.: Quan-
tification of microbial methane oxidation in an alpine peat bog,Vadose Zone J., 6, 705–712,doi:10.2136/vzj2006.0185, 2007.
USDA: Keys to Soil Taxonomy, 11th Edn., edited by: Service, N. R.C., United States Department of Agriculture, Soil Survey Staff,2010.
Van Der Nat, F.-J. W. A., and Middelburg, J. J.: Effects of two com-mon macrophytes on methane dynamics in freshwater sediments,Biogeochemistry, 43, 79–104,doi:10.1023/a:1006076527187,1998.
Walter, K. M., Smith, L. C., and Chapin, F. S.: Methane bub-bling from northern lakes: present and future contributions tothe global methane budget, Philos. T. R. Soc., 365, 1657–1676,doi:10.1098/rsta.2007.2036, 2007.
Wang, J. S., Logan, J. A., McElroy, M. B., Duncan, B. N., Megret-skaia, I. A., and Yantosca, R. M.: A 3-D model analysis of theslowdown and interannual variability in the methane growth ratefrom 1988 to 1997, Global Biogeochem. Cy., 18, 1–30, GB3011,doi:10.1029/2003gb002180, 2004.
Whalen, S. C.: Biogeochemistry of methane exchange between nat-ural wetlands and the atmosphere, Environ. Eng. Sci., 22, 73–94,2005.
Wille, C., Kutzbach, L., Sachs, T., Wagner, D., and Pfeiffer, E. M.:Methane emission from Siberian arctic polygonal tundra: eddycovariance measurements and modeling, Global Change Biol.,14, 1395–1408,doi:10.1111/j.1365-2486.2008.01586.x, 2008.
WRB, I. W. G.: World reference base for soil resources 2006,Food and Agriculture Organization of the United Nations, Rome,2006.
Yamamoto, S., Alcauskas, J. B., and Crozier, T. E.: Solubility ofMethane in Distilled Water and Seawater, J. Chem. Eng. Data,21, 78–80,doi:10.1021/je60068a029, 1976.
Zubrzycki, S., Kutzbach, L., Grosse, G., Desyatkin, A., and Pfeiffer,E.-M.: Organic Carbon and Total Nitrogen Stocks in Soils of theLena River Delta, Biogeosciences, accepted, 2013.
Zyakun, A. M. and Zakharchenko, V. N.: Carbon isotope discrimi-nation by methanotrophic bacteria: Practical use in biotechnolog-ical research (review), Appl. Biochem. Microbiol., 34, 207–219,1998.
Biogeosciences, 10, 2539–2552, 2013 www.biogeosciences.net/10/2539/2013/