Embed Size (px)
Citation preview

Louisiana State UniversityLSU Digital Commons
LSU Doctoral Dissertations Graduate School
2017
Improved Protein Characterizations using IonicLiquids: PAGE and MALDI-MSPunprabhashi VidanapathiranaLouisiana State University and Agricultural and Mechanical College, [email protected]
Follow this and additional works at: https://digitalcommons.lsu.edu/gradschool_dissertations
Part of the Chemistry Commons
This Dissertation is brought to you for free and open access by the Graduate School at LSU Digital Commons. It has been accepted for inclusion inLSU Doctoral Dissertations by an authorized graduate school editor of LSU Digital Commons. For more information, please [email protected].
Recommended CitationVidanapathirana, Punprabhashi, "Improved Protein Characterizations using Ionic Liquids: PAGE and MALDI-MS" (2017). LSUDoctoral Dissertations. 4234.https://digitalcommons.lsu.edu/gradschool_dissertations/4234

IMPROVED PROTEIN CHARACTERIZATIONS USING IONIC
LIQUIDS: PAGE AND MALDI-MS
A Dissertation
Submitted to the Graduate Faculty of the
Louisiana State University and
Agricultural and Mechanical College
in partial fulfillment of the
requirements for the degree of
Doctor of Philosophy
in
The Department of Chemistry
by
Punprabhashi Vidanapathirana
B.S., University of Colombo, Sri Lanka, 2010
August 2017

ii
DEDICATION
I dedicate this work to my beloved parents, the reason for whom I am today and to my wonderful
husband, who supported me to achieve this goal with his eternal love and care

iii
ACKNOWLEDGMENTS
I appreciate all the people in graduate school who helped me to achieve my goals, especially:
Prof. Isiah M. Warner, my Ph.D. advisor for his proper guidance, support, encouragement, and
care throughout the Ph.D. program.
Prof. Doug Gilman, Prof. Megan Macnaughtan, and Prof. Chandra Theegala for serving as my
doctoral Committee and valuable support towards my dissertation.
Dr. Farhana Hasan for introducing me to protein separation studies and guidance throughout my
projects.
Prof. Anne Grove for her assistance with protein separation technique development and valuable
suggestions.
Prof. Kermit Murray for helpful comments and suggestions on protein detection studies using
MALDI mass spectrometry.
Dr. Jack Losso and Dr. Samuel Washington for their contributions with IEF technique
development.
Dr. Noureen Siraj, Dr. Susmita Das, Dr. Girija Sahasrabudhe, Dr. Pratap Chhotaray, and Dr.
Rocio Perez for their valuable discussions on projects.
Anuja Pande for her contribution on cationic gel electrophoresis technique development.
Kaitlyn Mussio, Michael Brands, and Abdul-Rahman Ezzir for their contributions on
experiments.
Past and present Warner Research Group for their helpful comments and suggestions.
Funding source for projects, National Science Foundation

iv
TABLE OF CONTENTS
ACKNOWLEDGMENTS ....................................................................................................... iii
LIST OF TABLES ................................................................................................................. viii
LIST OF FIGURES ................................................................................................................. ix
LIST OF SCHEMES.............................................................................................................. xiii
LIST OF ABBREVIATIONS ................................................................................................ xiv
ABSTRACT ........................................................................................................................... xvi
CHAPTER 1: INTRODUCTION ............................................................................................. 1
1.1. Background .................................................................................................................... 1
1.2. Protein Structure ............................................................................................................. 2
1.2.1. Protein Primary Structure .................................................................................. 2
1.2.2. Protein Secondary Structure .............................................................................. 3
1.2.3. Protein Tertiary Structure .................................................................................. 4
1.3. Protein Stability .............................................................................................................. 5
1.4. Protein Separation .......................................................................................................... 6
1.4.1. Polyacrylamide Gel Electrophoresis (PAGE) ................................................... 6
1.4.2. Ionic Liquids .................................................................................................... 10
1.4.3. Ionic Liquid-based Surfactants in Protein Separation ..................................... 11
1.5. Protein Identification .................................................................................................... 12
1.5.1. Protein Identification by MALDI-MS ............................................................. 12
1.6. Instrumentation Techniques ......................................................................................... 14
1.6.1. Polyacrylamide Gel Electrophoresis (PAGE) ................................................. 14
1.6.2. Isoelectric Focusing (IEF) ............................................................................... 15
1.6.3. Fluorescence Spectroscopy .............................................................................. 16
1.6.4. Circular Dichroism (CD) ................................................................................. 19
1.6.5. Matrix Assisted Laser Desorption Ionization (MALDI)-Mass Spectrometry
(MS) ................................................................................................................. 20
1.7. Scope of Dissertation ................................................................................................... 21
1.8. References .................................................................................................................... 22

v
CHAPTER 2: IONIC LIQUIDS AS BUFFER ADDITIVES IN IONIC
LIQUID-POLYACRYLAMIDE GEL ELECTROPHORESIS
SEPARATION OF MIXTURES OF LOW AND HIGH
MOLECULAR WEIGHT PROTEINS ............................................................ 31
2.1. Introduction .................................................................................................................. 31
2.2. Experimental Section ................................................................................................... 34
2.2.1. Materials .......................................................................................................... 34
2.2.2. Synthesis and Characterization of Ionic Liquid Surfactants ........................... 34
2.2.3. Critical Micelle Concentration (CMC) ............................................................ 36
2.2.4. Instrumentation ................................................................................................ 36
2.2.5. Binding Parameters.......................................................................................... 37
2.2.6. Electrophoretic Separation .............................................................................. 38
2.3. Results and Discussion ................................................................................................. 39
2.3.1. Critical Micelle Concentration ........................................................................ 39
2.3.2. Separation of Proteins by ILS-PAGE .............................................................. 41
2.3.3. Comparison of ILS-PAGE and SDS-PAGE .................................................... 42
2.3.4. Factors Affecting the Separation of Protein Mixture in ILS-PAGE ............... 44
2.3.5. Separation Mechanism of ILS-PAGE ............................................................. 46
2.3.6. Fluorescence Studies ....................................................................................... 48
2.3.7. Protein Denaturation Monitored by CD Studies.............................................. 53
2.4. Conclusions .................................................................................................................. 55
2.5. References .................................................................................................................... 55
CHAPTER 3: CATIONIC IONIC LIQUID SURFACTANT-POLYACRYLAMIDE
GEL ELECTROPHORESIS FOR ENHANCED SEPARATION OF
ACIDIC AND BASIC PROTEINS WITH SINGLE-STEP
RIBONUCLEASE B GLYCOFORMS SEPARATION ................................. 60 3.1. Introduction .................................................................................................................. 60
3.2. Materials and Methods ................................................................................................. 64
3.2.1. Materials .......................................................................................................... 64
3.2.2. Ionic Liquid Surfactants Synthesis .................................................................. 64
3.2.3. Instrumentation ................................................................................................ 64
3.2.4. Sample Buffer Preparation for ILS-PAGE ...................................................... 65
3.2.5. Protein Sample Preparation for ILS-PAGE ..................................................... 65
3.2.6. Running Buffer Preparation for ILS-PAGE .................................................... 66
3.2.7. ILS Discontinuous Gel Preparation ................................................................. 66
3.2.8. Cationic ILS-PAGE Experiment ..................................................................... 66

vi
3.2.9. Anionic SDS-PAGE ........................................................................................ 67
3.2.10. MALDI-MS Analysis of Ribonuclease b Protein Bands ................................. 67
3.2.11. Two Dimensional IEF/SDS PAGE Analysis of Ribonuclease b Protein ........ 68
3.3. Results and Discussion ................................................................................................. 69
3.3.1. Optimization of Ionic Liquid Surfactant Concentration in Cationic PAGE .... 69
3.3.2. Separation of Ribonuclease b Glycoforms in ILS-PAGE and Comparison
with SDS-PAGE .............................................................................................. 75
3.3.3. IEF/SDS-PAGE reveals Ngative Charge Heterogeneity on
Ribonuclease b Protein .................................................................................... 77
3.3.4. A Proposed Mechanism for Cationic ILS-PAGE ............................................ 78
3.4. Conclusions .................................................................................................................. 79
3.5. References .................................................................................................................... 80
CHAPTER 4: TWO DIMENSIONAL (2D) IEF/ILS-PAGE AS A TOOL FOR
COMPLEX PROTEIN SEPARATIONS ........................................................ 84
4.1. Introduction .................................................................................................................. 84
4.2. Materials and Methods ................................................................................................. 86
4.2.1. Materials .......................................................................................................... 86
4.2.2. Instrumentations .............................................................................................. 86
4.2.3. Ionic Liquid Surfactant Synthesis.................................................................... 87
4.2.4. Protein Sample Preparation, Rehydration, and Isoelectric Focusing (IEF) ..... 87
4.2.5. Sample Equilibration ....................................................................................... 87
4.2.6. Second Dimension-PAGE ............................................................................... 88
4.2.7. Gel Staining and Imaging ................................................................................ 88
4.3. Results and Discussion ................................................................................................. 88
4.3.1. IEF/ILS-PAGE of E. Coli Cell Lysate ............................................................ 88
4.3.2. Separation of Alpha-antityrpsin Protein Subunits by IEF/C4PBr-PAGE ........ 91
4.3.3. Separation of Cytochrome c Subunits by IEF/C4PBr-PAGE .......................... 93
4.4. Conclusions .................................................................................................................. 94
4.5. References .................................................................................................................... 95
CHAPTER 5: IONIC LIQUIDS AS SIGNAL ENHANCING MATRIX ADDITIVES
FOR PROTEIN ANALYSIS USING MALDI-MS ......................................... 98 5.1. Introduction .................................................................................................................. 98
5.2. Experimental Section ................................................................................................. 100
5.2.1. Materials ........................................................................................................ 100

vii
5.2.2. Ionic Liquid Synthesis ................................................................................... 101
5.2.3. Sample Preparation for Protein Analysis ....................................................... 101
5.2.4. Tissue Sample Preparation ............................................................................ 101
5.2.5. Instrumentation .............................................................................................. 102
5.3. Results and Discussion ............................................................................................... 103
5.3.1. Surfactant Properties of C4PBr, C8PBr, SDS, and CTAB ............................. 103
5.3.2. Protein Sample Analysis ................................................................................ 104
5.3.3. Concentration Effects .................................................................................... 106
5.3.4. Sample Homogeneity .................................................................................... 108
5.3.5. Profile Mode Analysis of Rat Brain Tissue in the Presence of ILS .............. 111
5.4. Conclusions ................................................................................................................ 112
5.5. References .................................................................................................................. 113
CHAPTER 6: CONCLUSIONS AND FUTURE DIRECTIONS ........................................ 117 6.1. Conclusions ................................................................................................................ 117
6.2. Future Directions ........................................................................................................ 119
APPENDIX A: SUPPORTING INFORMATION FOR CHAPTER 3 ................................ 121
APPENDIX B: SUPPORTING INFORMATION FOR CHAPTER 5 ................................ 126
APPENDIX C: LETTER OF PERMISSION ....................................................................... 127
VITA ..................................................................................................................................... 129

viii
LIST OF TABLES
Table 2.1. CMC of ionic liquids; 1-butene-4-methylpyridiniumbromide (C4PBr),
1-octene- 4-methylpyridiniumbromide (C8PBr), and 1-undecene-4-
methylpyridiniumbromide(C11
PBr)……………………………………………..........41
Table 2.2 Types of cooperative binding for ILS in the low concentration region………………52
Table 3.1. Optimized ILS concentrations in C4PBr, C8PBr, and C11PBr-PAGE………………..74
Table 5.1. Structures, MW, and CMC values of each surfactant used in this study………...….103
Table 5.2. MALDI-MS signal intensities of BSA, Cyt c, and Tr proteins in
the presence of different concentrations of surfactants.
(ND*-A signal was not detected at this concentration of surfactant.)………………106
Table 5.3. Range, average, and relative standard deviations (R.S.D.) of protein
MALDI-MS intensities with different surfactants…………………………………..108

ix
LIST OF FIGURES
Figure 1.1. Primary structure of a protein with the N-terminus on left and the C-terminus on
right…………………………………………………………………………....….........2
Figure 1.2. Schematic diagram of an alpha helix and a beta sheet. Dotted lines in α-helix and
dashed lines in β-sheets represent hydrogen bonds, which stabilize the structures.
Source for the alpha helix-
(http://www.nslc.wustl.edu/courses/bio2960/labs/02Protein_structure/ps2011.htm).....3
Figure 1.3. Tertiary structure of Arabinose binding protein (A) (Source-
http://chemistry.umeche.maine.edu/CHY431/Proteins10.html) and quaternary
structure of a potassium ion channel protein from Streptomyces lividans (B)
(Source-
http://chemistry.umeche.maine.edu/MAT500/Proteins12.html)…………….………....4
Figure 1.4. The plot of estimated molecular weight from
SDS-PAGE (observed Mr) vs. molecular weight derived from the
amino acid sequence (formula Mr) for transmembrane proteins
running at formula Mr (n=28, black dots), slower than
formula Mr (n=48, red dots), and faster than formula Mr (n=92, green dots).44
….........8
Figure 1.5. Common cations; dialkylimidazolium (a), phosphonium (b),
N-alkylpyridinium (c), and alkylammonium (d) and anions;
hexafluorophosphate (e), tetrafluoroborate (f),
bis(trifluoromethanesulfonyl)imide (g),
bis(pentafluoroethanesulfonyl)imide (h), chloride (i), and bromide (j)……................11
Figure 1.6. Reaction for polyacrylamide gel polymerization………………………………..........14
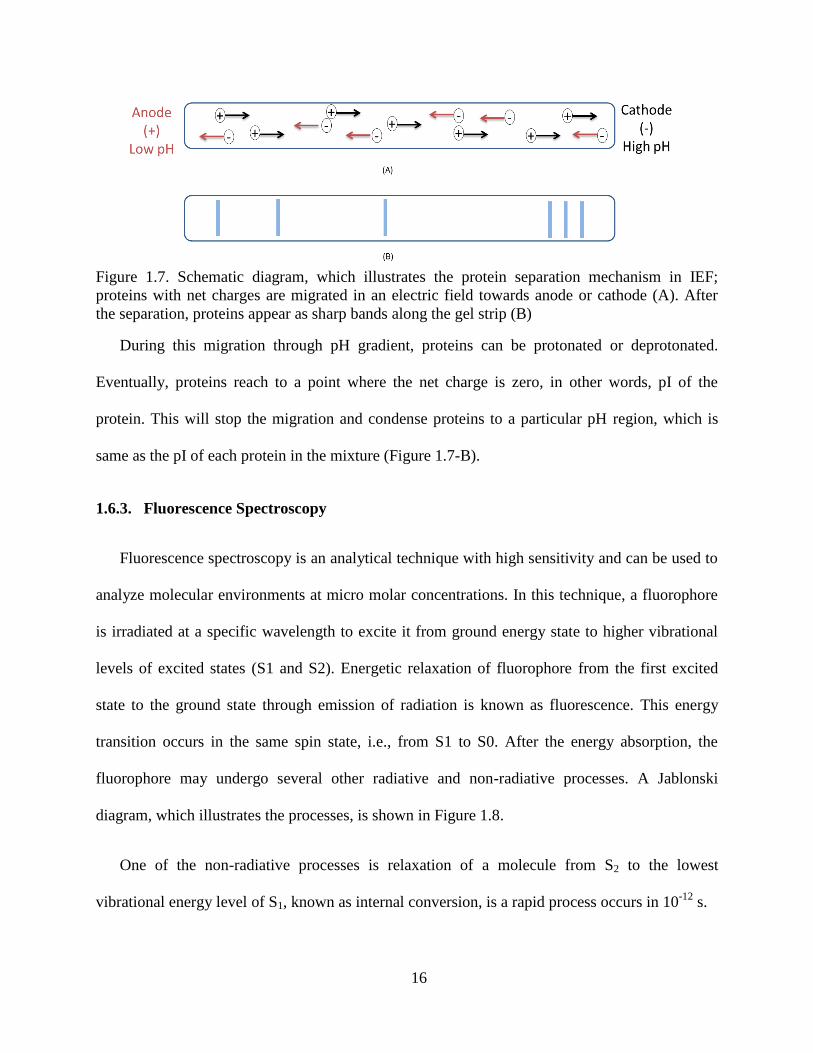
Figure 1.7. Schematic diagram, which illustrates the protein separation mechanism in IEF;
proteins with net charges are migrated in an electric field towards anode
or cathode (A). After the separation, proteins appear as sharp bands along
the gel strip (B)…………………………………………………………………….…16
Figure 1.8. Jablonski diagram, which shows possible radiative (solid lines) and
non-radiative (dashed lines) transitions…………………………………………........17
Figure 1.9. Major components of fluorescence spectrophotometer……………………………....18
Figure 1.10. The principle of Circular dichroism…………………………………………………..19
Figure 1.11. Schematic diagram, which shows the ionization process in MALDI-MS…………...20

x
Figure 2.1. Tensiometric analysis of CMC of C4PBr (A and D), C8PBr (B and E), C11PBr
(C and F) in water (A-C) and 25 mM Tris/glycine buffer (D-F) respectively…….….40
Figure 2.2. ILS-PAGE with 0.025% (w/v) C4PBr in protein mixture (1); Cat, 250 kDa (2);
Tf, 80 kDa (3); BSA, 66 kDa (4); Ova, 45 kDa (5); and α-Lact, 14 kDa (6)…….…...41
Figure 2.3. Separation of Cat (1), Tf (2), BSA (3), Ova (4), and α-Lact (5) in
C4PBr-PAGE (lanes A) and SDS-PAGE (lanes B)……………………………….......42
Figure 2.4. ILS-PAGE of protein mixture (Cat, 250 kDa; Tf, 80 kDa; BSA, 66 kDa;
Ova, 45 kDa; α-Lact, 14 kDa) with C4-C
11PBr concentration (w/v)
of (A) 0.025% (w/v) (B) 0.05% (C) 0.25% (D) 0.5% (E) 1% in
sample buffer, while running buffer concentration is 0.025% (w/v)
of C4PBr–C
11PBr………………..…………………………………………..……...…45
Figure 2.5. Effects of different concentrations (w/v) of C4PBr in running buffer (A) 0.1%,
(B) 0.05%, (C) 0.025%, and (D) 0.0125% for separation of protein mixture.
Sample buffer concentrations were kept constant at 0.025% (w/v) in A, B, C,
and D comparing 0.025% (w/v) (C) with ordinary SDS (E)……………….................46
Figure 2.6. Fluorescence wavelength maxima shift of Trp in the presence of
increasing concentration of C11PBr in association with BSA (10 uM),
determined by steady state fluorescence
( λex =295 nm, 25 ºC)…………………………………………………………….…..48
Figure 2.7. Effects of C11
PBr on the fluorescence intensity of BSA at different
NaCl concentration (0.1, 1 mol L-1
)…………………………………………….…….49
Figure 2.8. Fraction bound of C11
PBr (circles), C8PBr (triangles) and C
4PBr
(solid diamonds) to BSA (10 μM) with increasing concentration of
C11
PBr, C8PBr,(0-30 mM), C
4PBr ( 0-80 mM)……………………………….…........50
Figure 2.9. Scatchard plots of BSA with (A) C11
PBr, (B) C8PBr, (C) C
4PBr…………………….51
Figure 2.10. The CD spectra of BSA (10 μM) with increasing concentration of
C11PBr (A) SDS (B), in the presence of heated sample of 0.025% (w/v)
(0.86 mM) SDS and unheated 0.025% (w/v) (0.86 mM) C11PBr (C).
The buffer was 25mM Tris/192 mM Glycine at pH 8.4 and 25oC……………….......53
Figure 3.1. Cationic PAGE with 4-methylpyridinium-based ILS. (A) The generic
structure of the ILS with 4-methyl pyridinium cation and variable
alkyl chain lengths. (B) Formation of cationic ILS-protein
complex upon interaction between ILS and protein. (C) Stepwise
experiments in cationic ILS-PAGE ………………………………………………......70

xi
Figure 3.2. Polyacrylamide gel images obtained from C4PBr-PAGE showing
migrations of five proteins, (1) BSA (pI-4.8, 66 kDa),
(2) β-cas (pI-5.13, 23.6 kDa), (3) Myo (pI-6.8, 16.9 kDa),
(4) Rib b (pI-9.45, 14.7 kDa), and (5) Cyt c (pI-10, 12.3 kDa)
at different concentrations, (A) 0.02%, (B) 0.05%, (C) 0.1%, and
(D) 0.5%, (w/v) of C4PBr ILS in gels. C4PBr concentrations in
sample buffer (0.02% (w/v)) and running buffer (0.05% (w/v)) were
the same for all four gels…………………………………………………………..….71
Figure 3.3. C4PBr-PAGE separation of a mixture of five proteins; BSA (pI-4.8, 66 kDa),
Ova (pI-4.6, 44.3 kDa), α-Chy (pI-8.8, 25.7 kDa), Myo (pI-16.9, 14.7 kDa),
and Cyt c (pI-10, 12.3 kDa) from top to bottom in A-1, B-1, and C-1,
using different C4PBr running buffers; (A) 0.025% (w/v) (B) 0.05% (w/v),
and (C) 0.1% (w/v) and sample buffers; (1) 0.01% (2) 0.02%
(3) 0.05% (4) 2% (w/v) with 0.05% (w/v) C4PBr gels.
Note that Ova band disappears when high ILS concentrations were
included in sample buffers using all three running buffers…………………….…….73
Figure 3.4. Separation of mixture of five proteins; BSA (pI-4.8, 66 kDa),
Ova (pI-4.6, 44.3 kDa), α-Chy (pI-8.8, 25.7 kDa), Myo (pI-16.9, 14.7 kDa),
and Cyt c (pI-10, 12.3 kDa) using cationic PAGE, C4PBr-PAGE using
C4PBr ILS (0.05% (w/v) in gel, 0.01% (w/v) in sample buffer,
and 0.1% (w/v) in running buffer), C8PBr-PAGE using C8PBr ILS
(0.05% (w/v) in gel, 0.02% (w/v) in sample buffer, and 0.1% (w/v)
in running buffer), and C11PBr-PAGE using C11PBr ILS (0.05% (w/v)
in gel, 0.02% (w/v) in sample buffer, and 0.1% (w/v) in running buffer)
from left to right respectively………………………………………………………...75
Figure 3.5. Electropherogram of (A) cationic C4PBr -PAGE with C4PBr concentrations
of 0.05% (w/v) in gel, 0.02% (w/v) in sample buffer, and 0.05% (w/v)
in running buffer (B) MALDI mass spectra of 2 protein bands extracted
from Rib b (lane 4) (C) anionic SDS-PAGE. The same set of five proteins;
(1) BSA (pI-4.8, 66.5 kDa), (2) β-cas (pI-5.1, 23.6 kDa),
(3) Myo (pI-6.8, 16.9 kDa), (4) Rib b (pI-9.45, 14.7 kDa), and
(5) Cyt c (pI-10.0, 12.3 kDa) were used in both
SDS-PAGE and ILS-PAGE…………………………………………………………76
Figure 3.6 2D map (IEF/SDS-PAGE) of Rib b protein. IEF was carried out in
pH 3-10 range. Striated protein pattern reflect charge heterogeneity
of Rib b protein………………………………………………………………………77
Figure 3.7 The plot of Rf vs. log molecular weight of proteins; BSA (pI-4.8, 66 kDa),
Ova (pI-4.6, 44.3 kDa), α-Chy (pI-8.8, 25.7 kDa), Myo (pI-16.9, 14.7 kDa),
and Cyt c (pI-10, 12.3 kDa) separated by C4PBr-PAGE at
optimum C4PBr IL concentrations; 0.05% (w/v) in gel, 0.02% (w/v)
in sample buffer, and 0.1% (w/v) in running buffer…………………………………78

xii
Figure 4.1. 2D profiles of E. Coli cell lysates at different ILS concentrations in gels
(A) 0.02% (w/v) C4PBr (B) 0.05% (w/v) C4PBr (C) 0.02% (w/v) C8PBr
(D) 0.05% (w/v) C8PBr (E) 0.02% (w/v) C11PBr
(F) 0.05% (w/v) C11PBr. Number of spots obtained from imagej software
are labeled on each gel image.…………………………………………………..……90
Figure 4.2 2D profiles of E. Coli obtained from (A) IEF/C8PBr-PAGE and
(B) IEF/SDS-PAGE…………………………………………………………………..91
Figure 4.3. Separation of alpha-antitrypsin protein subunits by (A) IEF/C4PBr -PAGE
(B) IEF/SDS-PAGE, and (C) IEF/CTAB-PAGE……………………...…………......92
Figure 4.4. Separation of Cytochrome c subunits by (A) C4PBr-PAGE
(B) SDS-PAGE…………………………………………………………………….....94
Figure 5.1 MALDI mass spectra of (A) Cyt c (B) BSA and (C) Tr (1.0 × 10⁻⁵ M, 10 pmol
on the sample target) in the presence of different surfactants………………….……105
Figure 5.2. Optical microscopic images of Cyt C protein sample spots on the MALDI
target plate. The protein sample has prepared by using different
surfactants; (A) C4PBr (B) C8PBr (C) SDS (D) CTAB………………………..…....109
Figure 5.3. MALDI profiling mass spectra without ILS (upper) and with ILS (below)
for C4PBr (A and C) and C8PBr (B and D)………………………………….…...…111

xiii
LIST OF SCHEMES
Scheme 2.1 Reaction for the 4-methylpyridinium-based ionic liquid synthesis…………….35

xiv
LIST OF ABBREVIATIONS
α-CHCA Alpha cyanohydroxycinnamic acid
α-Chy Alpha chymotrypsinogen
α-Lac Alpha lactalbumin
β-cas Beta casein
BSA Bovine Serum albumin
Cat Catalase
CD Circular dichroism
CMC Critical micelle concentration
C4PBr 4-Butene-4-methylpyridinium bromide
C8PBr 8-Octene-4-methylpyridinium bromide
C11PBr 11-Unedcene-4-methylpyridinium bromide
CTAB Cetyltrimethylammonium bromide
Cyt c Cytochrome c
IEF Isoelectric focusing
ILs Ionic liquids
ILS Ionic liquid surfactants
IPG Immobiline pH gradient
PAGE Polyacrylamide gel electrophoresis
MALDI Matrix assisted laser desorption ionization
Myo Myoglobin
Ova Ovalbumin

xv
Rib b Ribonuclease b
SDS Sodium dodecyl sulfate
TOF Time-of-flight
Tr Transferrin
TCA Tricholoroacetic acid

xvi
ABSTRACT
Protein separation by polyacrylamide gel electrophoresis (PAGE) and identification by
matrix assisted laser desorption ionization-mass spectrometry (MALDI-MS) are primary tools of
protein analysis. In these techniques, surfactants are used in protein sample preparation in order
to enhance the protein solubility. Conventional surfactants have shown limitations in protein
analysis due to the structural complexity of proteomes, resulting in low resolution. The research
goal of this dissertation is to address some of these limitations by applying novel cationic ionic
liquid surfactants (ILS), N-alkyl-4-methyl pyridinium bromide (CnPBr where n=4, 8, 11). The
ILS would be suitable candidates to be used in PAGE protein separations as a result of positive
cooperative binding to proteins at low concentrations of ILS and protein denaturing ability at
room temperature. These compounds were used as buffer additives in ILS-PAGE protein
separation and matrix additives in MALDI-MS protein identification. Anionic ILS-PAGE was
used to separate a mixture of acidic proteins by applying ILS in sample and running buffers.
Protein separation was improved for transferrin and ovalbumin, which were resolved as multiple
bands of isoforms. In cationic ILS-PAGE, ILS were applied in polyacrylamide gels in addition to
sample and running buffers. Separation of both acidic and basic proteins as sharp bands with
high resolution is a major advancement of this technique. Cationic ILS-PAGE was used to
resolve ribonuclease b glycoforms as multiple protein bands. In contrast, the same protein was
migrated as a single band in Sodium dodecyl sulfate (SDS)-PAGE. Moreover, alpha antitrypsin
glycoforms were resolved as multiple spots by two dimensional (2D) Isoelectric focusing
(IEF)/ILS-PAGE. Furthermore, C4PBr and C8PBr ILS were applied as matrix additives with
MALDI matrix, α-cyanohydroxycinnamic acid (CHCA), to perform protein sample analysis as
well as rat brain tissue profiling. ILS showed high protein signal intensity at low concentrations

xvii
(0.02% (w/v)) in protein samples compared to SDS, cetyltrimethyl ammonium bromide (CTAB),
and no surfactants present (blank). A large number of new protein peaks were acquired from
tissue sample as compared to the absence of ILS in the matrix. These results show the
applicability of ILS in improved protein identification by MALDI imaging mass spectrometry.

1
CHAPTER 1: INTRODUCTION
1.1. Background
Proteins are essential macromolecules with diverse biological functions, such as enzyme
catalysis, regulation of biological activities as hormones, molecular transportation, act as
structural proteins, and involve in immunity reactions as antibodies in living organisms.1 Protein
structure and function are significantly affected by various disease stages2 and changes in
cellular environments.3 Hence, studies on proteins are essential to diagnose progression of
diseases and to discover new medicines.
Proteomics is the analysis of the whole protein content of a cell, tissue or an organism.4 The
proteome undergoes structural and functional changes based on different biological conditions
and pathological stages.5,6,7
Compared to the complexity of a genome, which codes a particular
proteome of a living organism, a proteome is more complex due to the additional post
translational modifications and alternate splicing during protein synthesis.4 Hence, proteome
analysis becomes extremely challenging even for a single cell. In order to analyze structural and
functional properties, a proteome should undergo a sequential analytical process known as
proteomic workflow. A typical proteomic work flow includes protein extraction from cells or
tissues, separation, purification, and identification.8 Solvent extraction
9 and solvent
precipitation10
are typical methods of protein extractions, while gel electrophoresis,11
IEF,12
and
liquid chromatography13
are some of the major tools used in protein separations and
purifications. Then protein identification is performed by use of mass spectrometry.14
Proteins with different structural and functional properties demand variable agents and
techniques to separate and identify them. For example, SDS-PAGE, the most common protein

2
separation technique, shows unexpected migration patterns for certain hydrophobic proteins due
to charge heterogeneity.15,11,16
Such proteins require separation techniques, which are more
compatible with protein charges and capable of denaturing complex protein structures. Similarly,
mass spectrometry identification of proteins, particularly in tissue analysis, often requires new
agents to improve protein signal intensity and resolution. As a result, a growing interest is being
placed on the development of novel techniques and agents that have capacity to enhance the
efficacy of protein separation and identification.
1.2. Protein Structure
Protein structures can be classified into several classes, primarily based on amino acid
sequences. Protein conformation, which results due to variable amino acid interactions,
determines the protein structure.17
1.2.1. Protein Primary Structure
Two termini of a polypeptide chain are identified as C-terminus and N-terminus, in which the
C-terminus is a carboxylic group and N-terminus is an amino group. The α-amino group of one
amino acid can react with the α-carboxyl group of the adjacent amino acid by a condensation
reaction. These bonds, known as peptide bonds, can link multiple amino acids to form linear
polypeptide chains, known as protein primary structures (Figure 1.1). Every protein has a unique
amino acid sequence in the primary structure.
Figure 1.1. Primary structure of a protein with the N-terminus on left and the C-terminus on right

3
1.2.2. Protein Secondary Structure
Spatial interactions between nearby amino acid residues in a primary structure leads to a
secondary structure. The two major types of protein secondary structure are α-helix and β- sheets
are shown in Figure 1.2.
Figure 1.2. Schematic diagram of an alpha helix and a beta sheet. Dotted lines in α-helix and
dashed lines in β-sheets represent hydrogen bonds, which stabilize the structures. Source for the
alpha helix- (http://www.nslc.wustl.edu/courses/bio2960/labs/02Protein_structure/ps2011.htm)
An α-helix is a spiral conformation that is tightly coiled in clockwise direction. The back-
bone of this conformation consists of the polypeptide chain contributing 3.6 amino acid residues
into one coiled turn. The stability of the conformation maintains by two factors. First and most
importantly, oxygen atoms of carbonyl groups hydrogen bond to hydrogen atoms of amino
groups, so each peptide makes two hydrogen bonds. The atoms involved in hydrogen bonds
linearly arranged through the entire length of the polypeptide chain to stabilize the conformation.

4
The other factor is the spatial separation of amino acid side chains (R groups) by projecting them
outward from the backbone. (See α-helix structure in Figure 1.2)
Beta-sheet conformation of protein secondary structure occurs when polypeptide strands
closely lie on top of each other. The conformation stabilizes by lateral hydrogen bonding
interactions between carbonyl oxygen and amino hydrogen of polypeptide chains, which are
closer together. Beta-sheet conformation can be parallel, i.e. C-terminus and N-terminus of
adjacent polypeptide chains are at the same direction, or antiparallel.
1.2.3. Protein Tertiary Structure
The folded protein secondary structure leads to a globular and more compact conformation,
which is known as a tertiary structure (Figure 1.3-A). Folding (of globular proteins) is driven by
exclusion of water and interactions between R groups, which can stabilize the fold.
(B) (A)
Figure 1.3. Tertiary structure of Arabinose binding protein (A) (Source-
http://chemistry.umeche.maine.edu/CHY431/Proteins10.html) and quaternary structure of a
potassium ion channel protein from Streptomyces lividans (B) (Source-
http://chemistry.umeche.maine.edu/MAT500/Proteins12.html)

5
In addition, tertiary structures stabilize by strong, covalent disulfide bonds between sulfur
atoms in cysteine amino acid side chains, charge–charge interactions between oppositely charged
species in the amino acid side chains, hydrogen bonds, and Van der Waals interactions.
The quaternary structures are the combination of several polypeptide units together, which
are known as multimers, i.e. dimer, trimer, tetramer, etc. (Figure 1.3-B). The conformational
stability of the quaternary structure maintains by the same interactions, which occur in the
tertiary structure.
1.3. Protein Stability
In general, most proteins are in a two-state model, folded (native) and unfolded (denatured)
states.18
Native folded states can be reversibly transformed into an unfolded states therefore, in
cells and tissues these two states are in an equilibrium.19,20
𝑁 ↔ D (1.1)
Here, N is the concentration of native protein and D is the concentration of denatured protein
in the equilibrium. The stability of the native state is marginally higher (-5 to -10 kCal/mol) than
the unfolded state.19
Transitions from lower energy state, i.e. folded state to the higher energy
state (unfolded state) occur in the presence of a protein-denaturing agent. In such an
environment, hydrogen bonds, disulfide bonds, electrostatic interactions, and Van der Waal
interactions, which maintain the tertiary structure, is destroyed.
Protein denaturation achieves by using various conditions: temperature and pH variations,
addition of chemical agents, and the application of a mechanical stress. Herein, I will be focused
on the first three factors since those are being extensively used. High temperature conditions
(~60 ºC- 100 ºC) are often caused denaturation by weakening the spatial interactions and

6
irreversibly changing the native structure. Exposure of proteins to a low pH (< ~4) environment
can also be led to protein unfolding.21
Urea and guanidine chloride are two most commonly used
chaotropic agents. At high concentrations, these substances weaken the hydrogen bond network
between solvent molecules. This leads to reduction of hydrophobic effect of proteins. As a result,
native state becomes unstable.22
All these denaturing conditions of proteins are applied in protein
separation, a major step in proteomic workflow.
1.4. Protein Separation
Protein separation is performed by various analytical techniques, such as reversed phase
chromatography and hydrophobic interaction chromatography based on protein polarity;23
size
exclusion chromatography,24
gel electrophoresis,25
and gel filtration technique26
based on protein
size and shape; capillary electrophoresis,27
IEF,28
and ion exchange chromatography29
based on
protein charge; etc. Polyacrylamide gel electrophoresis (PAGE) is by far the most commonly
used technique for separation of protein mixtures.30,31,32
1.4.1. Polyacrylamide Gel Electrophoresis (PAGE)
PAGE is a widely used technique for protein separation and purification based on molecular
weight and/or charge. The technique involves sieving of proteins with different charges and
masses through a polyacrylamide gel matrix in an applied electric field. PAGE can be used to
separate proteins in their native (native PAGE)33,34,35
or denatured form (denaturing
PAGE).36,37,38
The latter is achieved with the addition of surfactants in sample, gel, and running
buffer preparations. PAGE can be classified into two based on nature of the surfactants used;
anionic or cationic.

7
Anionic PAGE uses anionic surfactants with basic buffers, while cationic surfactants at low
pH buffers are used in cationic PAGE. Protein separation by use of PAGE with anionic
surfactant, SDS, which is known as SDS-PAGE is the most common anionic PAGE technique
used to estimate the molecular weight of proteins.39,30, 40
SDS is used in protein sample,
polyacrylamide gel, and running buffer preparations in SDS-PAGE.30
Typically, for most
proteins, monomeric SDS in the sample buffer binds to proteins in a ratio of 1.4 g of SDS/1 g of
protein.41,42
Binding of SDS to any protein is predominantly hydrophobic and causes the tertiary
structure to be unfolded.42
Reducing agents in sample buffer aid with disulfide bond cleavages.
At SDS concentrations greater than the critical micelle concentration (CMC), hydrophobic
domains of proteins interact with the inner core of SDS micelles causing the proteins to be
unfolded. Proteins are further unfolded as a result of hydrophobic and electrostatic interactions
between SDS and proteins, yielding linear chains of negatively charged SDS-protein complexes.
In an electric field, these charged complexes sieve through gel pores from cathode to anode. The
electrophoretic mobility is a unique function of protein molecular weight as most of the SDS-
protein complexes under investigation have a constant negative charge.43
In other words, the plot
of logarithm of molecular weight vs. protein migration distance in SDS-PAGE protein separation
often yields a linear relationship.
Even though SDS has been extensively used to denature and enhance protein solubility in
extractions and separations, several deficiencies are associated with it in protein separation
followed by identification. For example, defects in SDS-PAGE are known even though it reveals
accurate molecular weight information for most proteins. For some proteins, particularly in
membrane proteomics, anomalous protein migrations are observed where protein migrations do
not correlate to the molecular weight, often known as ‘gel shifts’.41,44

8
Figure 1.4. A plot of estimated molecular weight from SDS-PAGE (observed Mr) vs. molecular
weight derived from the amino acid sequence (formula Mr) for transmembrane proteins running
at formula Mr (n=28, black dots), slower than formula Mr (n=48, red dots), and faster than
formula Mr (n=92, green dots).45
Figure 1.4 shows such an example, a systematic study performed by Rath et al. to investigate
the relationship between the estimated protein molecular weight from SDS-PAGE and the
molecular weight derived from amino acid sequence of the protein, for a series of trans
membrane proteins. These anomalous protein migrations have been occurred due to numerous
biological factors: alternative splicing, posttranslational modifications, and endoproteolytic
processes occur in membrane proteins.45
All these factors may change the molecular weight
derived from the amino acid sequence hence, migrate at a different speed. In addition, various
levels of SDS binding to hydrophobic proteins also could affect the migration speed. Even
though the maximum binding ratio of SDS to protein is 1.4 g of SDS/1 g of protein, in another
study, Rath et al. reported that the ratio varies from 3.4-10 g of SDS/1 g of membrane proteins.41
This suggests that membrane proteins denature into variable extents depending on the SDS

9
loading level to such proteins. Consequently, SDS-PAGE separation of these types of proteins
does not solely based on molecular weights but, variable protein shapes, extent of unfolding, and
protein charges also affect differential migration patterns of SDS-PAGE.11,16,15
For this reason,
alternative surfactants and techniques are in need, which are more suitable in separating
membrane proteins.
Cationic PAGE has been used in membrane protein separations by use of 2D-PAGE 46,44,47,48
and 1D-PAGE.49,50
In contrast to anionic PAGE, cationic surfactants, such as
cetyltrimethylammonium bromide (CTAB),44,49
16-benzyldimethyl-n-hexadecylammonium
chloride (16-BAC),46,48
tetradecyltrimethylammonium bromide (TDAB),51
and cetylpyridinium
chloride52
along with acidic sample and running buffers are employed in cationic PAGE.
Interaction of proteins with these surfactants can form positively charged surfactant-protein
complexes under acidic pH leading to a migration from anode to cathode.44
Similar to SDS-
PAGE, molecular weight-based separations are obtained using cationic PAGE technique as
well.51,44
A significant portion of research related to membrane protein separations reported using
cationic PAGE. Amory et al. used TDAB-based cationic PAGE to separate a phosphorylated
catalytic intermediate of purified ATPase of the Schizosaccharomycespombe yeast with a high
resolution. It has been revealed that after separation of proteins by CTAB-PAGE the enzymatic
activity was retained owing to the low CMC of the surfactant, which reduced the denaturation
effect.50
In a recent study, CTAB-PAGE was able to detect post translational modifications of
nuclear proteasomes, which were not visible in SDS-PAGE.49
These modifications were known
to possess negative charge heterogeneity, which are more compatible with cationic CTAB-

10
PAGE. In recent years, ionic liquid-based surfactants have shown much interest in protein
separation chemistry due to unique chemical properties associated with them.53,54,55
1.4.2. Ionic Liquids
Ionic liquids (ILs) are organic salts with melting point below 100 ºC. ILs that are liquids at
room temperature are known as room temperature ILs. In contrast, those that are solids at room
temperature are known as frozen ILs. The presence of a bulky cation and/or anion in ILs makes a
loosely packed lattice structure. This leads to a low melting point compared to conventional salts,
which have high melting points. Figure 1.5 shows some of the common cations and anions,
which are used in ILs synthesis. The cation of ILs is generally bases on different types of organic
compounds, such as dialkylimidazolium-, phosphonium-, N-alkylpyridinium-, alkylammonium-,
etc. The anion may be organic or inorganic, for some examples, hexafluorophosphate,
tetrafluoroborate, bis(perfluoromethanesulfonyl)imide, bis(trifluoromethanesulfonyl)imide,
chloride, and bromide.
ILs have achieved considerable attention due to various physicochemical properties, e.g.,
high conductivity,56,57
low volatility,58,59
high thermal stability,60,61
non-flammability,62,63
etc. An
attractive property of ILs is the ability to tune those properties for a desired task by changing
counter ions. In most cases, this performs simply by an ion exchange reaction. For this reason,
numerous types of ILs are being exploited in different applications, for instance, light emitting
diodes (LED),64
stable solvents for organic synthesis,65
sensors,66
and surfactants in
separations.67

11
Figure 1.5. Common cations; dialkylimidazolium (a), phosphonium (b), N-alkylpyridinium (c),
and alkylammonium (d) and anions; hexafluorophosphate (e), tetrafluoroborate (f),
bis(trifluoromethanesulfonyl)imide (g), bis(pentafluoroethanesulfonyl)imide (h), chloride (i), and
bromide (j)
1.4.3. Ionic Liquid-based Surfactants in Protein Separation
ILs have been used as surfactants for protein separation using various analytical techniques.
Zhang et al. reported the application of 3-methylimidazolium-based ILs for IL-assisted SDS-
PAGE separation of human serum proteins.68
In this study, ILs were applied in polyacrylamide
gel matrix, while SDS was employed in protein sample and running buffers to perform protein
separation under standard SDS-PAGE conditions. Serum proteins with low and moderate

12
molecular weights were separated with a high resolution using this technique. In another study,
isopropylammonium formate ILs as buffer modifiers, have been used in mobile phase of reverse
phased-high performance liquid chromatography (HPLC).69
This technique has successfully been
used to separate subunits of a variety of proteins including glutamate dehydrogenase and lactate
dehydrogenase. Furthermore, 1-alkyl-3-methylimidazolium-based ILs have been used as coating
agents in fused silica capillaries and buffer additives in running buffer of capillary
electrophoresis (CE) for rapid and efficient separation of basic proteins.70
Inclusion of ILs in
capillary coating has resulted to yield an improved sharp protein peak on electropherograms of
CE.
1.5. Protein Identification
Protein identification by mass spectrometry is a critical step in proteomic workflow. Two soft
ionization methods in mass spectrometry, electrospray ionization (ESI) and matrix assisted laser
desorption ionization (MALDI), are widely used in protein and peptide analysis. The latter
technique has more advantages in direct analysis of proteins.71
1.5.1. Protein Identification by MALDI-MS
MALDI-MS is a highly sensitive technique, which used to identify biomolecules with large
molecular weights.72
Tremendous efforts and strategies have been made by use of MALDI-MS
to identify protein biomarkers in cells and tissue extracts,73
urine,74
blood serum and plasma,75
cerebrospinal fluid,76
fingerprints,77
etc. In addition, it has been used to analyze proteins in
microorganisms78
and food.79
Furthermore, MALDI imaging mass spectrometry (IMS) technique
has been used for spatial analysis of protein distribution with unbiased visualization on tissue
samples.80

13
The performance of MALDI-MS protein detection is affected by low abundance and
hydrophobicity of proteins.71
The latter affects the protein solubility, which is a key factor for the
efficient co-crystallization of proteins and matrix in sample. Researchers have employed
surfactants as matrix additives to solubilize hydrophobic proteins in samples to eliminate the bias
of mass detection in favor of hydrophilic proteins over hydrophobic proteins.81,82
The presence of surfactants, in particular, SDS, in MALDI-MS sample preparation has
shown counter effects, such as reduction of signal-to-noise ratio83
and mass resolution84
in
protein identification. Signal suppression due to this anionic surfactant has been attributed to the
partial precipitation of protein-surfactant ion pairs below the CMC and formation of surfactant
coatings on protein-matrix crystals above the CMC.84
As a result, it is not possible to recover the
total protein signal at any concentration of SDS. Consequently, mass spectrometry compatible
surfactants as matrix additives have been exploited in MALDI-MS that have capacity to
solubilize hydrophobic proteins and improve mass spectral quality.85,86,87
For an instance, anionic
surfactant, sodium 3-((1-(furan-2-yl)undecyloxy) carbonylamino) propane-1-sulfonate has been
used to increase protein solubility of an in-gel protein digestion sample prior to mass spectral
identification of peptides.85
The quality of mass spectra was not negatively affected as a result of
removal of the surfactant including other contaminants by centrifugation and solid phase
extraction. In another study, sodium laurate has been used as an efficient protein extracting
agent, similar to SDS, in membrane proteomics.87
However, in the presence of the surfactant,
mass spectra were significantly suppressed, which recovered to some extent after removing the
surfactant by phase transfer method. None of these surfactants showed an improvement in the
presence of the surfactant or applications in protein separation, in addition to identification.

14
1.6. Instrumentation Techniques
1.6.1. Polyacrylamide Gel Electrophoresis (PAGE)
Polyacrylamide gels are prepared by polymerization of acrylamide monomer along with
N,N’-methylenebisacrylamide cross linker in the presence of a suitable catalyst for anionic or
cationic PAGE (Figure 1.6).
Figure 1.6. Reaction for polyacrylamide gel polymerization
The pore sizes of the gel matrix are affected by acrylamide composition, total percentage of
both monomers (T), and percentage of bisacrylamide cross linker with respect to the total
monomer concentration (C). Primarily, higher proportions of cross linker leads to small pores,
therefore, suitable to separate proteins with relatively low molecular weight and vice versa.88
Thus, careful selection of %T and %C are critical for an optimal protein separation.
Two PAGE techniques can be identified based on distribution of pH, pore sizes, and voltage
in gel medium; continuous and discontinuous. In continuous PAGE, a homogenous buffer
system with uniform pH and a single layer of gel media are used.89
In contrast, multiple gel

15
layers, i.e., stacking and resolving, which have different pore sizes and gradient pH buffer
systems are used in discontinuous PAGE. In this system, protein samples are concentrated into a
sharp zone inside large pores of the stacking gel layer, reducing sample diffusion prior to the
separation. As a result, highly resolved protein bands are often yielded.
Bio-Rad Mini PROTEAN Tetra Cell, a vertical gel electrophoresis system, was used in all
the PAGE protein separations that are discussed in this dissertation. In anionic PAGE
experiments, Bio-Rad precast gels were used at 200 V for 40 minutes. In cationic PAGE
experiments, polyacrylamide gels containing ILS were prepared in the lab using Bio-Rad glass
plates, i.e., one short plate and one spacer plate. Cationic PAGE experiments were performed at
200 V for 10 minutes followed by 300 V for 50 minutes.
1.6.2. Isoelectric Focusing (IEF)
Isoelectric focusing (IEF) is an electrophoretic technique, which is used for protein
separations based on the isoelectric point (pI) of proteins. For this purpose, an immobilized pH
gradient (IPG) in a polyacrylamide gel matrix uses as a gel strip with a range of pH (3-12).90
Iso-
electric focusing was performed using an Ettan IPGphor (GE healthcare) unit. Protein separation
is performed by first, immersing the IPG strip in an aqueous protein sample for rehydration. As
explained in section 1.2.1., proteins can have either a net negative or positive charge depending
on the pH of the medium. In an applied electric field, proteins will migrate towards the electrode,
which is oppositely charged to proteins (Figure 1.7-A).
16
Figure 1.7. Schematic diagram, which illustrates the protein separation mechanism in IEF;
proteins with net charges are migrated in an electric field towards anode or cathode (A). After
the separation, proteins appear as sharp bands along the gel strip (B)
During this migration through pH gradient, proteins can be protonated or deprotonated.
Eventually, proteins reach to a point where the net charge is zero, in other words, pI of the
protein. This will stop the migration and condense proteins to a particular pH region, which is
same as the pI of each protein in the mixture (Figure 1.7-B).
1.6.3. Fluorescence Spectroscopy
Fluorescence spectroscopy is an analytical technique with high sensitivity and can be used to
analyze molecular environments at micro molar concentrations. In this technique, a fluorophore
is irradiated at a specific wavelength to excite it from ground energy state to higher vibrational
levels of excited states (S1 and S2). Energetic relaxation of fluorophore from the first excited
state to the ground state through emission of radiation is known as fluorescence. This energy
transition occurs in the same spin state, i.e., from S1 to S0. After the energy absorption, the
fluorophore may undergo several other radiative and non-radiative processes. A Jablonski
diagram, which illustrates the processes, is shown in Figure 1.8.
One of the non-radiative processes is relaxation of a molecule from S2 to the lowest
vibrational energy level of S1, known as internal conversion, is a rapid process occurs in 10-12
s.

17
Figure 1.8. Jablonski diagram, which shows possible radiative (solid lines) and non-radiative
(dashed lines) transitions
Fluorescence emission occurs within 10-8
s after the completion of internal conversion. For this
reason, fluorescence emission happens from a thermally equilibrated, lowest vibrational level of
S1 state. Another non-radiative transition is intersystem crossing, where a spin conversion occurs
from singlet state (S2) to the first triplet state (T1). The emission from T1 to S0 is a radiative
transition, known as phosphorescence and always occurs at longer wavelengths as compared to
the fluorescence.
The analytical instrument used to measure fluorescence was a SPEX Fluorolog-3
spectrofluorimeter (model FL3-22TAU3). Figure 1.9 shows the basic units of the instrument;
light source, excitation and emission monochromators, sample holder, and detector
(photomultiplier tube). A xenon arc lamp (450 W) was used as the light source in the
fluorescence studies discussed in this dissertation. Excitation and emission monochromators are
gratings, which are used to filter a specific wavelength. As the beam of light is passed through
excitation monochromator, it is filtered through an adjustable slit before entering into the sample
chamber. The emission monochromator is placed at a 90º angle to the light source in order to
3
3
1 2 3 S
2
S1
S0
S
Absorbance (10-14
s)
Fluorescence (10-8
s)
Singlet excited states
Triplet excited states
Internal conversion (10-12
s)
Inter system crossing (10-9
s)
Phosphorescence (10-6
-10-3
s)
T
1 2
1 2
1

18
collect the emission light and minimize scattered light. The emission light is then passed through
emission monochromators, where a fixed wavelength range is selected by the user. It is then
filtered through an adjustable slit and forward to the photomultiplier tube. Finally, fluorescence
spectrum is generated after amplifying the signal by the detector.
Figure 1.9. Major components of fluorescence spectrophotometer
The molecular environments of proteins can be studied using intrinsic protein fluorescence;
three fluorescent amino acids, phenylalanine, tyrosine, and tryptophan located in proteins are
acted as fluorophores.91,92,93,94
Tryptophan is the major fluorophore, which is widely used as a
reporter molecule.95
Excitation wavelength of Tryptophan lies between 295-305 nm and
emission occurs near 350 nm. It is recommended to excite tryptophan at 295 nm to avoid
interference from tyrosine spectral emission.96
Spectral shifts in tryptophan emission are due to
changes in local environments of the protein. Hence, it reveals useful information on protein
structural changes, denaturation, and protein- ligand interactions. Tryptophan emission is highly
affected by different types of quenchers (amino and carboxyl groups, peptide bonds, disulfides,
Excitation
monochromator
Sample
chamber Light
source
Emission
monochromator Detector

19
and amides) and polarity of surroundings as well.97
When the protein is in a completely non-
polar environment, it shows a characteristic blue-shifted emission (hypsochromic effect). As
tryptophan residue is exposed to a polar solvent or formed hydrogen bonds with water, the
emission is red-shifted (bathochromic effect). These variable emission characteristics are useful
to understand different stages of protein unfolding.
1.6.4. Circular Dichroism (CD)
CD is a valuable analytical technique used to examine the protein structure in a solution. The
principle of this technique is based on absorption of two components, clockwise (R) and anti-
clockwise (L) rotations of circularly polarized light by a chiral chromophore (Figure 1.10). If R
and L components are absorbed in equal extents or not absorbed at all, the total absorbance will
generate a polarized radiation on the same plane as the incident light. If two components are
different, the radiation will be elliptically polarized. The circular polarized absorbance is
measured by use of a spectropolarimeter and reported the ellipticity in degree. Hence, the CD
spectrum is a plot of ellipticity (θ) versus wavelength (λ).
Figure 1.10. The principle of Circular dichroism
CD exhibits characteristic spectra at different finger print regions for protein secondary and
tertiary structures. Protein secondary structures; α-helix, anti-parallel β sheets, and β turns show
different spectra at far-UV region (170-250 nm). These absorption characteristics of the
Circularly
polarized
light
Detector
L
Chiral chromophore

20
secondary structure are due to the peptide bonds with transitions from n→π* (around 220 nm)
and π→π* (around 190 nm). Tertiary structures of proteins can be identified due to absorption by
aromatic amino acids, phenyl alanine, tryptophan, and tyrosine leading to the absorbance in the
near-UV region (250-320 nm). These amino acids absorb at characteristic wavelengths; phenyl
alanine in between 255-270 nm, tryptophan around 290 nm, and tyrosine in between 275-282
nm.
Moreover, CD spectra can reveal structural changes due to ligand binding as well. The
concentration, in which such changes may occur also can be detected using a range of
concentrations of ligands. In addition, protein denaturation in the presence of a denaturing agent
or with increased temperature can be monitored due to loss of CD signal. All of these
characteristics are widely applied in protein biochemistry, protein synthesis, and analysis. An
AVIV spectrophotometer (model 62DS) was used to collect CD data in this dissertation.
1.6.5. Matrix Assisted Laser Desorption Ionization (MALDI)-Mass Spectrometry (MS)
Figure 1.11. Schematic diagram, which shows the ionization process in MALDI-MS

21
MALDI-MS is a soft ionization mass spectrometry technique, which uses to analyze masses
of biopolymers including peptides and proteins. In this technique, suitable chromophores, such
as α-cyanohydroxycinnamic acid (CHCA), sinapinic acid, 2,5-dihydroxybenzoic acid (DHB),
and succinic acid are used as matrix components during sample preparation. For protein
characterization studies discussed in this dissertation, a MALDI time-of-flight (TOF) mass
spectrometer (Bruker, ultrafleXtreme) with Nd:YAG laser (355 nm, 3 ns pulse width) was used.
During the analysis, a protein sample irradiates with the laser beam. Then, the matrix mixture
desorbs into the gas phase. As a result, proton transfer can occur from matrix to analyte or vice
versa, which leads to protonation or deprotonation of analytes and matrix molecules (Figure
1.11). These charged ionic species then migrate through an electric field at different speeds
depending on mass to charge ratio (m/z) and finally, leading to detection by a mass detector.
1.7. Scope of Dissertation
In this dissertation, the application of novel, cationic ionic liquid surfactants, N-alkyl-4-
methyl pyridinium bromide (CnPBr where n=4, 8, 11), in protein separations by PAGE and
identification by MALDI-MS will be discussed. Chapter 2 will be focused on synthesis and the
application of N-alkyl-4-methylpyridinium bromide-based ILS in separation of acidic proteins
including ovalbumin and transferrin isoforms by anionic PAGE. In this study, intrinsic
fluorescence spectroscopy and circular dichroism studies will be used to explain protein-ILS
interactions and denaturing effects of ILS. In chapter 3, the application of the same ILS in
cationic PAGE for separation of both acidic and basic proteins will be discussed. Furthermore,
the application of the technique to resolve ribonuclease b glycoforms will be reported in detail.
As another application of the cationic PAGE technique, 2D-PAGE (IEF/ILS-PAGE) separation
of complex proteins will be demonstrated in chapter 4. Separation of alpha antitrypsin

22
glycoprotein and cytochrome c protein subunits using this technique will be discussed and
compared with conventional 2D-PAGE methods in the same chapter. Chapter 5 highlights the
application of the same ILS as matrix additives in MALDI-MS for detection of proteins. The
signal-to-noise-ratio improvement in the presence of ILS will be discussed compared to 0%
surfactants and conventional surfactants. In addition, application of the ILS in MALDI-MS
profiling mode experiments to improve protein analysis of a rat brain tissue sample will be
investigated.
1.8. References
1. Petsko, G. A.; Ringe, D., Protein structure and function. New Science Press: 2004.
2. Suresh, S.; Spatz, J.; Mills, J.; Micoulet, A.; Dao, M.; Lim, C.; Beil, M.; Seufferlein, T.,
Reprint of: connections between single-cell biomechanics and human disease states:
gastrointestinal cancer and malaria. Acta biomaterialia 2015, 23, S3-S15.
3. Harada, R.; Tochio, N.; Kigawa, T.; Sugita, Y.; Feig, M., Reduced native state stability in
crowded cellular environment due to protein-protein interactions. Journal of the American
Chemical Society 2013, 135 (9), 3696.
4. Kim, M.-S.; Pinto, S. M.; Getnet, D.; Nirujogi, R. S.; Manda, S. S.; Chaerkady, R.;
Madugundu, A. K.; Kelkar, D. S.; Isserlin, R.; Jain, S., A draft map of the human proteome.
Nature 2014, 509 (7502), 575-581.
5. Budak, H.; Akpinar, B. A.; Unver, T.; Turktas, M., Proteome changes in wild and modern
wheat leaves upon drought stress by two-dimensional electrophoresis and nanoLC-ESI–MS/MS.
Plant Molecular Biology 2013, 83 (1-2), 89-103.
6. Emery, S. J.; Pascovi, D.; Lacey, E.; Haynes, P. A., The generation gap: Proteome changes
and strain variation during encystation in Giardia duodenalis. Molecular and biochemical
parasitology 2015, 201 (1), 47-56.
7. Romero, R.; Erez, O.; Maymon, E.; Chaemsaithong, P.; Xu, Z.; Pacora, P.; Chaiworapongsa,
T.; Done, B.; Hassan, S. S.; Tarca, A. L., The maternal plasma proteome changes as a function of
gestational age in normal pregnancy: a longitudinal study. American Journal of Obstetrics and
Gynecology 2017.

23
8. Wiśniewski, J. R.; Duś, K.; Mann, M., Proteomic workflow for analysis of archival formalin‐fixed and paraffin‐embedded clinical samples to a depth of 10 000 proteins. PROTEOMICS-
Clinical Applications 2013, 7 (3-4), 225-233.
9. Wilson, A. M.; Bailey, P. J.; Tasker, P. A.; Turkington, J. R.; Grant, R. A.; Love, J. B.,
Solvent extraction: the coordination chemistry behind extractive metallurgy. Chemical Society
Reviews 2014, 43 (1), 123-134.
10. Crowell, A. M.; Wall, M. J.; Doucette, A. A., Maximizing recovery of water-soluble proteins
through acetone precipitation. Analytica chimica acta 2013, 796, 48-54.
11. Kawashima, A.; Kigoshi, T.; Katoh, Y.; Ishikawa, Y.; Shawki, H. H.; Inoue, N.; Tamba, M.;
Matsuda, M.; Okamura, N., CABCOCO1, a novel coiled‐coil protein With calcium‐binding
activity, is localized in the sperm flagellum. Molecular reproduction and development 2016, 83
(10), 912-926.
12. Anderson, J. C.; Peck, S. C., Detection of protein phosphorylation and charge isoforms using
vertical one-dimensional isoelectric focusing gels. Plant MAP Kinases: Methods and Protocols
2014, 39-46.
13. Prasad, B.; Evers, R.; Gupta, A.; Hop, C. E.; Salphati, L.; Shukla, S.; Ambudkar, S. V.;
Unadkat, J. D., Interindividual variability in hepatic organic anion-transporting polypeptides and
P-glycoprotein (ABCB1) protein expression: quantification by liquid chromatography tandem
mass spectroscopy and influence of genotype, age, and sex. Drug Metabolism and Disposition
2014, 42 (1), 78-88.
14. Sakamoto, A.; Matsumaru, T.; Yamamura, N.; Suzuki, S.; Uchida, Y.; Tachikawa, M.;
Terasaki, T., Drug Transporter Protein Quantification of Immortalized Human Lung Cell Lines
Derived from Tracheobronchial Epithelial Cells (Calu‐3 and BEAS2‐B), Bronchiolar–Alveolar
Cells (NCI‐H292 and NCI‐H441), and Alveolar Type II‐like Cells (A549) by Liquid
Chromatography–Tandem Mass Spectrometry. Journal of pharmaceutical sciences 2015, 104
(9), 3029-3038.
15. Chaijarasphong, T.; Nichols, R. J.; Kortright, K. E.; Nixon, C. F.; Teng, P. K.; Oltrogge, L.
M.; Savage, D. F., Programmed ribosomal frameshifting mediates expression of the α-
carboxysome. Journal of molecular biology 2016, 428 (1), 153-164.
16. Gazzola, D.; Pasini, G.; Tolin, S.; Curioni, A.; Vincenzi, S., CHARACTERIZATION OF
CHITINASE ISOFORMS FROM GRAPE JUICE. Italian Journal of Food Science 2017, 29 (1).
17. Anfinsen, C. B., Studies on the principles that govern the folding of protein chains. 1972.
18. Arnold, U.; Ulbrich-Hofmann, R., Kinetic and thermodynamic thermal stabilities of
ribonuclease A and ribonuclease B. Biochemistry 1997, 36 (8), 2166-2172.
19. Creighton, T. E., Protein folding. Biochemical journal 1990, 270 (1), 1.

24
20. Dill, K. A.; Shortle, D., Denatured states of proteins. Annual review of biochemistry 1991, 60
(1), 795-825.
21. Rabbani, G.; Ahmad, E.; Zaidi, N.; Fatima, S.; Khan, R. H., pH-Induced molten globule state
of Rhizopus niveus lipase is more resistant against thermal and chemical denaturation than its
native state. Cell biochemistry and biophysics 2012, 62 (3), 487-499.
22. Salvi, G.; De Los Rios, P.; Vendruscolo, M., Effective interactions between chaotropic
agents and proteins. Proteins: Structure, Function, and Bioinformatics 2005, 61 (3), 492-499.
23. Xiu, L.; Valeja, S. G.; Alpert, A. J.; Jin, S.; Ge, Y., Effective protein separation by coupling
hydrophobic interaction and reverse phase chromatography for top-down proteomics. Analytical
chemistry 2014, 86 (15), 7899-7906.
24. Fekete, S.; Beck, A.; Veuthey, J.-L.; Guillarme, D., Theory and practice of size exclusion
chromatography for the analysis of protein aggregates. Journal of pharmaceutical and
biomedical analysis 2014, 101, 161-173.
25. Dunn, M. J., Gel electrophoresis of proteins. Elsevier: 2014.
26. Nuñez, J. K.; Kranzusch, P. J.; Noeske, J.; Wright, A. V.; Davies, C. W.; Doudna, J. A.,
Cas1–Cas2 complex formation mediates spacer acquisition during CRISPR–Cas adaptive
immunity. Nature structural & molecular biology 2014, 21 (6), 528-534.
27. Han, X.; Wang, Y.; Aslanian, A.; Fonslow, B.; Graczyk, B.; Davis, T. N.; Yates III, J. R., In-
line separation by capillary electrophoresis prior to analysis by top-down mass spectrometry
enables sensitive characterization of protein complexes. Journal of proteome research 2014, 13
(12), 6078-6086.
28. Eulitz, M. In Purification of Myeloma Proteins by Iso-electric Focusing, Protides of the
Biological Fluids: Proceedings of the Seventeenth Colloquium, Bruges, 1969, Elsevier: 2014; p
481.
29. Fekete, S.; Beck, A.; Fekete, J.; Guillarme, D., Method development for the separation of
monoclonal antibody charge variants in cation exchange chromatography, Part I: Salt gradient
approach. Journal of pharmaceutical and biomedical analysis 2015, 102, 33-44.
30. Brunelle, J. L.; Green, R., One-dimensional SDS-polyacrylamide gel electrophoresis (1D
SDS-PAGE). Methods in enzymology 2014, 541, 151.
31. Nigg, P. E.; Pavlovic, J., Characterization of Multi-subunit Protein Complexes of Human
MxA Using Non-denaturing Polyacrylamide Gel-electrophoresis. JoVE (Journal of Visualized
Experiments) 2016, (116), e54683-e54683.

25
32. Kabir, M. R.; Afrose, R.; Shahidullah, A.; Hossain, M. A.; Paul, S. K.; Rahman, M.;
Kobayashi, N., Usage of Silver-Stained Polyacrylamide Gels Electrophoresis (PAGE) for
Detection of Rotavirus Infection by Direct Identification of Viral Nucleic Acid. Bangladesh
Journal of Medical Science 2016, 15 (2), 154.
33. Weber, M.; Weber, F., Monitoring activation of the antiviral pattern recognition receptors
RIG-I and PKR by limited protease digestion and native PAGE. Journal of visualized
experiments: JoVE 2014, (89).
34. Umetsu, K.; Yuasa, I.; Hashiyada, M.; Adachi, N.; Watanabe, G.; Haneda, T.; Yamazaki, K.,
The art of traditional native PAGE: The APLP 48-ID assay for human identification. Legal
Medicine 2016, 19, 28-31.
35. Moyano, M. F.; Mariño-Repizo, L.; Tamashiro, H.; Villegas, L.; Acosta, M.; Gil, R. A.,
ICPMS analysis of proteins separated by Native-PAGE: Evaluation of metaloprotein profiles in
human synovial fluid with acute and chronic arthritis. Journal of Trace Elements in Medicine
and Biology 2016, 36, 44-51.
36. Sharma, A. K.; Plant, J. J.; Rangel, A. E.; Meek, K. N.; Anamisis, A. J.; Hollien, J.;
Heemstra, J. M., Fluorescent RNA labeling using self-alkylating ribozymes. ACS chemical
biology 2014, 9 (8), 1680-1684.
37. Conway, J. W.; McLaughlin, C. K.; Castor, K. J.; Sleiman, H., DNA nanostructure serum
stability: greater than the sum of its parts. Chemical Communications 2013, 49 (12), 1172-1174.
38. Selvadurai, K.; Wang, P.; Seimetz, J.; Huang, R. H., Archaeal Elp3 catalyzes tRNA wobble
uridine modification at C5 via a radical mechanism. Nature chemical biology 2014, 10 (10), 810-
812.
39. Swain, S.; Panigrahi, K.; Baisakh, B., Estimation of Seed Storage Protein and Molecular
Weight Determination in Micro Mutant Lines of Green Gram (Vigna radiate (L.) Wilczek) by
SDS-PAGE. Trends in Biosciences 2014, 7 (19), 2912-2917.
40. Kinoshita, E.; Kinoshita‐Kikuta, E.; Karata, K.; Kawano, T.; Nishiyama, A.; Yamato, M.;
Koike, T., Specific glutamic acid residues in targeted proteins induce exaggerated retardations in
Phos‐tag SDS‐PAGE migration. Electrophoresis 2017.
41. Rath, A.; Glibowicka, M.; Nadeau, V. G.; Chen, G.; Deber, C. M., Detergent binding
explains anomalous SDS-PAGE migration of membrane proteins. Proceedings of the National
Academy of Sciences 2009, 106 (6), 1760-1765.
42. Bhuyan, A. K., On the mechanism of SDS‐induced protein denaturation. Biopolymers 2010,
93 (2), 186-199.
43. Reynolds, J. A.; Tanford, C., The gross conformation of protein-sodium dodecyl sulfate
complexes. Journal of Biological Chemistry 1970, 245 (19), 5161-5165.

26
44. Buxbaum, E., Cationic electrophoresis and electrotransfer of membrane glycoproteins.
Analytical biochemistry 2003, 314 (1), 70-76.
45. Rath, A.; Deber, C. M., Correction factors for membrane protein molecular weight readouts
on sodium dodecyl sulfate–polyacrylamide gel electrophoresis. Analytical biochemistry 2013,
434 (1), 67-72.
46. Hartinger, J.; Stenius, K.; Högemann, D.; Jahn, R., 16-BAC/SDS–PAGE: a two-dimensional
gel electrophoresis system suitable for the separation of integral membrane proteins. Analytical
biochemistry 1996, 240 (1), 126-133.
47. Godl, K.; Wissing, J.; Kurtenbach, A.; Habenberger, P.; Blencke, S.; Gutbrod, H.; Salassidis,
K.; Stein-Gerlach, M.; Missio, A.; Cotten, M., An efficient proteomics method to identify the
cellular targets of protein kinase inhibitors. Proceedings of the National Academy of Sciences
2003, 100 (26), 15434-15439.
48. Nothwang, H. G.; Schindler, J., Two-dimensional separation of membrane proteins by 16-
BAC-SDS-PAGE. Membrane Proteomics: Methods and Protocols 2009, 269-277.
49. Pitcher, D. S.; de Mattos-Shipley, K.; Wang, Z.; Tzortzis, K.; Goudevenou, K.; Flynn, H.;
Bohn, G.; Rahemtulla, A.; Roberts, I.; Snijders, A. P., Nuclear proteasomes carry a constitutive
posttranslational modification which derails SDS-PAGE (but not CTAB-PAGE). Biochimica et
Biophysica Acta (BBA)-Proteins and Proteomics 2014, 1844 (12), 2222-2228.
50. Akins, R. E.; Levin, P. M.; Tuan, R. S., Cetyltrimethylammonium bromide discontinuous gel
electrophoresis: Mr-based separation of proteins with retention of enzymatic activity. Analytical
biochemistry 1992, 202 (1), 172-178.
51. Amory, A.; Foury, F.; Goffeau, A., The purified plasma membrane ATPase of the yeast
Schizosaccharomyces pombe forms a phosphorylated intermediate. Journal of Biological
Chemistry 1980, 255 (19), 9353-9357.
52. Mócz, G.; Bálint, M., Use of cationic detergents for polyacrylamide gel electrophoresis in
multiphasic buffer systems. Analytical biochemistry 1984, 143 (2), 283-292.
53. Yang, X.; Zhang, S.; Yu, W.; Liu, Z.; Lei, L.; Li, N.; Zhang, H.; Yu, Y., Ionic liquid-anionic
surfactant based aqueous two-phase extraction for determination of antibiotics in honey by high-
performance liquid chromatography. Talanta 2014, 124, 1-6.
54. Rajabi, M.; Ghanbari, H.; Barfi, B.; Asghari, A.; Haji-Esfandiari, S., Ionic liquid-based
ultrasound-assisted surfactant-emulsified microextraction for simultaneous determination of
three important flavoring compounds in plant extracts and urine samples. Food Research
International 2014, 62, 761-770.

27
55. El-Hady, D. A.; Albishri, H. M., Alkyl imidazolium ionic liquid based sweeping-micellar
electrokinetic chromatography for simultaneous determination of seven tea catechins in human
plasma. Journal of Chromatography B 2014, 969, 224-229.
56. Monti, D.; Jónsson, E.; Palacín, M. R.; Johansson, P., Ionic liquid based electrolytes for
sodium-ion batteries: Na+ solvation and ionic conductivity. Journal of Power Sources 2014, 245,
630-636.
57. Ye, Y.; Sharick, S.; Davis, E. M.; Winey, K. I.; Elabd, Y. A., High hydroxide conductivity in
polymerized ionic liquid block copolymers. ACS Macro Letters 2013, 2 (7), 575-580.
58. Zhou, D.; Zhou, R.; Chen, C.; Yee, W.-A.; Kong, J.; Ding, G.; Lu, X., Non-volatile polymer
electrolyte based on poly (propylene carbonate), ionic liquid, and lithium perchlorate for
electrochromic devices. The Journal of Physical Chemistry B 2013, 117 (25), 7783-7789.
59. Huang, K.; Xia, S.; Zhang, X.-M.; Chen, Y.-L.; Wu, Y.-T.; Hu, X.-B., Comparative study of
the solubilities of SO2 in five low volatile organic solvents (sulfolane, ethylene glycol, propylene
carbonate, N-methylimidazole, and N-methylpyrrolidone). Journal of Chemical & Engineering
Data 2014, 59 (4), 1202-1212.
60. Liu, J.; Wang, F.; Zhang, L.; Fang, X.; Zhang, Z., Thermodynamic properties and thermal
stability of ionic liquid-based nanofluids containing graphene as advanced heat transfer fluids for
medium-to-high-temperature applications. Renewable Energy 2014, 63, 519-523.
61. Maton, C.; De Vos, N.; Stevens, C. V., Ionic liquid thermal stabilities: decomposition
mechanisms and analysis tools. Chemical Society Reviews 2013, 42 (13), 5963-5977.
62. Lin, X.; Kavian, R.; Lu, Y.; Hu, Q.; Shao-Horn, Y.; Grinstaff, M., Thermally-responsive,
nonflammable phosphonium ionic liquid electrolytes for lithium metal batteries: operating at 100
degrees celsius. Chemical Science 2015, 6 (11), 6601-6606.
63. Salem, N.; Abu-Lebdeh, Y., Non-flammable electrolyte mixtures of ringed ammonium-based
ionic liquids and ethylene carbonate for high voltage li-ion batteries. Journal of The
Electrochemical Society 2014, 161 (10), A1593-A1601.
64. Parker, S. T.; Slinker, J. D.; Lowry, M. S.; Cox, M. P.; Bernhard, S.; Malliaras, G. G.,
Improved turn-on times of iridium electroluminescent devices by use of ionic liquids. Chemistry
of materials 2005, 17 (12), 3187-3190.
65. Feldmann, C.; Ruck, M., Ionic Liquids–Designer Solvents for the Synthesis of New
Compounds and Functional Materials. Zeitschrift für anorganische und allgemeine Chemie 2017,
643 (1), 2-2.
66. Jamali, T.; Karimi-Maleh, H.; Khalilzadeh, M. A., A novel nanosensor based on Pt: Co
nanoalloy ionic liquid carbon paste electrode for voltammetric determination of vitamin B 9 in
food samples. LWT-Food Science and Technology 2014, 57 (2), 679-685.

28
67. Liu, Y.; Shamsi, S. A., Combined use of chiral ionic liquid surfactants and neutral
cyclodextrins: Evaluation of ionic liquid head groups for enantioseparation of neutral compounds
in capillary electrophoresis. Journal of Chromatography A 2014, 1360, 296-304.
68. Zhang, T.; Gai, Q.; Qu, F.; Zhang, Y., Ionic liquid‐assisted SDS‐PAGE to improve human
serum protein separation. Electrophoresis 2011, 32 (20), 2904-2910.
69. Zhou, L.; Danielson, N. D., The ionic liquid isopropylammonium formate as a mobile phase
modifier to improve protein stability during reversed phase liquid chromatography. Journal of
Chromatography B 2013, 940, 112-120.
70. Corradini, D.; Nicoletti, I.; Bonn, G. K., Co‐electroosmotic capillary electrophoresis of basic
proteins with 1‐alkyl‐3‐methylimidazolium tetrafluoroborate ionic liquids as non‐covalent
coating agents of the fused‐silica capillary and additives of the electrolyte solution.
Electrophoresis 2009, 30 (11), 1869-1876.
71. Wang, S.; Xiao, Z.; Xiao, C.; Wang, H.; Wang, B.; Li, Y.; Chen, X.; Guo, X., (E)-Propyl α-
Cyano-4-Hydroxyl Cinnamylate: A High Sensitive and Salt Tolerant Matrix for Intact Protein
Profiling by MALDI Mass Spectrometry. Journal of The American Society for Mass
Spectrometry 2016, 27 (4), 709-718.
72. Hillenkamp, F.; Jaskolla, T. W.; Karas, M., The MALDI process and method. MALDI MS: A
Practical Guide to Instrumentation, Methods, and Applications, Second Edition 2014, 1-40.
73. Meding, S.; Nitsche, U.; Balluff, B.; Elsner, M.; Rauser, S.; Schone, C. d.; Nipp, M.; Maak,
M.; Feith, M.; Ebert, M. P., Tumor classification of six common cancer types based on
proteomic profiling by MALDI imaging. Journal of proteome research 2012, 11 (3), 1996-2003.
74. Van Swelm, R. P.; Laarakkers, C. M.; Kooijmans-Otero, M.; de Jong, E. M.; Masereeuw, R.;
Russel, F. G., Biomarkers for methotrexate-induced liver injury: urinary protein profiling of
psoriasis patients. Toxicology letters 2013, 221 (3), 219-224.
75. Sandanayake, N. S.; Camuzeaux, S.; Sinclair, J.; Blyuss, O.; Andreola, F.; Chapman, M. H.;
Webster, G. J.; Smith, R. C.; Timms, J. F.; Pereira, S. P., Identification of potential serum
peptide biomarkers of biliary tract cancer using MALDI MS profiling. BMC clinical pathology
2014, 14 (1), 7.
76. Greco, V.; Pieragostino, D.; Piras, C.; Aebersold, R.; Wiltfang, J.; Caltagirone, C.;
Bernardini, S.; Urbani, A., Direct analytical sample quality assessment for biomarker
investigation: qualifying cerebrospinal fluid samples. Proteomics 2014, 14 (17-18), 1954-1962.
77. Ferguson, L. S.; Wulfert, F.; Wolstenholme, R.; Fonville, J. M.; Clench, M. R.; Carolan, V.
A.; Francese, S., Direct detection of peptides and small proteins in fingermarks and
determination of sex by MALDI mass spectrometry profiling. Analyst 2012, 137 (20), 4686-
4692.

29
78. Nomura, F., Proteome-based bacterial identification using matrix-assisted laser desorption
ionization–time of flight mass spectrometry (MALDI-TOF MS): A revolutionary shift in clinical
diagnostic microbiology. Biochimica et Biophysica Acta (BBA)-Proteins and Proteomics 2015,
1854 (6), 528-537.
79. Sassi, M.; Arena, S.; Scaloni, A., MALDI-TOF-MS platform for integrated proteomic and
peptidomic profiling of milk samples allows rapid detection of food adulterations. Journal of
agricultural and food chemistry 2015, 63 (27), 6157-6171.
80. Gessel, M. M.; Norris, J. L.; Caprioli, R. M., MALDI imaging mass spectrometry: spatial
molecular analysis to enable a new age of discovery. Journal of proteomics 2014, 107, 71-82.
81. Cohen, S. L.; Chait, B. T., Influence of matrix solution conditions on the MALDI-MS
analysis of peptides and proteins. Analytical chemistry 1996, 68 (1), 31-37.
82. Patel, E.; Clench, M. R.; West, A.; Marshall, P. S.; Marshall, N.; Francese, S., Alternative
surfactants for improved efficiency of in situ tryptic proteolysis of fingermarks. Journal of The
American Society for Mass Spectrometry 2015, 26 (6), 862-872.
83. Botelho, D.; Wall, M. J.; Vieira, D. B.; Fitzsimmons, S.; Liu, F.; Doucette, A., Top-down and
bottom-up proteomics of SDS-containing solutions following mass-based separation. Journal of
proteome research 2010, 9 (6), 2863-2870.
84. Amado, F. M.; Santana-Marques, M. G.; Ferrer-Correia, A.; Tomer, K. B., Analysis of
peptide and protein samples containing surfactants by MALDI-MS. Analytical Chemistry 1997,
69 (6), 1102-1106.
85. Saveliev, S. V.; Woodroofe, C. C.; Sabat, G.; Adams, C. M.; Klaubert, D.; Wood, K.; Urh,
M., Mass spectrometry compatible surfactant for optimized in-gel protein digestion. Analytical
chemistry 2013, 85 (2), 907-914.
86. Chang, Y.-H.; Gregorich, Z. R.; Chen, A. J.; Hwang, L.; Guner, H.; Yu, D.; Zhang, J.; Ge,
Y., New mass-spectrometry-compatible degradable surfactant for tissue proteomics. Journal of
proteome research 2015, 14 (3), 1587-1599.
87. Lin, Y.; Huo, L.; Liu, Z.; Li, J.; Liu, Y.; He, Q.; Wang, X.; Liang, S., Sodium laurate, a novel
protease-and mass spectrometry-compatible detergent for mass spectrometry-based membrane
proteomics. PloS one 2013, 8 (3), e59779.
88. Shi, Q.; Jackowski, G., One-dimensional polyacrylamide gel electrophoresis. Gel
electrophoresis of proteins: A practical approach, 3rd ed. Oxford University Press, Oxford 1998,
1-52.
89. Maurer, H. R., Disc electrophoresis and related techniques of polyacrylamide gel
electrophoresis. Walter de Gruyter: 1978.

30
90. Garfin, D. E., Gel electrophoresis of proteins. Essential cell biology 2003, 1 (7), 197-268.
91. Das, S.; Sylvain, M. R.; Fernand, V. E.; Losso, J. N.; El-Zahab, B.; Warner, I. M., Positive
cooperative mechanistic binding of proteins at low concentrations: A comparison of poly
(sodium N-undecanoyl sulfate) and sodium dodecyl sulfate. Journal of colloid and interface
science 2011, 363 (2), 585-594.
92. Ghisaidoobe, A. B.; Chung, S. J., Intrinsic tryptophan fluorescence in the detection and
analysis of proteins: a focus on Förster resonance energy transfer techniques. International
journal of molecular sciences 2014, 15 (12), 22518-22538.
93. Chan, F. T.; Schierle, G. S. K.; Kumita, J. R.; Bertoncini, C. W.; Dobson, C. M.; Kaminski,
C. F., Protein amyloids develop an intrinsic fluorescence signature during aggregation. Analyst
2013, 138 (7), 2156-2162.
94. Chan, F. T.; Pinotsi, D.; Kaminski Schierle, G.; Kaminski, C. F., Structure-specific intrinsic
fluorescence of protein amyloids used to study their kinetics of aggregation. Bio-nanoimaging:
protein misfolding and aggregation 2014.
95. Chen, Y.; Barkley, M. D., Toward understanding tryptophan fluorescence in proteins.
Biochemistry 1998, 37 (28), 9976-9982.
96. De, S.; Girigoswami, A.; Das, S., Fluorescence probing of albumin–surfactant interaction.
Journal of colloid and interface science 2005, 285 (2), 562-573.
97. Watson, M. D.; Peran, I.; Zou, J.; Bilsel, O.; Raleigh, D. P., Selenomethionine Quenching of
Tryptophan Fluorescence Provides a Simple Probe of Protein Structure. Biochemistry 2017, 56
(8), 1085-1094.

31
CHAPTER 2: IONIC LIQUIDS AS BUFFER ADDITIVES IN IONIC
LIQUID-POLYACRYLAMIDE GEL ELECTROPHORESIS
SEPARATION OF MIXTURES OF LOW AND HIGH MOLECULAR
WEIGHT PROTEINS*
2.1. Introduction
Large scale studies of proteins have received widespread public attention because of the
significance of proteomics for medical diagnosis and treatment. The progress of proteomics is
strongly dependent on the development of protein separation techniques and MS technology.1
Many classical approaches become inefficient because of the complexity of protein structures
and their sequence and folding motifs.2 A number of methods have been used for protein
separations, which includes liquid chromatography,3-5
size exclusion chromatography,6
capillary
electrophoresis7-9
and gel electrophoresis.10-13
The ordinary gel-based electrophoresis techniques,
SDS-PAGE,14-17
2-DE,15,16,18
Blue-native,19,20
and Native-PAGE 21,22
are important and the most
commonly used methods for protein separation.
SDS-PAGE has become and remains the standard method for identification, purification, and
structural analyses of proteins. SDS, as a solubilizing agent for proteins, was first introduced by
Laemmli in 1970.23,24,25
The amphiphilic properties of SDS are very important to the separation
because at concentrations greater than the critical micelle concentration (CMC), surfactant
monomers spontaneously self-assemble into micellar structures. Such micelles denature,
solubilize and bind to proteins.26
Negatively charged SDS-protein complexes are formed having
the same mass to charge ratio; therefore, charge is eliminated from the migration mechanism and
separation is solely based on relative molecular masses.27
Although SDS has been used in PAGE
*I would like to thank Dr. Farhana Hasan for her guidance and support to work on this chapter. It
is reproduced by permission of The Royal Society of Chemistry
http://pubs.rsc.org/en/content/articlelanding/2015/ra/c5ra11559k/unauth#!divAbstract

32
for decades, there are some limitations of PAGE due to joule heating and long measurement
times. In addition, some proteins migrate anomalously in SDS-PAGE.28,29
In addition, the presence of long chained alkyl sulfates in unpurified SDS may lead to
multiple bands as single protein complexes with one or more SDS monomer.29
Even by use of
pure SDS, carbohydrate-bearing, highly basic and highly acidic proteins migrate anomalously in
gel electrophoresis.30-33
Another deficiency in SDS-PAGE is that SDS may crystallize at low
temperatures,34,35
producing artifacts in gels, which then affect the resolution of proteins.36
In
Matrix-assisted laser desorption ionization mass spectrometry (MALDI-MS), SDS forms sodium
adducts with proteins and thus reduces the accuracy of protein identification.37
To overcome
these limitations, various other detergents have been used to replace SDS. For example, in 1984
two cationic detergents, cetyltrimethylammonium bromide (CTAB) and cetylpyridinium chloride
were used to replace SDS.38
However, these cationic detergents required a ten-fold increase in
concentration as compared to SDS. In another study by Ross and coworkers,34
an acid labile
surfactant (ALS) reportedly exhibited similar denaturing and electrophoretic properties as SDS.
The authors revealed that ALS decomposes at low pH and the negative charge on the ALS-
protein complex may not be as high as with SDS. Limitations of SDS-PAGE require
development of new surfactants that can discriminate protein types and molecular weights.
Therefore, a simple modification of SDS-PAGE for complex protein sample separation may
provide great potential for widely used applications in protein analysis.
Ionic liquids are a group of organic salts consisting of ions (cations and anions), having
appreciable liquid ranges and melting points below 100 ºC. These salts have low melting points
because of the larger size of one or both ions and thus low symmetry.39
There are two broad
categories of ILs: room temperature ILs (RTILs) that melt below 25 °C and frozen ILs (FILs),

33
which are typically solids at room temperature (>25 °C) but, melt below 100 °C. ILs have
attracted extensive attention in recent years and have aroused considerable interest in biological
catalysis40
and protein separations41,42
due to their unique properties i.e. low volatility, negligible
vapor pressure, nonflammability, high thermal stability, and wide electrochemical window. The
chemical and physical properties of these salts can be obtained by choosing suitable cationic
and/or anionic constituent. Thus, ILs are regarded as ‘‘designer solvents’’ because of the
tunability, which increases their potential applications. ILs which are considered as cationic
surfactants (ILS), because of the amphiphilicity of their cation,43
play an important role in
separation, such that they have been used either in the stationary phase of HPLC,44
reverse phase
liquid chromatography (RPLC)45
and gas chromatography (GC)46,47
or as a buffer modifier in
capillary electrophoresis (CE).48-50
ILS based monolithic column for CE have been reported
recently.51
In mass spectrometry, ILS have been used as MALDI matrices and ion pairing
reagents in ESI.52
Herein, we report the first ILS-PAGE technique, in which hydrophobic ILS were used as
buffer additives in both sample and running buffers for separation of five acidic proteins: Cat, Tf,
BSA, Ova, and α-Lact. The ILS used in this study were chosen based on their significant
physiochemical properties, i.e. solubility in aqueous solution, good conductivity, and good
hydrophobicity. For this purpose, novel, N-alkyl-4-methylpyridinium bromide ionic liquids with
different alkyl chain lengths i.e. 1-butene-4-methylpyridinium bromides (C4PBr), 1-octene-4-
methylpyridinium bromide (C8PBr) and 1-undecene-4-methylpyridinium bromide (C11PBr) have
been synthesized. These ILS are categorized as RTILS because they are viscous at room
temperature and follow the normal temperature requirements for IL salts. In this regard, the
influences of chain lengths and concentration of these ILS in sample and running buffers on

34
protein separation have been investigated. As compared to standard Laemmli protocol for SDS-
PAGE, no heating of sample buffer was required in ILS-PAGE. Therefore, we report CD studies
which prove that these ILS denature the protein without heating. Fluorescence studies were
performed in order to understand ionic liquid-protein interactions. In studies of surfactant-protein
interactions, BSA was used as a model protein due to its well-established primary structure,
water solubility, and versatile binding capacity.53
2.2. Experimental Section
2.2.1. Materials
All proteins: Cat (bovine liver, 250 kDa, pI 5.4), Tf (human, 80 kDa, pI 5.5), BSA (bovine,
66 kDa, pI 4.7), Ova (egg, 45 kDa, pI 4.9), and α-Lact (bovine milk, 14 kDa, pI 4.2) were
purchased from Sigma Aldrich (St. Louis, MO, USA) in pure form (≥ 95%). Proteins were
reconstituted into 3 mg/ml aliquots with 10 mM phosphate buffer at pH 7.4 and stored at -20 ºC.
Standard precast 4-20% Tris-HCl gradient polyacrylamide mini gels were obtained from Bio-
Rad Laboratories (Hercules, CA, USA). Tris-Glycine buffer was used for 1D-gel electrophoresis
and all other studies. Reagents used to prepare the running buffer, sample buffer, and the
destaining solution were purchased from Invitrogen Corporation (Carlsbad, CA, USA). Ultrapure
water (18.2 MΩ) was obtained using an Elga PURELAB Ultra purifier (Lowell, MA, USA). All
reagents were used as received without further purification.
2.2.2. Synthesis and Characterization of Ionic Liquid Surfactants
Pyridinium based ILS with different alkyl chain lengths i.e. C4PBr, C8PBr, and C11PBr were
synthesized and characterized by use of nuclear magnetic resonance (1H-,
13C-NMR) and

35
electrospray ionization (ESI)-mass spectrometry (MS). The instruments used for ESI-MS and
NMR were Agilent 6210 TOF LC/MS and Bruker AV 400 respectively.
1-Butene-4-methylpyridiniumbromide (C4PBr)
To acetonitrile, 4-bromo-1-butene (10 g, 0.074 M) and 4-methylpyridine (1.02 eq., 7 g, 0.075
M) were added and the mixture was refluxed at 80 ºC for 24h. After 24h, acetonitrile was
evaporated under a vacuum, which then resulted yellow viscous liquid. TLC in 90% CHCl3:
MeOH showed that the product was pure (16 g, 94% yield).
1H-NMR (CDCl3, 400 MHz): δ 9.33 (d, J= 6.52, 2H), 8.36 (d, J= 6.62 Hz, 2H), 5.82 (m, 1H),
4.97 (m, 1H), 4.84 (m, 2H), 2.71 (m, 2H), 2.26 (s, 3H); 13
C-NMR (CDCl3, 100 MHz): δ 158.4,
144.1, 140.5, 128.3, 119.8, 59.4, 35.5, 22.2; (MS, ESI) m/z 148 (M+)
Other ILS, 1-Octene-4-methylpyridinium bromide (C8PBr) and 1-Undecene-4-
methylpyridinium bromide (C11PBr) were synthesized following the same procedure mentioned
above and characterized by 1H-NMR,
13C-NMR, and ESI/MS.
1-Octene-4-methylpyridiniumbromide (C8PBr)
1H-NMR (CDCl3, 400 MHz) (C8PBr) : δ 9.43 (d, J =6.68Hz, 2H), 7.98 (d, J=6.28Hz,2H),
5.79 (m, 1H), 5.75 (m,1H), 5.72 (m,1H), 4.90 (m, 2H), 2.86 (s, 3H), 2.39 (m, 2H), 2.0 (m,2H),
Scheme 2.1. Reaction for the 4-methylpyridinium-based ionic liquid synthesis

36
1.36 (m,6H); 13
C-NMR (CDCl3, 100 MHz): δ 158.5, 144.1, 138.4, 128.7, 114.2, 60.7, 33.2, 31.5,
28.2, 25.6, 22.06; (MS, ESI) m/z 204 (M+)
1-Undecene-4-methylpyridiniumbromide (C11PBr)
1H-NMR (CDCl3, 400 MHz) (C11PBr) : δ9.30 (d, J =6.6Hz, 2H), 7.89 (d, J=6.28Hz,2H), 5.77
(m, 1H), 5.73 (m,1H), 5.71 (m, 1H), 4.80 (m, 1H), 2.63 (s, 3H), 2.0 (m,2H), 1.96 (m,2H), 1.29
(m, 10H); 13
C-NMR (CDCl3, 100 MHz): δ 158.7, 144.2, 139.09, 128.8, 114.1, 61.1, 31.8, 29.2,
29, 28.9, 28.8, 26, 22.2; (MS, ESI) m/z 246 (M+)
2.2.3. Critical Micelle Concentration (CMC)
The CMCs of the ILS, C4PBr, C8PBr, and C11PBr, were determined by use of surface tension
measurements at the room temperature with KSV Sigma 703 digital tensiometer. These CMCs
were determined in both deionized water and 25 mM Tris/192 mM glycine buffer (pH 8.4).
2.2.4. Instrumentation
Fluorescence studies were performed using a SPEX Fluorolog-3 spectrofluorimeter (model
FL3-22TAU3; Jobin Yvon, Edison, NJ) equipped with a 450 W xenon lamp and R928P
photomultiplier tube (PMT) emission detector. A quartz cuvette with an optical pathlength of 0.4
cm was used and bandwidths of both the excitation and emission monochromators were set at 3
nm. Excitation of Tryptophan (Trp) was performed at 295 nm, while emission spectra were
measured in the range of 300-500 nm. Fluorescence spectra reported here were obtained from
proteins at concentration of 1 mg/ml in 25 mM Tris/ 192 mM Glycine (pH 8.4). CD data were
obtained using an AVIV Model 62DS (AVIV Associates, Lakewood, N.J.) spectrophotometer at
25 °C, fitted with a 1 mm path length quartz cell. The CD spectra of native protein samples in 25
mM Tris/192 mM Glycine (pH 8.4) were acquired at concentrations that produced optimal CD

37
signals. All CD scans were conducted in triplicate using the far UV (200-240 nm) and near UV
(240-320 nm) regions of the spectrum. Average CD spectra were recorded after correcting for
background intensity of the buffer. The CD response is reported as ellipticity and displayed in
units of millidegree (mdeg).
A Mini-PROTEAN 3 Electrophoresis Module from Bio-Rad Laboratories (Hercules, CA,
USA) was used for PAGE separations. A constant voltage of 200 V was applied for each
separation. Gels were placed in plastic containers and set on a shaker (Midwest Scientific, St.
Louis, MO, USA) during staining and destaining. Typical staining and destaining times for SDS-
PAGE were used. Protein bands were analyzed for each gel using a Kodak Gel Logic 200 Image
Analyzer (Rochester, NY, USA).
2.2.5. Binding Parameters
Binding parameters of C4PBr, C8PBr, and C11PBr, interacting with BSA were determined by
use of the fluorometric titration method. Each protein (1 mg/mL) was allowed to equilibrate for
30 min with concentrations of C4PBr, C11PBr (0-35 mM), and C8PBr (0-95 mM) in 25 mM Tris/
192 mM Glycine (pH 8.4) at 25 ºC. In biological systems where a ligand binds to a receptor
(macromolecule), Scatchard plot (ν/c vs ν)54,55
is used to determine the binding properties from
different regions of the isotherm: binding constant for each region and number of ligand binding
sites.
The various parameter characteristics of such analyses were determined as mentioned below:
Fraction of surfactant bound, α = (I-I0) / (Im-I0)
The concentration of the bound surfactant, Sb = α [Total surfactant]
The concentration of free ILS = 1 - [bound ILS]
The parameter, ν = α [Total surfactant] / [Total protein]

38
The concentration of free surfactant, c = [Total surfactant] (1-α)
Where I0 is the fluorescence intensity of the protein in the absence of ILS (C4PBr, C8PBr or
C11PBr), I is the fluorescence intensity when the protein and ILS are in an equilibrium, and Im is
the fluorescence intensity when the protein is saturated with ILS. Each linear portion of a
Scatchard plot was given a linear fit and the equilibrium binding constant (K) and number of
binding sites (n) for a particular concentration region were obtained from the slope and the
intercept respectively.
2.2.6. Electrophoretic Separation
Standard 10× running buffer (RB) stock solution contained 25 mM Tris and 192 mM
Glycine (pH 8.4). The RB solution was prepared by pipetting an appropriate amount of ILS (or
SDS) into a volumetric flask, dissolving it with 50 mL of running buffer stock solution, and
diluting up to a final volume of 500 mL with ultrapure water (18.2 MΩ). Concentrations of
0.0125%, 0.025%, 0.05%, 0.1%, and 0.5% (w/v) ILS were used in the running buffer for
optimization and validation of separations. The sample buffer (SB) was prepared in 2 mL
Eppendorf tubes by combining appropriate amounts of ultrapure water, 50 mM Tris-HCl (pH
6.8), glycerol, bromophenol blue, and 0.025%, 0.05%, 0.25%, 0.5%, 1% (w/v) of ILS (or
SDS). Proteins from stock solution (3 mg/mL) were added into the SB at protein:SB
ratio of 1:20. The reducing agent, β-mercaptoethanol, was added at 5% (v/v) into the SB. The
running buffer was loaded into the inner and outer chambers of the Mini-PROTEAN 3 module.
For ILS, no heating of samples was needed. However, for SDS, each sample was heated at 95
°C for 5 minutes on a dry bath incubator purchased from Fisher Scientific (Pittsburgh, PA,
USA). Fifteen microliters (15 µL) of sample were loaded into each well of the 4-20% Tris-HCl
gradient mini gels. Migration time was 40 minutes for all separations. After each separation,

39
gels were rinsed with ultrapure water (18.2 MΩ), stained with approximately 20 mL of
Coomassie Blue Stain, and placed on a shaker. Gels were destained using ultrapure water (18.2
MΩ) until a clear background was visible.
2.3. Results and Discussion
2.3.1. Critical Micelle Concentration
Surface tension measurements were performed to evaluate the surface activity of three
pyridinium ILS in water and 25 mM Tris/192 mM glycine buffer (pH 8.4). Figure 2.1 depicts the
surface tension (γ) verses concentration (C) plots for CnPBr (n= 4, 8, 11) in water and in buffer at
25 oC. The surface tension of ILS both in water and buffer progressively decreases with an
increase in concentration. After that, it reaches a plateau region indicating that micelles are
formed, and the concentration of the break point corresponds to the CMC. The values of the
CMC decreases in order of C4PBr > C8PBr > C11PBr, in accordance with increased
hydrophobicity owing to an extension of the hydrocarbon chain. Increasing the hydrophobic
chain length decreases the water solubility of ILS, and causes close packing of the ILS within
micelles, which facilitates the formation of micelles at a lower concentration.56
The CMC also
depends on the ionic strength or salt effect. Hydrophobic interactions can be enhanced by an
increase in ionic strength.57
The reduction in the CMC in the presence of electrolytes for ionic
detergent is likely due to a reduction in the electronic environment surrounding the ionic head
groups. Addition of electrolytes decreases the repulsion between similarly charged ionic head
groups within a micelle and therefore, the detergent monomers can pack more tightly, and thus
the CMC is reduced.58
The overall CMC in buffer is lower as compared to the CMC in water
(Table 2.1).

40
y = -0.0831x + 78.413
y = -0.0427x + 76.54
73.50
74.00
74.50
75.00
75.50
76.00
76.50
77.00
77.50
78.00
78.50
0 20 40 60 80
γ (m
N/m
)
concentration (mM)
(A)
(B)
(C)
(D)
(E)
(F)
Figure 2.1. Tensiometric analysis of CMC of C4PBr (A and D), C8PBr (B and E), C11PBr (C and F) in
water (A-C) and 25 mM Tris/glycine buffer (D-F) respectively

41
Table 2.1. CMC of ionic liquids; 1-butene-4-methylpyridiniumbromide (C4PBr), 1-octene- 4-
methylpyridiniumbromide (C8PBr), and 1-undecene-4-methylpyridiniumbromide (C
11PBr).
2.3.2. Separation of Proteins by ILS-PAGE
Separation of a mixture of five proteins, i.e. Cat, Tf, BSA, Ova, and α-Lact (pI 4-6), has been
evaluated by using ionic liquids in PAGE. ILS with C4, C8, C11 alkyl chains (C4PBr), (C8PBr)
and (C11PBr) were used as buffer additives in both sample and running buffers. SDS was
completely replaced by use of ILS in PAGE. The electrophoretic migration patterns of proteins
in mixtures as well as purified form were studied. The electropherogram displayed in Figure 2.2
was obtained by use of 0.025% (w/v) C4PBr in sample buffer and 0.025% (w/v) C4PBr in
running buffer.
Figure 2.2. ILS-PAGE with 0.025% (w/v) C4PBr in protein mixture (1); Cat, 250 kDa (2); Tf,
80 kDa (3); BSA, 66 kDa (4); Ova, 45 kDa (5); and α-Lact, 14 kDa (6).
Ionic liquid
Surfactants
CMC in water
(mM)
CMC in buffer
(mM)
C4PBr 46.36 27.60
C8PBr 21.50 9.10
C11PBr 11.24 7.73

42
Cat (250 kDa) in lane 2 appeared as a single band, while Tf (80 kDa, lane 3) separated as two
highly stained bands which could be its β1 and β2 isoforms. 59
BSA (66 kDa, lane 4) appeared as
multiple bands, which may be due to the formation of oligomers.60
Ova (45 kDa, lane 5)
separated as two bands of its S and I isoforms 61
and lastly a single band of α-Lact (14 kDa, lane
6). A similar pattern for individual protein migrations was observed in bands analyzed in mixture
(lane 1).
2.3.3. Comparison of ILS-PAGE and SDS-PAGE
The resolution and migration distances of individual proteins, separated by optimum
concentration of 0.025% (w/v) C4PBr in running buffer, 0.025% (w/v) sample buffer and
ordinary SDS-PAGE were compared (Figure 2.3).
Figure 2.3. Separation of Cat (1), Tf (2), BSA (3), Ova (4), and α-Lact (5) in C4PBr-PAGE (lanes
A) and SDS-PAGE (lanes B)
In standard SDS-PAGE, all samples were heated at 95 oC for 5 minutes, while no heating
was involved in ILS-PAGE. A difference was observed in the separation pattern of Cat, Tf, BSA,
and Ova. Cat is a homotetrameric enzyme, composed of four subunits. 62
There is one major band
of each subunit (approximately 62.5 kDa) appeared 63
in SDS-PAGE, having the same Rf value

43
as BSA, while in C4PBr-PAGE, Cat (A1) separated as a single band in the range of 250 kDa. Tf
and Ova exist as isoforms; β1, β2 59
and S, I 61
respectively, due to small variations in their
carbohydrate structures. Separation of isoforms is difficult because of the smaller difference in
their Rf values and involved multiple steps of separation (chromatographic and electrophoretic
etc.). The unique property of ILS-PAGE is that the isoforms of Tf and Ova could easily be
separated as shown in A2 and A4 respectively, while SDS-PAGE failed to separate any of these
isoforms. Tf appeared as single band and if closely observed, Ova appeared as two bands (B4),
which were very close and difficult to separate by SDS-PAGE. BSA showed multiple bands
(A3) in ILS-PAGE, which could be due to the formation of oligomers. 60
In SDS-PAGE, BSA
was separated as a single band (B3). Examination of the results showed that the mobility distance
of a lower molecular weight protein (α-Lact) in ILS-PAGE was decreased as compared to SDS-
PAGE. The mobility distance could be increased by varying the conditions of PAGE, which are
concentration of surfactant, running time of the gel, and voltage.
ILS-PAGE performance of protein samples at room temperature indicates that ILS itself
solubilizes the protein in its hydrophobic environment, thus, disrupting its tertiary structure and
denaturing the protein, which was later confirmed by CD studies. In ILS-PAGE, sample buffer
concentration was 0.025% (w/v) ILS, which was 100-fold less than the standard SDS-PAGE
concentration (2% (w/v)). Running buffer concentration in ILS-PAGE was 0.025% (w/v) ILS,
while in SDS-PAGE, the running buffer concentration of SDS was 0.1% (w/v), which wass 5-
fold more than ILS-PAGE. Higher separation resolution of Tf and Ova was achieved in case of
ILS-PAGE, eventhough the migration distance of α–Lact decreased. In ILS-PAGE, separation
was achieved by using lesser amount of surfactant as compared to SDS-PAGE. No heating of

44
sample buffer will have a direct impact on reduction in time and energy usage when multiple
samples are being prepared simultaneously.
2.3.4. Factors Affecting the Separation of Protein Mixture in ILS-PAGE
Different factors affecting the separation of mixtures of five acidic proteins, i.e. ( pI 4- 6 ),
Cat, Tf, BSA, Ova, and α-Lact, have been studied, which are as follows:
2.3.4.1. Different Concentration in Sample Buffer and Alkyl Chain Length of ILS Cation
We examined the effects of different alkyl chain lengths of CnPBr (n= 4, 8, 11) as a buffer
additive on the separation of a mixture of five proteins (Cat, Tf, BSA, Ova, and α-Lact). The
concentration of ILS in the sample buffer was varied, while it was held constant (0.025% (w/v))
for the running buffer. In Fig. 2.4A, 0.025% (w/v) of C4PBr, C8PBr and C11PBr were used as
sample buffer additives respectively, which produced separation of five proteins. α-Lact (14 kDa)
exhibited shorter migration distance in case of C4 and C8 as compared to C11.This indicated that
low molecular weight protein migration was retarded by C4 and C11 ILS. At lower
concentrations, 0.025% and 0.05% (w/v), of both C4PBr and C8PBr gave clear separation (Fig.
2.4A, B). Geng et al. have reported that ILS with long alkyl chain form complex with protein by
hydrophobic and electrostatic interactions.64
Stronger hydrophobic interactions could damage the
ILS-protein complex, so at higher concentrations, 0.25%-1% (w/v), of C8PBr and C11PBr in
running buffer damage the ILS-protein complex, which deteriorate the separation of protein
mixture (Fig. 2.4E). The results indicate that, at higher concentrations of longer alkyl chain ILS,
as buffer additive in ILS-PAGE result poor separation of proteins. Overall, shorter alkyl chain
(C4, C8) ILS at lower concentration as buffer additive were suitable for protein mixture
separation.

45
Figure 2.4. ILS-PAGE of protein mixture (Cat, 250 kDa; Tf, 80 kDa; BSA, 66 kDa; Ova, 45
kDa; α-Lact, 14 kDa) with C4-C
11PBr concentration (w/v) of (A) 0.025% (w/v) (B) 0.05% (C)
0.25% (D) 0.5% (E) 1% in sample buffer, while running buffer concentration is 0.025% (w/v) of
C4PBr–C
11PBr.
2.3.4.2. Different Concentrations of ILS in Running Buffer
C4PBr ILS at a low concentration in sample buffer, 0.025% (w/v) was chosen to optimize the
concentration of ILS in running buffer as it gave optimum separation in the previous section. In
this regard, the effect of different concentrations of C4PBr ILS (0.1-0.0125% w/v) in running
buffer on the separation of protein mixture (Cat, Tf, BSA, Ova, and α-Lact) and their migration
patterns were investigated. The resolution of proteins was poor and the larger molecular weight
protein exhibited shorter migration distance at higher (0.1-0.05% (w/v)) and very low (0.012%
(w/v)) concentrations of C4PBr in the running buffer. The higher concentrations of ILS made the
Ova (45 kDa) band virtually disappear, while α-Lact (14 kDa) appeared as a dark condense band
(Fig. 2.5A, B). These results showed that using a lower concentration, 0.025% (w/v) of C4PBr,
C4 C8 C11
A B C
D E
C4 C8 C11 C4 C8 C11
C4 C8 C11 C4 C8 C11

46
better performance, resolution, and mobility distance of proteins were improved (Fig. 2.5C), and
this was the optimized concentration of ILS in running buffer. As compared to ordinary SDS-
PAGE, 0.025% (w/v) of C4PBr in running buffer enhanced the mobility distance of all proteins
except α-Lact, which could be modified by changing the parameters of gel electrophoresis, and
by running the gel at lower voltage for longer time periods. The change in electrophoretic
mobility of proteins in ILS-PAGE could be due to the positive charge and hydrophobic alkyl
Figure 2.5. Effects of different concentrations (w/v) of C4PBr in running buffer (A) 0.1%, (B)
0.05%, (C) 0.025%, and (D) 0.0125% for separation of protein mixture. Sample buffer
concentrations were kept constant at 0.025% (w/v) in A, B, C, and D comparing 0.025% (w/v)
(C) with ordinary SDS (E)
Chain in the ILS cation, which produce electrostatic and hydrophobic interactions with proteins.
This may play an important role in changing their electrophoretic mobility.
2.3.5. Separation Mechanism of ILS-PAGE
In SDS-PAGE, protein separation is entirely dependent upon the molecular mass of
proteins.27,65,66
In contrast, ILS-PAGE separation is based on charges on proteins and their
molecular masses. Based on this study, we have proposed the following mechanism of protein
47
separation in ILS-PAGE. ILS in solution first interact or form complex with protein and induce
conformational changes in protein structure, which results in protein unfolding, exposing the
acidic amino acids on the surface of protein, and thus proteins acquire negative charges due to
the alkaline pH of the electrode buffer. Geng, et al. have reported that ILS with long alkyl chain
form complexes with proteins by electrostatic and hydrophobic interactions.64
The charge
strengths of proteins depend upon the difference in buffer pH and pI of the protein. Thus, the
migration of proteins in ILS-PAGE could be the function of their net charge and molecular
size.67
Electrophoretic mobility is directly related to net charge and inversely related to mass of
protein.
Other factors that could be involved in protein separation are hydrophobic and electrostatic
interactions, as well as hydrogen bonding. Better resolution of Tf and Ova was achieved in ILS-
PAGE, due to the stronger hydrophobic interactions between pyridine possessing longer alkyl-
chain ionic liquids and proteins,57,68
even though the concentrations of ILS used in sample and
running buffer were far below the CMC of this ILS. Hydrophobic interaction increases from
C4PBr > C8PBr > C11PBr. Electrostatic interactions also play a role, possibly between the
negatively charged sites on proteins and ILS-cation. ILS can also bind to proteins by H-bonding
interactions, which are between their cationic head groups and amino acid residue at the surface
of protein. Fluorescence and CD studies, which are discussed later, also support this supposition
for this phenomenon. In conclusions, ILS could be promising alternative surfactants to perform
electrophoresis separations in the future. However, these surfactants are not yet ready to replace
SDS without optimization of other separation parameters (e.g. buffer composition, voltage and
running time of gel).

48
2.3.6. Fluorescence Studies
For macromolecules, fluorescence measurements can provide information regarding binding
mechanism of a ligand to a protein.69
The fluorescence of intrinsic Trp residue was used to
determine the binding of BSA to three ligands, i.e. C4PBr, C8PBr, and C11PBr.The binding
properties of SDS to BSA has been reported earlier.70,71
BSA has two Trp residues in the native
state, one buried in the hydrophobic pocket and the other located towards the outer surface
(solvent accessible). To examine whether CnPBr binds to BSA, fluorescence measurements were
performed in 25 mM Tris/192 mM Glycine buffer (pH 8.4) at 25 ºC. In this study, a titration
method was adopted in which BSA concentration was held constant (10 µM), while varying the
concentration of CnPBr (n=4, 8, 11). The excitation wavelength for Trp is 295 nm, while the
maximum emission wavelength (i.e. λmax) is 352 nm in the absence of CnPBr (n=4, 8, 11). The
Trp emission of BSA was gradually quenched with increasing concentration of ILS. The initial
blue shift was accompanied by a red shift of the maximum emission peak until the point of
saturation was reached, after which there was no additional quenching or shifting of emission
maxima even by further increasing the concentration of ILS (Fig. 2.6).
348
349
350
351
352
353
354
0 10 20 30 40
Wavele
ngth
Maxim
um
(nm
)
Concentration of C11PBr(mM)
Figure 2.6. Fluorescence wavelength maxima shift of Trp in the presence of increasing
concentration of C11
PBr in association with BSA (10 uM), determined by steady state
fluorescence ( λex
=295 nm, 25 oC).

49
The red shift and quenching in the Trp emission maxima of BSA with increasing
concentration of the ligand are attributed to changes in the conformation of the proteins.72
Such a
conformational change induced by binding of ligand to the protein leads to exposure of Trp
residue to a relatively hydrophobic domain. Fluorescence quenching increases with increasing
the alkyl chain length of CnPBr (n=4, 8, 11), so hydrophobic interactions increase from C4PBr to
C11PBr.57
Hence, it is speculated that hydrophobic interactions play an important role in the
interaction of CnPBr with protein. In order to confirm this, NaCl was added to Tris-Glycine
buffer (pH 8.4), and the concentration was increased from 0.1 to 1.0 M. At the higher NaCl
concentration (1.0 M), fluorescence intensity of Trp dramatically decreases with increasing
C11PBr concentration (from 1.5 to 4.0 mM) compared to the system containing 0.1 M NaCl (Fig.
2.7).
Figure 2.7. Effects of C11
PBr on the fluorescence intensity of BSA at different NaCl
concentration (0.1, 1 mol L-1
)
The ionic strength of the system increases due addition of NaCl, which could enhance
hydrophobic interactions between ionic liquid and protein. 57,73
This is attributed to a contention
that hydrophobic interactions between ILS and protein plays an important role in protein
separation by ILS-PAGE.

50
2.3.6.1.Binding Studies and Scatchard Analysis
Scatchard plots demonstrate the types of binding, particularly when multi-site ligand binding
is suspected.74
Generally, there are four characteristic binding regions: (a) specific binding to
high energy sites on the protein, which are believed to be electrostatic, (b) noncooperative
binding, (c) cooperative binding, where protein unfolding is believed to occur and a marked
increase in binding, and (d) saturation, in which micelles co-exist with the saturated protein and
no further binding occurs.71
Figure 2.8. Fraction bound of C11
PBr (circles), C8PBr (triangles) and C
4PBr (solid diamonds) to
BSA (10 μM) with increasing concentration of C11
PBr, C8PBr,(0-30 mM), C
4PBr ( 0-80 mM).
The binding isotherms for ILS to BSA suggest that the concentration for saturation binding
was determined by the alkyl chain length of the ILS. Fig. 2.8 suggests that for the ILS with the
longest alkyl chain length, saturation binding was attained at much lower concentration followed
by the other two ILS in the order of decreasing chain length. This observation indicates that
hydrophobicity of the ILS is a very important factor, which directs ILS-BSA complexation. Also,
interactions between ILS and BSA is found to be primarily hydrophobic.
0
0.2
0.4
0.6
0.8
1
1.2
0 20 40 60 80
Fra
ctio
n B
ound
Concentration of IL (mM)
0
0.2
0.4
0.6
0.8
1
1.2
0 20 40
Fra
ctio
n B
ou
nd
Concentration of IL(mM)

51
Scatchard plots for binding of C11PBr, C8PBr, and C4PBr suggest that the binding mechanism
of the three ionic liquids to BSA is significantly different from each other. For SDS, Scatchard
analysis with BSA was reported earlier by Das, et al.70
Scatchard plots characteristic at different
concentration regions suggest that binding of these ILS to BSA follows separate mechanism in
various concentration regions.
Scatchard analysis (Fig. 2.9., Table 2.2.) revealed that ILS produce a highly cooperative
binding mechanism in low concentration regions. The binding mechanism of ILS to BSA is in
direct opposition to what has been reported earlier for conventional anionic surfactant SDS.70
The concave downward Scatchard plot revealed that C11PBr shows positive cooperative binding
Figure 2.9. Scatchard plots of BSA with (A) C11
PBr, (B) C8PBr, (C) C
4PBr

52
with BSA in the low concentration region (0-1 mM) (Figure 2.9.), while SDS showed negative
cooperative binding with BSA in a similar low concentration region.
Below 2 mM, C11PBr showed positive cooperative binding, which revealed that binding of
ILS to one site on BSA increases the C11PBr binding affinity to subsequent sites of the protein.
Table 2.2. Types of cooperative binding for ILS in the low concentration region
Above 2 mM, C11PBr exhibited negative cooperative binding which revealed that in this
concentration region, BSA was saturated with ILS and thus binding at one site lowers the
binding affinity at adjacent site. At higher concentrations (3.4-5.4 mM), SDS showed positive
cooperative binding followed by a linear region characteristic of non-specific binding.54
The
highest binding of SDS with BSA occurs in this region (4.1-5.4 mM) because of micellization.
At higher concentrations (7-15 mM), C11PBr exhibited nonspecific binding which revealed that
with increasing surfactant concentration, BSA saturated with ILS, no further binding occurs, and
micelles co-exist with saturated protein.71
Summarizing the results from intrinsic fluorescence
data for all ILS studied for BSA, it is apparent that C11PBr binding to protein is more cooperative
than C8PBr and C4PBr at lower concentrations. We attribute this phenomenon to hydrophobicity
ILS BSA
C11
PBr Region1 Region2 Region3 Region4
sp, +
+ - n.sp
Region1 Region2 Region3 Region4
sp -
n.sp
Region1 Region2 Region3 Region4
sp
+ - n.sp
Sp=specific binding, + = positive cooperative binding, - = negative cooperative binding, n.sp= nonspecific
binding.
C8PBr
C4PBr
-
Regions

53
(hydrophobic domain) that exists in C11PBr more than C8PBr and C4PBr. Therefore for BSA,
binding occurs primarily through hydrophobic interactions.
2.3.7. Protein Denaturation Monitored by CD Studies
In order to investigate the influence of ILS (C11PBr) on protein conformation as compared to
the conventional surfactant SDS, CD spectra of BSA in the absence and presence of C11PBr were
obtained from 200-250 nm (Fig. 2.10). CD spectrum of BSA consists of two negative bands in
the ultraviolet region at 208 (π-π* transition) and 222 nm (n-π* transition), which is a
A
B
C
Figure 2.10. The CD spectra of BSA (10 μM) with increasing concentration of C11
PBr (A) SDS
(B), in the presence of heated sample of 0.025% (w/v) (0.86 mM) SDS and unheated 0.025%
(w/v) (0.86 mM) C11
PBr (C). The buffer was 25mM Tris/192 mM Glycine at pH 8.4 and 25oC.

54
characteristic of α-helical structure of a protein.75
In this study, we found that interaction of
C11PBr with BSA caused a dramatic increase in band intensity at all wavelengths of far UV CD
with a significant shift in peak position (Fig. 2.10A). This clearly indicates that there was a
significant conformational change occurring and BSA begins to unfold.76
The shift in CD signal
for the 208 nm minimum at 2 mM suggests a decrease in α-helical content in the presence of
C11PBr. The change in secondary structure of BSA is quite significant as the ellipticity increases
at both wavelengths (208, 222 nm) with increasing concentration of IL from 0-7 mM (Fig.
2.10A). In the case of SDS (Fig. 2.10B), there was a small increase in ellipticity from 0-5 mM
concentration, which suggests that SDS did not appreciably change the conformation of BSA.
The results clearly indicates major changes in the protein structure, namely a significant decrease
in α-helical content in protein. This may be caused by interactions between the IL and BSA,
which leads to a swelling of biomacromolecule and exposing of hydrophobic residues.77
Thus,
some of the original α-helices are broken to give a more open disordered structure.
One of the denaturation processes of proteins in standard SDS-PAGE is to heat the sample
buffer at 95 ºC for 5 minutes. However, in ILS-PAGE, it was observed that IL itself denature the
protein without heating, and this was confirmed by CD studies. The CD spectra in Fig. 2.10C
showed that there is an increase in ellipticity along with a significant shift at 208 nm for
unheated 0.86 mM (0.025% (w/v)) C11PBr. The heated 0.86 mM (0.025% (w/v)) SDS showed a
smaller increase in ellipticity with no shift at 208 nM. The above results suggest that C11PBr
denatured the protein at lower concentration without heating as compared to the conventional
surfactant, which required heating of sample buffer.

55
2.4. Conclusions
In this chapter, an ILS-PAGE method is established for the separation of low and higher
molecular weight, acidic proteins, using CnPBr (n=4, 8, 11) as buffer additives in both sample
and running buffers. The effects of ILS with four, eight, and eleven carbons have been evaluated.
Better separation was achieved with shorter carbon chain (C4, C8) ILS at lower concentration.
The longer carbon chain (C11) ILS at higher concentration gave poor separation. The stronger
hydrophobic interactions between longer carbon chain ILS and protein could distruct the protein-
ILS complex, which would deteriorate the separation of proteins. This method improves
separation and resolution of transferrin and ovalbumin in comparison to ordinary SDS-PAGE.
Overall resolution of proteins in ILS-PAGE is improved even though the migration distance of
α-Lact decreases. However, this can be improved by optimization of other separation parameters
(e.g., buffer compositions, voltage of instrument, and running time of gel). The experimental
data obtained from intrinsic fluorescence studies showed that binding of ILS to protein is more
cooperative at low concentration, as compared to the mostly negative cooperative binding with
SDS. In addition, CD studies revealed that ILS denature the protein without heating. Further
studies are underway in our laboratory to explore the applications of these ILS and their
molecular micelles for separation of hydrophobic proteins.
2.5. References
1. Chen, C. H. Analytica chimica acta 2008, 624, 16.
2. Wang, H.; He, Y.; He, X.; Li, W.; Chen, L.; Zhang, Y. Journal of separation science 2009,
32, 1981.
3. D’Attoma, A.; Heinisch, S. Journal of Chromatography A 2013, 1306, 27.
4. Yang, G.; Zhang, X.; Lei, H.; Niu, W.; Bai, L. Analytical Letters 2013, 46, 1477.

56
5. Wagner, K.; Racaityte, K.; Unger, K.; Miliotis, T.; Edholm, L.; Bischoff, R.; Marko-Varga,
G. Journal of Chromatography A 2000, 893, 293.
6. Chen, X.; Ge, Y. PROTEOMICS 2013, 13, 2563.
7. Wu, R.; Wang, Z.; Zhao, W.; Yeung, W. S.; Fung, Y. S. Journal of chromatography. A 2013,
1304, 220.
8. IKI, N.; YEUNG, E. Journal of chromatography. A 1996, 731, 273.
9. Albarghouthi, M. N.; Stein, T. M.; Barron, A. E. Electrophoresis 2003, 24, 1166.
10. Dodd, D. W.; Hudson, R. H. Electrophoresis 2007, 28, 3884.
11. Schägger, H.; Von Jagow, G. Analytical biochemistry 1987, 166, 368.
12. Wang, W.; Lu, J. J.; Gu, C.; Zhou, L.; Liu, S. Analytical chemistry 2013, 85, 6603.
13. Hsieh, J.-F.; Chen, S.-T. Biomicrofluidics 2007, 1, 014102.
14. Burre, J.; Beckhaus, T.; Schagger, H.; Corvey, C.; Hofmann, S.; Karas, M.; Zimmermann,
H.; Volknandt, W. Proteomics 2006, 6, 6250.
15. Li, X.; Cao, J.; Jin, Q.; Xie, C.; He, Q.; Cao, R.; Xiong, J.; Chen, P.; Wang, X.; Liang, S.
Journal of cellular biochemistry 2008, 104, 965.
16. Yang, X.; Clifton, J.; Huang, F.; Kovac, S.; Hixson, D. C.; Josic, D. Electrophoresis 2009,
30, 1185.
17. Zgoda, V. G.; Moshkovskii, S. A.; Ponomarenko, E. A.; Andreewski, T. V.; Kopylov, A. T.;
Tikhonova, O. V.; Melnik, S. A.; Lisitsa, A. V.; Archakov, A. I. Proteomics 2009, 9, 4102.
18. Addis, M. F.; Tanca, A.; Pagnozzi, D.; Rocca, S.; Uzzau, S. Proteomics 2009, 9, 4329.
19. Wittig, I.; Braun, H.-P.; Schägger, H. Nature Protocols 2006, 1, 418.
20. Aivaliotis, M.; Karas, M.; Tsiotis, G. Journal of proteome research 2007, 6, 1048.
21. Arndt, C.; Koristka, S.; Bartsch, H.; Bachmann, M. In Protein Electrophoresis; Springer:
2012, p 49.
22. Rothe, G. M.; Purkhanbaba, H. Electrophoresis 1982, 3, 43.
23. Ghosh, S. Colloids and Surfaces B: Biointerfaces 2008, 66, 178.

57
24. Ghosh, S. Journal of Colloid and Interface Science 2001, 244, 128.
25. Laemmli, U. K. Nature 1970, 227, 680
26. Jungblut, P.; Thiede, B.; Zimny-Arndt, U.; Müller, E.; Scheler, C.; Wittmann-Liebold, B.;
Otto, A. Electrophoresis 1996, 17, 839.
27. Shapiro, A. L.; Vinuela, E.; Maizel, J. V., Jr. Biochemical and biophysical research
communications 1967, 28, 815.
28. Reynolds, J. A.; Tanford, C. Proceedings of the National Academy of Sciences 1970, 66,
1002.
29. Malhotra, M.; Sahal, D. International journal of peptide and protein research 1996, 48, 240.
30. Allen, R. C.; Saravis, C. A.; Maurer, H. R. Gel electrophoresis and isoelectric focusing of
proteins; de Gruyter Berlin, 1984.
31. Margulies, M. M.; Tiffany, H. L. Analytical biochemistry 1984, 136, 309.
32. Andrews, A. T. Electrophoresis: theory, techniques, and biochemical and clinical
applications; Clarenden Press, 1986.
33. Hames, B. D.; Rickwood, D. Gel electrophoresis of proteins: a practical approach; IRL
Press, 1981.
34. Ross, A. R.; Lee, P. J.; Smith, D. L.; Langridge, J. I.; Whetton, A. D.; Gaskell, S. J.
Proteomics 2002, 2, 928.
35. Furthmayr, H.; Timpl, R. Analytical biochemistry 1971, 41, 510.
36. Cannon-Carlson, S.; Tang, J. Analytical biochemistry 1997, 246, 146.
37. Zhang, N.; Li, L. Analytical chemistry 2002, 74, 1729.
38. Zardoya, R.; Diez, A.; Mason, P. J.; Luzzatto, L.; Garrido-Pertierra, A.; Bautista, J. M.
BioTechniques 1994, 16, 270.
39. Krossing, I.; Slattery, J. M.; Daguenet, C.; Dyson, P. J.; Oleinikova, A.; Weingärtner, H.
Journal of the American Chemical Society 2006, 128, 13427.
40. van Rantwijk, F.; Sheldon, R. A. Chemical reviews 2007, 107, 2757.
41. Shu, Y.; Chen, X.-W.; Wang, J.-H. Talanta 2010, 81, 637.

58
42. Ge, L.; Wang, X.-T.; Tan, S. N.; Tsai, H. H.; Yong, J. W.; Hua, L. Talanta 2010, 81, 1861.
43. Qiu, H.; Zhang, Q.; Chen, L.; Liu, X.; Jiang, S. Journal of separation science 2008, 31, 2791.
44. Chitta, K. R.; Van Meter, D. S.; Stalcup, A. M. Analytical and bioanalytical chemistry 2010,
396, 775.
45. Wang, Y.; Tian, M.; Bi, W.; Row, K. H. International journal of molecular sciences 2009,
10, 2591.
46. Zhang, M.; Liang, X.; Jiang, S.; Qiu, H. TrAC Trends in Analytical Chemistry 2014, 53, 60.
47. Buszewski, B.; Studzińska, S. Chromatographia 2008, 68, 1.
48. Corradini, D.; Nicoletti, I.; Bonn, G. K. Electrophoresis 2009, 30, 1869.
49. Wu, X.; Wei, W.; Su, Q.; Xu, L.; Chen, G. Electrophoresis 2008, 29, 2356.
50. Kašička, V. Electrophoresis 2010, 31, 122.
51. Tang, S.; Liu, S.; Guo, Y.; Liu, X.; Jiang, S. Journal of Chromatography A 2014, 1357, 147.
52. Joshi, M. D.; Anderson, J. L. Rsc Advances 2012, 2, 5470.
53. Hu, Y.-J.; Liu, Y.; Pi, Z.-B.; Qu, S.-S. Bioorganic & medicinal chemistry 2005, 13, 6609.
54. Notides, A. C.; Lerner, N.; Hamilton, D. E. Proceedings of the National Academy of Sciences
1981, 78, 4926.
55. Perlmutter-Hayman, B. Accounts of Chemical Research 1986, 19, 90.
56. Zana, R.; Benrraou, M.; Rueff, R. Langmuir 1991, 7, 1072.
57. Yan, H.; Wu, J.; Dai, G.; Zhong, A.; Chen, H.; Yang, J.; Han, D. Journal of Luminescence
2012, 132, 622.
58. Rosen, M. J.; Kunjappu, J. T. Surfactants and interfacial phenomena; John Wiley & Sons,
2012.
59. Görögh, T.; Rudolph, P.; Meyer, J. E.; Werner, J. A.; Lippert, B. M.; Maune, S. Clinical
chemistry 2005, 51, 1704.
60. Babcock, J.; Brancaleon, L. International journal of biological macromolecules 2012.
61. Covaciu, M.; Olaru, F.; Petrescu, I. OVALBUMIN ISOFORMS ¬PURIFICATION AND
DENATURATION / RENATURATION STUDIES, 2004; Vol. 5.

59
62. Aydemir, T.; Kuru, K. Turkish Journal of Chemistry 2003, 27, 85.
63. Walicke, P.; Varon, S.; Manthrope, M. The Journal of neuroscience 1986, 6, 1114.
64. Geng, F.; Zheng, L.; Yu, L.; Li, G.; Tung, C. Process biochemistry 2010, 45, 306.
65. James, T. L.; Milos, N. C. Analytical Biochemistry 2007, 367, 134.
66. Lacher, N. A.; Wang, Q.; Roberts, R. K.; Holovics, H. J.; Aykent, S.; Schlittler, M. R.;
Thompson, M. R.; Demarest, C. W. Electrophoresis 2010, 31, 448.
67. Ramos, Y.; Gutierrez, E.; Machado, Y.; Sánchez, A.; Castellanos-Serra, L.; González, L. J.;
Fernández-de-Cossio, J.; Pérez-Riverol, Y.; Betancourt, L.; Gil, J. Journal of proteome
research 2008, 7, 2427.
68. Jiang, T.-F.; Gu, Y.-L.; Liang, B.; Li, J.-B.; Shi, Y.-P.; Ou, Q.-Y. Analytica chimica acta
2003, 479, 249.
69. Ojha, B.; Das, G. The Journal of Physical Chemistry B 2010, 114, 3979.
70. Das, S.; Sylvain, M. R.; Fernand, V. E.; Losso, J. N.; El-Zahab, B.; Warner, I. M. Journal of
colloid and interface science 2011, 363, 585.
71. Gelamo, E.; Silva, C.; Imasato, H.; Tabak, M. Biochimica et Biophysica Acta (BBA)-Protein
Structure and Molecular Enzymology 2002, 1594, 84.
72. Chakraborty, T.; Chakraborty, I.; Moulik, S. P.; Ghosh, S. Langmuir 2009, 25, 3062.
73. Melander, W.; Horváth, C. Archives of biochemistry and biophysics 1977, 183, 200.
74. Ercolani, G. Journal of the American Chemical Society 2003, 125, 16097.
75. Gull, N.; Chodankar, S.; Aswal, V.; Sen, P.; Khan, R. H. Colloids and Surfaces B:
Biointerfaces 2009, 69, 122.
76. Peyre, V.; Lair, V.; André, V.; le Maire, G.; Kragh-Hansen, U.; le Maire, M.; Møller, J. V.
Langmuir 2005, 21, 8865.
77. Nielsen, A. D.; Borch, K.; Westh, P. Biochimica et Biophysica Acta (BBA)-Protein Structure
and Molecular Enzymology 2000, 1479, 321.

60
CHAPTER 3: CATIONIC IONIC LIQUID SURFACTANT-POLYACRYLAMIDE GEL
ELECTROPHORESIS FOR ENHANCED SEPARATION OF ACIDIC AND BASIC
PROTEINS WITH SINGLE-STEP RIBONUCLEASE B GLYCOFORMS
SEPARATION
3.1. Introduction
Polyacrylamide gel electrophoresis (PAGE) has long been a major tool for electrophoretic
mobility-based protein separation.1,2,3,4,5
In this technique, ionic surfactants are employed; these
surfactants bind to proteins and usually cause protein unfolding. Anionic PAGE 6,7,8
and cationic
PAGE 9,10,11
are two types of PAGE techniques that depend on the type of surfactant, i.e. anionic
and cationic respectively, buffer pH, and the direction of electrophoretic mobility.
The most widely used PAGE technique — sodium dodecyl sulfate (SDS)-PAGE is anion-
based; SDS is an anionic surfactant. SDS-PAGE has been extensively used for mass-based
protein separations for the past several decades.12,13,14,15
In this technique, SDS-treated protein
samples are boiled and then loaded onto SDS-based polyacrylamide gels, while employing a
needed voltage for electrophoresis. SDS has been shown to homogeneously bind to most
proteins, thus conferring the same negative charge to all surfactant-protein complexes. Therefore,
upon application of voltage, these protein complexes migrate from cathode to anode, and the
distance of migration is dependent primarily on the mass of proteins. This is because the mass of
the complexed SDS molecules is negligible compared to the protein mass.
The SDS-PAGE technique is the primary technique for protein separation. However, many
examples of anomalous protein migration patterns have been reported, particularly for membrane
protein separations.16,17,18
These problems may arise due to differential surfactant binding to
hydrophobic domains in more complex membrane proteins.19,18, 20
The amount of SDS actually
interacting with every amino acid residue within a given protein is greatly affected by the

61
presence of inter/intra-molecular bonds (characteristic of the protein tertiary structure). For
example, intact disulfide bonds in lysozyme limit SDS binding to this protein.21
In such a non-
reduced state, this protein is more compact and migration in the electric field is anomalously fast.
In contrast, a higher number of SDS molecules bind to reduced lysozyme and the completely
denatured protein migrates slower due to less compactness and loss of the tertiary structure.
Similar to non-reduced lysozyme proteins, complex membrane proteins with intact hydrophobic
interactions tend to bind less amount of SDS. As a result, they migrate faster than the calibration
standards.
It should be noted that glycoproteins are commonly present in membrane protein fractions
and that SDS-PAGE is not an efficient separation technique for such proteins. Separation of
glycoproteins by use of SDS-PAGE often yields broad and fuzzy bands due to extensive negative
charges on their carbohydrate side chains.22,20
This significantly reduces the sensitivity and
resolution of the technique. Similarly, subunits of post-translationally modified protease
complexes are not visualized using SDS-PAGE. However, such systems are observed to be well
resolved in cetyltrimethyl ammonium bromide (CTAB)-PAGE, a cationic PAGE technique.9
This difference in separation has been ascribed to incompatibility between highly negatively
charged hydrophobic protein subunits in anionic PAGE. Therefore, use of cationic surfactants,
which can neutralize excess negative charges on proteins, has been suggested for overcoming
this deficiency.22
Cationic PAGE depends on cationic surfactants binding to proteins and forming positively
charged surfactant-protein complexes often at low pH values. In contrast to SDS-PAGE, these
complexes migrate from anode to cathode in an electric field. In addition to CTAB, 9-10, 22
numerous other cationic surfactants have been suggested for use in cationic PAGE, including

62
benzyldimethyl-n-hexadecylammonium chloride (16-BAC),23,24
tetradecyltrimethylammonium
bromide,25
and cetylpyridinium chloride.26
Cationic surfactants have mostly been used to separate membrane proteins with post-
translational modifications, more commonly, glycoproteins.22,23,9
Glycoproteins often exist as
variable glycosylated populations of the same protein, which are known as, glycoforms.
Glycoform analysis is important as the attached glycans may control protein function and
conformation. These different glycoforms may reflect the cell environment, physiological
conditions, as well as disease states.27,28
Thus far, none of the one dimensional (1D)-PAGE
techniques have been able to separate glycoforms into species with distinct migration values.
SDS- PAGE (1D) generally separates glycoproteins into broad bands due to protein
heterogeneity.29
As a result, further analyses of proteins present in those bands are often
required. Typically, this process involves releasing glycans using in-gel deglycosylation
followed by glycan profiling using mass spectrometry.20,27,29
An isoelectric focusing (IEF)/SDS-
PAGE (2D) technique has been used to reveal protein separations due to different pI and/or
masses of glycoforms.30
However, this technique often under-represents the amount of total
proteins as a result of the low solubility power of the non-ionic and zwitterionic surfactants
employed in IEF. Therefore, surfactants with strong solubility power as well as high resolving
power in 1D-PAGE are desired in order to overcome those limitations, especially, for glycoform
separations. In the study outlined in this manuscript, we demonstrate that certain ionic liquid
surfactants (defined as surfactants that would be liquid in pure form) can effectively separate
ribonuclease b glycoforms into multiple bands at room temperature.
Ionic liquid surfactants (ILS) are amphiphilic organic salts with a cation and an anion that
have melting points below 100 °C in the pure state. This class of materials exhibits various

63
tunable physicochemical properties, which make them ideal candidates for analytical
applications where conventional surfactants are less suitable or not applicable. High
conductivity, non-volatility, non-flammability, tunable hydrophobicity, and high chemical
stability are some of the properties of ILS, which make them suitable for PAGE applications. In
a previous study, we have used N-alkyl-4-methylpyridinium bromide ILS, 1-butene-4-
methylpyridinium bromide (C4PBr), 1-octene-4-methylpyridinium bromide (C8PBr), and 1-
undecene-4-methylpyridinium bromide (C11PBr) as buffer additives in the sample and running
buffers for anionic PAGE separation of a mixture of acidic proteins.31
Observation of high
resolving power of the technique, protein binding characteristics, and protein denaturation ability
by use of ILS suggested their further applications in protein separation.
Herein, we report the development of a cationic PAGE technique using the three ILS. The
application described here is unique and truly impactful for protein separations. In this study,
these ILS were employed in three components of the PAGE separation, i.e. the discontinuous
polyacrylamide gels, sample and running buffers. The optimization of concentrations of the ILS
in those three components is also described. A major advantage of this approach as compared to
the previous study is use of ILS to separate both acidic and basic proteins with a wide range of
molecular weights. Most importantly, a one-step separation of Rib b glycoforms is achieved
using this cationic ILS-PAGE approach. To the best of our knowledge, this is the first report of
successful separation of Rib b glycoforms into multiple discrete bands using a 1D-PAGE
technique.

64
3.2. Materials and Methods
3.2.1. Materials
Four (4)-Picoline, 4-Bromo-1-butene, 8-Bromo-1-octene, 11-Bromo-1-undecene, bovine
serum albumin (BSA), β-casein (β-Cas), myoglobin (Myo), ribonuclease b (Rib b), ovalbumin
(Ova), α-chymotrypsinogen (α-Chy), cytochrome c (Cyt c), CTAB, tris, glycine, urea, potassium
dihydrogen phosphate, potassium monohydrogen phosphate, ascorbic acid, FeSO4, pyronine Y,
and α-cyanohydroxycinnamic acid (CHCA) were purchased from Sigma Aldrich (Milwaukee,
WI). SDS, acrylamide/bisacrylamide (37.5:1) (12.5%), methylene bis acrylamide (MBA), 2-
mercaptoethanol, IEF reagents, immobilized pH gradient (IPG) gels, 2D electrophoresis precast
gels, and Bio-safe Coomassie Blue were obtained from Bio-Rad Laboratories, Inc. (Hercules,
Ca). Hydrogen peroxide (30% solution) and phosphoric acid were purchased from Mallinckrodt
Baker, Inc. (Phillipsburg, NJ).
3.2.2. Ionic Liquid Surfactants Synthesis
CnPBr (n=4,8,11) ILS were synthesized and characterized according to our previous
procedure.31
In brief, 4-Picoline (7g, 0.075 M) and n-Bromo-1-alkene, where n=4, 8, 11 (0.02 eq,
10 g, 0.074 M) were separately reacted by refluxing at 80 °C overnight. Pure products, yellow
color viscous liquids, were obtained under the specified conditions and characterized by use of
ESI-MS.
3.2.3. Instrumentation
Discontinuous polyacrylamide mini gels were freshly prepared by casting a stacking gel on
top of a resolving gel. For this purpose, Bio-Rad short and spacer glass plates (with integrated

65
1.00 mm spacers) and 10 well combs were used. Polyacrylamide gel electrophoresis was
performed by use of a Bio-Rad Mini-PROTEAN®
Tetra vertical electrophoresis system
(Hercules, CA, USA). Electrophoresis was started at 200 V, 25 mA and continued for 10 minutes
until proteins were first entered the resolving gel. Then, proteins were separated at 300 V, 80 mA
for 50 minutes or until the tracking dye reached the bottom of the gel. Gel images were captured
using a Kodak Gel Logic 200 Image Analyzer (Rochester, NY).
MALDI-MS analyses were performed by use of a Bruker UltrafleXtreme MALDI-time of
flight (TOF) mass spectrometer with an Nd:YAG laser (355 nm wavelength and 3 ns pulse
duration). Mass spectra were acquired using positive ion linear mode at 25 kV acceleration
potential and analyzed by use of Bruker FlexAnalysis 3.3 software.
3.2.4. Sample Buffer Preparation for ILS-PAGE
Urea (450 mg) was added to a mixture of glycerol (100 µL), ILS (0.02%-2% (w/v)),
ultrapure water (400 µL), and pyronine Y tracking dye (5% (w/v), 20 µL), which then vortexed
for 1 minute. The buffer was stored at room temperature.
3.2.5. Protein Sample Preparation for ILS-PAGE
Individual protein samples (1 mg/mL) and protein mixtures (1 mg/mL of each protein) were
freshly prepared by dissolving appropriate amounts of proteins in ultrapure water. The protein
sample (2.5 µL), 2-mercaptoethanol (2.5 µL) and sample buffer (47.5 µL) were mixed together
to prepare a protein sample buffer for application in gel electrophoresis.

66
3.2.6. Running Buffer Preparation for ILS-PAGE
ILS (0.02%-0.1% (w/v)) was added to glycine (150 mM) and phosphoric acid (50 mM) to
prepare 500 ml of running buffer (pH 3).
3.2.7. ILS Discontinuous Gel Preparation
The resolving gel (12.5% (w/v), 5 mL) was made first by preparing a solution of urea (3 M),
phosphate buffer (1.25 mL, pH 2.1), ILs (0.02%-0.5% (w/v)), acrylamide/bisacrylamide (12.5%
(w/v)), MBA (2% (w/v), 0.150 mL), ascorbic acid (4 mM), and FeSO4 (8 µM). Then H2O2
(0.001% (w/v)) was added to initiate the polymerization. The solution was vortexed, quickly
poured into the assembled glass plates, and allowed to polymerize for about 20 minutes. Next,
the stacking gel solution (2.5 mL) containing urea (3 M), phosphate buffer (0.625 mL, pH 4.1),
ILS (0.02%-0.5% (w/v)), acrylamide/bisacrylamide (4.00% (w/v)), MBA (2% (w/v), 0.293 mL),
ascorbic acid (4 mM), and FeSO4 (8 µM) was prepared. Then, H2O2 (0.002% (w/v)) was added,
the solution vortexed, and poured onto the resolving gel. The comb was inserted quickly and the
gel was allowed to polymerize overnight.
3.2.8. Cationic ILS-PAGE Experiment
The gel was assembled into the gel box, the running buffer was poured into the buffer tank
and the gel box with assembled gel. Protein samples (15 µL) were loaded into the wells at room
temperature. The system was closed and electrodes connected such that proteins migrated from
anode to cathode. After completion of electrophoresis, the gel was fixed with gel fixation
solution (methanol: acetic acid: water-4:1:5), maintained on a shaker for 1 hour, followed with
changes in the fixation solution every 15 minutes. After that, the gel was stained with Bio-safe

67
Coomassie Blue for 1 hour on the shaker. Finally, gel images were captured after washing with
deionized water for at least 1 hour.
3.2.9. Anionic SDS-PAGE
SDS-PAGE gel (15% (w/v)) was casted and assembled into the gel-running tray already
containing 1x Laemmli buffer (running buffer). Each protein sample (15 µL) was loaded into
each well after boiling sample buffer containing SDS at 95 °C. The samples were then allowed to
separate from cathode to anode, using a voltage of 200 V for 50 minutes. After completion of
electrophoresis, the gel was carefully rinsed with distilled water and stained using Bio-Safe
Coomassie Blue for about 30 minutes, after which it was destained with a destaining solution
(Glacial Acetic Acid and Methanol). Finally, gel images were captured after re-rinsing the gels in
distilled water.
3.2.10. MALDI-MS Analysis of Ribonuclease b Protein Bands
A separate cationic ILS-PAGE experiment was performed to analyze Rib b protein bands.
The same amount (15 µL) of protein sample was loaded into all 10 wells of the gel and the
separation was performed using C4PBr ILS (0.02% (w/v) in sample buffer, 0.05% (w/v) in gel,
and 0.05% (w/v) in running buffer). After completion of electrophoresis run, the gel was
vertically divided into two parts, i.e., five protein lanes in each. One part of the gel was stained
with coomassie blue, while the other part was used for MALDI-MS analysis without staining to
avoid interferences from the stain. The two distinct bands of Rib b protein on the stained gel
piece were used as a reference to determine the corresponding position of the two protein bands
on the unstained gel. The two parts were aligned to form a complete gel, and then two narrow
horizontal excisions on the unstained part of the gel were performed at positions matching the
68
protein bands on the stained part. The two horizontal gel parts were cut into small pieces and
placed in two separate eppendorf tubes. A saturated CHCA solution in TFA (1% (v/v)) and
acetonitrile (60% (v/v)) was added to each tube using a sufficient volume to cover all the gel
parts. These tubes were then vortexed at a high speed overnight. Finally, the matrix solution
which contained extracted proteins was retrieved and analyzed by use of MALDI-MS.
3.2.11. Two Dimensional IEF/SDS PAGE Analysis of Ribonuclease b Protein
The first dimension, IEF, was performed as described below. A lyophilized powder of Rib b
protein (5 mg) was dissolved in 2 mL of rehydration buffer containing 8 M urea, 2% (w/v)
CHAPS, 50 mM dithiothreitol (DTT), 0.2% (w/v) Bio-Lyte® 3/10 ampholytes, and a trace
amount of bromophenol blue. The sample was diluted five times with rehydration buffer and 625
µL was applied into a focusing tray. An IPG gel strip (pH 3-10) was placed in the tray
maintaining the gel side down. Care was taken not to introduce air bubbles. After that, mineral
oil (1 mL) was overlaid to avoid evaporation of the rehydration buffer. After 12 hours of
rehydration, focusing was performed in two steps. The first step was 100 V for 2 hours, followed
by 200 V for 1 hour.
After completion of IEF, the gel strip was removed from the tray and excess oil was removed
by vertically holding up the strip. Then, the strip was placed in a disposable equilibration tray
maintaining gel side up. Equilibration buffer (2 mL) containing 6 M urea, 2% (w/v) SDS, 0.375
M tris-HCl (pH 8.8), 20% (w/v) glycerol, and 2% (w/v) DTT was added to the tray containing
the gel strip and the tray was placed on an orbital shaker for gentle shake. After 10 minutes, the
buffer was carefully drained. Fresh equilibration buffer (2 mL) with 6 M urea, 2% (w/v) SDS,
0.375 M tris-HCl (pH 8.8), 20% (w/v) glycerol, and 3.75% (w/v) iodoacetamide was added to

69
the tray, which was placed on the orbital shaker for another 10 minutes to complete the
equilibration.
After the equilibration, the gel strip was removed and briefly dipped in a tris-glycine-SDS
running buffer. The gel strip was then laid gel side up on the back plate above the IPG well of
the 2D electrophoresis (2DE) precast gel. Then, the 2DE gel was vertically placed in a test tube
rack, while the gel strip was still resting on the back plate. A low melting point agarose sealing
solution was pipetted into the IPG well in order to overlay on top of the 2DE gel. After that, the
gel strip was pushed down into the well with forceps. The 2DE gel containing the IPG strip was
mounted in the gel box of the electrophoresis system to perform anionic PAGE at 200 V for 40
minutes. After completion of electrophoresis, the gel was removed and washed with deionized
water for 15 minutes with three changes every 5 minutes. Then the gel was stained with Bio-Safe
Coomassie Blue for 1 hour and then de-stained with deionized water for at least 1 hour before
capturing the gel image.
3.3. Results and Discussion
3.3.1. Optimization of Ionic Liquid Surfactant Concentration in Cationic PAGE
The three ILS used in this study have a common cationic head group (4-methyl pyridinium)
but, three different alkyl chain lengths (C4, C8, and C11) as shown in Figure 3.1(A). ILS were
applied in polyacrylamide gels, protein sample buffers, and electrophoresis running buffer in
ILS-PAGE experiments. As the first step, concentrations of ILS in polyacrylamide gels were
optimized. Then, the concentrations in sample and running buffers, and the effects of the ILS
alkyl chain length were evaluated by comparing three different ILS-PAGE techniques.

70
3.3.1. Optimization of ILS Concentration in Polyacrylamide Gels
Five different proteins, i.e., BSA, β-Cas, Myo, Rib b, and Cyt c with known molecular
weights were used in order to demonstrate the effects of different concentrations of ILS in
polyacrylamide gels for protein separation. Four different concentrations of each ILS were
chosen (0.02%, 0.05%, 0.1%, and 0.5% (w/v)) in polyacrylamide gel preparation, while ILS
concentration in sample buffer (0.02% (w/v)) and running buffer (0.05% (w/v)) were maintained
constant. Of the three ILS studied, the best results were obtained when C4PBr ILS was
Figure 3.1. Cationic PAGE with 4-methylpyridinium-based ILS. (A) The generic structure of the
ILS with 4-methyl pyridinium cation and variable alkyl chain lengths. (B) Formation of cationic
ILS-protein complex upon interaction between ILS and protein. (C) Stepwise experiments in
cationic ILS-PAGE

71
employed, so the results obtained with this ILS were reported in this chapter. The data of the
other two ILS tested were presented on the Appendix A (Figure S1). Figure 3.2 displays the
electropherograms of protein migration patterns at different concentrations of ILS in
polyacrylamide gels. An increase on the protein migration was observed when ILS
concentrations varied from 0.02% (w/v) through 0.1% (w/v) although at 0.5% (w/v) the mobility
was reduced. Sharp protein bands were obtained at low concentrations, 0.02% and 0.05% (w/v)
of C4PBr ILS. At all the concentrations, Rib b protein was resolved in two bands, this behavior is
discussed in detail in section 3.3.2. High concentrations of ILS, 0.1% and 0.5% (w/v), affected
band width and intensity as well as resulted in broad and distorted bands. In addition, at the
highest concentration of ILS (0.5% (w/v)), protein migration was reduced.
A brief overview of the protein separation mechanism is described below in order to explain
this behavior. ILS-protein complexes can be formed by binding proteins to ILS present in the
sample buffer. These complexes may have overall positive charges as a result of the cationic
(A)
0.02% (w/v)
C4PBr in gel
1 2 3 4 5 1 2 3 4 5
1 2 3 4 5
1 2 3 4 5
(B)
0.05% (w/v)
C4PBr in gel
(C)
0.1% (w/v)
C4PBr in gel
(D)
0.5% (w/v)
C4PBr in gel
Figure 3.2. Polyacrylamide gel images obtained from C4PBr-PAGE showing migrations of five
proteins, (1) BSA (pI-4.8, 66 kDa), (2) β-cas (pI-5.13, 23.6 kDa), (3) Myo (pI-6.8, 16.9 kDa), (4)
Rib b (pI-9.45, 14.7 kDa), and (5) Cyt c (pI-10, 12.3 kDa) at different concentrations, (A) 0.02%,
(B) 0.05%, (C) 0.1%, and (D) 0.5%, (w/v) of C4PBr ILS in gels. C4PBr concentrations in sample
buffer (0.02% (w/v)) and running buffer (0.05% (w/v)) were the same for all four gels.

72
charges of the ILS (see Figure 3.1 (B)). Therefore, these cationic complexes will migrate from
anode to cathode during cationic PAGE experiments (Figure 3.1(C)). Due to the presence of the
4-methylpyridinium cations of ILS in the gel, these ILS-protein complexes will be
electrostatically stabilized while they are migrating. As a result, highly resolved sharp protein
bands were obtained at 0.05% (w/v) of ILS in the gel as compared to the bands obtained at the
other concentrations analyzed. As well as at 0.05% (w/v) of ILS, the electrophoretic mobility of
proteins was increased in comparison with the 0.02% (w/v) concentration as a result of higher
conductivity, without reducing the quality of separation (Figure 3.2. (A) and (B)). Although the
electrophoretic mobility was further increased when the ILS concentration was 0.1% (w/v), the
resolution of Rib b was reduced (lane 4 in Fig 3.2 (C)). At 0.5% (w/v), band diffusion occurred,
perhaps due to excessive heating produced in gels with very high conductivity. At the same time,
repulsive forces between cationic ILS-protein complexes and ILS present in gels (0.1% and 0.5%
(w/v) ILS) may also hamper the resolution of protein bands. Considering all these effects, band
diffusion and protein band resolution, 0.05% (w/v) ILS concentration was identified as the
optimum concentration for use in our gels.
3.3.1.1. Optimization of Ionic Liquid Surfactants Concentration in Running Buffer and
Sample Buffer using a Mixture of Proteins
The effects of ILS concentrations in running buffer and sample buffer were investigated
using a mixture of five proteins; BSA (pI-4.8, 66 kDa), Ova (pI-4.6, 44.3 kDa), α-Chy (pI-8.8,
25.7 kDa), Myo (pI-16.9, 14.7 kDa), and Cyt c (pI-10, 12.3 kDa). (A different set of proteins
with discrete molecular weights were used to minimize overlapping of protein bands.)

73
This protein mixture was separated by use of C4PBr- PAGE and employing four different
C4PBr concentrations in the sample buffer, i.e., 0.01%, 0.02%, 0.05%, and 2% (w/v). The C4PBr
concentrations in the running buffer were varied from 0.025% to 0.1% (w/v). The optimum
C4PBr concentration in the gel, i.e., 0.05% (w/v), was used for all separations in this experiment.
All five proteins showed single bands when the ILS concentration was 0.01% (w/v) in the
sample buffer, regardless of the ILS concentration in the running buffer (Figure 3.3-A1, B1, and
C1). Ova protein was not resolved when higher ILS concentrations were used in the sample
buffer. Protein band resolution (compare Ova and α-Chy protein bands in A-1, B-1, and C-1 gel
images in Fig. 3.3) and migration distances increased with increasing ILS concentration in the
running buffer. This was due to higher ionic conductivity generated with higher ILS
1 2 3 4
1 2 3 4
(A) 0.025% (w/v)
C4PBr in running buffer
α-Chy
Ova
BSA
1 2 3 4
Myo
Cyt c
(B) 0.05% (w/v)
C4PBr in running buffer
(C) 0.1% (w/v)
C4PBr in running buffer
C4PBr concentrations
in sample buffer
(1) 0.01% (w/v)
(2) 0.02% (w/v)
(3) 0.05% (w/v)
(4) 2% (w/v)
0.05% (w/v) C4PBr in gels
Figure 3.3. C4PBr-PAGE separation of a mixture of five proteins; BSA (pI-4.8, 66 kDa), Ova (pI-
4.6, 44.3 kDa), α-Chy (pI-8.8, 25.7 kDa), Myo (pI-16.9, 14.7 kDa), and Cyt c (pI-10, 12.3 kDa)
from top to bottom in A-1, B-1, and C-1, using different C4PBr running buffers; (A) 0.025% (w/v)
(B) 0.05% (w/v), and (C) 0.1% (w/v) and sample buffers; (1) 0.01% (2) 0.02% (3) 0.05% (4) 2%
(w/v) with 0.05% (w/v) C4PBr gels. Note that Ova band disappears when high ILS concentrations
were included in sample buffers using all three running buffers.

74
concentrations, which aided separation. We concluded that the lowest concentration of ILS in the
sample buffer (0.01% (w/v)) and the highest concentration in the running buffer (0.1% (w/v)) are
the optimum conditions for separation of protein mixtures using ILS-PAGE.
3.3.1.2. Effects of Alkyl Chain Length in Ionic Liquid Surfactants
ILS with three different alkyl chain lengths, i.e., 4, 8, and 11 carbon atoms in C4PBr, C8PBr,
and C11PBr, respectively, were used for protein separation. ILS concentration in gels, sample
buffer, and running buffer were separately optimized for each employed ILS-PAGE techniques.
The optimized ILS concentrations are shown in the Table 3.1.
Table 3.1. Optimized ILS concentrations in C4PBr, C8PBr, and C11PBr-PAGE
ILS-PAGE Concentration of
ILS in gel
(w/v) %
Concentration of ILS in
Sample Buffer
(w/v) %
Concentration of ILS in
Running Buffer
(w/v) %
C4PBr-PAGE 0.05 0.01 0.10
C8PBr-PAGE 0.05 0.02 0.05
C11PBr-PAGE 0.05 0.02 0.05
The previous mixture of five proteins, which were used for optimization studies of running
and sample buffer concentrations, was employed for this experiment. Figure 3.4 displays the
electropherograms of three ILS-PAGE separations of protein mixture. As can be seen, C4PBr-
PAGE and C8PBr-PAGE produced five well resolved protein bands, but reduced resolution in
C11PBr-PAGE. Similarly, in our previous study, where these ILS were used as buffer additives in
anionic ILS-PAGE protein separations, C11PBr ILS resulted in poor band resolution as compared
to C4PBr and C8PBr.31

75
Thus, as the alkyl chain becomes longer, hydrophobic interactions between hydrophobic
domains of the proteins and the ILS become stronger. These strong interactions may deteriorate
protein separation by reducing resolution.32
Evidently, shorter alkyl chains, i.e., C4 and C8, are
much better suited for cationic ILS-PAGE.
3.3.2. Separation of Ribonuclease b Glycoforms in ILS-PAGE and Comparison with SDS-
PAGE
In section 3.3.1., we observed that BSA, β-cas, Myo, and Cyt c proteins migrated as sharp,
intense single bands at optimum ILS concentration in gel (reproduced in Figure 3.5(A)). In
contrast, Rib b protein (lane 4) migrated as two sharp bands. Rib b is a glycoprotein, in which a
C8PBr-PAGE C11PBr-PAGE
Cyt c
Myo
α-Chy
Ova
C4PBr-PAGE
BSA
Figure 3.4. Separation of mixture of five proteins; BSA (pI-4.8, 66 kDa), Ova (pI-4.6, 44.3 kDa),
α-Chy (pI-8.8, 25.7 kDa), Myo (pI-16.9, 14.7 kDa), and Cyt c (pI-10, 12.3 kDa) using cationic
PAGE, C4PBr-PAGE using C4PBr ILS (0.05% (w/v) in gel, 0.01% (w/v) in sample buffer, and
0.1% (w/v) in running buffer), C8PBr-PAGE using C8PBr ILS (0.05% (w/v) in gel, 0.02% (w/v)
in sample buffer, and 0.1% (w/v) in running buffer), and C11PBr-PAGE using C11PBr ILS
(0.05% (w/v) in gel, 0.02% (w/v) in sample buffer, and 0.1% (w/v) in running buffer) from left to
right respectively.

76
range of oligomannose structures (Man5 GlcNAc2 to Man9 GlcNAc2) are attached to a single N-
glycosylation site to generate five possible glycoforms.33,34,35,
These masses of glycoforms have
been distinguished by MALDI-MS and reported.33
In this study, the two bands observed in lane 4 in Figure 3.5(A) were further analyzed by
extracting the proteins from the gels and determining the mass of proteins in each band by use of
MALDI-MS. The mass of protein corresponding to the top band was revealed as 15,535.061
(m/z) and the bottom band contained protein with a mass of 15,386.181 (m/z) (Figure 3.5(B)).
Both masses matched two of the Rib b glycoform masses previously reported. As gleaned from
reported data, the top band correspond to a glycoform of Rib b with Man9 GlcNAc2, with an
1 2 3 4 5
SDS-PAGE C4PBr-PAGE MALDI-MS
(A) (B) (C)
Figure 3.5. Electropherogram of (A) cationic C4PBr -PAGE with C4PBr concentrations of 0.05%
(w/v) in gel, 0.02% (w/v) in sample buffer, and 0.05% (w/v) in running buffer (B) MALDI mass
spectra of 2 protein bands extracted from Rib b (lane 4) (C) anionic SDS-PAGE. The same set of
five proteins; (1) BSA (pI-4.8, 66.5 kDa), (2) β-cas (pI-5.1, 23.6 kDa), (3) Myo (pI-6.8, 16.9
kDa), (4) Rib b (pI-9.45, 14.7 kDa), and (5) Cyt c (pI-10.0, 12.3 kDa) were used in both SDS-
PAGE and ILS-PAGE.

77
average mass reported as 15,548 (m/z) and the bottom band represent the protein modified with
Man8 GlcNAc2 (average mass of 15,386 (m/z))33
. The technique proposed in this manuscript,
ILS-based cationic PAGE, allows separation of two glycoforms of Rib b protein. In contrast,
these glycoforms migrated as a single predominant band in SDS-PAGE (anionic PAGE) as
shown in figure 3.5(C). The mass of the additional band observed at the top of the lane did not
appear in the mass range of Rib b glycoforms (Figure S4) illustrating the failure of conventional
1D-PAGE to separate these glycoforms.
3.3.3. IEF/SDS-PAGE reveals negative charge heterogeneity on Ribonuclease b Protein
In order to understand the reason, the separation of Rib b glycoforms in ILS-PAGE, but not
in standard SDS-PAGE, we examined the properties of these glycoproteins. For this purpose, Rib
b glycoprotein was subjected to isoelectric focusing (IEF)/SDS-PAGE. A 2-D map showed
numerous spindle-shaped, ‘striated’, and slanted focusing patterns as shown in Figure 3.6. These
characteristics reflect the charge heterogeneity of the protein.36
Since the patterns are slanting
towards the positive end, it is reasoned that the charges are anionic. These anions may not be
pH 10 pH 3
Figure 3.6. 2D map (IEF/SDS-PAGE) of Rib b protein. IEF was carried out in pH 3-10 range.
Striated protein pattern reflect charge heterogeneity of Rib b protein.

78
compatible with SDS-PAGE9, but are compatible with ILS-PAGE separations. As a result, two
of the Rib b glycoforms were readily visualized in ILS-PAGE.
3.3.4. A Proposed Mechanism for Cationic ILS-PAGE
A better linear plot of Rf Vs. log molecular weight was obtained for five proteins (Figure 3.7)
under the optimum conditions of C4PBr ILS in gels, sample buffer, and running buffer as
compared to that of SDS-PAGE (Figure S5).
The linearity of the plot suggests that cationic ILS-PAGE protein separations are primarily
mass-based. The mechanism of mass-based protein separations is a result of the binding of ILS
to proteins via electrostatic interactions, hydrogen bonding, and hydrophobic interactions.31
In
our previous study, we have shown that, when proteins are dissolved in ILS sample buffers, at
R² = 0.9625
0
0.2
0.4
0.6
0.8
1
1.2
1.4
1.6
1.8
2
0 0.1 0.2 0.3 0.4 0.5 0.6 0.7
Log (MW)
Rf
Figure 3.7 The plot of Rf vs. log molecular weight of proteins; BSA (pI-4.8, 66 kDa), Ova (pI-4.6,
44.3 kDa), α-Chy (pI-8.8, 25.7 kDa), Myo (pI-16.9, 16.7 kDa), and Cyt c (pI-10, 12.3 kDa)
separated by C4PBr-PAGE at optimum C4PBr IL concentrations; 0.05% (w/v) in gel, 0.02% (w/v)
in sample buffer, and 0.1% (w/v) in running buffer

79
very low concentrations, ILS can undergo cooperative binding to proteins, i.e., binding of ILS to
a certain site of protein enhances binding of ILS to multiple sites of proteins.31
In general, protein
unfolding is believed to occur with this type of binding mechanism.37
As a result, intrinsic amino
acids can be exposed to the solvent. The protein sample buffer has a neutral pH; the exposed
amino acids have native charges. ILS can further interact with the native charges of the amino
acids and bind to the surfaces of unfolded regions of proteins. Thus, positively charged ILS-
protein complexes are formed, which migrate from anode to cathode through polyacrylamide
gels where ILS are present. Those ILS can further stabilize the positive charges of the
complexes. ILS present in the running buffer assist in separation by generating conductivity,
which is required for electrophoretic mobility of proteins during the electrophoresis experiment.
3.4. Conclusions
In summary, a cationic ILS-PAGE technique has been developed for the first time using ILS
in gel, sample buffer, and running buffer. Both acidic and basic proteins were separated using
this novel technique. Optimum separations were obtained by use of C4PBr ILS at 0.05% (w/v) in
gel, 0.1% (w/v) in the running buffer, and 0.01% (w/v) in the sample buffer. For the first time,
effective separation of two Rib b glycoforms was observed using 1D-PAGE. This finding
becomes more significant when analyzing different glycans and deglycosylated units in Rib b
glycoforms, which serves as a model protein in glycoproteomics. For this purpose, glycoforms
can be directly fractionated without pretreatment using cationic ILS-PAGE. Use of IEF/SDS-
PAGE allowed confirmation of the negative charge heterogeneity of Rib b. The cationic charges
of the ILS were more compatible with the negative charge distribution of the glycoprotein. This
suggests that this ILS-PAGE technique has the potential to overcome current deficiencies in
other types of glycoprotein separations as well.

80
3.5. References
1. Raymond, S., Acrylamide gel electrophoresis. Annals of the New York Academy of Sciences
1964, 121 (2), 350-365.
2. Chrambach, A.; Rodbard, D., Polyacrylamide gel electrophoresis. Science 1971, 172 (3982),
440-451.
3. Schägger, H.; Von Jagow, G., Tricine-sodium dodecyl sulfate-polyacrylamide gel
electrophoresis for the separation of proteins in the range from 1 to 100 kDa. Analytical
biochemistry 1987, 166 (2), 368-379.
4. Kang, D.; Gho, Y. S.; Suh, M.; Kang, C., Highly sensitive and fast protein detection with
coomassie brilliant blue in sodium dodecyl sulfate-polyacrylamide gel electrophoresis. Bulletin-
Korean chemical society 2002, 23 (11), 1511-1512.
5. Lesse, A. J.; Campagnari, A. A.; Bittner, W. E.; Apicella, M. A., Increased resolution of
lipopolysaccharides and lipooligosaccharides utilizing tricine-sodium dodecyl sulfate-
polyacrylamide gel electrophoresis. Journal of immunological methods 1990, 126 (1), 109-117.
6. Nowakowski, A. B.; Wobig, W. J.; Petering, D. H., Native SDS-PAGE: high resolution
electrophoretic separation of proteins with retention of native properties including bound metal
ions. Metallomics 2014, 6 (5), 1068-1078.
7. Alba, F. J.; Bartolomé, S.; Bermúdez, A.; Daban, J.-R., Fluorescent Labeling of Proteins and
Its Application to SDS-PAGE and Western Blotting. Detection of Blotted Proteins: Methods and
Protocols 2015, 41-50.
8. Kinoshita, E.; Kinoshita‐Kikuta, E.; Kubota, Y.; Takekawa, M.; Koike, T., A Phos‐tag SDS‐PAGE method that effectively uses phosphoproteomic data for profiling the phosphorylation
dynamics of MEK1. Proteomics 2016.
9. Pitcher, D. S.; de Mattos-Shipley, K.; Wang, Z.; Tzortzis, K.; Goudevenou, K.; Flynn, H.;
Bohn, G.; Rahemtulla, A.; Roberts, I.; Snijders, A. P., Nuclear proteasomes carry a constitutive
posttranslational modification which derails SDS-PAGE (but not CTAB-PAGE). Biochimica et
Biophysica Acta (BBA)-Proteins and Proteomics 2014, 1844 (12), 2222-2228.
10. Karadimitris, A.; Kleijnen, M. F., Bortezomib Amplifies Effect on Intracellular Proteasomes
by Changing Proteasome Structure☆. 2015.
11. Simpson, R. J., CTAB-PAGE. Cold Spring Harbor Protocols 2010, 2010 (4), pdb. prot5412.
12. Carraro, U.; Catani, C., A sensitive SDS-PAGE method separating myosin heavy chain
isoforms of rat skeletal muscles reveals the heterogeneous nature of the embryonic myosin.
Biochemical and biophysical research communications 1983, 116 (3), 793-802.

81
13. Karpe, F.; Hamsten, A., Determination of apolipoproteins B-48 and B-100 in triglyceride-
rich lipoproteins by analytical SDS-PAGE. Journal of lipid research 1994, 35 (7), 1311-1317.
14. Berber, I.; Cokmus, C.; Atalan, E., Characterization of Staphylococcus species by SDS–
PAGE of whole-cell and extracellular proteins. Microbiology 2003, 72 (1), 42-47.
15. Kinoshita, E.; Kinoshita‐Kikuta, E.; Koike, T., Phos‐tag SDS‐PAGE systems for
phosphorylation profiling of proteins with a wide range of molecular masses under neutral pH
conditions. Proteomics 2012, 12 (2), 192-202.
16. Rath, A.; Deber, C. M., Correction factors for membrane protein molecular weight readouts
on sodium dodecyl sulfate–polyacrylamide gel electrophoresis. Analytical biochemistry 2013,
434 (1), 67-72.
17. Rath, A.; Cunningham, F.; Deber, C. M., Acrylamide concentration determines the direction
and magnitude of helical membrane protein gel shifts. Proceedings of the National Academy of
Sciences 2013, 110 (39), 15668-15673.
18. Shi, Y.; Mowery, R. A.; Ashley, J.; Hentz, M.; Ramirez, A. J.; Bilgicer, B.; Slunt‐Brown, H.;
Borchelt, D. R.; Shaw, B. F., Abnormal SDS‐PAGE migration of cytosolic proteins can identify
domains and mechanisms that control surfactant binding. Protein Science 2012, 21 (8), 1197-
1209.
19. Rath, A.; Glibowicka, M.; Nadeau, V. G.; Chen, G.; Deber, C. M.; Engelman, D. M.,
Detergent Binding Explains Anomalous SDS-Page Migration of Membrane Proteins.
Proceedings of the National Academy of Sciences of the United States of America 2009, 106 (6),
1760-1765.
20. Li, L.; Wang, C.; Qiang, S.; Zhao, J.; Song, S.; Jin, W.; Wang, B.; Zhang, Y.; Huang, L.;
Wang, Z., Mass Spectrometric Analysis of N-Glycoforms of Soybean Allergenic Glycoproteins
Separated by SDS-PAGE. Journal of Agricultural and Food Chemistry 2016.
21. Dunker, A. K.; Kenyon, A. J., Mobility of sodium dodecyl sulphate-protein complexes.
Biochemical Journal 1976, 153 (2), 191-197.
22. Buxbaum, E., Cationic electrophoresis and electrotransfer of membrane glycoproteins.
Analytical biochemistry 2003, 314 (1), 70-76.
23. Hartinger, J.; Stenius, K.; Högemann, D.; Jahn, R., 16-BAC/SDS–PAGE: a two-dimensional
gel electrophoresis system suitable for the separation of integral membrane proteins. Analytical
biochemistry 1996, 240 (1), 126-133.
24. Macfarlane, D. E., Use of benzyldimethyl-n-hexadecylammonium chloride (“16-BAC”), a
cationic detergent, in an acidic polyacrylamide gel electrophoresis system to detect base labile
protein methylation in intact cells. Analytical biochemistry 1983, 132 (2), 231-235.

82
25. Amory, A.; Foury, F.; Goffeau, A., The purified plasma membrane ATPase of the yeast
Schizosaccharomyces pombe forms a phosphorylated intermediate. Journal of Biological
Chemistry 1980, 255 (19), 9353-9357.
26. Mócz, G.; Bálint, M., Use of cationic detergents for polyacrylamide gel electrophoresis in
multiphasic buffer systems. Analytical biochemistry 1984, 143 (2), 283-292.
27. Küster, B.; Wheeler, S. F.; Hunter, A. P.; Dwek, R. A.; Harvey, D. J., Sequencing of N-
linked oligosaccharides directly from protein gels: in-gel deglycosylation followed by matrix-
assisted laser desorption/ionization mass spectrometry and normal-phase high-performance
liquid chromatography. Analytical biochemistry 1997, 250 (1), 82-101.
28. Zamfir, A. D.; Flangea, C.; Serb, A.; Zagrean, A.-M.; Rizzi, A. M.; Sisu, E., Separation and
identification of glycoforms by capillary electrophoresis with electrospray ionization mass
spectrometric detection. Mass Spectrometry of Glycoproteins: Methods and Protocols 2013, 145-
169.
29. Geyer, H.; Geyer, R., Strategies for analysis of glycoprotein glycosylation. Biochimica et
Biophysica Acta (BBA)-Proteins and Proteomics 2006, 1764 (12), 1853-1869.
30. Lee, Y.; Kockx, M.; Raftery, M. J.; Jessup, W.; Griffith, R.; Kritharides, L., Glycosylation
and Sialylation of Macrophage-derived Human Apolipoprotein E Analyzed by SDS-PAGE and
Mass Spectrometry EVIDENCE FOR A NOVEL SITE OF GLYCOSYLATION ON SER290.
Molecular & Cellular Proteomics 2010, 9 (9), 1968-1981.
31. Hasan, F.; Vidanapathirana, P.; Das, S.; Fernand, V. E.; Siraj, N.; Losso, J. N.; Warner, I. M.,
Ionic liquids as buffer additives in ionic liquid-polyacrylamide gel electrophoresis separation of
mixtures of low and high molecular weight proteins. RSC Advances 2015, 5 (85), 69229-69237.
32. Zhang, T.; Gai, Q.; Qu, F.; Zhang, Y., Ionic liquid‐assisted SDS‐PAGE to improve human
serum protein separation. Electrophoresis 2011, 32 (20), 2904-2910.
33. Tarelli, E.; Byers, H. L.; Wilson, M.; Roberts, G.; Homer, K. A.; Beighton, D., Detecting
Mannosidase Activities Using Ribonuclease B and Matrix-Assisted Laser Desorption/Ionization–
Time of Flight Mass Spectrometry. Analytical biochemistry 2000, 282 (2), 165-172.
34. Rudd, P. M.; Scragg, I. G.; Coghill, E.; Dwek, R. A., Separation and analysis of the
glycoform populations of ribonuclease B using capillary electrophoresis. Glycoconjugate journal
1992, 9 (2), 86-91.
35. Nwosu, C. C.; Huang, J.; Aldredge, D. L.; Strum, J. S.; Hua, S.; Seipert, R. R.; Lebrilla, C.
B., In-gel nonspecific proteolysis for elucidating glycoproteins: a method for targeted protein-
specific glycosylation analysis in complex protein mixtures. Analytical chemistry 2012, 85 (2),
956-963.

83
36. Gianazza, E., Isoelectric focusing as a tool for the investigation of post-translational
processing and chemical modifications of proteins. Journal of Chromatography A 1995, 705 (1),
67-87.
37. Das, S.; Sylvain, M. R.; Fernand, V. E.; Losso, J. N.; El-Zahab, B.; Warner, I. M., Positive
cooperative mechanistic binding of proteins at low concentrations: A comparison of poly
(sodium N-undecanoyl sulfate) and sodium dodecyl sulfate. Journal of colloid and interface
science 2011, 363 (2), 585-594.

84
CHAPTER 4: TWO DIMENSIONAL (2D) IEF/ILS-PAGE AS A TOOL FOR COMPLEX
PROTEIN SEPARATIONS
4.1. Introduction
Novel analytical techniques as tools to enhance the efficiency of proteomic work flow are in
growing need with expansion of protein expression levels in living organisms. The three major
steps in proteomic work flow are protein extraction, separation, and identification. Two
dimensional (2D) polyacrylamide gel electrophoresis (PAGE) is a widely used separation
technique for complex protein analysis.1,2,3,4,5
The most common 2D-PAGE technique is
isoelectric focusing (IEF) followed by SDS-PAGE (IEF/SDS-PAGE).
In the first dimension, IEF, an immobiline pH gradient gel strip is immersed in a protein
sample allowing the proteins to be well rehydrated in sample buffer and absorbed into the gel.
Upon application of a voltage, the proteins are migrated in the electric field based on charges.
Protein migration ceases when they reach the pH, which is the same as the protein isoelectric
point (pI). At this step, the proteins are separated based on charge. After that, in the second
dimension, the gel strip with separated proteins is subjected to PAGE. Proteins are further
separated based on molecular weights during this process. The IEF/SDS-PAGE technique has
numerous applications. First, complex protein mixtures can be separated into polypeptide
subunits such as isoforms,5-6
which have variable pI values. Then, this technique can be used as a
tool to make comparisons of protein expression patterns, which are derived from different
cellular environments.7 Finally, cellular responses for an external source such as drugs can be
evaluated by monitoring at the protein behavioral patterns of 2D protein profiles.8,9
Most of the complex proteins are underrepresented in 2D protein profiles although IEF/SDS-
PAGE serves as the state-of-the-art technique for complex protein separations.10,11,12,13
This has

85
been identified as a result of poor solubility and complicated separation behavior.14
Clemant et
al. described a comparison study of human lymph and plasma protein profiling by use of 2D-
PAGE and 1D-SDS-PAGE.15
The former technique had poor resolving power resulting limited
quantity of proteins. Some other techniques have been proposed as alternatives to IEF/SDS-
PAGE for complex protein separations. Some examples are, double SDS-PAGE technique where
6M urea-SDS-PAGE is used in the first dimension and SDS-PAGE without urea is used in the
second dimension,16
blue-native-PAGE followed by SDS-PAGE,17
and cationic PAGE followed
by SDS-PAGE have been widely used in membrane proteomics.18,19,20
The latter technique
involves the use of a cationic surfactant, either benzyldimethyl-n-hexadecylammonium chloride
(16 BAC)20,21,22
or cetyltrimethylammonium bromide (CTAB),23,24,25
in cationic PAGE along
with acidic buffers.
This chapter describes the use of IEF in the first dimension and cationic ionic liquid
surfactants (ILS)-PAGE in the second dimension to improve the resolution of complex protein
separation. The application of 4-methylpyridinium bromide-based ILS (CnPBr where n=4, 8, and
11) in cationic PAGE protein separations was described in chapter 3. The ILS concentration in
gel, sample, and running buffers were optimized along with alkyl chain length in order to
achieve the maximum resolution in protein separation by cationic ILS-PAGE. The results
showed a high resolving power with C4PBr concentrations of 0.05% (w/v) in gel, 0.01% (w/v) in
sample buffer, and 0.1% (w/v) in running buffer. Moreover, this technique could successfully
apply for one-step separation of ribonuclease b glycoforms. In contrast, SDS-PAGE of the same
protein showed a single intense band with a low migration distance relative to the other proteins,
showing an anomalous migration behavior. Further studies of ribonuclease b protein with
IEF/SDS-PAGE showed negative charge heterogeneity, which induces better compatibility of

86
protein with cationic ILS compared to anionic SDS. These studies suggested the application of
cationic ILS-PAGE in glycoprotein separations.
In this study, we describe the application of ILS-PAGE in 2D separation (IEF/ILS-PAGE) of
proteins. First, the optimization of ILS in polyacrylamide gels for 2D separations will be
discussed. Next, IEF/ILS-PAGE technique for separation of alpha-antitrypsin glycoprotein and
cytochrome c protein will be discussed. Moreover, 2D maps of this technique will be compared
with the results obtained with the conventional 2D-PAGE technique, IEF/SDS-PAGE.
4.2. Materials and Methods
4.2.1. Materials
Alpha antitrypsin, cytochrome c, 4-Picoline, 4-Bromo-1-butene, and buffer ingredients were
purchased from Sigma Aldrich Inc. (Milwaukee, WI). E. Coli protein sample,
rehydration/sample buffer, nanopure water, equilibration buffers containing SDS, iodoacetamide,
overlay agarose solution, immobiline pH gradient (IPG) strips, Mini-protean TGX gels for SDS-
PAGE, acrylamide/bisacrylamide (12.5%), methylene bisacrylamide (MBA), Bio-Safe
Coomassie blue and Glycerol (30%) were purchased from Bio-Rad Inc. (Hercules, CA).
4.2.2. Instrumentations
An Ettan IPGphor unit (GE Healthcare, Piscataway, NJ) was used for the IEF
experiments. Second dimension gel electrophoresis experiments were performed using a Bio-
Rad Mini-PROTEAN® Tetra vertical units. Gel images were captured by using a Bio-Rad
ChemiDoc™
XRS+ system with Image Lab™
Software.

87
4.2.3. Ionic Liquid Surfactant Synthesis
ILS was synthesized according to the previous report.26
Briefly, 4-picoline (7 g, 0.075 M)
and n-Bromo-1-butene (n=4,8,11) (10 g, 0.074 M) were mixed together and refluxed at 80 ºC
overnight. The final product, which was viscous and yellow color was collected and
characterized by ESI-MS.
4.2.4. Protein Sample Preparation, Rehydration, and Isoelectric Focusing (IEF)
A lyophilized powder of protein (0.5 mg) was dissolved in a rehydration sample buffer
(1.25 mL). The sample (650 µL) was loaded into a rehydration tray and an IPG strip (pH 3-10)
was laid in the sample, maintaining the gel side down. Mineral oil (650 µL) was overlaid on top
of the protein sample to avoid sample evaporation during rehydration. The tray was closed and
allowed the sample to rehydrate for about 12 hours. Finally, the IEF was performed at 200 V for
1 hour followed by 100 V for 2 hours.
4.2.5. Sample Equilibration
The gel strips were removed from the rehydration tray and transferred the gel side up into
a dry and clean equilibration tray after the IEF step has been completed. An equilibration buffer I
with urea (6 M, 20 mL), SDS (2%) for IEF/SDS-PAGE or ILS (0.02%) for IEF/ILS-PAGE, Tris-
HCl (0.375 M, pH 8.8), Glycerol (20%), and DTT (2%) was added onto the gel strip. The tray
was closed and put on an orbital shaker for 10 minutes. After that, the equilibration buffer was
carefully drained from the tray and added the equilibration buffer II containing everything in
equilibration buffer I except DTT that was replaced by iodoacetamide (3.75% (w/v). The tray
was returned to the orbital shaker for another 10 minutes.

88
4.2.6. Second Dimension-PAGE
At the end of the equilibration, the gel strip was removed from the tray and briefly dipped
in an electrophoresis running buffer. Then it was placed on top of a Mini-protean TGX gel with
the aid of forceps. Mini-protean TGX gels that are specified for IPG gels of 7 cm were used for
SDS-PAGE. ILS resolving gels were prepared according to the method described in chapter 3
(section 3.2.7.). Agarose sealing solution was poured inside the gel plates to seal the IPG and
polyacrylamide gels. Care was taken to remove any air bubbles trapped underneath the gel strip.
The gel was assembled in the gel box of electrophoresis apparatus. Electrophoresis running
buffer was added into the gel box and to the buffer tank. Gel electrophoresis was performed at
200 V for 40 minutes for SDS-PAGE or 300 V for 40 minutes for ILS-PAGE.
4.2.7. Gel Staining and Imaging
SDS-PAGE gels were rinsed with deionized water for 3 times at every 5 minutes after the
electrophoresis. ILS-PAGE gels were fixed with 40% methanol and 10% acetic acid for an hour
with 4 changes at every 15 minutes. After these steps, the gels were immersed in Bio-safe
coomassie blue for 1 hour followed by deionized water for another hour while gentle shaking.
Finally, gel images were captured and protein spots were scanned by imagej software (National
Institute of Health, Maryland, USA).
4.3. Results and Discussion
4.3.1. IEF/ILS-PAGE of E. Coli Cell Lysate
In Chapter 3, the optimization of ILS-PAGE for protein separation was discussed in detail
(section 3.3.1). C4PBr ILS at 0.05% (w/v) concentration in gels and 0.1% (w/v) concentration in

89
running buffer showed the optimum resolution in C4PBr-PAGE protein separation. The efficacy
of ILS-PAGE as a second dimension in 2D-PAGE was tested using an E. Coli cell lysate. Three
ILS-PAGE techniques, C4PBr-PAGE, C8PBr-PAGE, and C11PBr-PAGE, were applied at two
ILS concentrations, i.e. 0.02% (w/v) and 0.05% (w/v) in second dimension polyacrylamide gels.
Those two concentrations were chosen as they showed the maximum resolving power during
1D-PAGE. In addition, ILS were applied in equilibration and running buffer preparation at a
fixed concentration (0.02% (w/v) and 0.1% (w/v) concentrations of each ILS respectively).
Figure 4.1 shows 2D maps of E. Coli cell lysate at different ILS conditions. The number of
spots was increased when concentrations of ILS in second dimension gels were increased from
0.02% (w/v) to 0.05% (w/v) in both, IEF/C4PBr-PAGE and IEF/C8PBr- PAGE (Figure 4.1(B)
and 4.1(D) respectively). A similar effect was observed in chapter 3 (section 3.3.1.) where 0.05%
(w/v) concentrations of C4PBr and C8PBr were applied in gels of 1D-PAGE. At those conditions,
proteins were separated as sharp bands with improved resolution as compared to 0.02% (w/v) of
ILS in gels. This high resolution was claimed to achieve as a result of more stabilized ILS-
protein complexes in the presence of a moderate ILS concentration in gels. An increased number
of spots in 2D-PAGE gels in this study further supports this claim. Figure 1(E) and 1(F) show 2D
maps of IEF/C11PBr-PAGE at two different concentrations of C11PBr, i.e. 0.02% (w/v) and
0.05% (w/v), in second dimension gels. Number of protein spots was reduced in both images
compared to 1(B) and 1(D). In latter two images, 0.05% (w/v) concentration of C4PBr and C8PBr
ILS were applied in second dimension gels of IEF/C4PBr-PAGE and IEF/C8PBr-PAGE
respectively. Thus, C11PBr ILS has a low impact on protein resolution as compared to C4PBr and
C8PBr. Similar effects of ILS chain length was discussed in chapter 3 (section 3.3.2.).

90
(D) (C)
(B) (A)
0.1% (w/v) C4PBr in running
0.1% (w/v) C8PBr in running
0.1% (w/v) C11PBr in running buffer (E) (F)
Figure 4.1. 2D profiles of E. Coli cell lysates at different ILS concentrations in gels (A) 0.02%
(w/v) C4PBr (B) 0.05% (w/v) C4PBr (C) 0.02% (w/v) C8PBr (D) 0.05% (w/v) C8PBr (E) 0.02%
(w/v) C11PBr (F) 0.05% (w/v) C11PBr. Number of spots obtained from imagej software are
labeled on each gel image.
54 spots 101 spots
17 spots 125 spots
87 spots 31 spots

91
C11PBr-PAGE showed poor band resolution in all the concentration tested, as a result of
strong interactive forces between hydrophobic domains of the proteins and the ILS.
Next, the results obtained with IEF/C8PBr-PAGE were compared with conventional
method, IEF/SDS-PAGE (Figure 4.2.) The 2D map of latter showed only 82 spots as compared
to IEF/ILS-PAGE 2D map, which showed 125 spots. In addition, vertical streaking was appeared
on IEF/SDS-PAGE gel, which may have occurred due to poor solubility power or interference
from salts27
even though standard SDS conditions were applied. In contrast, IEF/C8PBr-PAGE
showed a clean 2D profile without vertical or horizontal streaking.
4.3.2. Separation of Alpha-antityrpsin Protein Subunits by IEF/C4PBr-PAGE
In chapter 3, ILS-PAGE technique showed an enhanced resolution in Ribonuclease b
glycoforms separation. Negative charge heterogeneity on this glycoprotein caused the cationic
ILS-PAGE to be more compatible with the protein. In order to further investigate the effect of
ILS-PAGE on separation of other glycoforms, human alpha-antitrypsin (A1PI) protein (52 kDa,
pI-4.2-4.9) was chosen for two dimensional IEF/C4PBr-PAGE. A1PI glycoprotein has five
(A) (B)
Figure 4.2. 2D profiles of E. Coli obtained from (A) IEF/C8PBr-PAGE and (B) IEF/SDS-PAGE
125 spots 82 spots

92
different glycoforms with pI values ranging from 4.2-4.9 as a result of different –di and –tri
antennary glycans, and a truncated N-terminus. Generally, three of the five glycoforms can be
identified in an IEF experiments.28
Figure 4.3 (A) shows the A1PI 2D profile of IEF/C4PBr-PAGE. Multiple spots in the pI
region of 4-5 (circled with green) were observed on this 2D map. As the spots are appearing on
the same pI region of A1PI glycoforms, those should be subunits derived from the glycoforms.
Even though, only three glycoforms are appeared in IEF (1st dimension) gels,
28 the second
(A)
pH 10 pH 3 pH 3 pH 10
pH 10
(B)
(C)
pH 3
Figure 4.3. Separation of alpha-antitrypsin protein subunits by (A) IEF/C4PBr-PAGE, (B)
IEF/SDS-PAGE, and (C) IEF/CTAB-PAGE
69 spots
29 spots
68 spots

93
dimension C4PBr-PAGE could resolve other subunits related to these glycoforms as well. IEF
migration of different glycoforms of A1PI protein is known to occur due to the presence of sialic
acid residues, which have pKa of 2.6.29
In second dimension ILS-PAGE, sialic acid residues are
deprotonated during the electrophoresis at pH 3.0. Ionic interactions between negatively charged
sialic acid residues and cationic C4PBr may have aided in resolving multiple subunits of the
glycoforms. The IEF/C4PBr-PAGE results for A1PI protein were compared with IEF/SDS-
PAGE and IEF/CTAB-PAGE. The standard separation conditions were applied for those two
conventional techniques. The 2D map of IEF/SDS-PAGE is shown in Figure 4.2 (B). Only two
major spots were observed in the corresponding pI region (4.2-4.9) of A1PI glycoforms owing to
the low resolution associated with the second dimension SDS-PAGE. It shows the
incompatibility between anionic SDS surfactant and anionic sialic acid residues during
electrophoresis running buffer conditions (pH 8.3). 2D map of IEF/CTAB-PAGE (Figure 4.2
(C)) showed one major band in the pI region of glycoforms, showing failure to resolve any
subunits of the glycoprotein.
4.3.3. Separation of Cytochrome c Subunits by IEF/C4PBr-PAGE
Cytochrome c protein (13 kDa, pI-10.5) was subjected to IEF followed by C4PBr-PAGE.
Figure 4.4 (A) shows the 2D map of IEF/C4PBr-PAGE with 8 protein spots. One protein spot
was observed at pH 3-4 region (circled in Figure 4.4 (A)). Cytochrome c protein consists of 24
basic and 15 acidic amino acid residues.30
The latter includes two propionic acid residues with pI
of 4.87, which are on the heme group of the protein. Hence, the acidic protein spot of
IEF/C4PBr-PAGE may represent the heme group with two propionic acids. Figure 4.3 (B) shows
a 2D map (IEF/SDS-PAGE) of the same protein with three spots. No spots were appeared in pH
pH 10

94
pH 3 pH 10 pH 3 pH 10
(A) (B)
3-4 region on that 2D map. Overall, these results show the high resolving power of IEF/C4PBr-
PAGE for cytochrome c protein compared to conventional IEF/SDS-PAGE.
4.4. Conclusions
In summary, ILS-PAGE technique was applied in 2D IEF/ILS-PAGE for some of the
complex protein separation. C4PBr-PAGE and C8PBr-PAGE could achieve better recovery of E.
Coli protein separations among three ILS-PAGE techniques when they were applied in 2D
PAGE. This suggests that ILS with short alkyl chains impose better interactions with proteins as
compared to long chains.
Increased number of A1PI protein sub units, which have derived from A1PI glycoforms
appeared in IEF/C4PBr-PAGE as compared to conventional IEF/SDS-PAGE. This proves the
high resolving power of ILS-PAGE on glycoprotein separations. Negative charge heterogeneity
of these glycoforms in the presence of sialic acids may have caused the differential separation
ability of IEF/SDS-PAGE and IEF/ILS-PAGE. However, a comparable resolution could not
Figure 4.4. Separation of Cytochrome c subunits by (A) C4PBr-PAGE (B) SDS-PAGE
8 spots 3 spots

95
achieve when ILS-PAGE was replaced by CTAB-PAGE, which is also a cationic PAGE
technique. This shows some unique cationic surfactant properties associated with ILS caused
them to make better interactions with proteins yielding a high resolution in separation. In
addition, an acidic subunit of Cytochrome c protein could be resolved by using IEF/C4PBr-
PAGE proving better resolving power of IEF/ILS-PAGE. Future works on this study include
application of ILS in the first dimension, IEF, as buffer additives to improve protein solubility
and increase protein recovery in second dimension ILS-PAGE. This will help to resolve proteins
with different charges that are not readily resolved by conventional 2D-PAGE techniques.
4.5. References
1. Sanchez, J. C.; Chiappe, D.; Converset, V.; Hoogland, C.; Binz, P. A.; Paesano, S.; Appel, R.
D.; Wang, S.; Sennitt, M.; Nolan, A., The mouse SWISS‐2D PAGE database: a tool for
proteomics study of diabetes and obesity. Proteomics 2001, 1 (1), 136-163.
2. Issaq, H. J.; Veenstra, T. D., Two-dimensional polyacrylamide gel electrophoresis (2D-
PAGE): advances and perspectives. Biotechniques 2008, 44 (5), 697.
3. Wilson, N. L.; Schulz, B. L.; Karlsson, N. G.; Packer, N. H., Sequential analysis of N-and O-
linked glycosylation of 2D-PAGE separated glycoproteins. Journal of proteome research 2002,
1 (6), 521-529.
4. Caruso, G.; Cavaliere, C.; Foglia, P.; Gubbiotti, R.; Samperi, R.; Laganà, A., Analysis of
drought responsive proteins in wheat (Triticum durum) by 2D-PAGE and MALDI-TOF mass
spectrometry. Plant Science 2009, 177 (6), 570-576.
5. Müller, D.; Schindler, P.; Coulot, M.; Voshol, H.; Van Oostrum, J., Mass spectrometric
characterization of stathmin isoforms separated by 2D PAGE. Journal of mass spectrometry
1999, 34 (4), 336-345.
6. Raikos, V.; Hansen, R.; Campbell, L.; Euston, S. R., Separation and identification of hen egg
protein isoforms using SDS–PAGE and 2D gel electrophoresis with MALDI-TOF mass
spectrometry. Food chemistry 2006, 99 (4), 702-710.
7. Chen, G.; Gharib, T. G.; Huang, C.-C.; Taylor, J. M.; Misek, D. E.; Kardia, S. L.; Giordano, T.
J.; Iannettoni, M. D.; Orringer, M. B.; Hanash, S. M., Discordant protein and mRNA expression
in lung adenocarcinomas. Molecular & cellular proteomics 2002, 1 (4), 304-313.

96
8. Celis, J. E.; Gromov, P., 2D protein electrophoresis: can it be perfected? Current Opinion in
Biotechnology 1999, 10 (1), 16-21.
9. Lilley, K. S.; Razzaq, A.; Dupree, P., Two-dimensional gel electrophoresis: recent advances in
sample preparation, detection and quantitation. Current opinion in chemical biology 2002, 6 (1),
46-50.
10. Galeva, N.; Altermann, M., Comparison of one-dimensional and two-dimensional gel
electrophoresis as a separation tool for proteomic analysis of rat liver microsomes: cytochromes
P450 and other membrane proteins. Proteomics 2002, 2 (6), 713.
11. Chevallet, M.; Santoni, V.; Poinas, A.; Rouquié, D.; Fuchs, A.; Kieffer, S.; Lunardi, J.;
Garin, J.; Rabilloud, T., New zwitterionic detergents improve the analysis of membrane proteins
by two‐dimensional electrophoresis. Electrophoresis 1998, 19 (11), 1901-1909.
12. Molloy, M. P., Two-dimensional electrophoresis of membrane proteins using immobilized
pH gradients. Analytical biochemistry 2000, 280 (1), 1-10.
13. Rabilloud, T., Use of thiourea to increase the solubility of membrane proteins in two‐dimensional electrophoresis. Electrophoresis 1998, 19 (5), 758-760.
14. Helling, S.; Schmitt, E.; Joppich, C.; Schulenborg, T.; Müllner, S.; Felske‐Müller, S.;
Wiebringhaus, T.; Becker, G.; Linsenmann, G.; Sitek, B., 2‐D differential membrane proteome
analysis of scarce protein samples. Proteomics 2006, 6 (16), 4506-4513.
15. Clement, C. C.; Aphkhazava, D.; Nieves, E.; Callaway, M.; Olszewski, W.; Rotzschke, O.;
Santambrogio, L., Protein expression profiles of human lymph and plasma mapped by 2D-DIGE
and 1D SDS–PAGE coupled with nanoLC–ESI–MS/MS bottom-up proteomics. Journal of
proteomics 2013, 78, 172-187.
16. Laßek, M.; Weingarten, J.; Acker-Palmer, A.; M Bajjalieh, S.; Muller, U.; Volknandt, W.,
Amyloid precursor protein knockout diminishes synaptic vesicle proteins at the presynaptic
active zone in mouse brain. Current Alzheimer Research 2014, 11 (10), 971-980.
17. Hashemi, A.; Gharechahi, J.; Nematzadeh, G.; Shekari, F.; Hosseini, S. A.; Salekdeh, G. H.,
Two-dimensional blue native/SDS-PAGE analysis of whole cell lysate protein complexes of rice
in response to salt stress. Journal of Plant Physiology 2016, 200, 90-101.
18. Macfarlane, D. E., Two dimensional benzyldimethyl-n-hexadecylammonium chloride→
sodium dodecyl sulfate preparative polyacrylamide gel electrophoresis: a high capacity high
resolution technique for the purification of proteins from complex mixtures. Analytical
biochemistry 1989, 176 (2), 457-463.
19. Navarre, C.; Degand, H.; Bennett, K. L.; Crawford, J. S.; Mørtz, E.; Boutry, M.,
Subproteomics: identification of plasma membrane proteins from the yeast Saccharomyces
cerevisiae. Proteomics 2002, 2 (12), 1706-1714.
97
20. Hartinger, J.; Stenius, K.; Högemann, D.; Jahn, R., 16-BAC/SDS–PAGE: a two-dimensional
gel electrophoresis system suitable for the separation of integral membrane proteins. Analytical
biochemistry 1996, 240 (1), 126-133.
21. Braun, R. J.; Kinkl, N.; Zischka, H.; Ueffing, M., 16-BAC/SDS-PAGE analysis of membrane
proteins of yeast mitochondria purified by free flow electrophoresis. Membrane Proteomics:
Methods and Protocols 2009, 83-107.
22. Nothwang, H. G.; Schindler, J., Two-dimensional separation of membrane proteins by 16-
BAC-SDS-PAGE. Membrane Proteomics: Methods and Protocols 2009, 269-277.
23. Longuespée, R.; Tastet, C.; Desmons, A.; Kerdraon, O.; Day, R.; Fournier, I.; Salzet, M.,
HFIP Extraction Followed by 2D CTAB/SDS-PAGE Separation: A New Methodology for
Protein Identification from Tissue Sections after MALDI Mass Spectrometry Profiling for
Personalized Medicine Research. Omics: a journal of integrative biology 2014, 18 (6), 374-384.
24. Yamaguchi, Y.; Miyagi, Y.; Baba, H., Two‐dimensional electrophoresis with cationic
detergents, a powerful tool for the proteomic analysis of myelin proteins. Part 1: Technical
aspects of electrophoresis. Journal of neuroscience research 2008, 86 (4), 755-765.
25. Braun, R. J.; Kinkl, N.; Beer, M.; Ueffing, M., Two-dimensional electrophoresis of
membrane proteins. Analytical and bioanalytical chemistry 2007, 389 (4), 1033-1045.
26. Hasan, F.; Vidanapathirana, P.; Das, S.; Fernand, V. E.; Siraj, N.; Losso, J. N.; Warner, I. M.,
Ionic liquids as buffer additives in ionic liquid-polyacrylamide gel electrophoresis separation of
mixtures of low and high molecular weight proteins. RSC Advances 2015, 5 (85), 69229-69237.
27. Lee, S.-H.; Ahn, J.-Y.; Min, J.; Kim, S. Y.; Wee, J.-H.; Sekhon, S. S.; Kim, Y.-H., The
optimized conditions of two-dimensional polyacrylamide gel electrophoresis for proteomic
analysis of Saccharomyces cerevisiae. Toxicology and Environmental Health Sciences 2014, 6
(4), 256-260.
28. Chung, H.-S.; Kim, J.-S.; Lee, S. M.; Park, S. J., Additional N-glycosylation in the N-
terminal region of recombinant human alpha-1 antitrypsin enhances the circulatory half-life in
Sprague-Dawley rats. Glycoconjugate journal 2016, 33 (2), 201-208.
29. Kolarich, D.; Weber, A.; Turecek, P. L.; Schwarz, H. P.; Altmann, F., Comprehensive glyco‐proteomic analysis of human α1‐antitrypsin and its charge isoforms. Proteomics 2006, 6 (11),
3369-3380.
30. Guevremont, R.; Siu, K.; Le Blanc, J.; Berman, S. S., Are the electrospray mass spectra of
proteins related to their aqueous solution chemistry? Journal of the American Society for Mass
Spectrometry 1992, 3 (3), 216-224.

98
CHAPTER 5: IONIC LIQUIDS AS SIGNAL ENHANCING MATRIX ADDITIVES FOR
PROTEIN ANALYSIS USING MALDI-MS
5.1. Introduction
Novel analytical methodologies for use in proteomics have received considerable attention
over the past few decades.1,2,3,4
Protein extraction, separation/purification, and characterization
are the main steps in a general proteomic analytical scheme. Protein characterization is an
essential step for precise protein identification. In this regard, matrix assisted laser desorption
ionization (MALDI)-mass spectrometry (MS) and electrospray ionization (ESI)- mass
spectrometry (MS) are widely used techniques for characterization of proteins and peptides on
the basis of molecular weight as well as structural analysis by tandem mass spectrometry as part
of protein sequencing. Among these techniques, MALDI-MS is a robust technique with high
tolerance for solvent background effects and high sensitivity for proteins.5,6,7
However, the
quality of the MALDI mass spectrum depends on sample preparation, matrix composition, and
sample impurities.8 The presence of trace surfactant impurities, which usually remain in the
protein sample after protein extraction and separation can interfere with protein MALDI mass
spectral acquisition.7,9,10,11
Surfactants are often used in protein extraction, separation, and analysis to increase solubility
and stability of the sample.12,13,14,15,16
Amphiphilic properties of surfactants lead to micelle
formation in aqueous media at a concentration known as the critical micelle concentration
(CMC). Surfactant micelles play a critical role in proteomics by aiding in unfolding and
denaturing of proteins through the formation of protein-micelle complexes.17
An anionic
surfactant, SDS, is the most commonly employed surfactant in proteomics. Although SDS has
been widely used in proteomics, mass spectral interferences are associated with protein analyses
99
using SDS in MALDI-MS.18,19,20,21,22
Typical interferences include peak broadening associated
with sodium protein adduct formation, low signal-to-noise ratio, and lower resolution.21,22,
Therefore, it is important to remove SDS before MALDI-MS analysis in proteomic work flow.
Common techniques used for removal of SDS include a C18 ZipTip cleanup method10
and an ion
exchange column chromatography technique.10,20
Unfortunately, these removal processes require
additional time and efforts that often cause a significant loss of proteins.23
Ultimately, the
presence of surfactants produces poor quality mass spectra and creates challenges for protein
characterization.10
In this regard, several studies have been performed to investigate the optimum
concentration of SDS for use in MALDI analyses of proteins.10,24,25,26,27
Zhang et al. reported that
concentrations of SDS above 0.2% (w/v) are effective for MALDI analysis of peptides.28
The
MALDI-MS signal intensity is suppressed when SDS was used below the CMC due to the partial
precipitation of proteins with SDS monomers.27
However, interferences from SDS-matrix
clusters were observed in MALDI mass spectra when high SDS concentrations were used.28
Alternative surfactants with useful properties have been proposed for proteomic work
flow.29,30,31
For example, Jimenez and coworkers have proposed novel anionic branched
surfactants suitable for PAGE protein separation.29
However, mass spectrometric compatibility
of these surfactants has not been assessed in the study. A cationic surfactant, CTAB, has also
been used for low molecular mass analysis, particularly for amino acids and peptides at a ratio of
1000:1 (matrix/CTAB) for suppression of matrix related background in MALDI-MS.32
Furthermore, CTAB is a useful surfactant in cationic PAGE, particularly for 2D-PAGE protein
separations.33
A zwitterionic surfactant, 3-[(3-Cholamidopropyl)dimethylammonio]-1-
propanesulfonate (CHAPS), and a non-ionic surfactant, Triton X-100, have also been tested for
protein sample preparation in MALDI-MS analysis.34
It was determined that the presence of

100
Triton X-100 in protein samples caused a slight degradation of mass spectral quality, while the
presence of CHAPS highly affected the spectra by producing a low signal-to-noise ratio.
Recently, ionic liquids-based surfactants have been proposed as novel surfactants for
proteomics.35
Ionic liquids have been previously used as MALDI matrices,36,37
but not as
surfactants in protein analysis by MALDI. In previous chapters, we studied 4-methyl pyridinium-
based ionic liquid surfactants (ILS) as buffer additives for protein separation by anionic35
and
cationic PAGE. Herein, we report the role of these ILS as additives for protein characterization
using MALDI-MS with a conventional matrix, α-cyanohydroxycinnamic acid (CHCA). Low
vapor pressure, high thermal stability, and solubility of different proteins in ILS ensure the
suitability of these ILS for applications in MALDI-MS for protein analyses. Three proteins of
different molecular weights; i.e. Cytochrome c (Cyt c,~12 kDa), Bovine serum albumin (BSA,
~66 kDa), and Transferrin (Tr, ~78 kDa), were selected as analytes. Results obtained using ILS
were compared to no surfactant added, SDS, and CTAB.
5.2. Experimental Section
5.2.1. Materials
The compounds 4-bromo-1-butene, 8-bromo-1-octene, 4-methylpyridinium, SDS, CTAB,
BSA, Tr, Cyt c, and CHCA were purchased from Sigma Aldrich (Milwaukee, WI) and used as
received. All solutions (surfactant, matrix, and protein) were prepared using triply deionized
ultrapure distilled water (18.23 MΩ) from an ARIES high purity water system (ARIES filter
works, West Berlin, NJ). Ethanol, methanol, and chloroform were purchased from Thermo
Fisher Scientific (Fair Lawn, New Jersey). Rat brain tissue samples were provided from School
of Veterinary Medicine, Division of Laboratory Animal Medicine at LSU.

101
5.2.2. Ionic Liquid Synthesis
Ionic liquids were synthesized and characterized using protocols established in our previous
work.35
Briefly, 4-methylpyridinium (7 g, 0.075 M) and 4-bromo-1-butene (for the synthesis of
1-butene-4-methylpyridinium IL (C4PBr)) or 8-bromo-1-octene (for the synthesis of 1-ocene-4-
methylpyridinium IL (C8PBr)) (0.02 eq, 10 g, 0.074 M) were added separately into acetonitrile
solvent and refluxed at 80 °C overnight. Acetonitrile was then evaporated by using a rotoary
evaporator and the product was freeze dried. The products were yellow, highly viscous liquids
and were characterized with ESI-MS.
5.2.3. Sample Preparation for Protein Analysis
Five concentrations of surfactant solutions, 0.02%, 0.05%, 0.1%, 0.5%, and 1% (w/v), were
prepared by dissolving the appropriate quantities in ultrapure water. BSA, Tr, and Cyt c proteins
were dissolved in ultrapure water to prepare protein stock solutions of 4.0 × 10⁻⁵
M. Protein
samples were prepared by mixing 5 µL of protein stock solution with 5 µL of surfactant solution
in a micro-centrifuge tube and vortexing at high speed for about 30 seconds. A saturated CHCA
solution in 1% TFA and 60% acetonitrile/water was prepared as the matrix before performing
MALDI-MS. This matrix solution (10 µL) was added into the protein sample (10 µL) and further
vortexed for about 30 seconds. An aliquot of the analyte-and matrix solution (1 µL, 10 pmol)
was pipetted onto the MALDI sample target and air dried at room temperature.
5.2.4. Tissue Sample Preparation
Horizontal sections of rat brain tissue samples were cut into pieces of 10 µm thickness. These
samples were prepared with a Leica cryostat (CM 1850, Leica Microsystems, Germany). The

102
optimal cutting temperature (OCT) compound was used to fix the tissue on a cryostat. When
fixing the tissue, care was taken to avoid contact of the exposed side of it with the OCT solution.
They were thaw-mounted on microscope slides, which were coated with indium tin oxide (ITO)
and stored at -80 °C. These horizontal sections were used for MALDI profiling mode
experiments. Before use, the tissue section was vacuum dried (10 min) and washed for 30 s each
with 70% ethanol and 95% ethanol followed by chloroform wash (15 s). Tissue section was
vacuum dried again for 10 min before the application of matrix. Two ILS, C4PBr and C8PBr,
were separately mixed with MALDI matrix (α-CHCA saturated with 1% TFA and 60%
acetonitrile/water) at 0.02% (w/v) concentration. The matrix was applied by manual spotting
(200 nL each) into 2×3 array of spots in each section and allowed to air dry. This process was
repeated five times on each spot. One section was used as the control matrix for two ILS and the
other section contained the matrix with C4PBr and C8PBr (each in a set of three spots).
5.2.5. Instrumentation
Surface tension measurements for CMC determinations were performed using a KSV Sigma
703 digital tensiometer at room temperature. Agilent 6210 electrospray TOF mass spectrometer
at positive mode was used to acquire ESI mass spectra of ionic liquid surfactants. MALDI mass
spectra were acquired using a MALDI-TOF mass spectrometer (UltrafleXtreme, Bruker)
equipped with a Nd:YAG laser with 355 nm wavelength and 3 ns pulse duration. MALDI-TOF
MS experiments were performed in positive ion linear mode with 25 kV acceleration potential.
Complete sample analysis was performed and an average signal intensity was collected for each
sample spot. Mass spectra were processed using FlexAnalysis 3.3 (Bruker). Light microscopic
digital images were captured using a Leica DM RXA2 upright microscope equipped with
Sensicam QE 12- bit, CCD camera and SlideBook 6.0 software.

103
5.3. Results and Discussion
5.3.1. Surfactant Properties of C4PBr, C8PBr, SDS, and CTAB
Surfactants have surface active properties due to a polar head group in combination with a
hydrophobic tail. In the ILS studied here, 4-methylpyridinium is a cationic hydrophilic head
group, while variable alkyl chains impart hydrophobic properties. Additionally, bromide anion
was chosen as the counter ion in these ILS in order to attain water soluble characteristics for
studies in aqueous protein solutions. Structures, molecular weights (MW) and CMC values for
all surfactants (C4PBr, C8PBr, SDS, and CTAB) are reported in Table 5.1.
Table 5.1. Structures, MW, and CMC values of each surfactant used in this study
Surfactant
Structure MW (g/mol)
CMC
(mM)
CMC
(w/v)%
C4PBr
228
46.36
1.06
C8PBr
284
21.50
0.61
SDS
288
8.1038
0.2338
CTAB
364 1.3038
0.0538

104
5.3.2. Protein Sample Analysis
In order to compare the role that surfactants play on the quality of MALDI mass spectra in
terms of signal intensity, resolution, signal-to-noise ratio etc., three proteins of variable
molecular weights (Cyt c, BSA, and Tr) and different surfactants (C4PBr, C8PBr, SDS, and
CTAB) were used at the same concentration (0.02% (w/v)). Results obtained from these
measurements are compared with MALDI mass spectra obtained in the absence of surfactant
(Figure 5.1). Interestingly, with C4PBr and C8PBr ILS, Cyt c protein (m/z 12387) exhibited
enhanced signal in the acquired MALDI mass spectra, as compared to the spectra obtained for
the same protein in the absence of surfactant. In contrast, the presence of normal surfactants, i.e.
SDS and CTAB, significantly reduced the signal intensity in comparison to the signal obtained
for the spectrum of 0% surfactant (Figure 5.1(A)). BSA protein signals (m/z 66449) were also
affected by two ILS in terms of enhanced signal intensity as compared to normal surfactants and
the 0% surfactant (Figure 5.1(B)). The intensity of transferrin (m/z 79019) was significantly
enhanced in the presence of C8PBr ILS, thus giving a high signal-to-noise ratio as compared to
C4PBr, SDS, CTAB and 0% surfactant.
The above observations suggest that the presence of trace amounts of ILS do not suppress the
protein signal; rather, they enhance signal intensity of MALDI mass spectra for improved
characterization. The aggregate of all results suggest that ILS perform better than the
conventional surfactants employed in this study. This is contrary to the general supposition that
surfactants will often suppress the signal of MALDI-MS.34
The concentration of ILS (0.02%
(w/v)) used in this study was lower than the CMC of C4PBr (1.06% (w/v)) and C8PBr (0.61%
(w/v)). This suggests that unlike SDS, micelle formation is not required for ILS to be effective in

105
66449.441
0
100
200
300
400
Inte
ns. [a
.u.]
55000 60000 65000 70000 75000m/z
0.02% C8PBr
0.02% C4PBr
0% Surfactant
0.02% SDS
0.02% CTAB
(b)
12387.237
0
1
2
3
4
5
4x10
Inte
ns. [
a.u.
]
11000 11500 12000 12500 13000 13500 14000m/z
(a)
0.02% C4PBr
0.02% C8PBr
0% Surfactant
0.02% SDS
0.02% CTAB
79019.360
0
100
200
300
Inte
ns. [
a.u.
]
55000 60000 65000 70000 75000 80000 85000 90000m/z
(c) 0.02% C8PBr
0% Surfactant
0.02% SDS
0.02% C4PBr
0.02% CTAB
C
A
B
Figure 5.1. MALDI mass spectra of (A) Cyt c (B) BSA and (C) Tr (1.0 × 10⁻⁵
M, 10 pmol
on the sample target) in the presence of different surfactants

106
MALDI-MS; rather, ionic interactions between ILS and proteins may play a larger role than the
micelle. Since both ILS and CTAB are cationic surfactants, a comparison between the two may
aid in an understanding of the role of cationic surfactants in MALDI-MS measurements. As
observed in Figure 5.1, all proteins showed enhanced protein signals in the presence of 0.02%
ILS as compared to the same concentration of CTAB. Since the anion is bromide in both
surfactants, variation in MALDI signal is attributed to differences in cationic moiety and
dissociated properties of ILS.
5.3.3. Concentration Effects
Table 5.2. MALDI-MS signal intensities of BSA, Cyt c, and Tr proteins in the presence of
different concentrations of surfactants. (ND*-A signal was not detected at this concentration of
surfactant.)
Concentration effects of ILS for protein MALDI-MS signal intensities were also
investigated. In this study, 0%, 0.02%, 0.05%, 0.1%, and 0.5% (w/v) concentrations of four
different surfactants: C4PBr, C8PBr, SDS, and CTAB were used. The resultant signal intensities
(in arbitrary units) are shown in Table 5.2. In the case of Cyt c and BSA proteins, highest
MALDI-MS signal intensity was observed at 0.02% (w/v) of ILS concentration (both C4PBr and
C8PBr). In contrast, MALDI-MS signals for Cyt c and BSA proteins were decreased at 0.02%
(w/v) of SDS as compared to 0% (w/v) of surfactant and essentially suppressed at 0.05% (w/v)
SDS. However, these signals recovered with increasing concentrations of SDS. A similar
Conc.
(w/v)
Cyt c Intensity (a.u.) BSA Intensity (a.u.) Tr Intensity (a.u.)
C4 C8 SDS CTAB C4 C8 SDS CTAB C4 C8 SDS CTAB
0% 35067 35067 35067 35067 224 224 224 224 211 211 211 211
0.02% 49289 38694 21202 12093 292 428 114 61 173 329 204 24
0.05% 13500 5000 0 1000 220 331 53 11 212 381 51 8
0.1% 12000 7000 1500 510 163 130 124 5 111 472 64 7
0.5% 6000 1500 6000 ND* 95 27 90 ND
* 272 286 5 ND
*
B

107
observation has been reported for Cyt c and BSA protein MALDI-MS signal suppression at SDS
subcritical concentrations (0.05%-0.1% (w/v)) by Amado et al.27
This decrease in MALDI-MS
signal at a subcritical concentration of SDS has been attributed to partial precipitation of proteins
with SDS monomers in solution. Higher MALDI-MS signal for these proteins was achieved
when an SDS concentration was used above its CMC value (0.23% (w/v)) due to the micelle
formation. Hence, SDS micelle formation is claimed to be necessary for high protein signal
intensity in MALDI-MS. However, other concentrations of SDS were not observed to achieve a
significant increase of mass spectral signal intensity for any proteins in comparison to the 0%
SDS solution. But, in our study, ILS caused a significant increase in MALDI-MS signal as
compared to the absence of surfactant.
The highest signal intensity for Tr was acquired in the presence of 0.5% (w/v) C4PBr and
0.1% (w/v) C8PBr. Again for Tr protein, SDS additions exhibited similar behavior of diminished
signal compared to 0% (w/v) as noted earlier for other proteins. The effect of cationic surfactant,
CTAB, on MALDI intensity revealed that its addition caused a gradual decrease in signal as the
concentration of surfactant increased from 0-0.1% (w/v). A protein signal was not observed at
0.5% (w/v) CTAB concentration.
After investigating the response of different surfactants, it was observed that ILS aid in
MALDI-MS signal enhancement of proteins below the CMC value as compared to MALDI mass
spectra free from surfactant. We have also examined ILS concentration effects on MALDI mass
spectra above the CMC, and observed that protein signals tend to diminish at those
concentrations (results not shown). However, normal surfactants can be used above the CMC
value to obtain a better signal but, signals are not as good with 0% surfactant. In particular, SDS
tends to diminish the signal at concentrations below the CMC, which suggests that the MALDI-

108
MS protein signal in the presence of SDS depends on the extent of micelle formation. In contrast,
protein signal enhancement in the presence of ILS is attributed to ionic interactions.
5.3.4. Sample Homogeneity
Sample spot homogeneity was compared for all surfactants: C4PBr, C8PBr, SDS, and CTAB
at low concentration (0.02% (w/v)). This evaluation focused on homogeneity of MALDI-MS
sample spots. The study was performed by using a previously described procedure.12
The sample
spot was virtually divided into 9 regions and the laser was shot at the center of the each region to
obtain a representative MALDI mass spectrum. The mass spectral intensities of the 9 regions in
each sample spot were used for calculation of range, average, and relative standard deviation
(RSD) (results are shown in Table 5.3).
Table 5.3. Range, average, and relative standard deviations (R.S.D.) of protein MALDI-MS
intensities with different surfactants
Surfactant
Intensity of Cyt C [M+H+]
(a.u.)
Intensity of BSA [M+H+]
(a.u.)
Intensity of Tr [M+H+]
(a.u.)
Range Average R.S.D.
(%) Range Average
R.S.D.
(%) Range Average
R.S.D.
(%)
Blank
(0%)
13 699 –
19 757
17 243
12 63-613 298 48
0 - 11
3 143
0.02%
C4PBr
15 360 –
37 930
24 391
30 51-292 131 58 16 - 99
36 68
0.02%
C8PBr
5 424 – 1 4310
9 912 24 206-428 299 22 104- 330
146 49
0.02%
SDS 0-1413 254 196 114-344 218 32
14 – 75
25 75
0.02%
CTAB
4 422 – 14 798
8740
34 16-61 27 49
0 - 16
4 166
The maximum intensity for Cyt c was exhibited with C4PBr, while the maximum intensities for
BSA and Tr proteins were obtained with C8PBr ILS, which are consistent with our previous
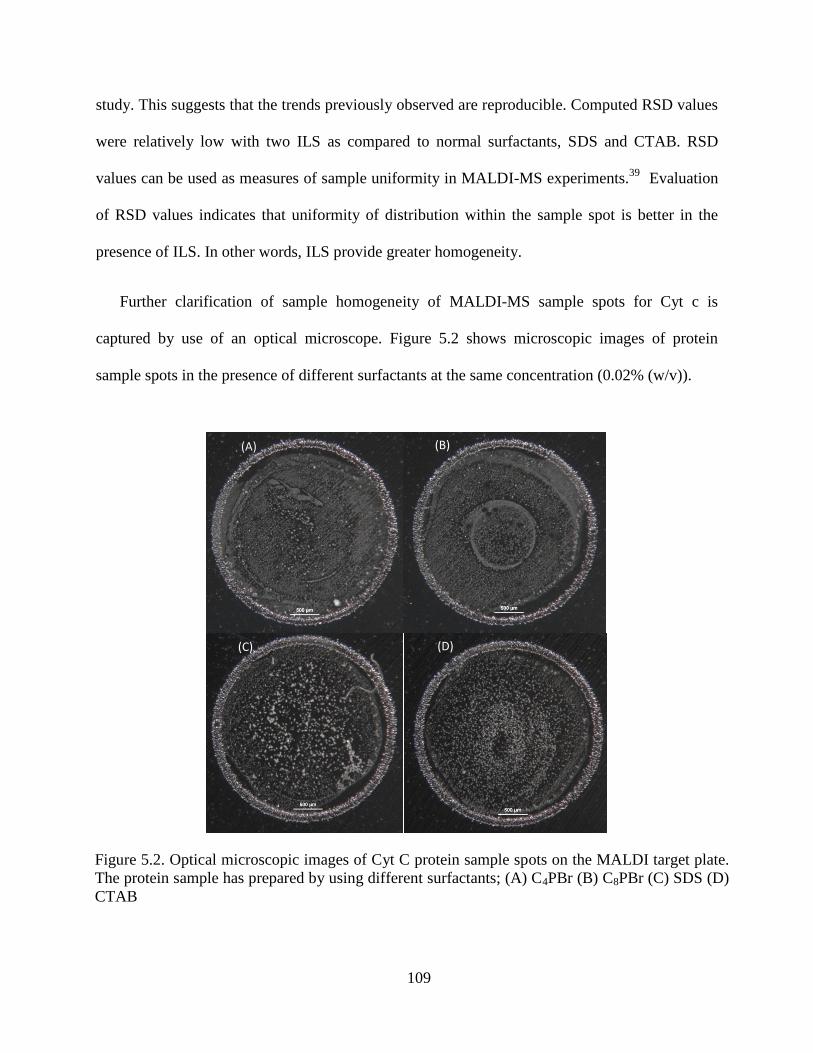
109
study. This suggests that the trends previously observed are reproducible. Computed RSD values
were relatively low with two ILS as compared to normal surfactants, SDS and CTAB. RSD
values can be used as measures of sample uniformity in MALDI-MS experiments.39
Evaluation
of RSD values indicates that uniformity of distribution within the sample spot is better in the
presence of ILS. In other words, ILS provide greater homogeneity.
Further clarification of sample homogeneity of MALDI-MS sample spots for Cyt c is
captured by use of an optical microscope. Figure 5.2 shows microscopic images of protein
sample spots in the presence of different surfactants at the same concentration (0.02% (w/v)).
)
( A )
(C)
(A) (B)
(D)
Figure 5.2. Optical microscopic images of Cyt C protein sample spots on the MALDI target plate.
The protein sample has prepared by using different surfactants; (A) C4PBr (B) C8PBr (C) SDS (D)
CTAB

110
An apparent difference in sample distribution is observed between sample spots containing
ILS and conventional surfactants. C4PBr and C8PBr containing protein sample spots were
noticeably transparent and continuous with a thin layer of small sized crystals (Figure 5.2 (A and
B)). The thin layer covered a large area of sample spot and very little spaces were observed on
the metal surface. In contrast, SDS and CTAB sample spots were visible with clusters of crystals,
which were larger in size (Figure 5.2 (C and D)). In particular, for SDS sample spot, the surface
coverage by crystals on the sample plate was very low.
The above observations provide a possible reason for the higher sensitivity observed for ILS.
In order to act as signal enhancing agents in MALDI-MS, ILS either have to possess MALDI-
matrix properties or act as protein-matrix crystallization modulators. Since no absorbance of
light occurs for these ILS at the corresponding wavelength (355 nm) of the Nd:YAG laser (see
appendix B for the absorbance spectra), this factor can be ruled out. In the presence of ILS,
homogeneous sample distribution of the sample spot revealed an even distribution of matrix
molecules throughout. This leads to an increase in the amount of matrix molecules, which are
exposed to the surface and thus can absorb greater laser energy. Furthermore, high surface
coverage on the sample spot by a very small thin crystal layer ensures the presence of a higher
number of protein-matrix interaction sites and more efficient proton transfer from matrix to
analyte. As a result, the number of protonated analyte molecules, which can be detected by use
of the mass analyzer becomes greater. Finally, the signal intensity, which is a function of the
amount of charged analytes, becomes higher in ILS protein samples, compared to SDS and
CTAB protein samples.

111
5.3.5. Profile Mode Analysis of Rat Brain Tissue in the Presence of ILS
Finally, the effects of ILS for MALDI-MS profiling were evaluated using rat brain tissue
samples. In this regard, two consecutive tissue sections were chosen to apply the MALDI matrix.
MALDI profiling mass spectra acquired in this study are shown in Figure 5.3. The same location
in two tissue sections was used for spectral peak comparison in the presence and absence of ILS.
The presence of both C4PBr and C8PBr on the matrix increased the number of peaks in 29% and
111% respectively, compared to no ILS present in the matrix. It shows the efficiency of ILS in
extracting biomolecules from tissue matrices.
(A) (B
4959.337
3450.393
6705.812
8567.452
14101.519
0
200
400
600
800
1000
Inte
ns. [a
.u.]
2000 4000 6000 8000 10000 12000 14000 16000 18000m/z
4965.699
2459.290
5632.320 7536.783
8948.077
9979.392
15180.751
0
200
400
600
800
Inte
ns. [a
.u.]
2000 4000 6000 8000 10000 12000 14000 16000 18000m/z
4957.527
7066.351
8549.422
14139.022
0
100
200
300
Inte
ns. [a
.u.]
2000 4000 6000 8000 10000 12000 14000 16000 18000m/z
3545.892
4985.665
14070.811
7536.501
8551.038
0
250
500
750
1000
1250
1500
Inte
ns. [a
.u.]
2000 4000 6000 8000 10000 12000 14000 16000 18000m/z
34
44 36
17
(C) (D)
Figure 5.3. MALDI profiling mass spectra without ILS (upper) and with ILS (below) for C4PBr
(A and C) and C8PBr (B and D)

112
The addition of C4PBr resulted to obtain 39 new peaks out of 44 total peaks detected,
whereas almost all the spectra (34 out of 36) acquired in the presence of C8PBr were new peaks.
The intensity of those new peaks shown by C8PBr ILS was significantly greater than the peaks
appeared from the control tissue sample. In terms of enhancing number of peaks, intensity of
peaks, and acquiring new peaks, C8PBr showed better performance than C4PBr. This is due to
strong hydrophobic interactions between tissue sample and C8PBr surfactant, which enabled
efficient extraction of hydrophobic proteins there by co-crystallization with the matrix. In
contrast, C4PBr with short alkyl chain makes weak hydrophobic interactions with tissue sample
and extraction of less number of proteins.
5.4. Conclusions
The presence of trace amounts of conventional surfactants in protein samples results in poor
MALDI-MS signal quality as compared to the absence of surfactants. However, surfactants
based on ILS as matrix additives in protein sample analysis exhibited improved protein
characterizations by use of MALDI-MS compared to the absence of surfactants. Concentration
studies revealed that maximum MALDI-MS signal can be obtained at 0.02% (w/v) ILS, which is
a lower concentration than the CMC. Hence, micelle formation is not necessary for MALDI-MS
signal enhancement effect. In contrast, normal surfactants, i.e. SDS and CTAB, exhibited
reduced MALDI-MS signal intensities at low concentrations (0.02% (w/v)) as compared to 0%
surfactant. The concentration of SDS had to be increased above the CMC in order to obtain a
considerable MALDI-MS signal for proteins, indicating that micelle formation is necessary to
achieve better signal quality. However, signal could not be completely recovered even at higher
concentrations of SDS compared to the absence of surfactant. Moreover, the presence of ILS
represented better shot-to-shot reproducibility and acted as protein-matrix crystallization

113
modulators with better ionic interactions through formation of very homogeneous sample spots.
As a result, high sensitivity in MALDI mass spectra could be achieved with ILS. It should be
noted that this difference in behavior between ILS and normal surfactants suggest that ILS are
more than just a collection of ions in solution. Rather they have distinct properties even when
dissolved in aqueous solution.
Since the same ILS have been used as surfactants in polyacrylamide gel electrophoretic
protein separations, high sensitivity in MALDI-MS analysis enhances applicability of these
compounds in proteomics. In this case, the presence of low amounts of ILS in protein samples to
be analyzed by MALDI-MS is not a concern, unlike other types of surfactants including SDS.
Therefore, we conclude that, use of ILS-based surfactants will save time and cost in proteomics
research, due to no need for removal of ILS from protein samples for purification.
Finally, MALDI profiling mode experiments showed better interactions of ILS with tissue
samples to extract proteins. Furthermore, this suggests the applicability of ILS in MALDI
imaging MS for analysis of novel proteins in tissue samples.
5.5. References
1. Vuckovic, D.; Dagley, L. F.; Purcell, A. W.; Emili, A., Membrane proteomics by high
performance liquid chromatography–tandem mass spectrometry: analytical approaches and
challenges. Proteomics 2013, 13 (3-4), 404-423.
2. Alonso, A.; Marsal, S.; Julià, A., Analytical methods in untargeted metabolomics: state of the
art in 2015. Frontiers in bioengineering and biotechnology 2015, 3, 23.
3. Walczak, J.; Bocian, S.; Trziszka, T.; Buszewski, B., Hyphenated Analytical Methods in
Determination of Biologically Active Compounds in Hen's Eggs. Critical Reviews in Analytical
Chemistry 2016, 46 (3), 201-212.
4. Mateos, J.; Carneiro, I.; Corrales, F.; Elortza, F.; Paradela, A.; del Pino, M. S.; Iloro, I.;
Marcilla, M.; Mora, M. I.; Valero, L., Multicentric study of the effect of pre-analytical variables
114
in the quality of plasma samples stored in biobanks using different complementary proteomic
methods. Journal of Proteomics 2017, 150, 109-120.
5. Cramer, R.; Pirkl, A.; Hillenkamp, F.; Dreisewerd, K., Liquid AP‐UV‐MALDI Enables Stable
Ion Yields of Multiply Charged Peptide and Protein Ions for Sensitive Analysis by Mass
Spectrometry. Angewandte Chemie International Edition 2013, 52 (8), 2364-2367.
6. Cramer, R.; Karas, M.; Jaskolla, T. W., Enhanced MALDI MS sensitivity by weak base
additives and glycerol sample coating. Analytical chemistry 2013, 86 (1), 744-751.
7. Wang, S.; Xiao, Z.; Xiao, C.; Wang, H.; Wang, B.; Li, Y.; Chen, X.; Guo, X., (E)-Propyl α-
Cyano-4-Hydroxyl Cinnamylate: A High Sensitive and Salt Tolerant Matrix for Intact Protein
Profiling by MALDI Mass Spectrometry. Journal of The American Society for Mass
Spectrometry 2016, 27 (4), 709-718.
8. Xu, Y.; Bruening, M. L.; Watson, J. T., Non‐specific, on‐probe cleanup methods for MALDI‐MS samples. Mass spectrometry reviews 2003, 22 (6), 429-440.
9. Pham, M. D.; Yu, S. S.-F.; Han, C.-C.; Chan, S. I., Improved mass spectrometric analysis of
membrane proteins based on rapid and versatile sample preparation on nanodiamond particles.
Analytical chemistry 2013, 85 (14), 6748-6755.
10. Zhang, N.; Li, L., Ammonium dodecyl sulfate as an alternative to sodium dodecyl sulfate for
protein sample preparation with improved performance in MALDI mass spectrometry.
Analytical chemistry 2002, 74 (7), 1729-1736.
11. Chang, Y.-H.; Gregorich, Z. R.; Chen, A. J.; Hwang, L.; Guner, H.; Yu, D.; Zhang, J.; Ge,
Y., A New Mass Spectrometry-compatible Degradable Surfactant for Tissue Proteomics. Journal
of proteome research 2015, 14 (3), 1587.
12. Shibata, M.; Koeda, S.; Noji, T.; Kawakami, K.; Ido, Y.; Amano, Y.; Umezawa, N.; Higuchi,
T.; Dewa, T.; Itoh, S., Design of New Extraction Surfactants for Membrane Proteins from
Peptide Gemini Surfactants. Bioconjugate Chemistry 2016, 27 (10), 2469-2479.
13. Reis, M. F. T.; Bonomo, R. C. F.; de Sousa, R. d. C. S.; Veloso, C. M.; Fontan, R. d. C. I.;
Gandolfi, O. R. R., Optimization of protein extraction process from jackfruit seed flour by
reverse micelle system. Acta Scientiarum. Technology 2016, 38 (3), 283.
14. Ward, K.; Cheng, S. I.; Stuckey, D. C., Protein separation using non‐ionic and cationic
surfactant precipitation. Journal of Chemical Technology and Biotechnology 2016, 91 (10),
2563-2567.
15. Yamada, H.; Matsumura, C.; Yamada, K.; Teshima, K.; Hiroshima, T.; Kinoshita, M.;
Suzuki, S.; Kakehi, K., Combination of SDS‐PAGE and intact mass analysis for rapid
determination of heterogeneities in monoclonal antibody therapeutics. Electrophoresis 2017.

115
16. Banstola, B.; Grodner, E. T.; Cao, F.; Donnarumma, F.; Murray, K. K., Systematic
assessment of surfactants for matrix-assisted laser desorption/ionization mass spectrometry
imaging. Analytica Chimica Acta 2017, 963, 76-82.
17. Chandrababu, K. B.; Dutta, K.; Lokappa, S. B.; Ndao, M.; Evans, J. S.; Moradian‐Oldak, J.,
Structural adaptation of tooth enamel protein amelogenin in the presence of SDS micelles.
Biopolymers 2014, 101 (5), 525-535.
18. Saveliev, S. V.; Woodroofe, C. C.; Sabat, G.; Adams, C. M.; Klaubert, D.; Wood, K.; Urh,
M., Mass spectrometry compatible surfactant for optimized in-gel protein digestion. Analytical
chemistry 2013, 85 (2), 907-914.
19. Antharavally, B. S.; Mallia, K. A.; Rosenblatt, M. M.; Salunkhe, A. M.; Rogers, J. C.;
Haney, P.; Haghdoost, N., Efficient removal of detergents from proteins and peptides in a spin
column format. Analytical biochemistry 2011, 416 (1), 39-44.
20. Botelho, D.; Wall, M. J.; Vieira, D. B.; Fitzsimmons, S.; Liu, F.; Doucette, A., Top-down and
bottom-up proteomics of SDS-containing solutions following mass-based separation. Journal of
proteome research 2010, 9 (6), 2863-2870.
21. Caprioli, R. M.; Porter, N. A.; Norris, J. L., Cleavable surfactants and methods of use thereof.
Google Patents: 2014.
22. Antharavally, B. S.; Mallia, A. K.; Salunkhe, A., Detergent removal from protein samples
prior to mass spectrometry analysis. Google Patents: 2013.
23. Sánchez‐Hernández, L.; Montealegre, C.; Kiessig, S.; Moritz, B.; Neusüß, C., In‐capillary
approach to eliminate SDS interferences in antibody analysis by capillary electrophoresis
coupled to mass spectrometry. Electrophoresis 2017.
24. Canas, B.; Pineiro, C.; Calvo, E.; López-Ferrer, D.; Gallardo, J. M., Trends in sample
preparation for classical and second generation proteomics. Journal of Chromatography A 2007,
1153 (1), 235-258.
25. Puchades, M.; Westman, A.; Blennow, K.; Davidsson, P., Removal of sodium dodecyl
sulfate from protein samples prior to matrix-assisted laser desorption/ionization mass
spectrometry. Rapid communications in mass spectrometry 1999, (13), 344-9.
26. Funk, J.; Li, X.; Franz, T., Threshold values for detergents in protein and peptide samples for
mass spectrometry. Rapid communications in mass spectrometry 2005, 19 (20), 2986-2988.
27. Amado, F. M.; Santana-Marques, M. G.; Ferrer-Correia, A.; Tomer, K. B., Analysis of
peptide and protein samples containing surfactants by MALDI-MS. Analytical Chemistry 1997,
69 (6), 1102-1106.

116
28. Zhang, N.; Li, L., Effects of common surfactants on protein digestion and matrix‐assisted
laser desorption/ionization mass spectrometric analysis of the digested peptides using two‐layer
sample preparation. Rapid Communications in Mass Spectrometry 2004, 18 (8), 889-896.
29. Ospinal-Jimenez, M. n.; Pozzo, D. C., Anionic Branched Surfactants as Alternative
Denaturing Agents for Protein Separations. Langmuir 2014, 30 (5), 1351-1360.
30. Gillespie, D. L.; Aguirre, M. T.; Ravichandran, S.; Leishman, L. L.; Berrondo, C.; Gamboa,
J. T.; Wang, L.; King, R.; Wang, X.; Tan, M., RNA interference targeting hypoxia-inducible
factor 1α via a novel multifunctional surfactant attenuates glioma growth in an intracranial
mouse model. Journal of neurosurgery 2015, 122 (2), 331-341.
31. Wang, S.; Xiong, N.; Dong, X.-Y.; Sun, Y., A novel nickel-chelated surfactant for affinity-
based aqueous two-phase micellar extraction of histidine-rich protein. Journal of
Chromatography A 2013, 1320, 118-124.
32. Guo, Z.; Zhang, Q.; Zou, H.; Guo, B.; Ni, J., A method for the analysis of low-mass
molecules by MALDI-TOF mass spectrometry. Analytical chemistry 2002, 74 (7), 1637-1641.
33. Mayer, U.; Ungerer, N.; Klimmeck, D.; Warnken, U.; Schnölzer, M.; Frings, S.; Möhrlen, F.,
Proteomic analysis of a membrane preparation from rat olfactory sensory cilia. Chemical senses
2008, 33 (2), 145-162.
34. Rosinke, B.; Strupat, K.; Hillenkamp, F.; Rosenbusch, J.; Dencher, N.; Krüger, U.; Galla, H.
J., Matrix‐assisted laser desorption/ionization mass spectrometry (MALDI‐MS) of membrane
proteins and non‐covalent complexes. Journal of Mass Spectrometry 1995, 30 (10), 1462-1468.
35. Hasan, F.; Vidanapathirana, P.; Das, S.; Fernand, V. E.; Siraj, N.; Losso, J. N.; Warner, I. M.,
Ionic liquids as buffer additives in ionic liquid-polyacrylamide gel electrophoresis separation of
mixtures of low and high molecular weight proteins. RSC Advances 2015, 5 (85), 69229-69237.
36. Tholey, A.; Heinzle, E., Ionic (liquid) matrices for matrix-assisted laser desorption/ionization
mass spectrometry—applications and perspectives. Analytical and bioanalytical chemistry 2006,
386 (1), 24-37.
37. Abdelhamid, H. N.; Gopal, J.; Wu, H.-F., Synthesis and application of ionic liquid matrices
(ILMs) for effective pathogenic bacteria analysis in matrix assisted laser desorption/ionization
(MALDI-MS). Analytica chimica acta 2013, 767, 104-111.
38. Love, L. C.; Habarta, J. G.; Dorsey, J. G., The micelle-analytical chemistry interface.
Analytical Chemistry 1984, 56 (11), 1132A-1148A.
39. Armstrong, D. W.; Zhang, L.-K.; He, L.; Gross, M. L., Ionic liquids as matrixes for matrix-
assisted laser desorption/ionization mass spectrometry. Analytical chemistry 2001, 73 (15), 3679-
3686.

117
CHAPTER 6: CONCLUSIONS AND FUTURE DIRECTIONS
6.1. Conclusions
Application of ionic liquid surfactants (ILS) based on N-alkyl-4-methylpyridinium bromide
were evaluated in anionic polyacrylamide gel electrophoresis (PAGE), cationic PAGE, two
dimensional (2D) isoelectric focusing (IEF)/ILS-PAGE, and matrix assisted laser desorption
ionization (MALDI)-mass spectrometric (MS) analysis of proteins. Ionic liquids have promising
characteristics such as high conductivity, high thermal stability, tunable hydrophobicity, and
non-flammability, which made them suitable in analytical applications. Additionally, ILS are
ideal candidates to be chosen as buffer additives in PAGE and MALDI-MS as they are
amphiphilic compounds with the above mentioned properties giving them distinct advantages.
In chapter 2, synthesis and characterization of N-alkyl-4-methylpyridinium bromide-based
(CnPBr where n=4, 8, and 11) ILS were described. These surfactants were applied in sample and
running buffers to separate a mixture of acidic, low and high molecular weight proteins using
anionic PAGE. C4PBr-PAGE showed better protein separations at low concentrations of ILS in
sample buffer as compared to other two ILS-PAGE. ILS with long alkyl chains reduced the
quality of separation due to strong surfactant-protein interactions. In addition, this technique
could resolve transferrin and ovalbumin isoforms as multiple bands, whereas anionic SDS-PAGE
showed single protein bands for the same proteins. Fluorescence binding studies of the ILS
revealed highly cooperative binding of proteins at very low concentrations. In contrast, SDS
exhibited negative cooperative binding to proteins. Furthermore, circular dichroism (CD) studies
showed strong denaturation properties of the ILS at room temperature. These fluorescence and
CD studies brought insights of ILS to be further used in protein separation studies.

118
In order to improve the separation efficacy for both acidic and basic proteins, the ILS-PAGE
technique was modified as cationic PAGE. In this regard, the ILS were used in polyacrylamide
discontinuous gel preparation in addition to sample and running buffers at acidic pH media. The
proteins migrated from anode to cathode under these conditions. Similar to anionic PAGE, ILS
with the shortest alkyl chain length, C4PBr, showed optimum protein separations at very low
concentrations of the surfactant. In contrast, ILS with long alkyl chain, C11PBr, showed poor
resolution in separation. Proteins were separated with a high resolution at C4PBr concentrations
of 0.05% (w/v) in gel, 0.01% (w/v) in sample buffer, and 0.1% (w/v) in running buffer. Under
the optimum conditions, ribonuclease b glycoprotein was separated into its glycoforms, which
appeared as multiple bands. The same protein migrated as a single band in anionic SDS-PAGE,
which showed the incompatibility with the glycoprotein. Hence, significant improvement of the
cationic ILS-PAGE technique is the high resolution associated with separation of glycoprotein
subunits due to charge compatibility.
This was further proved by applying cationic ILS-PAGE in 2D-PAGE separation of complex
proteins as described in chapter 4. An increased number of protein subunits, which derived from
alpha antitrypsin glycoforms appeared in 2D profile of IEF/ILS-PAGE as compared to the
conventional IEF/SDS-PAGE technique. As most glycoproteins possess negative charge
heterogeneity due to the presence of sialic acid residues attached to glycans, anionic SDS-PAGE
could not resolve those subunits. In these cases, cationic ILS-PAGE can be successfully applied
to resolve glycoprotein subunits.
In chapter 5, the application of two ILS, C4PBr and C8PBr, as a signal enhancing matrix
additives for the detection of proteins by use of MALDI-MS was discussed. The presence of low
concentrations (0.02% (w/v)) of ILS in protein samples resulted in increased signal intensity as

119
compared to 0% surfactants. Conventional surfactants such as SDS and CTAB reduced the
protein signal intensity unless they were applied at higher concentrations above the CMC.
Additionally, ILS showed better shot-to-shot reproducibility in MALDI-MS acquisitions and
more homogeneous crystals were observed as compared to SDS and CTAB. These properties
may enhance efficient proton transfer from matrix to protein, which resulted to increase the
signal intensity. All these results suggest the compatibility of ILS in MALDI-MS detection of
proteins.
6.2. Future Directions
All the fascinating properties of the ILS gave insights to apply them in further studies on
PAGE protein separation and MALDI-MS identification. For an instance, anionic SDS-PAGE
technique will be modified by applying the ILS in polyacrylamide gels, while using SDS in
protein sample and running buffers at SDS-PAGE standard conditions. This ILS-SDS-PAGE
technique is expected to improve the separation of low and moderate molecular weight proteins
as ILS in gels can stabilize excessive negative charges on SDS-protein complexes during
electrophoresis. This would help to enhance the electrophoretic mobility, hence, protein
separation resolution.
The application of cationic ILS PAGE for membrane proteins, in particular, glycoproteins
separation is another task to be done in future. For this purpose, a series of glycoproteins:
Immunoglobulin, Mucin, α1-Acid, and Invertase will be tested using 1D-cationic ILS-PAGE
technique. Analysis of glycoforms of these proteins will help to reveal biological conditions of
the tissue source. At the optimized conditions of cationic ILS-PAGE, glycoforms are expected
to be resolved in a single step similar to Rib b protein.

120
In addition, novel 2D PAGE methods based on cationic ILS-PAGE will be investigated to
separate complex proteins, which have charge heterogeneities. For an example, such proteins
will be separated using cationic ILS-PAGE in the first dimension followed by SDS-PAGE in the
second dimension. The advantage of using the former in the first dimension is the ability of ILS
to solubilize, denature, and resolve a higher number of proteins including those with negative
charge heterogeneity. During the second dimension, SDS-PAGE will resolve the proteins into
sub categories to obtain a detailed 2D profile. In another study, as a follow up to chapter 4, ILS
are expected to be applied in IEF sample buffer in the first dimension to enhance solubility of
hydrophobic proteins and to increase the recovery. Then, ILS-PAGE will be performed in the
second dimension, in a similar way as described in the same chapter.
Finally, the ILS will be applied in MALDI-imaging MS (IMS) to analyze hydrophobic
proteins in tissue samples. MALDI-MS profiling mode results suggested the possibility of
interactions between tissue sample and ILS. C8PBr ILS, in particular, showed the ability to
extract new proteins as a result of its hydrophobicity. The application of this ILS in tissue
samples analysis using MALDI-IMS would enhance the protein detection sensitivity.

121
APPENDIX A: SUPPORTING INFORMATION FOR CHAPTER 3
(
a)
(
b)
C8PBr-PAGE
1 2 3 4 5 1 2 3 4 5 1 2 3 4 5 1 2 3 4 5
(a)
0.02% (w/v)
C8PBr in gel
(b)
0.05% (w/v)
C8PBr in gel
(c)
0.1% (w/v)
C8PBr in gel
(d)
0.5% (w/v)
C8PBr in gel
(f)
0.05% (w/v)
C11PBr in gel
C11PBr-PAGE
1 2 3 4 5 1 2 3 4 5 1 2 3 4 5 1 2 3 4 5
(e)
0.02% (w/v)
C11PBr in gel
(g)
0.1% (w/v)
C11PBr in gel
(h)
0.5% (w/v)
C11PBr in gel
Figure S1. Optimization of IL concentration in polyacrylamide gels for C8PBr-PAGE and
C11PBr-PAGE. Five proteins; (1) BSA (pI-4.8, 66 kDa), (2) β-cas (pI-5.13, 23.6 kDa), (3) Myo
(pI-6.8, 16.9 kDa), (4) Rib b (pI-9.45, 14.7 kDa), and (5) Cyt c (pI-10, 12.3 kDa) were used for
this study. Different concentrations; 0.02%, 0.05%, 0.1%, and 0.5%, (w/v) of C8PBr and C11PBr
ILs were included in gels of C8PBr-PAGE and C11PBr-PAGE respectively. Sample buffer
concentration (0.02% IL (w/v)) and running buffer concentration (0.05% IL (w/v)) were the same
for all eight gels. In C8PBr-PAGE, 0.05% (w/v) IL concentration, gel (b), was selected as the
optimum concentration in gels due to sharp bands obtained in lane 1,2,3, and 5. Even though Rib b
protein in lane 4 of the same gel appeared as a diffused band, better migration was observed as
compared to 0.02% (w/v) in gel (a), which also showed comparable sharp bands. In C11PBr-
PAGE, 0.05% (w/v) IL concentration, gel (f), was selected again as the optimum concentration in
gels due to higher resolution and sharp bands obtained as compared to the other concentrations.

122
(C) 0.1% (w/v) C8PBr in
running buffer
(B) 0.05% (w/v) C8PBr in
running buffer
(A) 0.025% (w/v) C8PBr
in running buffer
1 2 3 4
1 2 3 4
1 2 3 4
0.05% (w/v) C8PBr in gels
C8PBr
concentrations
in sample buffer
(1) 0.02% (w/v)
(2) 0.1% (w/v)
(3) 0.5% (w/v)
Figure S2. Optimization of C8PBr IL in running and sample buffers of C8PBr-PAGE separation of
a mixture of five proteins; BSA (pI-4.8, 66 kDa), Ova (pI-4.6, 44.3 kDa), α-Chy (pI-8.8, 25.7 kDa),
Myo (pI-16.9, 14.7 kDa), and Cyt c (pI-10, 12.3 kDa). Three different C8PBr concentrations in
running buffers; (A) 0.025% (w/v) (B) 0.05% (w/v), and (C) 0.1% (w/v) were used. The IL
concentration in sample buffers were varied as; (1) 0.02%, (2) 0.1%, (3) 0.5%, and (4) 2% (w/v)..
Same concentration of C8PBr (0.05% (w/v)) was included in all the gels. Five resolved, sharp protein
bands were observed in B-1 (at 0.05% (w/v) IL in running buffer, 0.02% (w/v) IL in sample buffer,
and 0.05% (w/v) IL in gel). So those conditions were used as the optimum concentrations for C8PBr-
PAGE.

123
(C) 0.05% (w/v) C11PBr
in running buffer
(B) 0.1% (w/v) C11PBr in
running buffer
(A) 0.025% (w/v) C11PBr
in running buffer
0.05% (w/v) C11PBr in gels
1 2 3 1 2 3 1 2 3
Figure S3. Optimization of C11PBr IL concentration in running and sample buffers of C11PBr -
PAGE separation of a mixture of five proteins; BSA (pI-4.8, 66 kDa), Ova (pI-4.6, 44.3 kDa), α-Chy
(pI-8.8, 25.7 kDa), Myo (pI-16.9, 14.7 kDa), and Cyt c (pI-10, 12.3 kDa). Three different C11PBr
concentrations in running buffers; (A) 0.025% (w/v) (B) 0.05% (w/v), and (C) 0.1% (w/v) were used.
The IL concentration in sample buffers were varied as; (1) 0.02%, (2) 0.05%, and (3) 0.1% (w/v).
Same concentration of C11PBr (0.05% (w/v)) was included in all the gels. The best resolution was
achieved at 0.05% (w/v) concentration of IL in running buffer and 0.02% (w/v) IL in sample buffer.
So those conditions were used as the optimum concentrations for C11PBr -PAGE.

124
Figure S4. MALDI mass spectra obtained for the protein band observed on the top of rib b lane
in SDS-PAGE. No signal was observed in the mass range of 14 kDa-16 kDa, which shows the
absence of rib b glycoforms in that protein band
0
200
400
600
Inte
ns. [a
.u.]
10000 12500 15000 17500 20000 22500 25000 27500 30000m/z

125
Figure S5. The plot of Rf vs. log molecular weight of proteins; BSA (pI-4.8, 66 kDa), Ova (pI-
4.6, 44.3 kDa), α-Chy (pI-8.8, 25.7 kDa), Myo (pI-16.9, 16.7 kDa), and Cyt c (pI-10, 12.3 kDa)
separated by SDS-PAGE at Laemmli conditions
R² = 0.8955
0
0.2
0.4
0.6
0.8
1
1.2
1.4
1.6
1.8
2
0 0.1 0.2 0.3 0.4 0.5 0.6 0.7
Log
(MW
)
Rf

126
APPENDIX B: SUPPORTING INFORMATION FOR CHAPTER 5
-0.5
0
0.5
1
1.5
2
2.5
3
3.5
200 250 300 350 400 450 500
Ab
sorb
ance
Wavelength (nm)
Absorbance of C4PBr (0.25mM)
-0.5
0
0.5
1
1.5
2
2.5
3
3.5
200 250 300 350 400 450 500
Ab
sorb
ance
Wavelength (nm)
Absorbance of C8PBr (0.25 mM)

127
APPENDIX C: LETTER OF PERMISSION

128

129
VITA
Punprabhashi Vidanapathirana was born in Galle, Sri Lanka in 1985. She is the elder child in
the family having one brother. She attended Morawaka primary school for her primary education
and received a full scholarship at grade 6 to attend the top ranked girl’s school in Sri Lanka,
Visakha Vidyalaya. She completed high school in there and started collage at the University of
Colombo where she received her Bachelor of Science degree in Computational Chemistry in
2010.
She moved to United States in 2011 and joined the Department of Chemistry at Louisiana
State University as a Ph.D. candidate in Analytical Chemistry. She performed her graduate
research studies under the supervision of Prof. Isiah M. Warner. In addition, she worked as a
graduate teaching assistant in the Department of Chemistry. Punprabhashi anticipates graduating
with her Ph.D. from Louisiana State University in August 2017.