Embed Size (px)
Citation preview
INGENIERÍA • Vol. 17 • No. 2 • ISSN 0121-750X • UNIVERSIDAD DISTRITAL FRANCISCO JOSÉ DE CALDAS 35
AbstractThe reconstruction of magnetic resonance imaging (MRI) data can be a
computationally demanding task. Signal-to-noise ratio is also a concern,especially in high-resolution imaging. Data compression may be useful notonly for reducing reconstruction complexity and memory requirements, butalso for reducing noise, as it is capable of eliminating spurious components.
This work proposes the use of a singular value decomposition low-rankapproximation for reconstruction and denoising of MRI data. The AkaikeInformation Criterion is used to estimate the appropriate model order, whichis used to remove noise components and to reduce the amount of data to bestored and processed. The proposed method is evaluated using in vivo MRIdata. We present images reconstructed using less than 20% of the originaldata size, and with a similar quality in terms of visual inspection. A quantitativeevaluation is also presented.
Key words: data reconstruction, denoising, magnetic resonance imaging,truncated SVD.
ResumenLa reconstrucción de datos de resonancia magnética (RM) puede ser una
tarea computacionalmente ardua. La razón señal-ruido también puede pre-sentar complicaciones, especialmente en imágenes de alta resolución. En estesentido, la compresión de datos puede ser útil no sólo para reducir la com-plejidad y los requerimientos de memoria, sino también para reducir el ruido,hasta inclusive permitir eliminar componentes espurios.
El presente trabajo propone el uso de un sistema basado en la descompo-sición por valores singulares de bajo orden para reconstrucción y reducciónde ruido en imágenes de RM. El criterio de información de Akaike se utilizapara estimar el orden del modelo, que es usado para remover los componen-tes ruidosos y reducir la cantidad de datos procesados y almacenados. Elmétodo propuesto es evaluado usando datos de RM in vivo. Se presentanimágenes reconstruidas con menos de 20% de los datos originales y concalidad similar en cuanto a su inspección visual. Igualmente se presenta unaevaluación cuantitativa del método.
Palabras clave: descomposición truncada de valores singulares, recons-trucción de datos, reducción del ruido, resonancia magnética.
Fecha recibido: Julio 03/2012Fecha modificado: Noviembre 06/2012Fecha aceptado: Noviembre 15/2012
Citation: Lyra-Leite, D. M., da Costa, J. P. C. L. and Carvalho, J. L. A. “Improved MRI ReconstructionUsing a Singular Value Decomposition Approximation”. In: Ingeniería, Vol. 17, No. 2, pag. 35 - 45.
Davi MarcoLyra-Leite
University of BrasíliaBrasília-DF, Brazil
University of Southern CaliforniaLos Angeles, CA, USA
João Paulo CarvalhoLustosa da Costa
University of BrasíliaBrasília-DF, Brazil
João Luiz Azevedode Carvalho
University of BrasíliaBrasília-DF, Brazil
Improved MRI Reconstruction Using aSingular Value Decomposition Approximation
Reconstrucción Mejorada de Datos de ResonanciaMagnética Mediante Aproximación por Descomposiciónpor Valores Singulares
INGENIERÍA • Vol. 17 • No. 2 • ISSN 0121-750X • UNIVERSIDAD DISTRITAL FRANCISCO JOSÉ DE CALDAS36
1. IntroductionMagnetic resonance imaging (MRI) of living human tissue started in the 1970s with the
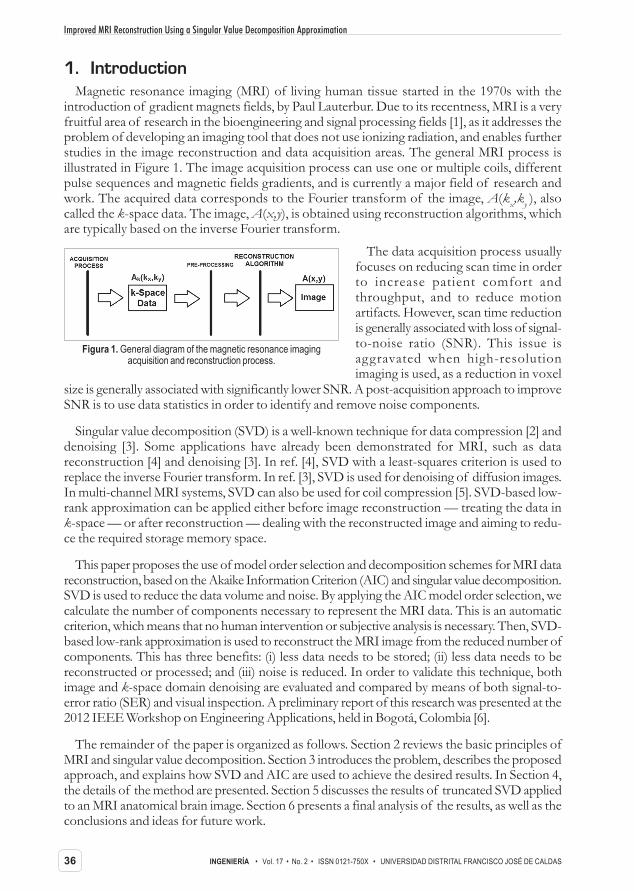
introduction of gradient magnets fields, by Paul Lauterbur. Due to its recentness, MRI is a veryfruitful area of research in the bioengineering and signal processing fields [1], as it addresses theproblem of developing an imaging tool that does not use ionizing radiation, and enables furtherstudies in the image reconstruction and data acquisition areas. The general MRI process isillustrated in Figure 1. The image acquisition process can use one or multiple coils, differentpulse sequences and magnetic fields gradients, and is currently a major field of research andwork. The acquired data corresponds to the Fourier transform of the image, A(kx,ky ), alsocalled the k-space data. The image, A(x,y), is obtained using reconstruction algorithms, whichare typically based on the inverse Fourier transform.
Figura 1. General diagram of the magnetic resonance imagingacquisition and reconstruction process.
size is generally associated with significantly lower SNR. A post-acquisition approach to improveSNR is to use data statistics in order to identify and remove noise components.
Singular value decomposition (SVD) is a well-known technique for data compression [2] anddenoising [3]. Some applications have already been demonstrated for MRI, such as datareconstruction [4] and denoising [3]. In ref. [4], SVD with a least-squares criterion is used toreplace the inverse Fourier transform. In ref. [3], SVD is used for denoising of diffusion images.In multi-channel MRI systems, SVD can also be used for coil compression [5]. SVD-based low-rank approximation can be applied either before image reconstruction — treating the data ink-space — or after reconstruction — dealing with the reconstructed image and aiming to redu-ce the required storage memory space.
This paper proposes the use of model order selection and decomposition schemes for MRI datareconstruction, based on the Akaike Information Criterion (AIC) and singular value decomposition.SVD is used to reduce the data volume and noise. By applying the AIC model order selection, wecalculate the number of components necessary to represent the MRI data. This is an automaticcriterion, which means that no human intervention or subjective analysis is necessary. Then, SVD-based low-rank approximation is used to reconstruct the MRI image from the reduced number ofcomponents. This has three benefits: (i) less data needs to be stored; (ii) less data needs to bereconstructed or processed; and (iii) noise is reduced. In order to validate this technique, bothimage and k-space domain denoising are evaluated and compared by means of both signal-to-error ratio (SER) and visual inspection. A preliminary report of this research was presented at the2012 IEEE Workshop on Engineering Applications, held in Bogotá, Colombia [6].
The remainder of the paper is organized as follows. Section 2 reviews the basic principles ofMRI and singular value decomposition. Section 3 introduces the problem, describes the proposedapproach, and explains how SVD and AIC are used to achieve the desired results. In Section 4,the details of the method are presented. Section 5 discusses the results of truncated SVD appliedto an MRI anatomical brain image. Section 6 presents a final analysis of the results, as well as theconclusions and ideas for future work.
The data acquisition process usuallyfocuses on reducing scan time in orderto increase patient comfort andthroughput, and to reduce motionartifacts. However, scan time reductionis generally associated with loss of signal-to-noise ratio (SNR). This issue isaggravated when high-resolutionimaging is used, as a reduction in voxel
Improved MRI Reconstruction Using a Singular Value Decomposition Approximation
INGENIERÍA • Vol. 17 • No. 2 • ISSN 0121-750X • UNIVERSIDAD DISTRITAL FRANCISCO JOSÉ DE CALDAS 37
2. Basic Principles of MRI and SVDIn this section, we present the theoretical fundamentals of MRI, and the principles of SVD.
2.1. Magnetic resonance imagingMRI is a non-invasive imaging technique that uses non-ionizing radiation in order to acquire
anatomical and functional information of the human body. It is possible to use MRI in order togenerate cross-sectional images in any plane (including oblique planes) [7] [8], and also to measureblood flow [7]. Data acquisition is based on the use of strong magnetic fields and pulses in theradio-frequency range in order to change nuclear spin orientation. Although this process is time-consuming, it is harmless to the patient [7], which makes MRI a unique medical imaging modality.
An MRI scanner is composed of three important and different types of magnetic fields: astrong magnetic field, called B0; the magnetic field gradients, that allow slice selection and spatialencoding; and the magnetic field associated with a radio-frequency pulse, called B1 [7] [8].
The magnetic field B0 is produced by a superconductor magnet. It is always on, even when thescanner is not being used. It aligns hydrogen nuclei in the human body, and therefore generates anet magnetization of particles in the body. The spinning charged particles (spins) act like tiny barmagnets, and the net magnetization vector generated when they are aligned can be purposelyperturbed. The net magnetization is proportional to the strength of the B0 field; therefore, MRIscanners with stronger magnetic fields (e.g., 3 Tesla) provide higher signal-to-noise ratio (SNR) [7].
The gradient coils, typically in the number of three (Gx, Gy and Gz), produce an intentionalperturbation in the B0 field when turned on. Usually, they are designed so that the perturbationvaries linearly along each spatial direction (x, y and z), and is not perceived at the iso-center ofthe magnet when the gradients are used. In the presence of an external magnetic field, the spinsrotate about the axis of that field. B0 is (approximately) spatially uniform, so all spins initiallyrotate at the same frequency (the Larmor frequency), ω = γ • B, where γ is the gyromagnetic ratio(for hydrogen protons, γ = 42.57 MHz/T). Then, the gradients are played to make the magneticfield become spatially varying, and so to vary the rotation frequency of the spins. Therefore, Gx,Gy, and Gz are used to frequency-encode (or phase-encode) spatial position along the x, y and zdirections, respectively [7] [8].
The final major component of the MR scanner is the radio-frequency (RF) coil, which is used totransmit a RF “excitation” pulse to the body, and may also be used to receive the frequency-encodedsignal from the “excited” portion of the body. In practice, independent coils may be used fortransmission and reception. The RF pulse is typically modulated to the Larmor frequency. By definition,B0 is aligned with the z-axis, while B1, which is a very weak magnetic field associated with the RF pulse,is aligned with the x-axis. When the RF pulse is played, some of the spins, which are in resonance withthe RF pulse — i.e., rotating at the RF pulse’s frequency —, begin to rotate around the x-axis (thus thename “magnetic resonance”). The RF pulse tilts the net magnetization towards the x-y plane, and thenet magnetization will now have a component in the x-y plane (Mxy) [7].
The RF pulse is typically designed to have an approximately rectangular profile in Fourierdomain, centered at the modulation frequency (e.g., a modulated windowed sinc). This impliesthat the RF pulse in fact contains a certain range of frequencies, thus all spins rotating within thatrange become “excited”, or tilted towards the x-axis. Thus, by playing gradient(s) of appropriateamplitude, and designing the RF pulse accordingly, one can excite only a thin slice of the body,which corresponds to the region containing all spins that are in resonance with the RF pulse’srange of frequencies.
Davi Marco Lyra-Leite • João Paulo Carvalho Lustosa da Costa • João Luiz Azevedo de Carvalho
INGENIERÍA • Vol. 17 • No. 2 • ISSN 0121-750X • UNIVERSIDAD DISTRITAL FRANCISCO JOSÉ DE CALDAS38
When the RF pulse is turned off, Mxy begins to rotate (at the Larmor frequency) around the z-axis, as the net magnetization begins to realign with B0. This rotating magnetization generates anoscillating signal, which can be detected by the receive coil. The frequency content of the receivedsignal can be used to obtain spatial information about the excited portion of the body. In orderto frequency-encode spatial information, gradients are also played during signal acquisition; theyare called readout gradients. For imaging a slice perpendicular to the z-axis (an axial image), Gzis played during excitation (for slice-selection), and Gx and Gy are played during acquisition.Gx,Gy, and Gz can be switched, for acquiring sagittal or coronal images, or all three gradients maybe used during both excitation and acquisition for imaging oblique planes.
The acquired MRI signal at a particular time instant t corresponds to the sum of differentsinusoidal signals generated by spins located at different regions of the body, each rotating atdifferent frequencies, corresponding to their spatial locations. Using an axial acquisition, thedemodulated signal is equivalent to a sample of the Fourier transform A(kx,ky ) of the cross-sectional image A(x,y):
(1)
The Fourier coordinates kx and ky vary with time, according to:
(2)
(3)
where Gx(t) and Gy(t) are time-varying magnetic field gradients along the x- and y-axes,respectively.
The A(x,y) image is reconstructed using a two-dimensional inverse Fourier transform alongkx and ky. The k-space data is typically digitized and reconstructed on a computer. Therefore, thereconstructed MRI image corresponds to a matrix of grayscale pixel-intensity values, A.
The required coverage of k-space, and the number of samples, depends on the specified spatialresolution and field-of-view. For low spatial resolution imaging, only the central portion of kx-kyneeds to be sampled. For higher spatial resolution, a portion of the periphery of k-space mustalso be covered. The field of view is associated with the spacing between samples. For a largerfield-of-view, k-space needs to be more densely sampled, requiring an increased number ofsamples. If k-space is not sufficiently sampled, and the resulting field-of-view is not large enoughto cover the entire object, overlap in spatial domain is observed (aliasing).
Because signal amplitude is lost as the net magnetization realigns with B0 (this is calledrelaxation), multiple acquisitions (excitation + readout) may be needed in order to cover theentire k-space. The fashion in which RF pulses and gradients are played is called pulse sequence.
2.2. Singular value decompositionConsidering the image matrix A, which is an M×N matrix of data, it is possible to obtain its
singular values and singular vectors according to:
(4)A = USVH ,
Improved MRI Reconstruction Using a Singular Value Decomposition Approximation
INGENIERÍA • Vol. 17 • No. 2 • ISSN 0121-750X • UNIVERSIDAD DISTRITAL FRANCISCO JOSÉ DE CALDAS 39
where U is an M×M matrix, S is an M×N diagonal matrix, V is an N×N matrix, and H denotesthe Hermitian transpose operation. Assuming that the rank of the signal matrix A is r, and thatM ≥ N, then r ≤ N. Equation (4) describes the singular value decomposition of A [9] [10].
The columns of U are called the left singular vectors, {uK}, and the columns of V correspondto the right singular vectors, {vK}. The elements of the diagonal matrix S are called the singularvalues. The singular values contain information about the importance of each vector — leftsingular and right singular — in spanning the signal space (or generating the MRI data, in thiscase), that is, how essential each component is for describing the data.
Furthermore, σm > 0 for 1 ≤ m ≤ r — where m is the candidate for the model order —, and σi= 0 for (r + 1) ≤ i ≤ N, and the singular values are ordered from the highest to the lowest.Therefore, this composition indicates that the singular values with the lowest indexes representthe more important components of the signal. Thus, it is possible to apply an algorithm in orderto determine the model order and therefore reduce the number of components in the matricesU, S, and V, so as to recover the original data without significant loss of information, and possiblyto reduce noise by removing components not related to the data [10].
In this paper, we propose the use of this decomposition scheme for reducing MRI data to bereconstructed. In order to correctly validate our analysis, we compare the results of SVDdecomposition schemes considering the original signal (in k-space) and the reconstructed signal(in image domain).
3. Problem statementBy applying the AIC, the number of singular values is estimated (which in turn determines its
respective left and right singular vectors). Therefore, it is possible to use this number, also called“model order”, to represent the original data.
The “principal components” are the singular values and singular vectors related to the modelorder. Using the principal components, one can increase the signal-to-error ratio in thereconstruction by removing noise components and, therefore, enhance the reconstructed imagequality. Another interesting point is that with fewer components, the data require less physicalmemory for storage and/or less bandwidth for transmission.
3.1. Proposed SVD-based low-rank approximation via Akaike information criterionThe use of decomposition schemes enables us to select data from a given set of information
and therefore identify which components are the most important for describing the originalelement. Data selection is a way of reducing noise from the acquired data based on its statisticsand the distribution of its components. In this work, we analyze the singular value profile, obtainedby singular value decomposition of any kind of complex rectangular matrices.
From the singular value matrix, it is possible to identify the model order and therefore applya selection algorithm that deals only with the important information, i.e., the information that isrequired for characterizing the original data and necessary for image reconstruction. Furthermore,one can identify which singular value components correspond to noise, and remove them beforerecomposing the original image.
(5)
Davi Marco Lyra-Leite • João Paulo Carvalho Lustosa da Costa • João Luiz Azevedo de Carvalho

INGENIERÍA • Vol. 17 • No. 2 • ISSN 0121-750X • UNIVERSIDAD DISTRITAL FRANCISCO JOSÉ DE CALDAS40
The optimal selection of the number of components is performed using a selection criterion,or — in image analysis — by visual inspection. However, the latter is a less general solution,because it is sensitive to subjective analysis and differs from person to person. Therefore, thisoption should be used only to refine the final result. In this work, the number of principalcomponents is selected using an objective approach: the AIC.
3.2. Akaike Information CriterionThe Akaike Information Criterion is used to select the necessary number of components to
describe a signal without loss of information. It is a mathematical criterion based on informationtheory, in which, given a set of candidate models for the data, the preferred model is the onewith the minimum AIC value, where the AIC value is given by [12] [13]:
(6)
(7)
where k is the number of parameters in the statistical model, and L is the maximized value ofthe likelihood function for the estimated model.
For the proposed analysis, the AIC number is calculated according to [10]:
where M and N correspond to the image size, and m is the number of considered components— and therefore the value that must be found in order to minimize the expression —, g(m) is thegeometric mean of the m smallest singular values of the data, and a(m) is the arithmetic mean ofm smallest singular values. Note that the eigenvalues are the square of the singular values.
AIC(m) is calculated for several values of m. After finding the value of m that minimizes AIC(m),it is possible to find the model order, which is given by D = M - m [10]. The model orderprovides information about the minimum number of components that accurately represents thesignal, and, therefore, allows us to discard the other components, which are considered noise.Thus, this algorithm is used to reduce the amount of data used for image reconstruction, andalso for denoising.
3.3. Using the estimated model order for SVD-based low-rank approximationAfter finding the optimal model order, we can reduce the singular value and singular vector
matrices by selecting only the components that are important for describing the signal. Forexample, given a matrix A of size M×N, which is originally described as stated in equation (4)— where UM×M, SM×N, and VN×N —, then if the model order is D ( 1 ≤ D ≤ min(M,N) ), we canuse only the highest D singular values and the first D left and right singular vectors to representthe original data. Therefore, we have:
ˆ
(8)
(9)
A = UDS
DV
DH ,
where UD and VD contain the first D columns of U and V, respectively, and SD is the diagonalmatrix with the D highest singular values. The process is also called low-rank approximation, orlow-rank truncation.
In the next section, we evaluate the use of truncated SVD for representing single-coil, two-dimensional MRI data. The information is therefore in matrix form. SVD was applied in both
Improved MRI Reconstruction Using a Singular Value Decomposition Approximation
INGENIERÍA • Vol. 17 • No. 2 • ISSN 0121-750X • UNIVERSIDAD DISTRITAL FRANCISCO JOSÉ DE CALDAS 41
k-space and image domains. Using the AIC, the singular value matrices are reduced to representonly meaningful and useful data. Finally, image reconstruction is performed and the results arecompared both qualitatively and quantitatively.
4. Methods
Figure 2. Ground-truth referenceimage obtained using all components
of its singular value matrix.
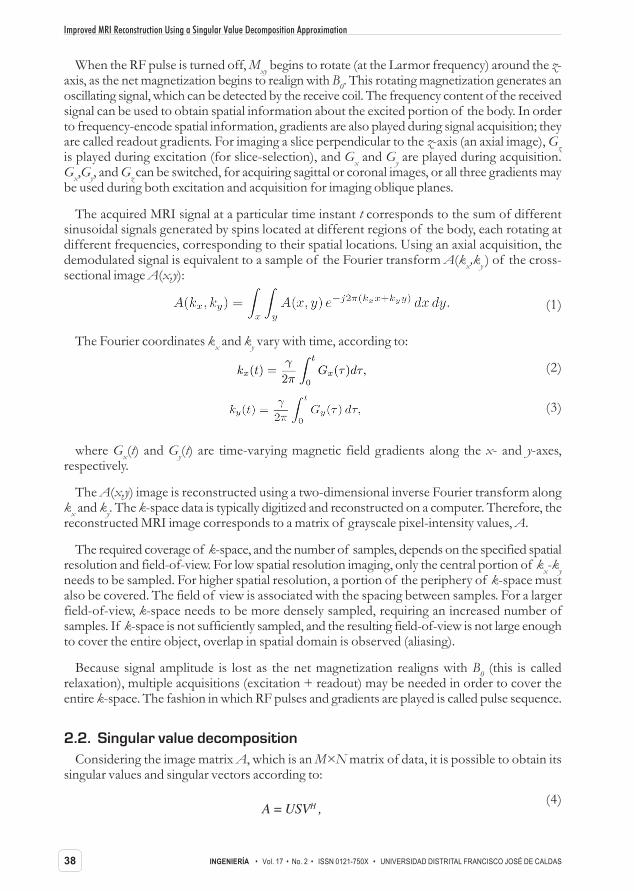
We performed reconstructions with data in both image andfrequency domain, in order to compare their results and evaluateprocess differences. The obtained images were comparedqualitatively (visual inspection) and quantitatively (signal-to-errorratio).
The data used in this work was downloaded from http://shorty.usc.edu/class/591/fall04/. Figure 2 shows the imagereconstructed from these data, using all components of its sin-gular value matrix. Reconstruction was performed using aninverse two-dimensional discrete Fourier transform. This resultwill be used as ground-truth reference.
The image shown in Figure 2 is a 256 × 256 complex matrix,which generates 256 × 256 matrices U, S, and V. In order to verifythe efficiency of the proposed method, random noise is addedto the original data (in k-space) — which is already originally noisy, due to the acquisition process—, and then SVD is applied. Noise addition is done to both real and imaginary values of the k-space data, according to:
(10)Xk(k
x,k
y ) = A
k(k
x,k
y ) + n (k
x,k
y ),
where n(kx,ky) are the zero mean i.i.d. additive Gaussian noise samples with variance σ2S =9.
The number of singular values used for reconstruction is selected both by using the Akaikeinformation criterion and by visual inspection, in order to perform quantitative and qualitativeanalyses. In order to calculate the signal-to-error ratio, we use the following formula:
(11)
where X(x,y) is the ground-truth image, A(x,y) is the reconstructed image, and |·| is themagnitude operator.
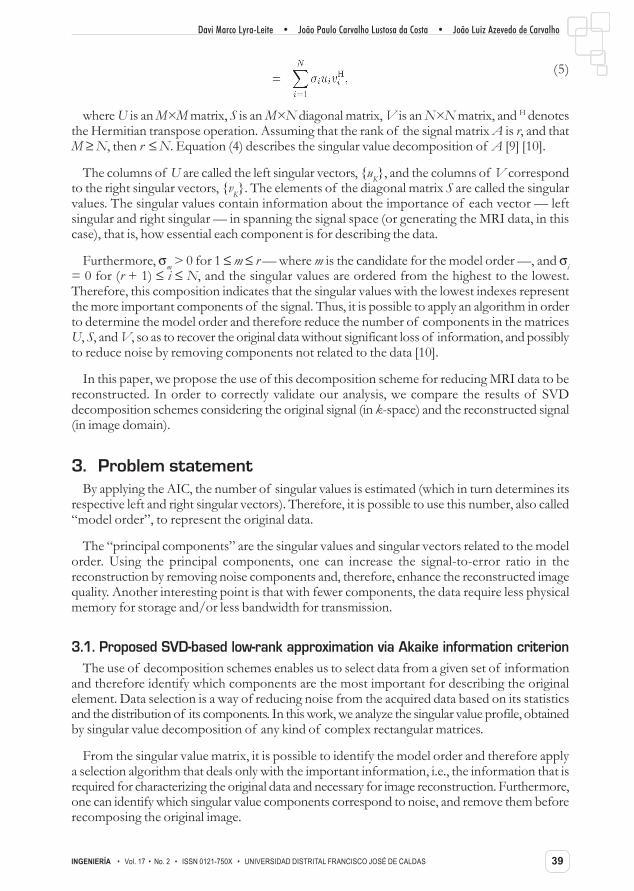
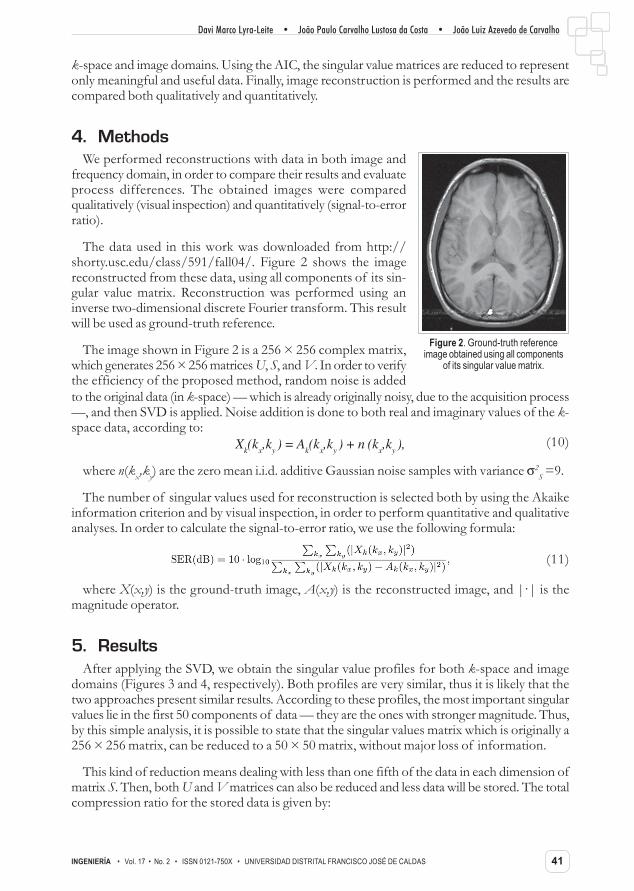
5. ResultsAfter applying the SVD, we obtain the singular value profiles for both k-space and image
domains (Figures 3 and 4, respectively). Both profiles are very similar, thus it is likely that thetwo approaches present similar results. According to these profiles, the most important singularvalues lie in the first 50 components of data — they are the ones with stronger magnitude. Thus,by this simple analysis, it is possible to state that the singular values matrix which is originally a256 × 256 matrix, can be reduced to a 50 × 50 matrix, without major loss of information.
This kind of reduction means dealing with less than one fifth of the data in each dimension ofmatrix S. Then, both U and V matrices can also be reduced and less data will be stored. The totalcompression ratio for the stored data is given by:
Davi Marco Lyra-Leite • João Paulo Carvalho Lustosa da Costa • João Luiz Azevedo de Carvalho
INGENIERÍA • Vol. 17 • No. 2 • ISSN 0121-750X • UNIVERSIDAD DISTRITAL FRANCISCO JOSÉ DE CALDAS42
where M and N are the image size, andD is the model order [14]. Therefore,with M = N = 256 and D = 50, thecompression ratio will be 2.6:1 — whichmeans that the compressed data usesonly 39% of the original memory.
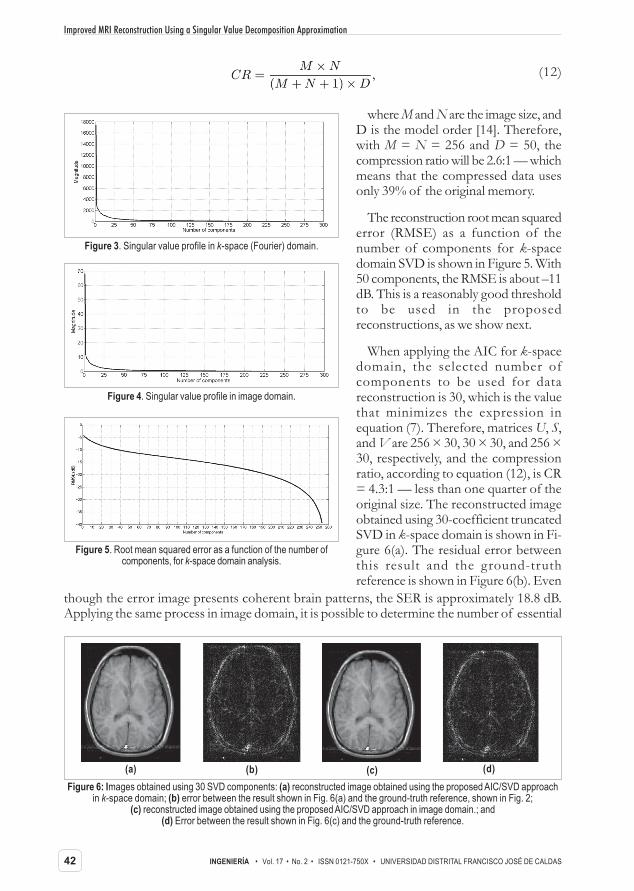
The reconstruction root mean squarederror (RMSE) as a function of thenumber of components for k-spacedomain SVD is shown in Figure 5. With50 components, the RMSE is about –11dB. This is a reasonably good thresholdto be used in the proposedreconstructions, as we show next.
When applying the AIC for k-spacedomain, the selected number ofcomponents to be used for datareconstruction is 30, which is the valuethat minimizes the expression inequation (7). Therefore, matrices U, S,and V are 256 × 30, 30 × 30, and 256 ×30, respectively, and the compressionratio, according to equation (12), is CR= 4.3:1 — less than one quarter of theoriginal size. The reconstructed imageobtained using 30-coefficient truncatedSVD in k-space domain is shown in Fi-gure 6(a). The residual error betweenthis result and the ground-truthreference is shown in Figure 6(b). Even
(12)
Figure 3. Singular value profile in k-space (Fourier) domain.
Figure 4. Singular value profile in image domain.
Figure 5. Root mean squared error as a function of the number ofcomponents, for k-space domain analysis.
Figure 6: Images obtained using 30 SVD components: (a) reconstructed image obtained using the proposed AIC/SVD approachin k-space domain; (b) error between the result shown in Fig. 6(a) and the ground-truth reference, shown in Fig. 2;
(c) reconstructed image obtained using the proposed AIC/SVD approach in image domain.; and(d) Error between the result shown in Fig. 6(c) and the ground-truth reference.
(a) (b) (c) (d)
though the error image presents coherent brain patterns, the SER is approximately 18.8 dB.Applying the same process in image domain, it is possible to determine the number of essential
Improved MRI Reconstruction Using a Singular Value Decomposition Approximation
INGENIERÍA • Vol. 17 • No. 2 • ISSN 0121-750X • UNIVERSIDAD DISTRITAL FRANCISCO JOSÉ DE CALDAS 43
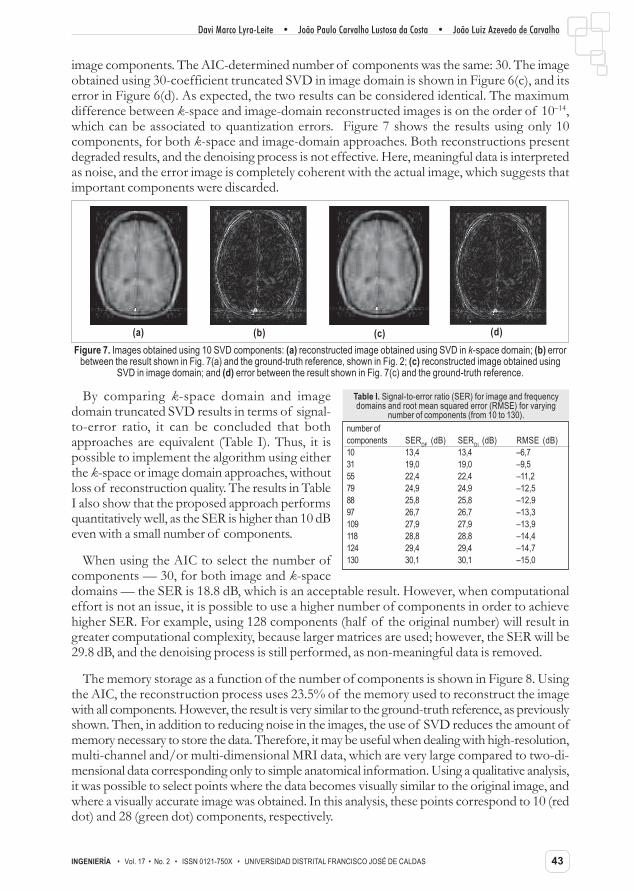
image components. The AIC-determined number of components was the same: 30. The imageobtained using 30-coefficient truncated SVD in image domain is shown in Figure 6(c), and itserror in Figure 6(d). As expected, the two results can be considered identical. The maximumdifference between k-space and image-domain reconstructed images is on the order of 10–14,which can be associated to quantization errors. Figure 7 shows the results using only 10components, for both k-space and image-domain approaches. Both reconstructions presentdegraded results, and the denoising process is not effective. Here, meaningful data is interpretedas noise, and the error image is completely coherent with the actual image, which suggests thatimportant components were discarded.
Figure 7. Images obtained using 10 SVD components: (a) reconstructed image obtained using SVD in k-space domain; (b) errorbetween the result shown in Fig. 7(a) and the ground-truth reference, shown in Fig. 2; (c) reconstructed image obtained using
SVD in image domain; and (d) error between the result shown in Fig. 7(c) and the ground-truth reference.
(a) (b) (c) (d)
By comparing k-space domain and imagedomain truncated SVD results in terms of signal-to-error ratio, it can be concluded that bothapproaches are equivalent (Table I). Thus, it ispossible to implement the algorithm using eitherthe k-space or image domain approaches, withoutloss of reconstruction quality. The results in TableI also show that the proposed approach performsquantitatively well, as the SER is higher than 10 dBeven with a small number of components.
When using the AIC to select the number ofcomponents — 30, for both image and k-space
number ofcomponents SERDF (dB) SERDI (dB) RMSE (dB)10 13,4 13,4 –6,731 19,0 19,0 –9,555 22,4 22,4 –11,279 24,9 24,9 –12,588 25,8 25,8 –12,997 26,7 26,7 –13,3109 27,9 27,9 –13,9118 28,8 28,8 –14,4124 29,4 29,4 –14,7130 30,1 30,1 –15,0
Table I. Signal-to-error ratio (SER) for image and frequencydomains and root mean squared error (RMSE) for varying
number of components (from 10 to 130).
domains — the SER is 18.8 dB, which is an acceptable result. However, when computationaleffort is not an issue, it is possible to use a higher number of components in order to achievehigher SER. For example, using 128 components (half of the original number) will result ingreater computational complexity, because larger matrices are used; however, the SER will be29.8 dB, and the denoising process is still performed, as non-meaningful data is removed.
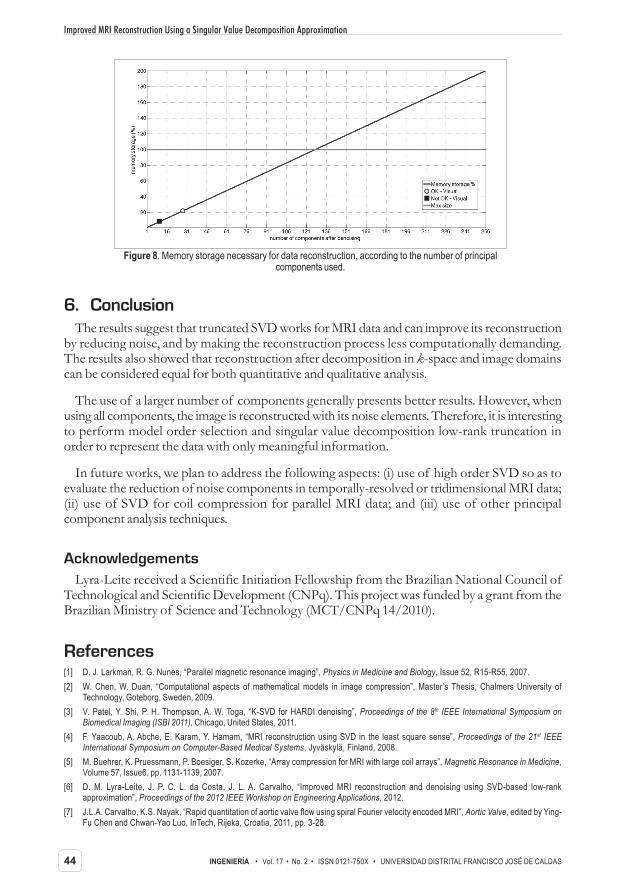
The memory storage as a function of the number of components is shown in Figure 8. Usingthe AIC, the reconstruction process uses 23.5% of the memory used to reconstruct the imagewith all components. However, the result is very similar to the ground-truth reference, as previouslyshown. Then, in addition to reducing noise in the images, the use of SVD reduces the amount ofmemory necessary to store the data. Therefore, it may be useful when dealing with high-resolution,multi-channel and/or multi-dimensional MRI data, which are very large compared to two-di-mensional data corresponding only to simple anatomical information. Using a qualitative analysis,it was possible to select points where the data becomes visually similar to the original image, andwhere a visually accurate image was obtained. In this analysis, these points correspond to 10 (reddot) and 28 (green dot) components, respectively.
Davi Marco Lyra-Leite • João Paulo Carvalho Lustosa da Costa • João Luiz Azevedo de Carvalho
INGENIERÍA • Vol. 17 • No. 2 • ISSN 0121-750X • UNIVERSIDAD DISTRITAL FRANCISCO JOSÉ DE CALDAS44
6. ConclusionThe results suggest that truncated SVD works for MRI data and can improve its reconstruction
by reducing noise, and by making the reconstruction process less computationally demanding.The results also showed that reconstruction after decomposition in k-space and image domainscan be considered equal for both quantitative and qualitative analysis.
The use of a larger number of components generally presents better results. However, whenusing all components, the image is reconstructed with its noise elements. Therefore, it is interestingto perform model order selection and singular value decomposition low-rank truncation inorder to represent the data with only meaningful information.
In future works, we plan to address the following aspects: (i) use of high order SVD so as toevaluate the reduction of noise components in temporally-resolved or tridimensional MRI data;(ii) use of SVD for coil compression for parallel MRI data; and (iii) use of other principalcomponent analysis techniques.
AcknowledgementsLyra-Leite received a Scientific Initiation Fellowship from the Brazilian National Council of
Technological and Scientific Development (CNPq). This project was funded by a grant from theBrazilian Ministry of Science and Technology (MCT/CNPq 14/2010).
References[1] D. J. Larkman, R. G. Nunes, “Parallel magnetic resonance imaging”, Physics in Medicine and Biology, Issue 52, R15-R55, 2007.[2] W. Chen, W. Duan, “Computational aspects of mathematical models in image compression”, Master’s Thesis, Chalmers University of
Technology, Goteborg, Sweden, 2009.[3] V. Patel, Y. Shi, P. H. Thompson, A. W. Toga, “K-SVD for HARDI denoising”, Proceedings of the 8th IEEE International Symposium on
Biomedical Imaging (ISBI 2011), Chicago, United States, 2011.[4] F. Yaacoub, A. Abche, E. Karam, Y. Hamam, “MRI reconstruction using SVD in the least square sense”, Proceedings of the 21st IEEE
International Symposium on Computer-Based Medical Systems, Jyväskylä, Finland, 2008.[5] M. Buehrer, K. Pruessmann, P. Boesiger, S. Kozerke, “Array compression for MRI with large coil arrays”, Magnetic Resonance in Medicine,
Volume 57, Issue6, pp. 1131-1139, 2007.[6] D. M. Lyra-Leite, J. P. C. L. da Costa, J. L. A. Carvalho, “Improved MRI reconstruction and denoising using SVD-based low-rank
approximation”, Proceedings of the 2012 IEEE Workshop on Engineering Applications, 2012.[7] J.L.A. Carvalho, K.S. Nayak, “Rapid quantitation of aortic valve flow using spiral Fourier velocity encoded MRI”, Aortic Valve, edited by Ying-
Fu Chen and Chwan-Yao Luo, InTech, Rijeka, Croatia, 2011, pp. 3-28.
Figure 8. Memory storage necessary for data reconstruction, according to the number of principalcomponents used.
Improved MRI Reconstruction Using a Singular Value Decomposition Approximation
INGENIERÍA • Vol. 17 • No. 2 • ISSN 0121-750X • UNIVERSIDAD DISTRITAL FRANCISCO JOSÉ DE CALDAS 45
[8] P. Suetens, Fundamentals of Medical Imaging, Second Edition, Cambridge University Press, Cambridge, United Kingdom, 2009.[9] S. Haykin, Adaptive Filter Theory, Third Edition, Prentice-Hall International, New Jersey, United States, 1993.[10] M. E. Wall, A. Rechtsteiner, L. M. Rocha, “Singular value decomposition and principal component analysis”, A Practical Approach to
Microarray Data Analysis, edited by D. P. Berrar, W. Dubitzky, M. Granzowr, Kluwer, Norwell, Massachusetts, 2003, pp. 91-109.[11] M. Wax, T. Kailath, “Detection of signals by information theoretic criterion”, IEEE Transactions on Acoustics, Speech and Signal Processing,
Volume 33, 1985, pp. 387-392.[12] H. Bozdogan, “Akaike’s Information Criterion and Recent Developments on Information Complexity”, Journal of Mathematical Psychology,
Volume 44, 2000 62-91.[13] K. P. Burnhamand, D. R., Anderson, “Multimodel inference: understanding AIC and BIC in Model Selection”, Sociological Methods and
Research, Volume 33, 2004, 261-304.[14] M. Pourhomayoun, M. Fowler, “An SVD approach for data compression in emitter location systems”, Proceedings of the 45th Asilomar
Conference on Signals, Systems and Computers, Monterrey, United States, 2011.
Davi Marco LDavi Marco LDavi Marco LDavi Marco LDavi Marco Lyra-Leiteyra-Leiteyra-Leiteyra-Leiteyra-Leitewas born in Brasília-DF, Brazil. He received his B.E. degree in electrical engineering in 2012 from the University of Brasília, in Brasília-DF, Brazil.During his undergraduate studies, he received a scientific initiation scholarship from the National Council of Technological and Scientific Development(Conselho Nacional de Desenvolvimento Científico e Tecnológico, CNPq) of the Brazilian Government.Currently, he is a Ph.D. student at the University of Southern California, in Los Angeles, CA, United States. His research interests are in the areaof magnetic resonance imaging, biomedical signal processing, medical image formation and analysis, and cardiovascular diseases.e-mail: [email protected]
João PJoão PJoão PJoão PJoão Paulo Carvalho Lustosa da Costaaulo Carvalho Lustosa da Costaaulo Carvalho Lustosa da Costaaulo Carvalho Lustosa da Costaaulo Carvalho Lustosa da Costawas born in Fortaleza, Brazil. He received his Diploma degree in electronic engineering in 2003 from the Military Institute of Engineering (IME) in Riode Janeiro, Brazil, his M.S. degree in 2006 from University of Brasília (UnB) in Brazil, and his Doktor-Ingenieur (Ph.D.) degree with Magna cumLaude in 2010 from Ilmenau University of Technology (TU Ilmenau) in Germany.During his Ph.D. studies, he was a scholarship holder of the National Council of Technological and Scientific Development (Conselho Nacional deDesenvolvimento Científico e Tecnológico, CNPq) of the Brazilian Government, and also a captain of the Brazilian Army.Currently, he is a professor at the Department of Electrical Engineering of the University of Brasília (UnB), and he participates in the Digital SignalProcessing Group and in the Laboratory of Technologies for Decision Making (LATITUDE), supported by DELL computers of Brazil. He is co-responsible for the Laboratory of Array Signal Processing (LASP) at UnB. His research interests are in the areas of multi-dimensional array signalprocessing, model order selection, principal component analysis, MIMO communications systems, parameter estimation schemes, development ofcommunication solutions and of sensors for UAVs, and business intelligence.e-mail: [email protected]
João Luiz Azevedo de CarvalhoJoão Luiz Azevedo de CarvalhoJoão Luiz Azevedo de CarvalhoJoão Luiz Azevedo de CarvalhoJoão Luiz Azevedo de Carvalhowas born in Campinas, Brazil. He received his B.E. degree in network engineering in 2002 from the University of Brasília, in Brasília-DF, Brazil, hisM.S. degree in electrical engineering in 2003 from the University of Brasília, in Brasília-DF, Brazil, and M.S. and Ph.D. degrees in electricalengineering in 2006 and 2008, respectively, from the University of Southern California, in Los Angeles, CA, United States.Currently, he is a professor at the Department of Electrical Engineering of the University of Brasília. His research interests are in the field of biomedicalsignal and image processing, including magnetic resonance flow imaging, reconstruction from undersampled MRI data, heart rate variability, andsurface electromyography.e-mail: [email protected]
Davi Marco Lyra-Leite • João Paulo Carvalho Lustosa da Costa • João Luiz Azevedo de Carvalho