Embed Size (px)
Citation preview
Improved estimate of tidal dissipation within Mars
from MOLA observations of the shadow of Phobos
Bruce G. Bills,1,2 Gregory A. Neumann,1,3 David E. Smith,1 and Maria T. Zuber1,3
Received 4 November 2004; revised 4 January 2005; accepted 21 April 2005; published 26 July 2005.
[1] We report on new observations of the orbital position of Phobos, the innermost naturalsatellite of Mars, and show that these observations provide an improved estimate of therate of tidal dissipation within Mars. The observations were made with the Mars OrbiterLaser Altimeter instrument on the Mars Global Surveyor spacecraft. The secularacceleration in along-track orbital motion is conventionally expressed in terms of aquadratic term in mean orbital longitude, which yields s = (dn/dt)/2 = (136.7 ± 0.6) �10�5 deg/yr2, where n is the mean motion. The corresponding fractional rate of change inorbital angular velocity is (dn/dt)/n = (6.631 ± 0.029) � 10�9/yr, the highest measured forany natural satellite in the solar system. The energy dissipation rate is (3.34 ± 0.01) MW.Because Phobos is so close to Mars, there are nonnegligible contributions to the tidalevolution from harmonic degrees 2, 3, and 4. However, the elastic tidal Love numbers areobservationally constrained only at degree two. The observed acceleration is consistentwith that for a homogeneous Maxwell viscoelastic model of Mars with effective viscosityof (8.7 ± 0.6) � 1014 Pa s.
Citation: Bills, B. G., G. A. Neumann, D. E. Smith, and M. T. Zuber (2005), Improved estimate of tidal dissipation within Mars from
MOLA observations of the shadow of Phobos, J. Geophys. Res., 110, E07004, doi:10.1029/2004JE002376.
1. Introduction
[2] The Mars Orbiter Laser Altimeter (MOLA) instru-ment on the Mars Global Surveyor spacecraft has observed15 transits of the shadow of Phobos across the surface ofMars, and has directly measured the range to Phobos on oneoccasion. The observed positions of Phobos and its shadoware in good agreement with predictions from orbital motionmodels derived from observations made prior to 1990, withthe notable exception that Phobos is gradually getting aheadof its predicted location. This effect makes the shadowappear at a given location earlier than predicted, andthe discrepancy is growing by an amount which averages0.8 s/yr. We model this effect, and interpret the requiredmodification in the orbital model as implying a revision tothe rate of tidal dissipation within Mars. It has long beenunderstood that tides can be effective in transferring angularmomentum from the spin of a planet to the orbit of asatellite, or vice versa, depending on whether the satellite isabove or below the synchronous elevation, at which thesatellite orbital period matches the planetary rotation period.The process was first examined in detail by Darwin [1911]and in the case of the Earth-Moon system there is a veryclear signal, with the Earth’s spin slowing down, such thatthe length of the day is increasing by (2.3 ± 0.1) ms per
century [Stephenson and Morrison, 1995] and the size ofthe lunar orbit is increasing at a rate of (3.84 ± 0.07) cm/yr[Dickey et al., 1994].[3] In the case of Io, the innermost large satellite of
Jupiter, tidal heating produces very significant volcanismon the satellite [Peale et al., 1979; Lopes-Gautier et al.,1999; Peale, 2003]. However, there are two importantdifferences between Io and the Moon, both of which slowthe orbital evolution of the former. The tides raised by Io onJupiter are substantial, but because Jupiter is gaseous, thetides are very nearly in equilibrium and dissipate littleenergy. Also, because Io is locked in resonance with itsneighbors Europa and Ganymede, the associated orbitalevolution, per unit of transferred angular momentum, isreduced [Yoder and Peale, 1981; Peale and Lee, 2002] anddespite nearly 400 years (�81,500 orbits) of careful obser-vations, even the sign of the change in orbital motion is stillin dispute [Lieske, 1987; Aksnes and Franklin, 2001].[4] The best known case of rapid orbital evolution in the
solar system is Phobos, innermost of the two naturalsatellites of Mars. From the time of its discovery by AsaphHall on 16 August 1877 [Hall, 1878], the orbital motion ofPhobos has been intensively studied by Earth-based observ-ers and from spacecraft. Phobos is very close to Mars, at amean distance of 9378 km, compared to 3394 km radius ofMars, and with an orbital period of only 7.65 hours, is wellwithin the synchronous orbital distance. In the 127 yearssince discovery, Phobos has completed �145,500 orbits,equivalent to 705 years for Io, and 10,880 years for theMoon. In terms of orbits completed under careful observa-tion, Phobos can arguably lay claim to being the beststudied natural satellite in the solar system.
JOURNAL OF GEOPHYSICAL RESEARCH, VOL. 110, E07004, doi:10.1029/2004JE002376, 2005
1NASA Goddard Space Flight Center, Greenbelt, Maryland, USA.2Scripps Institution of Oceanography, La Jolla, California, USA.3Massachusetts Institute of Technology, Cambridge, Massachusetts,
USA.
Copyright 2005 by the American Geophysical Union.0148-0227/05/2004JE002376$09.00
E07004 1 of 15
[5] As might be expected from proximity to Mars, theorbit of Phobos is experiencing a secular acceleration. Usingthe theory of Woolard [1944], Sharpless [1945] estimatedan along-track acceleration of (1.82 ± 0.17) � 10�3 deg/yr2.Subsequent observations have refined the estimate andmodels generated in support of the Russian Phobos mission[Sagdeev and Zakharov, 1989; Avensov et al., 1989; Morley,1989] all give concordant estimates, as indicated in Table 1.Given the long time span of the observations, and relativelyhigh accuracy of the models, it might be supposed that littleadditional progress would occur. Indeed, relatively fewadditional observations of Phobos have been made untilquite recently.[6] Our primary interest in these MOLA observations is
that they can provide information about the interior of Mars.Previous estimates of secular acceleration of Phobos havebeen used to determine the tidal quality factor, or Q, ofMars. This parameter is a common means of expressing therelative rate of tidal dissipation and is defined as themaximum energy stored in the tide, divided by the energydissipated per cycle. High values of Q correspond to lowrates of dissipation, per unit forcing. For any dampedoscillator system, the value of Q depends both on intrinsicproperties of the oscillator, and upon the frequency of theoscillation and without further information, it is difficult todetermine what the Q would be at other frequencies. Forthat reason, we will estimate an effective viscosity for Marswhich yields the observed tidal effects. However, sincemuch of the previous work on tidal dissipation within Mars,and other planets, has been formulated in terms of Q values,we will also use this formulation.[7] On the basis of previous analyses of the orbital
acceleration of Phobos, the tidal Q of Mars has beenestimated to be Q = (100 ± 50) [Smith and Born, 1976;Yoder, 1982]. For comparison, the tidal Q of Jupiter is likelyin excess of 106 [Goldreich and Nicholson, 1977; Ioannouand Lindzen, 1993] and that of Earth is �10. However, mostof the dissipation of lunar tides occurs in the oceans [Egbertand Ray, 2003]. It has only recently been possible to removethe much larger oceanic dissipation and estimate the solidEarth tidal Q = (280 ± 70) [Ray et al., 2001]. This is inagreement with damping of seismic normal modes [Widmeret al., 1991]. It thus appears that Mars is more dissipativethan Earth. This is an important conclusion, if true, andattempting to better understand this situation is part of ourmotivation for the current study.[8] In an analysis of tidal dissipation within Mars, the
secular acceleration of Deimos is also potentially informa-tive. It is outside the synchronous orbital distance, and isthus expected to be evolving away from Mars. The astro-metric observations of Deimos are nearly as numerous andaccurate as those of Phobos, but the secular acceleration issmall enough that the signal-to-noise ratio is not nearly as
good for Deimos, as can be seen in Table 1. In contrast tothe case for Phobos, where all of the recent estimates are ingood agreement, there is still considerable scatter among theDeimos estimates.
2. Observations
[9] We will present and discuss three types of observa-tions which constrain the orbital position of Phobos. Thefirst set of observations are measurements of the distance toPhobos by the MOLA instrument on MGS. The second setcomprise detections of the shadow of Phobos on the surfaceof Mars by MOLA. The earliest measurements we discussare observations by the camera on the Viking I lander as theshadow of Phobos passed over it in 1977.
2.1. Range to Phobos
[10] The MOLA instrument was designed to measure thetopography of Mars with a laser [Zuber et al., 1992; Abshireet al., 2000; Smith et al., 2001a]. In that mode of operation,it transmitted a short (8 ns) pulse of laser light at 1064 nmwavelength, and detected the reflected pulse in a 50 cmaperture telescope, with 0.8 mrad field of view. The round-trip time of flight of the laser pulse determines the rangefrom the spacecraft to the surface bounce point. Theinstrument time is related to the spacecraft clock withsubmillisecond precision [Neumann et al., 2001], andspacecraft time is maintained by the Mars Global Surveyorproject with accuracy better than 30 milliseconds relative toUTC. Onboard sensors determine the orientation of thespacecraft with an accuracy of �1 mrad, and radio trackingfrom Earth determines the trajectory of the spacecraft aboutMars with an accuracy of a few meters. Thus MOLAprovides an inherently precise and bias-free measurementof planetary radius and related events at Mars.[11] The direct range measurement to Phobos was made
on 12 September, 1998, during one of four close encountersbetween MGS and Phobos during the aerobraking missionphase. As discussed by Banerdt and Neumann [1999], atotal of 627 range measurements were acquired, over a spanof 63 s, and agreement between the measured range andprevious estimates of Phobos surface topography were quitegood, but required estimation of the location of the laserfootprints on the surface of Phobos and a small correction tothe satellite orbit. There was a 4 km discrepancy betweenthe measured and estimated ranges, but with a total posi-tional accuracy estimate for the model of 17 km, this wasnot seen as anomalous.
2.2. Shadow Detections
[12] The MOLA instrument is currently in use as apassive radiometer. It no longer fires its laser, since themaster clock oscillator failed in 2001, halting the laser after700 million pulses. However, its detector continues to sensethe 1 micron brightness of the surface of Mars. The surfacespot size depends on viewing geometry, but in nadir-pointedmode, the field of view is a circle with radius 300 m. Inthe passive radiometer mode, background brightness isintegrated over 1/8 s intervals (1 s intervals during topo-graphic mapping), during which time the detector groundtrack advances 375 m. The MOLA detector thus functionsas a 1-pixel camera, with a roughly 300 � 500 m resolution,which is intermediate between that of imagers such as
Table 1. Phobos and Deimos Secular Acceleration Estimates
Source Phobos, 10�5 deg/yr2 Deimos, 10�5 deg/yr2
Sharpless [1945] 188 ± 17 �26.6 ± 16Sinclair [1972] 96 ± 16 �6.3 ± 4.4Sinclair [1989] 123.7 ± 1.7 �0.28 ± 0.79Jones et al. [1989] 124.0 ± 1.7 �0.20 ± 0.80Jacobson et al. [1989] 124.8 ± 1.8 �1.57 ± 0.81This work 136.7 ± 0.6
E07004 BILLS ET AL.: TIDAL DISSIPATION WITHIN MARS
2 of 15
E07004
MOC, and the 3 � 5-km spots of the Thermal EmissionSpectrometer.[13] In radiometer mode, MOLA measures variations in
albedo, changes in dust opacity, cloud cover, and seasonalvariations in albedo of polar ice. The MGS extendedmission phase has implemented a 16deg pitch to thespacecraft attitude so that the emission angle is no longernormal to the surface, with correspondingly greater uncer-tainty in the position and range to the MOLA footprint.[14] The size of Phobos, and its distance from Mars, are
such that the apex of the umbral cone, within which a totalsolar eclipse would be seen, does not reach the surface ofMars. The minimum diameter of the penumbra at thesurface is �60 km, when the shadow is located near solarnadir, but extends in a broad ellipse as the shadow marchesfrom hemisphere to hemisphere with season. In any case,the passage of a shadow of Phobos through the MOLA fieldof view causes a detectable change in surface brightness.[15] We searched the archive of surface brightness varia-
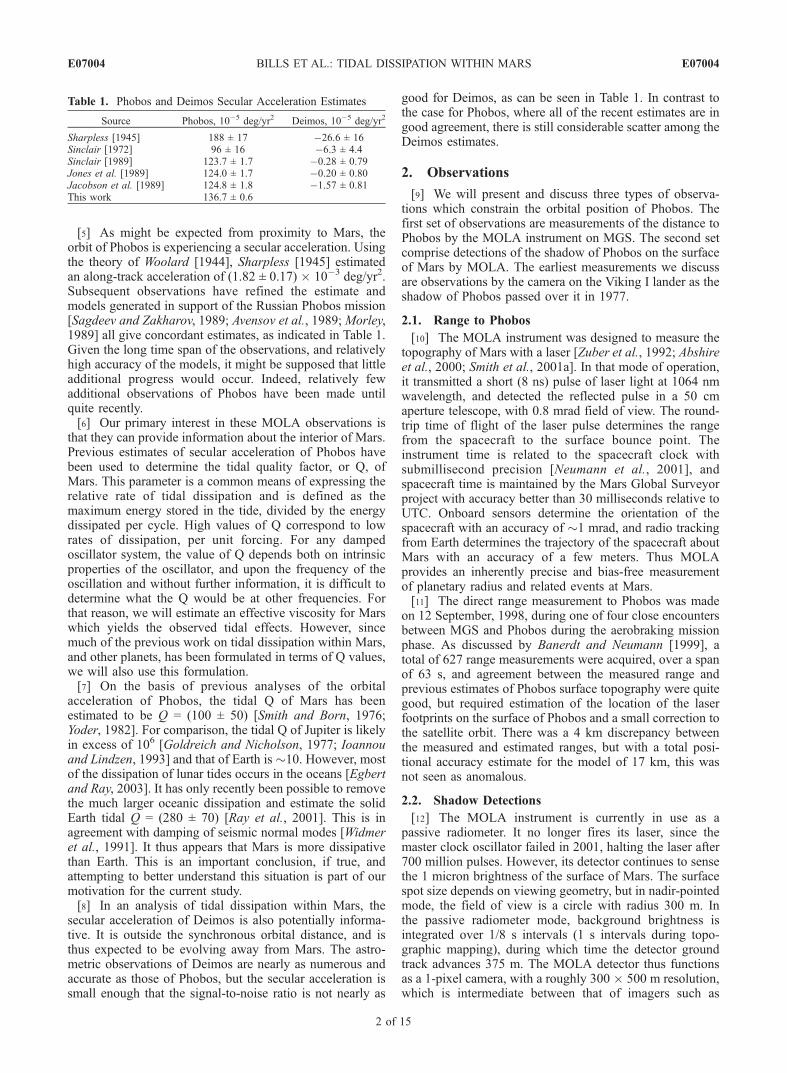
tions spanning three Mars years, concentrating on timeswhen the predicted shadow centroid was within 50 km ofthe MOLA viewpoint. We have detected 15 shadow transits,with parameters listed in Table 2. The best shadow detec-tions occur when the shadow is near the equator and ismoving across low-relief, uniform albedo surfaces, butnearly all light curves have provided usable estimates ofcentroid time and duration of the darkening. Because solarbrightness varies from center to limb and considerablelight is scattered by atmospheric particles, the amount ofdarkening is not strictly proportional to, and is generallyless than, the area of the solar disk obscured.[16] In Table 2, we indicate for each detected shadow
event the time and location of the centroid. We also list theestimated duration of the event, and an offset between theobserved and computed centroid times. A positive offsetmeans that Phobos was ahead of the estimate given bythe Jacobson et al. [1989] ephemeris. We also list anerror associated with the offset, which is determined bythe least-squares fitting procedure, as described below.[17] Under favorable circumstances, the observed ‘‘light
curve’’ is quite analogous to what is seen when observingeclipsing binary stars through a telescope [Wilson, 1994].Figure 1 illustrates one of the detected shadow events. It islisted as event 3 in Table 2, and has identifier AP11994L.
The parameters of primary interest are the centroid time,and the duration and maximum amount of the darkening.[18] The orbit of Phobos lies very nearly in the Mars
equator plane, so the shadow motion is mainly in alongitudinal direction. The latitude of the shadow changesmuch more slowly, with one cycle per Mars year. As thesubsolar latitude moves north after the vernal equinox, theshadow moves south of the equator. Since the obliquity ofMars is roughly 25.2 degrees and the orbital mean radius is2.76 times the planetary radius, there are two periods duringeach Mars year during which the Phobos-Sun line fails tointersect the surface of Mars. The most recent shadowdetection in Table 2 is the last one possible during thecurrent eclipse season. For a more detailed discussion of the
Table 2. Phobos Shadow Events
Event Identifier Date Time, UTC h:m:s Duration, s Offset, s Error, s E Longitude, deg N Latitude, deg
a VL1-263 1977 Sep 20 20:40:03.718 30 �16. 3.0 312.0434 22.26890 Flyby 551 1998 Sep 12 22:44:31.638 63 1.75 0.25 337.3135 23.71301 AP10758L 1999 May 10 23:07:40.975 25 2.0 2.0 73.8112 �35.43302 AP11211L 1999 Jun 16 15:44:29.745 20 1.4 0.2 176.7834 �18.74353 AP11994L 1999 Aug 19 11:11:57.587 15 1.7 0.2 138.0214 8.00114 AP12080L 1999 Aug 26 04:00:29.597 18 1.8 0.2 310.3241 10.57005 AP19166L 2001 Mar 27 06:11:53.914 35 2.8 0.2 98.3065 �38.77486 AP20266L 2001 Jun 25 05:35:29.846 15 3.2 0.2 251.3572 6.04097 AR02012B 2002 Jan 12 21:20:29.756 23 5.6 1.0 154.9400 47.99178 AR02118B 2002 Apr 28 04:19:45.634 15 5.7 2.5 347.9598 �0.65019 AR02151B 2002 May 31 01:00:16.445 18 4.7 0.5 355.1518 �13.617910 AR03092B 2003 Apr 02 15:32:22.254 20 6.7 0.2 211.7248 �14.043611 AR03356B 2003 Dec 22 12:31:21.916 19 5.1 0.2 277.7320 29.793912 AR04017B 2004 Jan 17 16:27:09.046 15 5.6 0.2 111.7624 17.668913 AR04069B 2004 Mar 09 16:35:19.534 16 4.8 0.2 252.0035 �1.066114 AR04124B 2004 May 03 21:14:38.725 17 3.3 2.0 355.2571 �20.381715 AR04180B 2004 Jun 28 01:50:29.156 47 4.6 2.0 100.2560 �49.2834
Figure 1. Shadow event detection. Plus signs indicatedetected Mars surface brightness variations as seen byMOLA, as a function of time, for shadow event 3 in Table 2.The curve approximating the observations is computedvia ray tracing, as explained in the text. Unit for radiance isW/m�2/sr/micron. The other curve illustrates distancebetween the MOLA field of view and the predicted shadowcentroid. The offset of 1.7 s between the minima of thesetwo curves yields an estimate of the along-track correction,or the amount by which Phobos is ahead of schedule. Unitof distance is km.
E07004 BILLS ET AL.: TIDAL DISSIPATION WITHIN MARS
3 of 15
E07004
spatial and temporal pattern of motion of the shadow, seeBills and Comstock [2005].[19] The MGS spacecraft orbital inclination is 92.9
degrees, so its motion is mainly in a latitudinal direction.Both orbits (MGS and Phobos) have low eccentricities, andthus nearly uniform speed in the along-track direction. Theshadow of Phobos is nearly circular when it is close to thesubsolar point, and as it moves away from that pointbecomes elongated along the axis connecting the shadowcentroid to the subsolar point. For small departures from thesubsolar point, the shadow is approximately elliptical.When far from the subsolar point it departs somewhat fromthe elliptical form, since it is defined by the intersection of anearly circular cone with a sphere. When circular, theshadow diameter is roughly 30 km. Due to the lowinclination of the orbit, these circular shadows only occurnear to the equinoxes. The duration of a shadow detectionevent depends on several parameters, including the size,shape, and orientation of the shadow itself, and how closelythe MOLA field of view trajectory passes to the shadowcentroid.[20] To predict the light curve, rays are traced from the
solar disk to the surface observation point during a windowof time of approximately 45–60 s duration. We model thesolar disk as an array of 70 � 70 pixels, each of them20,000 km on a side, with a brightness that depends onwavelength and on the pixel’s angular distance from centerq as ma, where m = cos (q) and a = 0.25 at 1064 nm[Hestroffer and Magnan, 1998].[21] We determine the position of the Sun and Phobos in
Mars-centered, inertial (J2000) coordinates using the NAIFtoolkit [Acton, 1996] applied to the nominal ephemeriskernel mar033-7 [Jacobson et al., 1989; Sinclair, 1989],using the JPL Developmental Ephemeris DE410 [Standishet al., 1995, 2003], correcting the position of the Sun forlight-time and stellar aberrations. The rotations of Mars andPhobos are calculated according to the IAU2000 planetarymodel [Seidelmann et al., 2002].[22] The solar disk is eclipsed where a ray intersects the
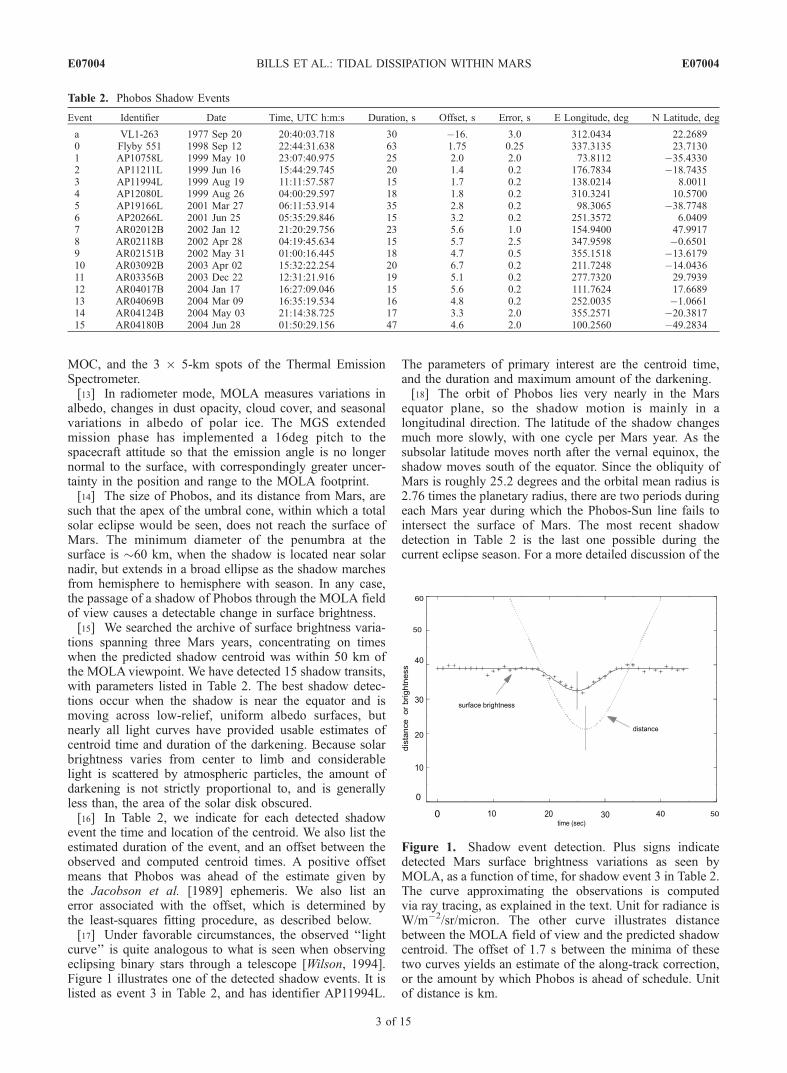
volume of Phobos, modeled as a triaxial ellipsoid with radii13.4, 11.2, and 9.3 km. The normalized light curve iscompared to the observations in a least-squares sense, wherethe model includes an unknown scale factor and back-ground constant to account for attenuated and scatteredlight. A total of 45 s of time is modeled to establish abaseline. Figure 2 illustrates a sequence of simulated viewsof the partially eclipsed Sun, at 1 s intervals, as would beseen at points along the MOLA ground track for the sameevent as in Figure 1. In this case, the shadow center is 20 kmoff the MOLA track at closest approach, and the shadowintersects the field of view for only 15 s. Variations insurface albedo and illumination geometry are not accountedfor in our model.[23] The residual between observations and model can be
minimized by adjusting the along-track position of Phobos
with respect to the nominal ephemeris. The position in adirection perpendicular to the line of sight to the Sun, and tothe along-track direction, may also be adjusted, whilevariations in the line of sight direction have virtually noeffect.[24] For a given shadow configuration, and MOLA
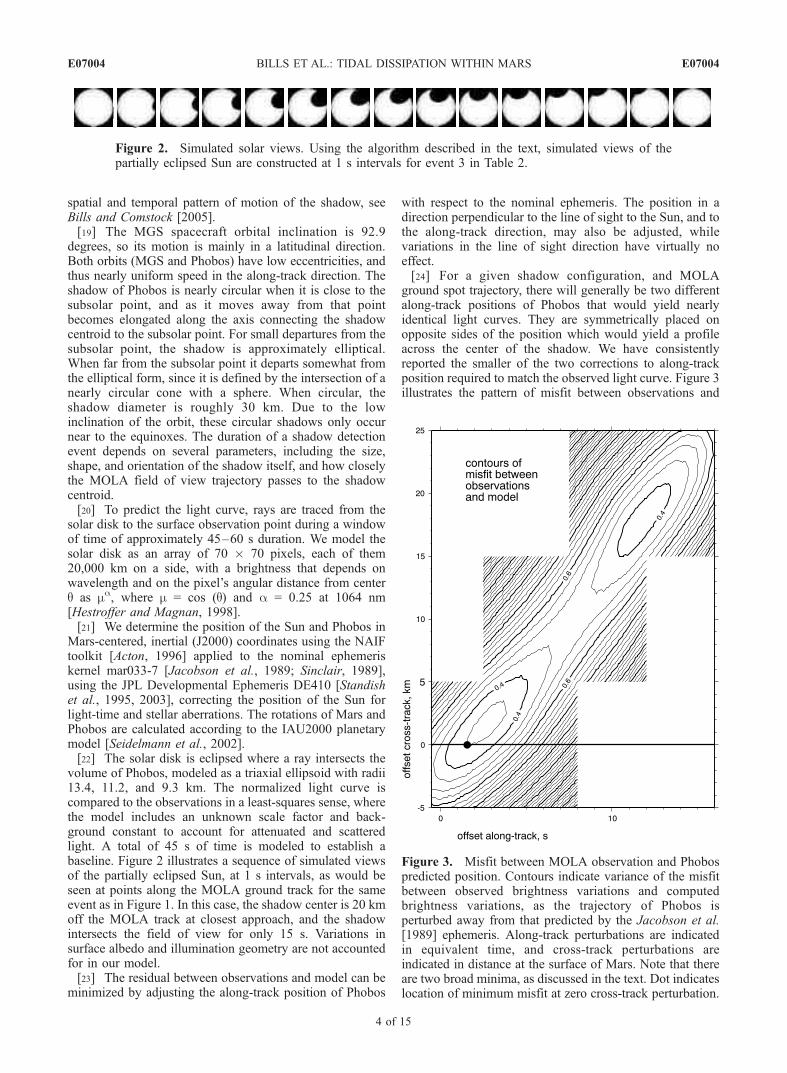
ground spot trajectory, there will generally be two differentalong-track positions of Phobos that would yield nearlyidentical light curves. They are symmetrically placed onopposite sides of the position which would yield a profileacross the center of the shadow. We have consistentlyreported the smaller of the two corrections to along-trackposition required to match the observed light curve. Figure 3illustrates the pattern of misfit between observations and
Figure 2. Simulated solar views. Using the algorithm described in the text, simulated views of thepartially eclipsed Sun are constructed at 1 s intervals for event 3 in Table 2.
Figure 3. Misfit between MOLA observation and Phobospredicted position. Contours indicate variance of the misfitbetween observed brightness variations and computedbrightness variations, as the trajectory of Phobos isperturbed away from that predicted by the Jacobson et al.[1989] ephemeris. Along-track perturbations are indicatedin equivalent time, and cross-track perturbations areindicated in distance at the surface of Mars. Note that thereare two broad minima, as discussed in the text. Dot indicateslocation of minimum misfit at zero cross-track perturbation.
E07004 BILLS ET AL.: TIDAL DISSIPATION WITHIN MARS
4 of 15
E07004
predictions for the same event that was used in the previousfigures.[25] In all but two cases the minimum misfit position lies
within 4 km of the nominal Phobos orbital plane. We do notconsider the minimization in the cross-track direction to besufficiently informative, pending a better understanding ofthe possible atmospheric effects on the shadow. Thereforewe apply only the along-track perturbation in our analysis.Where the surface is reasonably uniform and the light curveis well-modeled, the precision of the estimate approaches0.2 s, whereas in other cases the time and duration of thetransit is less well resolved. Error estimates are thereforebased on the discrepancy between the modeled perturbationwith across-track shift constrained and unconstrained.[26] Table 3 lists the derived position information for
Phobos. We list both the time of each event and thecorresponding position of Phobos. The positions are listedin Cartesian Mars-centered coordinates (X, Y, Z), and interms of a distance and direction from the center of Mars.The direction is given in terms of right ascension anddeclination in the J2000 system. We also list the distanceof the shadow center from the MOLA ground track, at thetime of closest approach.[27] We also searched for Deimos shadow events and did
not find any. Because Deimos is both smaller and fartherfrom the surface of Mars, the shadows would be muchfainter. There were three occasions when the MOLA field ofview passed through the estimated location of a Deimosshadow, but the background albedo variations are too highto allow a secure detection.
2.3. Viking Lander Transits
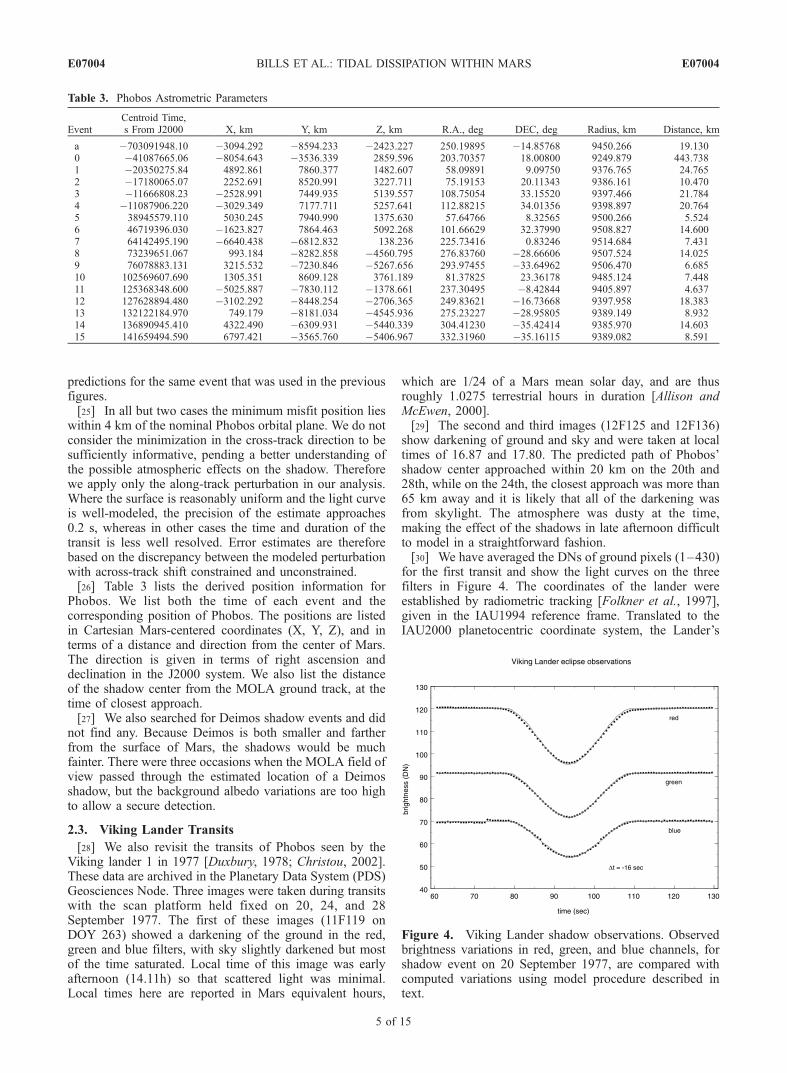
[28] We also revisit the transits of Phobos seen by theViking lander 1 in 1977 [Duxbury, 1978; Christou, 2002].These data are archived in the Planetary Data System (PDS)Geosciences Node. Three images were taken during transitswith the scan platform held fixed on 20, 24, and 28September 1977. The first of these images (11F119 onDOY 263) showed a darkening of the ground in the red,green and blue filters, with sky slightly darkened but mostof the time saturated. Local time of this image was earlyafternoon (14.11h) so that scattered light was minimal.Local times here are reported in Mars equivalent hours,
which are 1/24 of a Mars mean solar day, and are thusroughly 1.0275 terrestrial hours in duration [Allison andMcEwen, 2000].[29] The second and third images (12F125 and 12F136)
show darkening of ground and sky and were taken at localtimes of 16.87 and 17.80. The predicted path of Phobos’shadow center approached within 20 km on the 20th and28th, while on the 24th, the closest approach was more than65 km away and it is likely that all of the darkening wasfrom skylight. The atmosphere was dusty at the time,making the effect of the shadows in late afternoon difficultto model in a straightforward fashion.[30] We have averaged the DNs of ground pixels (1–430)
for the first transit and show the light curves on the threefilters in Figure 4. The coordinates of the lander wereestablished by radiometric tracking [Folkner et al., 1997],given in the IAU1994 reference frame. Translated to theIAU2000 planetocentric coordinate system, the Lander’s
Table 3. Phobos Astrometric Parameters
EventCentroid Time,s From J2000 X, km Y, km Z, km R.A., deg DEC, deg Radius, km Distance, km
a �703091948.10 �3094.292 �8594.233 �2423.227 250.19895 �14.85768 9450.266 19.1300 �41087665.06 �8054.643 �3536.339 2859.596 203.70357 18.00800 9249.879 443.7381 �20350275.84 4892.861 7860.377 1482.607 58.09891 9.09750 9376.765 24.7652 �17180065.07 2252.691 8520.991 3227.711 75.19153 20.11343 9386.161 10.4703 �11666808.23 �2528.991 7449.935 5139.557 108.75054 33.15520 9397.466 21.7844 �11087906.220 �3029.349 7177.711 5257.641 112.88215 34.01356 9398.897 20.7645 38945579.110 5030.245 7940.990 1375.630 57.64766 8.32565 9500.266 5.5246 46719396.030 �1623.827 7864.463 5092.268 101.66629 32.37990 9508.827 14.6007 64142495.190 �6640.438 �6812.832 138.236 225.73416 0.83246 9514.684 7.4318 73239651.067 993.184 �8282.858 �4560.795 276.83760 �28.66606 9507.524 14.0259 76078883.131 3215.532 �7230.846 �5267.656 293.97455 �33.64962 9506.470 6.68510 102569607.690 1305.351 8609.128 3761.189 81.37825 23.36178 9485.124 7.44811 125368348.600 �5025.887 �7830.112 �1378.661 237.30495 �8.42844 9405.897 4.63712 127628894.480 �3102.292 �8448.254 �2706.365 249.83621 �16.73668 9397.958 18.38313 132122184.970 749.179 �8181.034 �4545.936 275.23227 �28.95805 9389.149 8.93214 136890945.410 4322.490 �6309.931 �5440.339 304.41230 �35.42414 9385.970 14.60315 141659494.590 6797.421 �3565.760 �5406.967 332.31960 �35.16115 9389.082 8.591
Figure 4. Viking Lander shadow observations. Observedbrightness variations in red, green, and blue channels, forshadow event on 20 September 1977, are compared withcomputed variations using model procedure described intext.
E07004 BILLS ET AL.: TIDAL DISSIPATION WITHIN MARS
5 of 15
E07004

coordinates are 312.04343deg E, 22.26891deg N, at radius3389.3156 km.[31] The start time of the image recording is given in the
PDS label, but the stop time is approximate. The transit liesmid-image, so that timing depends on the line rate assumed.Christou [2002] inferred the scan time on the basis of thenumber of sample bits 3072 plus a variable number ofengineering bits. This was assumed to be 3414 for each ofthree colors, which was divided by telemetry rate (16000 bps)to give 0.640125 s. The camera was designed to scan inincrements of 0.12deg, with a scan rate of 5.52 scans perdegree [Patterson et al., 1977]. Using these parameters weobtain a scan time of 0.6624 s, slightly longer than that usedby the PDS to calculate end time. Christou [2002], using aspherical shadow approximation, obtained an offset for thistransit of �10 s, while we estimate it at �16 s. Using theimage duration inferred from telemetry rates, we wouldinfer an offset of �13 s. Although the image start time isthought to be accurate to 1 s, an uncertainty of 3 s in transitoffset time must be assumed.[32] We also note that there have been recent observations
of both Phobos and Deimos from the PanCam instrumentson the Mars Exploration Rovers [Bell et al., 2004a, 2004b].We have not included these observations in our currentanalysis for three reasons. First, they overlap in time withthe MOLA observations, and thus provide less informationon purely secular effects than would be the case for earlieror later observations. Second, they have not yet beenreduced to astrometric form. Third, the time at which theobservations were made is difficult to reconstruct at therequired accuracy, since the rover onboard clock was neverintended for such precise applications. However, we doanticipate that these observations will be useful in con-straining future ephemeris studies of both Phobos andDeimos.
3. Fit to Observations
[33] We now describe our analysis of the recent observa-tions, and explain the changes required in the orbital modelto accommodate both the MOLA observations and thepreviously collected ground-based and spacecraft observa-tions. As additional observations accumulate, both fromMOLA and from other orbiting and landed instruments atMars, it will likely become necessary to perform a completenew analysis. This is partly due to the fact that spacecraftobservations have provided significantly improved esti-mates of the gravitation field [Lemoine et al., 2001; Yuanet al., 2001] and rotational parameters [Folkner et al., 1997]of Mars, and thus the gravitational forcing experienced byPhobos is considerably better understood than was the casein 1990.[34] However, as the corrections required to fit the new
observations are very small, and appear to be almost entirelyalong-track perturbations, we can use a very simple linearperturbation analysis and adjust only 3 parameters. If theadjustments in time of along-track position were large,compared to the shortest forcing periods, this simple line-arization would not be sufficient. The orbital model hassecular effects, long period effects, and short period effects,and the forcing periods are mainly at harmonics of the Marsheliocentric orbital period, and the Phobos mean orbital
period. As these periods are incommensurate, the orbitalmotion is quasi-periodic and a shift in time by a significantfraction of the shortest period will alter the structure of thebeat patterns between the input periods. However, the rateof accumulation of along-track position error is equivalentto 0.8 s/yr, or a few parts in 107, and the linear analysis iswarranted.[35] The parameters we adjust are only those which
determine the unperturbed orbital mean longitude. That is,we write
l tð Þ ¼ Lþ n t � tð Þ þ s t � tð Þ2; ð1Þ
where l is the mean longitude, L is the mean longitude atthe reference epoch t, the mean motion is n, and s is a termrelated to secular acceleration. Note that the secularacceleration in longitude, or rate of change of mean motion,is
dn
dt¼ 2s t � tð Þ: ð2Þ
It could thus be argued that 2s would be a better parameterto estimate. However, the form listed above is quitetraditional, in the literature on Phobos and Deimos, andwe retain it here. However, in comparing estimates ofsecular acceleration for other satellites, caution is required,as the parameterization scheme varies.[36] A common means of illustrating the effect of the
secular acceleration, apparently initiated by Sharpless[1945], is to fit a model which includes secular accelerationto the observations, and then suppress the acceleration term.A plot of the mean longitude residuals of the observations,as a function of observation time, should be mainly para-bolic in form. When Sharpless first utilized the display, aparabolic trend was evident, but fairly significant periodicresiduals were also present. As the models and observationshave improved with time, and the time span itself hasincreased, the parabolic trend has become dominant, as isseen in Figure 5a. The longitude residuals from the obser-vations prior to 1990 are taken from Jones et al. [1989]. TheMOLA points are clearly separated in time from the rest andhave errors too small to be seen at this scale. An expandedview is given in Figure 5b.[37] Our initial estimates of the parameters L, n, and s are
from Jacobson et al. [1989]:
L ¼ 138:003� 0:026ð Þ deg;n ¼ 1128:8444070� 0:0000020ð Þ deg=d; ð3Þs ¼ 1:249� 0:018ð Þ � 10�3 deg=yr2:
Our adjusted estimates, obtained from a least-squares fit tothe augmented data set, are
L ¼ 137:790� 0:015ð Þdeg;n ¼ 1128:8444068� 0:0000013ð Þdeg=d; ð4Þs ¼ 1:367� 0:006ð Þ � 10�3 deg=yr2:
In both cases, the stated errors reflect one standarddeviation. We compare our estimate of the secular
E07004 BILLS ET AL.: TIDAL DISSIPATION WITHIN MARS
6 of 15
E07004
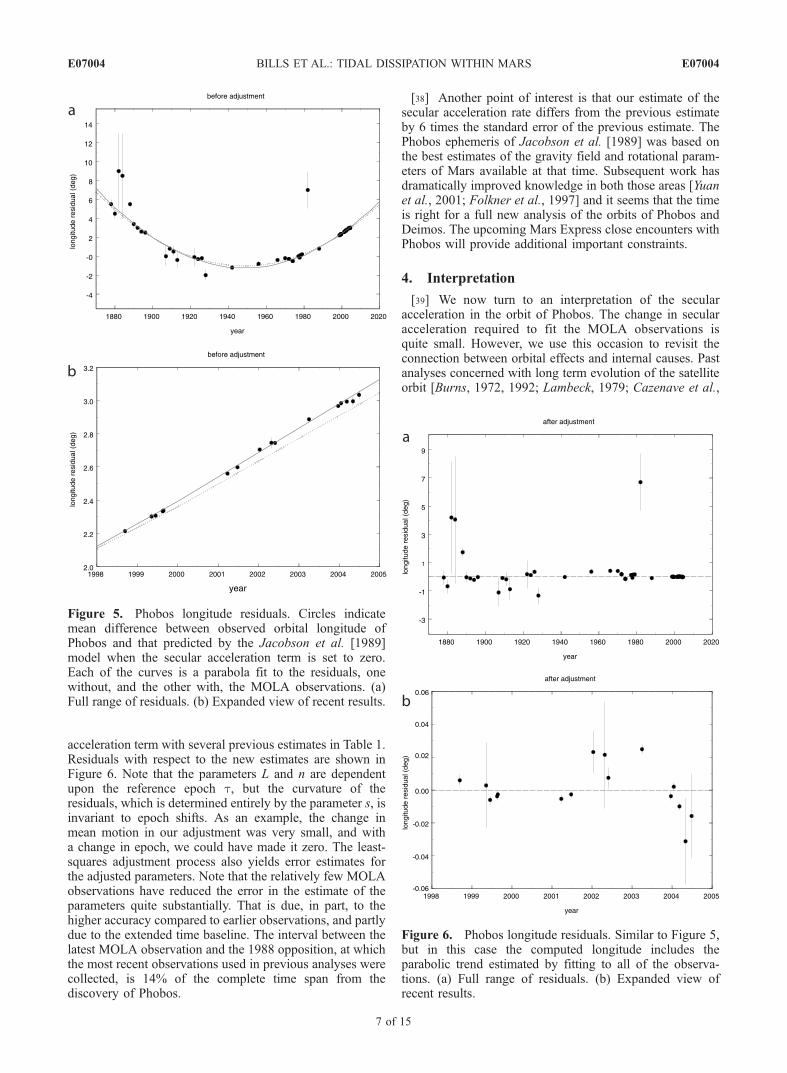
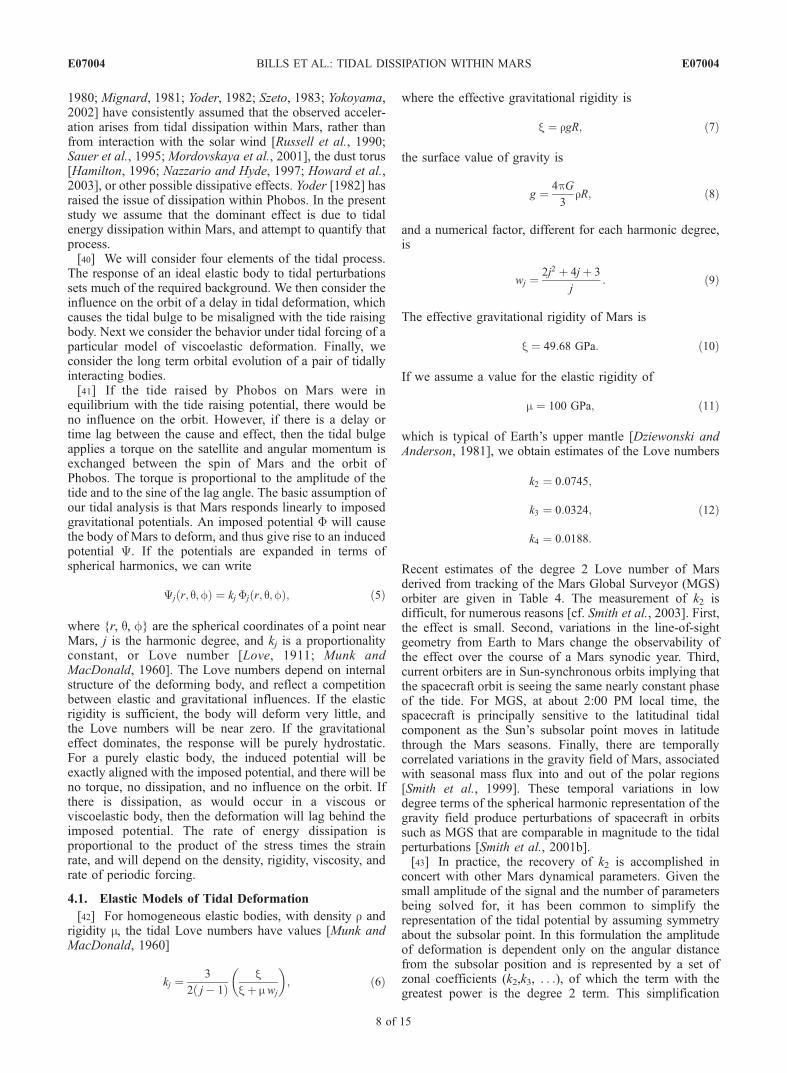
acceleration term with several previous estimates in Table 1.Residuals with respect to the new estimates are shown inFigure 6. Note that the parameters L and n are dependentupon the reference epoch t, but the curvature of theresiduals, which is determined entirely by the parameter s, isinvariant to epoch shifts. As an example, the change inmean motion in our adjustment was very small, and witha change in epoch, we could have made it zero. The least-squares adjustment process also yields error estimates forthe adjusted parameters. Note that the relatively few MOLAobservations have reduced the error in the estimate of theparameters quite substantially. That is due, in part, to thehigher accuracy compared to earlier observations, and partlydue to the extended time baseline. The interval between thelatest MOLA observation and the 1988 opposition, at whichthe most recent observations used in previous analyses werecollected, is 14% of the complete time span from thediscovery of Phobos.
[38] Another point of interest is that our estimate of thesecular acceleration rate differs from the previous estimateby 6 times the standard error of the previous estimate. ThePhobos ephemeris of Jacobson et al. [1989] was based onthe best estimates of the gravity field and rotational param-eters of Mars available at that time. Subsequent work hasdramatically improved knowledge in both those areas [Yuanet al., 2001; Folkner et al., 1997] and it seems that the timeis right for a full new analysis of the orbits of Phobos andDeimos. The upcoming Mars Express close encounters withPhobos will provide additional important constraints.
4. Interpretation
[39] We now turn to an interpretation of the secularacceleration in the orbit of Phobos. The change in secularacceleration required to fit the MOLA observations isquite small. However, we use this occasion to revisit theconnection between orbital effects and internal causes. Pastanalyses concerned with long term evolution of the satelliteorbit [Burns, 1972, 1992; Lambeck, 1979; Cazenave et al.,
Figure 5. Phobos longitude residuals. Circles indicatemean difference between observed orbital longitude ofPhobos and that predicted by the Jacobson et al. [1989]model when the secular acceleration term is set to zero.Each of the curves is a parabola fit to the residuals, onewithout, and the other with, the MOLA observations. (a)Full range of residuals. (b) Expanded view of recent results.
Figure 6. Phobos longitude residuals. Similar to Figure 5,but in this case the computed longitude includes theparabolic trend estimated by fitting to all of the observa-tions. (a) Full range of residuals. (b) Expanded view ofrecent results.
E07004 BILLS ET AL.: TIDAL DISSIPATION WITHIN MARS
7 of 15
E07004
1980; Mignard, 1981; Yoder, 1982; Szeto, 1983; Yokoyama,2002] have consistently assumed that the observed acceler-ation arises from tidal dissipation within Mars, rather thanfrom interaction with the solar wind [Russell et al., 1990;Sauer et al., 1995; Mordovskaya et al., 2001], the dust torus[Hamilton, 1996; Nazzario and Hyde, 1997; Howard et al.,2003], or other possible dissipative effects. Yoder [1982] hasraised the issue of dissipation within Phobos. In the presentstudy we assume that the dominant effect is due to tidalenergy dissipation within Mars, and attempt to quantify thatprocess.[40] We will consider four elements of the tidal process.
The response of an ideal elastic body to tidal perturbationssets much of the required background. We then consider theinfluence on the orbit of a delay in tidal deformation, whichcauses the tidal bulge to be misaligned with the tide raisingbody. Next we consider the behavior under tidal forcing of aparticular model of viscoelastic deformation. Finally, weconsider the long term orbital evolution of a pair of tidallyinteracting bodies.[41] If the tide raised by Phobos on Mars were in
equilibrium with the tide raising potential, there would beno influence on the orbit. However, if there is a delay ortime lag between the cause and effect, then the tidal bulgeapplies a torque on the satellite and angular momentum isexchanged between the spin of Mars and the orbit ofPhobos. The torque is proportional to the amplitude of thetide and to the sine of the lag angle. The basic assumption ofour tidal analysis is that Mars responds linearly to imposedgravitational potentials. An imposed potential F will causethe body of Mars to deform, and thus give rise to an inducedpotential �. If the potentials are expanded in terms ofspherical harmonics, we can write
�j r; q;fð Þ ¼ kj Fj r; q;fð Þ; ð5Þ
where {r, q, f} are the spherical coordinates of a point nearMars, j is the harmonic degree, and kj is a proportionalityconstant, or Love number [Love, 1911; Munk andMacDonald, 1960]. The Love numbers depend on internalstructure of the deforming body, and reflect a competitionbetween elastic and gravitational influences. If the elasticrigidity is sufficient, the body will deform very little, andthe Love numbers will be near zero. If the gravitationaleffect dominates, the response will be purely hydrostatic.For a purely elastic body, the induced potential will beexactly aligned with the imposed potential, and there will beno torque, no dissipation, and no influence on the orbit. Ifthere is dissipation, as would occur in a viscous orviscoelastic body, then the deformation will lag behind theimposed potential. The rate of energy dissipation isproportional to the product of the stress times the strainrate, and will depend on the density, rigidity, viscosity, andrate of periodic forcing.
4.1. Elastic Models of Tidal Deformation
[42] For homogeneous elastic bodies, with density r andrigidity m, the tidal Love numbers have values [Munk andMacDonald, 1960]
kj ¼3
2 j� 1ð Þx
xþ mwj
� �; ð6Þ
where the effective gravitational rigidity is
x ¼ rgR; ð7Þ
the surface value of gravity is
g ¼ 4pG3
rR; ð8Þ
and a numerical factor, different for each harmonic degree,is
wj ¼2j2 þ 4jþ 3
j: ð9Þ
The effective gravitational rigidity of Mars is
x ¼ 49:68 GPa: ð10Þ
If we assume a value for the elastic rigidity of
m ¼ 100 GPa; ð11Þ
which is typical of Earth’s upper mantle [Dziewonski andAnderson, 1981], we obtain estimates of the Love numbers
k2 ¼ 0:0745;
k3 ¼ 0:0324;
k4 ¼ 0:0188:
ð12Þ
Recent estimates of the degree 2 Love number of Marsderived from tracking of the Mars Global Surveyor (MGS)orbiter are given in Table 4. The measurement of k2 isdifficult, for numerous reasons [cf. Smith et al., 2003]. First,the effect is small. Second, variations in the line-of-sightgeometry from Earth to Mars change the observability ofthe effect over the course of a Mars synodic year. Third,current orbiters are in Sun-synchronous orbits implying thatthe spacecraft orbit is seeing the same nearly constant phaseof the tide. For MGS, at about 2:00 PM local time, thespacecraft is principally sensitive to the latitudinal tidalcomponent as the Sun’s subsolar point moves in latitudethrough the Mars seasons. Finally, there are temporallycorrelated variations in the gravity field of Mars, associatedwith seasonal mass flux into and out of the polar regions[Smith et al., 1999]. These temporal variations in lowdegree terms of the spherical harmonic representation of thegravity field produce perturbations of spacecraft in orbitssuch as MGS that are comparable in magnitude to the tidalperturbations [Smith et al., 2001b].[43] In practice, the recovery of k2 is accomplished in
concert with other Mars dynamical parameters. Given thesmall amplitude of the signal and the number of parametersbeing solved for, it has been common to simplify therepresentation of the tidal potential by assuming symmetryabout the subsolar point. In this formulation the amplitudeof deformation is dependent only on the angular distancefrom the subsolar position and is represented by a set ofzonal coefficients (k2,k3, . . .), of which the term with thegreatest power is the degree 2 term. This simplification
E07004 BILLS ET AL.: TIDAL DISSIPATION WITHIN MARS
8 of 15
E07004
implies that asymmetric components of the potential equalthe symmetric component (i.e., k2 = k2,0 = k2,1 = k2,2). Intheir recovery of the tidal potential, Yoder et al. [2003]instead implemented the more general form of the potentialand solved for k2,2, citing the fact that this term produced asecular drift in the orbital inclination of a spacecraft inthe Sun-synchronous configuration. Their recovery wasonly possible because the eccentricity of the MGS orbitcaused the spacecraft local time to drift slightly from Sunsynchronous.[44] Another factor contributing to the quality of Love
number estimates is the solution methodology, i.e., whatparameters are adjusted or modeled in the inversion of thetracking data. Spacecraft orbital geometry is mainly con-strained by tracking from Earth and sensitivity to tidaleffects varies as the orbit plane orientation changes relativeto the Earth-Mars line. Use of data acquired in the mostfavorable observing periods is thus crucial to obtaining awell-constrained estimate.[45] The lowest of the k2 estimates in Table 4 is in good
agreement with the prediction above, from a homogeneousmodel. Subsequent determinations produced larger values,with the best-determined values using only the data whenthe MGS spacecraft was in a desirable viewing geometrywith respect to Earth. These larger values (0.153–0.163)could be matched either by taking an effective elasticrigidity of roughly 50 GPa, or by assuming a weak regionin the interior, such as a fluid core. Elastic Love numbers ofnonhomogeneous bodies can be computed via algorithmsgiven by Alterman et al. [1959], Peltier [1974], andWilhelm[1986].
4.2. Tidal Phase Lag
[46] Redmond and Fish [1964] presented an analysis ofthe secular acceleration, due to tidal dissipation, of a body ina nearly circular orbit. Their analysis considered tides ofharmonic degrees 2 and 3, and equated the change in orbitalangular momentum to the applied gravitational torque. It iseasily generalized to yield
1
n
dn
dt¼ �3na
Xj¼2
kj Fj gð Þ R
a
� �2jþ1
; ð13Þ
with R the planetary radius, a the orbital semimajor axis,and
Fj gð Þ ¼ dPj cosgð Þdg
ð14Þ
a ¼ ms
mp
; ð15Þ
where Pj[x] is a Legendre polynomial of degree j, ms and mp
are the masses of the satellite and primary respectively, and
g is the tidal lag angle, or angular separation betweenimposed and induced potentials associated with harmonicdegree j. If the dissipation is strongly dependent on forcingfrequency, the lag angles at different harmonic degrees willbe somewhat different. The first few angular coefficients inthe series are
F2 gð Þ ¼ � 3
2sin 2g ’ �3g; ð16Þ
F3 gð Þ ¼ � 3
8sin gþ 5 sin 3gð Þ ’ �6g; ð17Þ
F4 gð Þ ¼ � 5
162 sin 2gþ 7 sin 4gð Þ ’ �10g: ð18Þ
[47] A difficulty in estimating the tidal lag angle is thatthe observed orbital motion depends on several otherparameters, whose values are not particularly well known.Smith and Born [1976] used this model, truncated at degreen = 3, in their analysis of tidal dissipation in Mars. Theyfaced the problem that the mass of Phobos was not wellknown at that time. Subsequent estimates have muchimproved the situation, and we adopt the estimates [Yuanet al., 2001] for Phobos, Deimos, and Mars
G ms1 ¼ 7:14� 0:19ð Þ � 10�4 km3s�2; ð19Þ
G ms2 ¼ 1:50� 0:11ð Þ � 10�4 km3s�2; ð20Þ
G mp ¼ 42828:382� 0:001ð Þ km3s�2 ð21Þ
so that the factors of interest here, the ratios of the satelliteand planet masses, are
a1 ¼ 16:67� 0:43ð Þ � 10�9; ð22Þ
a2 ¼ 3:50� 0:25ð Þ � 10�9; ð23Þ
with virtually all of the error coming from the Phobos andDeimos mass estimates.[48] A remaining problem in estimating the tidal phase
lag is that the higher degree Love numbers are completelyunconstrained by direct observations. If we take the uniformdensity, elastic body values listed above as estimates of therelevant Love numbers, and assume that the phase lag is thesame for all harmonic degrees, we can write
1
n
dn
dt¼ a g n 4186þ 478þ 60þ 8ð Þ � 10�6; ð24Þ
where the separate contributions from harmonic degrees 2,3, 4, and 5 are listed. Using this relation, we find that theapparent tidal lag angle is
g ¼ 0:6694� 0:0029ð Þ; ð25Þ
Table 4. Estimates for k2 Love Number
Parameter Value Source Solution
k2 0.055 ± 0.008 Smith et al. [2001b] all data, weightedk2 0.195 ± 0.003 Lemoine et al. [2001] all data, weightedk2 0.201 ± 0.059 this paper all data, weightedk2 0.163 ± 0.056 this paper best datak2,2 0.153 ± 0.017 Yoder et al. [2003] best data
E07004 BILLS ET AL.: TIDAL DISSIPATION WITHIN MARS
9 of 15
E07004

and the corresponding tidal quality factor is
Q ¼ 1= tang ¼ 85:58� 0:37: ð26Þ
It should be noted that the quoted error is a formal estimateonly, and does not take into account the considerableuncertainty in the elastic Love numbers nor the possiblevariation in phase lag with harmonic degree. In fact, in thefollowing section, we will see that the phase lags are likelyto be quite different.
4.3. Viscoelastic Deformation
[49] We now attempt to relate the tidal phase lag tophysical processes within Mars. The simplest example of arheological model in which the tide would lag behind theimposed potential is a Maxwell viscoelastic structure, whichis effectively a series connection of elastic and viscouselements. Maxwell viscoelastic models of the Earth are oftenused in consideration of postglacial rebound [Peltier, 1974;Vermeersen and Sabadini, 1997] and associated rotationalperturbations [Sabadini and Peltier, 1981; Sabadini et al.,1993]. In many discussions of planetary tidal dissipation[Segatz et al., 1988; Peale, 2003], and associated orbitalevolution [Fischer and Spohn, 1990; Hussman and Spohn,2004], Maxwell rheology is also invoked. A limitationof these previous analyses, in the present context, is thatthe tidal potential has been limited to the lowest order(degree j = 2) terms, as is appropriate for more distantplanet-satellite interactions. However, for consideration ofthe Mars-Phobos interaction, we are obligated to includehigher order terms. In order to make our analysis moretransparent and easily extensible, we will briefly reviewsome of the fundamentals.[50] The elastic element of a Maxwell viscoelastic
structure, in which stress is proportional to strain, ischaracterized by a rigidity m. The viscous element, in whichstress is proportional to strain rate, is characterized by aviscosity h. For a series connection of these elements, thestresses within them are equal and the strains are additive. Inresponse to a step-loading event, a Maxwell body willexhibit an initial elastic strain, followed a steady viscousstrain rate. The Maxwell relaxation time
t ¼ hm
ð27Þ
is the time required for the viscous strain to equal the initialelastic strain.[51] In response to a periodic forcing, with frequency w, a
Maxwell body will have stress
s tð Þ ¼ S exp i w tð Þ ð28Þ
and strain
e tð Þ ¼ E exp i w tð Þ: ð29Þ
The stress and strain functions can be related to each othervia an effective modulus, as though they were elastic:
S ¼ m* wð Þ E: ð30Þ
The primary departure from a pure elastic response is thatthe effective rigidity is complex and frequency dependent. Itcan be written as
m* wð Þ ¼ mwtð Þ2þi wt
1þ wtð Þ2
!: ð31Þ
The real part represents the component of response which isin phase with the forcing, and the imaginary part is theresponse in quadrature. At high frequencies (t w � 1) theresponse is mainly elastic and is very nearly in phase withthe forcing. At low frequencies, it is mainly viscous and willlag behind the forcing by amounts approaching 180�.[52] The tidal response of a homogeneous Maxwell body
is obtained via substitution of the effective modulus (31)into the formula for the tidal Love number for an elasticbody (6). Because the tidal response has both buoyant andviscoelastic components, and they are effectively connectedin parallel, the phase behavior is somewhat different thanfor a purely viscoelastic element. The response is nearly inphase with the forcing at both high frequencies, where theresponse is effectively elastic, and at low frequencies, wherethe response is mainly that of a buoyant fluid. Only atintermediate forcing periods is there any appreciable phaselag c, and it is obviously a function of the forcingfrequency. The maximum phase lag for a homogeneousMaxwell body occurs at frequencies w for which
t2w2 ¼ xxþ wj m
ð32Þ
and has a value
cmax ¼ tan�1 wj m
2ffiffiffiffiffiffiffiffiffiffiffiffiffiffiffiffiffiffiffiffiffiffiffix xþ wj m� �q
0B@
1CA ð33Þ
which is independent of viscosity. At forcing frequencieswhich are either higher or lower than this value, the phaselag will be less. This phase lag is very important for thesecular orbital evolution problem. If the tidal bulge raisedon Mars by Phobos were exactly aligned with the currentposition of Phobos, there would be no tidal torque.[53] Note that the variations with forcing frequency in the
real and imaginary parts of the forced response are quitedifferent. The real part is essentially independent offrequency on the high frequency part of the curve, wherethe elastic aspect is dominant, and has a +2 logarithmicslope on the low frequency part of the curve, where viscousflow dominates. The imaginary part of the Love number hassomewhat similar low frequency behavior, but with a +1logarithmic slope, and at high frequencies, rather than beingindependent of frequency, it is has a �1 logarithmic slope.The maximum value of the imaginary part of the Lovenumber occurs at the frequencies for which
t2w2 ¼ xxþ wj m
� �2
; ð34Þ
E07004 BILLS ET AL.: TIDAL DISSIPATION WITHIN MARS
10 of 15
E07004
which is similar to, but somewhat different than, thecriterion for maximum phase lag, as discussed immediatelyabove.[54] The absolute value of the tidal Love number is the
quantity reported in Table 4. For a homogeneous Maxwellbody, it can be written as
kj�� �� ¼ 3
2 j� 1ð Þ
ffiffiffiffiffiffiffiffiffiffiffiffiffiffiffiffiffiffiffiffiffiffiffiffiffiffiffiffiffiffiffiffiffiffiffiffiffiffiffiffiffiffix2 1þ t2w2ð Þ
x2 þ xþ mwj
� �2t2w2
vuut : ð35Þ
[55] In a layered viscoelastic body, the response will bemore complicated, but can still be described by a summa-tion over the individual responses of the normal modes ofthe body [Wu and Peltier, 1982; Vermeersen et al., 1996].Each of the modal responses is identical in form to that for ahomogeneous body; all that changes is the amplitude andrelaxation time. That is, each mode contributes a realresponse which has the same structure as the homogeneousbody’s real response, but with a different amplitude andpeak forcing frequency. The same is true for the imaginarypart of the tidal response. As a result, the maximum possiblerate of change in tidal response, as a function of forcingfrequency, is the same as for the homogeneous body. Twofrequencies which differ by a factor of 2 will have lagangles which differ by, at most, a factor of two. Whether thelarger lag angle is at the higher or lower frequency willdepend on proximity to modal peaks.[56] We know very little, at present, about the viscosity
structure within Mars. However, the smaller size of Mars,compared to Earth, and larger surface to volume ratiosuggests that the interior of Mars is likely to be coolerand thus more viscous than the Earth, all else being equal.Thermal evolution models of support this notion [Spohn etal., 1998, 2001; Nimmo and Stevenson, 2000]. If we take1021 Pa s as a representative viscosity, which is typical ofthe estimates obtained for global average upper mantleviscosity of Earth [Peltier, 1974; Mitrovica, 1996], and alsoassume a rigidity of 1011 Pa, as mentioned above, theMaxwell time will be 1010 s, or roughly 320 years. In thatcase, the orbital periods of Phobos and Mars are both verymuch in the high frequency, elastic response domain. Wewould thus expect the Love number estimates obtained fromsolar tidal perturbations on artificial satellite orbits to bequite independent of the forcing frequency. If the effectiveviscosity of Mars were as low at 1018 Pa s, which ischaracteristic of terrestrial regions with high heat flow, suchas the mid-Atlantic ridge at Iceland [Sjoberg et al., 2000], orin continental settings of active tectonic deformation [Billset al., 1994; Dixon et al., 2004], the Maxwell time would beonly 0.3 year, so that some viscous relaxation could occurduring the Mars orbital period. However, as noted above,thermal arguments would seem to suggest that the viscositywithin Mars should be much higher than that.
[57] Another important influence on the rheology ofterrestrial mantle rock is the water content. Recent workhas shown that addition of only a few parts per million ofwater to initially dry olivine, in temperature and pressureenvironments similar to those in the terrestrial upper mantle,can reduce the viscosity by a factor of 30 [Hirth andKohlstedt, 1996; Dixon et al., 2004]. It seems clear thatusing terrestrial analogs to predict the viscosity of themantle of Mars is still rather problematic.[58] The spatio-temporal pattern associated with visco-
elastic tidal deformation combines several effects. For anelastic tide, the deformation is symmetric about the lineconnecting the center of the deforming body and the tide-raising body. The spatial pattern of deformation is a weightedsum of Legendre polynomials in angular distance fromthat line, as seen from the center of the deforming body.Viscoelastic deformation differs from the elastic pattern intwo important regards. The amplitudes of deformation ateach harmonic degree will differ from the elastic values,and the axis of symmetry for each harmonic degree willcorrespond to a past (rather than current) location of the tideraising body. The time lags will generally be different fordifferent harmonic degrees.[59] Each harmonic constituent of the tidal potential has a
spatial pattern proportional to Pj[cos(g)] where g is theangular separation from the symmetry axis of that constit-uent. Assuming an equatorial orbit for the satellite, we canwrite this separation angle as a function of the longitude ofthe tide-raising body fs and the latitude q and longitude f ofthe surface point as
cosg ¼ cos q cos Dfð Þ; ð36Þ
where the longitude difference is abbreviated
Df ¼ fs � f: ð37Þ
If the angular rates are s for rotation of the deforming body,and n for orbital motion of the tide raising body, then therate of change of the longitude difference is
d Dfdt
¼ n� s ¼ q: ð38Þ
The three bodies for which tidal motions are of interest atMars are the Sun, Phobos, and Deimos. As the siderealrotation rate of Mars is
s ¼ 350:892=d; ð39Þ
the corresponding tidal rates and fundamental periods aregiven in Table 5.[60] We now reformulate the tidal evolution model of
Redmond and Fish [1964] incorporating the behavior of ahomogeneous Maxwell rheology. It should be noted that weare not suggesting that Mars is actually homogeneous.Rather, we are attempting to test the hypothesis that wecan find a simple mechanical model which approximates thebehavior which is observed. It is convenient to rewrite theLegendre polynomials in the tidal potential function interms of the explicit locations of the tide raising body and
Table 5. Tidal Forcing Periods
BodySidereal Rate,
deg/dSynodic Rate,
deg/dSynodic Period,
hours
Sun 0.524 �350.368 24.660Phobos 1128.844 777.952 11.106Deimos 285.162 �65.730 131.447
E07004 BILLS ET AL.: TIDAL DISSIPATION WITHIN MARS
11 of 15
E07004
the point at which the potential is evaluated, and thenevaluate them on the equator. This yields
P2 cos g½ ¼ c2;0 þ c2;2 cos 2Df
¼ 1þ 3 cos 2Dfð Þ=4; ð40Þ
P3 cos g½ ¼ c3;1 cosDfþ c3;3 cos 3Df¼ 3 cosDfþ 5 cos 3Dfð Þ=8; ð41Þ
P4 cos g½ ¼ c4;0 þ c4;2 cos 2Dfþ c4;4 cos 4Df¼ 9þ 20 cos 2Dfþ 35 cos 4Dfð Þ=64: ð42Þ
Thus each harmonic degree will yield several forcingfrequencies, each of them an integer multiple of thefundamental synodic frequency for that body.[61] The induced tidal potential at longitude f, when the
tide raising body is at longitude fs, is
� fs;fð Þ ¼ ms
Xj
R
a
� �2jþ1Xjh¼0
kj h qð Þ�� ��
� cj;h cos h f� fs � c h qð Þð Þð ; ð43Þ
where c is the phase lag between imposed and inducedpotential. The tidal torque is the product of a tidal force anda corresponding lever arm. The acceleration is obtained asthe derivative of the induced potential with respect toposition of the tide raising body, evaluated at the location ofthe satellite itself. Equating the rate of change of orbitalangular momentum to the applied tidal torque, we nowobtain the viscoelastic version of the tidal evolutionequation
1
n
dn
dt¼ �3n
ms
mp
Xj
R
a
� �2jþ1Xjh¼0
kj h qð Þ�� �� cj;h h sin h c h qð Þð Þ:
ð44Þ
This is equivalent to equation (13), but with more explicitforms for the Love number and phase lag. We note that, at agiven forcing frequency, there is generally only littlevariation in phase lag with changing harmonic degree.However, the spectral decomposition of the Legendrepolynomials (in equations (40), (41), and (42)) clearlyindicates that there are widely differing forcing frequenciesassociated with the different harmonics. Thus the assump-tion of a common phase lag for all the tidal constituents, aswas done in the preceding section, is seen to be a ratherpoor approximation.[62] If we use a homogeneous Maxwell model, there
are only two unknown parameters: the effective rigidity mand the effective viscosity h. We have 3 observationalconstraints on the frequency dependent viscoelastic Lovenumber of Mars. The first constraint comes from the valuesdiscussed above for the degree two Love number, which areestimates of the absolute value of that parameter at thesemidiurnal solar synodic period. The functional form of theconstraint is given in equation (35). The second and thirdconstraints come from the estimates of the secular acceler-
ation rates of Phobos and Deimos, which yield weightedsums of the complex Love numbers at multiples of theirrespective synodic periods. The functional forms of thoseconstraints are given in equation (44), immediately above.Ideally, we should be able to estimate the Mars mechanicalparameters from any two of the three observations, or obtaina weighted least-squares estimate from all three constraints.What we find is that the least-squares solution
m ¼ 4:6� 2:0ð Þ � 1010 Pa
h ¼ 8:7� 0:6ð Þ � 1014 Pa s
is virtually identical to the two-parameter solution obtainedusing the solar-forced Love number and Phobos secularacceleration alone.[63] In contrast to the situation for Phobos, neither of
the two constraint pairs involving Deimos yields a validsolution. The value predicted for the Deimos secular accel-eration rate, using the estimated Mars interior parameters is�3.1 � 10�7deg/yr2, which is roughly 10% of the estimatesby Jones et al. [1989] and Sinclair [1989], but only about2% of the estimate of Jacobson et al. [1989]. It thus appearsthat the existing estimates of secular acceleration forDeimos are still too large. Of course, it could be that ourmodel is too simple, and a homogeneous Maxwell modeldoes not properly capture the tidal dissipation behavior ofMars.[64] We note, for comparison, that using Earth values of
k2 = 0.302 and a phase lag of 0.20� for the lunar semidiurnaltide [Ray et al., 2001], the effective rigidity and viscosityvalues for a homogeneous Maxwell model are
m ¼ 1:44� 1011 Pa
h ¼ 2:21� 1017 Pa s:
This rigidity estimate is fairly typical of the terrestrial uppermantle, but the viscosity is quite low compared to publishedestimates of terrestrial mantle values [Peltier, 1974;Mitrovica, 1996]. In the case of Earth, it is clear that thepresence of a substantial fluid core yields a global effectiveviscosity substantially lower than the mean mantle viscosity.The source of enhanced dissipation within Mars is notobvious.[65] Yoder et al. [2003] argued, from the relatively large
size of the degree two Love number, that Mars has asubstantial fluid core. While not disputing that as a possibleinterpretation, we note that our homogeneous Maxwellmodel equally well satisfies the observed value of the solarforced tidal response of Mars. The fact that the effectiveviscosity of Mars estimated this way is 250 times less thanthe estimate derived for Earth suggests that presence of afluid core is not the entire explanation. As noted above,thermal considerations suggest that, all else being equal,mantle viscosity within Mars should be substantially largerthan for Earth. A somewhat more volatile rich mantle forMars would bring the two values closer together, but still
E07004 BILLS ET AL.: TIDAL DISSIPATION WITHIN MARS
12 of 15
E07004
fails to explain why Mars should be less viscous than Earth.One attractive mechanism for producing large amounts ofdissipation is tidally forced flow of a fluid within a poroussolid [Nield et al., 2004]. In the present context that couldinvolve water in near-surface rock layers [Clifford, 1993;Clifford and Parker, 2001], or partial melt within the mantle[Kiefer, 2003; Wenzel et al., 2004].
4.4. Orbital Evolution
[66] We now consider the longer term implications of thetidal evolution of the orbit of Phobos. Kepler’s third law ofplanetary motion relates the size of an orbit to the orbitalperiod, and can be written as
a3n2 ¼ M2 ¼ G mp þ ms
� �; ð45Þ
where a is the orbital semimajor axis, G is the gravitationalconstant, and (mp, ms) are the masses of the orbiting bodies.Upon differentiation, this yields a relationship between theobserved secular increase in mean motion and a correspond-ing secular decrease in semimajor axis. The implied rate is
da
dt¼ � 2 a
3 n
dn
dt¼ � 4 a s
3 n¼ �4:03� 0:03ð Þcm=yr: ð46Þ
Note that we have followed the usual convention ofestimating the coefficient s of the quadratic term in meanlongitude, rather than the linear term in the rate of meanmotion change, so that
dn
dt¼ 2 s: ð47Þ
The orbit of Phobos is shrinking at rate similar to that atwhich the lunar orbit is growing. A linear extrapolation ofthis rate would suggest a remaining lifetime for Phobos of�150 million years, at which point it would impact onto thesurface of Mars. However, as will be discussed below, theorbital evolution is quite nonlinear, and the expected demiseof Phobos will be rather sooner than the linear estimatewould suggest.[67] The total energy (kinetic plus potential) in a binary
orbit is
E ¼ �G mp ms
2a; ð48Þ
where G is the gravitational constant, and (mp, ms) are themasses of the orbiting bodies. The rate of orbital energy lossfor Phobos is
dE
dt¼ �E
a
da
dt¼ � 3:35� 0:01ð Þ � 106 W: ð49Þ
[68] It is instructive to write the tidal evolution formula ofRedmond and Fish [1964] entirely in terms of the semi-major axis, rather than the mean motion. The result is
1
a
da
dt¼ 2b a�3=2
Xj¼2
kj Fj gð Þ R
a
� �2jþ1
; ð50Þ
where we have combined the mass dependent terms in thesingle parameter
b ¼ aM ¼ ms
mp
ffiffiffiffiffiffiffiffiffiffiffiffiffiffiffiffiffiffiffiffiffiffiffiffiG mp þ ms
� �q¼ 0:10907� 0:00028ð Þ m3=2 s�1: ð51Þ
If the orbital evolution were dominated by the degree 2 tide,we could write
da
dt¼ �f2 a�11=2; ð52Þ
with
f2 ¼ 4b g k2 R5: ð53Þ
The solution to this differential equation, assuming f2 to beconstant, is
a t½ ¼ a 0½ � 13
2f2 t
� �2=13
: ð54Þ
This solution was used by Burns [1978] to estimate aremaining lifetime for Phobos of 30–50 million years. Wenote, however, that this is best viewed as an upper bound,since the effect of higher degree harmonic tides increasesrapidly as Phobos gets closer to Mars. Our estimates of thetidal Love numbers suggest that 10% of the present secularacceleration is due to harmonic degree 3, and that ratioincreases with a�2. During the late stages of orbitalevolution, the rate of orbital decay will be appreciablyhigher than would be estimated from the degree twocontribution alone. A more accurate assessment of the finalstages of the orbital evolution of Phobos would take intoaccount the dependence of the phase lags on the forcingperiod, as was discussed above in connection with aviscoelastic response model.[69] Of course, the latest stages of orbital evolution will
presumably involve a tidally disrupted cloud of smallparticles. Phobos is already inside the classical Roche limit,at which a fluid would be pulled apart. The role offinite strength complicates the analysis considerably, andit is difficult to predict when Phobos will disintegrate[Dobrovolskis, 1982, 1990; Bottke et al., 1997; Davidsson,1999; Holsapple, 2001]. The story beyond that point wouldinvolve formation and evolution of an ephemeral ringsystem [Bills, 1992; Colwell, 1994].
5. Summary
[70] We report on new observations of the orbital positionof Phobos, which require an adjustment to previousestimates of secular acceleration in longitude. Our newestimate for that parameter is slightly higher, and muchbetter constrained, than the several estimates which werepublished circa 1990. The significant improvement in theaccuracy of determination arises from a combination ofaccurate measurements and extended time span of observa-tions. The rate of secular acceleration in longitude directlydetermines the rate at which orbital energy is being dissi-
E07004 BILLS ET AL.: TIDAL DISSIPATION WITHIN MARS
13 of 15
E07004
pated. Our analyses of the tidal lag angle, and attempts toconstrain internal dissipation mechanisms within Mars, aremore limited, since they require knowledge of other param-eters, some of which are still rather uncertain. Continuedobservations of Phobos and Deimos will eventually allowimproved estimates of the tidal response of Mars, which willyield constraints on the mechanical properties of the deepinterior.
ReferencesAbshire, J. B., X. Sun, and R. S. Afzal (2000), Mars Orbiter LaserAltimeter: Receiver model and performance analysis, Appl. Opt., 39,2440–2460.
Acton, C. H. (1996), Ancillary data services of NASA’s navigation andancillary information facility, Planet Space Sci., 44, 65–70.
Aksnes, K., and F. A. Franklin (2001), Secular acceleration of Io frommutual satellite events, Astron. J., 122, 2734–2739.
Allison, M., and M. McEwen (2000), A post-Pathfinder evaluation of areo-centric solar coordinates with improved timing recipes for Mars seasonal/diurnal climate studies, Planet. Space Sci., 48, 215–235.
Alterman, Z., H. Jarosch, and C. L. Pekeris (1959), Oscillations of theEarth, Proc. R. Soc. London, Ser. A, 252, 80–95.
Avensov, G. A., et al. (1989), Television observations of Phobos, Nature,341, 585–587.
Banerdt, W. B., and G. A. Neumann (1999), The topography and ephemerisof Phobos from MOLA ranging, Lunar Planet. Sci., XXX, abstract 2021.
Bell, J. F., et al. (2004a), Pancam multispectral imaging results from theSpirit Rover at Gusev crater, Science, 305, 800–806.
Bell, J. F., et al. (2004b), Pancam multispectral imaging results from theOpportunity Rover at Meridiani Planum, Science, 306, 1703–1709.
Bills, B. G. (1992), Venus satellite orbital decay, ephemeral ring formation,and subsequent crater production, Geophys. Res. Lett., 19, 1025–1028.
Bills, B. G., and R. L. Comstock (2005), Spatial and temporal patterns ofsolar eclipses by Phobos on Mars, J. Geophys. Res., 110, E04004,doi:10.1029/2003JE002209.
Bills, B. G., D. R. Currey, and G. A. Marshall (1994), Viscosity estimatesfor the crust and upper mantle from patterns of lacustrine shorelinedeformation in the eastern Great Basin, J. Geophys. Res., 99, 22,059–22,086.
Bottke, W. F., D. C. Richardson, and S. G. Love (1997), Can tidal disrup-tion of asteroids make crater chains on the Earth and Moon?, Icarus, 126,470–474.
Burns, J. A. (1972), The dynamical characteristics of Phobos and Deimos,Rev. Geophys., 10, 462–483.
Burns, J. A. (1978), The dynamical evolution and origin of the Martianmoons, Vistas Astron., 22, 193–210.
Burns, J. A. (1992), Contradictory clues as to the origin of the Martianmoons, in Mars, pp. 1283–1302, Univ. of Ariz. Press, Tucson.
Cazenave, A., A. Dobrovolskis, and B. Lago (1980), Orbital history of theMartian satellites with inferences on their origin, Icarus, 44, 730–744.
Christou, A. A. (2002), Lander position determination on Mars usingPhobos transits: Application to Beagle 2, Planet Space Sci., 50, 781–788.
Clifford, S. M. (1993), A model for the hydrologic and climatic behavior ofwater on Mars, J. Geophys. Res., 98, 10,973–11,016.
Clifford, S. M., and T. J. Parker (2001), The evolution of the Martianhydrosphere: Implications for the fate of a primordial ocean and thecurrent state of the northern plains, Icarus, 154, 40–79.
Colwell, J. E. (1994), The disruption of planetary satellites and the creationof planetary rings, Planet. Space Sci., 42, 1139–1149.
Darwin, G. H. (1911), The Tides and Kindred Phenomena in the SolarSystem, 437 pp., John Murray, London.
Davidsson, B. J. R. (1999), Tidal splitting and rotational breakup of solidspheres, Icarus, 142, 525–535.
Dickey, J. O., et al. (1994), Lunar laser ranging: A continuing legacy of theApollo program, Science, 265, 482–490.
Dixon, J. E., T. H. Dixon, D. R. Bell, and R. Malservisi (2004), Lateralvariation in upper mantle viscosity: Role of water, Earth Planet. Sci.Lett., 222, 451–467.
Dobrovolskis, A. R. (1982), Internal stresses in Phobos and other triaxialbodies, Icarus, 52, 136–148.
Dobrovolskis, A. R. (1990), Tidal disruption of solid bodies, Icarus, 88,24–38.
Duxbury, T. C. (1978), Spacecraft imaging of Phobos and Deimos, VistasAstron., 22, 149–161.
Dziewonski, A. M., and D. L. Anderson (1981), Preliminary referenceEarth model, Phys. Earth Planet. Inter., 25, 297–356.
Egbert, G. D., and R. D. Ray (2003), Semi-diurnal and diurnal tidaldissipation from TOPEX/Poseidon altimetry, Geophys. Res. Lett.,30(17), 1907, doi:10.1029/2003GL017676.
Fischer, H. J., and T. Spohn (1990), Thermal orbital histories of viscoelasticmodels of Io, Icarus, 83, 39–65.
Folkner, W. M., C. F. Yoder, D. N. Yuan, E. M. Standish, and R. A. Preston(1997), Interior structure and seasonal mass redistribution of Mars fromradio tracking of Mars Pathfinder, Science, 278, 1749–1752.
Goldreich, P., and P. D. Nicholson (1977), Turbulent viscosity and Jupiter’stidal Q, Icarus, 30, 301–304.
Hall, A. (1878), Observations and orbits of the satellites of Mars with datafor ephemerides in 1879, U.S. Govt. Print. Off., Washington, D. C.
Hamilton, D. P. (1996), The asymmetric time-variable rings of Mars,Icarus, 119, 153–172.
Hestroffer, D., and C. Magnan (1998), Wavelength depencency of the solarlimb darkening, Astron. Astrophys., 333, 338–342.
Hirth, G., and D. L. Kohlstedt (1996), Water in the oceanic upper mantle:Implications for rheology, melt extraction and the evolution of the litho-sphere, Earth Planet. Sci. Lett., 144, 93–108.
Holsapple, K. A. (2001), Equilibrium configurations of solid cohesionlessbodies, Icarus, 154, 432–448.
Howard, J. E., A. V. Krivov, and F. Spahn (2003), Transverse halo orbitsabout Mars?, Geophys. Res. Lett., 30(13), 1680, doi:10.1029/2003GL017677.
Hussman, H., and T. Spohn (2004), Thermal-orbital evolution of Io andEuropa, Icarus, 171, 391–410.
Ioannou, P. J., and R. S. Lindzen (1993), Gravitational tides in the outerplanets, Astrophys. J., 406, 266–278.
Jacobson, R. A., S. P. Synnott, and J. K. Campbell (1989), The orbits of thesatellites of Mars from spacecraft and Earthbased observations, Astron.Astrophys., 225, 548–554.
Jones, D. H. P., A. T. Sinclair, and I. P. Williams (1989), Secular accelera-tion of Phobos confirmed from positions obtained on La Palma, Mon.Not. R. Astron. Soc., 237, 15–19.
Kiefer, W. S. (2003), Melting in the martian mantle: Shergottite formationand implications for present-day mantle convection on Mars, Meteorit.Planet. Sci., 38, 1815–1832.
Lambeck, K. (1979), On the orbital evolution of the Martian satellites,J. Geophys. Res., 84, 5651–5658.
Lemoine, F. G., D. E. Smith, D. D. Rowlands, M. T. Zuber, G. A.Neumann, D. S. Chinn, and D. E. Pavlis (2001), An improved solutionof the gravity field of Mars (GMM-2B) from Mars Global Surveyor,J. Geophys. Res., 106, 23,359–23,376.
Lieske, J. H. (1987), Galilean satellite evolution: Observational evidencefor secular changes in mean motions, Astron. Astrophys., 176, 146–158.
Lopes-Gautier, R., et al. (1999), Active volcanism on Io: Global distributionand variations in activity, Icarus, 140, 243–264.
Love, A. E. H. (1911), Some Problems of Geodynamics, Cambridge Univ.Press, New York.
Mignard, F. (1981), Evolution of the Martian satellites, Mon. Not. R. As-tron. Soc., 194, 365–379.
Mitrovica, J. X. (1996), Haskell [1935] revisited, J. Geophys. Res., 101,555–569.
Mordovskaya, V. G., N. N. Oraevksy, and J. Rustenbach (2001), Interactionof Phobos with the solar wind plasma, Cosmic. Res., 39, 446–452.
Morley, T. A. (1989), A catalogue of ground-based astrometric observationsof the Martian satellites, 1877–1982, Astron. Astrophys. Suppl. Ser., 77,209–226.
Munk, W., and G. J. F. MacDonald (1960), The Rotation of the Earth: AGeophysical Discussion, Cambridge Univ. Press, New York.
Nazzario, R. C., and T. W. Hyde (1997), The dust bands of the planet Mars,Adv. Space Res., 20, 1535–1538.
Neumann, G. A., D. D. Rowlands, F. G. Lemoine, D. E. Smith, and M. T.Zuber (2001), Crossover analysis of Mars Orbiter Laser Altimeter data,J. Geophys. Res., 106, 23,753–23,768.
Nield, D. A., A. V. Kuznetsov, and M. Ziong (2004), Effects of viscousdissipation and flow work on forced convection in a channel filled by asaturated porous medium, Transp. Porous Media, 56, 351–367.
Nimmo, F., and D. J. Stevenson (2000), Influence of early plate tectonics onthe thermal evolution and magnetic field of Mars, J. Geophys. Res., 105,11,969–11,979.
Patterson, W. R., F. O. Huck, S. D. Wall, and M. R. Wolf (1977), Calibra-tion and performance of the Viking lander cameras, J. Geophys. Res., 82,4389–4400.
Peale, S. J. (2003), Tidally induced volcanism, Celest. Mech. Dyn. Aston.,87, 129–155.
Peale, S. J., and M. H. Lee (2002), A primordial origin of the Laplacerelation among the Galilean satellites, Science, 298, 593–597.
Peale, S. J., P. Cassen, and R. T. Reynolds (1979), Melting of Io by tidaldissipation, Science, 203, 892–894.
E07004 BILLS ET AL.: TIDAL DISSIPATION WITHIN MARS
14 of 15
E07004
Peltier, W. R. (1974), Impulse response of a Maxwell Earth, Rev. Geophys.,12, 649–669.
Ray, R. D., R. J. Eanes, and F. G. Lemoine (2001), Constraints on energydissipation in the Earth’s body tide from satellite tracking and altimetry,Geophys. J. Int., 144, 471–480.
Redmond, J. C., and F. F. Fish (1964), The luni-tidal interval in Mars andthe secular accleration of Phobos, Icarus, 3, 87–91.
Russell, C. T., J. G. Luhmann, K. Schwingenschuh, W. Riedler, andY. Yeroshenko (1990), Upstream waves at Mars, Geophys. Res. Lett.,17, 897–900.
Sabadini, R., and W. R. Peltier (1981), Pleistocene deglaciation and theEarth’s rotation: Implications for mantle viscosity, Geophys. J. R. Astron.Soc., 66, 553–578.
Sabadini, R., G. Spada, and Y. Ricard (1993), Time dependent densityanomalies in a stratified, viscoelastic mantle: Implications for the geoid,Earth’s rotation, and sea-level fluctuations, Surv. Geophys., 14, 537–553.
Sagdeev, R. Z., and A. V. Zakharov (1989), Brief history of the Phobosmission, Nature, 341, 581–585.
Sauer, K., E. Dubinin, K. Baumgartel, and A. Bogdanov (1995), Deimos—An obstacle to the solar wind, Science, 269, 1075–1078.
Segatz, M., T. Spohn, M. N. Ross, and G. Schubert (1988), Tidal dissipa-tion, surface heat flow, and figure of viscoelastic models of Io, Icarus, 75,187–206.
Seidelmann, P. K., et al. (2002), Report of the IAU/IAG Working Groupon cartographic coordinates and rotational elements of the planets andsatellites, Celest. Mech. Dyn. Astron., 82, 83–110.
Sharpless, B. P. (1945), Secular accelerations in the longitudes of thesatellites of Mars, Astron. J., 51, 185–186.
Sinclair, A. T. (1972), The motions of the satellites of Mars, Mon. Not. R.Astron. Soc., 155, 249–274.
Sinclair, A. T. (1989), The orbits of the satellites of Mars determined fromEarth-based and spacecraft observations, Astron. Astrophys., 220, 321–328.
Sjoberg, L. E., M. Pan, E. Asenjo, and S. Erlingsson (2000), Glacialrebound near Vatnajokull, Iceland, studied by GPS campaigns in 1992and 1996, J. Geodyn., 29, 63–70.
Smith, D. E., M. T. Zuber, R. M. Haberle, D. D. Rowlands, and J. R.Murphy (1999), The Mars seasonal CO2 cycle and the time variationof the gravity field: A general circulation model simulation, J. Geophys.Res., 104, 1885–1896.
Smith, D. E., et al. (2001a), Mars Orbiter Laser Altimeter: Experimentsummary after the first year of global mapping of Mars, J. Geophys.Res., 106, 23,689–23,722.
Smith, D. E., M. T. Zuber, and G. A. Neumann (2001b), Seasonal variationof snow depth on Mars, Science, 294, 2141–2146.
Smith, D. E., M. T. Zuber, M. H. Torrence, and P. J. Sunn (2003), Estimat-ing the k2 tidal gravity Love number of Mars, Eos Trans. AGU, 84(46),Fall Meet. Suppl., Abstract P31A-05.
Smith, J. C., and G. H. Born (1976), Secular acceleration of Phobos and Qof Mars, Icarus, 27, 51–53.
Spohn, T., F. Sohl, and D. Breuer (1998), Mars, Astron. Astrophys. Rev., 8,181–235.
Spohn, T., M. H. Acuna, D. Breuer, M. Golombek, R. Greeley, A. Halliday,E. Hauber, R. Jaumann, and F. Sohl (2001), Geophysical constraints onthe evolution of Mars, Space Sci. Rev., 96, 231–262.
Standish, E. M., X. X. Newhall, J. G. Williams, and W. M. Folkner (1995),JPL Planetary and Lunar Ephemerides, DE403/LE403, JPL Rep. IOM314.10-127, Jet Propul. Lab., Pasadena, Calif.
Standish, E. M., X. X. Newhall, J. G. Williams, and W. M. Folkner (2003),JPL Planetary and Lunar Ephemerides, DE410, JPL Rep. IOM 312.N.03-007, Jet Propul. Lab., Pasadena, Calif.
Stephenson, F. R., and L. V. Morrison (1995), Long-term fluctuations in theEarth’s rotation: 700 BC to AD 1990, Philos. Trans. R. Soc. London, Ser.A, 351, 165–202.
Szeto, A. (1983), Orbital evolution and origin of the Martian satellites,Icarus, 55, 133–168.
Vermeersen, L. L. A., and R. Sabadini (1997), A new class of stratifiedviscoelastic models by analytical techniques, Geophys. J. Int., 129,531–570.
Vermeersen, L. L. A., R. Sabadini, and G. Spada (1996), Compressiblerotational deformation, Geophys. J. Int., 126, 735–761.
Wenzel, M. J., M. Manga, and A. M. Jellinek (2004), Tharsis as a conse-quence of Mars’ dichotomy and layered mantle, Geophys. Res. Lett., 31,L04702, doi:10.1029/2003GL019306.
Widmer, R., G. Masters, and F. Gilbert (1991), Spherically symmetricattenuation within the Earth from normal mode data, Geophys. J. Int.,104, 541–553.
Wilhelm, H. (1986), Spheroidal and toroidal stress coefficients, J. Geo-phys., 59, 16–22.
Wilson, R. E. (1994), Binary-star light-curve models, Publ. Astron. Soc.Pac., 106, 921–941.
Woolard, E. W. (1944), The secular perturbations of the satellites of Mars,Astron. J., 51, 33–36.
Wu, P., and W. R. Peltier (1982), Viscous gravitational relaxation, Geophys.J. R. Astron. Soc., 70, 435–485.
Yoder, C. (1982), Tidal rigidity of Phobos, Icarus, 49, 327–346.Yoder, C. F., and S. J. Peale (1981), The tides of Io, Icarus, 47, 1–35.Yoder, C. F., A. S. Konopliv, D. N. Yuan, E. M. Standish, and W. M.Folkner (2003), Fluid core size of Mars from detection of the solar tide,Science, 300, 299–303.
Yokoyama, T. (2002), Possible effects of secular resonances in Phobos andTriton, Planet. Space Sci., 50, 63–77.
Yuan, D. N., W. L. Sjogren, A. S. Konopliv, and A. B. Kucinskas (2001),The gravity field of Mars: A 75th degree and order model, J. Geophys.Res., 106, 23,377–23,401.
Zuber, M. T., D. E. Smith, S. C. Solomon, D. O. Muhleman, J. W. Head,J. B. Garvin, J. B. Abshire, and J. L. Bufton (1992), The MarsObserver Laser Altimeter investigation, J. Geophys. Res., 97, 7781–7797.
�����������������������B. G. Bills, Scripps Institution of Oceanography, La Jolla, CA 92093,
USA. ([email protected])G. A. Neumann and D. E. Smith, NASA Goddard Space Flight Center,
Greenbelt, MD 20771, USA.M. T. Zuber, Massachusetts Institute of Technology, 77 Massachusetts
Avenue, Cambridge, MA 02139, USA.
E07004 BILLS ET AL.: TIDAL DISSIPATION WITHIN MARS
15 of 15
E07004