Embed Size (px)
Citation preview

45th International Conference on Environmental Systems ICES-2015-216 12-16 July 2015, Bellevue, Washington
Improved Dynamic Modeling of the Cascade Distillation Subsystem and Analysis of Factors Affecting Its
Performance
Bruce A. Perry1 Princeton University, Princeton, New Jersey, 08544
and
Molly S. Anderson2 NASA Johnson Space Center, Houston, Texas, 77508
The Cascade Distillation Subsystem (CDS) is a rotary multistage distiller being developed to serve as the primary processor for wastewater recovery during long-duration space missions. The CDS could be integrated with a system similar to the International Space Station Water Processor Assembly to form a complete water recovery system for future missions. A preliminary chemical process simulation was previously developed using Aspen Custom Modeler® (ACM), but it could not simulate thermal startup and lacked detailed analysis of several key internal processes, including heat transfer between stages. This paper describes modifications to the ACM simulation of the CDS that improve its capabilities and the accuracy of its predictions. Notably, the modified version can be used to model thermal startup and predicts the total energy consumption of the CDS. The simulation has been validated for both sodium chloride solution and pretreated urine feeds and no longer requires retuning when operating parameters change. The simulation was also used to predict how internal processes and operating conditions of the CDS affect its performance. In particular, it is shown that the coefficient of performance of the thermoelectric heat pump used to provide heating and cooling for the CDS is the largest factor in determining CDS efficiency. Intrastage heat transfer affects CDS performance indirectly through effects on the coefficient of performance.
Nomenclature ACM = Aspen Custom Modeler® CDS = Cascade Distillation Subsystem CD5 = five-stage cascade distiller COP = coefficient of performance DCT = Distillation Comparison Test FC = final condenser LEO = low Earth orbit NaCl = sodium chloride RPM = revolutions per minute TC = trim cooler THP = thermoelectric heat pump VEC = volatiles evaporation chamber VLE = vapor-liquid equilibrium WRS = water recovery system 1 Graduate Research Assistant, Department of Mechanical and Aerospace Engineering, Engineering Quad D214, Princeton, NJ, 08544. 2 ECLSS Domain Lead, Crew and Thermal Systems Division, NASA Johnson Space Center, Mailcode EC2, 2101 NASA Parkway, Houston TX 77058

International Conference on Environmental Systems
2
f = condenser effluent vapor fraction hC = condenser side heat transfer coefficient hE = evaporator side heat transfer coefficient hw = wall heat transfer coefficient ΔPce = interstage pressure drop Qce = rate of intrastage heat flow from condensers to evaporators Qh = heat pumped to hot loop by THP U = overall intrastage heat transfer coefficient W = power supplied to the THP ω = angular velocity of distiller rotation
I. Introduction N estimated 2.9 kg of potable water per crewmember per day is required to sustain manned space exploration missions.1 For short-duration, low Earth orbit missions, it is feasible to launch and store enough water for the
mission without the need to recover wastewater. However, it would be prohibitively expensive to launch and store all required water for long-duration missions. Therefore, the development of efficient wastewater recovery technologies is necessary to enable exploration missions to destinations beyond low Earth orbit. The Advanced Exploration Systems Water Recovery Project has been established to develop an improved water recovery system (WRS) that operates as part of a nearly closed-loop system, with minimal consumable and power use. The Cascade Distillation Subsystem (CDS) is a new contaminant concentration and removal technology being developed by NASA and Honeywell International to serve as the central component of a next-generation WRS. Distillation is a commonly used physiochemical separation process that takes advantage of the difference in composition between phases at vapor-liquid equilibrium (VLE). Although fundamentally similar to distillation columns for Earth-based applications, the CDS has unique features that make it suited for spaceflight applications. Traditional distillation columns rely on gravity to separate the vapor and liquid phases, but the CDS uses a rotating drum to separate the phases by centrifugal force so it can operate in microgravity. Additionally, the CDS uses a thermoelectric heat pump (THP) that serves as both the reboiler and the condenser, which increases simplicity and decreases the power requirement. The five stages of the distiller are designed to recover the heat of vaporization, further reducing the energy input required. Detailed simulations are a valuable aid during the development and optimization of complex chemical processes, such as those occurring in the CDS. Simulation is the only way to gain insight about the internal operating conditions of the CDS because its rotating drum makes direct internal measurements impossible. Aspen Custom Modeler® (ACM) is a chemical process modeling software package that is well suited for dynamic modeling of specialized chemical processes because it includes an equation solver linked to a chemical properties database. Allada and coworkers developed an initial, lower-fidelity simulation of the CDS using ACM.2 The objective of the efforts described in this paper was to build the pre-existing CDS model into a high-fidelity simulation that can be used to make informative predictions about CDS performance under a range of operating conditions. First, this paper describes the changes made and the current state of the CDS model. Reducing the number of estimated parameters and relaxing several assumptions improved the generality of the model. For example, the detail of the analysis of heat transfer and other internal processes was improved by adding relevant empirical correlations and analytical equations. The updated model was validated by comparing predicted flow rates, temperatures, pressures, and compositions to experimental data. Finally, this paper also describes and draws conclusions from predictions made by the updated model about the effects of varying operating parameters on CDS performance.
II. Cascade Distillation System Design and Operation
A. System Overview A schematic of the CDS showing material flows throughout the system is illustrated in Figure 1. The CDS
consists of four major components: the five-stage cascade distiller (CD5), a THP, a heat exchanger (the trim cooler (TC)), and a vacuum pump. The CD5 is a cylindrical drum with internal baffles that divide it into four paired evaporators and condensers (labeled Stages 1 to 4), a primary condenser (the final condenser (FC)) at the end closest to Stage 1, and a primary evaporator (the volatiles evaporation chamber (VEC)) at the end closest to Stage 4. The CD5 is a pressure vessel, pumped to a vacuum prior to the start of operation to reduce the temperatures at which the system operates. The walls within Stages 1 to 4 are designed to allow heat transfer between the evaporators on the
A

International Conference on Environmental Systems
3
interior and condensers on the exterior. The CD5 drum is rapidly rotated (~1200 revolutions per minute (RPM)) to generate centrifugal force for density-based separation of the vapor and liquid phases. The purified water distillate is collected in a tank while impurities accumulate within the CD5 drum.
The THP provides both the heating duty to the VEC and the cooling duty to the FC. The hot loop is the fluid path that allows flow from the VEC to the hot side of the THP and back into the VEC. Similarly, the cold loop allows flow from the FC through the cold side of the THP, through the TC, and back to the FC. In the THP, heat is transferred from the cold loop to the hot loop. Due to thermodynamic limitations, more heat must be transferred to the hot loop than is removed from the cold loop, so the TC provides additional cooling duty in the cold loop to thermodynamically balance the system. The end of the CD5 closest to the FC is referred to as the cold side and the end of the CD5 closest to the VEC is referred to as the hot side.
Internal liquid flow is passively controlled using pitot pumps. The pitot pump pickups are statically mounted to the central column of the CDS while the fluids in the system rotate with the exterior walls, resulting in a pressure increase due to the velocity difference. Liquid wastewater enters the CD5 at the Stage 1 evaporator and flows from left to right in Figure 1. Pitot pumps connecting successive stages are designed to maintain constant liquid holdup in each stage. Pitot pumps are also used to wet the evaporator walls to improve heat transfer. In the VEC, an additional pitot pump circulates fluid through the hot loop, but this does not result in any net inflow or outflow from the stage, so impurities accumulate in the VEC. Another consequence of this design is that the amount of wastewater drawn in by the system must be equal to the amount of vapor produced in the five evaporators to maintain constant liquid holdup.
Vapor produced at each evaporator flows to the next condenser toward the cold side (from the Stage 1 evaporator to the FC, from the Stage 2 evaporator to the Stage 1 condenser, etc.). The vapor has a complex flow path through screens and liquid traps to ensure no liquid is carried between stages through the vapor flow path, as shown in Figure 3. To drive this flow, there must be a small pressure difference (ΔPce) between the evaporators and condensers. The condensate can pass through channels between the condensers, flowing toward the FC where it accumulates. One pitot pump is used to circulate the condensate through the cold loop in the FC, while another maintains constant liquid holdup in the FC by pumping condensate into the product tank at the rate at which it is formed.
The CDS is operated as a batch process. First, the motor is activated to begin rotating the CD5 and the system is pumped to a vacuum. Then, the cold loop is filled with deionized water and the hot loop is filled with wastewater from the feed tank. Production is started by activating the THP. Wastewater continuously flows into the system and purified water is continuously removed, so impurities accumulate within the CDS. The system must periodically be stopped to purge the accumulated impurities. The CDS is designed to purify wastewater feeds containing urine that has been pretreated for stability, which contains urea, ammonia, and a variety of ionic compounds.
B. Heat Recovery and Heat Transfer Distillation is an effective purification method for wastewater containing pretreated urine because the salts and
other compounds in the wastewater are mostly nonvolatile. Thus, the vapor formed in each evaporator of the CDS is nearly pure water and the liquid effluent from each evaporator is more concentrated with salts than the incoming liquid. The production rate of purified water is determined by the sum of the vaporization rates at all stages, so energy efficiency is determined by the energy requirement to vaporize a given amount of wastewater.
Figure 1. Cross section showing fluid flows within the CDS. Blue, yellow, and orange streams indicate purified water, wastewater feed, and brine, respectively. Estimated fluid distribution. Adapted from drawing in Ref. 3.

International Conference on Environmental Systems
4
The major advantage of the CDS is that the five-stage design allows for the recovery and reuse of the heat used to vaporize the wastewater in each stage, theoretically allowing for a five-fold increase in the amount of product produced for the same energy input. The heat pumped into the hot loop by the THP vaporizes wastewater in the VEC. The vapor formed in the VEC travels to the Stage 4 condenser, where it condenses and releases the same amount of heat. This heat is transferred through the condenser walls to the Stage 4 evaporator, where it vaporizes an approximately equivalent amount of wastewater. In turn, this vapor is condensed in the Stage 3 condenser, with the latent heat again being recovered to vaporize an equivalent amount of wastewater in the Stage 3 evaporator. This process continues until the vapor generated in the Stage 1 evaporator flows into the final condenser, where the cooling duty necessary for condensation is supplied by the trim cooler and the cold side of the THP.
For the recovery of the latent heat of vaporization to work as described above, the condenser at each stage must have a higher temperature than the corresponding evaporator. Therefore, the dew point of the vapor being condensed (coming from the hot side) must be higher than the bubble point of the wastewater being vaporized (coming from the cold side). This is ensured by a difference in pressure between the evaporators and condensers at each stage. The pitot pump connections between the evaporators allow them to maintain independent pressures and the continuous flow of heat into the VEC and removal of heat from the FC results in a temperature and pressure gradient from the VEC (hot, high-pressure side) to the FC (cold, low-pressure side). Within each stage, the condenser pressure is higher than the evaporator pressure because it is linked to the next evaporator toward the hot, high-pressure side (where the vapor was generated). This pressure difference is large enough to ensure that dew point in the condensers is higher than the bubble point in the evaporators.
The rate of intrastage heat transfer between evaporators and condensers is a key factor that determines the efficiency of this heat recovery. To accurately model the intrastage heat transfer, it is essential to understand how the overall heat transfer coefficient scales with CDS operating conditions. The heat transfer occurs across the wall separating the evaporators and condensers. This wall is approximately tire shaped, with the sides (nearly vertical edges in Fig. 1) accounting for approximately 75% of the area and the round face (horizontal edge in Fig. 1) accounting for the remaining area. Heat transfer is expected to be faster through the side walls because there is strong flow of condensate and wastewater on the sides of these walls, which is aided by the centrifugal force acting nearly parallel to the walls. Because of this and the larger area of the side walls, it is assumed the overall rate of intrastage heat transfer is dominated by heat transfer through the side walls and thus the overall heat transfer coefficient will scale in the same manner as the heat transfer coefficient across the side walls.
The overall heat transfer coefficient U therefore follows the scaling
1U=1hC+1hw+1hE
(1)
where hC, hw, and he are the heat transfer coefficients across the fluid on the condenser side, across the wall, and across fluid on the evaporator side, respectively. Heat transfer during condensation on a rotating disk has been studied experimentally, resulting in an empirical correlation for hC:
hc =1.38!k3hfg"lD4!T
"
#$$
%
&''
0.25# 2D4
2! 2"
#$
%
&'
0.215
(2)
where D is the diameter, ∆! is the temperature difference between the condenser and wall, ω is the angular velocity of rotation, and k, ν, hfg, and ρl are the thermal conductivity, kinematic viscosity, heat of vaporization, and density of the liquid, respectively.4 This equation has a similar form to an analytical expression derived by Sparrow and Gregg.5 Furthermore, Sparrow and Hartnett showed that the wall being at a slight angle (as is the case for the CDS) has a negligible effect.6 The case of evaporation on a rotating disk has been less extensively studied, but there is an empirical correlation developed by Wang and coworkers:
hE = 5.23k!"
!
"#
$
%&hfg Prcp'T
!
"##
$
%&&
(0.065
(3)

International Conference on Environmental Systems
5
where Pr is the Prandtl number and cP is the liquid heat capacity.7 Heat transfer across the wall is assumed to have a negligible impact on U, as hw is large because the walls are thin and thermally conductive. Thus, Eq. 1, Eq. 2, and Eq. 3 together determine how the overall CDS heat transfer coefficient scales with measureable or controllable CDS operating parameters.
C. Cascade Distillation System Power Consumption Electrical power is required to run the THP, to run the motor that rotates the distiller drum, and to operate the
control systems. For modeling purposes, the power consumption of the THP is considered separately from the rest of the system. Because the remaining power consumption is dominated by the motor, it is expected to be a function of the rotational speed of the CDS. Figure 2 shows the observed power draw of the CDS as a function of rotational speed. The data show a quadratic relationship with r2 = 0.994.
The amount of heat that is transferred to the hot loop (Qh), and hence the amount of purified water that can be produced, for a given energy input (W) to the THP is determined by the coefficient of performance (COP):
COP = Qh
W. (4)
The efficiency of the THP (η) is defined as the ratio of the COP to the thermodynamic maximum COP for the Carnot cycle:
! =COP
Thot !Tlm (5)
where Thot is the average hot loop temperature, ΔTlm is the log mean temperature difference between the hot side and the cold side, and the denominator is the Carnot COP. The efficiency is dependent on heat transfer within the system and therefore can vary with Thot, ΔTlm, W, and the flow rates through the THP.
The performance of the THP was previously characterized while varying these parameters for 38 total cases. A multivariable regression analysis was run using these data to determine how efficiency depends on Thot, ΔTlm, hot and cold loop flow rates, and THP power. Both first- and second-order effects (including interactions) were considered. The results of the regression are shown in Figure 3. Overall, there is excellent agreement (r2 = 0.991) between the efficiencies predicted by this statistical model and the measured values, with the exception of one case. This case was excluded because the discrepancy is thought to be a result of a data recording error. Efficiency was found to increase significantly with ΔTlm and flow rates, but to decrease significantly with increasing power. No significant effect (p > 0.05) was found for Thot. Note that although η increases with ΔTlm, COP is inversely proportional to ΔTlm in the definition of η and the net effect remains that COP decreases with increasing η. The dependence of η on hot and cold loop flow rates means that the dependence of these flow rates on CDS operating conditions must also be taken into account. Flow through the hot and cold loops is driven by pitot pumps, so the flow rate is a function of ω, the rotational speed at which the CDS is operated. Experimental measurements, shown in Figure 4, indicate a linear relationship between flow rates and rotational speed.
Figure 2. Measurements of CD5 power consumption as a function of rotational speed (○) and the quadratic best-fit line for the data (r2 = 0.994).

International Conference on Environmental Systems
6
The empirical correlations for CDS power consumption, THP efficiency, and loop flow rates described in this section are only valid over the range of parameters across which measurements were taken. Table 1 shows the range of parameters over which each relationship is valid.
Figure 4. Measurements of cold loop (○) and hot loop (●) flow rates as a function of rotational speed along with best-fit lines.
Table 1. Parameter Ranges for Empirical Correlations Parameter Units Minimum Maximum Limited Correlation
Rotational Speed RPM 1000 1500 CD5 Power & Loop Flow Rates THP Power W 280 500 THP Efficiency ΔTlm °C 3.2 16.7 THP Efficiency Thot °C 17.9 38.3 THP Efficiency
Cold Loop Flow gal/min 0.23 0.97 THP Efficiency Hot Loop Flow gal/min 0.25 1.01 THP Efficiency
2
Empirical Model
Coefficient p-value η = - 6.14E-03 1.0E-01 + 1.14E-02 × ΔTlm 5.9E-22 + 4.69E-01 × Fhot 2.6E-03 + 3.55E-01 × Fcold 1.2E-03 3.88E-05 × W 1.3E-06 1.93E-04 × ΔTlm
2 3.3E-11 4.26 × Fhot
2 1.3E-02
3.35 × Fcold2 1.6E-02
2.30E-06 × W × ΔTlm 9.7E-03
Fhot = Hot Loop Flow Rate (L/hr) Fcold = Cold Loop Flow Rate (L/hr) W = THP Power (W)
Figure 3. Predicted efficiency vs. experimental efficiency for THP performance data using the empirical model shown. The measurement excluded from the calculation is indicated with the filled circle (●).
1

International Conference on Environmental Systems
7
III. Aspen Custom Modeler® Model Description
A. Model Overview In ACM, individual submodels with equations describing a particular unit operation are developed, then linked
together in a flowsheet so they can be solved simultaneously. The flowsheet developed for the CDS model is shown in Figure 5. The fundamental structure of the models has been previously described in more detail in Ref. 1 and Ref. 7. The key equations governing the behavior of all blocks within the flowsheet are energy balances, an overall mass balance, and species balances for all compounds included in the model except for water. These equations can be solved dynamically to show the accumulation of species within each process during CDS operation. Built-in chemical properties information from ACM is used to determine physical constants such as density and for VLE calculations. The electrolyte nonrandom two-liquid model (NRTL) equation of state is used to determine the extent of dissociation for aqueous ionic compounds and the Redlich-Kwong equation of state is used for vapor phase properties.
As shown in Figure 5, the five-stage rotary distiller is modeled using five instances each of an evaporator model and a condenser model. In addition to mass flows that represent the flow of wastewater, vapor, and condensate flow through the distiller, energy flows are required to model intrastage heat transfer. The intrastage heat flow from condensers to evaporators (Qce) is calculated
Qce =UA!Tlm (6)
where U is the previously defined overall heat transfer coefficient, A is the heat transfer area, and ΔTlm refers to the temperature difference between condensers and evaporators. The energy transfer rates within the THP and TC must also be calculated to dynamically solve for the temperature at each process. The energy transfer rates to the hot loop and from the cold loop within the THP are calculated within the THP model for a given COP using Equation 4 and the THP energy balance. The heat removal within the TC is calculated using an equation of the same form as Eq. 6. Two feed solutions can be used for the ACM simulation: sodium chloride (NaCl) solution and an ersatz model for the Distillation Comparison Test (DCT) urine feed. The latter includes 24 of the most prevalent compounds in urine and has the ability to represent dissociation of salts, production of volatile organic compounds, and the presence of incondensable gases, such as carbon dioxide.8 The pH calculated by ACM for this feed solution at room temperature is 2.82, as compared to 2.22 measured for typical pretreated urine.9
Figure 5. Flowsheet for the ACM model of the CDS. Black arrows indicate material flows, red arrows indicate energy flows, and blue arrows indicate cooling water.

International Conference on Environmental Systems
8
B. Assumptions The model includes dynamic mass balances for the liquid phase of the evaporators and the product tank. The
vapor phase compositions of the evaporators are defined by thermodynamic equilibrium with the liquid phases. All other components of the system are assumed to have pseudo-steady state mass balances. In other words, the timescale for these components to reach steady state is short compared to the timescale of fluctuations in their inputs, so the accumulation terms in the mass balances can be ignored. Constant molar holdup is assumed for the evaporators, and the initial composition is assumed to be the same as the feed. The VEC holdup is assumed to include both the fluid in the VEC and any fluid traveling through the hot loop.
All of the above assumptions are unchanged from the original CDS model developed by Allada, but several assumptions were adjusted or relaxed to improve the accuracy of the model, as shown in Table 2. Dynamic energy balances were added for the evaporators to improve modeling of thermal startup. Pseudo-steady state energy balances were used for the remaining components of the system and the thermal capacity of the CDS itself was neglected. The capability to model heat loss to the environment was added with the assumption that heat loss from the condensers occurs at a constant rate.
Additionally, parameters that were assumed constants in the original Allada model are now calculated based on controllable operating conditions or determined from the design of the CDS. The THP COP, loop flow rates, and motor power consumption are calculated using the empirical correlations described in Section II. Detailed schematics of the CDS were used to calculate the intrastage heat transfer area and evaporator liquid holdup, which were previously estimated.
The current model has three parameters that need to be adjusted to fit the model predictions to experimental data:
the interstage pressure drop (ΔPce), condenser vapor fraction (f), and a prefactor for the intrastage heat transfer coefficient (U0). The first two of these were assumed to be zero in the Allada model, which did not take into account the possibility of a decrease in pressure of the vapor as it flows from the evaporators to the condensers and assumed total condensation in the condensers. The capability to model a vapor/liquid mixture for the condenser effluents was added in the updated simulation. Note that the current model does not explicitly account for any effect this would have on the heat transfer coefficient, but this could be implicitly accounted for in the scaling of the heat transfer coefficient. In the Allada model, it was assumed that U is constant (U = U0), and this value needed to be adjusted for any different set of CDS operating conditions. In the current model, it is assumed that U has a scaling based on Eq. 2 and Eq. 3:
U =U0! 0.43
!T 0.25 . (7)
The constant U0 can be determined at any particular set of operating conditions, and then this scaling can be used to determine the value of U for any set of conditions. Once the three adjustable parameters are determined empirically, the only major required inputs to the model are the rotational speed, THP power, cooling water temperature in the TC, and feed temperature. The model calculates
Table 2. Updated Model Assumptions Parameter/Assumption Allada Model Current Model Condenser energy balances Psuedo-steady state Dynamic Heat loss to environment Not included Estimated constant (optional) THP COP Estimated constant Variable, calculated using multi-parameter
empirical correlation Loop flow rates Estimated constant Variable, function of rotational speed Motor power consumption Not included Variable, function of rotational speed Intrastage heat transfer area Estimated constant Determined based on CDS dimensions Evaporator liquid holdup Estimated constant Determined based on CDS dimensions Interstage pressure drop (ΔPce) Assumed to be 0 Constant, adjusted to fit data Condensate vapor fraction (f) Assumed to be 0 Constant, adjusted to fit data Intrastage heat transfer coefficient (U) Adjusted to fit data Magnitude adjusted to fit data, scaling follows
known correlations

International Conference on Environmental Systems
9
all necessary internal parameters from these inputs, which can all be controlled during CDS operation. The outputs from ACM include the production rate of purified water and the compositions, temperatures, and pressures within all components of the CDS.
IV. Results and Discussion
A. Parameter Fitting The best-fit values of U0, ΔPce, and f were determined by manually adjusting the parameters until the simulation
predictions matched experimental data for a test run of the CDS using a pretreated urine feed. For this test run, the THP power was increased from 300 W to 400 W after 0.8 hr, the rotational speed was constant at 1210 RPM, and the feed temperature was constant at 20.3 °C. During CDS testing, temperature was measured continuously in five locations: in the hot loop at the inlet and outlet and in the cold loop at the inlet, between the THP and TC, and at the outlet. Pressure in the final condenser and product flow rate were also measured. As will be described, the parameters U0 and ΔPce affect both the temperature difference across the system and the product flow rate. In contrast, f has minimal impact on the operating temperatures but increasing f decreases the product flow rate. Therefore, U0 and ΔPce were adjusted during parameter fitting to match the predicted temperature profiles with the experimental data, then f was adjusted to match the production rate profiles.
The best-fit values for the parameters are shown in Table 3. The value for U0 indicates that U is approximately 17 kW/m2-K, which is similar to the value of 9 kW/m2-K that would be predicted using Eq. 1, Eq. 2, and Eq. 3. The predicted interstage pressure drop is reasonable given the typical internal pressures for the CDS are on the order of 0.03 bar. The best-fit value for f, 0.095, may be unrealistically high, as it would imply that a vapor fraction by volume greater than 0.9 is flowing through a channel designed for liquid flow, or that vapor is leaking between stages through a different path. Even if this value is not accurate, f only affects the production rate predictions, so the conclusions based on the temperature and pressure predictions of the model would still be valid.
A comparison of best-fit model predictions to experimental temperature data is shown in Figure 6(a). Long-time temperature predictions are accurate before and after the step-change in THP power. Start-up behavior, particularly on the cold side, is not as well captured by the model. The differences in startup behavior may be a result of neglecting the thermal capacity of the CDS and using pseudo-steady state energy balances for the condensers. The resolution of the experimental pressure data (±0.1 psi or ±0.007 bar) is inadequate to make precise comparison possible, but the predictions are always accurate to the precision of the experimental data (Fig. 6(b)). Furthermore, the long-time predictions and measurements of product flow rate agree well at both 300 W and 400 W (Fig. 6(c)). There is a time lag of approximately 0.15 hr between when changes in product flow rate occur and when they actually occur, the cause of which has not been determined. Finally, the model predicts a product pH of 3.94, which is close to the value of 4.03 that was measured for a similar CDS run.9 The ability of the simulation to accurately predict the dynamic behavior of seven measured quantities while using only three fitting parameters indicates the model accurately captures the key physics of the CDS.
Table 3. Best-fit Values for Model Parameters Parameter Best-fit Value Heat transfer coefficient prefactor (U0) 0.78
Approx. heat transfer coeff. calculated from U0
17 kW/m2-K
Interstage pressure drop (ΔPce) 0.0026 bar
Condenser vapor fraction (f) 0.095 mol/mol

International Conference on Environmental Systems
10
B. Model Validation The ACM model of the CDS and the best-fit values of U0, ΔPce, and f were validated by comparing the model
predictions to a total of five additional test runs with pretreated urine feed, as listed in Table 4. These test runs had varying THP Power, feed temperature, and cooling water temperature, but no information was available for runs with significant variation in rotational speed. Additionally, model predictions for the NaCl solution feed were validated against two experimental runs.
Figure 6. Comparison of model predictions (colored, solid lines) to experimental data (dotted black lines) for (a) temperatures, (b) pressure, and (c) product flow rate for the CDS run used to determine best-fit parameters. Arrows indicate when power was increased from 300 W to 400 W.
Table 4. Operating Conditions of Test Runs used for Validation
Test Date Feed Rot. Speed (RPM)
THP Power (W)
Feed Temp. (°C)
Cooling Water Temp. (°C)
9/20/07 (1) * Pretreated Urine 1210 300 – 400 20.3 16.5 9/19/07 Pretreated Urine 1211 296 20.5 16.5 – 18.6 9/20/07 (2) Pretreated Urine 1209 405 21.5 16.6 10/10/07 Pretreated Urine 1210 294 20.4 16.5 10/11/07 (1) Pretreated Urine 1208 294 18.7 16.5 10/11/07 (2) Pretreated Urine 1208 297 18.8 16.6 11/8/07 2 wt.% NaCl 1206 301 19.4 16.6 1/8/08 2 wt.% NaCl 1201 300 21.3 16.5
*Used to determine best-fit parameters
International Conference on Environmental Systems
11
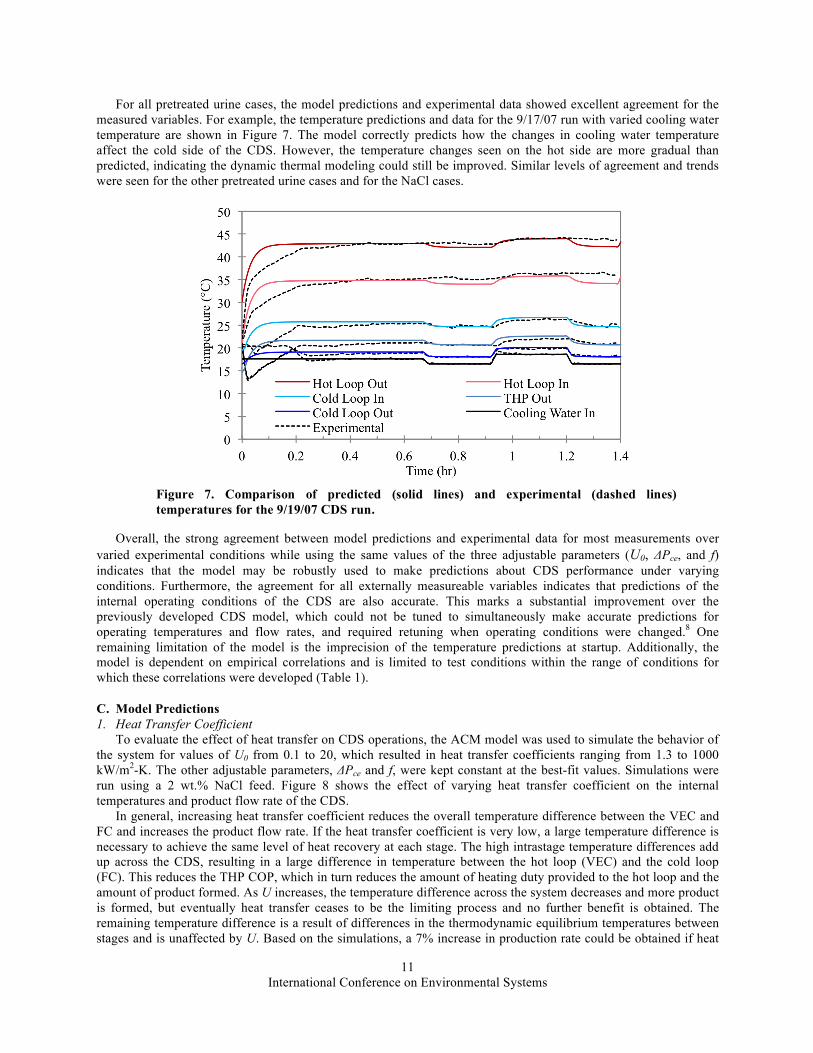
For all pretreated urine cases, the model predictions and experimental data showed excellent agreement for the measured variables. For example, the temperature predictions and data for the 9/17/07 run with varied cooling water temperature are shown in Figure 7. The model correctly predicts how the changes in cooling water temperature affect the cold side of the CDS. However, the temperature changes seen on the hot side are more gradual than predicted, indicating the dynamic thermal modeling could still be improved. Similar levels of agreement and trends were seen for the other pretreated urine cases and for the NaCl cases.
Overall, the strong agreement between model predictions and experimental data for most measurements over
varied experimental conditions while using the same values of the three adjustable parameters (U0, ΔPce, and f) indicates that the model may be robustly used to make predictions about CDS performance under varying conditions. Furthermore, the agreement for all externally measureable variables indicates that predictions of the internal operating conditions of the CDS are also accurate. This marks a substantial improvement over the previously developed CDS model, which could not be tuned to simultaneously make accurate predictions for operating temperatures and flow rates, and required retuning when operating conditions were changed.8 One remaining limitation of the model is the imprecision of the temperature predictions at startup. Additionally, the model is dependent on empirical correlations and is limited to test conditions within the range of conditions for which these correlations were developed (Table 1).
C. Model Predictions 1. Heat Transfer Coefficient
To evaluate the effect of heat transfer on CDS operations, the ACM model was used to simulate the behavior of the system for values of U0 from 0.1 to 20, which resulted in heat transfer coefficients ranging from 1.3 to 1000 kW/m2-K. The other adjustable parameters, ΔPce and f, were kept constant at the best-fit values. Simulations were run using a 2 wt.% NaCl feed. Figure 8 shows the effect of varying heat transfer coefficient on the internal temperatures and product flow rate of the CDS.
In general, increasing heat transfer coefficient reduces the overall temperature difference between the VEC and FC and increases the product flow rate. If the heat transfer coefficient is very low, a large temperature difference is necessary to achieve the same level of heat recovery at each stage. The high intrastage temperature differences add up across the CDS, resulting in a large difference in temperature between the hot loop (VEC) and the cold loop (FC). This reduces the THP COP, which in turn reduces the amount of heating duty provided to the hot loop and the amount of product formed. As U increases, the temperature difference across the system decreases and more product is formed, but eventually heat transfer ceases to be the limiting process and no further benefit is obtained. The remaining temperature difference is a result of differences in the thermodynamic equilibrium temperatures between stages and is unaffected by U. Based on the simulations, a 7% increase in production rate could be obtained if heat
Figure 7. Comparison of predicted (solid lines) and experimental (dashed lines) temperatures for the 9/19/07 CDS run.

International Conference on Environmental Systems
12
transfer in the CDS was improved enough to no longer be limiting (U ≥ 100 kW/m2-K). Previous studies have indicated that the rate of heat transfer is a key factor that must be considered if the CDS is scaled up or down.10 The nonlinear relationship between the heat transfer coefficient and production rate presented here indicates that great care will be required when performing this scaling to ensure the desired production rate is attainable.
2. Interstage Pressure Drop
The effect of the pressure drop required for vapor flow from the evaporators to the condensers (ΔPce) was also investigated. For this purpose, U was set to a constant value and f was set to 0 while ΔPce was adjusted from 0 to 0.007 bar. The effects on internal temperatures and pressures are shown in Figure 9. Although the values of ΔPce examined were small in comparison to the operating pressures, the cumulative effect across all stages is to substantially increase the pressure in the VEC. The effect on temperatures is almost identical because at higher pressures, higher temperatures are required to reach thermodynamic equilibrium between the vapor and liquid phases. This leads to a larger temperature difference across the THP, which reduces the COP and hence the amount of product produced. Therefore, ΔPce has an indirect effect that reduces CDS efficiency. The model predicts that reducing ΔPce from the current estimated value of 0.0028 bar to near 0 would allow for an 8% increase in product flow rate at the same THP power.
Figure 8. (a) CDS internal temperatures and (b) product flow rate after 1.4 hr with varied heat transfer coefficients, other parameters held constant.

International Conference on Environmental Systems
13
3. Incomplete Condensation
Ideally, the effluent from each condenser would be a saturated liquid, but here the effect of a vapor/liquid mixture in the effluent from the Stage 1 to 4 condensers is considered. The best-fit value for the condensate vapor fraction, f, was 0.095 mol/mol, so CDS operations were simulated with vapor fractions ranging from 0 to 0.15 to determine how changes in this parameter might affect system performance. Figure 10 shows the effects on the amount of water vapor produced at each stage and the internal temperatures after 1.4 hr. Incomplete condensation causes a reduction in energy recovery at each stage because the latent heat of vaporization of any vapor in the condenser effluent does not get transferred to the corresponding evaporator. This effect cascades across the system, with each subsequent evaporator producing less vapor. In total, the simulation predicts that product flow rate is decreased by 16% for a vapor fraction of 0.095 compared to the case of total condensation. Increasing vapor fraction is predicted to minimally impact operating temperatures.
The condenser effluent would be more than 90% vapor by volume at a molar vapor fraction of 0.095. This level of vapor would imply an open pathway exists for vapor to flow between condenser stages, which could be the pathway designed for liquid condensate or elsewhere. If this is not the case, the initial assumption of total condensation may be more accurate. Then, only two adjustable parameters remain and the ability to quantitatively match the predicted production rate to experimental data is lost. The predictions for temperature and pressure would remain accurate; adjusting U0 and ΔPce is sufficient to fit these variables to data and changes in f minimally impact temperature predictions, as discussed above. An alternative explanation for the reduced production rate would be needed. One possibility is that the empirical model over predicts COP for the CDS operating conditions. If the true COP is lower than predicted, the production rate would be lower for a given temperature distribution. Another possibility is that evaporators do not truly reach equilibrium, as is assumed.
Figure 9. (a) CDS internal pressures and (b) temperatures after 1.4 hr with varied ΔPce, other parameters held constant

International Conference on Environmental Systems
14
4. Optimization of Operating Conditions
The CDS model predicts performance trade-offs for the most important controlled operating parameters – rotational speed and THP power. The dependence of specific energy on rotational speed is shown in Figure 11(a). The energy required for the motor increases with rotational speed based on the relationship in Figure 2. However, higher rotational speeds increase flow rates through the THP and improve heat transfer, so more product is produced from a constant power input to the THP. The net effect of these competing factors is that there is a minimum in overall specific energy at approximately 1050 RPM, but specific energy is relatively constant for rotational speeds between 1000 RPM and 1200 RPM.
There is a similar trade-off for the effect of THP power on CDS performance. The dependence of specific energy on THP power is shown in Fig. 11(b). The THP COP decreases with increasing power, which increases the THP specific energy. However, the total amount of product increases with the increase in power, from 4.15 kg/hr at 300 W to 5.5 kg/hr at 500 W. The motor power consumption is constant, so motor specific energy decreases at higher THP powers. The net result is a minimum in specific energy between 250 W and 300 W. In this case, the specific energy minimum is not necessarily the optimum operating condition. Specific mass (amount of product produced per unit device mass) may be more important than specific energy for some applications, thus higher THP power would be favored.
Figure 10. (a) Purified water vapor production rate from each stage and (b) internal CDS temperatures after 1.4 hr with varied vapor fraction, other parameters held constant.
Figure 11. Predicted values for overall CDS specific energy (●) and specific energy contributions from the THP (□) and the CD5 motor (○) as a function of (a) rotational speed and (b) THP power.

International Conference on Environmental Systems
15
V. Conclusions An improved dynamic model of the CDS has been developed in ACM. Several empirical correlations were
developed for the model to relate key internal parameters to externally measureable or controllable variables. Three adjustable parameters, intrastage heat transfer coefficient prefactor, interstage pressure drop, and condenser effluent vapor fraction, were used to fit the model predictions to data from one CDS run. The model was then validated by showing that these parameters could be used to make accurate predictions of all externally measureable variables under a wide variety of test conditions. Limitations remain for model predictions during thermal startup because simplified, pseudo-steady state energy balances are used in the condenser submodels.
The amount of product produced by the CDS is determined by the amount of heat energy transferred to the hot side of the THP to vaporize brine in the VEC. This heat of vaporization is recovered via intrastage heat transfer at the subsequent four stages, theoretically leading to a five-fold maximum increase in production rate. The THP COP is the key parameter for CDS specific energy because it determines the amount of heat flow to the hot side of the THP for a given power input. The COP is a function of flow rates, power, and temperature difference across the THP, with increasing temperature difference leading to particularly significant reductions in COP. The temperature difference across the THP results from three factors: thermodynamics, intrastage heat transfer, and interstage pressure drop. Thus, the major impact of intrastage heat transfer and interstage pressure drop on CDS efficiency occurs indirectly as a result of their effects on the THP COP.
ACM simulations were used to predict how adjusting CDS variables affects the internal behavior of the system, with particular attention to effects on the COP and latent heat recovery. Reducing interstage pressure drops or improving heat transfer within the system could improve production rate by 8% and 7%, respectively, based on the resulting increases in COP. Note the significance of the interstage pressure drop, which has generally been assumed to be negligible in previous analyses of CDS performance. Reducing THP power also improves COP, but at the expense of reducing overall flow rate. A trade-off also exists for increasing rotational speed, which has indirect effects that improve the COP but also increases motor power consumption. Currently used settings for rotational speed (1200 RPM) and THP power (300 W) are near the optimum values for specific energy. The model predicts that incomplete condensation significantly reduces latent heat recovery and therefore production rate, but the predicted vapor fraction is questionably high and an alternative explanation may be needed. Nevertheless, comparisons against experimental data support the validity of the simulation and the conclusions that can be drawn from its results.
References 1 NASA Human Integration Design Handbook, NASA/SP-2010-3407/REV1, 2014. 2 Allada, R., Lange, K., and Anderson, M., “Detailed Modeling of Distillation technologies for Closed-loop Water Recovery
Systems,” AIAA 2011-5102, International Conference on Environmental Systems, 2011. 3 Rifert, V., Usenko, V., Zolotukhin, I., MacKnight, A., and Lubman, A., “Design Optimization of Cascade Rotary Distiller
with the Heat Pump for Water Reclamation from Urine,” SAE 2001-01-2248, International Conference on Environmental Systems, 2001.
4 Rifert, V., Smirnov, H., Condensation Heat Transfer Enhancement, WIT Press, 2004. 5 Sparrow, E. and Gregg, J., “A Theory of Rotating Condensation,” Journal of Heat Transfer, Vol. 81, 1959, pp. 113-120 6 Sparrow, E. and Hartnett, J., “Condensation on a Rotating Cone,” Journal of Heat Transfer, Vol. 83, 1961, pp. 101-102 7 Wang, C., Grief, R., and Laird, A., “Heat Transfer in a Rotating Disk Evaporator,” Desalination, Vol. 33, 1980, pp. 259-267 8 Allada, R., “Status of Modeling Efforts for Water Recovery Technology Development,” ESCG-4470-09-TEAN-DOC-
0169, NASA Johnson Space Center, Houston, TX, September 2009. 9 Callahan, M., Patel, V., and Pickering, K., “Cascade Distillation Subsystem Development: Early Results from the
Exploration Life Support Distillation Technology Comparison Test,” AIAA 2010-6149, International Conference on Environmental Systems, 2010.
10 Patel, V., Au, H., Shull, S., Sargusingh, M., and Callahan, M., “Cascade Distillation System – A Water Recovery System for Deep Space Missions,” ICES 2014-12, International Conference on Environmental Systems, 2014.


![Data Distillation: Towards Omni-Supervised Learning · Data Distillation model A model A Figure 1. Model Distillation [18] vs. Data Distillation. In data distillation, ensembled predictions](https://img.dokumen.tips/doc/110x75/60a237adb93b13457117b793/data-distillation-towards-omni-supervised-learning-data-distillation-model-a-model.jpg)