Embed Size (px)
Citation preview
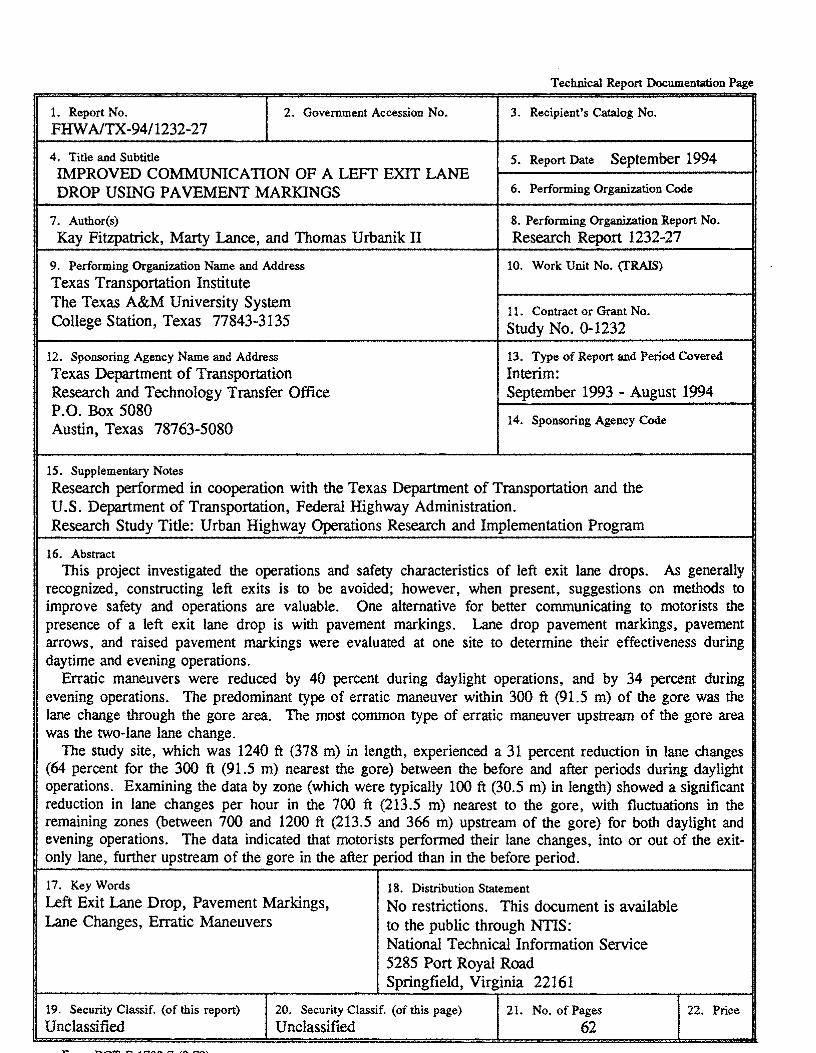
Technical Report Documentation Page
1. Report No. 2. Government Accession No. 3. Recipient's Catalog No. FHW AlTX-9411232-27
4. Title and Subtitle 5. Report Date September 1994 IMPROVED COMMUNICATION OF A LEFT EXIT LANE DROP USING PAVEMENT MARKINGS 6. Performing Organization Code
7. Author(s) Kay Fitzpatrick, Marty Lance, and Thomas Urbanik II
8. Performing Organization Report No.
Research Report 1232-27
9. Performing Organization Name and Address
Texas Transportation Institute The Texas A&M University System College Station, Texas 77843-3135
10. Work Unit No. (fRAIS)
11. Contract or Grant No.
Study No. 0-1232
12. Sponsoring Agency Name and Address Texas Department of Transportation Research and Technology Transfer Office P.O. Box 5080
13. Type of Report and Period Covered
Interim: September 1993 - August 1994
Austin, Texas 78763-5080 14. Sponsoring Agency Code
15. Supplementary Notes Research performed in cooperation with the Texas Department of Transportation and the U.S. Department of Transportation, Federal Highway Administration. Research Study Title: Urban Highway Operations Research and Implementation Program
16. Abstract This project investigated the operations and safety characteristics of left exit lane drops. As generally
recognized, constructing left exits is to be avoided; however, when present, suggestions on methods to improve safety and operations are valuable. One alternative for better communicating to motorists the presence of a left exit lane drop is with pavement markings. Lane drop pavement markings, pavement arrows, and raised pavement markings were evaluated at one site to determine their effectiveness during daytime and evening operations.
Erratic maneuvers were reduced by 40 percent during daylight operations, and by 34 percent during evening operations. The predominant type of erratic maneuver within 300 ft (91.5 m) of the gore was the lane change through the gore area. The most common type of erratic maneuver upstream of the gore area was the two-lane lane change.
The study site, which was 1240 ft (378 m) in length, experienced a 31 percent reduction in lane changes (64 percent for the 300 ft (91.5 m) nearest the gore) between the before and after periods during daylight operations. Examining the data by zone (which were typically 100 ft (30.5 m) in length) showed a significant reduction in lane changes per hour in the 700 ft (213.5 m) nearest to the gore, with fluctuations in the remaining zones (between 700 and 1200 ft (213.5 and 366 m) upstream of the gore) for both daylight and evening operations. The data indicated that motorists performed their lane changes, into or out of the exitonly lane, further upstream of the gore in the after period than in the before period.
17. Key Words
Left Exit Lane Drop, Pavement Markings, Lane Changes, Erratic Maneuvers
18. Distribution Statement
No restrictions. This document is available to the public through NTIS: National Technical Information Service 5285 Port Royal Road Springfield, Virginia 22161
19. Security Classif. (of this report)
Unclassified 20. Security Classif. (of this page)
Unclassified 21. No. of Pages
62 22. Price

IMPROVED COMMUNICATION OF A LEFT EXIT LANE DROP USING PAVEMENT MARKINGS
by
Kay Fitzpatrick, P .E. Assistant Research Engineer
Marty Lance Graduate Research Assistant
and
Thomas Urbanik II, P.E. Research Engineer
Research Report 1232-27 Research Study Number 0-1232
Research Study Title: Urban Highway Operations Research and Implementation Program
Sponsored by the Texas Department of Transportation
In Cooperation with U.S. Department of Transportation
Federal Highway Administration
September 1994
TEXAS TRANSPORTATION INSTITUTE The Texas A&M University System College Station, Texas 77843-3135

IMPLEMENTATION STATEl\1ENT
This study demonstrated that motorists' behavior at a left exit lane drop changed when pavement markings were installed. Findings revealed that fewer lane changes and erratic maneuvers occurred after the installation of the markings. Findings also demonstrated that motorists move earlier out of a lane that is being dropped (Le., further upstream of the exit) when lane drop markings are present. Consistent use of the standardized marking treatments provides several benefits, such as consistency in communicating lane drops on Texas freeways to drivers, and improved driver expectancy at lane drops. The improved driver expectancy encourages motorists to move out of or into a lane that is being dropped further upstream of the gore area. This behavior results in fewer erratic maneuvers.
v

DISCLAIMER
The contents of this report reflect the views of the authors, who are responsible for the facts and accuracy of the data presented herein. The contents do not necessarily reflect the official views or policies of the Texas Department of Transportation (TxDOT) or the Federal Highway Administration (FHW A). This report does not constitute a standard, specification, or regulation, nor is it intended for construction, bidding, or permit purposes. This report was prepared by Kay Fitzpatrick (pA-037730-E), Marty Lance, and Tom Urbanik (fX-42384).
Vll
ACKNOWLEDGMENT
Several individuals within the Houston District assisted with this study. These people were extremely cooperative and helpful in scheduling equipment and personnel, installing equipment at the sites, providing and operating the bucket (crane) trucks during installation and removal of the video cameras, and arranging or installing the lane drop markings at the sites. The following individuals are acknowledged: James Elliot, Jerals Hancock, Pat Henry, Steve Levine, Dennis Milcek, Mark Montgomery, Ervin Ramirez, Debbie Rogers, Douglas Streetman, and Dennis Zimmerman.
The TxDOT 1232 technical advisory panel chair, Gary Trietsch, is also recognized for his time in providing direction and comments for this research. This study was performed in cooperation with the Texas Department of Transportation and the U.S. Department of Transportation, Federal Highway Administration.
The authors would also like to recognize the undergraduate students (Deanne Simmons and Stacy Wiatrek) who diligently watched several hours of video tapes to extract the necessary data for this project.
viii

TABLE OF CONTENTS
Chapter Page
UST OF FIGUR:ES . . . . . . . . . . . . . . . . . . . . . . . . . . . . . . . . . . . . . . . . . . xi
LIST OF TABLES ........................................... xi
SUl\fl\.fAR Y ........................ . . . . . . . . . . . . . . . . . . . . . . xiii
1 INTRODUCTION .......................................... 1
2 SIGNING ................................................ 3 CURRENT PROCEDURES ..................................... 3
Lane Drop Exits ......................................... 3 Left Exits ............................................. 5 Left Exit Lane Drop Exits ................................... 7
PLACEMENT OF ADVANCE INFORMATION AT LEFT EXITS ............ 7 DIAGRAMMATIC SIGNS AT LEFT EXITS .......................... 9
3 UTERA TURE ........................................... 11 OPERATIONS ............................................ 11 SAFETY ............................................... 12
4 FIEI..D STIJDY ........................................... 15 MEASURES OF EFFECTIVENESS .............................. 15
Erratic Maneuvers and their Locations . . . . . . . . . . . . . . . . . . . . . . . . . . . 15 Lane Changes and their Locations . . . . . . . . . . . . . . . . . . . . . . . . . . . . . . 16
SITE SELECTION ......................................... 16 DATA COLLECTION ....................................... 21 DATA REDUCTION ........................................ 21
Lane Change Data ......... . . . . . . . . . . . . . . . . . . . . . . . . . . . . . . 23 Erratic Maneuver Data .................................... 23 Traffic Counts . . . . . . . . . . . . . . . . . . . . . . . . . . . . . . . . . . . . . . . . . . 25 Compilation of Data . . . . . . . . . . . . . . . . . . . . . . . . . . . . . . . . . . . . . . 25
DATA ANALYSIS/EVALUATION ............................... 25 RESULTS . . . . . . . . . . . . . . . . . . . . . . . . . . . . . . . . . . . . . . . . . . . . . . . 26
Volume Counts ......................................... 26 Erratic Maneuvers ....................................... 28
ix
TABLE OF CONTENTS (continued)
Chapter
4 FIELD STUDY (CON'T) Lane Changes-Frequency .................................. 31 Statistical Test of Measures of Effectiveness ....................... 34 Lane Changes-Location ................................... 38 Statistical Test on Location of Lane Changes . . . . . . . . . . . . . . . . . . . . . . . 38 Lane Changes-Hour of Day ................................. 40
5 CONCLUSIONS AND RECOMMENDATIONS . . . . . . . . . . . . . . . . . . . . . . 45 CONCLUSIONS . . . . . . . . . . . . . . . . . . . . . . . . . . . . . . . . . . . . . . . . . . . 45 RECOMMENDA nONS . . . . . . . . . . . . . . . . . . . . . . . . . . . . . . . . . . . . . . 46 SUGGESTED RESEARCH .................................... 46
Examine the Relationship between Erratic Maneuvers and Accidents ........ 46 Determine Driver Information Needs . . . . . . . . . . . . . . . . . . . . . . . . . . . . 46
REFERENC:ES ., . . . . . . . . . . . . . . . . . . . . . . . . . . . . . . . . . . . . . . . . . . . 47
x

LIST OF FIGURES
Figure ~
2-1 Exit Lane Drop on Right (3) . . . . . • . . . . . . . . . . . . . . . . . . . . . . . . . . .• 4 2-2 Lane Drop Markings at Exit Ramps (3) ........................... 5 2-3 Left Exit Condition (3) ............••...•....•...•••....•... 6 2-4 Exit Lane Drop on Left with Diagrammatic (3) .....••.....•...•...•• 8 4-1 1-45 Northbound to 1-610 West ............................... 17 4-2 Lane Drop Markings Installed at the Site ......................... 19 4-3 Raised Pavement Markers and Pavement Arrows at the Site .............. 20 4-4 Locations of Cameras and Zones .............................. 22 4-5 Illustration of Erratic and Non-Erratic Lane Changes . . . . . . . . . . . . . . . . . . 24 4-6 Erratic Maneuvers Per Hour Per Zone . . . . . . . . . . . . . . . . . . . . . . . . . . . 30 4-7 Lane Changes Per Hour Per Zone . . . . . . . . . . . . . . . . . . . . . . . . . . . . . . 33 4-8 Entering and Exiting the Exit Lane Changes Per Hour Per Zone . . . . . . . . . . . 35 4-9 Lane Change Percentage Distribution-Daylight . . . . . . . . . . . . . . . . . . . . . 39 4-10 Cumulative Percentage Distribution-Daylight ...................... 39 4-11 Lane Change Percentage Distribution-Evening ..................... 41 4-12 Cumulative Percentage Distribution-Evening ...................... 41 4-13 Lane Changes Per Hour of the Day . . . . . . . . . . . . . . . . . . . . . . . . . . . . . 44
LIST OF TABLES
3-1 Accident Rates by Type of Freeway Ramp (14) ..................... 13 4-1 Fifteen Minute Volume Counts-Daylight Hours ..................... 27 4-2 Fifteen Minute Volume Counts-Evening Hours ..................... 28 4-3 Types of Erratic Maneuvers Observed-Daylight .................... 29 4-4 Types of Erratic Maneuvers Observed-Evening . . . . . . . . . . . . . . . . . . . . . 29 4-5 Comparison of Before-and-After Data ........................... 32 4-6 Results of the Binomial Test of Proportions . . . . . . . . . . . . . . . . . . . . . . . . 36 4-7 Results of Chi-Square Tests ................................. 37 4-8 Results of Proportions Test for Each Zone-Daylight . . . . . . . . . . . . . . . . . . 42 4-9 Results of Proportions Test for Each Zone-Evening ....... . . . . . . . . . . . 43
xi


SUMMARY
The purpose of this project was to investigate the operations and safety characteristics of left exit lane drops. As generally recognized, constructing left exits is to be avoided; however, when present, suggestions on methods to improve safety and operations are valuable. Exit lane drops can also cause difficulties for unaware motorists. Without proper notification of the impending exit, drivers can find themselves performing erratic maneuvers in order to prevent exiting at undesirable locations. To negotiate a lane drop successfully, motorists need the following: knowledge of the lane drop, location of the lane drop, choice of an appropriate maneuver, and time to execute that maneuver. Pavement markings provide one alternative for better communicating the presence of a left exit lane drop to motorists.
Several research efforts have focused on communicating information through signing at exit lane drops. Several studies support the use of the black-on-yellow EXIT ONLY panel at exit lane drops where the through traffic continues on the freeway mainline. When route discontinuity occurs the EXIT ONLY panel is not recommended for use. Research indicates that drivers require more time to read and interpret information on diagrammatic signs in comparison with conventional signs. Despite this finding research results have indicated that diagrammatic signs will produce a benefit to motorists' performance at certain interchanges such as major forks, left exits, left exit lane drops, lane drops with an optional lane, and locations where route discontinuity occurs.
Although they provide one solution for communicating lane drops to motorists, very few studies regarding pavement markings at lane drops have been conducted. One recent study found that lane changes and erratic maneuvers decreased at right-hand lane drop exits after lane drop markings were installed. Researchers have also found that various types of pavement markings can produce a reduction in erratic maneuvers at freeway exits. These pavement markings included: color coded markings, raised pavement markings, dotted extended lines, pavement arrows, double white lines, wide solid white lines, and lane drop markings.
A before-and-after field study was designed to measure the effects of lane drop pavement markings on driver behavior at a left exit lane drop. The number and location of erratic maneuvers and lane changes upstream of the exit lane drop were the measures of effectiveness used to describe driver behavior.
A significant reduction in the number of erratic maneuvers within the study segment occurred during both daylight and evening operations. Erratic maneuvers were reduced by 40 percent during daylight operations, and by 34 percent during evening operations. The predominant type of erratic maneuver within 300 ft (91.5 m) of the gore was the lane change through the gore area. The most common type of erratic maneuver upstream of the gore area was the two-lane, lane change. A number of congestion-related erratic maneuvers were also observed.
xiii
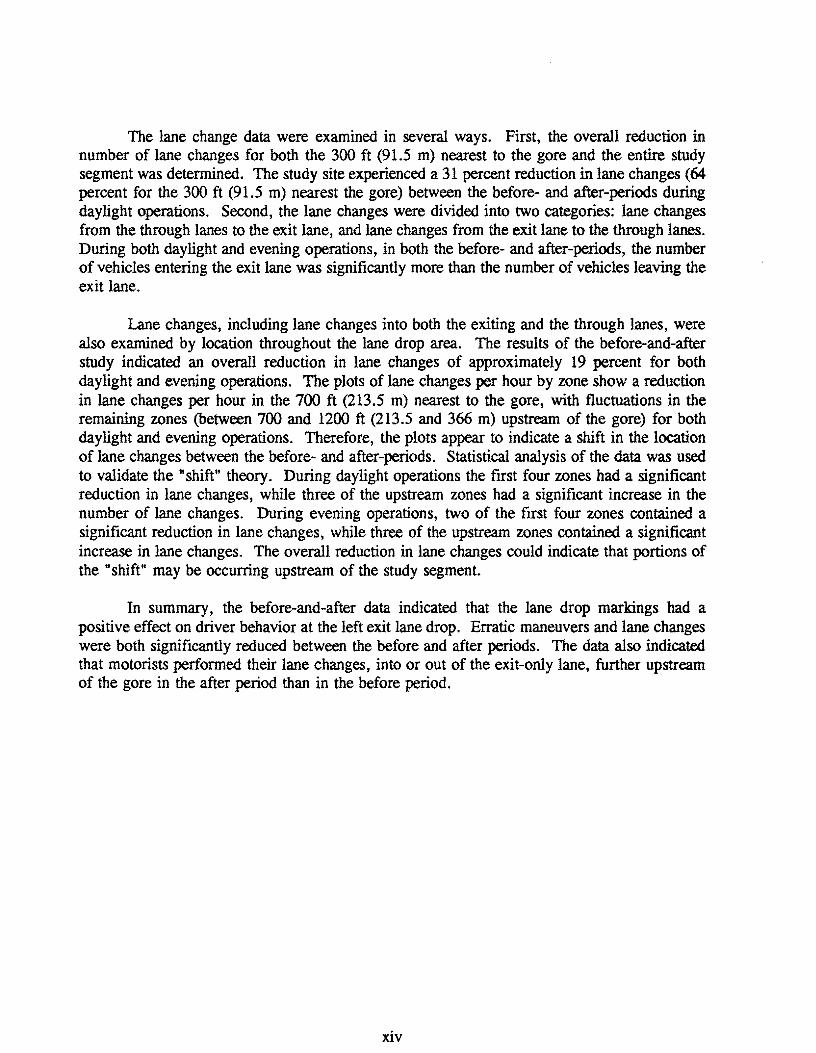
The lane change data were examined in several ways. First, the overall reduction in number of lane changes for both the 300 ft (91.5 m) nearest to the gore and the entire study segment was determined. The study site experienced a 31 percent reduction in lane changes (64 percent for the 300 ft (91.5 m) nearest the gore) between the before- and after-periods during daylight operations. Second, the lane changes were divided into two categories: lane changes from the through lanes to the exit lane, and lane changes from the exit lane to the through lanes. During both daylight and evening operations, in both the before- and after-periods, the number of vehicles entering the exit lane was significantly more than the number of vehicles leaving the exit lane.
Lane changes, including lane changes into both the exiting and the through lanes, were also examined by location throughout the lane drop area. The results of the before-and-after study indicated an overall reduction in lane changes of approximately 19 percent for both daylight and evening operations. The plots of lane changes per hour by zone show a reduction in lane changes per hour in the 700 ft (213.5 m) nearest to the gore, with fluctuations in the remaining zones (between 700 and 1200 ft (213.5 and 366 m) upstream of the gore) for both daylight and evening operations. Therefore, the plots appear to indicate a shift in the location of lane changes between the before- and after-periods. Statistical analysis of the data was used to validate the "shift" theory. During daylight operations the first four zones had a significant reduction in lane changes, while three of the upstream zones had a significant increase in the number of lane changes. During evening operations, two of the first four zones contained a significant reduction in lane changes, while three of the upstream zones contained a significant increase in lane changes. The overall reduction in lane changes could indicate that portions of the "shift" may be occurring upstream of the study segment.
In summary, the before-and-after data indicated that the lane drop markings had a positive effect on driver behavior at the left exit lane drop. Erratic maneuvers and lane changes were both significantly reduced between the before and after periods. The data also indicated that motorists performed their lane changes, into or out of the exit-only lane, further upstream of the gore in the after period than in the before period.
xiv
CHAPTER 1
INTRODUCTION
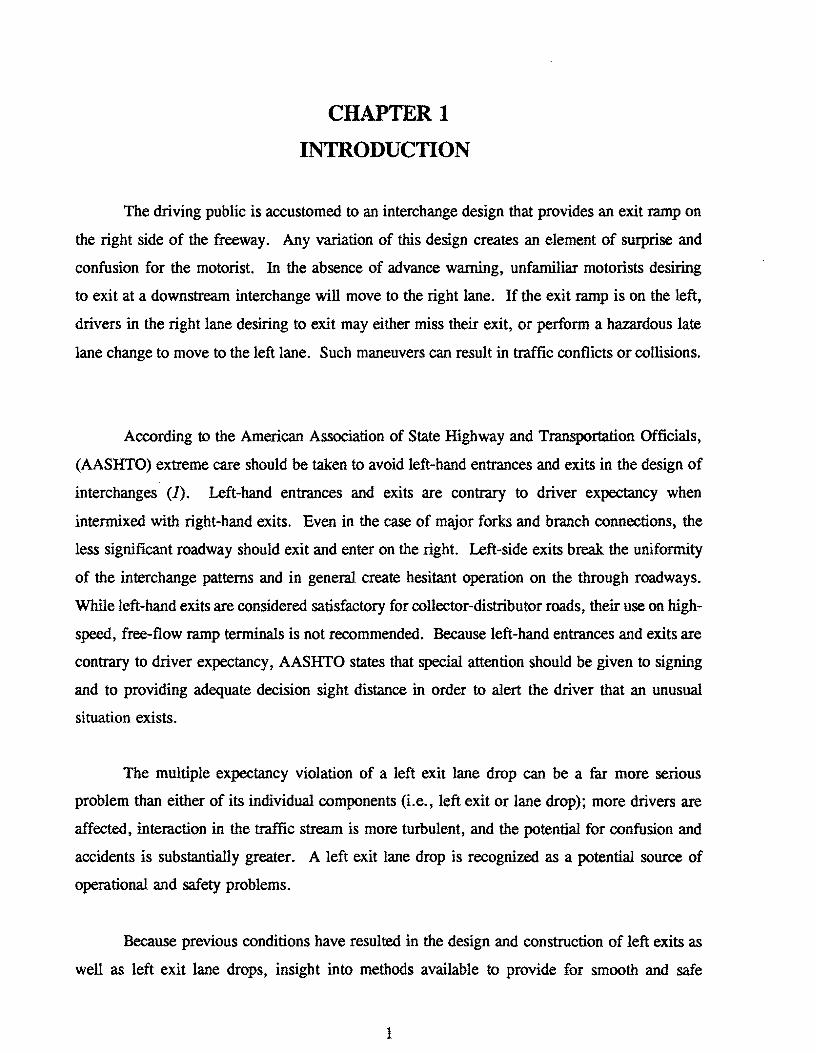
The driving public is accustomed to an interchange design that provides an exit ramp on
the right side of the freeway, Any variation of this design creates an element of surprise and
confusion for the motorist. In the absence of advance warning, unfamiliar motorists desiring
to exit at a downstream interchange will move to the right lane. If the exit ramp is on the left,
drivers in the right lane desiring to exit may either miss their exit, or perform a hazardous late
lane change to move to the left lane. Such maneuvers can result in traffic conflicts or collisions.
According to the American Association of State Highway and Transportation Officials,
(AASHTO) extreme care should be taken to avoid left-hand entrances and exits in the design of
interchanges (1), Left-hand entrances and exits are contrary to driver expectancy when
intermixed with right-hand exits. Even in the case of major forks and branch connections, the
less significant roadway should exit and enter on the right. Left-side exits break the uniformity
of the interchange patterns and in general create hesitant operation on the through roadways.
While left-hand exits are considered satisfactory for collector-distributor roads, their use on high
speed, free-flow ramp terminals is not recommended. Because left-hand entrances and exits are
contrary to driver expectancy, AASHTO states that special attention should be given to signing
and to providing adequate decision sight distance in order to alert the driver that an unusual
situation exists.
The multiple expectancy violation of a left exit lane drop can be a far more serious
problem than either of its individual components (i.e., left exit or lane drop); more drivers are
affected, interaction in the traffic stream is more turbulent, and the potential for confusion and
accidents is substantially greater. A left exit lane drop is recognized as a potential source of
operational and safety problems.
Because previous conditions have resulted in the design and construction of left exits as
well as left exit lane drops, insight into methods available to provide for smooth and safe
1
Chapter 1: Introduction
operations at a left exit lane drop is valuable. This report reviews the current knowledge
regarding left exits and left exit lane drops and reports on a field study. The field study
collected data on motorists' behavior at a left exit lane drop. This behavior included frequency
and location of lane changes and erratic maneuvers. Special pavement markings were installed
at the site and after data were collected. The before and after data were compared to determine
whether the pavement markings would result in improved operations and safety. The report
finishes with conclusions and recommendations.
2

CHAPTER 2
SIGNING
A driver needs certain information in order to travel through an exit area smoothly,
especially an exit lane drop area. To negotiate a lane drop successfully, motorists need the
following: knowledge of the lane drop, location of the lane drop, choice of an appropriate
maneuver, and time to execute that maneuver (2). The National and Texas Manuals on Uniform
Traffic Control Devices (MUTCD and TxMUTCD) contain information on signs and markings
available to guide and warn motorists of upcoming exits and lane drops (3,4).
CURRENT PROCEDURES
The following are the current procedures for signing and marking lane drops and left
exits as contained in the National and Texas Manuals on Uniform Traffic Control Devices.
Lane Drop Exits
Exit-only signs and pavement markings are two methods used to communicate an exit
lane drop to motorists. Signs are a required treatment in the MUTCD while pavement markings
are an optional treatment. Sign treatments include diagrammatic signs, the modified
diagrammatic signs, the use of the black on yellow EXIT ONL Y panel on conventional signs,
and other signs. Markings include alternative gore area treatments and special lane lines.
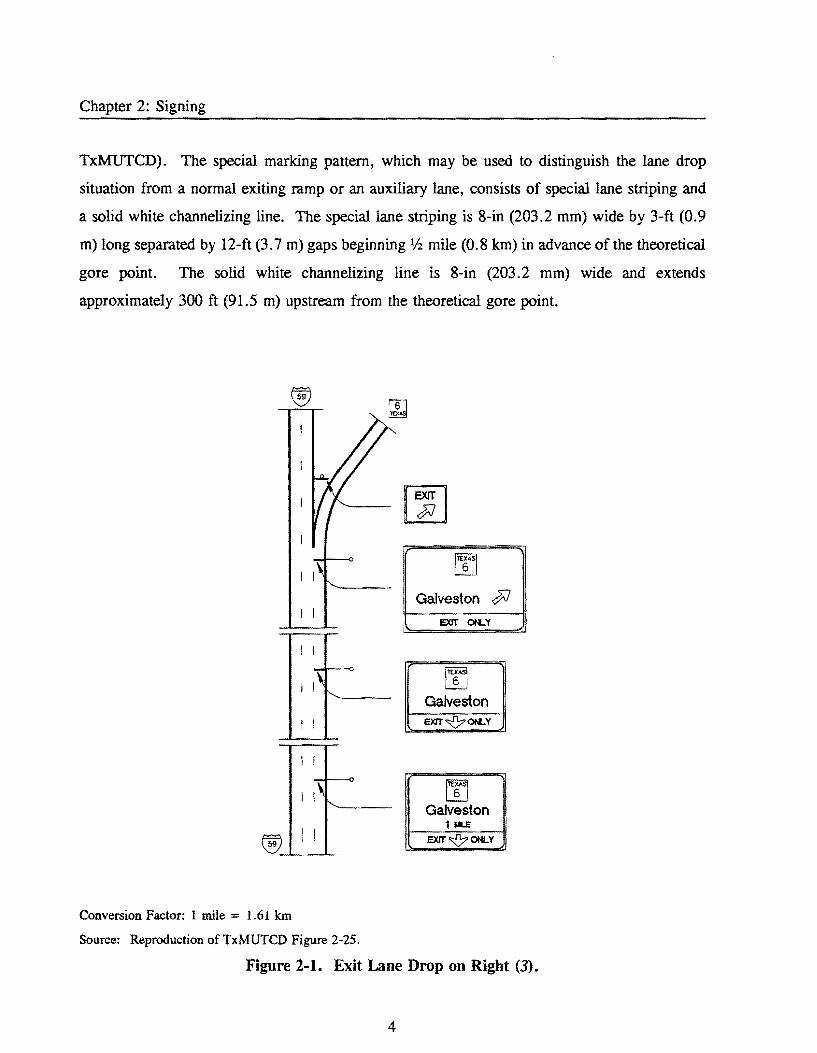
The TxMUTCD states that the EXIT ONLY panel shall be used on guide signs at all
interchange lane drops in which the through route is carried on the mainline. Figure 2-1
illustrates the signs used at a right hand interchange lane drop. The panel has a black legend
on a yellow, reflectorized background. The EXIT ONLY panel with a downward black arrow
is to be used on advance guide signs for right-hand exits (see illustration in Figure 2-1).
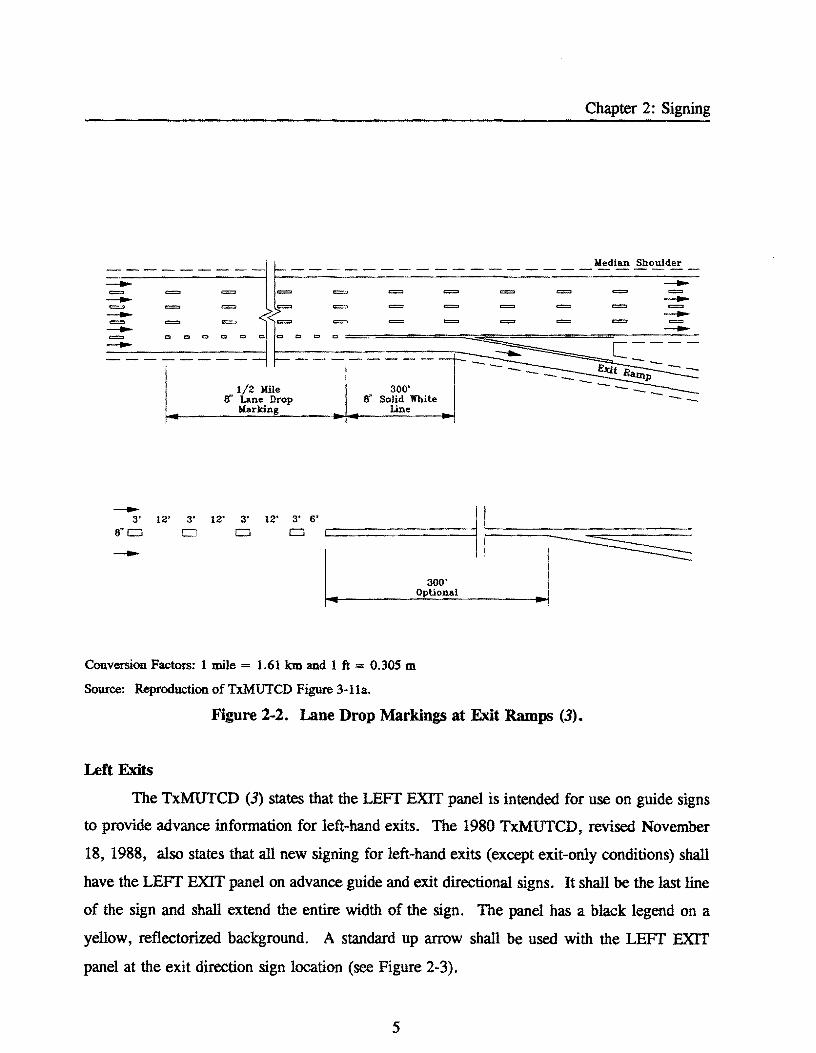
The MUTeD and TxMUTCD contain suggested pavement markings to be used at exit
lane drops. The markings are shown in Figure 2-2 (reproduced from Figure 3-11A in the
3
Chapter 2: Signing
TxMUTCD). The special marking pattern, which may be used to distinguish the lane drop
situation from a normal exiting ramp or an auxiliary lane, consists of special lane striping and
a solid white channelizing line. The special lane striping is 8-in (203.2 mm) wide by 3-ft (0.9
m) long separated by 12-ft (3.7 m) gaps beginning 112 mile (0.8 km) in advance of the theoretical
gore point. The solid white channelizing line is 8-in (203.2 mm) wide and extends
approximately 300 ft (91.5 m) upstream from the theoretical gore point.
~ !ltXAS! i 6
Galveston JJ :\. EXIT ON...Y
I I
W Galveston
I I EXl'TVON...Y
W Galveston
11LE EXIT v ONLY
Conversion Factor: 1 mile = 1.61 km
Source: Reproduction of TxMUTCD Figure 2-25.
Figure 2-1. Exit Lane Drop on Right (3).
4
Chapter 2: Signing
Median Shoulder --------- ~-------------------------- ---= = = = = = = = = = = --- ---= = = >.'F = = = = = = = --- ---= = = < = = = = = = = = --- ---= c CI
0
00
00
000= ~ ------------ i-----------r-_ --...... C __ -- -- EJCit ---- _ Ramp
1/2 Mile 300' - - - -If Lane Drop 8" Solid White
Marking Line
---3' 12' 3' 12' 3' 8"0 0 0
---
Conversion Factors: 1 mile = 1.61 km and 1 ft = 0.305 m
Source: Reproduction of TxMUTCD Figure 3-11a.
Figure 2-2. Lane Drop Markings at Exit Ramps (3).
Left Exits
-- --
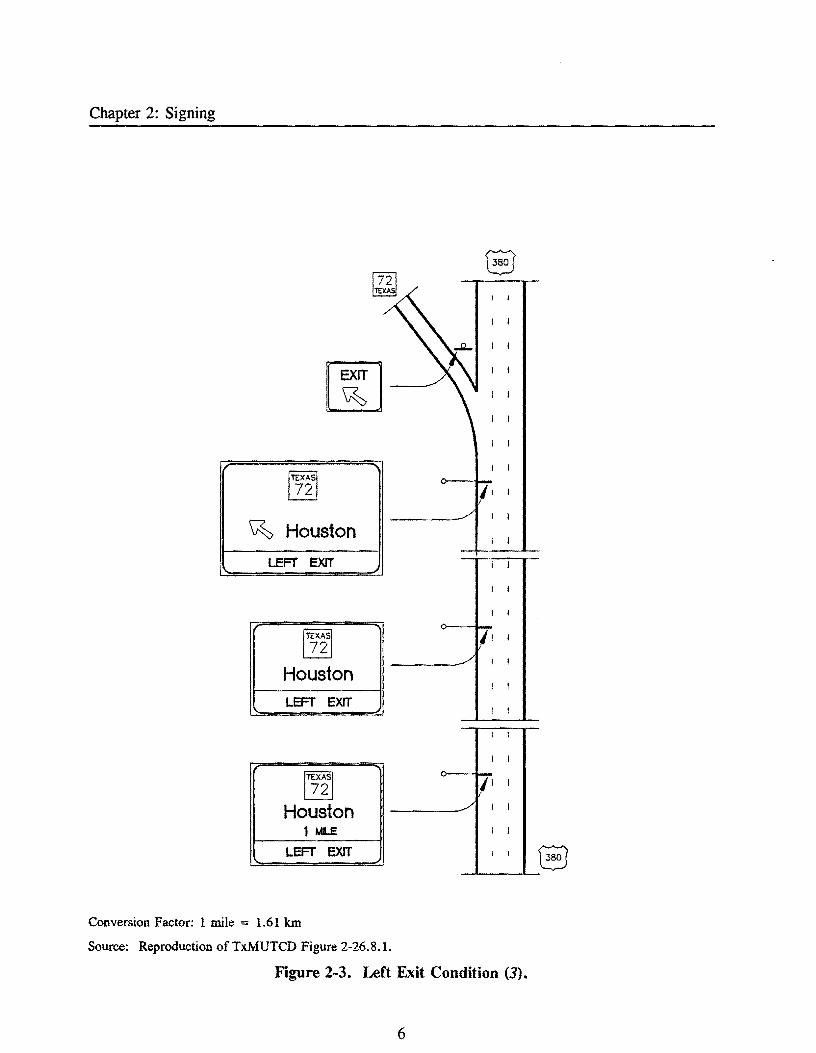
The TxMUTCD (3) states that the LEFT EXIT panel is intended for use on guide signs
to provide advance infonnation for left-hand exits. The 1980 TxMUTCD, revised November
18, 1988, also states that all new signing for left-hand exits (except exit-only conditions) shall
have the LEFT EXIT panel on advance guide and exit directional signs. It shall be the last line
of the sign and shall extend the entire width of the sign. The panel has a black legend on a
yellow, reflectorized background. A standard up arrow shall be used with the LEFT EXIT
panel at the exit direction sign location (see Figure 2-3).
5
Chapter 2: Signing
8 , I
I I
I I
[ID I I
I I
I I
I I
I I
ITEXAsl 72 I I
I I
~ Houston I I
LEFT EXIT I I
I I
I I
ITEXAsl I I
72 I I
Houston I I
LEFT EXIT I I
I I
I , [TEXASI 72 li' ,
Houston ./ I I
1 MLE , , LEFT EXIT I , 8
Conversion Factor: 1 mile = 1.61 km
Source: Reproduction of TxMUTCD Figure 2-26.8.1.
Figure 2-3. Left Exit Condition (3).
6
Chapter 2: Signing
Left Exit Lane Drop Exits
For lane drops on the left side, diagrammatic signing with the EXIT ONL Y panel should
be used without a down arrow for advance guide signs as shown in Figure 2-4. Left-hand exit
only conditions shall retain the signing principles as stated in the previous section on signing of
exit lane drops.
PLACEMENT OF ADVANCE INFORMATION AT LEFT EXITS
A study by Northwestern found that left-hand exit ramps were less efficient operationally
and slightly more hazardous than similarly designed right-hand ramps (5). The researchers cited
signing as the "single most important factor affecting left-hand exit ramp operation." Because
signing is of prime importance, they recommended that directional signs be placed at points 2,
1, Vl, and lA mile (3.2, 1.6, 0.8, and 0.4 km) upstream of the ramp nose.
The Texas Transportation Institute (TTl), in conjunction with several state highway
departments, conducted a study of highway visual communication systems, using a diagnostic
team approach in the late 1960s (6). In addition to developing the diagnostic technique, the
study objectives included the identification of problem areas in visual communication and the
formulation of recommendations to alleviate them. One of the team's comments regarding
exiting on freeways was that driver expectancy plays a critical role in interpretation of
information presented to the driver. The TIl team members identified driver expectancy as a
primary factor in determining the effectiveness of highway visual communication systems.
When the driver expects one situation (a right-hand exit ramp) and encounters another (a left
hand exit ramp), the associated perception reaction time is greatly increased. Therefore, in
unusual situations it is particularly important to present information (e.g., presence of left-hand
ramp) well in advance of the decision point.
7

Chapter 2: Signing
I~I--EXIT 27
NORTHG]
EXIT 27
Lindale
~ Lindale EXIT ONLY
; EXIT ONLY!
" EXIT 27
Lindale 1~
i EXIT ONLY I
Conversion Factor: 1 mile = 1.61 km
Source: Reproduction of TxMUTCD Figure 2-26.9.
.//
I I
II !
./ I !
I !
I I
l I
./ I I
I I
Figure 2-4. Exit Lane Drop on Left with Diagrammatic (3).
8

Chapter 2: Signing
In 1981, Perfater conducted a survey in Virginia to evaluate motorists' understanding of
directional messages (7). Although the survey did not contain questions specifically addressing
guide signing at left exits, respondents were provided space on the questionnaire for any
comments about interstate guide signs. Of the 1,006 respondents, 762, or almost 76 percent,
entered a comment of some type. Approximately 6 percent of those who commented perceived
deficiencies in the signing of left exits. The time needed to change lanes and "move to the left"
was seen as being insufficient. Several participants cited a need for more signs and/or for
diagrammatic signs.
DIAGRAMl\1A TIC SIGNS AT LEFT EXITS
Studies have shown that diagramrnatics are effective in providing advance notice of an
unexpected highway feature (8, 9), for example, when an off-route movement is to the left of
a through-route movement.
In 1972, Roberts conducted a before-and-after study of diagrammatic signs at left exits
(8). The research team selected erratic maneuvers as their method of evaluation for the study.
Erratic maneuvers observed in the "before" fums appeared to be a result of driver confusion due
to inadequate signing and/or road geometry. The findings of the study showed a decrease in the
number of erratic maneuvers at left exits after diagrammatic signs were installed and again after
lane lines were added. The study also indicated some apparent improvements of diagrammatic
signs over standard signs:
• The exit directions are more clearly communicated at more advanced locations, as
well at the most advanced location, at the first sign.
• The number of lanes for a movement can be communicated at the most advanced
point. This may be done through a display of different arrow stem thicknesses and
lane lines.
9
Chapter 2: Signing
• The destination and route number information is more meaningful because it is
matched with the major diagrammatic components of the interchange on all signs.
Motorists do not, therefore, have to infer the match in advance.
• The attention value of the diagrammatic signs in this study seems greater than that
of the conventional sign, perhaps because the arrows add more white area.
In 1972, another diagrammatic signing study developed warrants and standards for the
use of diagrammatic guide signs on controlled access highways (9). The findings of the project
indicated that drivers require more time to read and interpret information on diagrammatic signs
than on conventional signs. Moreover, as the graphic component on the sign becomes more
complex, driver interpretation time increases. Despite these findings, the research results clearly
indicated that diagrammatic guide signs will produce a benefit to motorist performance at
interchanges where traffic must exit to the left of the through route. Such interchanges include
major forks, left exits, and left exits in combination with right exits.
In 1972, Gordon also conducted a study of diagrammatic guide signs at exits with
nontypical geometrics (10). The study sites included a freeway cloverleaf intersection, a lane
drop, a multiple-split ramp, a left ramp downstream from a right, two right ramps in quick
succession, and a major fork. The evaluation included a comparison of diagrammatic and
conventional signs based on the speed and accuracy of the subject's lane selection. The study
results indicated that the conventional signs tested were slightly more effective than the
experimental diagrammatic signs. They produced fewer errors and faster response time than
diagrammatic signs. Although the results would not support the use of diagrammatic signs at
any of the interchanges tested, the author notes that the diagrammatic display of road geometry
may have advantages in certain situations, particularly when the geometry violates drivers'
expectations. Such might be the case at a left exit or an exit lane drop.
10

CHAPTER 3
LITERATURE
An exit ramp is usually located on the right side of the freeway; however, conditions may
cause the designer to recommend a left-hand exit. The effects that these unusual exits have on
traffic characteristics and safety as reported in the literature are discussed in this chapter.
OPERATIONS
Berry et al. (11) conducted a review of the operations on left-hand exit ramps in the early
196Os. They used time-lapse photography at four ramps (three left-hand and one right-hand) to
obtain volume, speed, density, exiting paths, and hazardous maneuvers. The results were used
to support their conclusion that the "left-hand exit ramps studied operate quite satisfactorily. "
The following are some of their findings:
• Left-hand exit ramps on level freeways do not seriously impair the capacity of the
through lanes;
• Left-hand exit ramps do not adversely affect the speeds of vehicles through the exit
area;
• Density of traffic upstream from left-hand exit ramps is not excessive or abnormal
(as compared to similar conditions for right-hand ramps);
• Exiting truck traffic does not degrade the quality of flow on left-side exits, provided
that the exit areas are level and that trucks are not required to keep right; and
• Vehicles enter left-side-exit deceleration lanes very near the beginning of the lanes,
indicating good ramp operations.
A study conducted by Northwestern University (5) in 1969 concluded that use of left
hand exit ramps should be avoided whenever possible. The research included the study of 34
left-hand ramps and 118 right-hand ramps. The study showed that left-hand ramps tend to be
more hazardous. It was also noted that lane changing occurs more frequently in the vicinity of
left-hand ramps than near right-hand ramps. Deceleration in the left lane to exit may cause a
11

Chapter 3: Literature
decrease in the overall operating speeds in the left lane, which is usually the high-speed lane.
Although in many situations left-hand ramps may be more economical with regard to
construction cost, the authors concluded that the losses suffered in terms of operations and safety
will often override this economic advantage.
A 1986 study on driver expectancy (12) tested a number of redundant information sources
at left exit lane drops. The tests were to determine whether additional informational sources
could minimize substantial operational problems. Tests included the following information
sources: a median mounted regulatory sign, "LEFT LANE MUST TURN LEFT, II a black-on
yellow "ONL YII panel on the overhead guide sign; the word "ONLY" with an arrow painted in
the dropped lane; and a different color and texture on the dropped lane. The study
recommended diagrammatic signs with a black-on-yellow EXIT ONLY panel in accordance with
the MUTCD for left exit lane drops.
SAFETY
While the study Berry et al. (11) performed indicated that left exits do not cause major
operational problems, left-side exits do have higher accident rates than similar right-side exits.
In 1961, Fisher made this same conclusion after studying the accident records of several left
and right-side exits (13). Berry proposed several sound reasons why left-side exits were
observed to be more accident-prone; left exits are much less common on today's system than
are right exits, and are not expected by the driver. Despite good signing and delineation, the
exiting driver may be in the right lane at such a time that it is difficult, if not impossible, to
safely exit to the left. Rapid movement across through lanes may cause friction and result in
unsafe conditions. Because of the typically higher speeds in the left lane, drivers in the left lane
who slow before the deceleration lane are often more hazardous than those who slow for a right
side exit.
12
Chapter 3: Literature
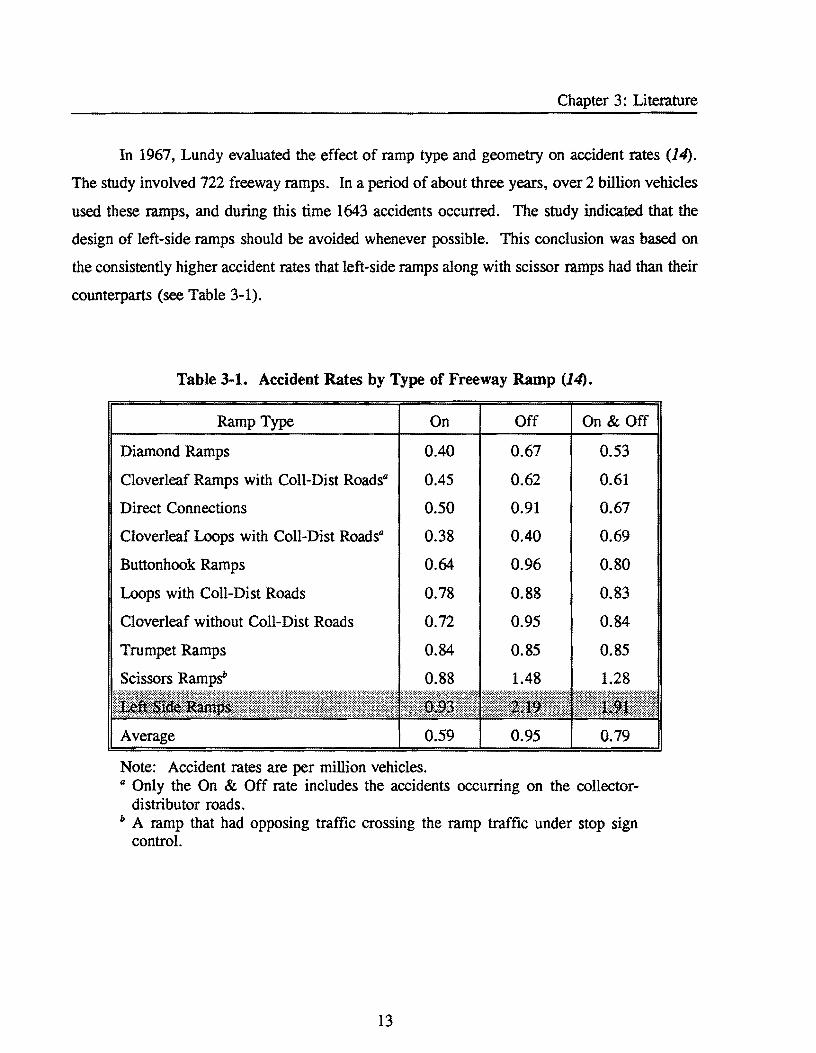
In 1967, Lundy evaluated the effect of ramp type and geometry on accident rates (14).
The study involved 722 freeway ramps. In a period of about three years, over 2 billion vehicles
used these ramps, and during this time 1643 accidents occurred. The study indicated that the
design of left-side ramps should be avoided whenever possible. This conclusion was based on
the consistently higher accident rates that left-side ramps along with scissor ramps had than their
counterparts (see Table 3-1).
Table 3-1. Accident Rates by Type of Freeway Ramp (14).
Ramp Type On Off On & Off
Diamond Ramps 0.40 0.67 0.53
Cloverleaf Ramps with Coll-Dist Roadsa 0.45 0.62 0.61
Direct Connections 0.50 0.91 0.67
Cloverleaf Loops with Coll-Dist Roadsa 0.38 0.40 0.69
Buttonhook Ramps 0.64 0.96 0.80
Loops with Coll-Dist Roads 0.78 0.88 0.83
Cloverleaf without Coll-Dist Roads 0.72 0.95 0.84
Trumpet Ramps 0.84 0.85 0.85
Scissors Rampsb 0.88 1.48 1.28
Note: Accident rates are per million vehicles. a Only the On & Off rate includes the accidents occurring on the collector
distributor roads. b A ramp that had opposing traffic crossing the ramp traffic under stop sign
control.
13
Chapter 3: Literature
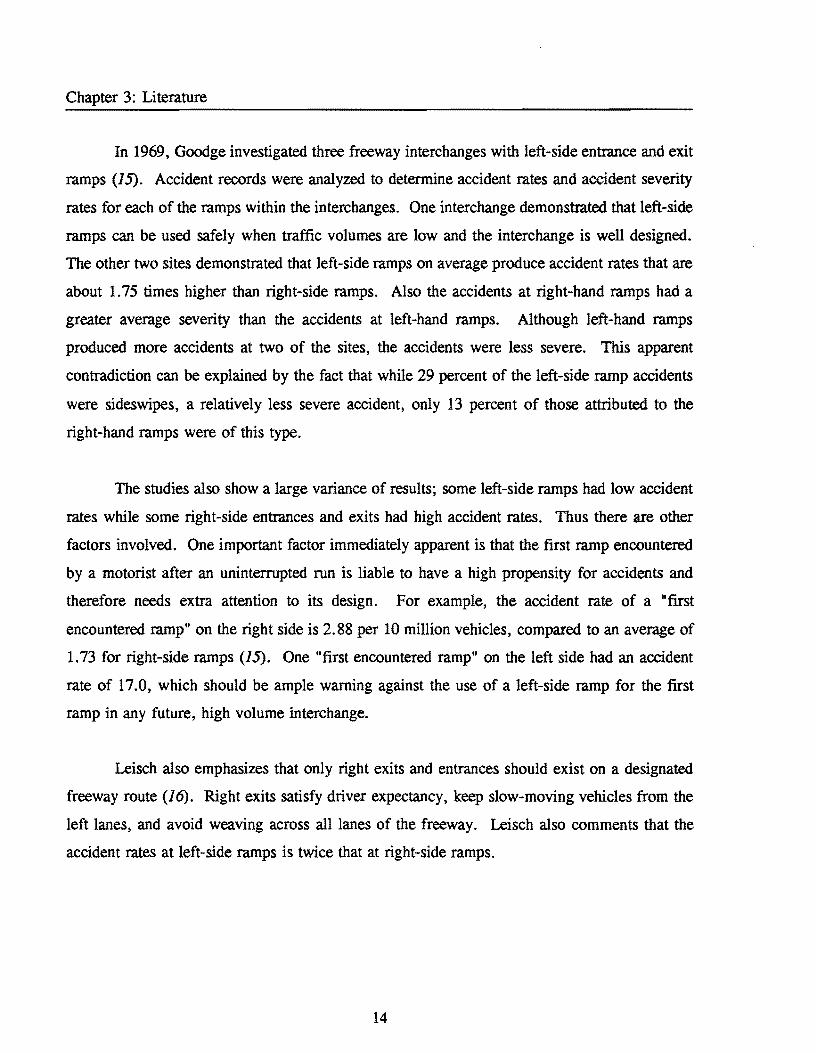
In 1969, Goodge investigated three freeway interchanges with left-side entrance and exit
ramps (15). Accident records were analyzed to determine accident rates and accident severity
rates for each of the ramps within the interchanges. One interchange demonstrated that left-side
ramps can be used safely when traffic volumes are low and the interchange is well designed.
The other two sites demonstrated that left -side ramps on average produce accident rates that are
about 1.75 times higher than right-side ramps. Also the accidents at right-hand ramps had a
greater average severity than the accidents at left-hand ramps. Although left-hand ramps
produced more accidents at two of the sites, the accidents were less severe. This apparent
contradiction can be explained by the fact that while 29 percent of the left-side ramp accidents
were sideswipes, a relatively less severe accident, only 13 percent of those attributed to the
right-hand ramps were of this type.
The studies also show a large variance of results; some left-side ramps had low accident
rates while some right-side entrances and exits had high accident rates. Thus there are other
factors involved. One important factor immediately apparent is that the first ramp encountered
by a motorist after an uninterrupted run is liable to have a high propensity for accidents and
therefore needs extra attention to its design. For example, the accident rate of a "first
encountered ramp" on the right side is 2.88 per 10 million vehicles, compared to an average of
1.73 for right-side ramps (15). One "first encountered ramp" on the left side had an accident
rate of 17.0, which should be ample warning against the use of a left-side ramp for the first
ramp in any future, high volume interchange.
Leisch also emphasizes that only right exits and entrances should exist on a designated
freeway route (16). Right exits satisfy driver expectancy, keep slow-moving vehicles from the
left lanes, and avoid weaving across all lanes of the freeway. Leisch also comments that the
accident rates at left-side ramps is twice that at right-side ramps.
14

CHAPTER 4
FIELD STUDY
This chapter describes the field study that was used to collect information on driver
behavior at a left exit lane drop. The following sections narrate the major activities and discuss
the issues associated with each of the various tasks.
MEASURES OF EFFECTIVENESS
An objective of this study was to determine whether additional pavement markings at left
exit lane drops are an effective method of informing motorists of the exit. To determine the
effectiveness of the additional markings, changes in driver behavior were examined. Driver
behavior in this study was measured using frequency of lane changes and erratic maneuvers, the
positions of these behaviors, and the time of day that these behaviors occurred. A more detailed
description of the measures of effectiveness follows.
Erratic Maneuvers and their Locations
In general, an erratic maneuver consists of any movement that involves a sudden
disruption in the continuity of direction and/or speed of the vehicle, or a deviation from the
traveled path intended by the design and traffic engineers responsible for the geometric
configuration of the exit (17). Erratic maneuvers can occur when the driver is indecisive as to
where to go or how to get there. This indecision may result from several factors, including
misleading or inadequate information in the form of signing, delineation, and geometric design,
or a deficiency in the driver decision-making process. In many cases these factors combine to
cause erratic maneuvers.
In studying erratic maneuvers (rather than traffic flow variables) it was believed that a
positive response to the pavement markings (Le., a decrease in erratic maneuvers) would
improve safety and operations at freeway exit lane drops. Because erratic maneuvers cause
15

Chapter 4: Field Study
disturbances in the traffic flow of both exiting and through vehicles, any obtainable reduction
in traffic flow disturbances would provide for more effective operations.
Lane Changes and their Location
The uniqueness of a lane drop at a left exit could further emphasize a changing situation
to motorists and encourage those drivers who desire to either enter or leave the exit lane to do
so further upstream. To examine this hypothesis, lane change behavior was recorded throughout
the lane drop area. For each lane change the beginning and ending lanes were recorded along
with the location of the lane change with respect to the gore of the exit. The beginning and
ending lanes were recorded to distinguish the difference between vehicles moving into the exit
lane and vehicles moving out of the exit lane. Based on previous observations of lane change
behavior, the location where more drivers are moving into or out of the exit lane(s) is influenced
by the geometry of the site and/or the level of congestion present (18).
SITE SELECTION
The site selection was based upon the following: geometric design, accessibility, traffic
volumes, current signing, and pavement markings. The lane drop selected for this evaluation
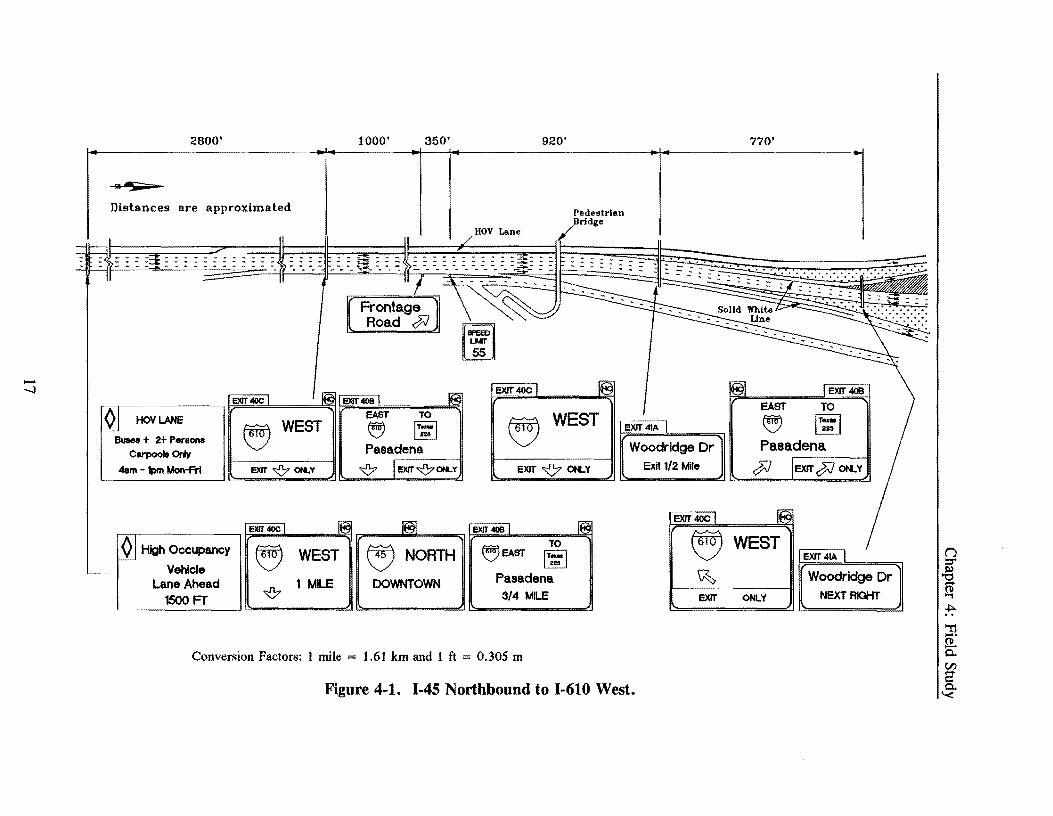
was a one-lane, left exit located in Houston, Texas. This exit is located on the 1-45 Northbound
freeway, at the interchange with 1-610 West, south of downtown. Figure 4-1 is a schematic of
the site. The length of the dropped lane is greater than 5 miles (8.05 Ian). Approximately 400
ft (122 m) prior to the left exit lane drop, an exit lane drop occurs on the right side of the
freeway. The median contains a high-occupancy vehicle (HOV) lane.
The site has several factors that could influence driver behavior, such as the fact that it
is a left exit lane drop within a high volume freeway. For 1992, the average annual daily traffic
along this corridor was 202,000. This section frequently experiences low speeds and noticeable
delays during the a.m. period. Although the nearest entrance or exit ramp on the left side of
the freeway is the entrance ramp to the HOV lane which is located 3,800 ft (1159 m) upstream
16
2800' 1000' 350' 920'
!II ""Si:>=
Distances are approximated
HOV Lane
EXIT .<COC 1 I«<; EXIT 409 I ~ EXrr400 1 I@
HOVLANE EAST TO
~ WEST ~ I~I ~
WEST + 2+ Peraona
Carpoole Only Pasadena m-lmIMon-Fri EXIT V ON..Y V IEXrrVON..Y Exrr ~ ON..Y
.. .,--------, I?E~lOT:..;;:.<COC;.;;.&. __ ~~ r,;--~"'=-......, I?ElOT ....... 4OB~ ___ ......I~
¢ High Occupancy
Vehicle Lane Ahead
1500 FT
WEST ~ NORTH
1 MILE DOWNTOWN
~EAST ~ Pasadena 3/4 MILE
Conversion Factors: 1 mile = 1.61 km and 1 ft = 0.305 m
770'
@l EXIT 40B
I EAST TO
EXlT41A I ~ IT;I Woodridge Dr Pasadena
Exit 1/2 Mile JJ
EXIT 400
~ WEST
~ EXrr ONLY
I EXIT JJ ON..Y
EXIT 41A
Woodridge Dr NEXT RIGHT
Figure 4-1. 1-45 Northbound to 1-610 West.
Chapter 4: Field Study
of the lane drop, motorist behavior at the site could be influenced by exit and entrance ramps
on the right side of the freeway.
A two-lane, exit lane drop with an optional lane occurs on the right side of the freeway
400 ft (122 m), upstream of the exit being studied. An exit ramp to the frontage road also
occurs on the right side of the freeway, 1,440 ft (439.2 m) upstream of the left exit lane drop.
These right-side exit ramps should have little effect on the operations at the left exit lane drop.
A more likely influence is the entrance ramp on the right side of the freeway, located 4,400 ft
(1342 m) upstream of the left exit lane drop. This entrance ramp could effect traffic operations
because motorists entering the freeway that desire to take the left exit would have to merge
across three lanes of traffic in a relatively short distance.
Five green guide signs announcing the 1-610 West exit lane drop precede the exit. The
first two signs, occurring 2 miles (3.2 km) and 1 mile (1.6 km) before the exit as stated on the
signs, do not contain the black-on-yellow EXIT ONLY panel; however, the second sign does
contain a downward arrow over the left-most lane. The third, fourth, and fifth signs contain the
black-on-yellow EXIT ONLY panels over the exit lane. Downward pointing arrows on the third
and fourth sign, and an upward arrow on the fifth (last) sign are displayed over the left lane.
The pavement markings existing prior to this study consisted of a solid white line between the
exiting lane and the adjacent lane beginning approximately 250 ft (76.3 m) prior to the gore and
typical dashed lane lines throughout the remainder of the study section. The signs and original
markings at the site are illustrated in Figure 4-1.
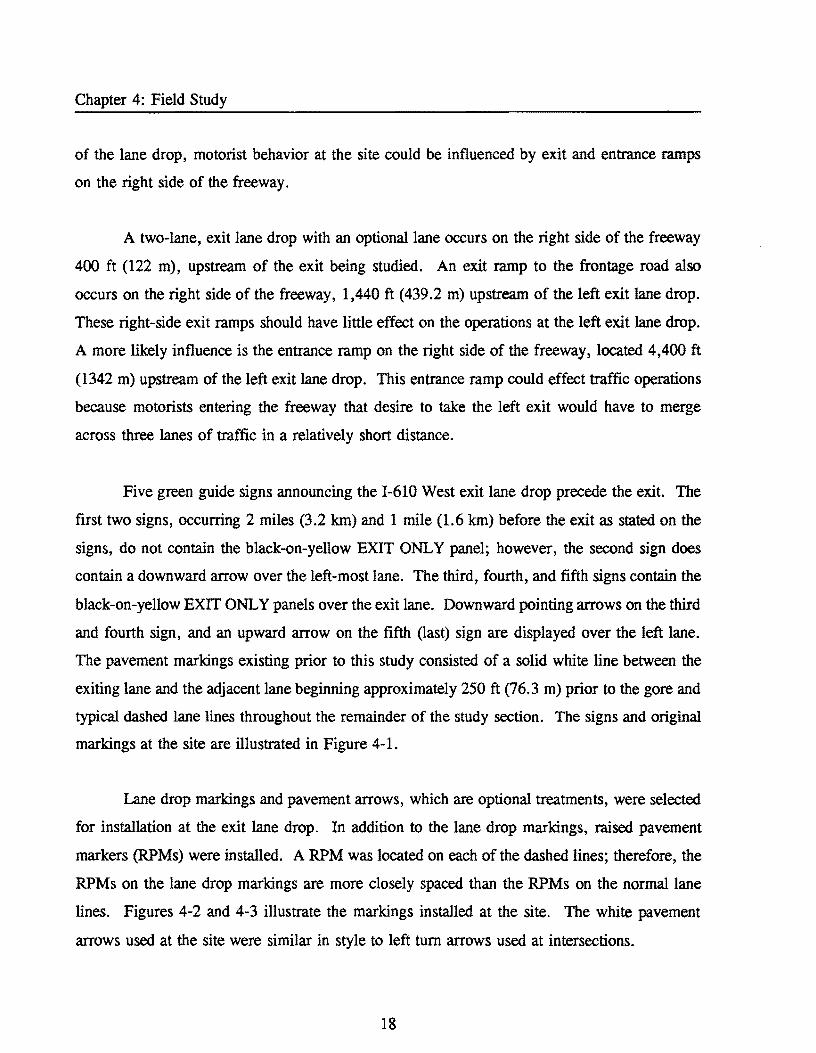
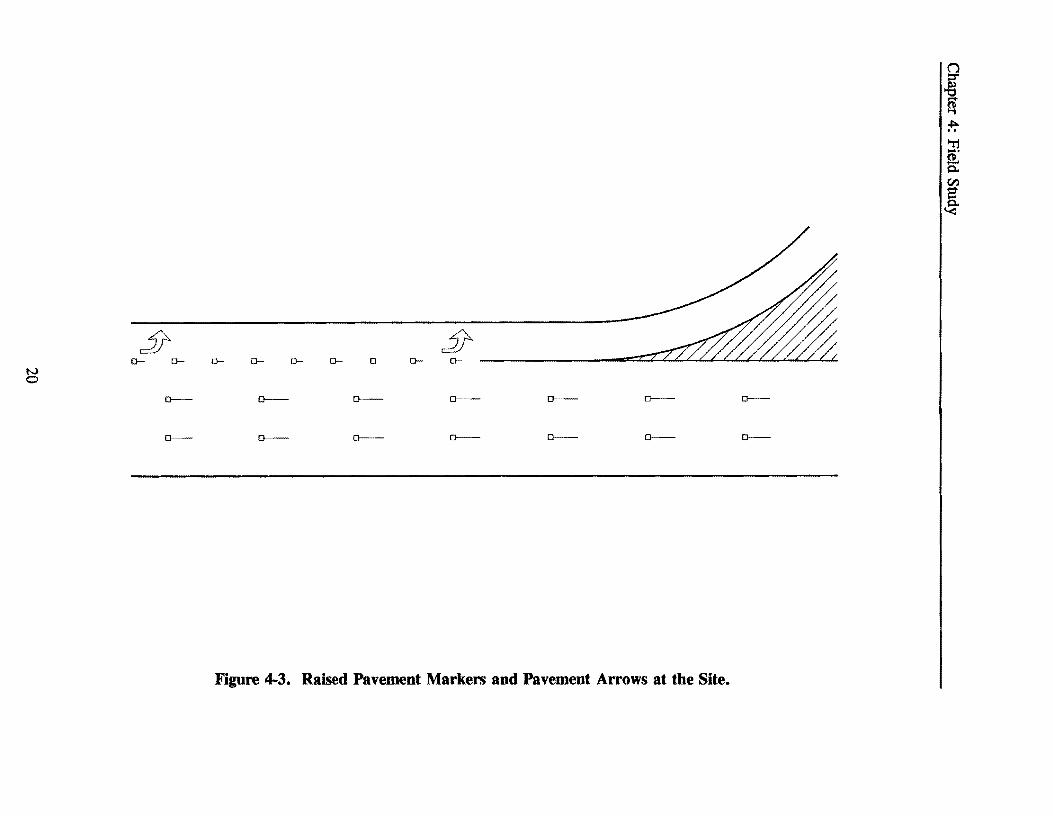
Lane drop markings and pavement arrows, which are optional treatments, were selected
for installation at the exit lane drop. In addition to the lane drop markings, raised pavement
markers (RPMs) were installed. A RPM was located on each of the dashed lines; therefore, the
RPMs on the lane drop markings are more closely spaced than the RPMs on the normal lane
lines. Figures 4-2 and 4-3 illustrate the markings installed at the site. The white pavement
arrows used at the site were similar in style to left turn arrows used at intersections.
18
Q
Lane Drop Markings (8" wide, 3' long with 12' spacing) beginning at end of solid white line and extending 2750'
420'
Pedestrian Bridge
HOV Lane ~ _ ~ w • _ _-.::.; _ _ _ _
- - -------- - -• --=.,.; • • - -
~ - Five white pavement marking arrows spaced at 300 ft, starting at end of solid white line
Distances are approximated
Conversion Factor: ] ft = 0.305 m
775'
8" Solid White Line (300' long)
Figure 4-2. Lane Drop Markings Installed at the Site.
:ft :ft 0- 0- 0- 0- 0- 0- 0- 0- 0-
N 0
0-- 0-- 0-- 0-- 0--
0-- 0-- 0-- 0-- 0-- 0--
Figure 4-3. Raised Pavement Markers and Pavement Arrows at the Site.
Chapter 4: Field Study
DATA COLLECTION
Data collection began with an inventory of the treatments currently being used at the site
and recognition of other factors that may influence motorist behavior at the exit lane drop. Lane
change and erratic maneuver data were collected for 1,500 ft (457.5 m) upstream of the lane
drop gore both before and after the markings are installed. Closed circuit video cameras
equipped with special wide angle and zoom lenses were used to allow optimum recording. The
cameras were mounted in the field on overhead sign structures and appeared to be undetectable
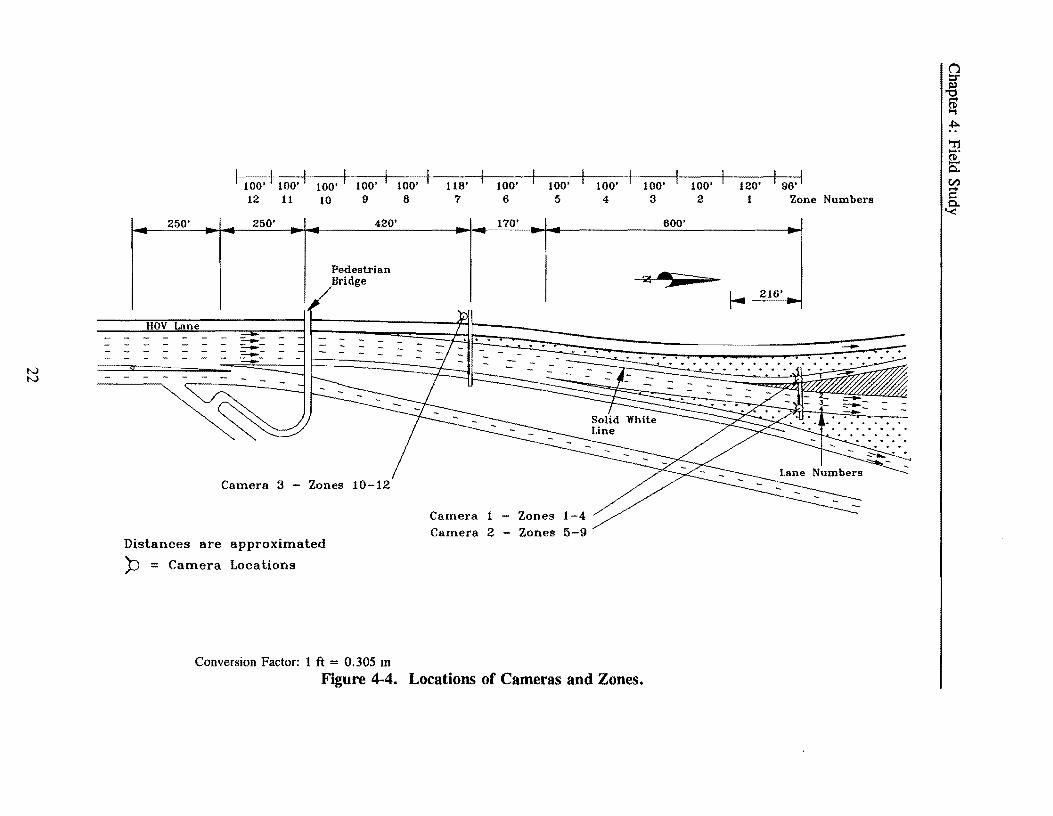
by passing motorists. Three cameras were installed at the site as shown in Figure 4-4. Two
cameras were mounted on the overhead sign structure directly over the gore area. One of the
cameras was focused near the gore area, while the other camera was focused upstream of the
gore. The third camera was positioned on the overhead sign structure located 775 ft (236.4 m)
upstream of the gore area. The before data was filmed during March, 1993 and the after filming
occurred during the month of November, 1993.
Data were collected for approximately one full week excluding weekends. Six hour
recording intervals were selected on time lapse VCRs. This recording period allowed extended
recording lengths at an acceptable frame-by-frame speed. Technicians started the recording
process between 6:00 and 7:00 a.m., and then returned six hours later to change VHS tapes for
an additional six hours of recording. Additional tapes were used to record evening operations
(from 6:00 to 10:00 p.m.) on two days during the after period.
DATA REDUCTION
The data reduction process began by subdividing the 1,500-ft (457.5 m) study length into
segments of approximately uniform length. These uniform segments are called "zones."
Rumble strips on the right shoulder that were generally spaced at loo-ft (30.5 m) increments
were used to delineate the zones. The zones were numbered, beginning with Zone 1 at the gore
and continuing upstream. All zones were 100 ft (30.5 m), except Zone 1 and 7 which were 120
ft (36.6 m) and 118 ft (36.0 m), respectively. Figure 4-4 illustrates the zone locations at the
21
IV IV
I 100' 1100, I 100' I 100' I 100' 12
250' 250'
HOV Lane
Q
11 10 9
420'
Pedestrian Bridge
Camera 3 - Zones 10-12
Distances are approximated
p = Camera Locations
Conversion Factor: 1 ft = 0.305 m
8 118'
7 100'
6
170'
100' 5
Camera 1 - Zones 1-4 Camera 2 - Zones 5-9
100' 4
Figure 4-4. Locations of Cameras and Zones.
100' I 100' 3 2
600'
120' 1
196. 1 Zone Numbers
216'
Chapter 4: Field Study
site. Each lane was also labeled, beginning with the exit only lane as Lane 1, and the adjacent
lane as Lane 2. Three types of data were collected from the video tapes: lane changes, erratic
maneuvers, and volume counts. The data were reduced in I5-minute intervals.
Lane Change Data
A lane change was recorded if a vehicle either entered or exited the exit-only lane.
Therefore, moves from Lane 1 into Lane 2, from Lane 2 into Lane 1, from Lane 1 into Lane
3, or from Lane 3 into Lane 1 were recorded. For each lane change the beginning and ending
lanes were recorded along with the zone from which the lane change originated. The zone from
which the lane change originates is defined as the zone in which the vehicle's front wheel first
crosses over the pavement markings separating the lanes.
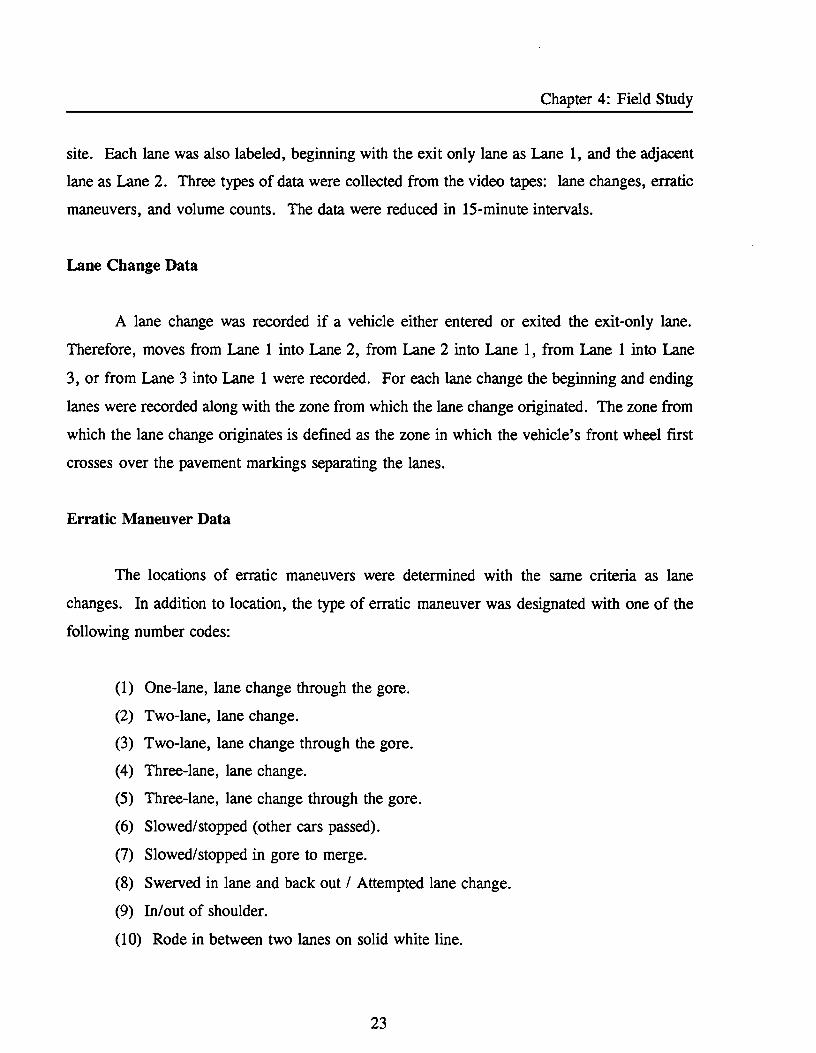
Erratic Maneuver Data
The locations of erratic maneuvers were determined with the same criteria as lane
changes. In addition to location, the type of erratic maneuver was designated with one of the
following number codes:
(1) One-lane, lane change through the gore.
(2) Two-lane, lane change.
(3) Two-lane, lane change through the gore.
(4) Three-lane, lane change.
(5) Three-lane, lane change through the gore.
(6) Slowed/stopped (other cars passed).
(7) Slowed/ stopped in gore to merge.
(8) Swerved in lane and back out / Attempted lane change.
(9) In/out of shoulder.
(10) Rode in between two lanes on solid white line.
23
Chapter 4: Field Study
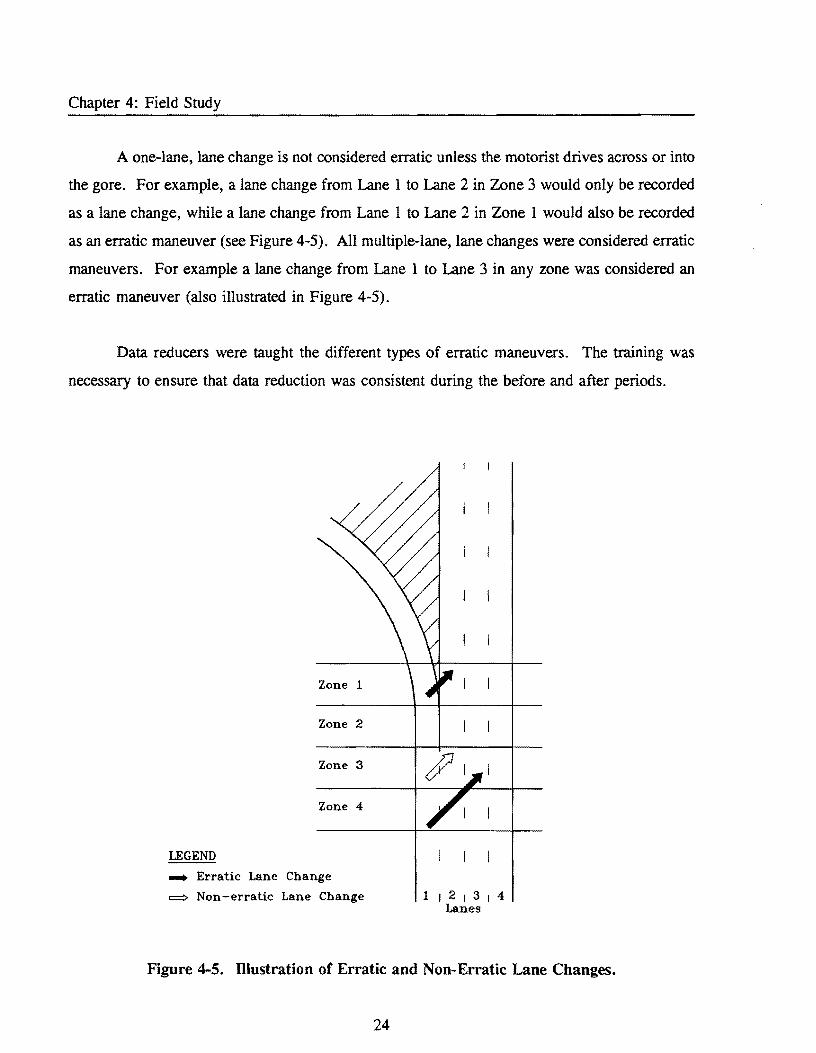
A one-lane, lane change is not considered erratic unless the motorist drives across or into
the gore. For example, a lane change from Lane 1 to Lane 2 in Zone 3 would only be recorded
as a lane change, while a lane change from Lane I to Lane 2 in Zone 1 would also be recorded
as an erratic maneuver (see Figure 4-5). All multiple-lane, lane changes were considered erratic
maneuvers. For example a lane change from Lane 1 to Lane 3 in any zone was considered an
erratic maneuver (also illustrated in Figure 4-5).
Data reducers were taught the different types of erratic maneuvers. The training was
necessary to ensure that data reduction was consistent during the before and after periods.
Zone 2
Zone 3
Zone 4
LEGEND
... Erratic Lane Change
=:::> Non-erratic Lane Change
Figure 4-5. IHustration of Erratic and Non-Erratic Lane Changes.
24
Chapter 4: Field Study
Traffic Counts
So that lane change rates and erratic maneuver rates could be determined, exiting and
through traffic volumes were obtained from the video tapes. The volumes were recorded for
each freeway lane for a minimum of 15 minutes at the beginning of each hour. The vehicles
were counted as they passed the point of the painted gore. All vehicle types were recorded.
Compilation of Data
Once the information was extracted from the video tapes, the data were entered into
computer spreadsheets. A spreadsheet was created for each zone. The entries in the
spreadsheets included the actual time interval reduced, the lane change count, and the erratic
maneuver count for that particular IS-minute interval. The data were adjusted to IS-minute
intervals and IOO-ft (30.5 m) zone lengths with ratios if the actual time intervals reduced were
less than 15 minutes or if the zone length was not 100 ft (30.5 m). The adjusted data were then
averaged for each IS-minute period and summarized by total number of lane changes or erratic
maneuvers for all hours, and typical number of lane changes or erratic maneuvers per hour for
each zone. Once the lane change and erratic maneuver data were obtained for each zone, the
next step was to combine the individual zone data into one file.
DATA ANALYSIS/EVALUATION
Observations of lane change behavior in the field, and findings from other studies indicate
that the location where more drivers are moving into or out of the exit lane could be a
characteristic of the geometry of the site or of the level of congestion at the site. To address
this issue, the difference in the number of vehicles moving into the exit lane and the number of
vehicles moving out of the exit lane were also calculated. Since the site had high volumes with
noticeable levels of congestion, comparisons between peak and non-peak periods were made.
25
Chapter 4: Field Study
Graphs representing the calculated number of lane changes and erratic maneuvers per
hour by zone were used to evaluate the findings. Initially, the findings were plotted by the 100-
ft (30.5 m) increments used to reduce the data. The data were then aggregated into 3oo-ft (91.5
m) zone groups to reduce data variability. The data were also evaluated using appropriate
statistical tests.
The concluding step of the evaluation used all available resources, such as site
characteristics, plots, numeric values, and results from the statistical evaluations, to draw
observations and then conclusions for the study.
RESULTS
This section presents the results of the study, including volume counts, and a summary
of motorists' lane change behavior and erratic maneuver behavior throughout the lane drop area.
Both before and after data are presented for daylight and evening operations. The statistical
evaluations of the data are also contained in this section.
Volume Counts
The freeway hourly volumes during daylight operations (see bottom of Table 4-1)
illustrate the high volume nature of the site, especially in the number of vehicles exiting. Over
1,700 vehicles in a typical hour used the left exit. The numbers of vehicles exiting per hour
ranged between 1,370 and 2,100 during the before study period, and between 1,320 and 2,190
during the after study period. While the exiting volumes appear to be extremely high for a
freeway lane, the exit does become a new lane on the 1-610 freeway. The vehicles exiting are
not required to merge for several miles with other traffic downstream of the lane drop gore.
The evening (6:00 p.m. to 9:00 p.m.) hourly volumes were about 30 percent lower than
the daylight (7:00 a.m. to 5:00 p.m.) hourly volumes (see Tables 4-1 and 4-2). The average
number of vehicles exiting per hour during daylight operations was approximately 1,700 for both
26

Chapter 4: Field Study
the before and after time periods. The average number of vehicles exiting per hour during
evening operations was approximately 1,050 during both the before and after time periods.
When comparing changes in driver behavior in a before-and-after study, potential
influences, other than the items being studied, should be investigated to determine whether they
affect the results. One way to detect other potential influences is to determine whether traffic
volumes are similar from the before period to the after period. To compare the before-and-after
traffic volumes during both daylight and evening operations, an analysis of variance statistical
model was used with a confidence level of 0.05. The test showed that the volumes were
statistically equal; therefore, there were no significant differences in the before and after traffic
volumes for either the daylight or evening operations.
Table 4-1. FIfteen Minute Volume Counts-Daylight Hours.
Time Before Volumes After Volumes
Ll L2 L3 L4 L1 L2 L3 L4
7:00-7:15 526 445 499 402 522 436 452 448 8:00-8:15 525 433 479 416 535 392 412 459 9:00-9:15 343 388 395 351 397 365 368 243 10:00-:15 354 243 329 220 360 365 332 234 11:00-:15 350 363 359 208 330 368 354 220 12:00-:15 367 360 353 224 368 326 342 234 1:00-1:15 382 368 360 245 382 352 372 237 2:00-2:15 435 372 361 246 392 336 348 222 3:00-3:15 425 380 387 264 432 334 356 236 4:00-4:15 502 339 339 259 463 370 384 248 5:00-5:15 490 363 384 266 548 341 356 273
Average 427 369 386 282 430 362 371 278 of counts
Hourly 1708 1474 1543 1126 1720 1449 1482 1111 Volume
Note: L1 = Lane 1; represents the exit-only lane L2 = Lane 2; represents the lane adjacent to Lane 1 L3 = Lane 3; represents the lane adjacent to Lane 2 L4 = Lane 4; represents the right-most lane
27

Chapter 4: Field Study
Table 4-2. Fifteen Minute Volume Counts-Evening Hours.
Before Volumes
Time L1 L2 L3 U Ll
6:00-6:15 370 356 352 237 393 7:00-7:15 240 245 262 155 238 8:00-8:15 230 182 204 148 246 9:00-9:15 208 182 189 113 209
Average of 262 241 252 163 264 counts
Hourly 1048 965 1007 653 1056 Volume
Note: L1 = Lane 1; represents the exit-only lane L2 = Lane 2; represents the lane adjacent to Lane 1 L3 = Lane 3; represents the lane adjacent to Lane 2 U = Lane 4; represents the right-most lane
Erratic Maneuvers
After Volumes
L2 L3 U
342 330 215 257 243 168 172 202 141 178 191 111
237 242 159
949 966 635
As might be expected, the majority of the erratic maneuvers near the gore were of the
"cross gore" variety. The more dangerous maneuvers, such as backing or stopping in the gore
area, occurred less often.
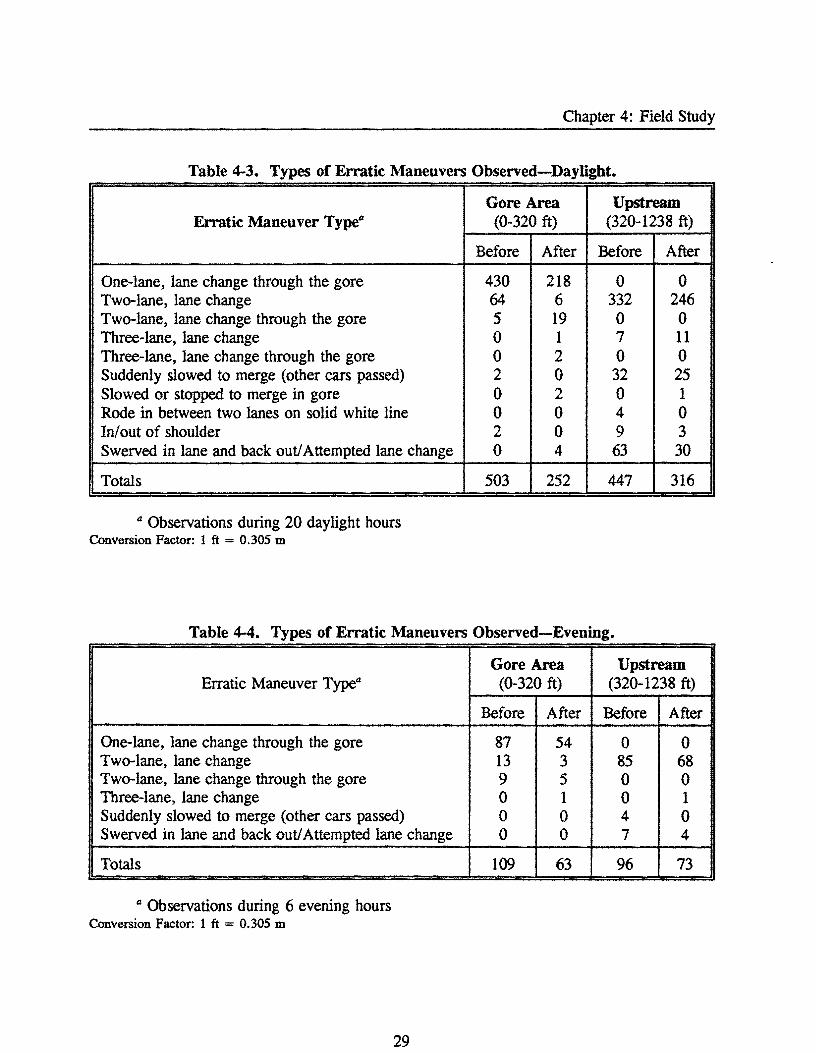
In the before data the largest number of erratic maneuvers occurred within 300 ft (91.5
m) of the gore (see Table 4-3 for daylight and Table 4-4 for evening). In the before data over
half (53 percent) of the erratic maneuvers occurred in Zones 1, 2, and 3, with most occurring
in Zone 1 (see Figure 4-6). A large number of erratic maneuvers also occurred within 300 ft
(91.5 m) of the gore during the after period. Approximately 45 percent of the erratic maneuvers
during the after period occurred in Zones 1, 2, and 3 (see Figure 4-6). The predominant type
of erratic maneuvers within 300 ft (91.5 m) of the gore was the lane change through the gore
area. The number of erratic maneuvers within 300 ft (91.5 m) of the gore was reduced 50
percent between the before and after periods during daylight operations (see Table 4-3), and by
42 percent during evening operations (see Table 4-4).
28
Chapter 4: Field Study
Table 4-3. Types of Erratic Maneuvers Observed-Daylight.
Erratic Maneuver TypeQ
One-lane, lane change through the gore Two-lane, lane change Two-lane, lane change through the gore Three-lane, lane change Three-lane, lane change through the gore Suddenly slowed to merge (other cars passed) Slowed or stopped to merge in gore Rode in between two lanes on solid white line Inlout of shoulder Swerved in lane and back out! Attempted lane change
Totals
Q Observations during 20 daylight hours Conversion Factor: 1 ft = 0.305 m
Gore Area (0-320 ft)
Before After
430 218 64 6 5 19 0 1 0 2 2 0 0 2 0 0 2 0 0 4
503 252
Upstream (320-1238 ft)
Before After
0 0 332 246
0 0 7 11 0 0
32 25 0 1 4 0 9 3
63 30
447 316
Table 4-4. Types of Erratic Maneuvers Observed-Evening.
Erratic Maneuver TypeQ
One-lane, lane change through the gore Two-lane, lane change Two-lane, lane change through the gore Three-lane, lane change Suddenly slowed to merge (other cars passed) Swerved in lane and back out! Attempted lane change
Totals
Q Observations during 6 evening hours Conversion Factor: 1 ft = 0.305 m
29
Gore Area (0-320 ft)
Before After
87 54 13 3 9 5 0 1 0 0 0 0
109 63
Upstream (320-1238 ft)
Before After
0 0 85 68 0 0 0 1 4 0 7 4
96 73
DAY EVENING
30 30
Ul g;:; 25 W
f;g;:; 20 wp
~~ 15
uQ:: e::~ 10 ~ Q:: W
5
0
~ ;
m ~ ~ ~
m. i
Ul g;:; 25 w :> pg;:;
20 wp
~~ 15
uQ:: ..... w e-<Q..
10 < Q:: Q:: W
5
0 12-10 9-7 6-4 3-1 12-10 9-7 6-4 3-1
ZONE GROUPS ZONE GROUPS VJ 0
16 16
Ul 14
Q::
~Q:: 12
wp 10 Zo ~:x:: 6
VJ 14
Q::
~Q:: 12
wp 10 Zo ~:x:: 8
uQ:: 6 ..... w
e-<Q.. '< 4 Q:: Q:: w 2
0
---
I,~n<=-m- ~ rrm-tm -
uQ:: 6 .... w
e-<Q..
~ 4 Q:: w
2
0
-h 1 -1&"1",,- rl 1~~~11
12 11 10 9 8 7 6 5 4 3 2 12 11 10 9 8 7 6 5 4 3 2 1
ZONES
~ BEFORE DATA c::::J AFTER DATA I ZONES
Figure 4-6. Erratic Maneuvers Per Hour Per Zone.
Chapter 4: Field Study
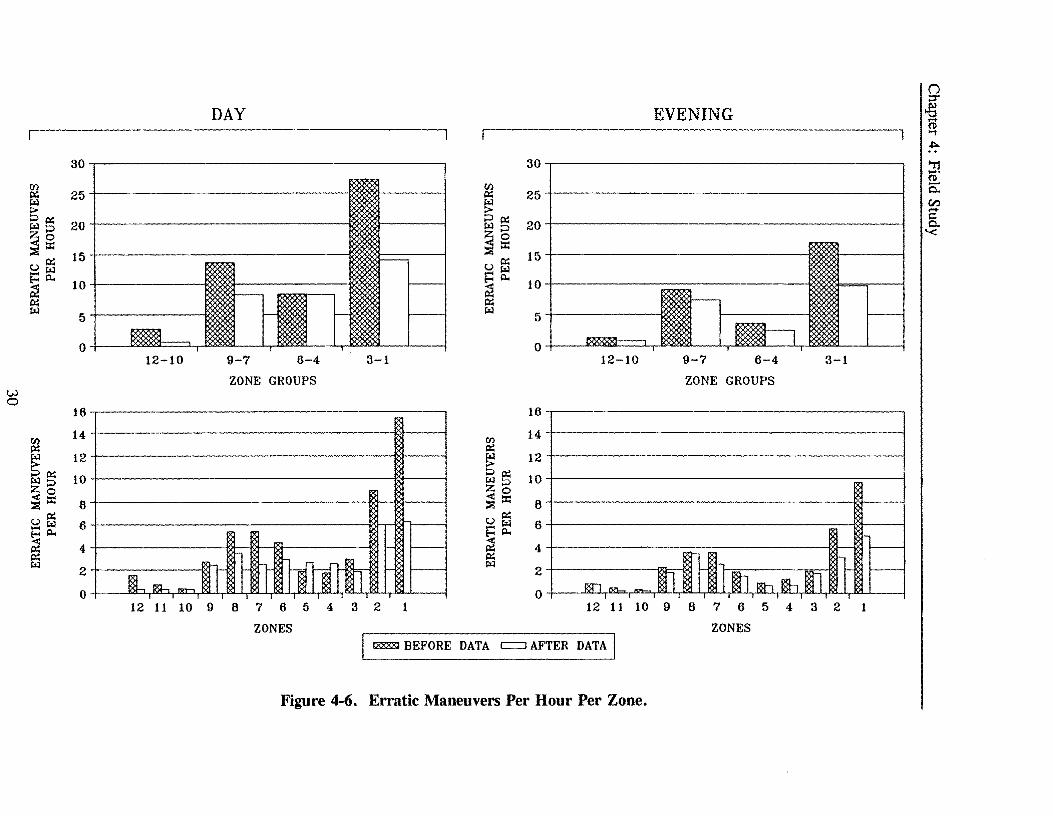
Although erratic maneuvers commonly occur in the vicinity of the gore area, the cause
of the erratic maneuver may not be associated with the gore area. For example, a motorist
might stop in the gore area because of confusion by the directional legend at the first advance
exit sign. The driver's confusion and indecision did not manifest itself until the occurrence of
the erratic maneuver in the gore area.
The most common type of erratic maneuver upstream of the gore area was the two-lane,
lane change (see Tables 4-3 and 4-4). A number of congestion-related erratic maneuvers were
also observed. Some drivers suddenly slowed in an attempt to position for a lane change, while
others attempted but failed to make a lane change. Upstream of the gore the number of erratic
maneuvers was reduced by 30 percent between the before and after periods during daylight
operations (see Table 4-3), and by 25 percent during evening operations (see Table 4-4).
By examining the erratic maneuvers per hour by zones during daylight operations (Figure
4-5) one sees an overall reduction in erratic maneuvers throughout the lane drop area. Only
Zones 4 and 5 contain a slight increase in erratic maneuvers during the after period. The
evening plots appear to follow the same trends as the daylight plots except the erratic maneuvers
in Zones 4 and 5 do not increase during the after period. Considering the entire lane drop area,
erratic maneuvers were reduced from the before period to the after period by 40 percent during
daylight operations, and by 34 percent during evening operations.
Lane Changes-Frequency
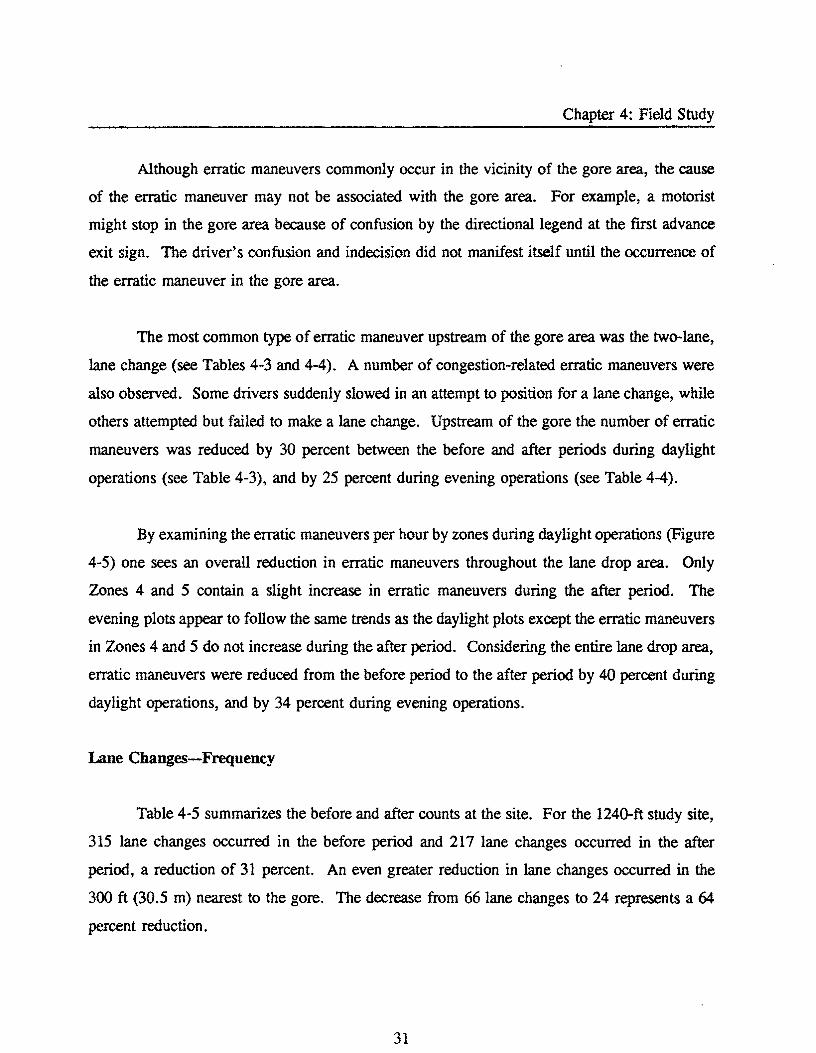
Table 4-5 summarizes the before and after counts at the site. For the 124Q-ft study site,
315 lane changes occurred in the before period and 217 lane changes occurred in the after
period, a reduction of 31 percent. An even greater reduction in lane changes occurred in the
300 ft (30.5 m) nearest to the gore. The decrease from 66 lane changes to 24 represents a 64
percent reduction.
31
Chapter 4: Field Study
Table 4-5. Comparison of Before-and-After Data.
Characteristics 1-45 Northbound to 1-610 West
Zones used in comparison Zones 1-12
Equil. length of study site 1240 ft
Time used in comparison 7: 15 a.m. to 6:00 p.m. 6:00 p.m. to 9:00 p.m.
Light Condition DAYLIGHT EVENING
Before After Change Before After Change
Freeway hourly volumea 5851 5761 -2% 3672 3605 -2%
Hourly volume exiting· 1708 1720 1% 1048 1056 1%
Total study length Lane Changesb 315.0 217.0 -31 % 234.0 158.0 -32% Erratic Maneuversb 51.0 31.0 -39% 32.0 21.0 -34%
For 300-ft nearest to gore Lane Changesb 66.0 24.0 -64% 42.0 14.0 -67% Erratic Maneuversb 27.0 14.0 -48% 17.0 10.0 -41%
RateC (1Q-6/ftlveh) Lane Changes 43.43 30.38 -30% 51.39 35.35 -31 % Erratic Maneuvers 6.55 3.98 -39% 7.03 4.7 -33%
a Freeway hourly volumes were measured prior to gore and represent the average of the time periods used in the comparison.
b Values represent an average 6O-minute period for the time periods used in the comparison.
C Rates were determined by dividing the number of lane changes, or erratic maneuvers, in an hour by study length and freeway hourly volume, and multiplying by 1,000,000.
Conversion factor: 1 ft = 0.305 m
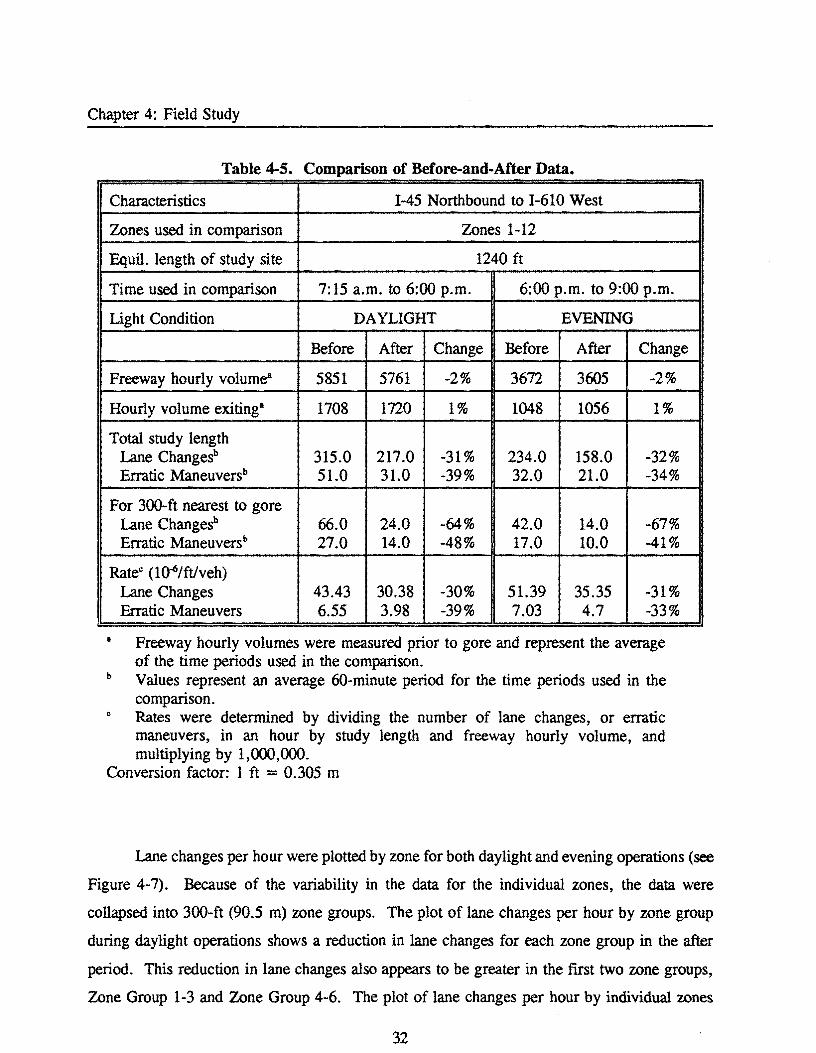
Lane changes per hour were plotted by zone for both daylight and evening operations (see
Figure 4-7). Because of the variability in the data for the individual zones, the data were
collapsed into 300-ft (90.5 m) zone groups. The plot of lane changes per hour by zone group
during daylight operations shows a reduction in lane changes for each zone group in the after
period. This reduction in lane changes also appears to be greater in the fIrst two zone groups,
Zone Group 1-3 and Zone Group 4-6. The plot of lane changes per hour by individual zones
32
120
100 en ~ co:: z::> <0
80
:x:::x:: u 60 0:: ~~ zo.. :s 40
20
0
w w 40
35
en 30 ~ co:: Z::>
25 <0 :X:::X:: u
0:: 20 ~~
~o.. 15
10
5
DAY EVENING
120
100 en ~ co:: z::> <0
80
:x:::x:: u 60 0:: ~~ zo..
40 :s 20
0 12-10 9-7 6-4 3-1 12-10 9-7 6-4 3-1
ZONE GROUPS ZONE GROUPS
40
35 en 30 ~ co:: z::> <0 25 :x:::x::
-u ~~ 20
~o.. 15
1 n h
10
5 1 1 -I n 12 11 10 9 8 7 6 5 4 3 2 1 12 11 10 9 8 7 6 5 4 3 2 1
ZONES ~ BEFORE DATA c::::J AFTER DATA I
Figure 4-7. Lane Changes Per Hour Per Zone.

Chapter 4: Field Study
reveals that the lane changes per hour actually increased in Zones 8, 9, and 11, during the after
period. Overall, a substantial reduction (approximately 45 percent) in lane changes per hour in
Zones 1-7 occurred, with fluctuations in the remaining zones (Zones 8-12).
The evening plots yielded similar patterns (see Figure 4-7). The evening plot of lane
changes per hour by zone group again indicates a reduction in lane changes per hour for each
zone group during the after period, with a greater reduction occurring in the first two zone
groups. The evening plot of lane changes per hour by individual zones also shows a substantial
decrease (approximately 54 percent) in lane changes per hour in Zones 1-7, with fluctuation in
Zones 8-12.
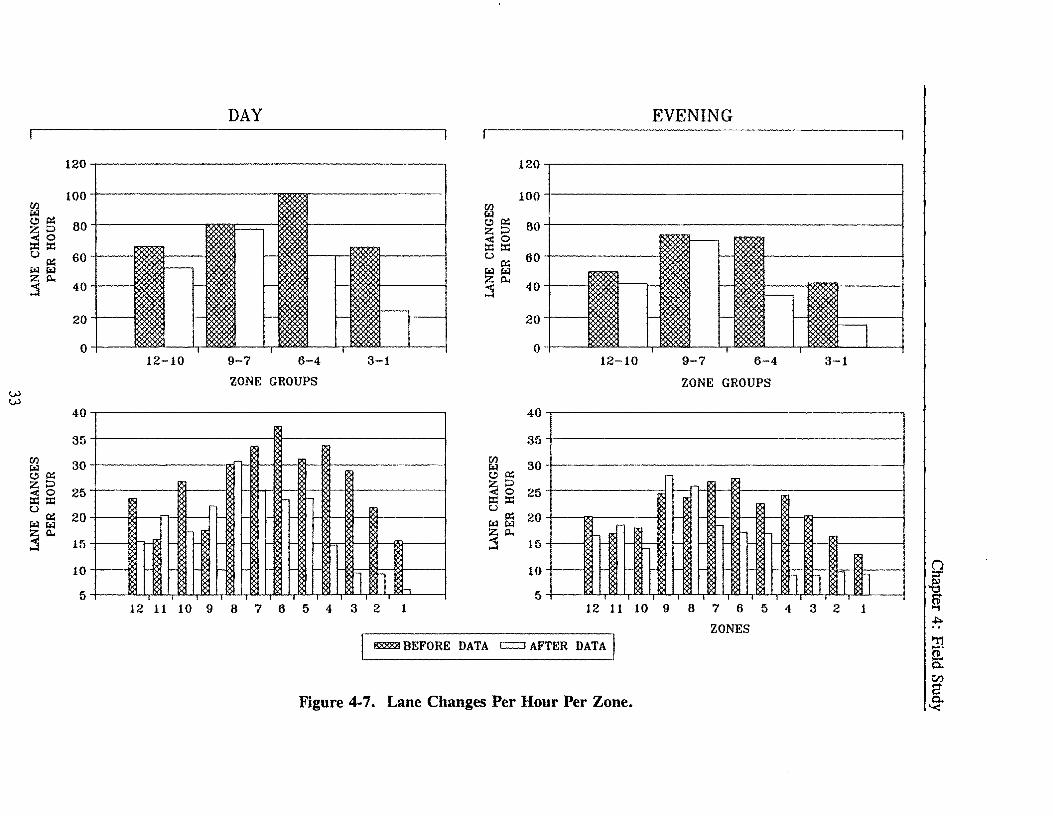
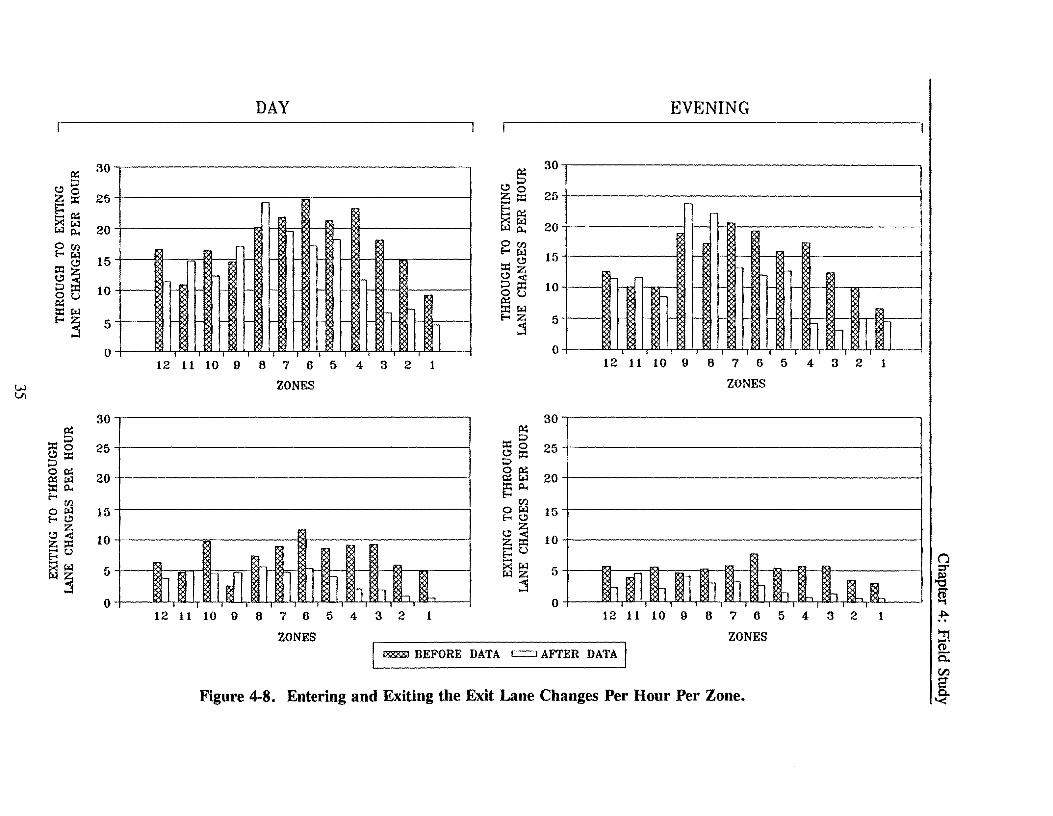
During both daylight and evening operations, for each zone, in both the before and after
studies, the number of vehicles entering the exit lane was more than the number of vehicles
leaving the exit lane (see Figure 4-8). Approximately 70 to 80 percent of the lane changes were
vehicles moving into the exit lane.
Statistical Test of Measures of Effectiveness
A statistical test was performed to determine whether the decreases in erratic maneuvers
and lane changes per hour from the before to the after period were statistically significant. A
binomial test of proportions with a 0.05 confidence level was used to determine whether the
percentages of lane changes and erratic maneuvers before the treatment were equal to the
percentages after treatment. For example, during daylight operations, the percent of lane
changes for the entire study segment was 59.3 percent during the before period and 40.7 percent
during the after period. The statistical test compares these numbers to 50 percent. For a
decrease in the percentages of lane changes or erratic maneuvers to be significant the calculated
z-value must be greater than 1.645. The results of the test indicate that the reduction in
percentages was significant in every case (see Table 4-6).
34
0:: 30 e!);.:J ZO 25 E=:::t: x 0:: til~ 20 Om f-<~
15 ::r:e!) e!)Z ;.:J~ 10 ~U ::t:til f-<3 5
0
w VI
30 0::
::t::J 25 00
;.:J::r: 00::
20 O::~ ::r:p.. f-< rn O~ f-<e!) 15
e!)~ 10 z::t: E=:u B~
3 5
0
DAY
i-
i- l-
i- i--
n 12 11 10 9 8 7 6 5 4 3 2 1
ZONES
....
l m, lJl I 1 I l 1 1 II 12 11 10 9 8 7 6 5 4 3 2 1
ZONES
0:: e!):J ZO _0:::: f-<o:: x~ ~P-.
OU) f-<~ ::ce!) e!)Z ;.:J< ~a ::r:~ f-<Z
j
0::
::c§ e!)p:: :J 00:: O::~
i5P-. U)
o til f-<e!) e!)~ Z::t: E=:u -;><til ~Z
j
30
25
20 ----
15
10
5
0
30
25
20
15
10
5
0
EVENING
- .--
n l ! l 12 11 10 9 8 7 6 5 4 3 2 1
ZONES
12 11 10 9 87654321
ZONES I ~ BEFORE DATA C==:J AFTER DATA I Figure 4-8. Entering and Exiting the Exit Lane Changes Per Hour Per Zone.

Chapter 4: Field Study
Table 4-6. Results of the Binomial Test of Proportions.
Daylight Evening Operations Operations
Before After Before After
I Lane Changes Per Hour for Study Segment 315 217 234 158
Lane Change Proportion 59.3 40.7 59.7 40.3
z-value 6.07 5.43 Significant/Not Significant? Significant Significant
Erratic Maneuvers Per Hour for Study Segment 51 31 32 21
Erratic Maneuver Proportion 62.5 37.5 60.4 39.6
z-value 3.20 2.14 Significant/Not Significant? Significant Significant
Lane Changes Per Hour for Gore Area 66 24 42 14
Lane Change Proportion 73.1 26.9 75.0 25.0
z-value 6.20 5.29 Significant/Not Significant? Significant Significant
Erratic Maneuvers Per Hour for Gore Area 27 14 17 10
Erratic Maneuver Proportion 66.2 33.8 63.0 37.0
z-value 2.93 3.38 Significant/Not Significant? Significant Significant
A more comprehensive test for before-and-after data included an examination of the
data's variability rather than only testing the significance of the difference between two averages.
Before-and-after hourly lane changes and erratic maneuvers were also compared using the Chi
Square test of independence. This test, which was also conducted at the 0.05 confidence level,
compares the percentage distribution of hourly lane changes and erratic maneuvers before and
after the treatment. It provides an appreciation for the variability of the data. The results are
shown in Table 4-7.
36
Chapter 4: Field Study
Table 4-7. Results of Chi-Square Tests.
X:CALC X:TABLE Significant?
Daylight Operations
Total Lane Change Per Hour 54.88 19.7 Yes
Exiting to Through Lane Changes Per Hour 26.81 11.1 Yes
Through to Exiting Lane Changes Per Hour 28.94 18.3 Yes
Erratic Maneuvers Per Hour 11.23 9.5 Yes
Evening Operations
Total Lane Changes Per Hour 49.16 17.0 Yes
Exiting to Through Lane Changes per Hour 24.86 7.82 Yes
Through to Exiting Lane Changes per Hour 29.69 17.0 Yes
Erratic Maneuvers per Hour 4.23 6.0 No
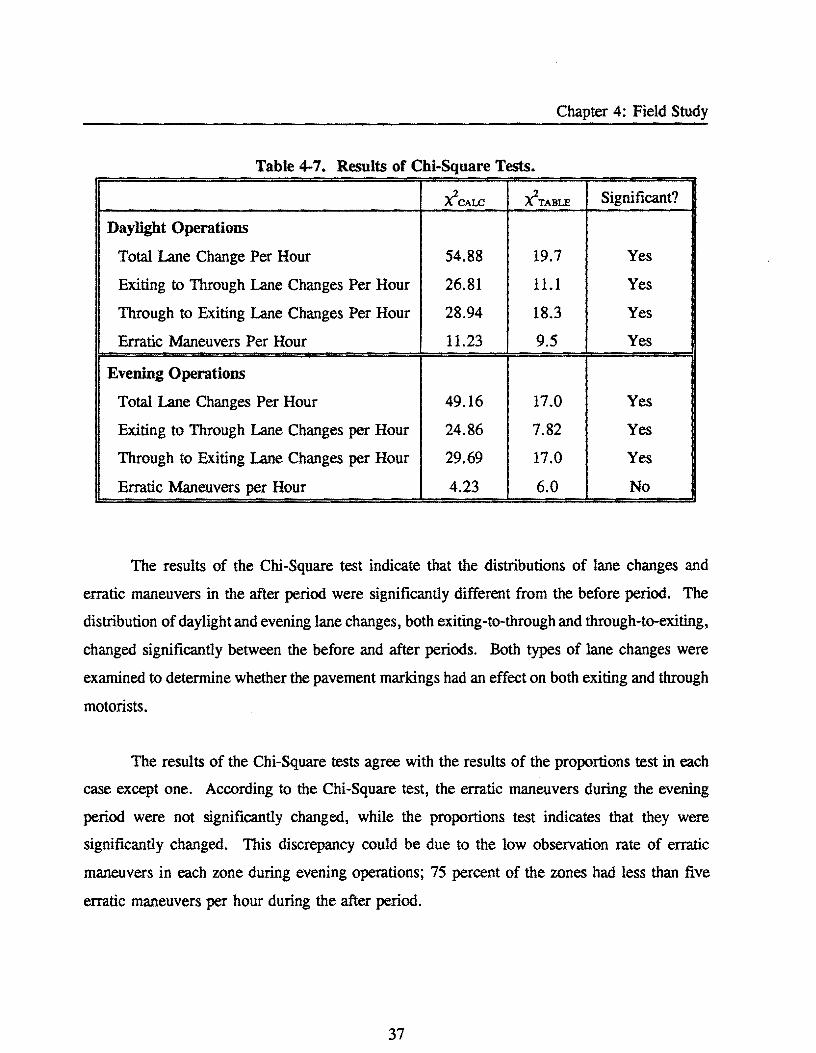
The results of the Chi-Square test indicate that the distributions of lane changes and
erratic maneuvers in the after period were significantly different from the before period. The
distribution of daylight and evening lane changes, both exiting-to-through and through-to-exiting,
changed significantly between the before and after periods. Both types of lane changes were
examined to determine whether the pavement markings had an effect on both exiting and through
motorists.
The results of the Chi-Square tests agree with the results of the proportions test in each
case except one. According to the Chi-Square test, the erratic maneuvers during the evening
period were not significantly changed, while the proportions test indicates that they were
significantly changed. This discrepancy could be due to the low observation rate of erratic
maneuvers in each zone during evening operations; 75 percent of the zones had less than five
erratic maneuvers per hour during the after period.
37

Chapter 4: Field Study
Lane Changes-Location
Both the daylight and evening plots appear to indicate a shift in the location of lane
changes between the before and after periods. If the after data shows a decrease in the number
of lane changing in one portion of the lane drop area, and an increase in the number of lane
changes in another portion of the lane drop area then it can be concluded that the pavement
markings created a shift in the location of lane changes. In this study, the before data contains
a large number of lane changes in the fIrst seven zones, while the after data shows
approximately a 50 percent reduction in lane changes in these zones. The lane change per hour
in Zones 8 to 12 show little reduction between the before and after periods-approximately 7
percent during daylight operations, and approximately 1 percent during evening operations.
Although the study segment does not contain zones with substantial increases in lane
changes per hour during the after period, these increases may occur prior to the study segment.
An increase in lane changes per hour during the after period in zones prior to the study segment
would indicate that motorists are positioning themselves further downstream in reaction to the
lane drop markings. It should be noted that the lane drop marking extended for 2,500 ft (762.5
m) prior to the gore; therefore, they appeared for approximately 1,300 ft (396.5 m) prior to the
study area.
Statistical Test on Location of Lane Changes
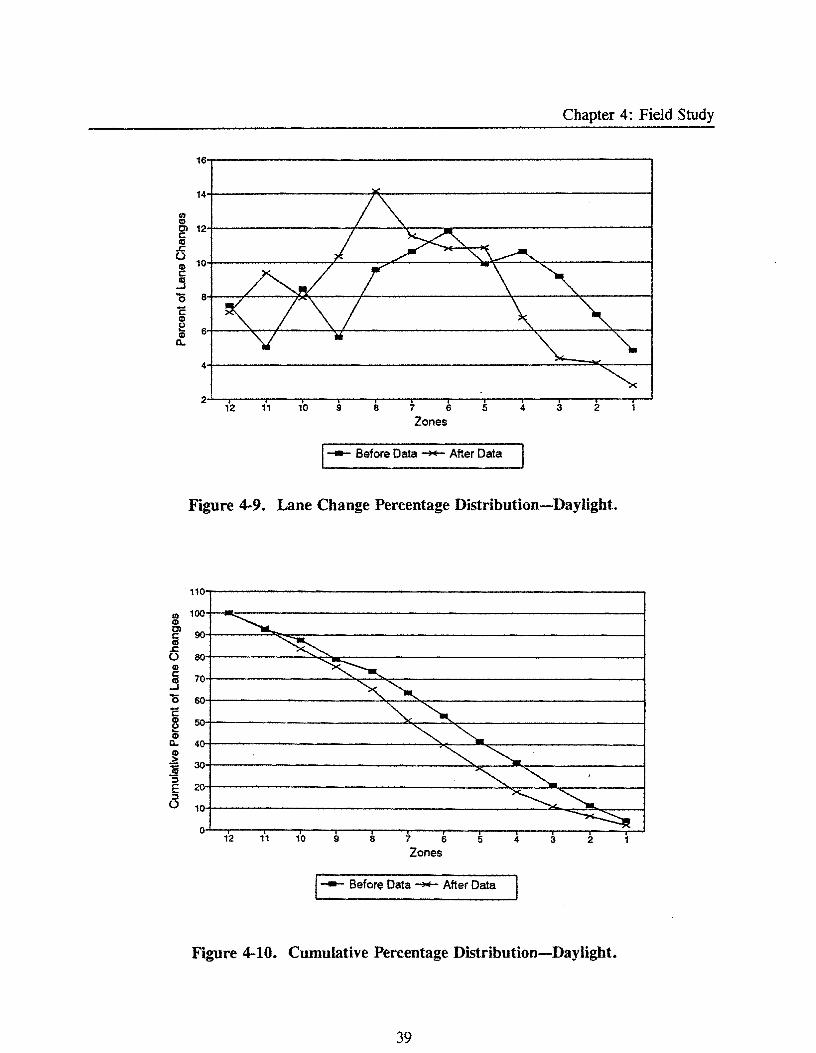
To determine whether a "shift .. in lane change locations is occurring, plots of percent of
lane changes per zone were used. The plot of percent of lane changes per zone during daylight
operations (see Figure 4-9) indicates a shift in where vehicles are changing lanes from the before
to the after period. For the fIve zones closest to the gore, fewer vehicles changed lanes in the
after period than in the before period, while more vehicles changed lanes in last fIve zones in
the after period than in the before period. This "shift" in lane change location can also be seen
by examining the cumulative percent of lane changes throughout the study segment (see Figure
4-10).
38
Chapter 4: Field Study
16
14
fIj CD Ol 12 s:: til .s::.
0 10 CD s::
til ...J
'0 8
C CD e 6 CD Il.
4
2 12 11 10 9 8 7 6 5 4 3 2
Zones
1--- Before Data -++- After Data
Figure 4-9. Lane Change Percentage Distribution-Daylight.
10
00
~ 90
~ 80
~ 70
~~ ~~
40 ~""-30 ~~
~~ 1 ~~
~ 12 11 10 9 8 7 6 5 4 3 2
Zones
1--- Beforf;~ Data -++- After Data
Figure 4-10. Cumulative Percentage Distribution-Daylight.
39
Chapter 4: Field Study
The plot of percent of lane changes during evening operations per zone follows the same
trend as the plot for daylight operations (see Figure 4-11). The evening plot illustrates an even
more noticeable difference between the before and after data. Again, fewer vehicles are
changing lanes in the first five zones during the after period than the before period, while more
vehicles are changing lanes in the last five zones during the after period than the before period.
The plot of cumulative percents for the evening period, Figure 4-12, also illustrates a slightly
more noticeable "shift" than the daylight plot, Figure 4-10.
The plots of the percentage distribution and cumulative percentage distributions indicate
a difference in before-and-after lane change behavior depending upon the distance from the gore.
To statistically validate this, a binomial proportions test was conducted on the before-and-after
percentages for each zone. Thus, the zones with significantly different proportions between the
before and after periods could be determined. The direction of change (Le., whether the number
of lane changes increased or decreased from before to after) was also determined. The results
of the individual proportions test by zone in addition to the direction of change (" -" indicates a
decrease in lane changes from before to after and "+" indicates an increase) are included in
Table 4-8 (daylight operations), and Table 4-9 (evening operations). All tests were done at the
0.10 confidence level.
Lane Changes-Hour of Day
The number of lane changes per hour throughout the day was also examined. Figure 4-
13 illustrates the number of lane changes per hour throughout the day, including both daylight
and evening hours. The frequency plot demonstrates that the number of lane changes is higher
in the afternoon peak period (4:30 p.m. to 6:30 p.m.) than in the morning peak period (7:30
a.m. to 8:30 a.m.). This finding supports the observation that the congested nature of this
freeway in the morning limits the number of lane changes as well as the number of lane
changing opportunities for drivers. The highest number of lane changes occurred during the
middle of the day. When the plot is adjusted to reflect volume, a similar pattern is seen (see
Figure 4-13). The highest lane-change rate occurs during the middle portion of the day and the
40

Chapter 4: Field Study
18
16
I/) 14 CD
Ol c: lIS .c 12
0 CD c: j 1
'0 C 8 CD e CD 6 ~
4
2 12 11 10 9 8 7 6 5 4 3 2
Zones
1-- Before Data -- After Data
Figure 4-11. Lane Change Percentage Distribution-Evening.
00
~ 90
~ 80
~~ 7"-
"'~ 60
" ~ 50
~ -~ 4
~ '" 20 ~ , ~,
10 ~-.........
0 ~
12 11 10 9 8 7 6 5 4 3 2 Zones
1-- Before ~ata -- After Data
Figure 4-12. Cumulative Percentage Distribution-Evening.
41

Chapter 4: Field Study
lowest during the heavily congested a.m. period. A peaking trend in the rate of lane changes
also occurs during the evening hours (6:00 p.m. to 10:00 p.m.) when the freeway volumes are
lowest.
Table 4-8. Results of Proportions Test for Each Zone-Daylight.
Total Lane Changes Exiting to Through Through to Exiting Zone Lane Changes Lane Changes
% Change Sig? Dir % Change Sig? Dir % Change Sig? Dir
1 2.07 Yes 3.34 No 0.95 No
2 2.83 Yes 3.89 No 1.52 No
3 4.82 Yes 5.56 No 3.12 No
4 3.88 Yes 4.73 No 3.89 Yes
5 0.96 No 0.03 No 1.07 No
6 1.00 No 0.88 No 1.06 No
7 0.88 No 0.75 No 1.55 No
8 4.58 Yes + 4.23 No 5.15 No
9 4.73 Yes + 6.97 Yes + 3.60 No
10 0.49 No 0.57 No 0.33 No
11 4.33 Yes + 5.55 No 3.94 Yes + 12 0.40 No 1.54 No 1.14 No
Overall 18.60 Yes 32.63 Yes 12.53 Yes
42
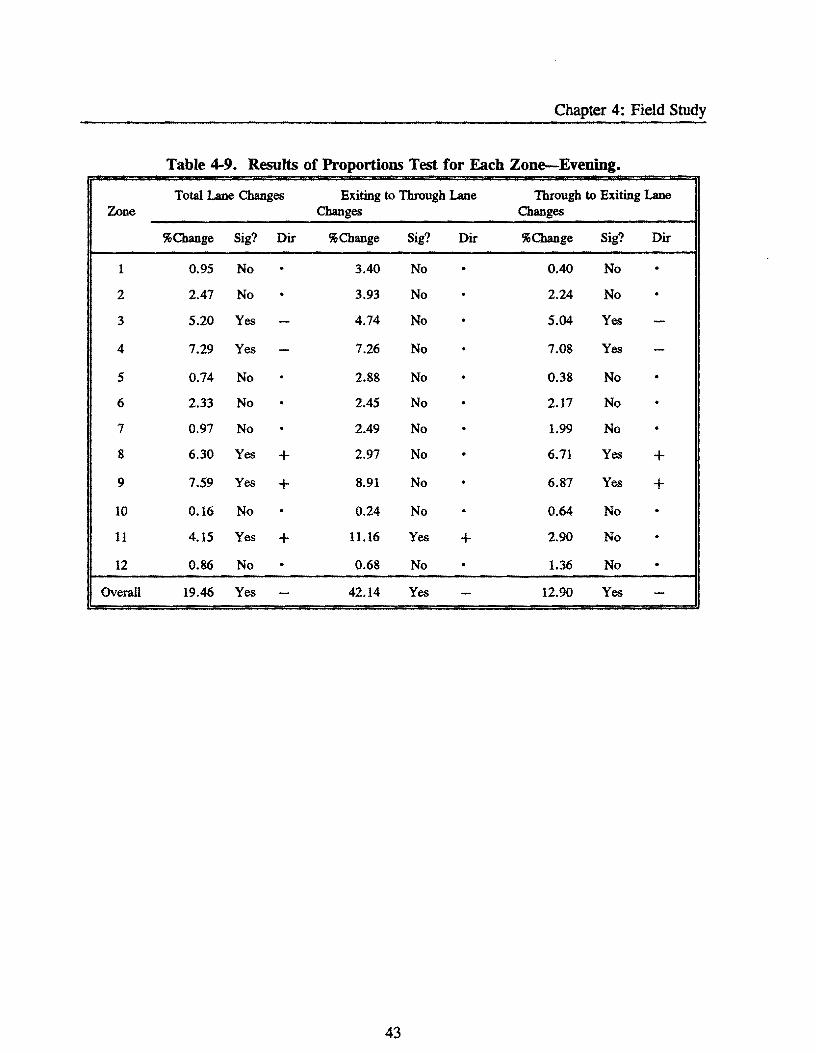
Chapter 4: Field Study
Table 4-9. Results of Proportions Test for Each Zone-Evening.
Total Lane Changes Exiting to Through Lane Through to Exiting Lane Zone Changes Changes
% Change Sig? Dir % Change Sig? Dir % Change Sig? Dir
1 0.95 No · 3.40 No · 0.40 No · 2 2.47 No · 3.93 No · 2.24 No · 3 5.20 Yes - 4.74 No · 5.04 Yes -4 7.29 Yes - 7.26 No · 7.08 Yes -5 0.74 No · 2.88 No · 0.38 No · 6 2.33 No · 2.45 No · 2.17 No · 7 0.97 No · 2.49 No · 1.99 No · 8 6.30 Yes + 2.97 No · 6.71 Yes + 9 7.59 Yes + 8.91 No · 6.87 Yes + 10 0.16 No · 0.24 No · 0.64 No · 11 4.15 Yes + 11.16 Yes + 2.90 No · 12 0.86 No · 0.68 No · 1.36 No ·
Overall 19.46 Yes - 42.14 Yes - 12.90 Yes -
43
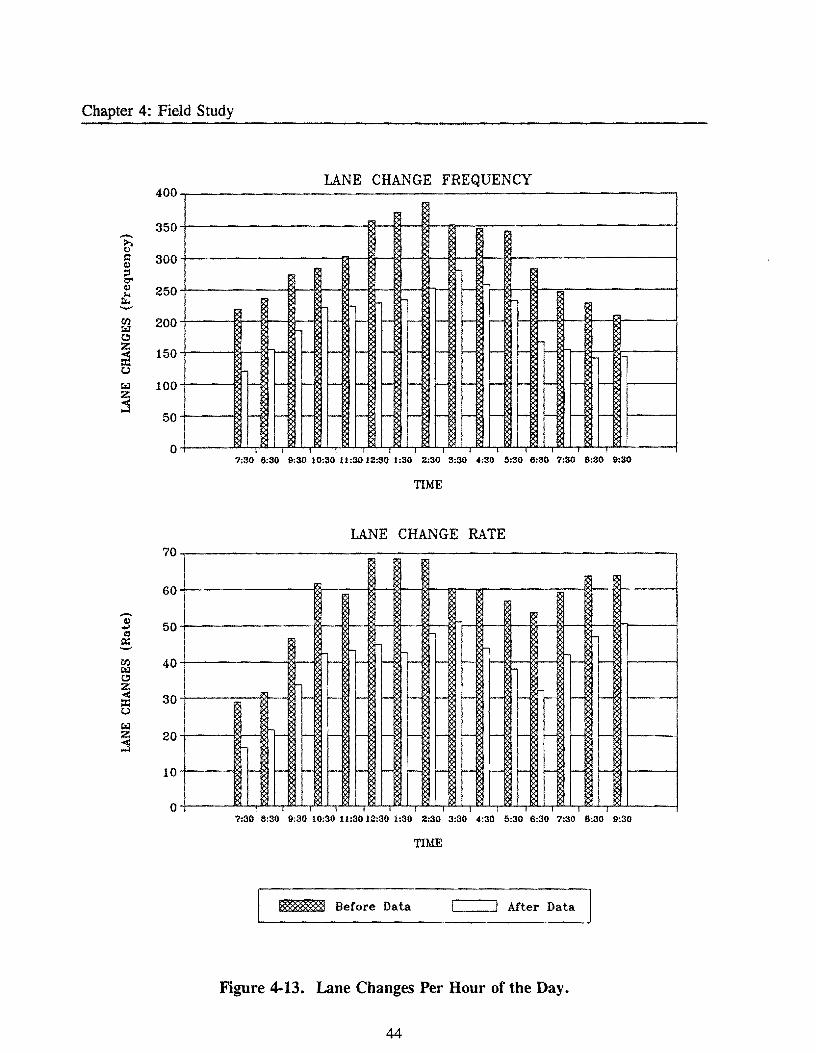
Chapter 4: Field Study
LANE CHANGE FREQUENCY 400
350 ->. t)
c: 300 Q)
::I 1:1' Q) 250 ,.. "" -rn 200 r:.::I
- L
I L - e- - ,.-- I- -C :z
150 < = U
r- r- - c- - r-- t- - r- t-
l r:.::I 100 '- l- e- - - - r-- i- - r- t- '- r- r-:z; :s
50 e- I- :-- - - - r-- l- f- r- t- e- f- r--
0 7:30 8:30 9:30 10:30 11:30 12:30 1:30 2:30 3:30 .:30 5:30 6:30 7:30 8:30 9:30
TIME
LANE CHANGE RATE 70
60
-. ~ 50 = 0:: -rn 40 r:.::I C
~ 30 = r- - - r- I- - r-- I--
'- - - f- t- - I-- i- ~:-- f- --U
r:.::I
~ 20 l- t- - e- - r-- I- - I-- t- ..- r- -,..;j
10
0
..- l- i- - :-- -~
I- - r i- r- r-- -
7:30 8:30 9:30 10:30 11:3012:30 1:30 2:30 3:30 4:30 5:30 6:30 7:30 8:30 9:30
TIME
Before Data Mter Data
Figure 4-13. Lane Changes Per Hour of the Day.
44
CHAPTERS
CONCLUSIONS AND RECOM:MENDATIONS
The purpose of this project was to investigate the operations and safety characteristics
of left exit lane drops. As is generally recognized, constructing left exits is to be avoided;
however, when present, suggestions on methods to improve safety and operations are valuable.
One alternative for better communicating the presence of a left exit lane drop to motorists is with
pavement markings. Lane drop pavement markings, pavement arrows, and raised pavement
markings were evaluated in the field to determine their effectiveness during daytime and evening
operations at a left exit lane drop. This chapter contains the conclusions of the evaluations of
motorist behavior in response to the lane drop markings. Recommendations and suggested topics
for future research are also contained in this chapter.
CONCLUSIONS
The results of the before·and-after study indicated that the lane drop markings and raised
pavement markers had a positive effect on driver behavior throughout the lane drop area;
therefore, they were an effective treatment at the left exit lane drop. Erratic maneuvers and lane
changes were both significantly reduced between the before and after periods during both
daylight and evening operations. The results also indicated that motorists performed their lane
changes, into or out of the exit-only lane, further upstream of the lane drop exit after the
markings were installed. This "shift" occurred during both daylight and evening operations.
Some of the reduction in the lane changes and/or erratic maneuvers may be partially
attributed to the greater attention value from the uniqueness of the markings within the lane drop
area since the optional lane drop markings are not consistently used at lane drop sites within the
state. Because the lane drop markings were evaluated four months after their installation,
however, the change in driver behavior is presumably not due to the "newness" of the markings.
45
Chapter 5: Conclusions and Recommendations
RECOMMENDATIONS
The consistent use of lane drop markings and raised pavement markers at left exit lane
drops is recommended. Consistent use of standardized markings treatments can provide several
benefits, among them improved driver expectancy at exit lane drops. The improved driver
expectancy encourages motorists to move out of or into a lane that is being dropped further
upstream of the gore area. This behavior results in fewer erratic maneuvers.
SUGGESTED RESEARCH
Examine the Relationship between Erratic Maneuvers and Accidents
The study of erratic maneuvers appears to be a promising tool for evaluating problem
exits. Accident rates may be too broad to detect the fine changes in driver behavior that result
from different treatments at exit lane drops. Therefore, it would be worthwhile to determine
if there is a quantifiable relationship between frequency of accidents and erratic maneuvers. If
a definitive relationship exits, benefits in the form of reduced accidents could be estimated from
erratic maneuver data.
Determine Driver Infonnation Needs
In this study erratic maneuvers and lane changes were evaluated at an exit lane drop to
determine whether motorists were confused as they traveled through the lane drop area. Some
motorists traveling through the lane drop area indicated with a blinker their desire to change
lanes, but were not able to change lanes. Therefore, there is reason to believe that some
motorists were confused or took a wrong route, but did so without making an erratic maneuver
or a lane change. Continued research is suggested to determine driver information needs at exit
lane drops, and how they can be satisfied.
46
REFERENCES
1. A Policy of Geometric Design of Highways and Streets. AASlITO, Washington, DC, 1990.
2. D. N. Goodwin. NCHRP Report 175: Freeway Lane Drops. TRB, National Research Council, Washington, DC, 1976.
3. Texas Manual on Uniform Traffic Control Devices. State Department of Highways and Public Transportation, Austin, TX, 1980.
4. Manual on Uniform Traffic Control Devices. Federal Highway Administration, U.S. Department of Transportation, Washington, DC, 1988.
5. The Suitability of Left-Hand Entrance and Exit Ramps for Freeways and Expressways. Northwestern University, Department of Civil Engineering, Evanston, IL, 1969.
6. D. L. Woods, N. J. Rowan, and J. H. Johnson. Significant Points from the Diagnostic Field Studies - Summary Report. Research Report No. 606-4, Texas Transportation Institute, College Station, TX, Sept. 1970.
7. M. A. Perfater. Motorist Understanding of Directional Messages. Final Report. VHTRC-82-R20, Virginia Highway & Transportation Research Council, Charlottesville, V A, Oct. 1981.
8. A. W. Roberts. Diagrammatic Sign Study. In Highway Research Record 414, HRB, National Research Council, Washington, DC, 1972, pp. 42-49.
9. T. M. Mast and G. S. Kolsrud. Diagrammatic Guide Signs for Use on Controlled Access Highways. Final Report FHWA-RD-73-21, Federal Highway Administration, U.S. Department of Transportation, Washington, DC, 1972.
10. D. A. Gordon. Evaluation of Diagrammatic Guide Signs. In Highway Research Record 414, HRB, National Research Council, Washington, DC, 1972, pp. 30-41.
11. D. S. Berry, G. L. Ross, and R. C. Pfefer. A Study of Left-Hand Exit Ramps on Freeways. In Highway Research Record 21, HRB, National Research Council, Washington, DC, 1963, pp. 1-16.
12. G. H. Alexander and H. Lunenfeld. Driver Expectancy in Highway Design and Traffic Operations. Final Report FHW A -TO-86-1, Federal Highway Administration, U. S. Department of Transportation, Washington, DC, May 1986.
13. R. L. Fisher. Accident and Operation Experience at Interchanges. In Highway Research Board Bulletin 291, HRB, National Research Council, Washington, DC, 1961, pp. 124-138.
47

References
14. R. A. Lundy. The Effect of Ramp Type and Geometry on Accidents. In Highway Research Record 163. HRB, National Research Council, Washington, DC, 1967, pp. 80-117.
15. M. J. Goodge. Left-Hand Entrance and Exit Ramps on a Freeway. Thesis for Master of Science, University of Massachusetts, Amherst, MA, Jan. 1969.
16. J. P. Leisch. Operational Considerations for Systems of Interchanges. In Transportation Research Record 1385. HRB, National Research Council, Washington, DC, 1993, pp. 106-111.
17. J. I. Taylor and H. W. McGee. NCHRP Report 145: Improving Traffic Operations and Safety at Exit Gore Areas. TRB, National Research Council, Washington, DC, 1973.
18. K. Fitzpatrick, T. K. Uenau, M. A. Ogden, M. T. Lance, and T. Urbanik, II. Freeway Exit Lane Drops in Texas. Research Report 1292-1F for Texas Department of Transportation, Texas Transportation Institute, College Station, TX, Nov. 1993.
48