Embed Size (px)
Citation preview
IMPORTANCE OF ONLINE PRESENCE TO COMPANIES IN DUBAI
Project Submitted to the MANIPAL UNIVERSITY
In the Partial Fulfillment of the Requirement of the Course [Audience Research and Survey Methods] of
BACHELOR OF ARTS IN MEDIA AND COMMUNICATION
By
ALYSA NAIR
REG. NO: 1002002
Under the Guidance and Supervision of
AFTAB HAIDER RIZVI
MANIPAL UNIVERSITY
DEPARTMENT OF MEDIA AND COMMUNICATION
ACADEMIC CITY, DUBAI, U.A.E.
JANUARY 2013

AFTAB HAIDER RIZVI Department of Media and Communication Manipal University – Dubai Campus International Academic City Dubai, U.A.E.
______________________________________________________________________________
Date: 3rd JANUARY 2013
CERTIFICATE
This is to certify that the project work entitled, ‘IMPORTANCE OF ONLINE PRESENCE TO COMPANIES IN DUBAI’, submitted to the MANIPAL UNIVERSITY – DUBAI CAMPUS, is a record of the original work done by Alysa Nair during the period of his/her study in the Department of Media and Communication, Manipal University – Dubai Campus, UAE, under my supervision and guidance, and the project work has not previously formed the basis for the award of any degree, diploma, fellowship, associateship or any other similar title, to any candidate of any University.
Signature of the Guide

DECLARATION
I hereby declare that matter embodied in this project work entitled “Importance of Online Presence to Companies in Dubai” is the result of the analysis of observation and interviews carried out by me under the guidance of Aftab Haider Rizvi Department of Management Studies, Manipal University – Dubai Campus, UAE. This project work has not previously formed the basis for the award of any degree, diploma, fellowship, associateship or any other similar title, to any candidate of any University.
Alysa Nair REG. NO: 1002002 Department of Media and Communication Manipal University – Dubai Campus International Academy City Dubai, UAE
Table of Contents
CHAPTER I Introduction 1
CHAPTER II Review of Literature 2-5
CHAPTER III Research Methodology 6
CHAPTER IV Analysis and Interpretation 7-19
CHAPTER VI Findings 20-21
CHAPTER VII Conclusion 22
REFERENCE………………………………………………………………………………...
APPENDIX…………………………………………………………………………………...

CHAPTER 1

P a g e | 1
| I M P O R T A N C E O F O N L I N E P R E S E N C E
INTRODUCTION
Today we live in a world filled with gadgets, electronic devices and information at our finger tips. These resources are enjoyed by the consumer to its fullest and used as a tool for success by companies. This phenomenon has not just taken over our work, but also the way we function on a daily basis. For every small action, we rely on any particular gadget to help us fulfill these tasks at hand. It should come as no surprise that companies all over the world are finding ways to use this dependence of the consumer to electronic devices, to their advantage.
With the rise in social media and the age of electronics, the smart phone and the internet, a significant shift in the marketing cycle has taken place. The emergence of online presence has become a must for all companies around the world. Online presence refers to a company’s presence on the online media. It is the process of raising awareness about one’s company online, drawing eager attention to them, fulfilling the new age needs of information and gaining a larger brand fan-follower base.
The new-age consumer does not approach companies anymore; the companies approach them. Social media websites such as Facebook, LinkedIn, Twitter, MySpace etc. has given consumers a platform to be exposed to and get more information about the world and the various brands available. This has resulted in a rise of competition between companies to win over their consumers. Therefore, a company who values their audience and brand loyalty would be present on these platforms to retain their audience and gain more followers.
This study focuses on the usage of this tool of online presence in the UAE, specifically Dubai. Dubai, being a rather fast moving, cosmopolitan state, with highly brand conscious inhabitants, is largely integrated with the media.
This reality is, however, only on face value. Many companies believe that they are using their online presence to the maximum if they have a social media account and/or website. Only a few companies may really be reaping the benefits of the online media platform. Our study focuses, therefore, on confirming this perception by finding the number of companies who are actually aware of online presence and are using it to its fullest.
This study’s objective is to finally raise awareness in regard to the number of companies who give importance to their online presence, in the UAE, specifically Dubai, with relation to the global scenario of advertising.

CHAPTER 2

P a g e | 2
| I M P O R T A N C E O F O N L I N E P R E S E N C E
REVIEW OF LITERATURE
“I’m passionate about marketing. I believe consumers will tell us what they want and need in their lives, if only we will listen anew every day.”
– Dina Howell, Chief Executive Officer, Saatchi & Saatchi X
Google had conducted a study to find out the various ‘Moment’s of Truth’, that is when a consumer makes their decisions to purchase or not to purchase a product. These decisions are based on various ‘mental models’. Mental models are explanations and representations of the thought process of an individual. Based on these models, an individual shapes their views and ideas about the world. With these mental models, individuals then accordingly tackle a particular task at hand in certain ways. Their behavior is therefore shaped on these mental models.
For a very long time, the perceived mental model of a consumer on the process of buying was conceptualized as the following:

P a g e | 3
| I M P O R T A N C E O F O N L I N E P R E S E N C E
Stimulus: The consumers initial exposure to the product. Example, Consumer ‘X’ watches advertisement for brand ‘Y’ on television. Consumer ‘X’ likes the advertisement they are exposed to
First Moment of Truth (FMOT): The consumer makes their decision to buy the product in front of the shelf, where one brand competes beside many other brands. Example, Consumer ‘X’ decides to choose and purchase brand ‘Y’ from the many other brands available, because of success in initial stimulus.
Second Moment of Truth (SMOT): The consumer tries the product. Based on the satisfaction level derived from the final exposure and usage of the product, s/he will accordingly purchase the product again or not.
However, after the study conducted by Google, a new ‘moment of truth’ was found in the mental model of the consumer, the ‘Zero Moment of Truth’ (ZMOT). According to Google, there is a particular ‘moment of truth’, between the ‘First Moment of Truth’ and the ‘Second Moment of Truth’, when the consumer seeks the reviews of others on the product and basis their buying decision accordingly.
Therefore, the conceptualization of the new mental model is:
P a g e | 4
| I M P O R T A N C E O F O N L I N E P R E S E N C E
‘Zero Moment of Truth’
We live in a world where greed and need for ‘information’ is of utmost importance. Furthermore, our economy has not yet recovered to completion after its great downfall. With the economy suffering and needs increasing, expenditure has become very selective. Today, any average person would search for as much information online about a product of initial interest, before buying the product. In simple words, a consumers buying behavior is shaped not by the company alone, but now increasingly by known and unknown people.
Rise in Technology, Social Media Websites/Online Forums/Blogs and the Word of Mouth Phenomena
The emergence of the ‘smart phone’ and various other technological devices, make access to these websites more and more accessible for anyone and everyone. With the rise of online activity, new media and its ease of access, people of all ages and walks of life are now continuously dependent on it for information about the world, upcoming events and activities, new products and their reviews. A consumer ‘X’ would now go online to various websites to check the ratings of a product ‘Y’ before purchase of the product. Depending on the overall satisfaction or dissatisfaction rate of other consumers of product ‘Y’, a decision will be made by consumer ‘X’ as to whether or not to purchase the product.
Word of Mouth is an ever increasing phenomenon where marketing strategists suggested that it was too highly ambiguous to employ, but if mastered, could be a powerful tool at the hand of a company/brand. A study was conducted by the University of Maryland on the effects of Word of Mouth as appose to Traditional Media and marketing strategies. The study revealed that more Word of Mouth led to more participation, and more participation led to more Word of Mouth. It further showed that Word of Mouth may also enhance the effect of traditional marketing when the activity serves to stimulate Word of Mouth.
Therefore, the impact of Word of Mouth and Social media websites is not increasingly more effective than the usual traditional media, as the smart consumer now tries to eliminate information they see as direct advertising. It is therefore, also, the job of the company to be present, now, whenever the consumer needs them, not when they need the consumer to hear them out.
P a g e | 5
| I M P O R T A N C E O F O N L I N E P R E S E N C E
Brand Loyalty to E-Loyalty
Brand loyalty has been the traditional aim for most marketers since time immemorial. It refers to the consumers’ commitment to purchase and repurchase only a particular brand of a company and choose to ignore all other competition. In an ideal situation, this would be possible. However, with more and more tools at the hands of the company and modes of information gathering by the consumer, competition is vastly increasing. Today, a new element of importance has come into play that makes the whole game of advertising and marketing different and tougher, ‘e-loyalty’. With the rapid growth of E-commerce and online consumer shopping trends, the importance of building and maintaining customer loyalty in electronic marketplaces has come into sharper focus in marketing theory and practice.(Eberly College of Business and Information Technology, Indiana University of Pennsylvania, U.S.A.)
Tools of the Company
We finally find, from review of prior research, that the various uses of online media for a company is one too many. Let’s take the example of Google and Facebook.
Google is the number one search engine on the internet. Many people do not use the word ‘search’ anymore as appose to the word ‘Google’. Google has therefore become a colloquial term amongst the consumers today. When a consumer searches for information online, majority would ‘Google’ it. When the consumer performs this act, a series of links with a small paragraph pertaining to the search comes up. Though the pages of links to websites might range from 30 – 1000, there are a few websites that make it to the top. This is not done by random. These websites pay Google to be placed on a particular place and in a particular position. It has been found that majority of the audience will search up to till the 5th page of searches, and maximum visit only the first few websites listed on the 1st page.
Facebook is now one of the most followed and loved social media website, close to Twitter. The benefits of this website, like any other social media website now, is the tracking of information, in particular, specific words, used by the user of the online platform. Facebook tracks the activity of its users and saves their information for companies who may be interested in buying them. Among this benefit, they also have customized advertisements for users, upon tracking of information, as well as ‘pages’ and ‘events’ that companies can make easily. This not only benefits a company to track the number of their fan-base, but also reach out to them and increase branding prospects. Therefore, the effectiveness of Online Presence cannot be doubted.

CHAPTER 3

P a g e | 6
| I M P O R T A N C E O F O N L I N E P R E S E N C E
RESEARCH METHODOLOGY
Now that we have established the importance of Online Presence, we seek to find whether or not companies in the Dubai are using this tool to the maximum.
To fulfill the objective of the study, we therefore employed an exploratory form of research. Secondary data from various journals were collected for prior research and understanding of the topic of Online presence, before designing and formulation of the ‘problem study’. After this, primary data was collected to further clarify the research findings.
Target Audience/Sampling
Data was sampled from various companies in Dubai. Since branding of a company is managed by the marketing department, information was gathered from the marketing departments of 11 companies who provide service and 9 companies who provide product. The reason for collection of data from both product and service fields were because from prior research we found that online presence is applicable and fruitful to all areas of work.
Questionnaire Discussion
A questionnaire was therefore designed to get the required information for the purpose of the study. The questionnaire consists of a series of close and open ended questions pertaining to the companies perceived importance of advertising and online presence to them, and their views on social media and its rise. Each questionnaire was filled under the guidance of an interviewer, to decrease the likeliness of sampling error.
Limitations of the Study
A major limitation of the study would be that the sample size was not a large enough. Suggestions for further study on this research topic would be to concentrate on a specific area of work, that is ‘product’ and ‘service’ separately, and to gain more information from various companies, so as to get a larger more accurate analysis of the problem study.

CHAPTER 4
P a g e | 7
| I M P O R T A N C E O F O N L I N E P R E S E N C E
ANALYSIS OF DATA
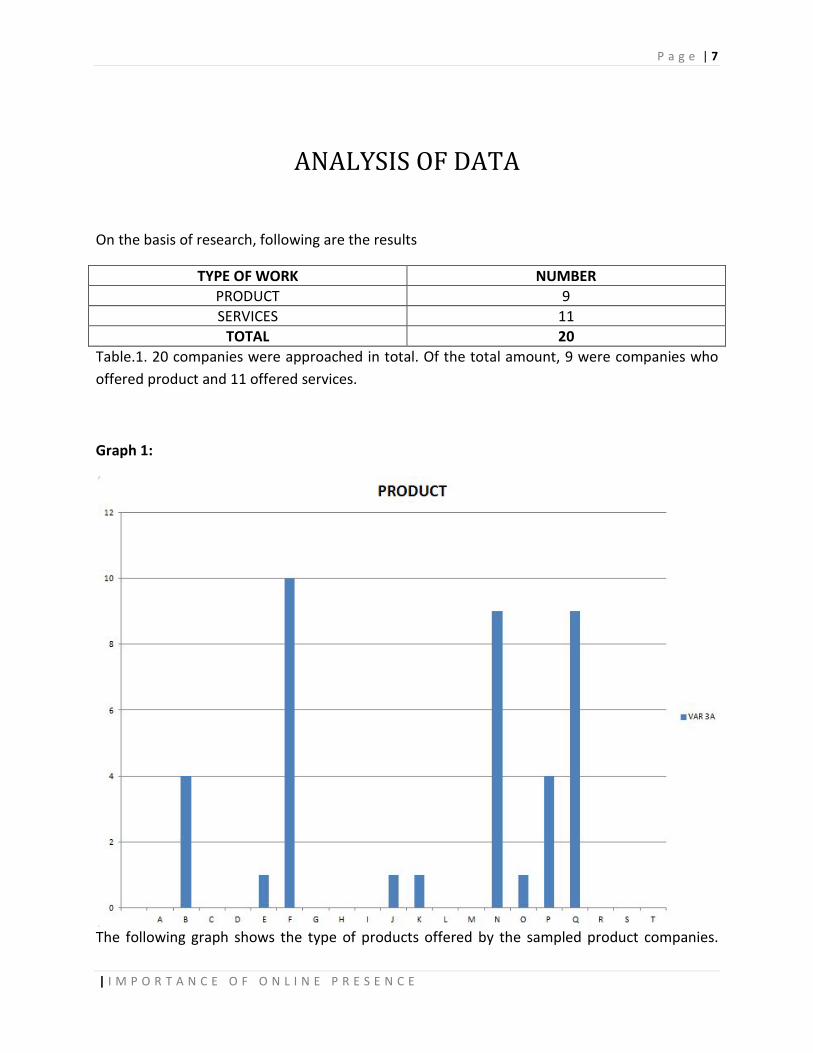
On the basis of research, following are the results
TYPE OF WORK NUMBER PRODUCT 9 SERVICES 11
TOTAL 20 Table.1. 20 companies were approached in total. Of the total amount, 9 were companies who offered product and 11 offered services.
Graph 1:
The following graph shows the type of products offered by the sampled product companies.

P a g e | 8
| I M P O R T A N C E O F O N L I N E P R E S E N C E
The y- axis represents the values for the type of product and the x-axis represents the subjects who answered.
The table is an explanation of the graph 1:
VALUE TYPE OF PRODUCT PERCENTAGE 1 FMCG 20% 4 PERISHABLE GOODS 10% 9 HEALTHCARE 10%
10 OTHER (RESTAURANT) 5% Table.2.
Graph 2:
The following graph shows the type of services offered by the sampled service companies. The y-axis represents the values for the type of service and the x-axis represents the subjects who answered.
P a g e | 9
| I M P O R T A N C E O F O N L I N E P R E S E N C E
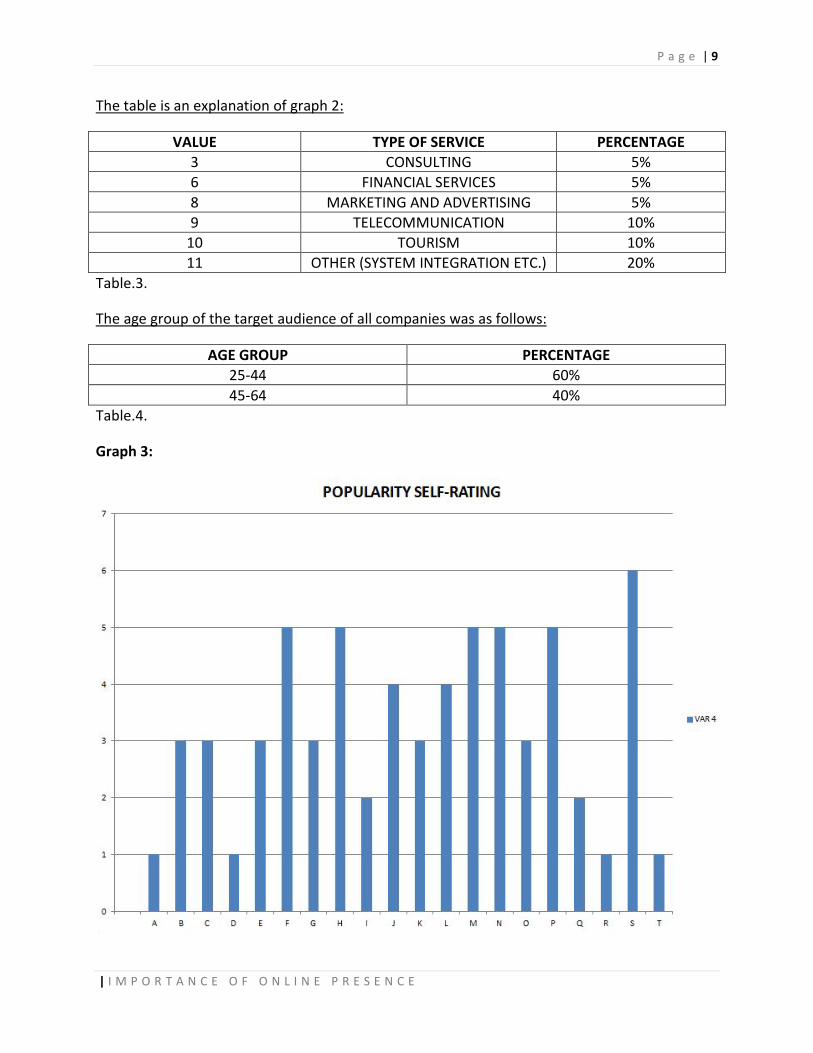
The table is an explanation of graph 2:
VALUE TYPE OF SERVICE PERCENTAGE 3 CONSULTING 5% 6 FINANCIAL SERVICES 5% 8 MARKETING AND ADVERTISING 5% 9 TELECOMMUNICATION 10%
10 TOURISM 10% 11 OTHER (SYSTEM INTEGRATION ETC.) 20%
Table.3.
The age group of the target audience of all companies was as follows:
AGE GROUP PERCENTAGE 25-44 60% 45-64 40%
Table.4.
Graph 3:
P a g e | 10
| I M P O R T A N C E O F O N L I N E P R E S E N C E
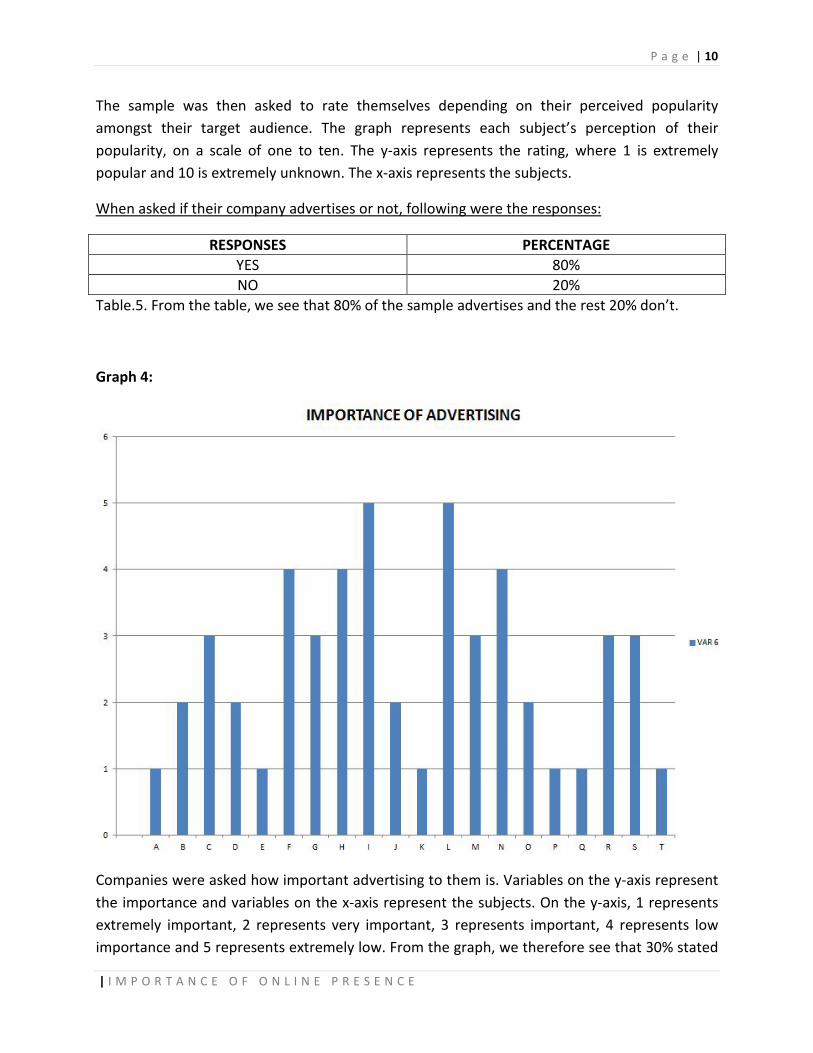
The sample was then asked to rate themselves depending on their perceived popularity amongst their target audience. The graph represents each subject’s perception of their popularity, on a scale of one to ten. The y-axis represents the rating, where 1 is extremely popular and 10 is extremely unknown. The x-axis represents the subjects.
When asked if their company advertises or not, following were the responses:
RESPONSES PERCENTAGE YES 80% NO 20%
Table.5. From the table, we see that 80% of the sample advertises and the rest 20% don’t.
Graph 4:
Companies were asked how important advertising to them is. Variables on the y-axis represent the importance and variables on the x-axis represent the subjects. On the y-axis, 1 represents extremely important, 2 represents very important, 3 represents important, 4 represents low importance and 5 represents extremely low. From the graph, we therefore see that 30% stated
P a g e | 11
| I M P O R T A N C E O F O N L I N E P R E S E N C E
that it was ‘extremely important’, 20% stated that it was ‘very important’, 25% stated that it was ‘important’, 15% stated that advertising was of ‘low importance’ and 10% stated that advertising was of ‘extremely low’ importance to their company.
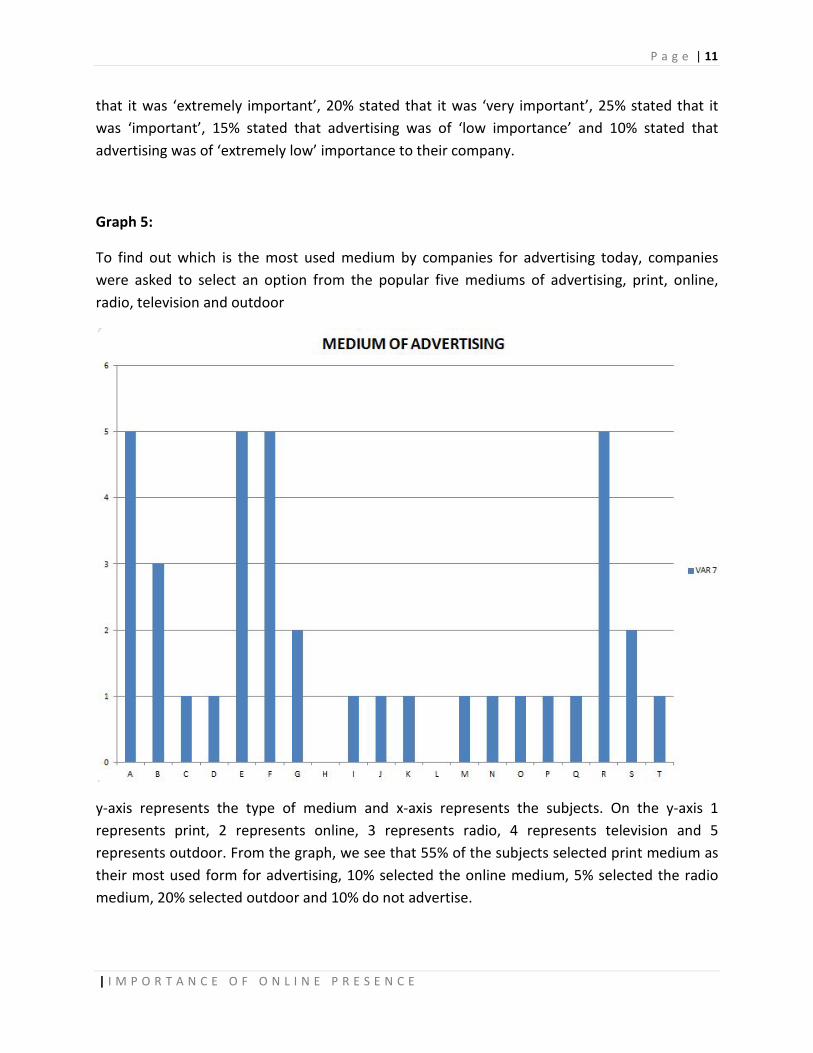
Graph 5:
To find out which is the most used medium by companies for advertising today, companies were asked to select an option from the popular five mediums of advertising, print, online, radio, television and outdoor
y-axis represents the type of medium and x-axis represents the subjects. On the y-axis 1 represents print, 2 represents online, 3 represents radio, 4 represents television and 5 represents outdoor. From the graph, we see that 55% of the subjects selected print medium as their most used form for advertising, 10% selected the online medium, 5% selected the radio medium, 20% selected outdoor and 10% do not advertise.

P a g e | 12
| I M P O R T A N C E O F O N L I N E P R E S E N C E
Results of the study show that majority of the sample have a usual fixed advertising budget maintained, which would range from AED 200,000 – AED 300,000,000. The minority of the sample did not have an advertising budget allotted and/or only advertised in yellow pages.
When asked, in their opinion, whether or not the advertising budget of the company should be increased, decrease or stay the same, 35% of the sample stated that the advertising budget of their company should increase, so as to better sales and diversify into various other mediums of advertising, such as outdoor and radio. Only 5% of the sample stated that the advertising budget of their company should decrease since their company had already reached maximum popularity, 35% of the sample stated that their company’s budget should remain the same and the rest 15% of the sample claimed to not have an advertising budget since they were content with word-of-mouth advertising.
Following are the results upon asking companies how important brand loyalty is, to their company
Graph 6:
P a g e | 13
| I M P O R T A N C E O F O N L I N E P R E S E N C E
Variables on the y-axis represent the importance and variables on the x-axis represent the subjects. On the y-axis, 1 represents extremely important, 2 represents very important, 3 represents important, 4 represents low importance and 5 represents extremely low. From the graph, we therefore see that 35% stated that it was ‘extremely important’, 20% stated that it was ‘very important’, 40% stated that it was ‘important’ and 5% stated that brand loyalty was of ‘low importance’ to their company.
Further, we wanted to find the percentage of companies who believe they have achieved maximum brand loyalty. Following is a table representing the values:
ACHIEVED MAXIMUM BRAND LOYALTY PERCENTAGE YES 60% NO 40%
Table.6.
When asked whether brand loyalty or e-loyalty was more important to the company, the companies answered the following. It should be noted however that 70% of the companies were unaware of what e-loyalty was.
PREFERED LOYALTY PERCENTAGE BRAND LOYALTY 95%
E-LOYALTY 5% Table.7.
At the most basic requirement, for a company to have some form of online presence, they would require a company website. Following are the results upon asking whether or not a company owned one:
COMPANY WEBSITE PERCENTAGE YES 90% NO 10%
Table.8.
P a g e | 14
| I M P O R T A N C E O F O N L I N E P R E S E N C E
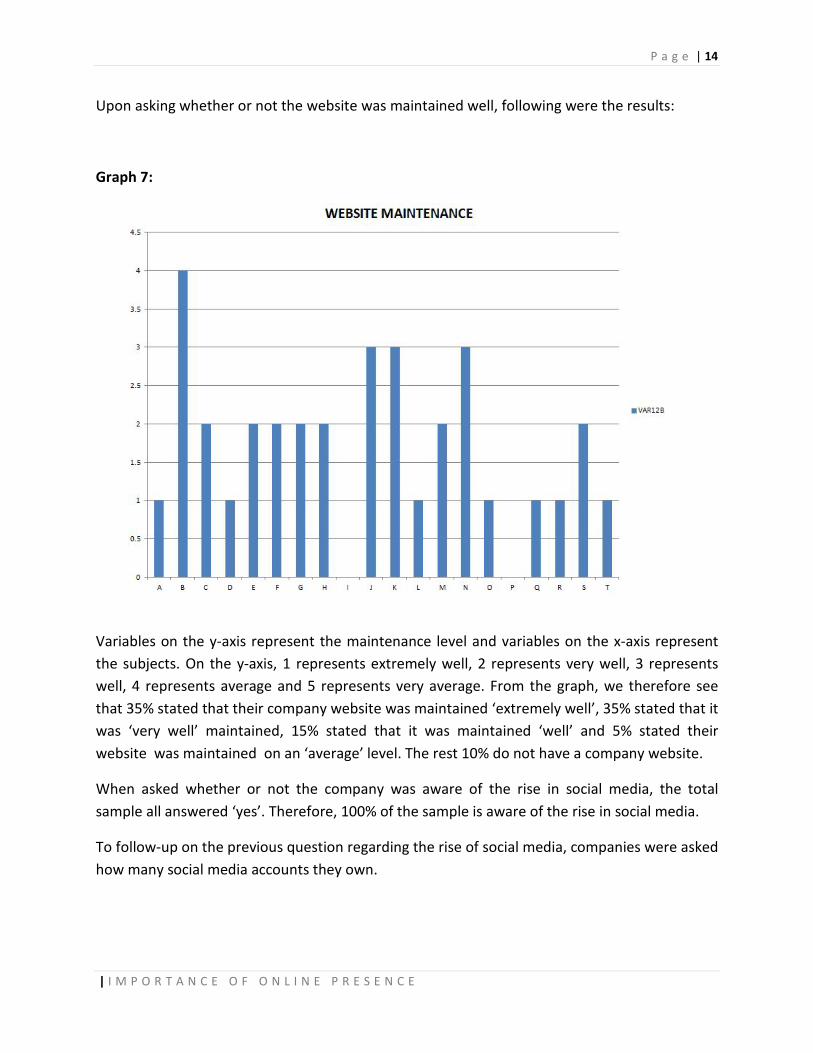
Upon asking whether or not the website was maintained well, following were the results:
Graph 7:
Variables on the y-axis represent the maintenance level and variables on the x-axis represent the subjects. On the y-axis, 1 represents extremely well, 2 represents very well, 3 represents well, 4 represents average and 5 represents very average. From the graph, we therefore see that 35% stated that their company website was maintained ‘extremely well’, 35% stated that it was ‘very well’ maintained, 15% stated that it was maintained ‘well’ and 5% stated their website was maintained on an ‘average’ level. The rest 10% do not have a company website.
When asked whether or not the company was aware of the rise in social media, the total sample all answered ‘yes’. Therefore, 100% of the sample is aware of the rise in social media.
To follow-up on the previous question regarding the rise of social media, companies were asked how many social media accounts they own.

P a g e | 15
| I M P O R T A N C E O F O N L I N E P R E S E N C E
Graph 8:
Variables on the y-axis represent the number of social media accounts each company holds and x-axis represents the subjects.
The following table represents the type of social media accounts owned by the companies and the percentage of companies who own them:
VARIABLE SOCIAL MEDIA ACCOUNT PERCENTAGE VAR15(1) FACEBOOK 60% VAR15(2) TWITTER 35% VAR15(3) GOOGLE+ 20% VAR15(4) PINTEREST 0% VAR15(5) YOUTUBE 25% VAR15(6) FLICKR 5% VAR15(7) LINKEDIN 45% VAR15(8) INSTAGRAM 5% VAR15(9) MYSPACE 15%
DON’T HAVE ACCOUNT 15% Table.9.

P a g e | 16
| I M P O R T A N C E O F O N L I N E P R E S E N C E
Majority of the companies agreed that their online presence did have a significant impact on their sales and only a few claimed that it didn’t really make an effect on their sales.
Companies were then asked how active they were on the social media accounts per week. Following were the results:
(Please note that those companies who don’t own the particular social media account were asked to select ‘extremely inactive’)
FACEBOOK PERCENTAGE EXTREMELY ACTIVE 20%
VERY ACTIVE 25% ACTIVE 10%
INACTIVE 5% EXTREMELY INACTIVE 40%
Table.10.
TWITTER PERCENTAGE EXTREMELY ACTIVE 0%
VERY ACTIVE 15% ACTIVE 15%
INACTIVE 5% EXTREMELY INACTIVE 65%
Table.11.
GOOGLE+ PERCENTAGE EXTREMELY ACTIVE 5%
VERY ACTIVE 0% ACTIVE 5%
INACTIVE 5% EXTREMELY INACTIVE 85%
Table.12.
PINTEREST PERCENTAGE EXTREMELY ACTIVE 0%
VERY ACTIVE 0% ACTIVE 0%
INACTIVE 0% EXTREMELY INACTIVE 100%
Table.13.

P a g e | 17
| I M P O R T A N C E O F O N L I N E P R E S E N C E
YOUTUBE PERCENTAGE EXTREMELY ACTIVE 0%
VERY ACTIVE 5% ACTIVE 20%
INACTIVE 0% EXTREMELY INACTIVE 75%
Table.14.
FLICKR PERCENTAGE EXTREMELY ACTIVE 0%
VERY ACTIVE 0% ACTIVE 5%
INACTIVE 0% EXTREMELY INACTIVE 95%
Table.15.
LINKEDIN PERCENTAGE EXTREMELY ACTIVE 0%
VERY ACTIVE 25% ACTIVE 20%
INACTIVE 0% EXTREMELY INACTIVE 55%
Table.16.
INSTAGRAM PERCENTAGE EXTREMELY ACTIVE 0%
VERY ACTIVE 0% ACTIVE 0%
INACTIVE 5% EXTREMELY INACTIVE 95%
Table.17.
MYSPACE PERCENTAGE EXTREMELY ACTIVE 0%
VERY ACTIVE 5% ACTIVE 5%
INACTIVE 0% EXTREMELY INACTIVE 90%
Table.18.
P a g e | 18
| I M P O R T A N C E O F O N L I N E P R E S E N C E
Results of the study show that only half of the sample uses these social media accounts to post information about upcoming events that their company is holding, new offers available to the consumer, information about existing and new products and updating of information about their company. Only a minority uses these social media accounts for competitions, give away prizes, analysis of the market and head hunting.
When asked whether companies are aware that there are a number of online forums that exist, where people discuss and review products, 90% of the sample answered ‘yes’ and the rest 10% answered ‘no’. Companies were then asked if they monitor these forums; following are the results:
MONITORING OF FORUMS PERCENTAGE YES 40% NO 20%
SOMETIMES 30% UNAWARE AND DON’T MONITOR 10%
Table.19.
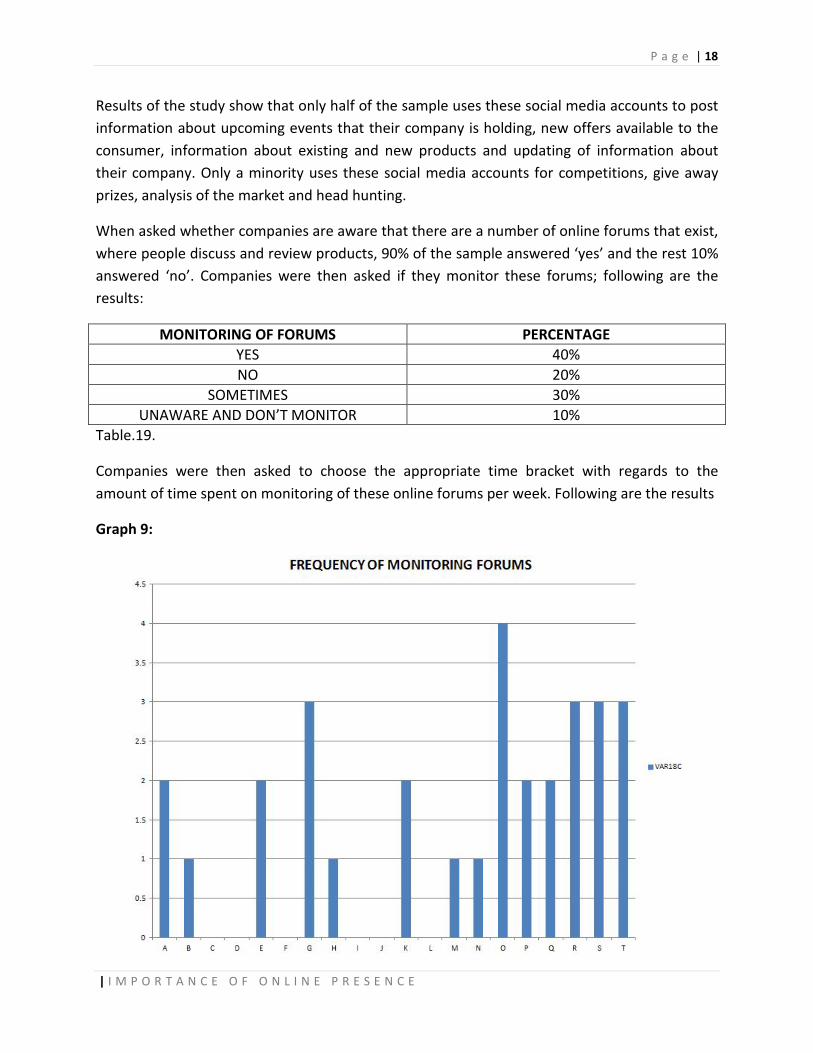
Companies were then asked to choose the appropriate time bracket with regards to the amount of time spent on monitoring of these online forums per week. Following are the results
Graph 9:
P a g e | 19
| I M P O R T A N C E O F O N L I N E P R E S E N C E
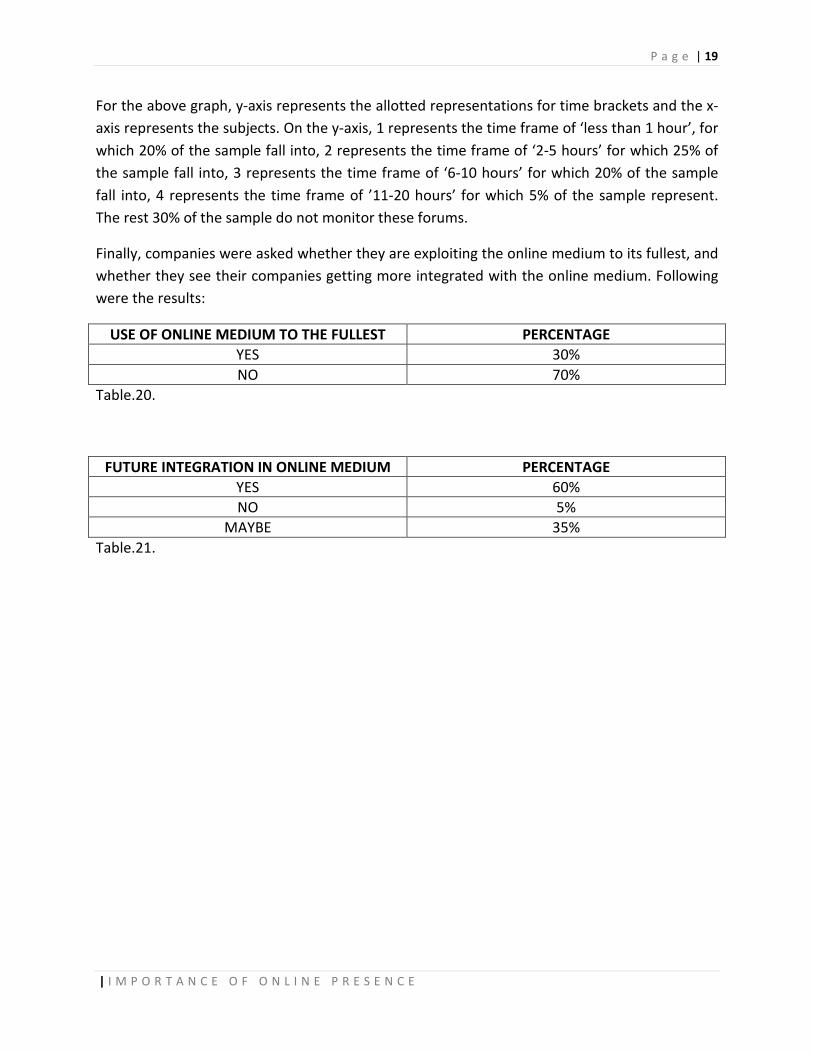
For the above graph, y-axis represents the allotted representations for time brackets and the x-axis represents the subjects. On the y-axis, 1 represents the time frame of ‘less than 1 hour’, for which 20% of the sample fall into, 2 represents the time frame of ‘2-5 hours’ for which 25% of the sample fall into, 3 represents the time frame of ‘6-10 hours’ for which 20% of the sample fall into, 4 represents the time frame of ’11-20 hours’ for which 5% of the sample represent. The rest 30% of the sample do not monitor these forums.
Finally, companies were asked whether they are exploiting the online medium to its fullest, and whether they see their companies getting more integrated with the online medium. Following were the results:
USE OF ONLINE MEDIUM TO THE FULLEST PERCENTAGE YES 30% NO 70%
Table.20.
FUTURE INTEGRATION IN ONLINE MEDIUM PERCENTAGE YES 60% NO 5%
MAYBE 35% Table.21.

CHAPTER 5

P a g e | 20
| I M P O R T A N C E O F O N L I N E P R E S E N C E
FINDINGS
- Research results show that 60% of the sample’s target audience is from 25-44, and 40%
of the sample’s target audience is from 45-64.
- 30% of the sample believes they are extremely known among their target audience. 40% of the sample believes they are known on a level that is popular enough among their target audience. The rest 30% believe they are known on a moderate to average level.
- 80% of the sample advertises; it is extremely important to advertise from 50% of the target audience. The 40% of the sample keep it at an average level of importance. The rest 10% find advertising to be an unnecessary expenditure.
- 55% of the sample advertises on the print medium. 20% of the sample advertises on the outdoor medium. 10% of the sample advertises online and only 5% of the sample advertises on radio. The rest 10% do not advertise.
- Majority of the sample state that the fixed budget would range from AED 200,000 to AED 300,000,000, depending on the product being advertised. The rest minority does not have a fixed budget, nor do they see the need for advertising as they believe their company as achieve maximum brand loyalty. They are satisfied with only word of mouth.
- 95% of the sample chose brand loyalty over e-loyalty. However, only small minority of the sample understood the meaning of e-loyalty. 60% of the sample believe they have reached maximum brand loyalty.
- 90% of the sample has a website. 85% of the sample believe they have it very well maintained, and the rest 5% believe that it is averagely maintained.
- 100% of the companies are aware of the rise in social media.
P a g e | 21
| I M P O R T A N C E O F O N L I N E P R E S E N C E
- Of all the few popular social media accounts stated, the most used accounts are Facebook, Twitter, LinkedIn, YouTube and Google+. 60% of the sample hold ‘Facebook’ accounts. 35% hold ‘Twitter’ accounts. 45% hold LinkedIn accounts. 25% hold YouTube accounts and 20% hold Google+ accounts.
- Activity on the social media accounts are very limited to only updating of information as a main function.
- The frequency of updating all accounts for these most used accounts range from, 20% of the sample who are extremely active on these accounts to 15% who only actively use it.
- 90% of the sample are aware of online forums, however only 40% monitor them. The frequency of monitoring the activity and discussion on these online forums per week falls under a time frame of 2 to 5 hours, by 25% of the sample. 20% monitor the forums between 6-10 hours.
- 30% of the sample believes they are exploiting the internet to its fullest. Only 60% are sure that their company will get more integrated with the online platform in the near future

CHAPTER 6

P a g e | 22
| I M P O R T A N C E O F O N L I N E P R E S E N C E
CONCLUSION
From this study, we can thus conclude that online presence has now become an important factor in the marketing mix. It largely contributes to the sales of an organization. The study however shows that companies in Dubai aren’t using the potential that online presence has to offer. Majority of them believe that they have fulfilled online presence by being just present online by owning a few social media accounts and having a company website. Those companies who do use social media accounts to the fullest are a very small minority of the Dubai. There is a lack of knowledge in the field of e-loyalty and marketing.
The need of the hour is to raise awareness regarding the proper use of social media accounts and online opportunities for companies as it can greatly benefit them. Many companies who do not advertise because they believe it a waste of money must reconsider they use of the term ‘advertise’. The medium for advertising has no open ten-fold to companies with the introduction of the online platform. Companies who believe relying on word-of-mouth as their only source of advertising must consider the monitoring of online forums more. Only a minority of the companies in Dubai monitor forums where their products are being discussed. These forums have a highly negative or positive impact on the company’s brand image, depending on how well the situations are handled by the company.
Finally, a company must try to always be available to their customer at all points of time. Since the world is largely shifting to an online base, and consumers no longer approach the company, but rather companies approach the consumer, it is recommended that companies keep a strong online presence and are ready to interact with their highly probably consumers at any point of time.

REFERENCE
P a g e | 23
| I M P O R T A N C E O F O N L I N E P R E S E N C E
- ZMOT, WINNING THE ZERO MOMENT OF TRUTH, By Jim Lecinski
- From Brand Loyalty to E-Loyalty: A conceptual Framework, Marcel Gomman, Krish S. Krishnan and Katrin B. Scheffold
- The Hierarchy of Effects (HOE) Meets Paid, Earned, and Owned (POE): How Do Internet Media Work with the Marketing Mix to Drive Sales for a Consumer Packaged Good?, by Koen Pauwels, Shuba Srinivasan, Oliver J. Rutz and Randolph E. Bucklin
- Effects of Word-of-Mouth Versus Traditional Marketing: Findings from an Internet Social Networking Site, by Michael Trusov, University of Maryland, Randolph E. Bucklin, University of California, Los Angeles – Marketing Area, Koen H. Pauwels, Tuck School of Business at Dartmouth
- Can Sentiment Toward Advertising Explain Materialism and Vanity in the Globalization Era? Evidence from Dubai, by Tarek Mady, Helene Cherrier, Dennis Lee and Kaleel Rahman
- Simulating the conflict between reputation and profitability for online rating portals, by Boris Galitsky and Mark Levene
- Social Media Marketing in the UAE, by Afraa Abdulla Al Tenaiji and Yoosuf Cader, College of Business Sciences, Zayed University, UAE
- Modeling Online Presence, by Milan Stankovic
- The study of consumer brand loyalty on FMCG – Cosmetic products with special reference to Madurai, Tuticorin, Kanyakumari Districts, Tamil Nadu State, South India, by C. Muthuvelayutham and L. Subburaj
- Internet usage, Internet marketing intensity and international marketing growth, by Shane Mathews and Constanza Bianchi
- E-Loyalty: Your secret weapon on the web, by Frederick F. Reichheld and Phil Schefter

APPENDIX

QUESTIONNAIRE
‘Importance of Online presence to
Companies in Dubai’
By: Alysa Nair 3rd Year Student B.A. Media and Communication Manipal University, Dubai

P a g e | 2
INTRODUCTION
Dear Participant,
Thank you for agreeing to part-take in our study
This questionnaire is conducted to estimate the number of companies who are aware of and using online advertising and presence to help brand their image to the target audience.
Be assured that no information you provide will be used to harm you or your company in any way. Confidentiality of the information will be maintained.
We urge you to please answer each question truthfully and leave no question unanswered.
The questionnaire should take no more than 5 to 10 minutes of your time. Please begin
P a g e | 3
QUESTIONS
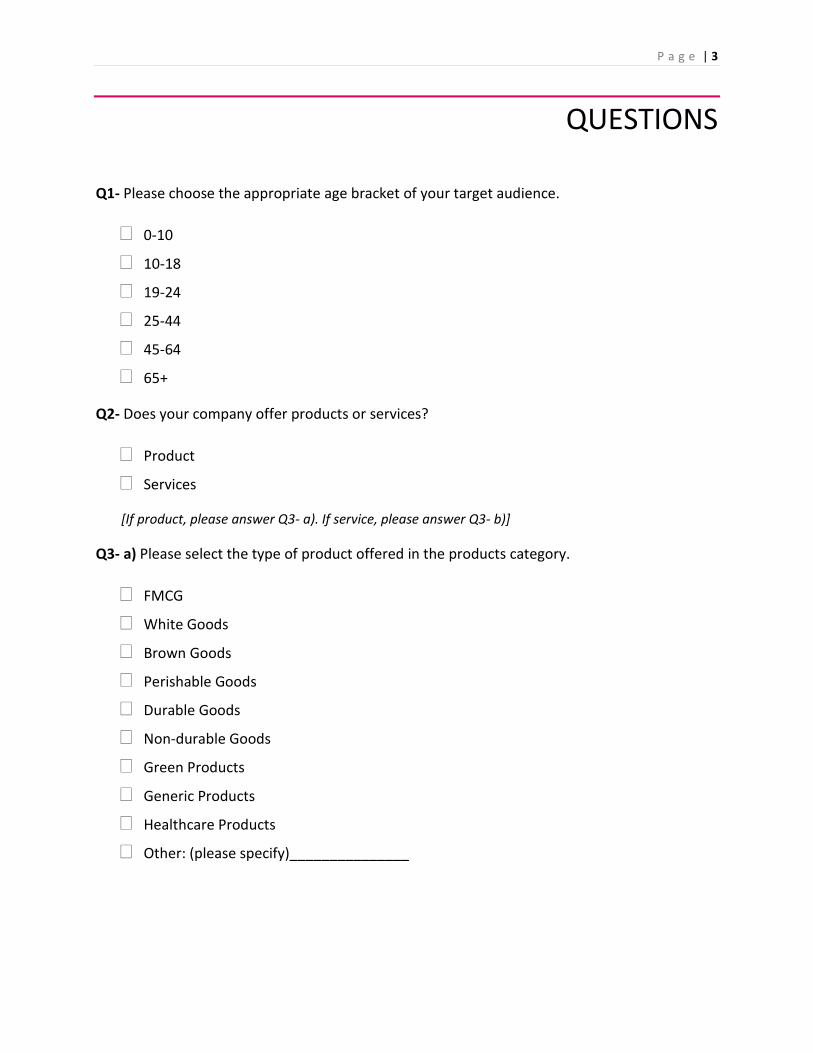
Q1- Please choose the appropriate age bracket of your target audience.
� 0-10
� 10-18
� 19-24
� 25-44
� 45-64
� 65+
Q2- Does your company offer products or services?
� Product
� Services
[If product, please answer Q3- a). If service, please answer Q3- b)]
Q3- a) Please select the type of product offered in the products category.
� FMCG
� White Goods
� Brown Goods
� Perishable Goods
� Durable Goods
� Non-durable Goods
� Green Products
� Generic Products
� Healthcare Products
� Other: (please specify)_______________

P a g e | 4
b) Please select the type of service offered in the service category.
� Childcare
� Cleaning and Maintenance
� Consulting
� Education and Training
� Entertainment
� Financial Services
� Healthcare
� Marketing and Advertising
� Telecommunication
� Tourism
� Other: (please specify)_______________
Q4- On a scale of 1 to 10, 1 being extremely popular and 10 being extremely unknown, please rate your company as to where it stands amongst its target audience.
l_____l_____l_____l_____l_____l_____l_____l_____l_____l 1 2 3 4 5 6 7 8 9 10
Q5- Does your company advertise?
� Yes
� No
Q6- How important is advertising to your company?
� Extremely Important
� Very Important
� Important
� Low Importance
� Extremely Low
P a g e | 5
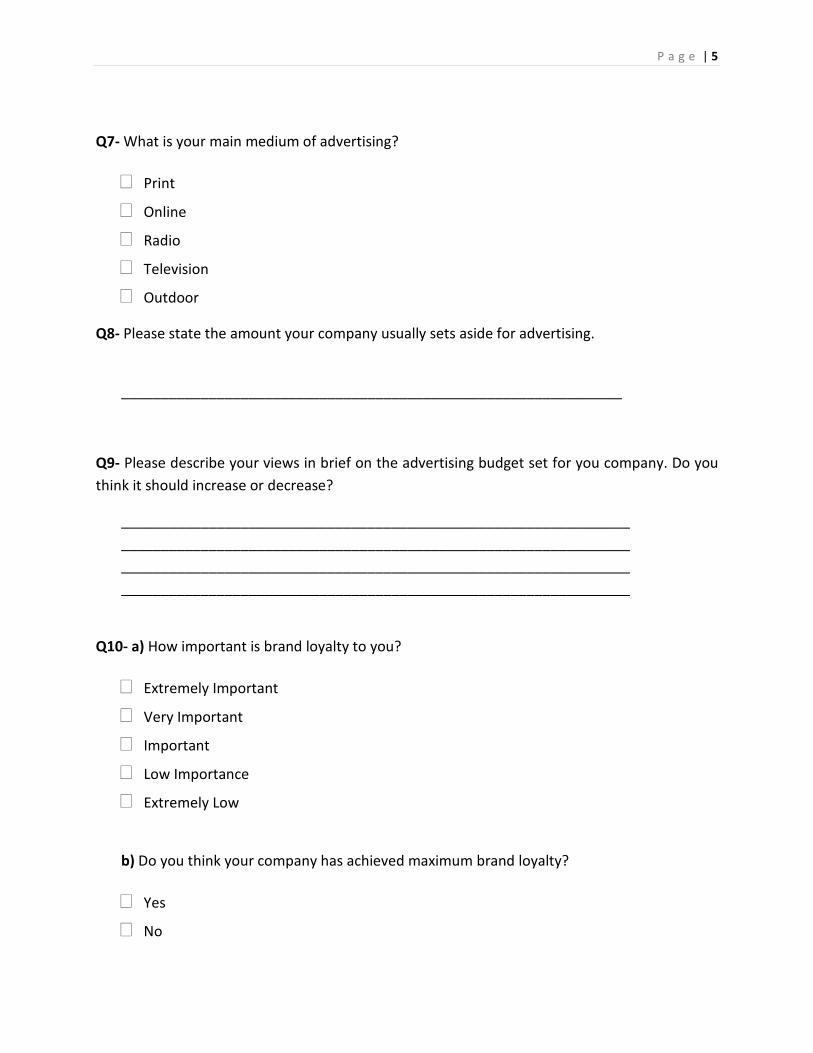
Q7- What is your main medium of advertising?
� Online
� Radio
� Television
� Outdoor
Q8- Please state the amount your company usually sets aside for advertising.
_______________________________________________________________
Q9- Please describe your views in brief on the advertising budget set for you company. Do you think it should increase or decrease?
________________________________________________________________ ________________________________________________________________ ________________________________________________________________ ________________________________________________________________
Q10- a) How important is brand loyalty to you?
� Extremely Important
� Very Important
� Important
� Low Importance
� Extremely Low
b) Do you think your company has achieved maximum brand loyalty?
� Yes
� No
P a g e | 6
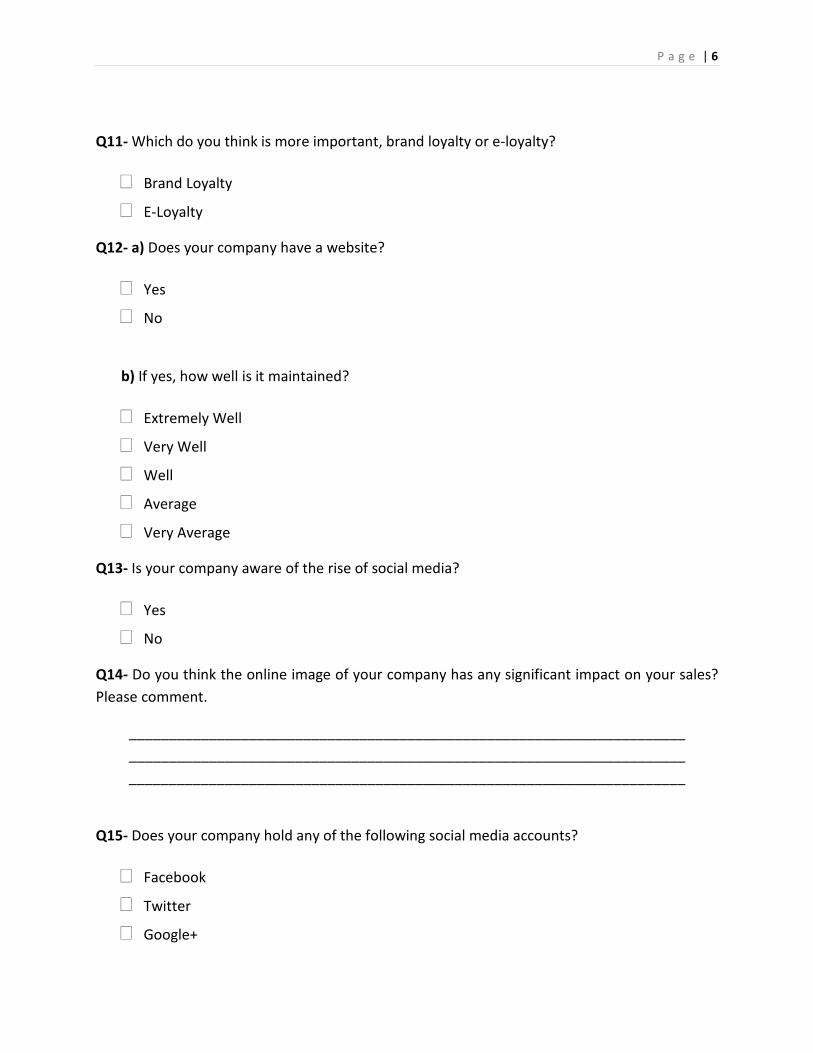
Q11- Which do you think is more important, brand loyalty or e-loyalty?
� Brand Loyalty
� E-Loyalty
Q12- a) Does your company have a website?
� Yes
� No
b) If yes, how well is it maintained?
� Extremely Well
� Very Well
� Well
� Average
� Very Average
Q13- Is your company aware of the rise of social media?
� Yes
� No
Q14- Do you think the online image of your company has any significant impact on your sales? Please comment.
______________________________________________________________________ ______________________________________________________________________ ______________________________________________________________________
Q15- Does your company hold any of the following social media accounts?
� Google+
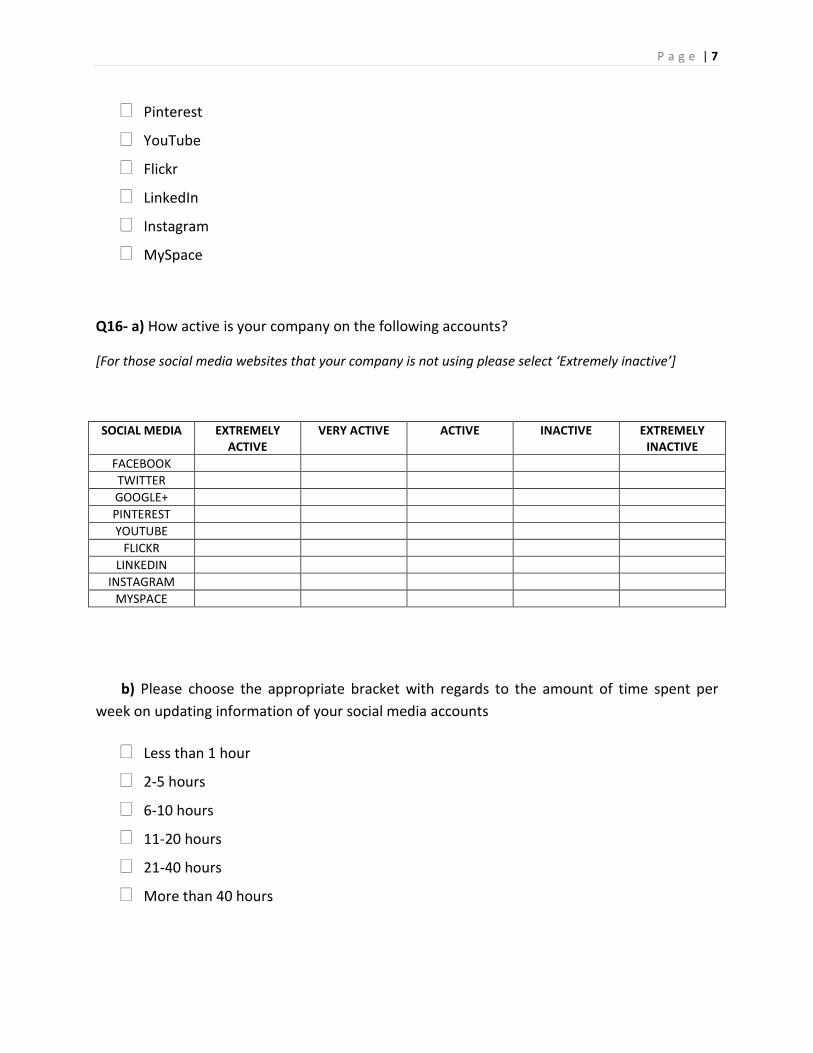
P a g e | 7
� YouTube
� Flickr
� MySpace
Q16- a) How active is your company on the following accounts?
[For those social media websites that your company is not using please select ‘Extremely inactive’]
SOCIAL MEDIA EXTREMELY ACTIVE
VERY ACTIVE ACTIVE INACTIVE EXTREMELY INACTIVE
FACEBOOK TWITTER GOOGLE+ PINTEREST YOUTUBE
FLICKR LINKEDIN
INSTAGRAM MYSPACE
b) Please choose the appropriate bracket with regards to the amount of time spent per week on updating information of your social media accounts
� Less than 1 hour
� 2-5 hours
� 6-10 hours
� 11-20 hours
� 21-40 hours
� More than 40 hours
P a g e | 8
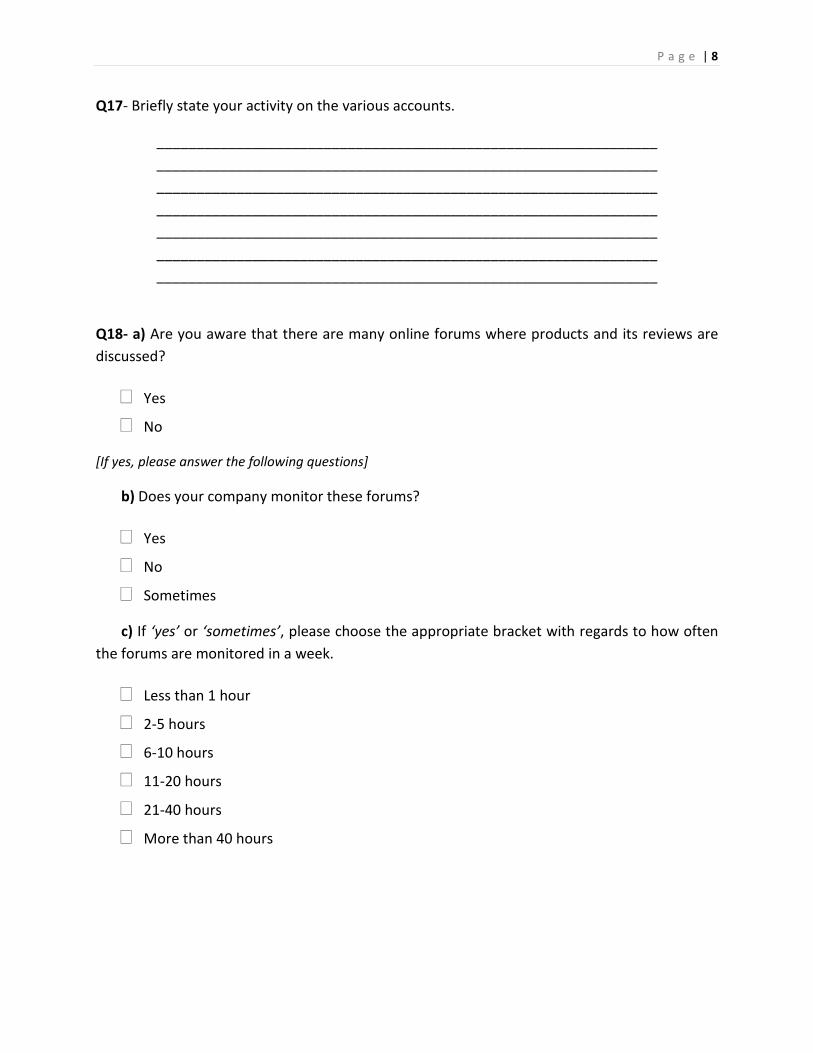
Q17- Briefly state your activity on the various accounts.
_______________________________________________________________ _______________________________________________________________ _______________________________________________________________ _______________________________________________________________ _______________________________________________________________ _______________________________________________________________ _______________________________________________________________
Q18- a) Are you aware that there are many online forums where products and its reviews are discussed?
� Yes
� No
[If yes, please answer the following questions]
b) Does your company monitor these forums?
� Yes
� No
� Sometimes
c) If ‘yes’ or ‘sometimes’, please choose the appropriate bracket with regards to how often the forums are monitored in a week.
� Less than 1 hour
� 2-5 hours
� 6-10 hours
� 11-20 hours
� 21-40 hours
� More than 40 hours
P a g e | 9
Q19- Do you think your company is exploiting the use of internet to its fullest?
� Yes
� No
Q20- Do you see your company getting more integrated with the online platform in the near future?
� Yes
� No
� Maybe
______________________________________________________________________________