Embed Size (px)
Citation preview

PHARMACOKINETICS AND DISPOSITION
Importance of hematocrit for a tacrolimus targetconcentration strategy
Elisabet Størset & Nick Holford & Karsten Midtvedt &Sara Bremer & Stein Bergan & Anders Åsberg
Received: 1 July 2013 /Accepted: 28 August 2013 /Published online: 27 September 2013# The Author(s) 2013. This article is published with open access at Springerlink.com
AbstractPurpose To identify patient characteristics that influence ta-crolimus individual dose requirement in kidney transplantrecipients.Methods Data on forty-four 12-h pharmacokinetic profilesfrom 29 patients and trough concentrations in 44 patientsmeasured during the first 70 days after transplantation(1,546 tacrolimus whole blood concentrations) were analyzed.Population pharmacokinetic modeling was performed usingNONMEM 7.2®.Results Standardization of tacrolimus whole blood concentra-tions to a hematocrit value of 45 % improved the model fitsignificantly (p<0.001). Fat-free mass was the best body sizemetric to predict tacrolimus clearance and volume of distribution.
Bioavailability was 49 % lower in expressers of cytochromeP450 3A5 (CYP3A5) than in CYP3A5 nonexpressers. Youngerfemales (<40 years) showed a 35 % lower bioavailability thanyounger males. Bioavailability increased with age for both malesand females towards a common value at age >55 years that was47% higher than themale value at age <40 years. Bioavailabilitywas highest immediately after transplantation, decreasing steeplythereafter to reach its nadir at day 5, following which it increasedduring the next 55 days towards an asymptotic value that was28 % higher than that on day 5.Conclusions Hematocrit predicts variability in tacrolimus wholeblood concentrations but is not expected to influence unbound(therapeutically active) concentrations. Fat-free mass, CYP3A5genotype, sex, age and time after transplant influence the tacro-limus individual dose requirement. Because hematocrit is highlyvariable in kidney transplant patients and increases substantiallyafter kidney transplantation, hematocrit is a key factor in theinterpretation of tacrolimus whole blood concentrations.
Keywords Tacrolimus . Hematocrit . Fat-freemass .
Population pharmacokinetics . Target concentrationintervention . Kidney transplantation
Introduction
Tacrolimus is an immunosuppressive drug widely used afterkidney transplantation. Applying a target concentration strategyis recommended to ensure adequate immunosuppression[1]. The initial dose of tacrolimus is typically calculated inproportion to total bodyweight, with subsequent doses adjustedon the basis of whole blood trough concentration measure-ments. The target concentration for initial and subsequent dos-ing varies from center to center with no detectable relationshipbetween achieved whole blood concentrations and the risk ofacute rejection [2]. Predicting the individual dose requirement
Electronic supplementary material The online version of this article(doi:10.1007/s00228-013-1584-7) contains supplementary material,which is available to authorized users.
E. Størset (*) :K. Midtvedt :A. ÅsbergDepartment of Transplant Medicine,Oslo University Hospital, Rikshospitalet, Oslo, Norwaye-mail: [email protected]
E. StørsetInstitute of Clinical Medicine, University of Oslo, Oslo, Norway
N. HolfordDepartment of Pharmacology and Clinical Pharmacology,University of Auckland, Auckland, New Zealand
S. BremerDepartment of Medical Biochemistry,Oslo University Hospital, Rikshospitalet, Oslo, Norway
S. BerganDepartment of Pharmacology,Oslo University Hospital, Rikshospitalet, Oslo, Norway
A. ÅsbergSchool of Pharmacy, University of Oslo, Oslo, Norway
Eur J Clin Pharmacol (2014) 70:65–77DOI 10.1007/s00228-013-1584-7

to achieve and maintain the desired target whole blood concen-tration of tacrolimus is challenging due to considerable vari-ability in apparent whole blood clearance (CL/F) betweenpatients [coefficient of variance (CV) 30–42 %] as well asbetween dosing occasions within patients (CV 40–71 %) [3].In addition, dose-normalized whole blood concentrations oftacrolimus tend to increase during the first months after kidneytransplantation, which has led to the suggestion of time-dependent pharmacokinetics [4, 5]. Both under- and overdosingfrequently occur during this period, and several dose adjust-ments are typically performed [6].
Tacrolimus distributes into and binds to erythrocytes, show-ing a blood-to-plasma ratio of approximately 50 with a hemat-ocrit of 45 % [7], and the unbound fraction in the blood is <1%[8]. The drug is routinely measured as total concentrations inwhole blood, although the unbound concentration is expectedto mediate the pharmacological effect. Hebert et al. [9] haverecently reviewed the pharmacological principles underlyingthe interpretation of whole blood concentrations and pointedout the potential dangers of adjusting tacrolimus doses based onwhole blood concentration alone. Since tacrolimus is a low-extraction-ratio drug [10], whole blood concentrations areexpected to increase in proportion to erythrocyte binding (pro-portional to hematocrit), while the unbound, therapeuticallyactive concentration remains unchanged. At the time of kidneytransplant, hematocrit is generally low, and it usually increasesduring the first months after transplantation as the recipientsrecover from kidney failure and erythrocyte production normal-izes [11]. Because changes in hematocrit are expected to changethe concentration of bound tacrolimus without modifying theunbound concentration [9], this trend should not be interpretedas the need for dose adjustment. It is currently unclear howmuch of the apparent time-dependent pharmacokinetics oftacrolimus during the first post-transplant months are explainedby changes in hematocrit.
In this study, a population pharmacokinetic model for tacro-limus was developed using data from adult kidney transplantrecipients. The purpose was to identify patient characteristics thatinfluence tacrolimus individual dose requirement. Measuredwhole blood concentrations of tacrolimus were standardized toa normal hematocrit value (45%). This led to the development ofa pharmacokinetic model that can be used to individualize tacro-limus dosing to achieve a target concentration that better reflectsthe unbound pharmacologically active drug.
Materials and methods
Patients and data
Data on a total of 1,546 tacrolimus whole blood concentrationswere obtained from 69 adult patients who underwent kidneytransplantation at Oslo University Hospital, Rikshospitalet and
who received tacrolimus as part of their immunosuppressivetherapy. Patients who received multiple organs or who receiveddrugs that were known to pharmacokinetically interact withtacrolimus were excluded. However, if such drugs were usedby >5 % of the patients, the patients were allowed in theanalysis, and the drug was analyzed as a covariate. The patientscontributed data to an Intensive Group or a TDM (therapeuticdrug monitoring) Group. Four patients contributed data to bothgroups. The Intensive Group consisted of 12-h concentration–time profiles from 29 patients in a stable phase after transplan-tation (range 26 days–18 years). The data were collected on atotal of 44 dosing occasions as described in three previouslypublished studies [12–14]. The TDM Group consisted of rou-tine trough concentrations (C0) measured in 44 patients duringthe first 70 days following kidney transplantation. Dosing at12-h intervals and full compliance were presumed unlessmissed doses were recorded in the patient chart. Patients weretold to be fasting at the time of drug intake.
The following data were collected for covariate analysis:cytochrome P450 3A5 (CYP3A5) genotype, hematocrit, sex,age, total body weight, height, serum albumin, serum creati-nine, C-reactive protein, aspartate aminotransferase, alanineaminotransferase, total serum bilirubin, alkaline phosphatase,acute rejection episodes, oral prednisolone dose, intravenousmethylprednisolone dose, and use of other potentially interac-tive drugs. Covariates with time-dependent values were up-dated for each recorded tacrolimus measurement. Covariatesmissing on the day of transplantation were imputed by carry-ing back the first known value. Covariates missing at any latertime point were imputed by carrying forward the last knownvalue. However, if more than two hematocrit values weremissing in sequence and the hemoglobin level was known,hematocrit values were derived by linear regression betweenall known hematocrit and hemoglobin values within the pa-tient. A summary of the study designs is listed in Table 1.
The study was approved by the Regional Committee forMedical Research Ethics and by the Norwegian MedicinesAgency. All patients gave written informed consent.
Immunosuppressive therapy
All patients received oral tacrolimus (Prograf® capsules;Astellas Pharma US Inc., Northbrook, IL). According to thecenter transplant protocol, initial dosage for the TDM Groupwas 0.04 mg/kg total body weight (0.05 mg/kg for high-riskpatients) twice daily, adjusted to the nearest 0.5 mg dose. Thedosage was subsequently adapted by measuring whole bloodtrough concentrations to maintain concentrations within therange of 3–7 μg/L in standard risk patients or 8–12 μg/L inhigh-risk patients. High-risk patients were defined by panelreactive antibody of >20 % and/or presence of donor-specificantibodies. Trough concentrations of tacrolimus were initiallymeasured three to four times per week. Depending on clinical
66 Eur J Clin Pharmacol (2014) 70:65–77
status and graft function, this frequency decreased in parallelwith increasing time since transplantation.
In addition to tacrolimus, the immunosuppressive regimenfor the TDM Group consisted of 0.75 g mycophenolatemofetil twice daily (without target concentration intervention),induction therapy with 20 mg of basiliximab on the day oftransplant (day 1) and on day 5, an intravenous bolus of250 mg methylprednisolone on day 1 and oral prednisoloneonce daily according to the following tapering regimen: 20mgon days 2–15, 15 mg on days 16–29, 10 mg on days 30–61,7.5 mg on days 62–180 and 5 mg from day 181 onwards.High-risk patients received induction therapy with 500 mg/kgintravenous human immune globulins daily on days 1–6 and375mg/m2 rituximab on day 1, intravenous boluses of 500mgand 80 mg methylprednisolone on day 1 and 2, respectively,and oral prednisolone at a total dose of 80 mg on day 3,followed by tapering during days 4–7 to 30 mg daily, contin-ued with once-daily doses of 20 mg on days 8–29, 15 mg ondays 30–61, 10 mg from day 62 and in selected patientstapered to 5 mg from day 181 onwards. For the IntensiveGroup, prednisolone dose was the only recorded concomitantimmunosuppressive drug on which information was provided(range 0–25 mg daily).
Analytical assays
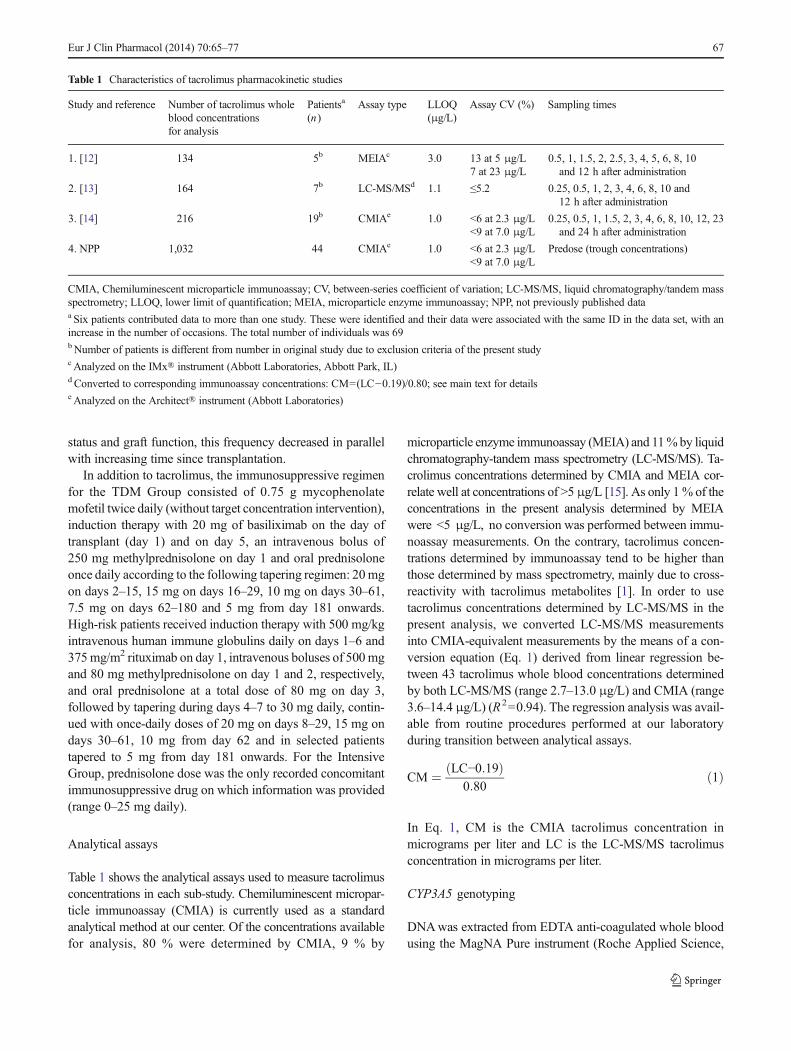
Table 1 shows the analytical assays used to measure tacrolimusconcentrations in each sub-study. Chemiluminescent micropar-ticle immunoassay (CMIA) is currently used as a standardanalytical method at our center. Of the concentrations availablefor analysis, 80 % were determined by CMIA, 9 % by
microparticle enzyme immunoassay (MEIA) and 11%by liquidchromatography-tandem mass spectrometry (LC-MS/MS). Ta-crolimus concentrations determined by CMIA and MEIA cor-relate well at concentrations of >5 μg/L [15]. As only 1% of theconcentrations in the present analysis determined by MEIAwere <5 μg/L, no conversion was performed between immu-noassay measurements. On the contrary, tacrolimus concen-trations determined by immunoassay tend to be higher thanthose determined by mass spectrometry, mainly due to cross-reactivity with tacrolimus metabolites [1]. In order to usetacrolimus concentrations determined by LC-MS/MS in thepresent analysis, we converted LC-MS/MS measurementsinto CMIA-equivalent measurements by the means of a con-version equation (Eq. 1) derived from linear regression be-tween 43 tacrolimus whole blood concentrations determinedby both LC-MS/MS (range 2.7–13.0 μg/L) and CMIA (range3.6–14.4 μg/L) (R2=0.94). The regression analysis was avail-able from routine procedures performed at our laboratoryduring transition between analytical assays.
CM ¼ LC−0:19ð Þ0:80
ð1Þ
In Eq. 1, CM is the CMIA tacrolimus concentration inmicrograms per liter and LC is the LC-MS/MS tacrolimusconcentration in micrograms per liter.
CYP3A5 genotyping
DNAwas extracted from EDTA anti-coagulated whole bloodusing the MagNA Pure instrument (Roche Applied Science,
Table 1 Characteristics of tacrolimus pharmacokinetic studies
Study and reference Number of tacrolimus wholeblood concentrationsfor analysis
Patientsa
(n)Assay type LLOQ
(μg/L)Assay CV (%) Sampling times
1. [12] 134 5b MEIAc 3.0 13 at 5 μg/L 0.5, 1, 1.5, 2, 2.5, 3, 4, 5, 6, 8, 10and 12 h after administration7 at 23 μg/L
2. [13] 164 7b LC-MS/MSd 1.1 ≤5.2 0.25, 0.5, 1, 2, 3, 4, 6, 8, 10 and12 h after administration
3. [14] 216 19b CMIAe 1.0 <6 at 2.3 μg/L 0.25, 0.5, 1, 1.5, 2, 3, 4, 6, 8, 10, 12, 23and 24 h after administration<9 at 7.0 μg/L
4. NPP 1,032 44 CMIAe 1.0 <6 at 2.3 μg/L Predose (trough concentrations)<9 at 7.0 μg/L
CMIA, Chemiluminescent microparticle immunoassay; CV, between-series coefficient of variation; LC-MS/MS, liquid chromatography/tandem massspectrometry; LLOQ, lower limit of quantification; MEIA, microparticle enzyme immunoassay; NPP, not previously published dataa Six patients contributed data to more than one study. These were identified and their data were associated with the same ID in the data set, with anincrease in the number of occasions. The total number of individuals was 69bNumber of patients is different from number in original study due to exclusion criteria of the present studycAnalyzed on the IMx® instrument (Abbott Laboratories, Abbott Park, IL)d Converted to corresponding immunoassay concentrations: CM=(LC−0.19)/0.80; see main text for detailse Analyzed on the Architect® instrument (Abbott Laboratories)
Eur J Clin Pharmacol (2014) 70:65–77 67

Penzberg, Germany). CYP3A5 genotyping (rs776746;NG_007938.1 :g .12083G >A, A=CYP3A5*1 andG=CYP3A5*3 ) was performed by real-time PCR and meltcurve analysis with hybridization probes on the LightCycler®480 instrument (Roche Applied Science) or by a previouslyreported PCR-restriction fragment length polymorphism as-say [16]. Primers for the melt curve assay were designed usingLightCycler Probe Design software version 2 (Roche AppliedScience), and hybridization probe sequences were derivedfrom Cheung et al. [17].
Population pharmacokinetic modeling
Structural model
Models with one or two compartments, zero or first orderabsorption and with or without an absorption lag time wereinvestigated. Pharmacokinetic parameters were estimated interms of clearance (CL), intercompartmental clearance (Q)and volumes of distribution (V1, V2). The population valueof bioavailability (F) was defined as 1, and subgroup valuesand individual values of F were estimated relative to thepopulation value. Because only data following oral adminis-tration were available, apparent disposition parameter esti-mates were obtained (e.g. CL/F, V1/F). Random effects inthe pharmacokinetic parameters were modeled in terms ofbetween subject variability (BSV) and between occasion var-iability (BOV). BSVand BOV were initially estimated for allpharmacokinetic parameters except lag time. Random effectswere modeled exponentially (Eq. 2):
Pik ¼ PGRP � eηiþηk ð2Þ
where Pik is the value of parameter P for the i-th individual atthe k-th occasion, PGRP is the group value of P in the popula-tion, eηi is the deviation between PGRP and the individualvalue Pi and eηk is the deviance between the individual valuePi and the occasion-specific value Pik [18]. For the IntensiveGroup, one hospital visit was defined as one occasion. For theTDMGroup, a new occasion was defined when a dose changetook place. Equation 3 shows the residual error model usedthroughout the analysis:
Yij ¼ Concij þ θstudyi � ε1 � Concij þ ε2� �� eηerri ð3Þ
where Yij and Concij are the model-predicted drug concentra-tions with and without residual error, respectively, for the i-thindividual at the j-th measurement, θstudyi is a study-specificfixed effect, ε1 is a residual error term proportional to themeasured concentrations, ε2 is an additive error term and eηerri
is the individual random difference in residual error for the i-thindividual [19]. The random variables ηi, ηk, ε1, ε2 and ηerri
were assumed to be normally distributed with means of zeroand variances ω2
P, π2P , σ1
2, σ22 and ωerr
2, respectively.
Covariate model
Tacrolimus total concentrations (Ctot) in whole blood are thesum of the unbound (Cu), plasma bound (Cp) and erythrocytebound (Cb) concentrations. Assuming a single binding site,Ctot can be described as a function of the unbound concentra-tion (Eq. 4):
Ctot ¼ Cu � 1þ Cbmax
Cu þ Cu50
� �ð4Þ
where Cbmax is the maximum concentration bound to eryth-rocytes and Cu50 is the unbound concentration leading to halfmaximum binding.With a blood:plasma ratio of approximately50 [7], Ctot will mainly reflect Cb. By assuming that Cu is smallrelative to Cu50 and by standardizing Cbmax to a hematocritvalue of 45 %, Eq. 4 can be written as Eq. 5:
Ctot ≅ Cb ¼ Cstd � R� Hct
45%ð5Þ
where Cstd is the standardized concentration proportional toCu, and R is the ratio between Cbmax and Cu50 at a hematocritof 45 %. Equation 5 was included in the model by relating thepharmacokinetic parameters and predictions to Cstd ratherthan to Ctot. Potential concentration-dependent binding oftacrolimus to erythrocytes was investigated using Eq. 6:
Ctot ¼ Cstd � Cstdmax
Cstd þ Cstd50� Hct
45%ð6Þ
where Cstdmax and Cstd50 are estimable parameters reflectingmaximum binding capacity of tacrolimus to erythrocytes andthe standardized concentration associated with half maximumbinding, respectively. Similar principles to those described forhematocrit were used to investigate the standardization ofplasma protein binding using serum albumin concentrations.
The pharmacokinetic disposition parameters were relatedto fat-free mass using theory-based allometric coefficients of3/4 for clearances and 1 for volumes of distribution [20]. Fat-free mass was predicted from total body weight, height andsex (Eqs. 20 and 21 in [21]). Potential additional effects of fatmass (i.e. total body weight—fat-free mass) to the effect offat-free mass on the pharmacokinetic parameters were esti-mated as described by Anderson and Holford [20].
All available patient characteristics were evaluated as co-variates on parameters where an effect was biologically plau-sible or if an effect was found in previous studies. Regardingcovariates for which little is known about the mechanism of
68 Eur J Clin Pharmacol (2014) 70:65–77

influence on tacrolimus pharmacokinetics (age, time after trans-plantation, liver function test values), continuous covariateeffects were initially investigated by binning observed concen-trations by covariate value (e.g. age bins of 20–29 years,30–39 years and so on). The early post-transplant period wasbinned by dividing it into 12 time intervals with similar numberof observations in each interval: day 2, 3, 4–5, 6–7, 8–10,11–14, 15–21, 22–28, 29–42, 43–56, 57–70 and >70 days. Amean pharmacokinetic parameter (CL or F) was estimatedwithin each bin relative to a reference bin. Empirical models(linear, power, exponential or sigmoid functions) were subse-quently used to match the discrete distribution of parametervalues as a function of the continuous covariate and of time.This method helps to identify and obtain initial estimates ofcontinuous functions that describe the data when there is littleprior information on what relationship to expect [22]. Binarycovariate effects (e.g. sex) were investigated by estimating thefractional change in one group compared to the other.
Model evaluation and statistical analysis
Model selection was guided by biological plausibility and thelikelihood ratio test [difference in objective function value(ΔOFV)]. A decrease in OFV of >6.6 was considered to bestatistically significant for the addition of one parameter(p <0.01) [23]. Prediction-corrected visual predictive checks(pcVPCs) were generated to compare observed data with90 % prediction intervals constructed from 100 simulated sub-sets of the original dataset [24]. Time after dose, time aftertransplantation and other continuous covariates were used asindependent variables in pcVPCs. Covariates were includedstepwise and subsequently independently deleted fromthe full model (backward elimination) to evaluate theirfinal statistical contribution [25]. Confidence intervals(CIs) of the parameter estimates were generated from1,000 nonparametric bootstrap replicates [26]. Thesewere used to guide model simplification. Random ef-fects were retained if the lower 2.5th percentile did notapproach zero. Covariates were retained if the 95 % CIof the covariate coefficient estimate did not include thevalue equivalent to no effect. To describe variability inhematocrit between and within patients, hematocrit wasmodeled by BSV and BOV (considering each hematocritmeasurement as a single occasion). The time course of hemat-ocrit after transplantation was described by a sigmoid Emaxfunction.
Modeling was performed in NONMEM® v. 7.2 [23] usingthe first order conditional estimation method with interaction.Models and bootstrap replicates were run using Wings forNONMEM® [27]. Statistical and graphical analyses wereperformed using the statistical package R® (v. 2.15.0; RFoundation for Statistical Computing, Vienna, Austria).Means for normally distributed covariates were compared
using two-tailed t tests with assumption of equal variance. Ifnot stated otherwise, descriptive statistics are expressed as themean ± standard deviation.
Results
Patients and data
Demographic and clinical characteristics, details about tacro-limus treatment and the number of missing covariate valuesare presented in Table 2. Patients using carbamazepine (n =2)were excluded because of potential drug interaction withtacrolimus. Patients using nifedipine (n =26), lansoprazole(n =12) and/or cinacalcet (n =5) were retained. Figure 1ashows the evolution of the dose-normalized tacrolimus troughwhole blood concentrations after transplantation. In total,41 % of the measured trough concentrations in the TDMgroup were outside the target concentration ranges definedby the hospital protocol. The percentage of measured concen-trations outside these ranges for week 1, 2, 3, 4, 5–6, 7–8 and9–10 after transplantation were 42, 41, 47, 42, 43, 37 and36 %, respectively. It was however not known if the clinicianvoluntarily had deviated from the protocol.
Hematocrit increased during the first 70 days after trans-plantation (Fig. 1b). The population baseline hematocrit onday 1 was estimated to be 29.7 %, increasing towards anasymptotic value of 37.4 % with half maximum increase onday 19 post-transplant. BSVand BOVof the hematocrit wereestimated to be 8 and 11 %, respectively. Average hematocritdid not vary by sex (p =0.28) or CYP3A5 genotype (p =0.51).Average total body weight was 19 kg higher in males (86±21 kg) than in females (67±15 kg) (p <0.001). Average fat-free mass was 18 kg higher in males (64±10 kg) than infemales (46±5 kg) (p <0.001).
Population pharmacokinetic modeling
Structural model
Tacrolimus pharmacokinetics were best described by a two-compartment model and first order absorption with a lag time.A study-specific absorption rate and lag time improved thedescription of substudy 2.When the BOVwas estimated for F,the lower 2.5th percentile of the bootstrap distribution of BOVin the four disposition parameters (CL/F, V1/F, Q/F and V2/F)approached zero. BOV in these parameters were thereforeremoved (ΔOFV+7.3 for four parameters, p =0.12). For theabsorption rate constant (ka), BSV was removed and BOVwas retained (ΔOFV+3.4 by removing BSV, p =0.07;ΔOFV+28.7 by removing BOV, p <0.001), indicating thatthe variability in absorption rate is mainly dependent ondosing occasion rather than being a subject-specific process.
Eur J Clin Pharmacol (2014) 70:65–77 69

We chose to estimate a full correlation matrix betweenCL/F, V1/F, Q/F and V2/F (ΔOFV=−59.0 for six parameters,p <0.001) rather than to estimate BSV in F (ΔOFV=−32.4 forone parameter, p <0.001). The pcVPC over the range ofhematocrit revealed a systematic prediction error at this stage(Fig. 2b).
Covariate model
The model fit improved significantly by linearly standardizingwhole blood concentrations to a hematocrit of 45 % (ΔOFV=−78.3, p <0.001). The estimated value for the parameter R inEq. 5 was 0.99, and this parameter was removed withoutworsening the model fit (ΔOFV=+1.2, p =0.27). By stan-dardizing for hematocrit, the systematic prediction error overthe range of hematocrit values was no longer present (Fig. 2c).Accounting for the possibility of saturated erythrocyte proteins
(Eq. 6) or including similar standardization of the concentra-tions using serum albumin did not improve the model fit.
The parameters describing the effects of fat mass in addi-tion to the effect of fat-free mass on the disposition parameterswere estimated to be close to zero [bootstrap means of0.1 (95 % CI −0.7 to 1.9) for clearances and 0.3 (95 %CI −0.7 to 2.4) for volumes of distribution]. This indicatedthat fat-free mass is a more predictive body size metric fortacrolimus pharmacokinetics than total body weight. The OFVdid not increase by fixing these parameters to zero. CYP3A5genotype significantly influenced both CL and F (p <0.001).
After including body size in the model, it was found that Fwas significantly lower in females (ΔOFV=−9.8, p =0.002).When an age-specific value of F was estimated in each of thefive age categories, it became apparent that F changed be-tween age 40 and 50 years and was essentially constant at alower relative value in patients aged <40 years and constant
Table 2 Demographic and clinical data
Data Number Meana 95 %observationinterval
Change in TDM Group after transplantation Number ofmissing datapointsDay 1 Day 70
Mean 95 % observationinterval
Mean 95 % observationinterval
Demographic data
Patients 69
Sex (male /female) 50/19 0/69
CYP3A5 genotype (*1/*1, *1/*3, *3/*3) 0/10/59 0/69
Age (years) 43 22–73 0/69
Height (cm) 176 151–197 0/69
Total body weight (kg) 81 51–131 83 53–140 80 49–128 142/1,546
Predicted fat-free mass (kg) 59 40–82 60 41–84 55 39–82 142/1,546
Hematocrit (%) 36 29–43 31 25–39 38 32–42 109/1,546
Serum creatinine (μmol/L) 147 73–347 409 123–1,079 120 78–208 2/1,546
C-reactive protein (mg/L) 7 <0.6–24 12 <0.6–34 3 <0.6–10 49/1,546
Serum albumin (g/L) 42 33–47 37 27–45 45 37–50 498/1,546
Total serum bilirubin (μmol/L) 7 3–13 5 1–14 6 3–15 500/1,546
Aspartate aminotransferase (IU/L) 23 15–40 35 13–111 20 14–29 498/1,546
Alanine aminotransferase (IU/L) 31 10–91 50 13–170 22 11–43 498/1,546
Alkaline phosphatase (IU/L) 66 30–106 60 34–95 70 41–105 499/1,546
Pharmacokinetic data (TDM Group)
Samples 1,032
Samples per patient 23 13–29
Tacrolimus trough concentration (μg/L) 7.0 2.7–12.4
Pharmacokinetic data (Intensive Group)
Samples 514
Samples per patient 18 9–39
Tacrolimus concentration (μg/L) 11.3 3.4–26.7
CYP3A5, Cytochrome P450 3A5; TDM, therapeutic drug monitoringa Calculated from mean value across all observation times in each patient
70 Eur J Clin Pharmacol (2014) 70:65–77

at a higher relative value in patients aged >55 years. Asigmoid function of age was useful to describe these changesand improved the model further (ΔOFV=−18.1 for threeparameters, p <0.001) (Eq. 7):
FGRP ¼ Fminage þ 1−Fminage
1þ AgeFage50
� �−Hill Fageð7Þ
where Fminage is the asymptotic value of F at a low agerelative to the highest value of F with increasing age, andFage50 is the age of the half maximum change in F with theassociated shape coefficient HillFage. The estimates of Fage50and HillFage were similar for males and females, whereasFminage was different between males and females. These
results indicate that the sex difference in F is greatest inyounger patients (<40 years) and that the difference dimin-ishes at age >55 years (Fig. 3a).
The time interval-specific value of F changed systematical-ly with time after transplantation. These changes could bedescribed using two distinct sigmoid functions of time aftertransplant (Fig. 4a and Eq. 8). A random effect was includedto describe BSV in the extent of change at a late time point:
Fi ¼ Fmaxearly þ 1−Fmaxearly
1þ TxtFearly50
� �−Hill Fearly
0B@
1CA� 1þ Fmaxlate � eηi
1þ TxtFlate50
� �−Hill Flate
0B@
1CA
ð8Þwhere Fi is the individual value of F, Fmaxearly is the maxi-mum value of F immediately after transplantation, Fearly50 isthe day with half maximum early effect on F with the associ-ated shape coefficient HillFearly describing the steepness of thischange, Flate50 is the day with half maximum later effect on Fwith the associated steepness coefficient HillFlate, Fmaxlate isthe asymptotic maximum value of F with increasing post-transplant time and eηi is the difference between the individualasymptote and the population asymptote, where ηi’s areassumed to be normally distributed with mean zero and var-ianceωFlate
2. The day of transplant was defined as day 1. Thesix sigmoid model parameters replaced the 12 time intervalparameters without loss in model goodness of fit (ΔOFV=−64.8 vs. −69.5, respectively, compared to a model withouttime after transplantation as a covariate). Estimation of BSVinFmaxlate resulted in a further decrease (ΔOFV=−40.7 for oneparameter, p <0.001). The data did not support estimation ofBSV in any of the remaining parameters in Eq. 8. No time-varying covariate, including prednisolone dose and liver func-tion test values, replaced the empirical time model for Fwithout a loss in model goodness of fit.
Model reduction and evaluation
The study-specific residual errors for substudies 1 and 4 weresimilar and joined (ΔOFV+0.9 for one parameter, p =0.34).The lower 2.5th percentile of the bootstrap distribution of theadditive residual error term and BSV in the residual errorapproached zero. Therefore, only the proportional error termwas retained. All random effects describing correlationsbetween disposition parameters except from between CL/Fand Q/F were removed because their 95 % CIs included zero.The effect of CYP3A5 genotype on CL was removed becausethe 95 % CI of 0.81–1.46 did not support its inclusion inaddition to an effect on F, which had a 95%CI not including 1(0.39–0.83) (ΔOFV +0.01 for one parameter, p =0.91).Removing the remaining covariates significantly worsenedthe goodness of fit.
Expressed as bootstrap averages of the final model (Table 3),we found that F was 49% lower in CYP3A5 expressers than in
Fig. 1 a Dose-normalized whole blood trough concentrations of tacro-limus (tac) observed in the TDM Group during the first 70 days aftertransplantation. Thin lines 44 individual patients, thick line a smoother toshow the trend with time. b Time course of hematocrit (%) during the first70 days after transplantation. Thin lines 44 individual patients that werefollowed during this period, thick line sigmoid Emax model fit to the datato describe changes in hematocrit as a function of time
Eur J Clin Pharmacol (2014) 70:65–77 71

Fig. 3 a Thick horizontal lines Age interval-specific average values ofbioavailability (F) estimated in males (black) and females (gray) relative tomales aged >60 years (defined asF=1). Lines Model-estimated functions forchanges in bioavailabilitywith age inmales (black dashed) and females (graysolid). b pcVPC using the final model as a function of age. Solid red lineMedian observed tacrolimus concentration (prediction-corrected), dashed redlines 90 % observation interval (5th to 95th percentile), solid black linemedian model-predicted concentrations, dashed black lines 90 % predictioninterval. Gray-shaded areas 95 % CI for each model-predicted percentile
Fig. 2 a Prediction-corrected tacrolimus whole blood concentrationsover the range of hematocrit, b prediction-corrected visual predictivecheck (pcVPC) over the range of hematocrit using the basemodel withoutcovariates, c pcVPC over the range of hematocrit using the base modelwith hematocrit standardized concentrations. Solid red line Median
observed tacrolimus concentration (prediction-corrected), dashed redlines 90 % observation interval (5th to 95th percentile), solid black linemedian model-predicted concentrations, dashed black lines 90 % predic-tion interval.Gray-shaded areas 95% confidence intervals (CIs) for eachmodel-predicted percentile
Fig. 4 a Thick horizontal lines Time interval-specific average values ofbioavailability after transplantation, estimated relative to the value at day 5(defined asF=1).Thin continuous line Model-estimated time course of relativebioavailability during the first 70 days after transplantation. b pcVPC using thefinal model as a function of the first 70 days after transplantation. Solid red lineMedian observed tacrolimus concentration (prediction-corrected), dashed redlines 90%observation interval (5th to 95th percentile), solid black line medianmodel predicted concentrations, dashed black lines 90 % prediction interval.Gray-shaded areas 95 % CI for each model-predicted percentile
72 Eur J Clin Pharmacol (2014) 70:65–77

Table 3 Original data estimates and bootstrap average parameter estimates with 95 % confidence intervals
Parameter Unit Original data estimatea Bootstrap average Bootstrap 95 % CIb
CL/Fn L/h 20.5 20.5 17.3–24.6
V1/Fn L 105 107 87–136
Q/Fn L/h 35.8 37.3 21.5–48.5
V2/Fn L 450 424 297–583
ka h−1 1.14 1.18 0.80–1.78
ka, study 2 h−1 0.37 0.38 0.31–0.48
Lag time h 0.21 0.22 0.20–0.24
Lag timestudy 2 h 0.82 0.81 0.65–0.90
Covariates on F
CYP3A5 *1/*3 factor 0.51 0.51 0.42–0.62
Age and sex
Fminage, females 0.44 0.43 0.23–0.60
Fminage, males 0.68 0.66 0.36–0.89
Fage50 years 44 47 39–70
HillFage 12.2 14.0 3.5–24.9
Time, early
Fmaxearly 1.87 2.04 1.60–3.9
Fearly50 days 2.6 2.5 1.7–3.0
HillFearly 10.0c 9.4 3.7–10.0c
Time, late
Fmaxlate 0.27 0.28 0.14–0.49
Flate50 days 30 31 24–40
HillFlate 2.3 2.5 1.6–4.7
BSV
CL/Fn % 33 31 21–40
V1/Fn % 14 14 0.2–37
Q/Fn % 91 86 51–114
V2/Fn % 52 52 32–74
HillFlate % 117 113 78–146
Correlation
CL/Fn∼Q/Fn 0.75 0.74 0.41–0.92
BOV
Fn % 16 16 13–18
ka % 63 60 41–84
Residual variability
Proportional error % 16.7 16.7 15.2–18.4
Study 2 factor 0.57 0.56 0.41–0.72
Study 3 factor 0.73 0.72 0.57–0.90
CI, Confidence interval, Fn, bioavailability at baseline nadir (5 days after transplantation); CL/Fn, apparent clearance; V1/Fn, apparent central volume ofdistribution; Q/Fn, apparent intercompartmental clearance; V2/Fn, apparent peripheral volume of distribution; ka, absorption rate constant; FFM, fat-free mass;Fminage, the minimum value of F at decreasing age relative to reference (male > 60 years); Fage50, the age with half maximum effect on F; HillFage, shapecoefficient for the change in Fwith age; Fmaxearly, themaximum increase in F immediately after transplantation relative to Fn; Fearly50, the daywith half maximumearly effect on F;HillFearly, shape coefficient for the change in F at early time; Fmaxlate, maximum increase in F at later time point, relative to Fn; Flate50, the daywithhalf maximum later effect on F; HillFlate, shape coefficient for the change in F at later time; BSV, between subject variability; BOV, between occasion variability
The final model was parameterized as follows: CL/Fn=20.5×(FFM /60)3/4 L/h; V1/Fn=107×(FFM /60) L; Q/Fn=37.3×(FFM /60)3/4 L/h; V2/Fn=424×(FFM /60) L
F=[2.04+(1−2.04)/(1+(TXT/2.5)−9.4 )]×[1+0.28 / (1+(TXT/31)−2.5 )]×[Fminage+(1−Fminage)/(1+(AGE/47)−14 )]× FCYP where Fminage=0.43 in
females and 0.66 in males, FCYP is 0.51 in CYP3A5 expressers and 1 in CYP3A5 nonexpressers and TXT is the time after transplantation in daysa Standardized to 40-year-old male, CYP3A5 nonexpresser with fat-free mass of 60 kg and hematocrit of 45 %, at a time point with the lowest estimatedbioavailability (Fn, day 5 post-transplant)b 2.5–97.5 percentile obtained from 500 bootstrap replicatesc Upper bound
Eur J Clin Pharmacol (2014) 70:65–77 73

CYP3A5 nonexpressers. Furthermore, F was reduced to 0.43and 0.66 for females and males, respectively, at the lowest agescompared to the plateau value set to 1 at highest age in males.The plateau value for females with increasing age was estimat-ed as 1 (not different from males). The steepest change in F withage occurred around the age of 47 years for both sexes. More-over, F was 104 % higher immediately after transplantationrelative to its lowest value, followed by a steep decrease(HillFearly=9.4) to a nadir (the reference baseline where F isdefined as 1), with half of the change at day 2.5 after transplan-tation. F then increased more slowly (HillFlate=2.5) to an asymp-totic value 28% higher than the nadir (BSV=113%)with half ofthe change after 31 days. PcVPCs indicated that the model wasable to predict tacrolimus concentrations over the range of all theincluded covariates (shown for age in Fig. 3b and for time aftertransplantation in Fig. 4b).
Discussion
In this study, a population pharmacokinetic model was devel-oped for tacrolimus by combining trough concentration datafrom the early post-transplant phase with rich sampling frompatients in a stable phase after kidney transplantation. Hemat-ocrit influenced the whole blood concentrations, while fat-freemass, CYP3A5 genotype, sex, age and time post-transplantwere identified as factors influencing tacrolimus individualdose requirement to achieve a target concentration proportion-al to the unbound active drug. Although the importance ofhematocrit has been highlighted in several population phar-macokinetic analyses of tacrolimus in kidney transplant pa-tients [28–32], these analyses used hematocrit as an empiricalpredictor only of clearance or volume of distribution, but notboth simultaneously. A novel approach of our study was themodeling of hematocrit as a covariate to adjust measured wholeblood concentrations based on the theory that all whole blood-based pharmacokinetic disposition parameters are equallyinfluenced by hematocrit for a low extraction ratio drug suchas tacrolimus. When not accounting for differences in hemato-crit, the pharmacokinetic model showed a clear systematicprediction error across the range of observed hematocrit values.The systematic prediction error was, however, no longer pres-ent after correction for the predictions to account for the actualhematocrit value (Fig. 2). This can be understood in terms ofpharmacokinetic theory for a low-extraction-ratio drug, withelimination and distribution processes being independent ofunbound drug concentration. Of note, the same theory de-scribed for hematocrit also applies to the binding of tacrolimusto albumin, α1-glycoprotein and lipoproteins in plasma [8, 9].Although we did not identify any influence of albumin, it mighthave been obscured by the correlation between increases inalbumin and hematocrit following kidney transplantation.
The challenge of reaching and maintaining a target con-centration of tacrolimus during the first months after kidneytransplantation has been described previously by Ekberg et al.who observed that approximately 50 % of tacrolimus troughconcentrations during the first 8 post-transplant weeks wereoutside the intended range (3–7 μg/L) [6]. In our study, thepercentage outside the target range was somewhat lower, but itwas not reduced during the first 6 weeks after transplantation(42 % week 1, 43 % week 5–6). These challenges are, at leastin part, related to the substantial increase in hematocrit fol-lowing kidney transplantation (Fig. 1b) and high hematocritwithin-subject variability (CV 11 %). Based on pharmacolog-ical theory and confirmation that hematocrit standardization isconsistent with unbound concentration-independent pharma-cokinetics, we recommend that tacrolimus whole blood con-centrations be standardized to a hematocrit (Hct) of 45 %(Cstd=Ctot×45 %/Hct) to reflect the unbound (active) drugmore closely. This recommendation is based on the samewell-known concepts that have guided the interpretation ofphenytoin plasma concentration measurements when plasmaproteins differ from normal [33, 34].
There is no consistent appreciation of the role of body sizeas a determinant of tacrolimus distribution and elimination[35], despite its biological basis and clinical use for predictinginitial doses. This may be partly explained by small ranges ofsize, but also by not recognizing the role of body composition(fat-free mass and fat mass) as a determinant of functionalbody size. We investigated a large range of weights andidentified fat-free mass as a predictor of tacrolimus pharma-cokinetics, which to our knowledge is a novel finding. It isreasonable to accept fat-free mass as a predictor of tacrolimusclearance because fat mass is not expected to influence met-abolic capacity directly [20]. The fact that volume of distribu-tion of tacrolimus appeared to be closer related to fat-free massthan to total body weight indicates that the extent of tissuedistribution of tacrolimus may be determined mainly by bind-ing to proteins in lean tissues. For the patients in the currentdataset with the lowest and highest total body weights (malesof 43 kg and 160 kg with predicted fat-free masses of 39 and95 kg, respectively), the model predicts apparent clearances of16 and 27 L/h, respectively (given otherwise equal conditions;see Table 3). These calculations show that although total bodyweight may differ by fourfold in this patient group, therequired dose differs by less than twofold and that the currentlyapplied initial dose algorithm increases risk of overtreatment inobese patients. Indeed, previous studies have reported that hightacrolimus concentrations were more frequently observed inpatients with higher weights [36, 37]. The proposed modelprovides a more rational use of body size for tacrolimus doseselection.
After appropriately accounting for body size differences inthe model, we then identified sex differences in the pharma-cokinetics of tacrolimus. The model fit was slightly better
74 Eur J Clin Pharmacol (2014) 70:65–77

using sex as a covariate on bioavailability rather than onclearance, and there was little evidence for an additional effecton clearance. This result is somewhat supported by previouslyreported results [37, 38], although most population studies ontacrolimus did not establish a relationship with sex [29, 35,39]. The difference between males and females was mostapparent in younger patients, and as age increased, bioavail-ability increased for both sexes while the sex differencediminished. It has been previously described that sexdifferences in the pharmacokinetics of CYP3A substratesseem to be more pronounced at younger ages comparedwith in the elderly [40]. The effect may alternatively becaused by sex- and/or age-related differences in intestinalP-glycoprotein (ABCB1) activity. Previous reports havealso described higher tacrolimus concentrations in elderlypatients [37, 41, 42], which is consistent with our find-ings. It should be noted that only four females in ourstudy were aged >50 years. Further studies are needed torecommend appropriate initial dosing of tacrolimus basedon sex and age.
A major limitation of our study was the use of a highproportion (67 %) of trough concentrations. Concentrationsmeasured at trough provide only modest pharmacokineticinformation. Another limitation was that seven patients whoreceived simultaneous pancreas–kidney transplantation andtwo patients who used carbamazepine were excluded fromthe analysis. This may have led to underprediction of thevariability seen across patients in a true clinical setting. Fur-thermore, conversion between multiple analytical assay tech-niques for tacrolimus measurements may have introducedadditional overall variability to the analysis. Hematocrit-related bias in concentration determinations by analytical im-munoassays should however not be a relevant limitation be-cause CMIA is not known to be affected by hematocrit [1]. Allsamples analyzed with MEIA had corresponding hematocritvalues not associated with bias (25–45 %) [43]. Finally, the95 % interval of the ordered observed hematocrit values was29–43 %. In general, extrapolation of results to patients withcovariate values outside of the investigated range should bedone with caution. Yet, because the hematocrit model has amechanistic basis, extrapolation is more likely to be reliable.
The whole blood concentration–effect relationship of ta-crolimus is poorly characterized, and there is no consensusamong transplant centers on an optimal tacrolimus concentra-tion [1, 2]. Although a trough concentration range of 3–7 μg/Lhas been proposed [44] and is used at our center, ranges of5–10 or 10–15 μg/L are targeted at other centers [45]. Anincreasing hematocrit leads to a decrease in therapeuticallyactive unbound concentrations with time after transplantation ifdoses are adjusted to maintain unchanged total whole bloodconcentrations [9]. Differences in active unbound concentra-tions not reflected by whole blood concentrations will be aconfounding factor in studies attempting to characterize the
whole blood concentration-effect relationship. In a study inliver transplant patients, the estimated unbound concentrationsof tacrolimus were significantly lower in patients experiencingacute rejection than in stable patients (p <0.001), without adifference in whole blood concentrations (p =0.5) [8]. Stan-dardizing whole blood concentrations to hematocrit in futurestudies should improve our understanding of the concentra-tion–effect relationship for tacrolimus and allow a more con-sistent target concentration to be achieved.
In conclusion, a population pharmacokinetic model wasdeveloped for tacrolimus in kidney transplant patients. Fat-free mass, CYP3A5 genotype, sex, age and time post-transplant were identified as predictors of individual tacroli-mus dose requirement. Allometric scaling to fat-free massprovides a more rational use of body size than linear scalingto total body weight. Hematocrit is a predictor of variability intacrolimus whole blood concentrations, but it is not expectedto influence unbound (therapeutically active) concentrations.Because hematocrit is highly variable in kidney transplantpatients and increases substantially after kidney transplanta-tion, hematocrit is a key factor for interpretation of tacrolimuswhole blood concentrations.
Acknowledgments We wish to thank the biomedical laboratory scien-tists at the Nephrology Laboratory and at the Department of MedicalBiochemistry at Oslo University Hospital for excellent assistance insampling, analysis and CYP3A5-genotype data management. We alsowish to thank all kidney transplanted patients contributing data thatenabled this analysis to be performed. Elisabet Størset received grantsfrom The Norwegian Pharmaceutical Society, the Meltzer Fund andShipowner Tom Wilhelmsens Foundation.
Conflict of interest None.
Open Access This article is distributed under the terms of the CreativeCommons Attribution License which permits any use, distribution, andreproduction in any medium, provided the original author(s) and thesource are credited.
References
1. Wallemacq P, Armstrong VW, Brunet M et al (2009) Opportunities tooptimize tacrolimus therapy in solid organ transplantation: report of theEuropean consensus conference. Ther Drug Monit 31(2):139–152
2. Bouamar R, Shuker N, Hesselink DA et al (2013) Tacrolimuspredose concentrations do not predict the risk of acute rejection afterrenal transplantation: a pooled analysis from three randomized-controlled clinical trials. Am J Transplant 13:1253–1261. doi:10.1111/ajt.12191
3. Barraclough KA, Isbel NM, Kirkpatrick CM et al (2011) Evaluationof limited sampling methods for estimation of tacrolimus exposure inadult kidney transplant recipients. Br J Clin Pharmacol 71:207–223.doi:10.1111/j.1365-2125.2010.03815.x
4. Scholten EM, Cremers SC, Schoemaker RC et al (2005) AUC-guided dosing of tacrolimus prevents progressive systemic overex-posure in renal transplant recipients. Kidney Int 67:2440–2447. doi:10.1111/j.1523-1755.2005.00352.x
Eur J Clin Pharmacol (2014) 70:65–77 75

5. Saint-Marcoux F, Woillard J-B, Jurado C, Marquet P (2013) Lessonsfrom routine dose adjustment of tacrolimus in renal transplant pa-tients based on global exposure. Ther Drug Monit 35:322–327. doi:10.1097/FTD.0b013e318285e779
6. Ekberg H, Mamelok RD, Pearson TC et al (2009) The challenge ofachieving target drug concentrations in clinical trials: experiencefrom the Symphony Study. Transplantation 87:1360–1366. doi:10.1097/TP.0b013e3181a23cb2
7. Jusko WJ, Piekoszewski W, Klintmalm GB et al (1995) Pharmaco-kinetics of tacrolimus in liver transplant patients. Clin PharmacolTher 57:281–290. doi:10.1016/0009-9236(95)90153-1
8. Zahir H, McCaughan G, Gleeson M et al (2004) Factors affectingvariability in distribution of tacrolimus in liver transplant recipients.Br J Clin Pharmacol 57:298–309
9. Hebert MF, Zheng S, Hays K et al (2013) Interpreting tacrolimusconcentrations during pregnancy and postpartum. Transplantation95:908–915. doi:10.1097/TP.0b013e318278d367
10. Möller A, Iwasaki K, Kawamura A et al (1999) The disposition of14C-labeled tacrolimus after intravenous and oral administration inhealthy human subjects. Drug Metab Dispos 27:633–636
11. Malyszko J, Oberbauer R, Watschinger B (2012) Anemia andErythrocytosis in patients after kidney transplantation. Transpl Int25:1013–1023. doi:10.1111/j.1432-2277.2012.01513.x
12. Falck P, Vethe NT, Åsberg A et al (2008) Cinacalcet’s effect on thepharmacokinetics of tacrolimus, cyclosporine and mycophenolate inrenal transplant recipients. Nephrol Dial Transplant 23:1048–1053.doi:10.1093/ndt/gfm632
13. Amundsen R, Åsberg A, Robertsen I et al (2009) Rimonabant affectscyclosporine A, but not tacrolimus pharmacokinetics in renal trans-plant recipients. Transplantation 87:1221–1224. doi:10.1097/TP.0b013e31819f1001
14. Midtvedt K, Jenssen T, Hartmann A et al (2011) No change in insulinsensitivity in renal transplant recipients converted from standard toonce-daily prolonged release tacrolimus. Nephrol Dial Transplant 26:3767–3772. doi:10.1093/ndt/gfr153
15. Marubashi S, Nagano H, Kobayashi S et al (2010) Evaluation of anew immunoassay for therapeutic drug monitoring of tacrolimus inadult liver transplant recipients. J Clin Pharmacol 50:705–709. doi:10.1177/0091270009352188
16. Falck P, Åsberg A, Byberg KT et al (2008) Reduced elimination ofcyclosporine A in elderly (>65 years) kidney transplant recipients.Transplantation 86:1379–1383. doi:10.1097/TP.0b013e31818aa4b6
17. Cheung CY, Op den Buijsch RA,Wong KM et al (2006) Influence ofdifferent allelic variants of the CYP3A and ABCB1 genes on thetacrolimus pharmacokinetic profile of Chinese renal transplant recipi-ents. Pharmacogenomics 7:563–574. doi:10.2217/14622416.7.4.563
18. Karlsson MO, Sheiner LB (1993) The importance of modelinginteroccasion variability in population pharmacokinetic analyses. JPharmacokinet Biopharm 21:735–750
19. Kerbusch T, Wahlby U, Milligan PA, Karlsson MO (2003) Popula-tion pharmacokinetic modelling of darifenacin and its hydroxylatedmetabolite using pooled data, incorporating saturable first-pass me-tabolism, CYP2D6 genotype and formulation-dependent bioavail-ability. Br J Clin Pharmacol 56:639–652
20. Anderson BJ, Holford NH (2009) Mechanistic basis of using bodysize and maturation to predict clearance in humans. Drug MetabPharmacokinet 24:25–36
21. Janmahasatian S, Duffull SB, Ash S et al (2005) Quantification oflean bodyweight. Clin Pharmacokinet 44:1051–1065
22. Størset E, Staatz C, Hennig S, et al (2013) Identification of continu-ous covariate relationships. Presented at the annual meeting of Pop-ulation Approach Group of Australia and New Zealand (PAGANZ).Available at: http://www.paganz.org/abstracts/identification-of-continuous-covariate-relationships
23. Beal SL, Sheiner LB, Boeckmann AJ (1989–2006) NONMEMuser’s guides. Icon Development Solutions, Ellicott City, MD
24. BergstrandM, Hooker AC,Wallin JE, KarlssonMO (2011) Prediction-corrected visual predictive checks for diagnosing nonlinear mixed-effects models. AAPS J 13:143–151. doi:10.1208/s12248-011-9255-z
25. Wahlby U, Jonsson EN, Karlsson MO (2002) Comparison of stepwisecovariate model building strategies in population pharmacokinetic-pharmacodynamic analysis. AAPS PharmSci 4:E27. doi:10.1208/ps040427
26. Efron B (1979) Bootstrap methods: another look at the jackknife.Ann Stat 7:1–26
27. Holford NHG (2011) Wings for NONMEM, v. 720 for NONMEM7.2. Available at: http://wfn.sourceforge.net
28. Han N, Yun HY, Hong JY et al (2012) Prediction of the tacrolimuspopulation pharmacokinetic parameters according to CYP3A5 geno-type and clinical factors using NONMEM in adult kidney transplantrecipients. Eur J Clin Pharmacol. doi:10.1007/s00228-012-1296-4
29. Woillard JB, de Winter BC, Kamar N et al (2011) Population phar-macokinetic model and Bayesian estimator for two tacrolimus for-mulations–twice daily Prograf and once daily Advagraf. Br J ClinPharmacol 71:391–402. doi:10.1111/j.1365-2125.2010.03837.x
30. Benkali K, Premaud A, Picard N et al (2009) Tacrolimus populationpharmacokinetic-pharmacogenetic analysis and Bayesian estimationin renal transplant recipients. Clin Pharmacokinet 48:805–816. doi:10.2165/11318080-000000000-00000
31. de Jonge H, de Loor H, Verbeke K et al (2012) In vivo CYP3A4activity, CYP3A5 genotype, and hematocrit predict tacrolimus doserequirements and clearance in renal transplant patients. ClinPharmacol Ther 92:366–375. doi:10.1038/clpt.2012.109
32. Musuamba FTF, Mourad MM, Haufroid VV et al (2012) Asimultaneous d-optimal designed study for population pharma-cokinetic analyses of mycophenolic acid and tacrolimus earlyafter renal transplantation. J Clin Pharmacol 52:1833–1843. doi:10.1177/0091270011423661
33. Reidenberg MM, Odar-Cederlöf I, von Bahr C et al (1971) Proteinbinding of diphenylhydantoin and desmethylimipramine in plasmafrom patients with poor renal function. N Engl J Med 285:264–267.doi:10.1056/NEJM197107292850506
34. Musteata FM (2012) Calculation of normalized drug concentrationsin the presence of altered plasma protein binding. Clin Pharmacokinet51:55–68. doi:10.2165/11595650-000000000-00000
35. Press RR, Ploeger BA, den Hartigh J et al (2009) Explaining vari-ability in tacrolimus pharmacokinetics to optimize early exposure inadult kidney transplant recipients. Ther DrugMonit 31:187–197. doi:10.1097/FTD.0b013e31819c3d6d
36. Rodrigo E, de Cos MA, Sanchez B et al (2005) High initial bloodlevels of tacrolimus in overweight renal transplant recipients. Trans-plant Proc 37:1453–1454. doi:10.1016/j.transproceed.2005.02.055
37. Stratta P, Quaglia M, Cena Tet al (2012) The interactions of age, sex,body mass index, genetics, and steroid weight-based doses on tacro-limus dosing requirement after adult kidney transplantation. Eur JClin Pharmacol 68:671–680. doi:10.1007/s00228-011-1150-0
38. Kuypers DR, Claes K, Evenepoel P et al (2004) Time-related clinicaldeterminants of long-term tacrolimus pharmacokinetics in combina-tion therapy with mycophenolic acid and corticosteroids: a prospec-tive study in one hundred de novo renal transplant recipients. ClinPharmacokinet 43:741–762
39. Antignac M, Barrou B, Farinotti R et al (2007) Population pharma-cokinetics and bioavailability of tacrolimus in kidney transplantpatients. Br J Clin Pharmacol 64:750–757. doi:10.1111/j.1365-2125.2007.02895.x
40. Cotreau MM, vonMoltke LL, Greenblatt DJ (2005) The influence ofage and sex on the clearance of cytochrome P450 3A substrates. ClinPharmacokinet 44:33–60
41. Jacobson PA, Schladt D, Oetting WS et al (2012) Lower calcineurininhibitor doses in older compared to younger kidney transplantrecipients yield similar troughs. Am J Transplant 12:3326–3336.doi:10.1111/j.1600-6143.2012.04232.x
76 Eur J Clin Pharmacol (2014) 70:65–77

42. Passey C, Birnbaum AK, Brundage RC et al (2011) Dosing equationfor tacrolimus using genetic variants and clinical factors. Br J ClinPharmacol 72:948–957. doi:10.1111/j.1365-2125.2011.04039.x
43. Tomita T, Homma M, Hasegawa Yet al (2008) Use of sample hemat-ocrit value to correct blood tacrolimus concentration derived by micro-particle enzyme immunoassay. Biol Pharm Bull 31:1250–1253
44. Ekberg H, Tedesco-Silva H, Demirbas A et al (2007) Reducedexposure to calcineurin inhibitors in renal transplantation. N Engl JMed 357:2562–2575. doi:10.1056/NEJMoa067411
45. Schiff J, Cole E, Cantarovich M (2007) Therapeutic monitoring ofcalcineurin inhibitors for the nephrologist. Clin J Am Soc Nephrol 2:374–384. doi:10.2215/CJN.03791106
Eur J Clin Pharmacol (2014) 70:65–77 77


