Embed Size (px)
Citation preview

0
IMPLEMENTING TALLY SHEETS INTERNAL PAY EQUITY AUDITS AND OTHER ESSENTIAL TOOLS
Jesse Brill, Moderator - NASPP
Douglas Friske - Towers Perrin
Myrna Hellerman - Sibson Consulting
Michael S. Kesner -Deloitte Consulting LLP
Joseph Rich - Pearl Meyer & Partners

1
Discuss the challenges of responsible management of executive pay
Describe Tally Sheets, Internal Pay Equity Audits and Accumulated and Future Realizable Wealth Calculations and their role in an evolving framework of responsible analyses and actions to restore (establish?) sound governance and decision making, fiscal responsibility, and transparency with respect to executive pay
Objectives for Today’s Discussion
EvolvingFrameworks
Discussion
The Obviousand Beyond
Discuss how you can make these tools actionable inside of YOUR company

2
TALLY SHEETS (go to Tally Sheets will evolve document)

3
… more on TALLY SHEETS(no visuals for Mike Kesner Presentation)

4
INTERNAL PAY EQUITY AUDIT
5
The “Holy Cow” moments caused by Tally Sheets have raised important questions…
How much is enough?
What’s fair and equitable? To/For whom?
How did this happen? Who’s responsible?

6
The “fairness” question is influenced by what is going on inside our companies -- cost risk has been passed like a “hot potato” to everyone, EXCEPT THOSE AT THE TOP
ToMeritocracy
Variable pay
Welfare self-management
Consumer education
Defined contribution
Self-service
Employability
FromEntitlement
Fixed pay
Welfare security
Indemnity coverage
Defined benefit
Full service
Employment security
Everyone Else
6
Top Executives
Economic and Employment Security
7
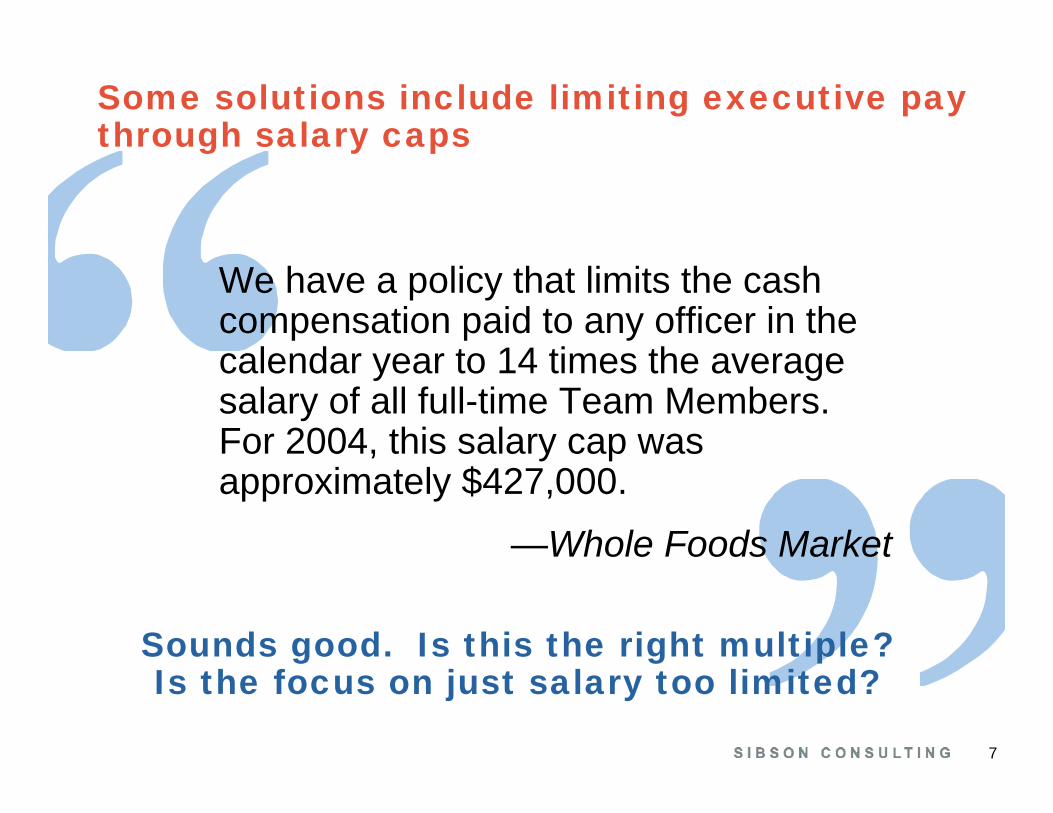
Some solutions include limiting executive pay through salary caps
We have a policy that limits the cash compensation paid to any officer in the calendar year to 14 times the average salary of all full-time Team Members. For 2004, this salary cap was approximately $427,000.
—Whole Foods Market
Sounds good. Is this the right multiple?Is the focus on just salary too limited?

8
Salary caps don’t tell the whole story about the “fairness” of an executive’s pay…
John P. Mackey, Chairman & CEO, Whole FoodsIn 2004, John P. Mackey raked in $885,216 in total compensation including stock option grants from Whole Foods Market.
From previous years’ stock grants the Whole Foods Market executive cashed out $1,013,893 in stock option exercises.
And, John P. Mackey has another $4,370,735 in unexercised stock options from previous years.
—AFL-CIO Executive Pay Watch Database
Is this package still “fair”and internally equitable?
9
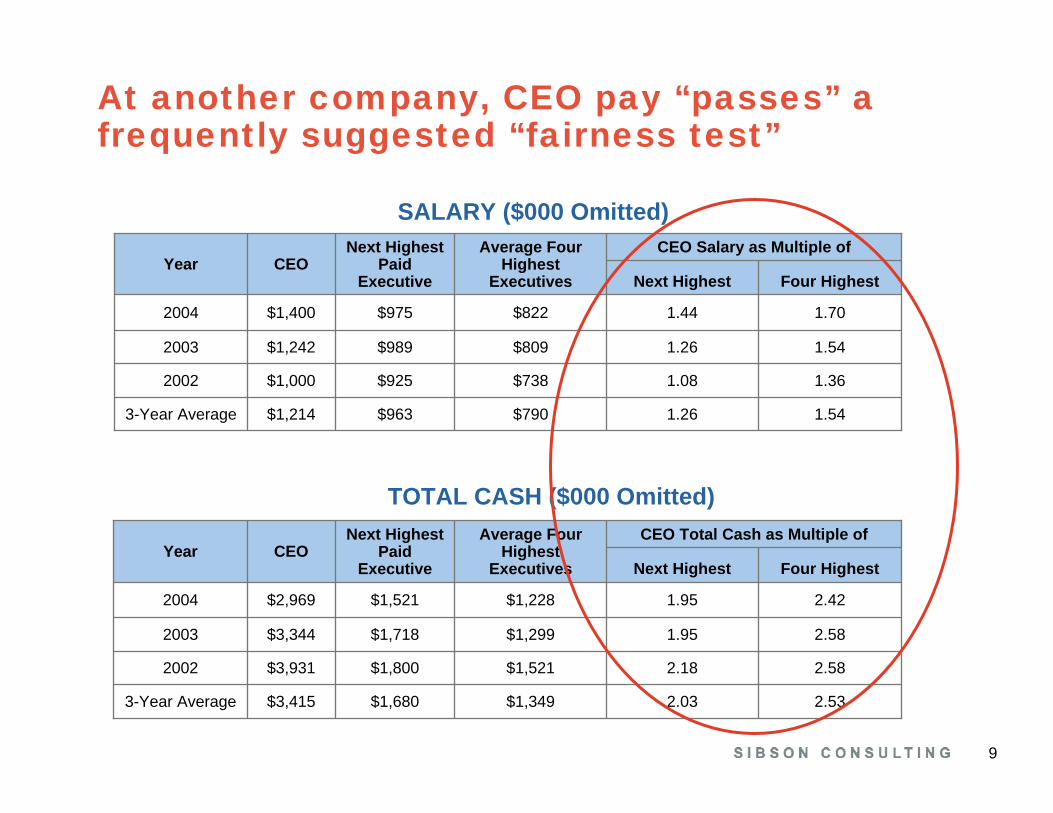
At another company, CEO pay “passes” a frequently suggested “fairness test”
3-Year Average
2002
2003
2004
Year
$1,214
$1,000
$1,242
$1,400
CEO
1.541.26$790$963
1.361.08$738$925
1.541.26$809$989
1.701.44$822$975
Four HighestNext Highest
Next Highest Paid
Executive
CEO Salary as Multiple ofAverage Four Highest
Executives
3-Year Average
2002
2003
2004
Year
$3,415
$3,931
$3,344
$2,969
CEO
2.532.03$1,349$1,680
2.582.18$1,521$1,800
2.581.95$1,299$1,718
2.421.95$1,228$1,521
Four HighestNext Highest
Next Highest Paid
Executive
CEO Total Cash as Multiple ofAverage Four Highest
Executives
SALARY ($000 Omitted)
TOTAL CASH ($000 Omitted)

10
Even looking at all cash payments plus grant date PV of equity, the “fairness test” is met
Is this package still “fair”and internally equitable?
How much more is there in the economic package?
2.002.00$330$330$660Grant Date PV Restricted Shares
Total
Grant Date PV Options
Other Cash
Total Cash
Compensation Components
$8,106
$4,342
$135
$2,969
CEO
2.231.60$3,634$5,062
2.151.40$2,016$3,102
2.261.24$60$109
2.421.95$1,228$1,521
Four HighestNext
Highest
Next Highest Paid
Executive
CEO Total as Multiple ofAverage Four Highest Executives
2004 ALL CASH PAYMENTS PLUS EQUITY(Grant Date PV) ($000 Omitted)

11
…YES, there’s more … for the CEO
…and for others

12
What happened at H-P has happened at many companies. A rewards package like this…
ALPHA CORP 1995 PAY PROGRAM (Excerpt)
StaffManagementExecutivesSenior Executives
Program
Cash
Equity
CEO 4 Proxy EVP
Base Salary
SVP VPs Director Mgr Other Exempt
Annual Incentive
Pension
Enhanced Pension
Stock Options
Other

13
Over time became a rewards package like this…
StaffManagementExecutivesSenior Executives
Program
Cash
Equity
CEO 4 Proxy EVP
Base Salary
SVP VP Director Mgr Other Exempt
Annual Incentive
Long-Term Cash
Pension
Enhanced Pension
Stock Options
Restricted Stock
Severance/COC
Other
Discretionary Cash Award
Discretionary Awards
Matched Deferral
Special Grants
ALPHA CORP 2005 PAY PROGRAM (Excerpt)

14
…And the accumulated financial exposure associated with a (never expected) “breakup”had not been made transparent to shareholders
15
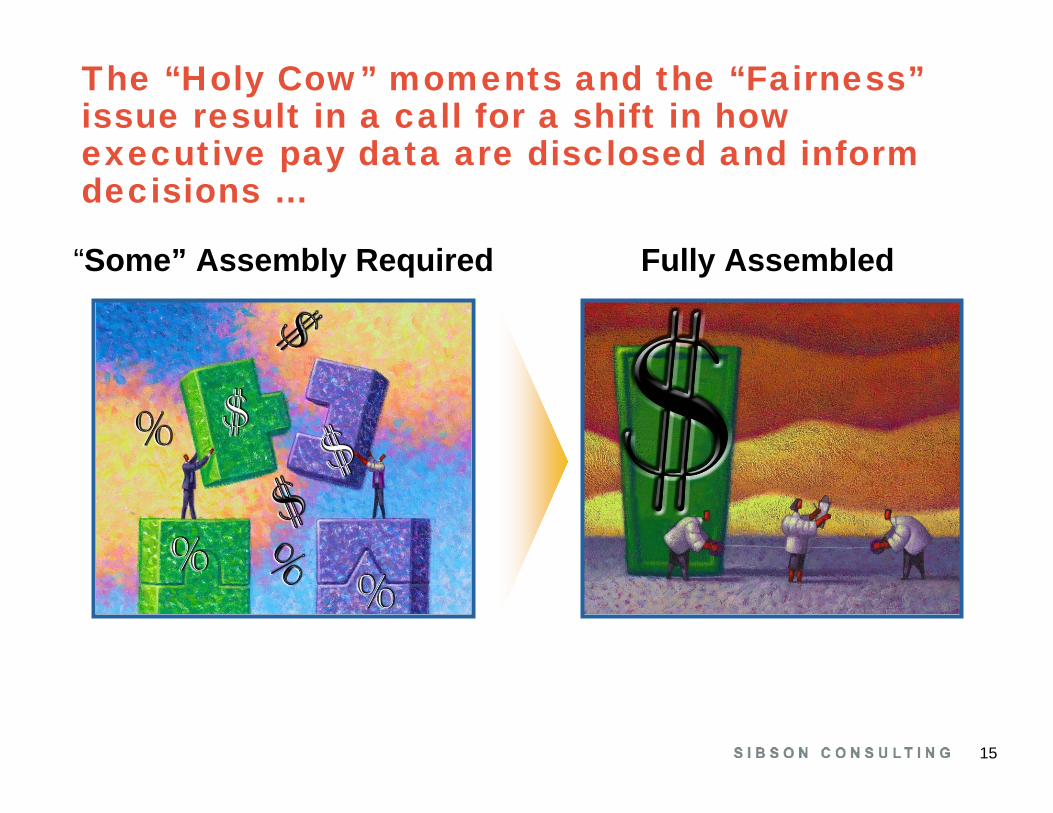
The “Holy Cow” moments and the “Fairness”issue result in a call for a shift in how executive pay data are disclosed and inform decisions …
“Some” Assembly Required Fully Assembled

16
“Some” Assembly Required Fully Assembled
…and unambiguous accountability

17
Evolving tools provide the data needed by the Board/Compensation Committee to step up to this stewardship responsibility
Internal Equity Audit. Documents the historical evolution of the components of the total economic package provided by the company to its CEO and to each of its (key) employee segments
Specifically: How and why has the differential between the total rewards paid (and payable) to the CEO and other executive and employee levels changed over time?
Tally Sheet. Documents the value of the total economic package provided (past and current) and the potential liability for the economic package to be provided in the future
Accumulated and Future Realizable Wealth Calculations.
18
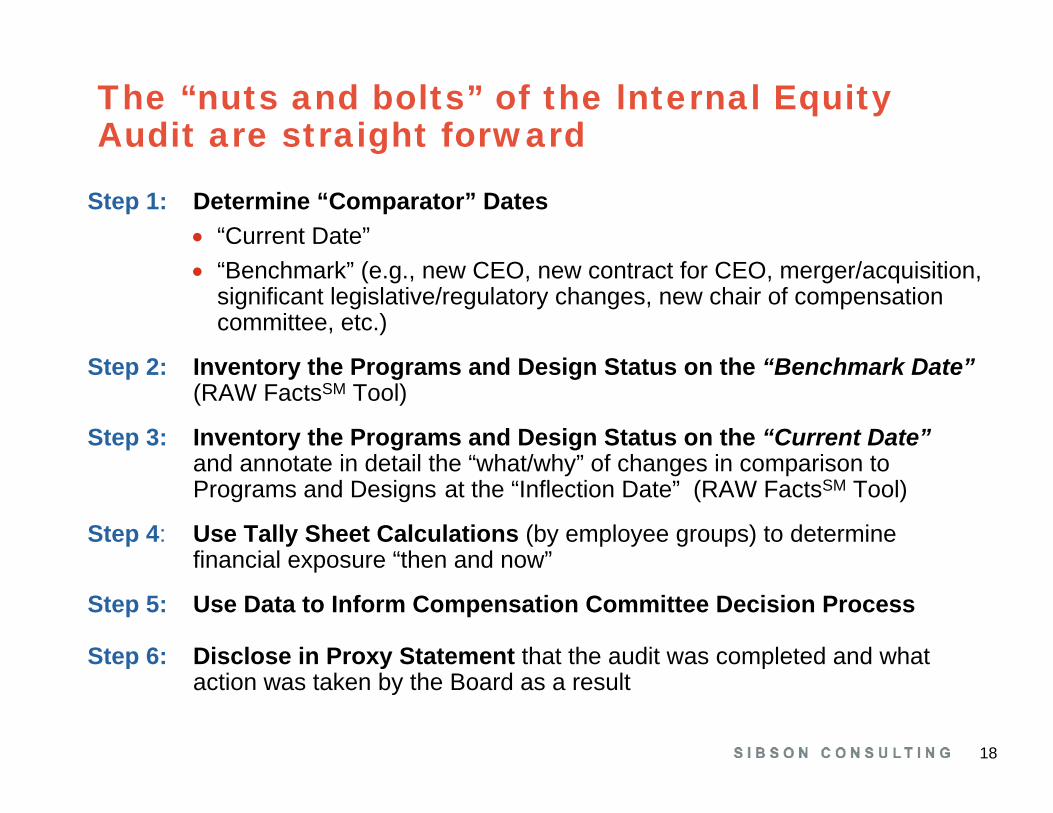
The “nuts and bolts” of the lnternal Equity Audit are straight forward
Step 1: Determine “Comparator” Dates• “Current Date”• “Benchmark” (e.g., new CEO, new contract for CEO, merger/acquisition,
significant legislative/regulatory changes, new chair of compensation committee, etc.)
Step 2: Inventory the Programs and Design Status on the “Benchmark Date”(RAW FactsSM Tool)
Step 3: Inventory the Programs and Design Status on the “Current Date”and annotate in detail the “what/why” of changes in comparison to Programs and Designs at the “Inflection Date” (RAW FactsSM Tool)
Step 4: Use Tally Sheet Calculations (by employee groups) to determine financial exposure “then and now”
Step 5: Use Data to Inform Compensation Committee Decision Process
Step 6: Disclose in Proxy Statement that the audit was completed and what action was taken by the Board as a result

19
Organization of the Internal Equity Audit Tool
Divides fact finding process into three “timeframes”
• Entry “Fees” programs and policies that come into play when there is a new entrant to the organization
• Cost of Maintenance programs and policies that impact the employee during his/her active employment
• Exit “Fees” programs and policies that deliver post-termination compensation and benefits
Within each “timeframe” identifies (a) the existence of a given program and (b) key design characteristics
Identifies the eligibility by distinct employee groups for a given program or design feature
Identifies what has changed since the prior evaluation period

20
Current Date
Prior Evaluation Date
Compensation Committee Members (Name, Affiliation) 1
Other Board Committees with Governance Rights over Rewards (Stock Plan, Benefits Plan, Succession) Employee Group
CEO 20 Next Highest Paid Executives
Group #1
Group #2 Change1 Comments
Number of Employees
Employment Contract Change of Control Protection Severance Protection “Parachute” Cash Signing Grant Welcome Equity Grant Prior Er Equity Buy-outs Relocation Allowance Perquisite Allowance Other
Other
1st Year AI Guarantee LTI Guarantee Service/Vesting Enhancement Tax Gross-ups Other Other
Other
Prog
ram
s
Entry
“Fee
s”
Desig
n
Gove
rnan
ce
1 Check circle if different from prior evaluation.

211 Check circle if different from prior evaluation.2 As a percent of base salary.
Employee Group
CEO 20 Next Highest Paid Executives
Group #1
Group #2 Change1 Comments
Base Salary Annual Variable Pay Commissions Current Dividends (e.g., on deferred RS)
Deferral of Base Salary/Bonus Other
Vacation Supplemental Sick/Disability Supplemental Health Care Perquisite Allowance Car Allowance Financial Counseling Tax Preparation Other Transportation Club Membership Supplemental Benefits
Other
Total Cash Comp Mix (Base/AI) Base/AI Pay Positioning AI Range2 (threshold, target, max) Annual Incentive (AI) Metrics Base Salary Increase Guarantee Match on Deferred Base Salary/AI Tax Gross-ups
Other
Prog
ram
s
Cost
of M
ainte
nanc
e (An
nual
Cash
)
Desig
n

22
1 Check circle if different from prior evaluation.2 TDC = Total Direct Comp (Base + Annual Incentive + Long-Term Incentive).3 As a percent of base salary.
Employee Group
CEO 20 Next Highest Paid Executives
Group #1
Group #2 Change1 Comments
Cash Settled LTI Carried Interest Deferral of Cash LTI Other Other
Incentive Stock Options NQSO RS (time) RS (performance) Performance Units SARs Other
Other
TDC2 Mix (Base/AI/LTI) TDC Positioning LTI Range3 (threshold, target, max) LTI Metrics Cashless Exercise Match on Deferred LTI Tax Gross-ups Front-loaded Equity Grants Ownership Guidelines Require Equity Hold to Ret. Dividend Deferral
Other
Prog
ram
s
Cost
of M
ainte
nanc
e (Lo
ng-T
erm
Cas
h/Eq
uity
)
Desig
n

23
1 Check circle if different from prior evaluation.2 As a percent of base salary.
Employee Group
CEO 20 Next Highest Paid Executives
Group #1
Group #2 Change 1 Comments
DB Qualified Pension Frozen DB Pension DB SERP 401(k) SERP/401(k) Profit Sharing Savings Plan AI / LTI Payouts Stock Plan Deferred Cash/Dividends Change of Control Severance “Parachute” Benefit Continuation Other
Other
DB Target Benefit Amount 2
Enhanced DB SERP Amount 2
401(k) Match/Maximum Match
DC SERP
Match on Deferred Cash
Interest on Def Cash/Dividends
Tax Gross-ups
Accelerated Vesting
Enhanced Exercise Period
Prog
ram
s De
sign
Exit
“Fee
s”

24
In partnership with the other essential tools, the Internal Pay Equity Audit serves to “corral”relevant facts about executive pay…but needs to be applied within the context of several guiding principles
25
1. Seek no “magic multiples” or specific financial comparisons that establish a “safe harbor” for executive pay levels and designs
…and the survey says…
26
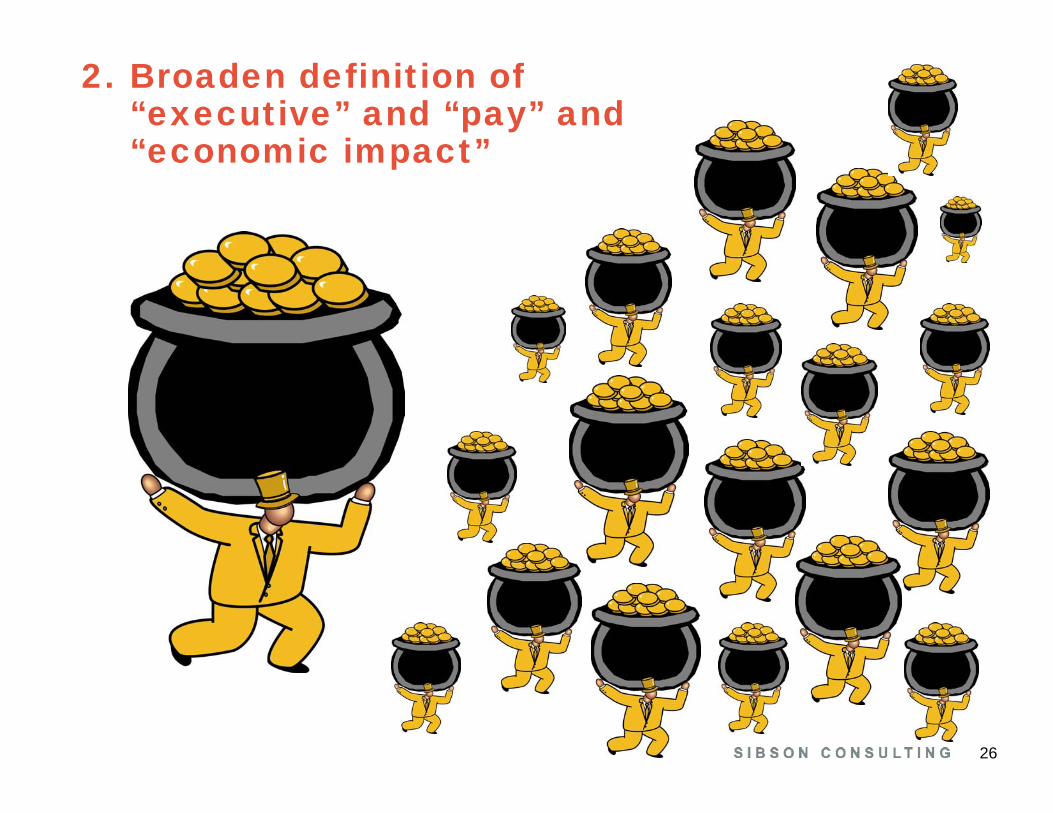
2. Broaden definition of “executive” and “pay” and “economic impact”

27
TOTAL
Compensation Component
Other2
Annual Incentive CashLong-Term Incentive Cash PaidEquity Grant Date PV• Plan #1• Plan #2• Plan #3
Salary
Cash Amounts DeferredMatches (e.g., Sup 401(k), on deferred amounts)
Benchmark YearCurrent YearBenchmark YearCurrent YearCEO
Benchmark YearCurrent Year
20 Next HighestPaid Executives1
TOTAL AS A % OF FULLY DILUTED EARNINGS
• Credited/Reinvested• Paid CurrentlyDividends
CEO as Multiple of20 Next Highest Paid Executives
ANNUAL EXECUTIVE “COST OF MAINTENANCE”
1 Footnote to include names of 20 individuals included in the top 20.2 Includes all W-2 items (e.g., financial counseling, tax preparation, company provided transportation, facilities for personal use at net operating cost, perk
allowance, car allowance, clubs, gross ups, other reimbursements, etc.). Also includes director’s fees from company or affiliated entities and payments related to special arrangements between company and executive.
3. Act as if proxy disclosure was required

28
Benchmark YearCurrent YearCompensation Component
TOTAL
PV of Other Welfare Benefits/InsurancePV of Other Compensation Continuation/Commitment
Company Lost Deductions
PV Defined Benefit (Pension + SERP)Defined Contribution (e.g., 401k + SERP)Other Savings/Profit SharingDeferred Cash + MatchesEquity Payouts• Plan #1
Severance Pay [e.g., PV of (base + bonus) x # years]
• Plan #2• Plan #3
PV Amounts Payable
TOTAL AS A % OF FULLY DILUTED EARNINGS
PV Welfare Benefit Commitments
Gross-up Payments
CEO “EXIT FEES”1
3. Act as if proxy disclosure was required continued
1 Company’s financial exposure if CEO terminated at end of fiscal year under the most favorable conditions for the executive.

29
?
4. Make compensation decisions informed by a thorough understanding of how/why compensation plans and their associated costs have evolved over time
ExecutivesSenior ExecutivesProgram
Cash
Equity
CEO 4 Proxy EVP
Base Salary
SVP VPs
Annual Incentive
Pension
Enhanced Pension
Stock Options
Other
ExecutivesSenior ExecutivesCEO 4 Proxy EVP
Base Salary
SVP VP
Annual Incentive
Long-Term Cash
Pension
Enhanced Pension
Stock Options
Restricted Stock
Severance/COC
Matched Deferral
Special Grants

30
“Some” Assembly Required Fully Assembled
5. Unambiguously disclose decisions

31
ACCUMULATED AND FUTURE REALIZABLE WEALTH CALCULATIONS
(go to NASPP Tools Panel document)

32