Embed Size (px)
Citation preview

Implementing RtI2 at the Secondary Level:The Critical Role of Leadership
Building Student Success:
Response to Instruction Conference
January, 2012
Judy Elliott, Ph.D.
Former Chief Academic Officer
Los Angeles Unified School District

Session Goals
• Continue dialogue with the lens of Secondary
• Importance of vertical articulation
• Is Core all it should be?
• Importance of courageous conversations about Beliefs

The Change Model
Consensus
InfrastructureImplementation
RtI² Essential Components• Multi-tiered framework•Problem-solving process •Data-based decision-making• Academic engaged time•Professional development
RtI

Stages of Implementing Problem-Solving/RtI2
• Consensus
– Belief is shared
– Vision is agreed upon
– Implementation requirements understood
• Infrastructure Development
– Problem-Solving Process
– Data System
– Policies/Procedures
– Training/Technical Assistance
– Tier I and II intervention systems
• e.g., K-3 Academic Support Plan
– Technology support
– Decision-making criteria established
• Implementation

School Consensus
• School consensus is long-term and on-going
• RtI² allows staff to have a stake in the design of what RtI² looks like at their school
5

Foundations and Basic Assumptions

Middle- and High-SchoolApplication of RtI2
• SAME critical components should be present K-12
• Implementation of the critical components will look different at the middle-and high-school levels.
• The differences are influenced by the organization of the level, type and focus of curriculum, logistics of scheduling at the middle- and high-school levels.

Areas of “Same” and “Different” At the Secondary Level
Same• Problem-Solving Process
• School-Based Leadership Teams
• Data Days to Evaluate “Health and Wellness”
• Data Matrix
• Multi-Tiered System
• Fidelity
Different• Consensus
• Monitor Skills and Content
• Types of data
• Schedule Development
• Integration of the Tiers
• Student Involvement
• Fidelity
Some “Givens”• Middle- and High-School teams “inherit” the strengths
and weaknesses (and Gaps) students bring to the level
• Successful high school performance begins with kindergarten
• Most successful high school “intervention” is to ensure that students enter with as much strength as possible
• The best high-school “screening” tool is the compilation of data in K-8
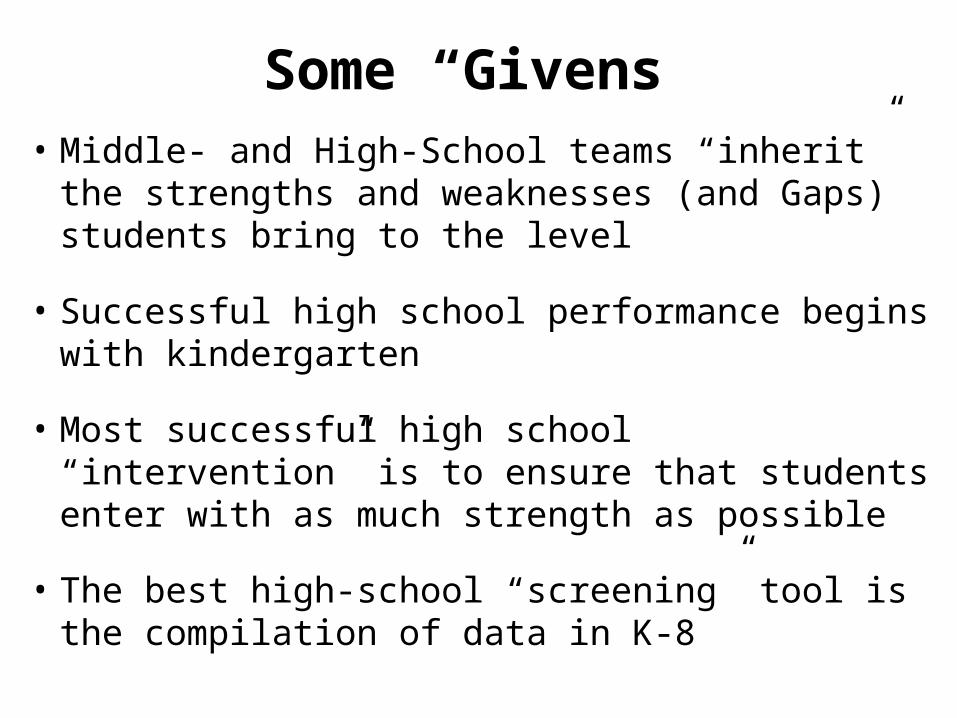
Some “Givens”• Vertical Programming—articulation K-12- is the
most effective way of ensuring that students are prepared for high school
• Middle- and High-School staff should know student needs at least 12-16 month ahead of time.
• An agreed upon “method” of vertical communication of student data/needs—that leads to vertical programming– is critical

Differences in Consensus Building between Elementary and Secondary Schools
• The “Compelling Why” of RtI2 Implementation is different for Secondary Schools– Elementary consensus building typically begins with the
identification of specific academic problems (e.g., Reading)• All teachers typically teach reading and thus reading issues are seen as
relevant to everyone
– Consensus is more complex to develop at the secondary level where most personnel are content specific and generally most interested only in their own content area
– Even cross-content problems (e.g., student literacy) do not typically constitute a strong enough hook to build consensus around the need for RtI2 Implementation
• Teacher autonomy and isolation reinforces the idea that even cross-content problems are someone else’s problem

Framework for Change
**Consensus Building throughout the Phases

Consensus Building in Secondary Schools
• Consensus building often begins by redefining the mission of the school to include graduation for all students.
• All staff contribute to the preparation of students for successful completion of high school.
• All high schools have graduation data readily available and most current graduation rates are significantly different from what staff would expect or desire.
• Redefining Middle School’s mission to include preparing students to successfully complete high school will help to strengthen vertical articulation and the effectiveness of feeder patterns

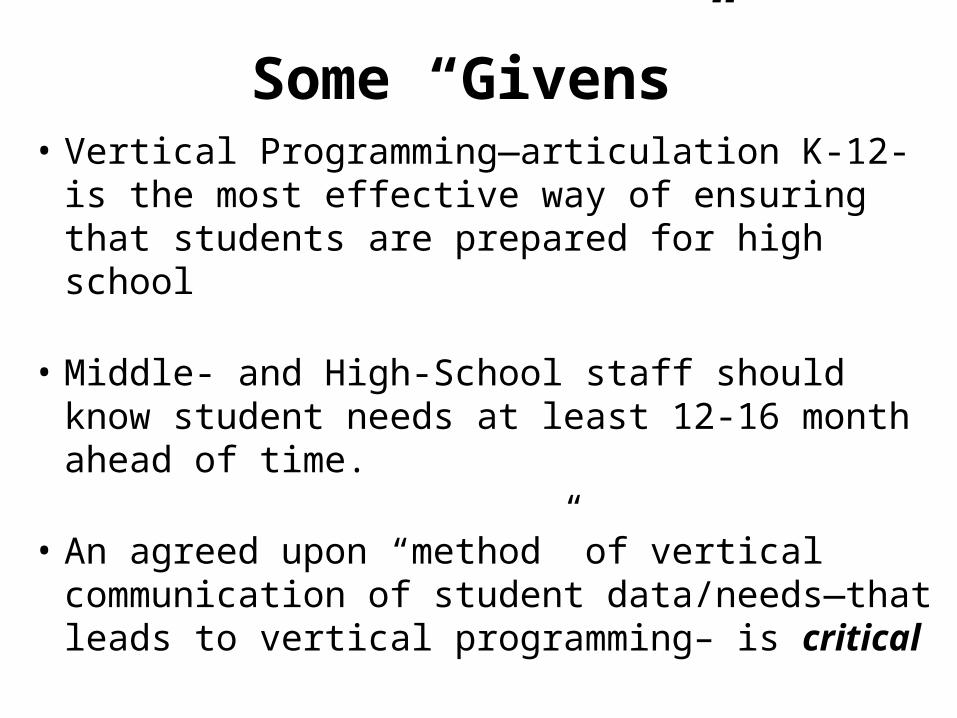
Mission Statement:XXXXX High School
XXXXX High School creates a sound educational environment that provides all students the opportunity to develop their individual talents, to meet and exceed graduation requirements, and to become productive citizens in an increasingly complex and global society
Mission Statement:XXXXX High School
XXXXX High School creates a sound educational environment that provides all students the opportunity to develop their individual talents, to meet and exceed graduation requirements, and to become productive citizens in an increasingly complex and global society

Mission Statement:XXXXX High School
XXXXX High School creates a sound educational environment that provides all students the skills and habits of mind to meet and exceed graduation requirements and to become productive citizens in an increasingly complex and global society

Consensus Building in Secondary Schools• Developing an Early Warning System will assist schools in
establishing a need for early identification of at-risk students, tiered intervention, progress monitoring, and data-based decision making
– Compare the percent of students who are off-track for graduation or at-risk for high school dropout to the school’s mission of graduating all students
– Discuss the impact of course failures, student engagement, and retentions on student graduation rates
– Discuss the advantage of keeping students on track for graduation instead of reacting only after they have become significantly off-track

High Off TrackLacking 2 or more graduation requirementsBehind 4 or more CreditsCurrently failing 3 or more classesExcessive Referrals and/or Absences
Extreme Off Track 2-3 Years BehindNo chance for graduation in a traditional school settingDisengagement
At Risk for Off TrackLacking 1 of 3 Graduation requirements< 5%Absences3 or less Level 1 or 2 referrals
On TrackExceeding or Meeting all graduation requirements (Credits, FCAT Score, GPA)6 or less AbsencesNo referrals
Off Track Lacking 2 graduation requirementsBehind 1-3 Credits10% Absences3 or less Level 2 referrals or 2 Level 3 Referrals9th graders indentified “at high risk” (3 F’s in 8th grade)
Example: Credits Earned
1st Semester
09-10 < 3 Credits
08-09 < 9 Credits
07-08 <15 Credits
06-07 < 21 Credits
Pasco County Schools

Early Warning Systems Data: School Example
52.8% (210) of last year's 9th graders are off-track for graduation• 19% (75) are off-track due to failed FCAT, Credits and GPA• 13% (52) of exiting 9th graders failed 3 or more courses
o Almost all of these students are part of the lowest 25%o Many of these students will count in the total graduation and at-
risk graduation rateso These students have less than a 15% chance of graduating
without significant intervention
Course Failures• Algebra 1 - 43.5%• Spanish 1 - 45%• World History- 29%• English 1 - 28%• Health - 58 students- 17%

on-tr
ack
at-r
isk
off-t
rack
drop
out
12th Grade
9th Grade
0%
20%
40%
60%
80%
Early Warning Systems: 10/11 Beginning of Year
12th Grade
11th Grade
10th Grade
9th Grade
Grade 9On Track: 348At Risk: 39Off Track: 53Dropout: 0%
Grade 10On Track: 147At Risk: 53Off Track: 157Dropout: 1%
Grade 11On Track: 150At Risk: 27Off Track: 95Dropout: 8%
Grade 12On Track: 200At Risk: 26Off Track: 49Dropout: 6%

XXX High School
ODR Progress and Goal
7615
5414
2000
0
1000
2000
3000
4000
5000
6000
7000
8000
2008-2009 2009-2010 Goal
ODRs
More than 2100 Hours (351 Days) of Instructional Time Recouped during 2009-2010 School Year
School is on-track to meet 2010-2011 Goal

XXX High School
% of Students with Excessive Absences
0%
10%
20%
30%
40%
50%
60%
70%
80%
90%
2008-2009 2009-2010 Goal
20 or More
40 or More
School is not currently on-track to meet absenteeism goal and is in the process of revising the intervention plan

XXX High School
Percent of 9th Grade Students with 1 or More Fs
0%
5%10%
15%
20%25%
30%
35%
40%45%
50%
2009-2010 Sem. 1 2010-2011 Sem. 1
School has added 1 hour to the school day to provide tiered intervention services for Algebra 1 and English 1

On TrackAt Risk for off track
Off TrackHigh Off Track
Extreme Off Track
0
10
20
30
40
50
60
70
80
90
Jan-10
Jul-10
Jan-11
51
27
8 11
3
60
23
9
6
2
84
5 9
11
E.W.S over time Team 08
Jan-10Jul-10Jan-11
2011 Cohort: EWS Data
Critical Issues-Overview

Academic Calendars
• SBLT Meetings
• Grade-/Department-Level Meetings
• Data Days
– Minimum of 3 per year
• Professional Development and Support
• Outcome Sharing Events
– Communication and Celebration

Schedules
• Maximize academic engaged time in critical areas
• Reflect needs of students
• Maximize use of all staff
• Ensure time allocated for Tiers 1, 2 and 3
• Provide meeting time for tier integration work

Development of Schedules
• How many students require immediate interventions—by grade level?– Preteach - Reteach Periods– Extra scoops (Double Dips)
• How many students require “moderate risk” interventions—time and focus?
• How many students require “high risk proximal and distal interventions ?

Schedule Development
• Schedules are driven by how many students need how much time of what.
• Schedules cannot be developed successfully without this basic information.

Middle/High School Dilemma
• Deadly combination
– Poor Skill Development
– Limited or No Productivity (work completed, practice)
• How do you remediate gaps and provide students with access to content simultaneously?
• How do you sustain student engagement when skill gaps are significant?
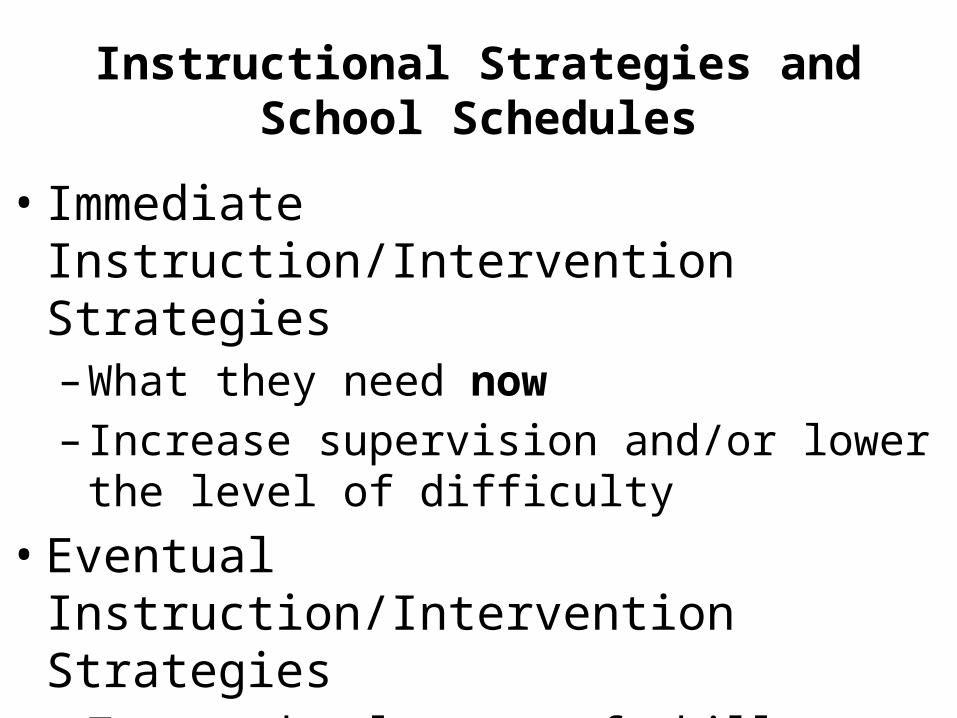
Instructional Strategies and School Schedules
• Immediate Instruction/Intervention Strategies– What they need now– Increase supervision and/or lower the level of
difficulty
• Eventual Instruction/Intervention Strategies– Target development of skills– Require time to develop

Immediate Strategies
• Preview-Review-Reteach
– Requires schedules to permit intervention in the period prior to the target class
• “Double-Dip” or Double Block
– Requires schedules to permit back-to-back schedule of target class with same teacher
• “Alternate Core”
– Requires separate class to provide supervision
• Tier 1 Supports—e.g., computer assisted instruction

Eventual/Distal Strategies
• Multi-year intervention plan to close gap
• Integration of interventions across all providers
• Integration of core content with all interventions
• Perhaps modification of post-secondary trajectory

Evaluate•Response to Instruction & Intervention (RtI2)
Problem Analysis•Validating Problem•Identify Variables that contribute to problem•Develop Plan
Define the Problem•Defining Problem/Directly Measuring Behavior
Implement Plan•Implement As Intended•Progress Monitor•Modify as Necessary
Problem Solving Process

Steps in the Problem-Solving Process
1. Problem Identification
– Identify replacement behavior
– Data- current level of performance
– Data- benchmark level(s)
– Data- peer performance
– Data- GAP analysis
2. Problem Analysis
– Develop hypotheses (brainstorming)
– Develop predictions/assessment

Step 1 - What’s the Problem?
In order to identify a problem, you’ve got to start with three pieces of data:
1. Benchmark level of performance
2. Peer level of performance
3. Student level of performance

Is this an individual student problem or a larger systemic problem?
Decision Making Rubricfor use w ith
School-Wide Screening
Are over 20% of students
struggling?
Are between 5% and 20% of Are 5% or fewer
and developgroup
intervention
Examine instruction,
curriculum, and environment for
needed adaptations
Develop small group
intervention
Go to individualstudent problem
solving
Go to intervention
evaluation
studentsstruggling?
studentsstruggling?
Step 1 - What’s the Problem?

35%
Benchmark 80%
= Peer Group = Aim Line
BASELINE
Classroom Behavioral Data
= Student

The Health of Tier 1
H

Student 1 Intensive 161
Student 2 Intensive 335
Student 3 Strategic 448
Student 4 Strategic 479
Student 5 Strategic 505
Student 6 Strategic 511
Student 7 Strategic 568
Student 8 Strategic 584
Student 9 Strategic 590
Student 10 Strategic 595
Student 11 Strategic 650
Student 12 Strategic 652
Student 13 Strategic 717
Student 14 Strategic 736
Student 15 Strategic 742
Student 16 Strategic 756
Student 17 Strategic 770
Student 18 Benchmark 826
Student 19 Benchmark 886
Student 20 Benchmark 948
Student 21 Benchmark 955
Student 22 Benchmark 984
Student 23 Benchmark 989
Student 24 Benchmark 1133
Scholastic Reading Inventory (SRI)
Which students may require additional instruction and/or intervention?


TIER I: Core, UniversalAcademic and Behavior
42
GOAL: 100% of students achieve at high levels
Tier I: Implementing well researched programs and practices demonstrated to produce good outcomes for the majority of students.Tier I: Effective if at least 80% are meeting benchmarks with access to Core/Universal Instruction.Tier I: Begins with clear goals:1.What exactly do we expect all students to learn ?2.How will we know if and when they’ve learned it?3.How you we respond when some students don’t learn?4.How will we respond when some students have already learned?
Questions 1 and 2 help us ensure a guaranteed and
viable core curriculum

Tier 1: Critical Questions
• What percent of students receiving only Tier 1 are proficient?– Those who are not are falling through the cracks
• What percent of students receiving only Tier 1 are proficient by NCLB category?
• How effective is core instruction?
• Remember, Tiers 2 and 3 cannot accommodate more than 20% of students. If more than 20% of students are not proficient, then...

Tier 1 Data Analysis-Building Level:Step 1
• Identify the number and names of students who are in core instruction 100% of the time.
• Identify the number and names of students who receive supplemental instruction.
• Identify the number and names of students who receive intensive instruction.
• Calculate the % of students who receive only Tier 1, core instruction.
– Is this at, above or below 80%?
• Same for Tiers 2 and 3?
– What does the distribution look like? A triangle, a rectangle?

Tier 1 Data Analysis-Building Level:Step 2
• What % of Tier 1 students made proficiency?
• What % of Tier 2 students made proficiency?
• What % of Tier 3 students made proficiency?
• What was the overall % of students who made proficiency?
• Calculate by disaggregated groups.

Data Example• 75% of students receiving only Tier 1 instruction are proficient
(70% of the school).
– What does this mean to you? How do you prioritize these students?
– 52.5% of students are proficient
– 17.5 % of students are not proficient & are not receiving additional services—Falling through the cracks.
42% of students receiving Tier 2 (22% of school) & Tier 1 are Profic. What does this say about the effectiveness of Tier 2 instruction & what does it say about overloading Tier 3?
9% of students are proficient
35% of students receiving Tier 3 (8% of school) are proficient.Is Tier 3 effective?
2.8% of students are proficient
Total % of school proficient: 52.5 + 9 + 2.8= 64.3

Tier 1 Data Analysis-Building Level:Step 3
• By disaggregated groups, plot the % of students who made proficiency for the past 2 years.
• Calculate the % of average growth per year for each group.
– % proficient in year 3 minus % proficient in year 1 divided by 2 =average rate of increase in % of students making proficiency

Finding the Average Rate of Growth
2008-09 2009-20102010-11
56.4 62.1(53.6)
8.5% increase
3 years of data, but 2 data points

Finding the Average Rate of Growth
2011-12 Target = 87.0%
2008-09 2009-20102010-11
62.1 – 56.4 = 24.9
24.9 divided by 3 = 2.85% rate of growth
56.4 62.1(53.6)
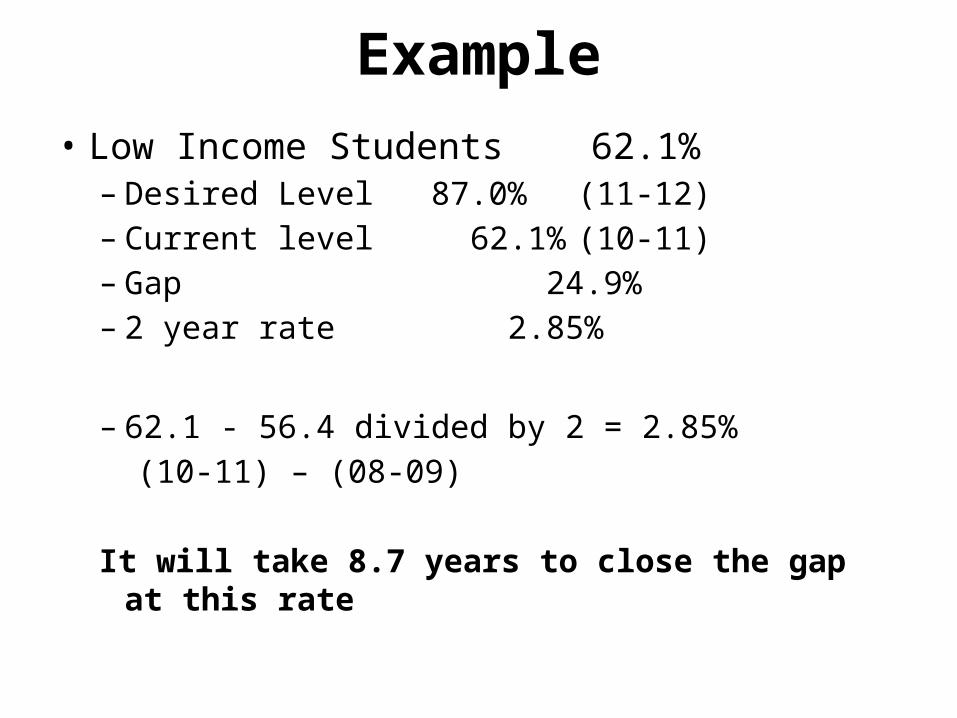
Example
• Low Income Students 62.1%– Desired Level 87.0% (11-12)– Current level 62.1% (10-11)– Gap 24.9%– 2 year rate 2.85%
– 62.1 - 56.4 divided by 2 = 2.85%
(10-11) – (08-09)
It will take 8.7 years to close the gap at this rate
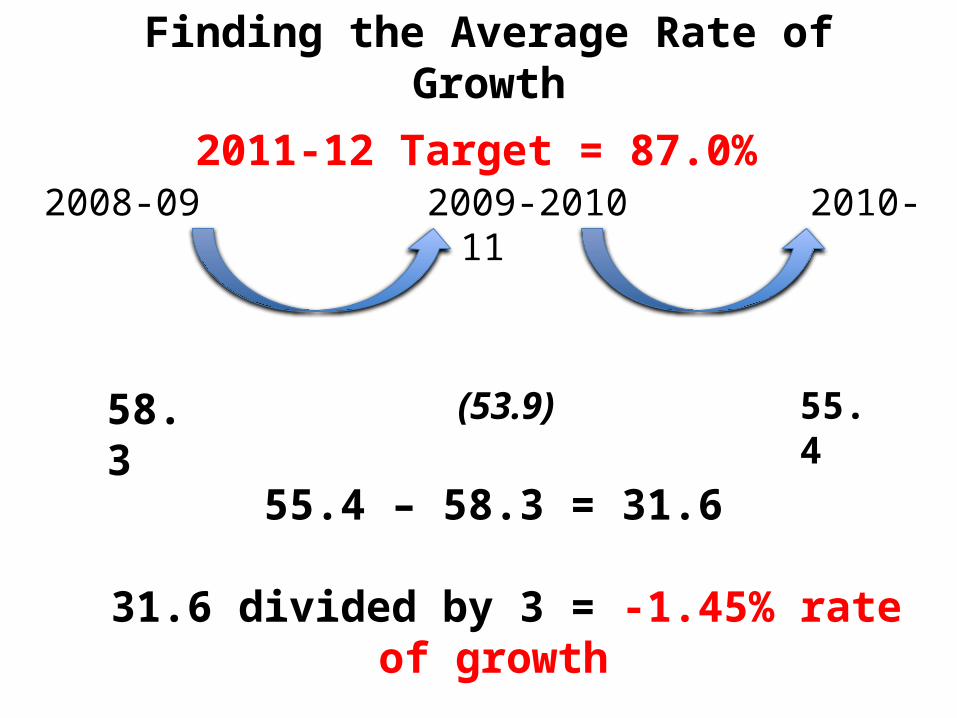
Finding the Average Rate of Growth
2011-12 Target = 87.0%
2008-09 2009-20102010-11
55.4 – 58.3 = 31.6
31.6 divided by 3 = -1.45% rate of growth
58.3 55.4(53.9)
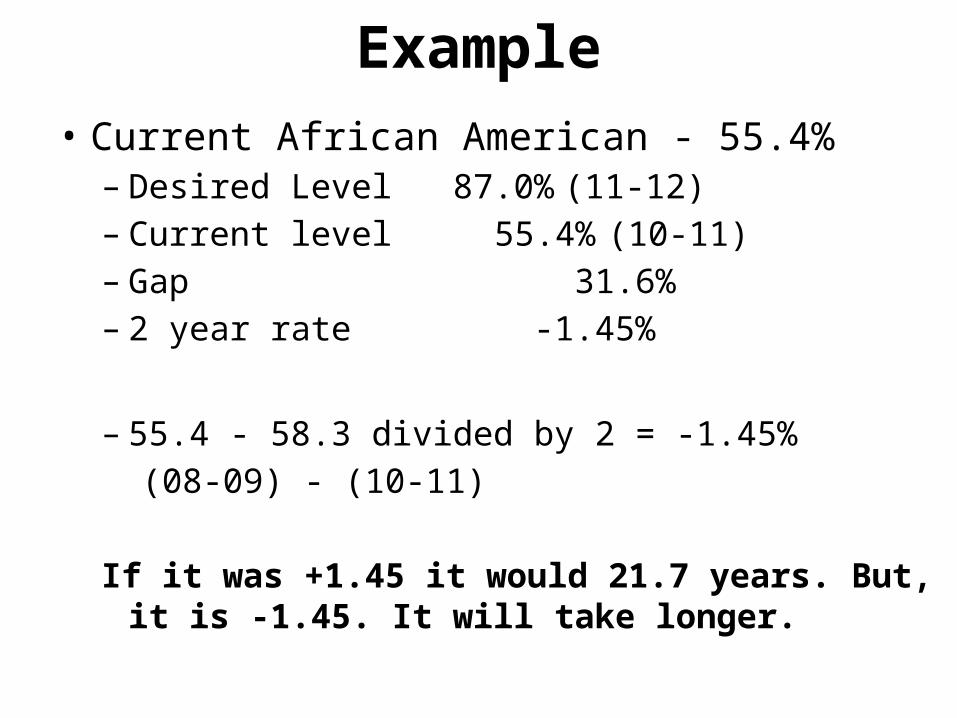
Example
• Current African American - 55.4%– Desired Level 87.0% (11-12)– Current level 55.4% (10-11)– Gap 31.6%– 2 year rate -1.45%
– 55.4 - 58.3 divided by 2 = -1.45%
(08-09) - (10-11)
If it was +1.45 it would 21.7 years. But, it is -1.45. It will take longer.

White
Black
Hispan
ic
Economica
lly Disa
dvantag
ed
Engli
sh La
nguag
e Lea
rners
Studen
ts with
Disabiliti
es0.00%
10.00%
20.00%
30.00%
40.00%
50.00%
60.00%
70.00%
80.00%
90.00%
100.00%
Reading: Percent of Schools Meeting AYP Disaggregated by Subgroup
% meeting 09% meeting 10

Tier 1 Data Analysis-Building Level:Step 4
• Are you happy with:– % of students in core who are proficient?– Same for each of the other Tiers.
• % of students in the three Tiers?
• Given that the national increase in % of students who move to proficiency is about 7%, how are you doing with the rate over the past years and what does this information mean to you for the next 2 years?– In 2014, 95% of students should be proficient
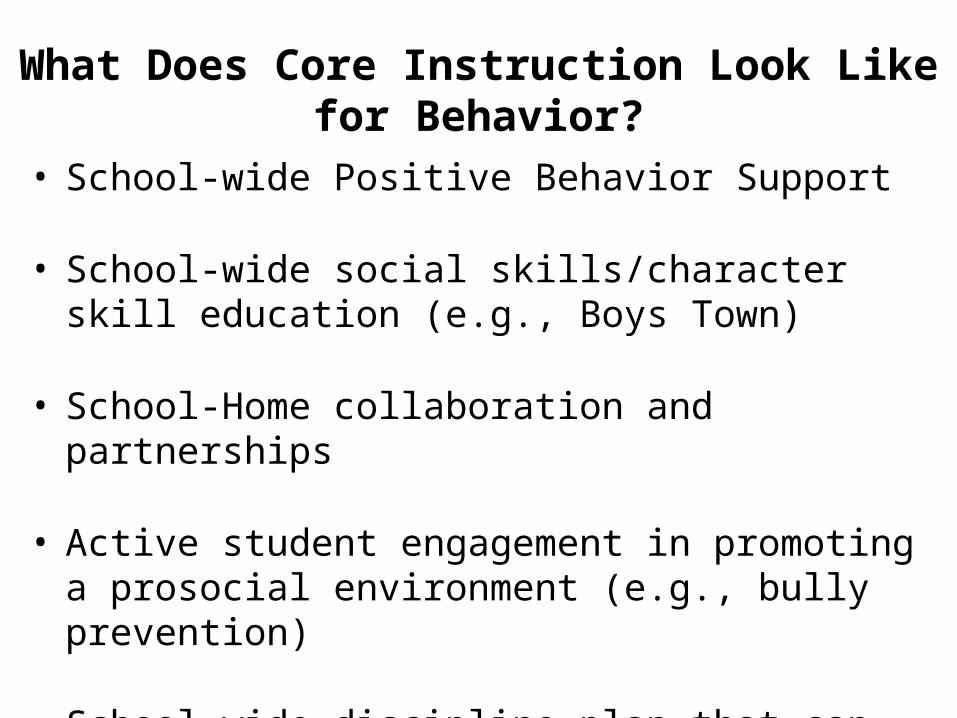
What Does Core Instruction Look Like for Behavior?
• School-wide Positive Behavior Support
• School-wide social skills/character skill education (e.g., Boys Town)
• School-Home collaboration and partnerships
• Active student engagement in promoting a prosocial environment (e.g., bully prevention)
• School-wide discipline plan that can be explained by both staff and students

What data can be collected to evaluate the effectiveness and quality of core instruction?
• Progress monitoring assessments 3x/year (Benchmarking)
• Ongoing Progress Monitoring
• Core Curriculum Unit Tests / Curriculum-based assessments/Common Assessments
• Outcome measures (District & State Tests) to make decisions about student placement for the following year
• Evaluation of quality of instruction
• Learner characteristics
• School environment
• Others??
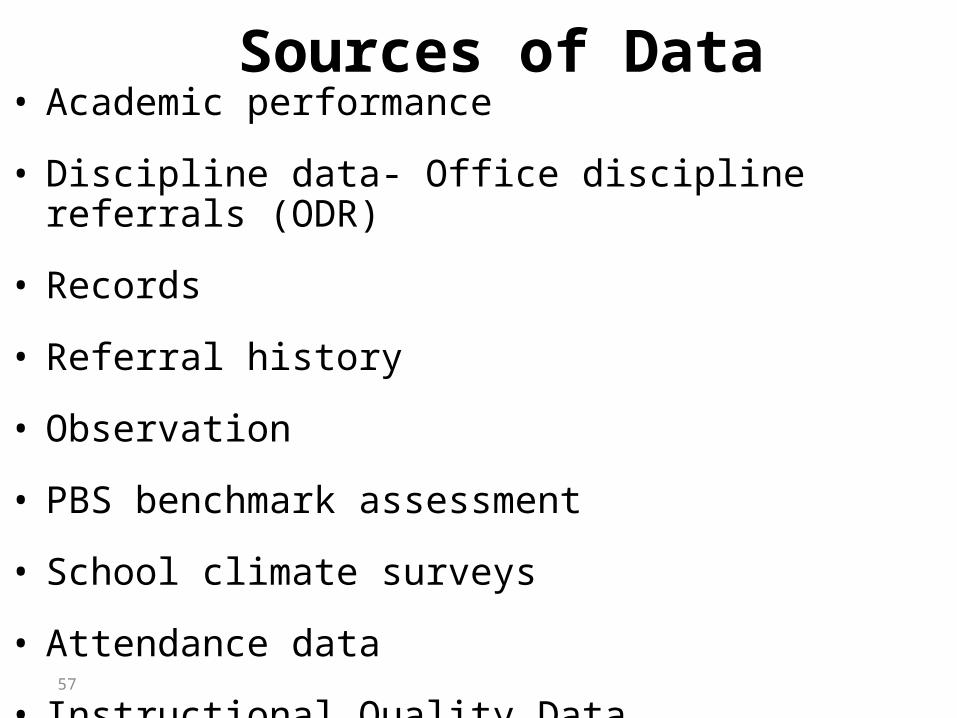
57
Sources of Data • Academic performance
• Discipline data- Office discipline referrals (ODR)
• Records
• Referral history
• Observation
• PBS benchmark assessment
• School climate surveys
• Attendance data
• Instructional Quality Data

ScreeningAssessment
DiagnosticAssessment
ProgressMonitoringAssessment
Outcome(Summative)Assessment
Administered to all students as an initial baseline
While relatively lengthy, they provide an in-
depth, reliable assessment of targeted
skills
Given periodically to determine whether
students are making adequate progress
Given at the end of the school year
[and/or end of a unit of instruction]
Help to identify students who do not meet grade level expectations
Purpose is to provide information for more
effective instruction and interventions
Data should be collected, evaluated, and used on
an ongoing basis
Group-administered tests of important [skills and/or
standards]
Are quick and efficient measures of overall
ability and critical skills known to be strong
indicators that predict student performance
Because these assessments are time consuming and expensive, they should be administered far less
frequently than the other assessments
Provide information on the effectiveness of
instruction and to modify the intervention
if necessary
Often used for school, district, and/or state
reporting
Indicate a need for further evaluation
Specific subtests from these instruments might be
used to provide information not
assessed by [other assessments]
Used to analyze and interpret gaps between
benchmark and achievement
Give feedback of the overall effectiveness of the
instructional program
Modified from 6 Components of RtI²– Assessment/Progress Monitoring Colorado Department of Education www.cde.state.co.us/RtI/AssessMonitor.htm

Categorize Your Current School Assessments
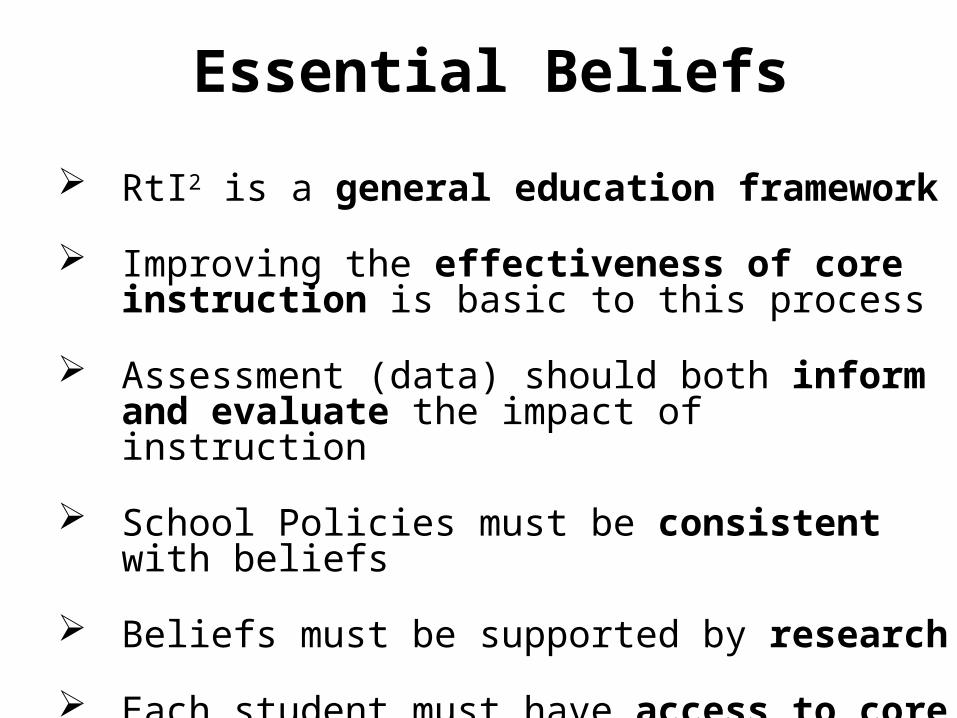
Essential Beliefs
RtI2 is a general education framework
Improving the effectiveness of core instruction is basic to this process
Assessment (data) should both inform and evaluate the impact of instruction
School Policies must be consistent with beliefs
Beliefs must be supported by research
Each student must have access to core

Essential Beliefs
Proficiency is the goal for each student
Every student is everybody’s responsibility
Common commitment to instruction and intervention
Common commitment to school-based academic and behavior programs
Common commitment to problem-solving process
Common commitment to data-driven decision making

Reaching Consensus: Why Change?
Educators will embrace change when two conditions exist:
• They understand the need for change
• They perceive that they either have the skills or the support to implement change

In other words, when…
Belief is shared
Vision is agreed upon
Implementation requirements are understood

High School TeamsBeliefs Survey Data

10a. Th
e majo
rity o
f studen
ts with
SLD ac
hieve g
rade-l
evel
bench
marks in
Reading
10b. The m
ajorit
y of s
tudents
with SL
D achiev
e grad
e-lev
el ben
chmark
s in M
ath
11a. Th
e majo
rity o
f studen
ts with
EBD ac
hieve g
rade-l
evel
bench
marks in
Reading
11b. The m
ajorit
y of s
tudents
with EB
D achiev
e grad
e-lev
el ben
chmark
s in M
ath
12a. Stu
dents
receiv
ing EEN
servi
ces ca
n mee
t grad
el-lev
el ben
chmark
s in Rea
ding
12b. Studen
ts rec
eiving E
EN se
rvices
can m
eet g
rade-l
evel
bench
marks in
Math
0%
10%
20%
30%
40%
50%
60%
70%
80%
90%
100%
Agree
Neutral
Disagree
Beliefs Survey Data – High School SBLTs Factor One: Academic Ability & Performance of Students with Disabilities
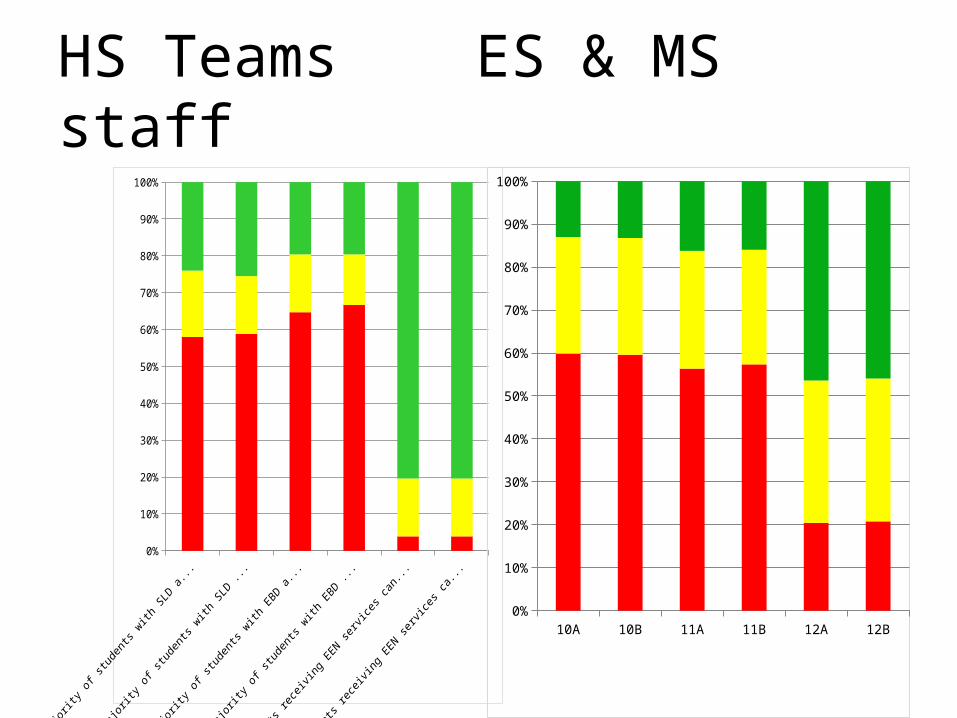
HS Teams ES & MS staff
0%
10%
20%
30%
40%
50%
60%
70%
80%
90%
100%
0%
10%
20%
30%
40%
50%
60%
70%
80%
90%
100%

0%10%20%30%40%50%60%70%80%90%
100%
AgreeNeutralDisagree
Beliefs Survey Data: High School SBLTsFactor Three: Functions of Core and Supplemental Instruction

HS teams ES & MS staff
0%
10%
20%
30%
40%
50%
60%
70%
80%
90%
100%
0%
10%
20%
30%
40%
50%
60%
70%
80%
90%
100%
AgreeNeutralDisagree

23: Additional time and resources should be allocated first to those students who are not at benchmarks (i.e., general education standards) before significant time and resources are directed to students who are at or above benchmarks.
Beliefs Survey Data: MMSD High School SBLTsIndividual Item (N=51)
15.70%
33%
51.00%Disagree Neutral
Agree

HS teams ES & MS staff
15.70%
33%
51.00%
Disagree
Neutral
Agree
29%
26%
45%DisagreeNeutralAgree
23: Additional time and resources should be allocated first to those students who are not at benchmarks (i.e., general education standards) before significant time and resources are directed to students who are at or above benchmarks.

National Resources to Support District and School Implementation
• Betterhighschools.org
• www.floridarti.usf.edu
• www.florida-rti.org
• www.nasdse.org
• www.rtinetwork.org
• www.rti4success.org