Embed Size (px)
Citation preview
Implementing Pull Production within an Aerospace AssemblyOperation
By
Kevin Michael Lennox
Bachelor of Science in Mechanical Engineering, Duke University (2001)
Submitted to the Sloan School of Management and the Department of MechanicalEngineering in Partial Fulfillment of the Requirements for the Degrees of
Master of Business Administration andMaster of Science in Mechanical Engineering
In Conjunction with the Leaders for Manufacturing Program at theMassachusetts Institute of Technology
June 2006
@ 2006 Massachusetts Institute of Technology. All rights reserved.
Signature of Author
Certified by_
/
Senior Research
Certified by7
BARKER
MASSACHUSETTS INSTIUTEOF TECHNOLOGY
AUG 3 12006
LIBRARIFS
6MIT Sloan School of Management
Department of Mechanical EngineeringMay 12, 2006
iel Whitney hesis SupervisorScientist, Eng ermg Systems Division
Donald Rosenfield, Thesis SupervisorA Senior Lecturer of Management
Accepted byfallit Annd, Chairman, Graduate Committee
Department of Mechanical Engineering
Accepted byDebbie Berechman, Exeq'utive Director, MBA Program
Sloan School of Management
MIT Thesis - Kevin Lennox Page I

This page has been intentionally left blank.
MIT Thesis - Kevin Lennox Page 2

Implementing Pull Production within an Aerospace AssemblyOperation
By
Kevin Michael Lennox
Submitted to the Department of Mechanical Engineering and the Sloan School ofManagement on May 12, 2006 in partial fulfillment of the Requirements for the Degreesof Master of Science in Mechanical Engineering and Master of Business Administration
Abstract
This thesis presents a detailed analysis of lean implementation at Hamilton Sundstrand, aglobal supplier of technologically advanced aerospace and industrial products. The mainobjective of the internship was to convert from a push system, where orders are expeditedand scheduled at multiple points in the process, to a pull system driven by a bin size orfinished goods supermarket. Some of the key issues addressed include system design forhighly variable processes, experimentation with various forms of Kanban, and the use ofvalue stream mapping as a change management tool.
This thesis is divided into two separate projects, both directly related to pull production.The first assignment was to redesign a subassembly process to improve fulfillment at thedownstream assembly operation. Broader in scope, the second task involvedimplementation of a constant work-in-process scheduling system or CONWIP. Eachproject was designed and executed through value stream mapping and continuousimprovement. The following discussion focuses on both strategic and tactical challengesof lean transformation because analysis and implementation were equally importantthroughout the internship.
Thesis Supervisor: Donald RosenfieldTitle: Senior Lecturer of Management
Thesis Supervisor: Daniel WhitneyTitle: Senior Research Scientist, Engineering Systems Division
MIT Thesis - Kevin Lennox Page 3

This page has been intentionally left blank.
MiT Thesis - Kevin Lennox Page 4

Acknowledgements
I would first like to thank the Leaders for Manufacturing program for its support of thiswork. The LFM experience has exceeded all expectations both academically andsocially. Thanks to all of my classmates for making the last two years so enjoyable.
I would also like to thank United Technologies and Hamilton Sundstrand for theirsponsorship of this work and the LFM program. In particular, I would like to thankMichael Butt, Russell Hubley, William Schnepp, and Robert Jennett for their support andguidance throughout the internship. They welcomed me onto the team, treated me like aninsider on the inside, and always made for an entertaining workplace.
I would like to thank my thesis advisors: Donald Rosenfield and Daniel Whitney fortheir assistance and counsel throughout the project.
In addition, I would like to thank the LFM/UTC crew who made being away from hometolerable. A special thanks to Rockledge, Wintonbury Hills, and the 1 5th and 16th holes atGillette Ridge.
Finally, I would like to thank to my wife Tara for supporting a lowly and pennilessstudent who refused to quit living the good life. Thanks for working so hard and makingthe first two years of marriage so great. I'm looking forward to many more to come.
MIT Thesis - Kevin Lennox Page 5

This page has been intentionally left blank.
MIT Thesis - Kevin Lennox Page 6

Table of ContentsA B STR A C T ....................................................................................................................... 3
A C K N O W LED G EM EN TS .......................................................................................... 5
TA B LE O F C O N TEN TS .............................................................................................. 7
LIST O F FIG U R ES ..................................................................................................... 9
C H A PTER 1: IN TR O D U C TIO N ................................................................................. 10
1.1 U NITED TECHNOLOGIES........................................................................................ 101.2 H AM ILTON SUNDSTRAND......................................................................................... 111.3 M ECHANICAL ENGINE SYSTEM S ........................................................................... 121.4 M ES O PERATIONAL CHALLENGES........................................................................ 13
1.4.1 Product V ariety ............................................................................................ 131.4.2 Product Com plexity ..................................................................................... 131.4.3 Part Shortages .............................................................................................. 141.4.4 Cross Training............................................................................................... 141.4.5 Scheduling.................................................................................................... 14
1.5 A PPROACH - V ALUE STREAM M APPING .................................................................. 151.6 O VERVIEW OF CHAPTERS......................................................................................... 15
CHAPTER 2: DEFINING THE EMID PROJECT.................................................... 16
2.1 EM ID BACKGROUND.............................................................................................. 162.2 CURRENT STATE .................................................................................................... 162.3 PROJECT G OALS.................................................................................................... 182.4 FUTURE STATE...................................................................................................... 192.5 TRANSFORM ATION PHASES ...................................................................................... 20
2.6 CHAPTER SUM M ARY ............................................................................................. 20
CHAPTER 3: ACHIEVING THE EMID FUTURE STATE ................. 21
3.1 SELECTING A K ANBAN .......................................................................................... 21
3.2 Tw o-BIN REPLENISHM ENT SYSTEM ....................................................................... 22
3.3 BIN SIZING ............................................................................................................. 22
3.3.1 O ne Piece Flow ............................................................................................ 223.3.2 D em and A nalysis .......................................................................................... 223.3.3 Cycle Tim e A nalysis..................................................................................... 233.3.4 Sizing A lternatives........................................................................................ 24
3.4 LOAD/CAPACITY ANALYSIS................................................................................... 25
3.5 R ESULTS .................................................................................................................. 263.5.1 Cycle Tim e.................................................................................................... 263.5.2 Inventory ...................................................................................................... 273.5.3 V isual M anagem ent ..................................................................................... 28
3.6 CHAPTER SUM M ARY ............................................................................................. 29
CHAPTER 4: IMPLEMENTING CON WIP .............................................................. 30
4.1 BACKGROUND ........................................................................................................ 304.2 CURRENT STATE .................................................................................................... 30
MIT Thesis - Kevin Lennox Page 7

4.3 M ODEL SELECTION ............................................................................................... 314.4 FUTURE STATE ...................................................................................................... 324.5 CON W IP OVERVIEW ............................................................................................ 334.6 D UAL SUPERM ARKETS .......................................................................................... 334.7 SUPERM ARKET SIZING ........................................................................................... 344.8 CON W IP PILOT PROGRAM ................................................................................... 374.9 EXECUTION AND PRELIM INARY RESULTS ............................................................. 374.10 CHAPTER SUM M ARY .............................................................................................. 38
CHAPTER 5: LESSONS LEARNED.......................................................................... 39
5.1 CHALLENGES W ITH EM ID PROJECT......................................................................... 395.2 CHALLENGES W ITH CON W IP TRIAL ....................................................................... 395.3 LEADERSHIP TAKE-AW AYS .................................................................................... 405.4 CONCLUSION .......................................................................................................... 41
BIBLIO G R A PH Y ........................................................................................................... 42
MIT Thesis - Kevin Lennox Page 8

List of Figures
Figure 1. UTC Revenue by Business, 2004 Annual Report ............................................ 11Figure 2. Hamilton Sundstrand Business Unit Organizational Chart........................... 12Figure 3. Mechanical Engine Systems Product Line.................................................... 13Figure 4. Current State Map of EMID Process............................................................. 18Figure 5. Future State Map of EMID Process.............................................................. 19Figure 6. A Sample Card attached to EMID Kanban Bin............................................. 21Figure 7. Forecasted EMID Demand by Part Number ................................................. 23Figure 8. Cycle Time Histogram for High Volume EMIDs ........................................ 24Figure 9. Forecasted EMID Load Hrs vs. Capacity.................................................... 25Figure 10. Cycle Time Before and After Process Change............................................. 27Figure 11. EM ID Inventory Balance ........................................................................... 28Figure 12. EMID Work Area after Process Improvement........................................... 29Figure 13. Current State Map with MRP Scheduling................................................. 31Figure 14. Monthly Demand vs. Cycle Time for High Demand Items ....................... 32Figure 15. Future State Map with CONWIP System.................................................... 33Figure 16. Inventory Level under Continuous Review Reorder Policy........................ 35Figure 17. Supermarket Calculator Sample .................................................................. 36Figure 18. Sample Supermarket Control Chart........................................................... 37
MIT Thesis - Kevin Lennox Page 9

Chapter 1: Introduction
Similar to recent Leaders for Manufacturing internships at United Technologies, thisproject was motivated by an "Operations Transformation" initiative being driventhroughout the company. Conceived of in 2003 as a means to sustain competitiveness ina global environment, Operations Transformation (OT) is aimed at three objectives: tomodify the infrastructure, to rationalize the manufacturing scope, and to improve theoperations execution.1 OT is complemented by UTC's lean manufacturing programcalled ACE for Achieving Competitive Excellence. While these initiatives encompassactivities throughout the entire supply chain, this internship focused primarily on internalproduction processes.
This thesis presents a detailed analysis of lean implementation at Hamilton Sundstrand'sMechanical Engine Systems division and is a continuation of a previous LFM internship.Hamilton Sundstrand is a subsidiary of UTC. The main focus of the project was toconvert from a push system, where orders are expedited and scheduled at multiple pointsin the process, to a pull system driven by a bin size or finished goods supermarket. Someof the key issues addressed are optimization of a subassembly, challenges ofimplementing a Kanban system, and the benefits of Constant Work-in-Process(CONWIP) versus traditional Kanban.
1.1 United Technologies
George David, Chairman and CEO of United Technologies (UTC), sums up his companyas follows "UTC is a global technology corporation with a long history of pioneeringinnovation in aerospace, aviation, helicopter design, climate control, elevator design andhydrogen fuel cells." 3 More specifically, UTC is a diversified company that consists ofsix independent business units:
* Carrier heating and air conditioning systems* Hamilton Sundstrand aerospace and industrial systems* Otis elevators and escalators* Pratt & Whitney aircraft engines* Sikorsky helicopters* UTC Fire & Security protection services
In addition to these businesses, UTC engages in fuel cell production and developmentfor commercial, transportation, and space applications through their UTC Powerdivision. They also operate a central Research Center to facilitate the development ofnew technologies and processes.
Operations Transformation video with excerpts from Operations Transformation Conference, held
January 16-17, 2003, East Hartford, CT, produced by United Technologies Corporation.2 Previous intern was Kevin McKenney, LFM Class of 2005.3 http://www.utc.com/profile/index.htm
MIT Thesis - Kevin Lennox Page 10

In total, UTC's various businesses generated $42.7B in revenue (2005) with aworkforce of 220,000 employees worldwide. Figure 1 shows the revenue broken down
by division in 2004. UTC has approximately 4,000 locations in 62 countries and has
been named "Most Admired" aerospace company by Fortune magazine for the past five
years in a row.4
7%8%
29% a rer
10% 0 Otis
o Pratt & Whitney
o Hamilton Sundstrand
* Fire & Security
22% m Sikorsky
24%
Figure 1. UTC Revenue by Business, 2004 Annual Report
1.2 Hamilton Sundstrand
Hamilton Sundstrand, headquartered in Windsor Locks, Connecticut, is among the largest
global suppliers of technologically advanced aerospace and industrial products. Thecompany designs and manufactures aerospace systems for commercial, regional,
corporate and military aircraft, and is a major supplier for international space programs.
Industrial products, consisting of four separate companies, serve industries ranging from
hydrocarbon, chemical and food processing to construction and mining.5
Hamilton Sundstrand was formed with the acquisition of the Sundstrand Corporation in
1999 and subsequent merger with UTC's legacy division Hamilton Standard. These two
companies have a rich history dating back to 1905 and 1919 respectively with an
impressive list of innovations including the first controllable-pitch propeller and the first
electronic engine control system. Today, Hamilton Sundstrand generates $4.4B in sales
and employs roughly 16,000 employees worldwide.6
Figure 2 shows the Hamilton Sundstrand organizational chart. This internship took place
in the Mechanical Engine Systems division (MES), a subdivision of the Engine and
Control Systems business unit (E&CS). E&CS acts as a single source systems provider
4 http://www.utc.com/profile/facts/index.htm5 http://www.hamiltonsundstrandcorp.com/hsc/details/0,4482,CLI1_DIV22_ET16080,OO.html6 UTC 2005 Annual Report
AMIT Thesis - Kevin Lennox Page I I

for jet engine manufacturers such as Pratt & Whitney and General Electric. Their
products include engine controls, fuel pumps, gearboxes, start systems, and gas turbine
accessories.
LL
Figure 2. Hamilton Sundstrand Business Unit Organizational Chart
1.3 Mechanical Engine Systems
The Mechanical Engine Systems division (MES) is an assembly and test operation. They
buy nearly all of their components from suppliers, both external and internal. MES
assembles a wide variety of products, most of which can be categorized into three groups:
Jet Fuel Controls (JFCs), Gas Turbine Accessories (GTAs), and Starters. Of the three,
JFCs account for the majority of sales and are the most labor intensive assemblies. A
sample of MES's product categories is shown in Figure 3.
At the time of the internship, MES employed roughly 45 hourly technicians, 20 salaried
engineers, and 5 managers. Total revenue for 2005 was approximately $50M, a 15%
increase from the year prior. The hourly work force is unionized and has remained
relatively constant despite the recent sales growth.
MIT Thesis - Kevin Lennox Page 12

Starter
Jet Fuel Control being assembled GTA
Figure 3. Mechanical Engine Systems Product Line
1.4 MES Operational Challenges
As a high-mix, low-volume operation, MES faces several challenges to implementing a
lean production system. This section describes some of the key characteristics identified
at the beginning of the project as items to consider for project selection and subsequent
system design.
1.4.1 Product Variety
With more than 60 different products and annual demand around 3000 units, MES is
most definitely a high-mix, low-volume operation. Demand across product lines ranges
from two or three up to 350 units per year with an average around 50. To make matters
more difficult, the various products have little commonality in parts or design. This
broad assortment of parts, almost all of which are purchased, leads to a complex and
somewhat disintegrated supply chain.
1.4.2 Product Complexity
As illustrated in Figure 3, jet fuel controls are complicated, labor-intensive assemblies.
This product complexity leads to long and highly variable processing times. Assembly
times range from 1 to 40 hours per unit, with an average of roughly 8 hours. With
standard deviation greater than 50% of the mean in most cases, process variability is
considered high by industry standards. Factors that influence variation include part
shortages, operator experience, and rework. Variation data is presented in further detail
in Chapter 4.
After assembly, the units are tested using large fuel rigs that reproduce engine operating
conditions. Test times are very similar to assembly times, averaging about 10 hours a
MIT Thesis - Kevin Lennox Page 13

unit. More importantly, test yield is relatively low, around 85% across all products. Theunits that fail require extensive rework which leads to high variation in overall cycletime. In addition to the labor required for teardown and repair, there is added time forengineering disposition and administrative processing.
1.4.3 Part Shortages
"Part shortages" was the most frequent response from the technicians when asked toidentify the organization's most critical issue. A part shortage simply means that thebuilder does not have all the parts he needs to assemble a unit. There are various reasonsexplaining these shortages including late supplier delivery, poor inventory management,single-sourcing, or quality non-conformances. As a result, the technicians are oftenforced to "build short" or out of sequence to accommodate the missing part. Buildingshort is not officially tracked as a metric but based on conversations with varioustechnicians at least 8 out of 10 units are built short.
1.4.4 Cross Training
The highly complex nature of MES's products requires experienced technicians toassemble and test them. Because of the variety in products, each model has its owncertification requirement. For a technician to become certified, he or she must be trainedand then successfully build a predetermined number of units, usually around five. Thisprocess is both time consuming and requires two resources in place of one. In a highpressure, production driven environment, training is often a low priority. With over 60models and 45 technicians, each of which is certified on an average of two or threeproducts, training becomes a major constraint. This lack of cross-training forces shopfloor supervisors to micromanage both the production schedule and resource allocation.
1.4.5 Scheduling
At the time of the internship, all production was scheduled using a centralized MaterialsResource Planning (MRP) system. This system is used throughout Hamilton Sundstrandand is very entrenched in all facets of the company from the supply chain tomanufacturing to the customer. Under MRP, parts are ordered in advance based on ademand forecast. While MES's demand is relatively firm six months out, the longcomponent lead times and subsequent processing times cause orders to fall off schedulewhich results in frequent expediting. By eliminating MRP and implementing pullproduction, MES should in theory be able to limit the expediting and improve on-timedelivery to the customer.
While there is potential for improvement in all of the challenges listed above, schedulingwas chosen as the focus of this internship mainly because it was the most manageablegiven the time and scope of the project. The other reason for focusing on pull productionwas the recent request from a key customer to establish a finished goods supermarket. Aswill be discussed throughout Chapter 4, the key deliverable for this internship was to putthe physical elements in place to execute pull production. Kevin McKenney's thesis
MT Thesis - Kevin Lennox Page 14

(LFM class of 2005), provides more detailed information and analysis on the otherchallenges listed above, specifically part shortages and cross training.7
1.5 Approach - Value Stream Mapping
Although the internship objective was straightforward from the beginning, it was criticalto develop a comprehensive understanding of the operation before making any changes.In addition to the traditional methods of research, observation, and informal interviews,Value Stream Mapping (VSM) was used as both a learning device and to establish aframework for managing change. Value stream mapping is a tool that helps to see andunderstand the flow of material and information as a product makes its way through thevalue stream. A value stream is defined as all the actions (both value added and non-value added) currently required to bring a product through the main flows essential toevery product: (1) the production flow from raw material into the arms of the customer,and (2) the design flow from concept to launch.8 For this internship, the value streamwas limited to actions inside the plant, from receiving to shipping, but the main conceptstill applied.
For the projects discussed in this thesis, VSM was taken a step further by scheduling anall day event to physically walk the process and interview key stakeholders. Theseevents were attended by a team of five or six key members including the author, theoperations manager, the manufacturing manager, and two or three engineers. Followingthe walk-around, the team gathered to construct both current and future state maps. Insome cases, more than one future state map was created to represent both short and longterm process improvements. These VSM events served as valuable kick-off meetingsand more importantly created a collective future state vision which could then be turnedinto a project plan. After the event, weekly team meetings were held to track progressand discuss results until the future states were realized.
1.6 Overview of Chapters
This thesis began with an introduction to United Technologies, Hamilton Sundstrand, andthe Mechanical Engine Systems Division, with an emphasis on the operational challengesfaced by MES. Chapters 2 and 3 will discuss the first of two projects completed duringthe internship which was to design and implement a two-bin Kanban system for theEMID subassembly process. Chapter 4 focuses on the development of a CONWIPsystem driven by a finished goods supermarket. Finally, Chapter 5 addresses some of thecultural issues associated with change management and presents the lessons learned fromboth projects.
7 McKenney, Kevin, "Development and Application of Management Tools within a High-Mix, Low-Volume Lean Aerospace Manufacturing Environment," Masters Thesis, MIT Leaders for ManufacturingProgram, June 2005.8 Rother, Mike, and John Shook, Learning to See, Brookline: The Lean Enterprise Institute, 2003.
MIT Thesis - Kevin Lennox Page 15

Chapter 2: Defining the EMID Project
Before making any changes that would impact the entire operation, the team decided tofirst begin on a smaller scale with an "offline" subassembly process. The intent was todevelop a robust process for implementing a pull system that could be used across theorganization. The other objective, aside from impacting the bottom line, was todemonstrate the potential for process improvement through lean concepts.
2.1 EMID Background
Most units built by MES require several electromechanical interface devices, genericallyreferred to as EMIDs. Simply put, an EMID is any part that has wires attached. Whilesome EMIDs are purchased ready for installation, most are received with unfinishedwires that need to be cut to a specified length and pinned before being assembled into thefinal unit. This procedure was at one time completed "on the job" as part of the finalassembly sequence, but was recently pulled out as a subassembly to be done "offline".The motivation for moving the process offline was to reduce labor cost by paying a lessskilled technician to complete the relatively simple job of cutting wires and attachingcontact pins.
The EMID pinning procedure was chosen for analysis due to the lack of an existingprocess. As a subassembly, EMID production was subject to the bullwhip effect leadingto major fluctuations in order fulfillment.9 As will be discussed in further detail in thenext section, EMIDs were essentially pinned in the order they were received from thesupply base, independent of what was needed downstream. Another reason for selectingthis process was the potential for significant inventory reduction considering the high-dollar value of EMIDs. The cost of a single EMID ranged from $400 to $5000, while theaverage inventory held was around $800,000, accounting for nearly 10% of MES's totalinventory.
2.2 Current State
As mentioned in section 1.5, the process improvement team began the EMID project byconducting a Value Stream Mapping event in early July. This section describes theEMID process as it occurred near the beginning of the internship which will be referredto as the "current" state. The following sub-sections provide some detail to accompanythe Current State Map shown in Figure 4.
Suppliers: There are roughly a dozen different EMID suppliers, ranging from very smallmom and pop operations to large electronics companies. Most of the supply base islocated within the United States, so orders are delivered via truck 1-2 times weekly withlead times ranging from 5-20 business days.
9 Standard, Charles, and Davis, Dale, Running Today's Factory: A Proven Strategy for LeanManufacturing. Cincinnati: Hanser Gardner Publications, 1999.
MIT Thesis - Kevin Lennox Page 16

Issue Work Order: The parts go through a central receiving department before they aredelivered to MES. Upon MES's receipt of the EMID, the material handler will release awork order in the MRP system and deliver a batch of parts to the processing queue.Batch size is set arbitrarily at the discretion of the material handler and variesconsiderably, (ranges from 1 to 15). The material handler typically performs this taskindependent of the downstream demand and is therefore "pushing" the parts through thesystem. The work order is now technically live, so cycle time is measured from this pointon. This process takes 5-10 minutes.
Assemble: This step is where most of the value added labor takes place. The EMIDwires are measured, cut, and pinned according to specifications. One full-time and onepart-time technician are dedicated to this task and support all MES production. Workorders are processed according to an informal FIFO system which is often rearranged bythe shop floor supervisor or other builders who are in need of a specific EMID. Largebatches that contain six or more units are fairly common and, as will be discussed lateron, lead to system inefficiencies. A typical work order of 4-6 units takes roughly 1.5hours to complete.
Inspect: After the EMIDs are cut and pinned, they are hand delivered to an inspectorwho then verifies that the part conforms to the drawing specifications. The order inwhich units are inspected is at the discretion of the inspector without a formalprioritization process. EMIDs are considered low priority and are often set aside for jetfuel controls or other completed assemblies. This process takes 10-15 minutes.
Close Work Order: After inspection, the EMIDs are hand delivered back to thematerial handler. The material handler will close the work order in the MRP system anddeliver the EMIDs to the final assembly part racks. The work order is now consideredcomplete thereby ending the cycle time. This process takes 5-10 minutes.
Customer: Because this is a subassembly, final assembly is considered the "customer".Final assembly is divided into several mixed-model lines with various part racks as willbe discussed further in Chapter 3. There is a major imbalance in EMID inventorythroughout these part racks to the point where some models contain a 6 month supplywhile others are starving. This imbalance is largely a result of the "push" nature of theprocess and clearly demonstrates the need for a just-in-time (JIT) system.
MIT Thesis - Kevin Lennox Page 17

rppiSuppliers Control AssemblyMRP & Spares
Issue WO Assemble.........Inspect Close WO
180~$ $1K0K le d
Figure 4. Current State Map of EMID Process
2.3 Project Goals
One of the beneficial features of VSM is establishing a reference point. The current state
map allows the team to easily identify the major issues with the process, which can then
be used to determine key objectives for the project. After evaluating the current process,
the team identified the following key goals:
- Reduce time in queue before the cutting and pinning operation- Balance inventory to eliminate starvation at final assembly
- Consolidate processes where possible to reduce the overall footprint
To achieve these goals, the plan was to design and implement a pull system using Kanban
as defined by the future state.
MIT Thesis - Kevin Lennox Page 18

2.4 Future State
With the project goals in mind, the team constructed a Future State Map. This map,
which serves as both a vision for success and a project management tool, was created
after collecting and evaluating data associated with the current process. The Future State
map for the EMID process is shown in Figure 5.
In comparing Figures 4 and 5, the transition from current state to future state requires the
following major changes:
1) Implement a Kanban system to drive EMID production
2) Reduce and fix work order quantities according to demand
3) Train the EMID technician to issue work orders
4) Integrate the supply base into the system
Additional changes include the establishment of a clear and disciplined FIFO lane and
moving the EMID assembly area closer to the material handler. This move reduced
EMID travel distance significantly and more importantly consolidated raw material into
one location, improving overall visual management.
---------- 7 Production 6 mo. forecast
rSuppliers LControl Assembly
MRP & Spares
100 ft
Issue WO FIFO-- Assemble FIFO-- Inspect FIFO-- Close WO
~IIP
Fu 5 u Value add
10 mins 1 hr 10 mins 10 mins time = 90 m
4 hrs4 hrsWait time= 3 days
Figure 5. Future State Map of EMID Process
MIT Thesis - Kevin LennoxPage 19

2.5 Transformation Phases
While traditional VSM events typically produce one future state with all desired changes,the EMID process improvement was carried out in two phases to allow for adjustments,and to give the technicians time to adapt to the new system.
Phase I incorporated most of the major changes including the introduction of Kanban andfixed bin sizing. After demonstrating success with the new system, Phase II furtherimproved the system by consolidating operations and integrating the suppliers. Thedevelopment and execution of both phases will be discussed in detail in Chapter 3.
2.6 Chapter Summary
This chapter introduces the EMID project and presents the process as it was at thebeginning of the internship. Several issues were identified as part of the value streammapping event that need to be resolved. The next chapter will provide the analysissubstantiating the changes planned for the future state and also discuss some of thechallenges of implementation.
MIT Thesis - Kevin Lennox Page 20

Chapter 3: Achieving the EMID Future State
Pointing out process inefficiencies and constructing a future state map, in a conference
room, with a team of supervisors and engineers, is easy. Executing the plan in a resource
and time constrained environment, where shipping the product is the number one priority,is much more difficult. This chapter will provide some analysis for changing the EMID
process. It also presents the preliminary results of the just-in-time system.
3.1 Selecting a Kanban
There are several mechanisms to choose from in selecting a pull signal or Kanban. Some
examples of Kanban include a card, an open space, a line, or a light.'0 The team decided
to use an empty parts bin as the indicator mainly because a two-bin replenishment system
was already in place downstream. The following paragraph provides a detailed
description of the existing two bin system. A second reason for selecting a bin rather
than a card is better traceability. As will be discussed in Chapter 4, cards can be easily
lost or misplaced. An informational photograph, shown in Figure 6, was attached to the
bottom of each bin to provide a visual reference.
EMID p/n: 827009-2
Detailed p/n: 823698-2
Supplier: Kavlico
Bin Size: 2
Model: JFC400-1
Place Empty Bin in Back for Replenishment
Figure 6. A Sample Card attached to EMID Kanban Bin
10 Pascal, Dennis, Lean Production Simplified: A Plain Language Guide to the World's Most Powerful
Production System. New York: Productivity Press, 2002.
MIT Thesis - Kevin Lennox
I
Page 21

3.2 Two-Bin Replenishment System
The final destination for an EMID prior to being assembled into a jet fuel control is aplastic bin. These bins are stored on racks that contain all of the components necessary tobuild a JFC. The racks are arranged by operation sequence and each part has twodedicated storage bins. The front bin is used as the primary stock, while the back isintended as a buffer. The idea is to consume parts from the front bin until it is empty, atwhich point the bins are swapped so that the back bin is now empty. The empty back binserves as a visual indicator for the material handler to replenish the supply. This systemworks well for simple items like screws and seals that require no preprocessing, butbecause of the long lead time described above, it was not used for EMIDs.
The goal for the future state was to use this two-bin system for EMIDs such that anempty back bin on the parts rack is the signal to process an EMID order. The materialhandler would then pick up the empty bin and deliver it to the EMID FIFO lane forprocessing and replenishment. The second bin served as a buffer so that final assemblywould have parts while the empty bin was being replenished.
3.3 Bin Sizing
Each EMID has a different assembly time depending on the number of wires and has adifferent consumption rate downstream depending on the JFC production rate. With over60 different types of EMIDs that support dozens of products, selecting a universal binsize was not a feasible solution. To achieve a functional JIT system, an individual binsize would be required for each EMID type according to demand and cycle time. Themethodology for calculating bin size is discussed in the following sections.
3.3.1 One Piece Flow
While lean principles would suggest one piece flow as the optimal solution, a bin size ofone is not practical in this case due to the time to process each work order. Every workorder is processed electronically through the MRP system. Therefore, time is required toinput information into the computer. This is done both at the beginning and end of theEMID cycle as previously illustrated in the current state map (Figure 4). There is also atime savings associated with measuring and cutting the wires in batches. According tothe EMID technician, the benefit of scale levels off with batches of four and higher.Hence, from an operational perspective, the optimal bin size should be somewherebetween one and four.
3.3.2 Demand Analysis
EMID demand data is generated by a forecast one year out. Generally speaking, ordersare firm six months out and slightly variable thereafter. Figure 7 plots cumulativepercentage of demand by part number, similar to an 80/20 curve. This curve was used tofilter out the low volume EMIDs that should not be included in the two bin system.These items are typically sold as spare parts or used in development hardware. It was
MIT Thesis - Kevin Lennox Page 22

determined that any EMID with average monthly demand less than or equal to two would
not be included in the new process. Of the 57 part numbers, 39 were to be included in the
two bin system, which accounted for 97% of the annual EMID demand.
V
(UE(U0V(UU,(UU(UI..0
U-4-0
100%
90%
80%
70%
60%
50%
40%
30%
20%
10%
0%1 6 11 16 21 26 31 36 41 46 51 56
Part Number
Figure 7. Forecasted EMID Demand by Part Number
3.3.3 Cycle Time Analysis
Cycle time is measured from when the EMID work order is issued in the MRP system to
the time it is closed, just before delivery to final assembly. The average cycle time is
11.7 working days, with a standard deviation of 13.7 days. Figure 8 shows a histogram
of cycle time for all 39 high volume EMIDs. Five of the 39 have an average cycle time
of greater than 28 working days, or 5.5 weeks. This is an astoundingly large number
considering the actual processing time or "touch time" is less than two hours for a typical
work order. The great majority of time is spent in queue just prior to the cutting and
pinning operation, as illustrated in Figure 4.
The extremely long wait time is due to the current practice of pushing work orders as
EMIDs are received rather than when they are needed. It is also due in part to the
frequent rearranging of the queue when orders are expedited. These push and expedite
practices lead to inflated and highly variable cycle times.
MIT Thesis - Kevin Lennox Page 23

12
10
LUL 4
2
0
Cycle Time (days)
Figure 8. Cycle Time Histogram for High Volume EMIDs
3.3.4 Sizing Alternatives
The following demand based bin sizing methodologies were considered as options for the
new JIT system.
1) Maximum weekly demand: Sets the bin size equal to the maximum weekly demand
for a particular part number, using a one year forecast.
2) Average weekly demand with buffer: Sets the bin size equal to the average weekly
demand plus one standard deviation.
Starvation at final assembly was a major concern. Therefore larger bin sizes were
favored because they provided a larger buffer. The tradeoff was that larger bin sizes also
led to longer cycle times, higher inventory, and added variability. Both options
represented a major reduction in bin size over the current process, but the maximum
demand alternative was chosen for the JIT system as the more conservative approach.
In selecting this method, it was assumed that EMID cycle time would be reduced to less
than one week. Under the two-bin system, the downstream operation would have one
week's worth of safety stock in a second bin while the first bin cycles through the EMID
process, thus allowing at most one week for replenishment. This was a bold assumption
considering the current cycle time for the average EMID was more than two weeks (11.7
MIT Thesis - Kevin Lennox Page 24

working days). By restricting the number of orders in queue, cycle time was expected to
drop substantially. A load versus capacity analysis was done to verify this assumption.
3.4 Load/Capacity Analysis
Each EMID has a standard assembly time ranging from 15 minutes to 1.5 hrs. While the
standard times are not always met, there was no actual data available so the standards
were used for this analysis. Monthly load was calculated for each EMID and then totaled
to determine overall shop load as shown below in Figure 9.
1 2005 EMID Demand
Cu.c0-j
250.00
200.00
150.00
100.00
50.00
0.00 -
OD July Aug Sept Oct Nov Dec
Figure 9. Forecasted EMID Load Hrs vs. Capacity
At the time of the analysis, there was one full-time technician dedicated to assembling
EMIDs as shown by the dotted line above. The OD column represents EMIDs that were
overdue or behind schedule. The large amount of overdue is evidence that one person is
clearly not enough, especially during the peak months such as September and October. A
second technician would have to be dedicated on an as needed basis to keep up with the
heavy load during peak production. If not, the WIP queue will begin to grow and the
replenishment time will increase beyond the one week threshold, leading to EMID
starvation downstream at final assembly.
To keep this scenario from happening, a maximum of two shelves worth of bins was
mandated for the assembly FIFO lane. Each shelf contained approximately one day's
work. Therefore the WIP queue could never go beyond two day's work. Anytime the
FIFO lane filled beyond the top two shelves, a flag was to be raised signaling the need for
MIT Thesis - Kevin Lennox Page 25

a second EMID assembler. The primary EMID technician was responsible formonitoring the line and raising the flag when needed. This policy had to be strictlyenforced to keep the JIT replenishment system functioning properly.
3.5 Results
The Kanban system was implemented at the end of July and data was collected tomeasure impact through the end of the internship in December. The data is summarizedin Table 1, and discussed further in the following sections.
Old Process New Process
Description - Push system - Pull system
" Large, variable bin sizes - Small, fixed bin sizes
- No visual mgt. * Consolidated, easily mgd.
Cycle Time V= 11.7 days [t= 4.4 days
Y = 13.7 days a = 3.1 days
Inv. WIP $ 180K (3 weeks) $ 30K (1-2 days)
Inv. Total $ 730K $ 715K
Table 1. Impact Summary of EMID Process Change
3.5.1 Cycle Time
As expected, cycle time reduced drastically from 11.7 days to 4.4 days. Most of this wasaccomplished by converting from push to pull and limiting the WIP queue to two daysworth of orders. While improving cycle time did not directly result in cost savings, it wasa prerequisite for a functional replenishment system. Figure 10 shows average cycle timebefore and after implementation of the two bin system for all 39 EMIDs.
MIT Thesis - Kevin Lennox
-J
Page 26

EMID Cycle Time by P/N (Before & After Process Change)
40 *
35
30
25M Before (Jan-Jun)
IN EAfter (Aug-Dec)20
15
10
P/N
Figure 10. Cycle Time Before and After Process Change
3.5.2 Inventory
The most significant impact of the newly implemented pull system was the improvement
in inventory management. While there was no quantitative data available, starvation at
final assembly was identified by both technicians and management as the key problem
with the current EMID process. With the two-bin Kanban system in place, starvation at
final assembly was essentially eliminated. During the four months following
implementation, there were two incidents of EMID shortages, and both were due to a
miscommunication between MES and the central receiving department, an issue that was
eventually straightened out.
While the primary goal for the project was to balance the finished goods inventory and
eliminate starvation at final assembly, it was clear that there was an opportunity for
significant cost savings through reduction in raw material inventory. This reduction
would only be realized if JIT was integrated into the supply chain. Without changing the
ordering policy, the EMIDs would continue to flow in from the suppliers at the same rate
as before; therefore any reduction in WIP would result in an increase in raw material
inventory. This scenario is exactly what happened as shown in Figure 11.
MIT Thesis - Kevin Lennox Page 2 7

After demonstrating the potential savings to the management team, it was decided tointegrate the suppliers into the new JIT system as part of the second phase of the project.Towards the end of the internship, in November, the ordering policies were changed withmost of the suppliers to implement an electronic Kanban through the MRP system.However, the effectiveness of these changes depended largely on the adequacy of theMRP system and coordination with the purchasing organization. The anticipatedinventory reduction was not yet realized at the conclusion of the internship.
0
0
160
C
900
800
700
600
500
400
300
200
100
oFG
EWIP
ERM
0Jul Sept Oct Dec
Figure 11. EMID Inventory Balance
3.5.3 Visual Management
An additional benefit to the project that cannot be quantified is the consolidation of
operations and inventory into one central area. Under the original setup, raw material
inventory was scattered throughout the shop floor and not accessible to anyone except the
material handler. A simple inventory inquiry could take up to 15 minutes just to go
through each aisle and check the multiple EMID locations. Under the new system, all of
the raw materials were consolidated and arranged onto two racks immediately adjacent to
the EMID assembly area. In addition to reducing the EMID travel distance by 250 ft, the
raw material inventory was now clearly labeled and easily visible to the supervisors
which allowed them to manage the supply more closely. Figure 12 is a photograph of the
EMID area after the process change. The two racks on the left contain all of the raw
MT Thesis - Kevin Lennox Page 28

material while the rack on the right holds works orders to be processed arranged as a
FIFO lane. The empty chair is where the EMID technician cuts and pins each order.
Figure 12. EMID Work Area after Process Improvement
3.6 Chapter Summary
This chapter presents the analysis, implementation, and results of the EMID project as
defined in Chapter 2. As mentioned previously, this project was planned as a lead-in to
the larger issue of implementing pull production across the organization. The next
chapter will discuss the design and transition to a supermarket driven system for MES's
primary production schedule.
MIT Thesis - Kevin Lennox Page 29

Chapter 4: Implementing CONWIP
After demonstrating significant improvement with the EMID process, the focus of theinternship shifted to the initial objective of revamping MES's existing scheduling system.As discussed briefly in 1.4.5, Hamilton Sundstrand uses MRP extensively throughout allorganizations. The MRP system has been used for many years and is essential tomanaging the growing supply chain. A pull system is designed to limit the role of MRPas it pertains to scheduling internal production, not to eliminate MRP altogether. Thegoal for this project was simple: design and implement a production process driven by asupermarket size rather than a customer due date.
4.1 Background
The supermarket idea came from one of MES's major customers. The customerrequested that MES maintain a finished goods inventory of a predetermined size fromwhich they could "shop". If MES were to agree to such a system, they would need todemonstrate their ability to maintain the supermarket size for an extended period of time.The management team realized the only way to achieve this goal was to establish a just-in-time (JIT) system via pull production, similar to the new EMID system.
Value stream mapping was again used to kick off the process. Although the team had asomewhat predetermined vision of the future state, the VSM event proved useful inunderstanding the existing process.
4.2 Current State
Figure 13 shows the current state of MES's generic manufacturing process. Some unitsrequire extra steps such as kitting, but most products follow the path exactly as shown.Excluding receiving and shipping, the process consists of five basic steps: Assembly,Inspect, Test, Process, and Final inspect. As highlighted in yellow, Assembly and Testare by far the most labor intensive and highly variable processes. The other three stepsare relatively consistent and only constitute a small fraction of the overall cycle time.Historical data was collected and analyzed from the previous year to measure labor timeat each step of the process and overall cycle time. These times vary drastically acrossmodels. Therefore each model had to be evaluated individually to determine applicabilityfor JIT production.
MIT Thesis - Kevin Lennox Page 30

Production
Suppliers Conr Csmr
Receiving
FG
Assemly InpectTest Process npt
Figure 13. Current State Map with MRP Scheduling
Note the amount of manual intervention in the scheduling process, represented in Figure
13 by the person connecting the MRP system to each process. This person is usually the
shop floor supervisor but scheduling is also controlled through a customer manager. The
customer manager is responsible for tracking all work orders and expediting any items
that are behind schedule. MES has four customer managers that work somewhatindependently resulting in a sub-optimization of resources. The shop floor supervisor is
ultimately responsible for allocating resources. However the customer managers often
interfere, especially in times of peak demand.
4.3 Model Selection
Similar to the EMID project, establishing supermarkets for all products was not practical
considering the numerous low volume items produced as legacy models, spares, and for
development purposes. An 80/20 analysis was completed to filter out the low volume
products. The top 80% consisted of 22 different models with average monthly demand
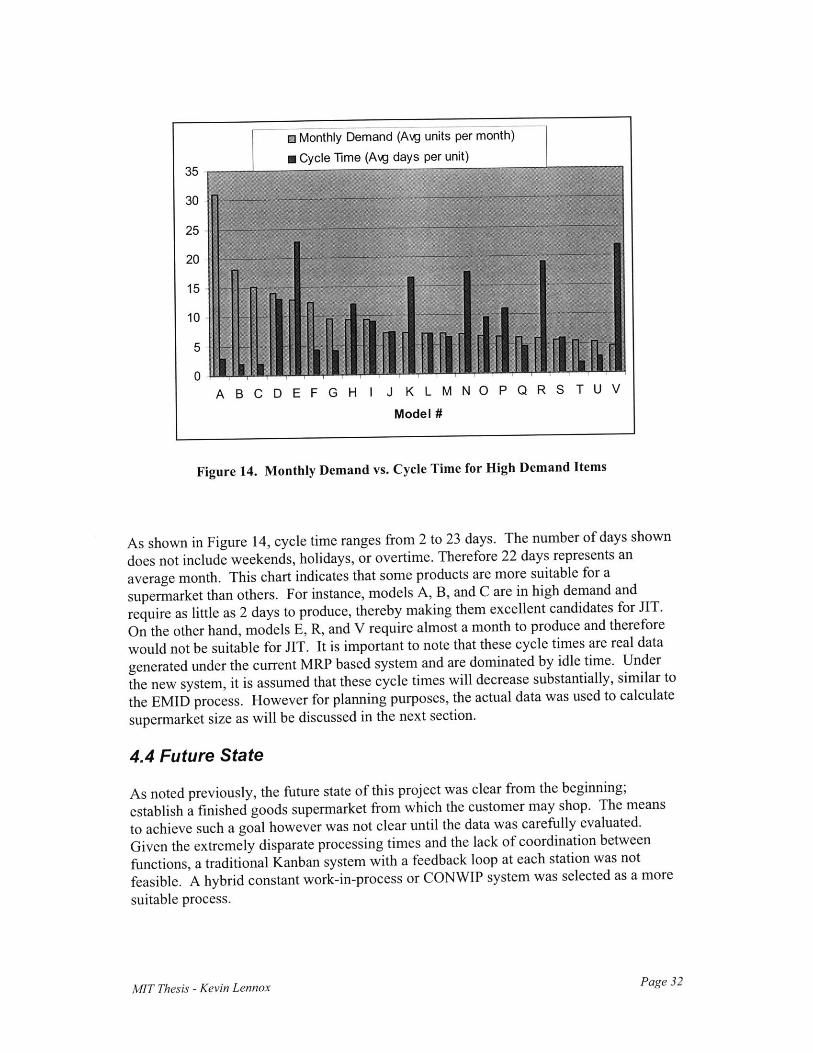
(output) ranging from 4 to 31 units. Figure 14 plots monthly demand relative to overall
cycle time for these top 22 models. Overall cycle time is defined as the time to produce a
unit from start to finish, including idle time. The cycle times are driven by various
factors including product complexity, part availability, test capacity, and technician
availability.
MIT Thesis - Kevin Lennox Page 31
* Monthly Demand (A\g units per month)
35
30
25
20
15
10
5
A B C D E F G H I J K L M N 0 P Q R S T U V
Model #
Figure 14. Monthly Demand vs. Cycle Time for High Demand Items
As shown in Figure 14, cycle time ranges from 2 to 23 days. The number of days shown
does not include weekends, holidays, or overtime. Therefore 22 days represents an
average month. This chart indicates that some products are more suitable for a
supermarket than others. For instance, models A, B, and C are in high demand and
require as little as 2 days to produce, thereby making them excellent candidates for JIT.
On the other hand, models E, R, and V require almost a month to produce and therefore
would not be suitable for JIT. It is important to note that these cycle times are real data
generated under the current MRP based system and are dominated by idle time. Under
the new system, it is assumed that these cycle times will decrease substantially, similar to
the EMID process. However for planning purposes, the actual data was used to calculate
supermarket size as will be discussed in the next section.
4.4 Future State
As noted previously, the future state of this project was clear from the beginning;
establish a finished goods supermarket from which the customer may shop. The means
to achieve such a goal however was not clear until the data was carefully evaluated.
Given the extremely disparate processing times and the lack of coordination between
functions, a traditional Kanban system with a feedback loop at each station was not
feasible. A hybrid constant work-in-process or CONWIP system was selected as a more
suitable process.
MIT Thesis - Kevin Lennox Page 32

4.5 CONWIP Overview
CONWIP is push-pull production system first described by Spearman, Woodruff, and
Hopp in 1990.11 A CONWIP line maintains a constant WIP level by allowing new jobs
to enter the production loop only as existing jobs are completed. The primary difference
between CONWIP and traditional Kanban is that CONWIP pulls jobs from the front of
the line and pushes them between stations elsewhere in the line, while Kanban pulls jobs
between all stations.12 CONWIP is designed to deliver the same benefits of pull
production for high-mix low volume operations that aren't conducive to traditional JIT.
Production
Suppliers Control Customer
I F_ IRP
ReceivingShipping
R - ~~~~~~~ - ---~ ~ ~ -- -- -- -- -~~~~~~-- -- -- ~~~~ ~~~~ ~~~~-~-~~~~~ ~~~z FG
Assembly Tas Test Process
Figure 15. Future State Map with CONWIP System
4.6 Dual Supermarkets
The Future State Map, shown in Figure 15, illustrates the use of two separate feedback
loops thus creating somewhat of a hybrid between traditional Kanban and CONWIP.
Units are pulled through the critical steps; assembly and test, and pushed through the less
variable steps; inspect, process, and final inspect. The rationale for using two loops rather
than one complete loop is simply that the overall cycle time in most cases is greater than
" Spearman, Mark L., Woodruff, David L., and Hopp, Wallace J., "CONWIP: a pull alternative to
kanban." International Journal of Production Research, 1990, vol. 28, no. 5, 879-894.
2 Hopp, Wallace J., and Roof, M. L., "Setting WIP levels with statistical throughput control (STC) in
CONWIP production lines." International Journal of Production Research, 1998, vol. 36, no. 4, 867-882.
MIT Thesis -Kevin Lennox Page 33

the time between shipments. For example, consider model J that has an average cycletime of 1.5 weeks and an average demand of 2 units per week. In a one loop system,when a completed unit is shipped to the customer, a card is sent back to the front whichwill then trigger production of another unit. This unit will then take an average of 1.5weeks to complete, but the customer needs the next unit within the week.
While it is possible to use one loop, it would require an undesirably large finished goodsinventory. Establishing two loops cuts cycle time roughly in half and reduces the totalamount of inventory to sustain the system. The major downside is that two loops requiretwo supermarkets which complicate the system from a management perspective. Thedesign and implementation of the supermarkets will be discussed further in the followingsections.
The purpose of a supermarket is to serve as both a scheduling point for production and toact as on-hand inventory ready to ship at the customer's request. In the CONWIP systemdescribed above, there is both a finished goods supermarket and work-in-processsupermarket. Both behave in the same manner, the only difference being that the FGsupermarket will be directly accessible by the customer and will therefore serve as theprimary trigger for production.
A description of the system shown in Figure 15 is as follows. Each supermarket willhave a predetermined size which serves as the target amount of inventory. As soon as thenumber of units falls below this target, a Kanban card is sent upstream to initiate therelease of a new unit. When a spot is vacated in the FG supermarket, the card goes backto Test which releases a unit from the WIP supermarket, vacating a spot and sendinganother card back to Assembly. The number of Kanban cards is equal to the supermarketsize according to the CONWIP strategy.
4.7 Supermarket Sizing
The supermarket sizing methodology was based on a Continuous Review, Reorder Pointpolicy as illustrated in Figure 16.13 The CR/RP model assumes a fixed order quantity Q,which is one because units are built individually, and replenishment time L, which is thesame as cycle time. The reorder point, R, is defined as the inventory level that willtrigger a reorder event. A reorder event is triggered when the total inventory (FG + WIP)falls below R. In this case, R is synonymous with supermarket size and can be calculatedas follows. 14
13 Anupindi, Ravi, Chopra, Sunil, Deshmukh, Sudhakar D., Van Mieghem, Jan A., Zemel, Eitan, ManagingBusiness Process Flows. Upper Saddle River: Prentice-Hall Inc., 1999.
14 McKenney, Kevin, "Development and Application of Management Tools within aHigh-Mix, Low-Volume Lean Aerospace Manufacturing Environment," Masters Thesis, MIT Leaders forManufacturing Program, June 2005.
MIT Thesis - Kevin Lennox Page 34

= LTD+SS
= Lead Time Demand
= Id * pi
SS = Safety Stock
= ZVd * pl + V1 * p-id)
Pd= average demand (units/month)
Vd =variation in demand
pi= average cycle time (in months, month = 22 days)
vi= variation in cycle time
z = measure of service level (z = 1.65 for 95% SL)
Units.
RQ
L
Q
L L
Order Cycle #1 Order Cycle #2
Figure 16. Inventory Level under Continuous Review Reorder Policy"
15 1.269 Supply Chain Planning & Advanced Logistics and Supply Chain Strategies Lecture by StephenGraves, Abraham J. Siegel Professor of Management Science & Engineering Systems, February 2, 2004.
MIT Thesis - Kevin Lennox
R
LTD
N
Time
Page 35
.~ ~ - -.
Q

It is important to note that R represents the sum of the FG and WIP supermarkets.
Individual supermarket sizes were determined based on the average ratio of Test Time to
Assembly Time (TT/TA).
R = RFG + RwIp
RFG = R/2 * TT/TA
In most cases, this ratio was close to 1, which leads to equal supermarket sizes of R/2. If
R is odd and TT/TA is 1, the 0.5 unit usually gets added to the FG supermarket because
management preference is to have more units closer to completion.
The benefit to using this approach is that process variation is built into the safety stock.
To be conservative, historical cycle time data including rework was used for the
calculation. Similar to the EMID project, the expectation upon implementing the
CONWIP system was to reduce cycle time which would then allow for a subsequent
reduction in supermarket size.
A supermarket calculator, shown in Figure 17, was constructed as a tool for MES to use
in conjunction with the Supermarket Control Chart, shown in Figure 18. This calculator
has four inputs, highlighted in yellow, which are linked directly to MES's data query
system. The supermarket sizes are automatically output and displayed in green. Other
factors that may be adjusted include service level (z) and Test/Assembly ratio. Upon full
implementation of the system, it would be necessary to recalculate supermarket sizes
periodically to adjust for changes in demand or cycle time.
Units/Mth Dem Var CT Avg CT Var Lead time Safety Test/Asy FG size WIP size
Model (ud) (vd) (ul) (V) Dem Stk SM size R Tt/Ta Rf Rw Cost/unit
A 15.0 50.0 0.41 0.07 6.2 7.5 14 1.10 8 6 $ 5,000
B 10.0 15.0 0.33 0.09 3.3 3.7 7 0.75 3 4 $ 10,000
C 12.0 35.0 0.50 0.12 6.0 6.9 13 1.20 8 5 $ 35,000
DI 20.0 25.0 0.311 0.07[ 6.21 4.61 il1 0.901 51 6 $ 15,000El 13.0 5.0 0.281 0.051 3.71 2.01 61 1.001 31__ 3__ $ 25.000q
Total SM Inventory 897,200
Figure 17. Supermarket Calculator Sample
Supermarket sizes were calculated with and without forecasted demand variation (vd) to
evaluate the impact of level loading the production schedule. Eliminating vd reduced the
total supermarket size by roughly 20%. As noted in the safety stock equation above,
reducing cycle time variation (vl) would have an exponentially greater impact on R.
However, cycle time variation is more of a systematic issue resulting from the various
factors discussed in Chapter 1 such as low test yield and frequent part shortages.
MIT Thesis - Kevin Lennox Page 36

4.8 CONWIP Pilot Program
As mentioned previously, the concept of a supermarket driven production schedule was
primarily motivated by a customer request. The MES CONWIP team, including the
author and manufacturing manager, met with customer representatives towards the end of
the internship to discuss an implementation strategy. It was decided to begin with a pilot
program that included the high volume items with relatively low process variation.
The customer calculated its own supermarket size based solely on its production forecast.
The customer's supermarket was compared to MES's as a reality check. In most cases,
the supermarket sizes were identical. The few differences were driven by long cycle
times on certain products that were not factored into the customer's calculation.
It was agreed that the supermarkets would have to be monitored continuously and would
therefore be subject to periodic audits by the customer. In response to this request, a
Supermarket Control Chart was developed for the MES management team as shown in
Figure 18. Unfortunately, the pilot program was not scheduled to begin until after the
end of the internship. However an experimental "pre-pilot" was executed in anticipation
of the transition and is discussed briefly in the following section.
Figure 18. Sample Supermarket Control Chart
4.9 Execution and Preliminary Results
In addition to the analysis discussed in the preceding sections, the pre-pilot required three
major actions before getting started: select a Kanban system, construct a supermarket,
and train the technicians to use the system.
MIT Thesis - Kevin Lennox
Model ADay Date WSM Repair FSM
M 11/28 3 0 3T 11/29 3 0 1
W 11/30 2 0 2
Th 12/1 2 0 3F 12/2 3 0 3
M 12/5 3 0 2
T 12/6 2 1 2
W 12/7 3 1 2
Th 12/8 3 1 0F 12/9 3 0 1
M 12/12 3 0 1
T 12/13 2 0 2
W 12/14 2 0 3
Th 12/15 2 0 3
F 12/16 3 0 3
SM Control Chart -Model A
8765 ORepair
4- E FSM
3 MWSM
2-
1
0
Page 3 7

Unlike the EMID project, it was not possible to use the product bins as Kanbans becausethe bins are sent out periodically to be washed. For this reason, laminated 3x5 cards wereused to drive production. A Kanban board was used to display cards that representedvacant spots in the supermarket, therefore a card on the board served as authorization tobuild or test. An empty board indicated that all units were either at a supermarket or inprocess. As will be discussed further in the next chapter, management and utilization ofthese cards turned out to be more difficult than expected.
To construct the supermarkets, a space on the incoming Test rack and on the FinalInspect rack were designated and labeled accordingly. Placemats with photographs wereattached to the shelves so that vacancies were easily identifiable. As the supermarketgrows to include all MES models, space will likely become a constraint that has to bemanaged.
Because the pre-pilot included so few models, but involved so many people, it wasdifficult to select a concentrated group of technicians for training. The management teamwas reluctant to conduct an all-hands training session mainly because the process was inits infancy and would likely require several modifications before being finalized. Of thetechnicians that were trained, many were quick to point out that there was noprioritization process separating the experimental CONWIP system from the existingproduction process. The dual supermarkets and Kanban boards added to the confusion.Many of these issues would have to be addressed before officially rolling out the processfor the customer.
4.10 Chapter Summary
Chapter 4 presents a strategic analysis that includes a description of the currentscheduling process and the introduction of CONWIP. This chapter also discussedsupermarket calculations, developed management tools, and identified issues from thepre-pilot trial, which will be discussed in greater detail in the next chapter.
MIT Thesis - Kevin Lennox Page 38

Chapter 5: Lessons Learned
Though similar in concept, the two projects presented in this thesis posed very differentchallenges from a leadership perspective. This chapter discusses some of the roadblocksencountered during the internship and summarizes the lessons learned for driving changein a manufacturing organization.
5.1 Challenges with EMID Project
The EMID project, initially designed as a small assignment to help permeate lean into theorganization, evolved into a major part of the internship. Relative to the second project,there were few difficulties in leading the workforce. The challenges were more related totechnical issues such as understanding the MRP system and deciding on a bin sizingmethodology. There was one instance where a technician was very reluctant to give upresponsibility as required by the process change but this was handled with furtherexplanation and compromise. Aside from this incident, the value stream mapping event,rearranging the shop floor, and training the EMID technician all went very smoothly.
There were a few external factors that contributed to the success of the project. First,there were only two technicians affected by the change, and both were involved early onin the process. Their contribution during the VSM event and willingness to learn a newsystem was critical to implementing a functional process. The other factor was atremendous amount of support from MES management. The summer months aretypically not as busy, so the team was able to meet once or twice a week which helpedkeep the momentum of the project rolling. In addition to relationship building, thelearning that took place during the project was primarily on how to conduct a VSM eventand best explain lean concepts to the workers.
The most discouraging aspect of the project was trying to change the ordering policieswith the EMID suppliers to use a Kanban. The potential for savings on raw materialinventory was enormous and seemed very attainable. However the MRP system was likea black box. Every person contacted to explain its capability had a different answer. Bythe time everything was straightened out, the internship was coming to a close and theinventory had not improved at all. Aside from the supply chain management issues, thisproject was considered a success and helped establish a positive attitude leading into thenext project.
5.2 Challenges with CONWIP Trial
The CONWIP project was a completely different story. Unlike the EMID project,introducing Kanban cards and supermarkets across the organization involved at least 15-20 technicians. Many of the technicians and supervisors were unable to attend the VSMkickoff event due to a busy production schedule in the fall. With so many stakeholdersand no available time, the author and management team were forced to design theCONWIP system with little input from the key stakeholders. When it came time toexecute the pre-pilot program, there was a tremendous amount of confusion regarding the
MiT Thesis - Kevin Lennox Page 39
Kanban cards and dual supermarkets. Had the entire team been involved from thebeginning, or been able to take part in an extended training period, the pre-pilot mighthave had more success. Instead, the author attempted to train individuals informallywithout providing the opportunity for communication among different functions. Theresult was a somewhat disjointed process with Kanban cards getting mixed up or lost.
The strategic analysis and process design were beneficial as management tools forplanning and development however the tactical elements were somewhat disappointing.The pre-pilot exposed problems that need to be resolved before the actual trial period andcustomer audits begin. Like any large scale process change, this will require closeattention from either a manager or engineer that is able to dedicate a substantial portionof time to the project. With another major lean initiative on the horizon, namelytransitioning from stationary work benches to a mobile assembly cart, MES managementwill have to be disciplined in allotting time for process improvement even it meansbuilding ahead of schedule to shut down production.
5.3 Leadership Take-aways
Although methods for successful change management are different for every situation,there were several lessons learned over the course of the internship that are transferable toany lean implementation project. The key take-aways are listed below.
- A leader needs to interact with team members both in a group and individually- Key stakeholders need to be involved from the beginning- Learning by doing is better than excessively planning
The first take-away might seem obvious, but in many large organizations, managers don'ttake the time to lead outside of a group setting. The one-on-one interaction fosters therelationship and establishes a sense of ownership for the employee. In addition, peoplehave different styles and some team members may not feel comfortable contributingduring a group meeting but are eager to do so offline. Perhaps not as common, but othermanagers are so busy interacting with their employees that group meetings are neglected.This is similar to what happened during the CONWIP project, which led to adisintegrated team and process. Group gatherings can create a team dynamic, reinforcethe significance of the change, and allow for communication between team members. Alack of team engagements also tends to diminish the sense of urgency for a project.
The second lesson above is more specifically targeted towards lean implementation. Asdemonstrated during the CONWIP pre-pilot, not involving technicians early on created asituation of giving orders rather than asking for input. This style can be effective in somegroups, depending on the workforce culture. Certain people would prefer to take ordersover contributing, but most are going to respond more effectively when they'veparticipated in the process redesign. The opposing argument can be made that fostering ademocratic style in a manufacturing environment with dozens or hundreds of workers cancomplicate the issue unnecessarily. Either way, the employee culture should beconsidered before choosing a leadership style.
MIT Thesis - Kevin Lennox Page 40

Another way of stating the last take-away above is to avoid "analysis paralysis" as theylike to say in MES. During the EMID project, the team started to enter a phase of"analysis paralysis" by excessively planning rather than implementing. Fortunately, therewere team members conscious of this concept who suggested that executing the plan wasmore important than scrutinizing over every last detail. This is especially important in atime constrained, high pressure environment like manufacturing. The sense of urgency isthe driving force behind Kaizen bursts or action work-outs, where plants will shut-downproduction to make things happen immediately thus taking away the opportunity fornegligence. Avoiding this trap is critical for driving change in an operations environmentwhere shipping products is the first priority.
5.4 Conclusion
The design and implementation of a lean production system is a complex andmultifaceted undertaking that requires both careful analysis of the process and timelyexecution through employee training and adaptation. This thesis discusses leanimplementation in the context of designing pull systems for highly variable processes.The two projects carried out during the internship demonstrated unique challengesdespite being similar in nature. From an operational perspective, the CONWIP systemwas difficult to implement because of the added complexity of multiple supermarkets andKanban cards. The EMID project was easier to execute but revealed the need forongoing management to realize the full potential of the newly designed system. Insummary, pull production and lean implementation in general, should be approached withthree entities in mind; the process, the stakeholders, and the organization. The processwill drive the analysis while stakeholder acceptance and organizational culture will helpdetermine the plan for execution.
MAIT Thesis - Kevin Lennox Page 41
Bibliography
Anupindi, Ravi, Chopra, Sunil, Deshmukh, Sudhakar D., Van Mieghem, Jan A., Zemel,Eitan, Managing Business Process Flows. Upper Saddle River: Prentice-HallInc., 1999.
Hopp, Wallace J., and Spearman, Mark L., Factory Physics: Foundations ofManufacturing Management. New York: McGraw-Hill, 2000.
Hopp, Wallace J., and Roof, M. L., "Setting WIP levels with statistical throughputcontrol (STC) in CONWIP production lines." International Journal of ProductionResearch, 1998, vol. 36, no. 4, 867-882.
Gates, Matthew D., "Lean Manufacturing System Design and Value Stream Managementin a High-Mix, Low-Volume Environment," Masters Thesis, MIT Leaders forManufacturing Program, June 2004.
Goldratt, Eliyahu M., The Goal: A Process of Ongoing Improvement. Great Barrington:The North River Press, 1992.
McKenney, Kevin, "Development and Application of Management Tools within aHigh-Mix, Low-Volume Lean Aerospace Manufacturing Environment," MastersThesis, MIT Leaders for Manufacturing Program, June 2005.
Pascal, Dennis, Lean Production Simplified: A Plain Language Guide to the World'sMost Powerful Production System. New York: Productivity Press, 2002.
Rother, Mike, and John Shook, Learning to See, Brookline: The Lean EnterpriseInstitute, 2003.
Spearman, Mark L., Woodruff, David L., and Hopp, Wallace J., "CONWIP: apull alternative to kanban." International Journal ofProduction Research, 1990,vol. 28, no. 5, 879-894.
Standard, Charles, and Davis, Dale, Running Today's Factory: A Proven Strategy forLean Manufacturing. Cincinnati: Hanser Gardner Publications, 1999.
Womack, James P., and Daniel T. Jones, Lean Thinking, New York: Free Press, 2003.
MIT Thesis - Kevin Lennox Page 42