Embed Size (px)
Citation preview

IMPLEMENTING A UTILITY GEOGRAPHIC INFORMATION
SYSTEM FOR WATER, SEWER, AND ELECTRIC
A THESIS PRESENTED TO THE DEPARTMENT OF GEOLOGY AND
GEOGRAPHY IN CANDIDACY FOR THE DEGREE OF
MASTER OF SCIENCE
By
Davie Crawford
NORTHWEST MISSOURI STATE UNIVERSITY
MARYVILLE, MISSOURI
MARCH, 2012

IMPLEMENTING A UTILITY GEOGRAPHIC INFORMATION SYSTEM
Implementing a Utility Geographic Information System
for Water, Sewer, and Electric
Davie Crawford
Northwest Missouri State University
THESIS APPROVED
Thesis Advisor, Dr. Ming Hung Date
Dr. Patricia Drews Date
Dr. Yi-Hwa Wu Date
Dean of Graduate School, Dr. Gregory Haddock Date
iii
Implementing a Utility Geographic Information System for Water, Sewer, and Electric
Abstract
This thesis presents the design and implementation of a Geographic Information
System (GIS) for the Water, Sewer, and Electric Departments for the City of Calhoun,
Georgia. The thesis reviews literature that is associated with developing a utility GIS.
The objective of this thesis is to explain how the design and implementation of a GIS for
the City of Calhoun was established in order to efficiently manage their utility
distribution systems and replace the existing CAD system. It also provides other small
municipalities with an understanding of what it takes to design and implement a utility
GIS. The design and implementation were divided into a set of phases that were carried
out to ensure a successful completed system.
The methodology used in the development of the GIS has been acquired through
reviewing and evaluating other similar systems that involve utility data. The utility
departments have relied on inaccurate CAD data for years. The departments all agreed
that a more accurate and up to date system would help manage their assets. The
conclusion of this thesis demonstrates the improved efficiency after implementing the
GIS compared with the previous CAD system.

iv
Table of Contents
List of Figures .................................................................................................................... vi
List of Tables ................................................................................................................... viii
ACKNOWLEDGEMENTS .................................................................................................x
LIST OF ABBREVIATIONS ............................................................................................ xi
CHAPTER 1 ........................................................................................................................1
INTRODUCTION ...............................................................................................................1
Research Objective ................................................................................................. 2
CHAPTER 2 ........................................................................................................................4
LITERATURE REVIEW ....................................................................................................4
Implementation Obstacles ....................................................................................... 4
Methodologies......................................................................................................... 6
Utility Data Collection ............................................................................................ 7
Geodatabase Design ................................................................................................ 8
CHAPTER 3 ........................................................................................................................9
USER NEEDS ASSESSMENT ...........................................................................................9
Description of Study Area ...................................................................................... 9
Needs Assessment Overview ................................................................................ 13
Department of Water GIS Needs Assessment ...................................................... 14
Department of Sewer GIS Needs Assessment ...................................................... 16
Department of Electric GIS Needs Assessment.................................................... 18
CHAPTER 4 ......................................................................................................................21
GEODATABASE DESIGN ..............................................................................................21

v
Water Geodatabase Design ................................................................................... 21
Sewer Geodatabase Design ................................................................................... 34
Electric Geodatabase Design ................................................................................ 44
CHAPTER 5 ......................................................................................................................61
DATA DEVELOPMENT AND CONVERSION .............................................................61
Water System Data Conversion and Development ............................................... 61
Sewer System Data Conversion and Development .............................................. 65
Electric System Data Conversion and Development ............................................ 68
Web Mapping Application and Development ...................................................... 71
CHAPTER 6 ......................................................................................................................81
ANALYSIS RESULTS AND DISCUSSION ...................................................................81
Challenges and Solutions ...................................................................................... 89
CHAPTER 7 ......................................................................................................................90
CONCLUSION AND FUTURE ENHANCEMENTS ......................................................90
Conclusion ............................................................................................................ 90
Future Enhancements ............................................................................................ 90
References ..........................................................................................................................92
vi
List of Figures
Figure 1. Location of the City of Calhoun, Georgia ........................................................ 10
Figure 2. Zoning Map of the City of Calhoun, Georgia .................................................. 11
Figure 3. Water Department Feature Dataset Design ....................................................... 22
Figure 4. Water Department ER Diagram ........................................................................ 23
Figure 5. Sewer Department Feature Dataset Design ....................................................... 35
Figure 6. Sewer Department ER Diagram ........................................................................ 36
Figure 7. Electric Department Feature Dataset Design .................................................... 44
Figure 8. Electric Department ER Diagram ...................................................................... 45
Figure 9. Example Water Map in CAD Not to Scale ....................................................... 63
Figure 10. Example Water Map in GIS. Refer to Figure 50 for Symbology .................... 64
Figure 11. Water GIS Symbology .................................................................................... 65
Figure 12. Example Sewer Map in CAD Not to Scale ..................................................... 66
Figure 13. Example Sewer Map in GIS. Refer to Figure 53 for Symbology. .................. 67
Figure 14. Sewer System Symbology ............................................................................... 68
Figure 15. Example Electric CAD Map not to Scale ........................................................ 69
Figure 16. Example Electric Map in GIS. Refer to Figure 56 for Symbology. ................ 70
Figure 17. Electric GIS Symbology .................................................................................. 71
Figure 18. Web Mapping Application Initial Screen ........................................................ 74
Figure 19. Main Toolbar for Application ......................................................................... 74
Figure 20. Layers List ....................................................................................................... 75
Figure 21. Locate Address Tool........................................................................................ 76

vii
Figure 22. Billing Account Number Lookup Tool ........................................................... 77
Figure 23. Attribute Table Tool ........................................................................................ 78
Figure 24. Search and Identify Tool ................................................................................. 78
Figure 25. Example Use of Search/Identify Tool ............................................................. 79
Figure 26. Draw and Measure Tool .................................................................................. 79
Figure 27. Print Tool ......................................................................................................... 80
Figure 28. Water Layer GIS Application .......................................................................... 84
Figure 29. Sewer Layer GIS Application ......................................................................... 85
Figure 30. Electric Layer GIS Application ....................................................................... 85
Figure 31. Overview of Calhoun Water System ............................................................... 86
Figure 32. Overview of Calhoun Sewer System ............................................................... 87
Figure 33. Overview of Calhoun Electric System ............................................................ 88
viii
List of Tables
Table 1: Average Monthly Statistics for Water Department ............................................ 15
Table 2: Feature Statistics for Water Department............................................................. 15
Table 3: Average Monthly Statistics for Sewer Department ............................................ 17
Table 4: Feature Statistics for Sewer Department ............................................................ 17
Table 5: Average Monthly Statistics for Electric Department.......................................... 20
Table 6: Feature Statistics for Electric Department .......................................................... 20
Table 7: Water Main Feature Class Design ...................................................................... 24
Table 8: Pump Station Feature Class Design .................................................................... 24
Table 9: Valve Feature Class Design ................................................................................ 25
Table 10: Hydrants Feature Class Design ......................................................................... 26
Table 11: Tanks Feature Class Design.............................................................................. 27
Table 12: Backflow Fire Tap Feature Class Design ......................................................... 28
Table 13: Backflow Point Feature Class ........................................................................... 29
Table 14: Laterals Feature Class Design .......................................................................... 30
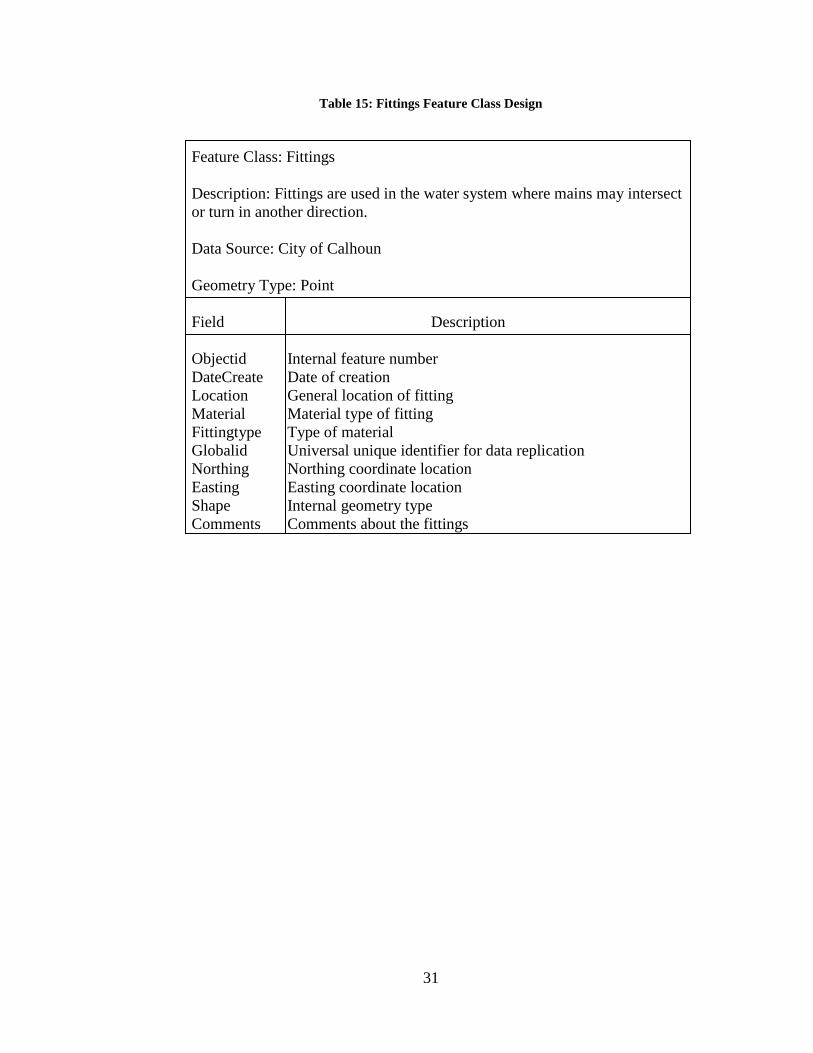
Table 15: Fittings Feature Class Design ........................................................................... 31
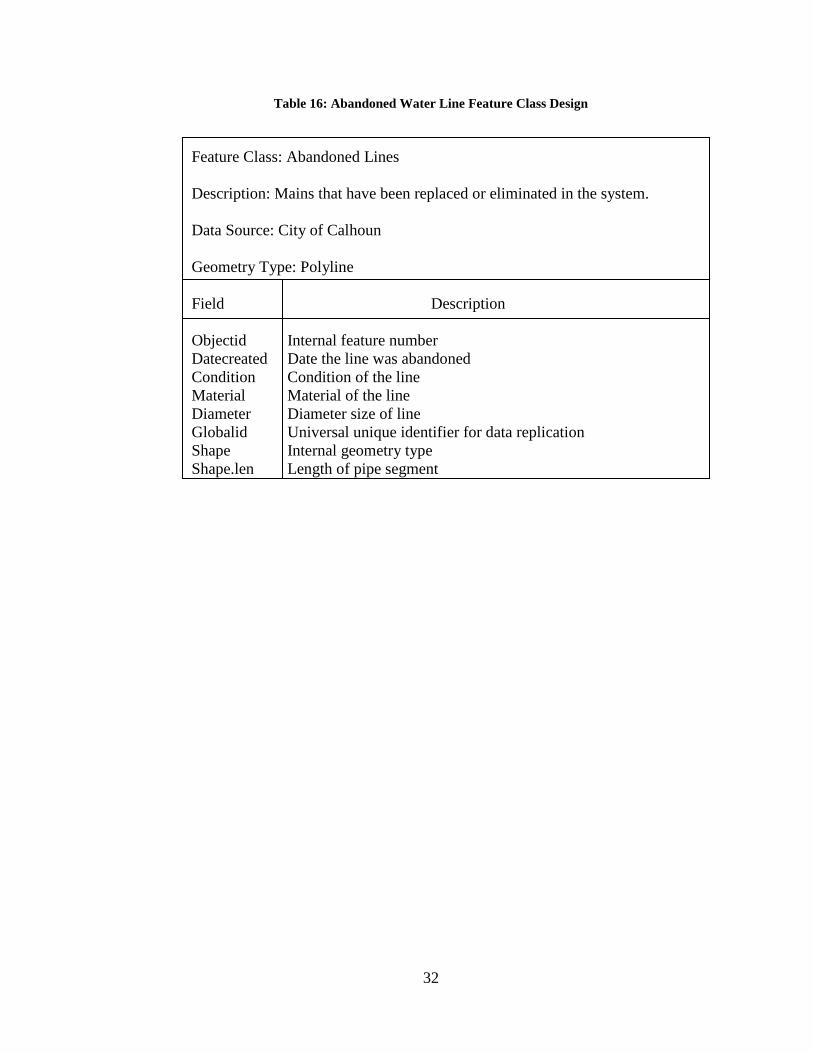
Table 16: Abandoned Water Line Feature Class Design .................................................. 32
Table 17: Water Meters Feature Class Design ................................................................. 33
Table 18: Leaks Feature Class Design .............................................................................. 34
Table 19: Manhole Feature Class Design ......................................................................... 37
Table 20: Gravity Main Feature Class Design .................................................................. 38
Table 21: Lift Station Feature Class Design ..................................................................... 39
Table 22: Wet Well Feature Class Design ........................................................................ 39

ix
Table 23: Monitor Location Feature Class ....................................................................... 40
Table 24: Service Lateral Feature Class Design ............................................................... 41
Table 25: Clean Out Feature Class Design ....................................................................... 42
Table 26: Force Main Feature Class ................................................................................. 42
Table 27: Abandoned Line Feature Class ......................................................................... 43
Table 28: Abandoned Point Feature Class Design ........................................................... 43
Table 29: Anchor Guy Feature Class Design ................................................................... 46
Table 30: Span Guy Feature Class Design ....................................................................... 46
Table 31: Bus Bar Feature Class Design .......................................................................... 47
Table 32: Open Point Feature Class Design ..................................................................... 48
Table 33: Surface Structure Feature Class Design ........................................................... 49
Table 34: Transformer Feature Class Design ................................................................... 50
Table 35: Support Structure Feature Class Design ........................................................... 51
Table 36: Switch Feature Class Design ............................................................................ 52
Table 37: Streetlight Feature Class Design ....................................................................... 53
Table 38: Fuse Feature Class Design ................................................................................ 54
Table 39: Electric Meter Feature Class Design ................................................................ 55
Table 40: Secondary OH Electric Feature Class Design .................................................. 56
Table 41: Secondary UDG Electric Feature Class Design ............................................... 56
Table 42: Primary OH Electric Feature Class Design ...................................................... 57
Table 43: Primary UDG Electric Feature Class Design ................................................... 58
Table 44: PF Correcting Equipment Feature Class Design .............................................. 59
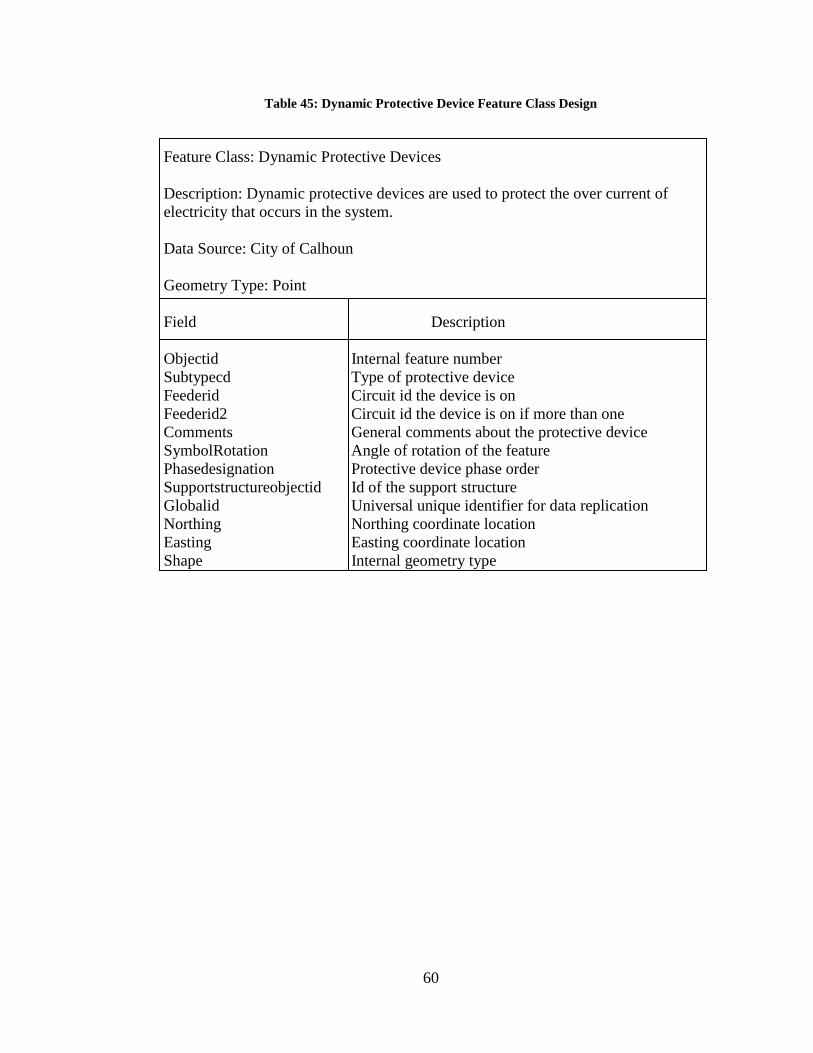
Table 45: Dynamic Protective Device Feature Class Design ........................................... 60

x
ACKNOWLEDGEMENTS
I would like to thank the City of Calhoun, GA and all the utility departments with
providing me the opportunity of implementing this GIS. I also would like to thank
Dr.Hung, Dr. Drews and Dr.Wu for their help and support while completing this thesis.
xi
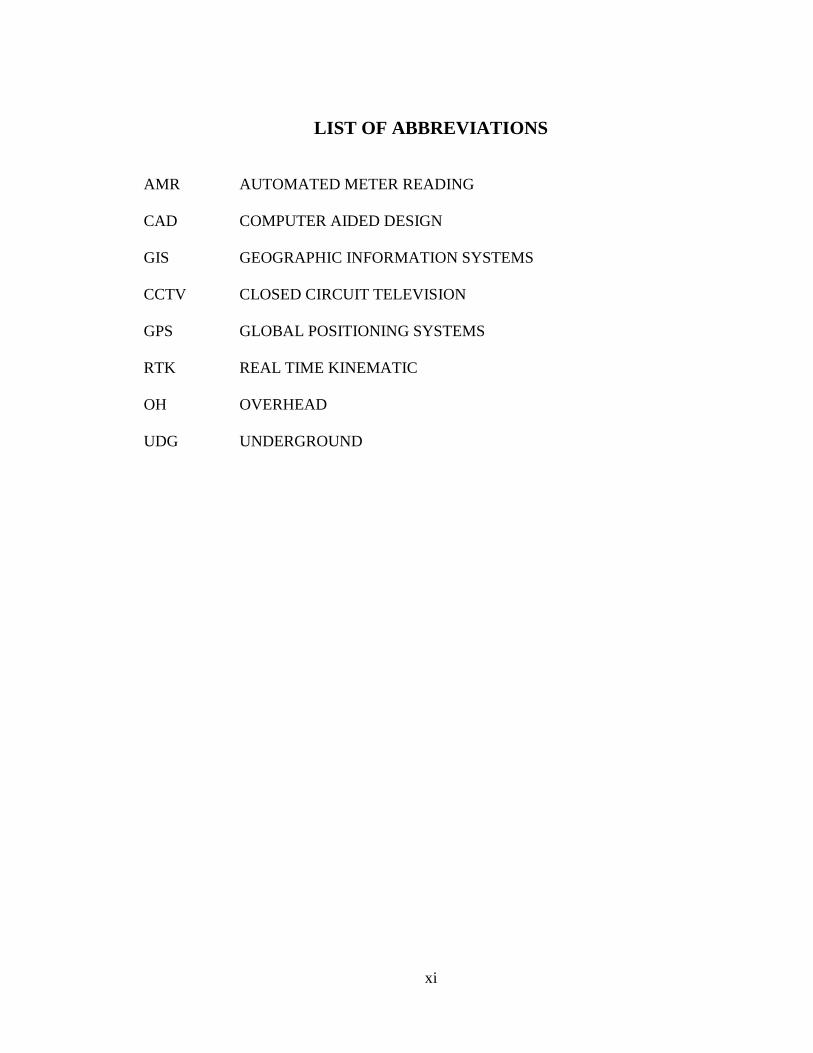
LIST OF ABBREVIATIONS
AMR AUTOMATED METER READING
CAD COMPUTER AIDED DESIGN
GIS GEOGRAPHIC INFORMATION SYSTEMS
CCTV CLOSED CIRCUIT TELEVISION
GPS GLOBAL POSITIONING SYSTEMS
RTK REAL TIME KINEMATIC
OH OVERHEAD
UDG UNDERGROUND
1
CHAPTER 1
INTRODUCTION
Most utilities throughout the United States and abroad are planning or
implementing an automated mapping-facilities management-Geographic Information
System (GIS) Cannistra (1999). Over the years many organizations have come to realize
that GIS not only helps manage the existing utility infrastructure, but can also help aid in
the design for future expansion (Shamsi 2005). The utility industry is a major consumer
of GIS because of the fact that almost all utilities can be spatially referenced. For
example, more than 80% of all the information that is within water and wastewater
utilities is geographically referenced (Shamsi 2005). Utility organizations not only use
GIS for the spatially referenced data, but also for any information that could be used to
help carry out further analysis if needed. A GIS allows utility operators and managers to
not only determine where their assets are located but analyze attributes about those assets
(Hughes 2006). The majority of the utility organizations reside in municipal
governments. Traditionally, utility organizations managed their systems by paper maps.
They relied on these paper maps for information about their assets and the location. The
maps served the purpose in three major areas: existing location of the system
infrastructure, engineering aspects of the utilities and customer connections, and the
overall network of the system for analysis (Environmental Systems Research Institute,
ESRI, 2003).
Many municipal governments provide its citizens with public utilities whether it
be electric, water, sewer, telecommunications, or gas. The size of the utility system
depends on the size of the area and the population it serves. The local governments over

2
the years have typically managed these utility systems by hard copy paper maps. The
hard copy paper maps were usually produced by using a computer aided design system
(CAD). The CAD system has helped the utility organizations throughout the years with
managing their assets, but lacks the ability to provide the organizations with database
technology. The database technology that is incorporated into GIS has greatly extended
the ability to effectively manage the utility assets.
GIS is able to provide the utility organizations with endless amounts of
information about their assets, whether it is spatial or non-spatial. Utility organizations
spend a large amount of money and time on maintaining their infrastructures. By using
GIS, these organizations are able to greatly reduce the amount of time and money
involved on maintenance. Many of the organizations incorporate their work order and
billing systems into the GIS, which saves even more time and resources. The
organizations are able to use one system to effectively manage all their utilities.
The City of Calhoun, GA has always utilized a CAD system to manage their
utilities. The utility departments realized that the data in the CAD system was not
accurate. The city started researching ways to improve their data and efficiency within
the departments and wanted a centralized system that could be accessed across all
departments in the city. While researching, the city found GIS and decided that it was the
type of system they wanted to implement.
Research Objective
The GIS implementation process for a municipal government’s utility system can
be very complex, expensive, and time consuming, depending on what the organization is

3
prepared to manage with the system. The research objective is to review, explain, and
provide an example of the implementation process for the water, sewer, and electric
utilities within the City of Calhoun, GA. These utility areas are very common among a
large percentage of the local governments in the United States. The implementation
process involves determining the needs of each department and constructing an
implementation plan to help track and determine the outcome of the overall system. The
research also reviews the database development process for each of the utility
departments.

4
CHAPTER 2
LITERATURE REVIEW
Implementation Obstacles
Utility organizations are beginning to look at GIS as a way to manage all their
assets and infrastructure. A GIS can reveal important information that leads to better
decision making (Hughes 2006). The implementation strategies of a utility GIS are what
organizations use to help achieve their overall goals of the system. These strategies can
be somewhat different between implementation. A number of factors go into the
implementation of a utility GIS, and depending on the size of the system, these factors
can be overwhelming at times.
Many organizations adopt GIS with the assumption that it will make their work
easier to complete, lower the cost to do their work, and provide the customers with better
service (Tomlinson 2003). The assumption will be true if the GIS implementation is
carried out correctly, and within a timely manner. Obstacles related to training, education,
and general understanding of the technology seems to inhibit the successful
implementation of the overall system (Croswell 1991).
Croswell (1991) explored the obstacles that are encountered during implementing
a GIS. He conducted a study analysis that involves 39 articles on the subject of problems
that are commonly found while implementing a GIS. The list below outlines some of the
major obstacles that are associated with system implementation.
Fear of change
Funding availability

5
Management support
Organizational coordination and conflicts
Training and understanding the technology
Staffing availability and recruitment
Software complexity
Data communications and networking
Croswell (1991) also outlined some of the strategies that were used to overcome
some of the common problems. The list below provides a number of solutions to the
major obstacles.
Initial evaluation of organizational risk
Commitment from management
Adopting a structured approach to the development
Involve users of the system in the design
Create a goal-oriented plan and schedule
Keep users and managers informed about the progress
During the City of Calhoun implementation some of the obstacles Croswell
(1991) describes were apparent from the beginning of the project. The fear of change
among department staff was the first obstacle encountered. The departments used the
CAD system for many years and were hesitate about working with a new type of system.
Another obstacle that arose during the project was organizational coordination.
Coordinating meetings with the departments in the beginning stages of the project was
challenging. The solution that helped overcome these obstacles was allowing the
department users to get involved with the design of the system.

6
Methodologies
In order for the implementation process to work the organization should follow an
implementation methodology. There are many methodologies available; choosing the one
that fits the needs of the organization and utility departments will provide the steps
needed to carry out the work. It is not mandatory that every step within a methodology be
executed; some GIS projects may only require the execution of a few steps.
Uhrick and Feinberg (1997) focused on a methodology used to link an existing
infrastructure inventory system database with a GIS for Broward County, Florida. One of
the main goals of the project included replacing the water and wastewater paper maps
with GIS. The methodology used during the project involved a number of customized
applications that helped link the two systems. The incorporation of the custom
applications into the methodology gave insight into how beneficial they can be while
translating data from one system to another.
The needs assessment is a major step while following a methodology. The needs
assessment example that was explored by Shamsi (2005) and Shamsi (2002) was specific
to a water and wastewater GIS. The needs analysis steps Shamsi presented in the water
and wastewater projects helped form the needs assessment for my own project. The areas
of conducting work sessions and interviews with the department staff helped gain the
understanding of the overall workflow. The methodology explored by Cannistra (1999)
was similar to the previous approach, but helped identify more of the methods used
during the data conversion process. Cannistra (1999) and Shamsi (2005) both agree that a
structured methodology that defines the requirements of the system should be executed.
The two methodologies also agree that conducting a pilot project area helps fine tune the

7
specifications during the implementation. Overall the methodologies reviewed for the
utility GIS project were all very similar. Some of the methodologies placed more
emphasis on the needs assessment step, while others concentrated more on the data
conversion process.
Utility Data Collection
Data collection is a very important step during a utility GIS project. According to
Pickford (1997) data capture is best defined as the means by which information relating
to physical entities (the data) is transferred into a digital format. This transfer can either
originate from plans where the information contained in the plans is converted directly
into a digital form with no additions (data conversion), or where the plans are used
simply as a guide to in-field data capture where the information is gathered as a result of
direct observation of the particular physical entity (field inventory).
Homer (1997) described the data collection methodology used to implement a
utility enterprise GIS for the City of Tallahassee, Florida. The City of Tallahassee
supports the electric, water, sewer, gas, and stormwater departments with the use of GIS.
Homer (1997) gave insight into the implementation steps that were brought upon by
devastating events like hurricane Kate in 1985 that triggered the interest in a utility GIS.
Homer (1997) explained the development requirements of the utility enterprise database
including facility data was also discussed which explained the city’s mobile data
collection system and how it was used. Homer (1997) also explained some of the
procedures that field crews used to carry out the collection of the data, which is one of the
most important aspects of implementing a utility GIS. The mobile data collection system

8
during the project consisted of a tablet computer with GPS. The research showed how
beneficial a mobile data collection system can be when collecting data for the utility
system.
The utility data collection methods described by Pickford (1997) and Homer
(1997) both involved an inventory of the utility system in the field. The methods included
using GPS to collect the data. They both identified quality assurance as being a major
aspect of the field inventory. By having field verified data as the primary source helps
ensure that the quality of data is good.
Geodatabase Design
The geodatabase design of a utility GIS was crucial in order to successfully
implement the system. A lot of time went into designing these geodatabases, because
sufficient knowledge of how each system works is necessary to construct the
geodatabase. The review of Zeiler (1999) case studies helped identify the steps needed to
develop the utility geodatabase. Zeiler (1999) noted that interaction with objects in the
world is diverse and we can model them in many ways. The case study design models
that were explored by Zeiler (1999) helped show the different ways that a geodatabase
can be designed. Zeiler (1999) also explained the steps needed to construct the entity
relationship models for the geodatabase. The entity relationship diagrams created for each
of the utility datasets in this project were done by following Zeiler’s approach.

9
CHAPTER 3
USER NEEDS ASSESSMENT
Description of Study Area
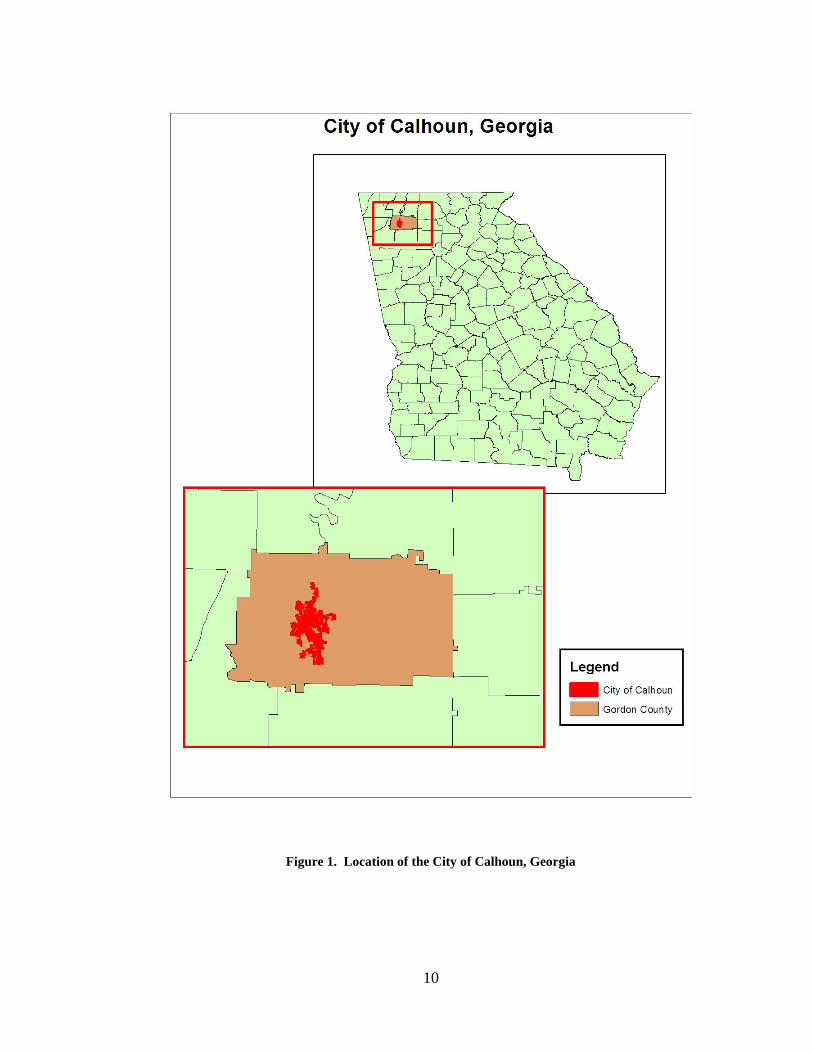
The City of Calhoun, Georgia, is located about 60 miles northwest of Atlanta and
is in Gordon County which covers approximately 356 square miles with 2.5 square miles
consisting of water. There are approximately 53,000 people that live in Gordon County
with roughly 14,000 residing within the city limits of Calhoun (Gordon County 2008).
Figure 1 shows the location of Gordon County and the City of Calhoun. Major carpet and
flooring industries account for the majority of the work force in the city. Figure 2
displays the zoning districts within the city.
The City of Calhoun was established in 1852, and is governed by a mayor and
four council members. The general administration of Calhoun includes the functions of
the mayor and council, city administrator, finance, tax administrator, human resources,
and risk management. The public works consist of Highway and Streets, Recycling
Center, Animal Control, and Cemetery Departments. The public safety and development
are the Police, Fire, and Community Development Departments. The City of Calhoun
utilities consist of the Water, Sewer, Electric, Telecommunications, Engineering, and GIS
Departments.
10
Figure 1. Location of the City of Calhoun, Georgia

11
Figure 2. Zoning Map of the City of Calhoun, Georgia

12
The Water, Sewer, and Electric Departments were the areas of concentration for
this research. According to the Director of Water and Sewer, J. Crawford (personal
communication, 5 Oct 2007) the Water Department serves over 20,000 customers in
Calhoun and Gordon County. There are a total of about 800 miles of water mains
throughout the county. The purpose of the Water Department is to provide clean, pure
drinking water to customers and to protect health; to maintain the water distribution
system, adding new lines and connections; to add new customers, and to provide proper
pressure and clean water at all times.
According to J. Crawford (personal communication, 5 Oct 2007) the Sewer
Department serves approximately 6500 customers. The sewer infrastructure is made up of
approximately 3000 manholes, 9 lift stations, and 150 miles of sewer line. Some of the
maintenance involved includes the department responding to approximately 300 utility
locate requests each month. The closed circuit television or CCTV crew performs
inspections on approximately 2500 linear feet of main line sewer each month. The
Jet/Vacuum crew cleans approximately 6000 linear feet of main line sewer each month.
According to L. Vickery, the Director of Electric (personal communication, 4 Oct
2007), the Electric Department serves approximately 5000 customers throughout the city.
The Electric Department handles approximately 1000 service calls annually. The
department estimated that there are approximately 5700 poles in the electric system. The
electrical system consist of 88 miles of primary overhead wire, 30 miles of primary
underground wire, 90 miles of secondary overhead wire, and 25 miles of secondary
underground wire. The department also maintains a number of the street and security
lights. There are approximately 1000 street lights and 200 security lights. The goal of the

13
Electric Department is to employ properly trained personnel and to secure a safe
environment for those employees and the community. This will insure that the
distribution system service is maintained at the highest level of quality and reliability.
The Electric Department is committed to customer satisfaction and a state-of-the-art
approach to power supply.
The Water, Sewer, and Electric GIS was developed and implemented by
following three phases. The first phase of the project was to conduct a needs assessment
for each of the departments. The second phase was geodatabase design. The third phase
is data development and conversion. The phases used for the project were performed
once the hardware and software were installed and configured. The City of Calhoun
already had a server available for the GIS implementation. A Microsoft SQL Server
Enterprise license was purchased and installed on the server. The ESRI software that was
installed for the implementation included ArcGIS Server Advance and a number of
ArcINFO seats in each department. ArcSDE, which is bundled with ArcGIS Server
Advance, was also installed and configured. The advance version of ArcGIS Server
provided the ability to develop a web mapping application that each department can
easily access and use.
Needs Assessment Overview
The list below identifies the steps that were taken to complete the needs
assessment for each of the departments:
Interviewed the staff within each department to identify the current document
workflows and conditions.

14
Established an overall set of goals and objectives for each of the departments.
Gained an understanding of their business processes and identified redundancy
within these processes.
Evaluated the existing data and data formats currently being used.
Identified applications that the departments can benefit from.
Determined the number of users that will be accessing the system from the
departments.
Department of Water GIS Needs Assessment
The needs assessment meeting with the Water Department identified a number of
functions and processes that will be achieved with the implementation of the GIS. The
list below outlines the major functions and processes identified.
Preparing maps for work orders
Integration of billing data
Future planning for system expansion
Asset inventory
Hydrant locations
Water main isolation
New meter locations
Meter replacement scheduling
Linking meters, valves, to the parcels they serve
Water distribution and usage analyses
Pressure zone mapping

15
Water main break reporting application
Crew routing
Maintenance tracking and inventory
Web mapping application for easy access to data
The statistics in table 1 show an average of the Water Department’s operations
during any given month. Table 2 lists the estimated number of features within the water
system during the time of the assessment. The statistics in table 2 provided an overall
evaluation of the amount of data that was involved in the implementation.
Table 1: Average Monthly Statistics for Water Department
Item Number
Customers Served 22,000
Number of Service Calls 40
Number of Leaks 50
New Meters added 75
Meter Repairs 35
Number of Utility Locate
request 500
Average number of new pipe
in feet added 5000
Table 2: Feature Statistics for Water Department
Item Number
Water Lines in Miles 800
Number of Meters 22000
Number of Hydrants 1600
Number of Valves 3700
Number of Pump Stations 9
Number of Tanks 17
16
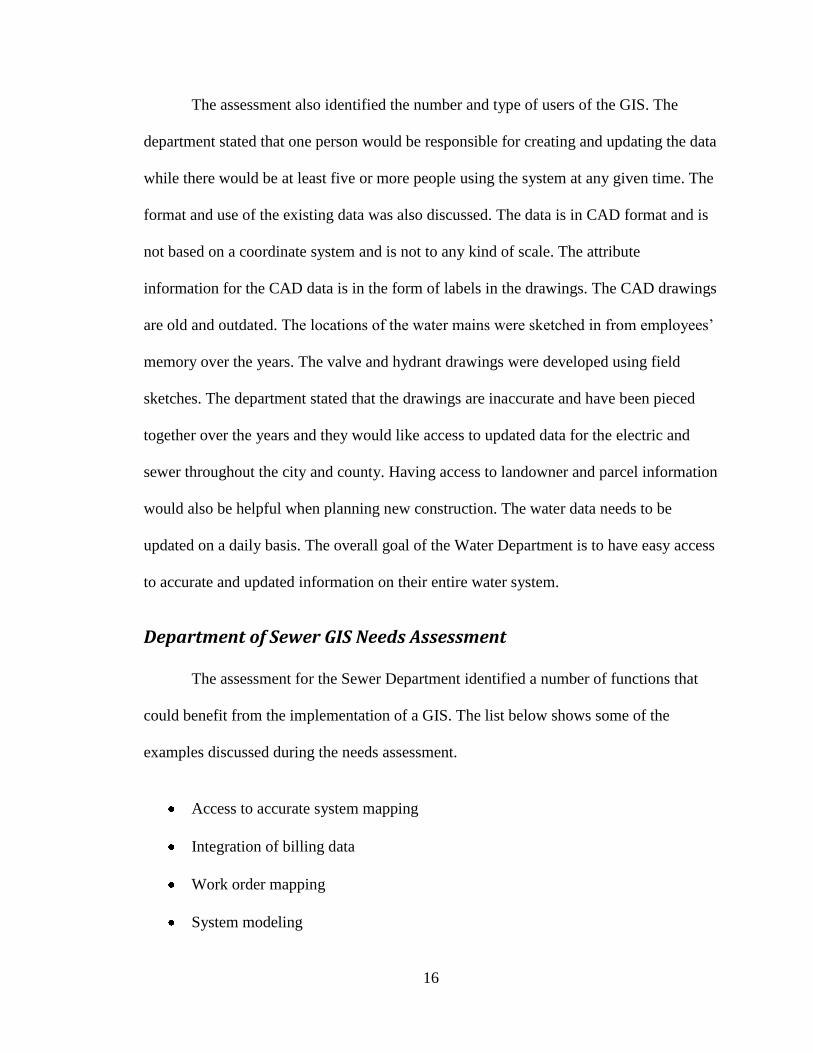
The assessment also identified the number and type of users of the GIS. The
department stated that one person would be responsible for creating and updating the data
while there would be at least five or more people using the system at any given time. The
format and use of the existing data was also discussed. The data is in CAD format and is
not based on a coordinate system and is not to any kind of scale. The attribute
information for the CAD data is in the form of labels in the drawings. The CAD drawings
are old and outdated. The locations of the water mains were sketched in from employees’
memory over the years. The valve and hydrant drawings were developed using field
sketches. The department stated that the drawings are inaccurate and have been pieced
together over the years and they would like access to updated data for the electric and
sewer throughout the city and county. Having access to landowner and parcel information
would also be helpful when planning new construction. The water data needs to be
updated on a daily basis. The overall goal of the Water Department is to have easy access
to accurate and updated information on their entire water system.
Department of Sewer GIS Needs Assessment
The assessment for the Sewer Department identified a number of functions that
could benefit from the implementation of a GIS. The list below shows some of the
examples discussed during the needs assessment.
Access to accurate system mapping
Integration of billing data
Work order mapping
System modeling

17
Crew scheduling
Inflow and Infiltration planning
Planning future expansion of system
Maintenance tracking and inventory
Sewer distribution analysis
Inspection reporting tools
Web mapping application for easy access to data
Table 3 shows some of the more important monthly statistics on the functions of
the Sewer Department. The numbers in table 4 give an idea on the number of features
that make up the sewer system.
Table 3: Average Monthly Statistics for Sewer Department
Item Number
Customers Served 6500
Avg. # of Service Calls 27
Number of Utility Locate
request 300
Amount of pipe camera
inspected in feet 2500
Amount of pipe cleaned in feet 6000
Table 4: Feature Statistics for Sewer Department
Item Number
Manholes 3000
Sewer lines in Miles 150
Lift Stations 9
Monitor Locations 17
Wet Wells 9
Cleanouts 500

18
The sewer data is similar to the water data except that roughly 35% of the
manholes in the system have been located using real-time kinematic global positional
system or (RTK GPS) by the Engineering Department. The attributes of the manholes
and pipe are in the form of labels in the CAD system. A number of subdivision drawings
have been submitted by developers in CAD format and placed in the overall CAD system
drawing. All lift stations and wet wells have been located using GPS. The remaining 65%
of the manholes and pipes is not accurate. The department uses AutoCad for all of their
mapping and information needs. The Sewer Department would like access to updated
data for the Electric and Water Departments for planning new construction. They would
also like to have access to parcel information for easement purposes. The department
would like to have the data updated daily as projects are completed in the field. The data
will be maintained and edited by one person and accessed by a number of people within
the city. The overall goal of the Sewer Department is to have accurate and up to date data
on their system and easy and quick access to the data.
Department of Electric GIS Needs Assessment
The needs assessment for the Electric Department began with identifying
processes within the department that could benefit from a GIS. The list below shows a
number of the processes indentified.
Work order mapping
Integration of billing data
Inventory
New electric utility expansion

19
Improved location of utilities in the field
Locate trouble calls and outages
Provide better customer service
Crew routing
Electrical distribution analysis
Linking meters to the parcels they serve
Maintenance tracking
Web mapping application for easy access to data
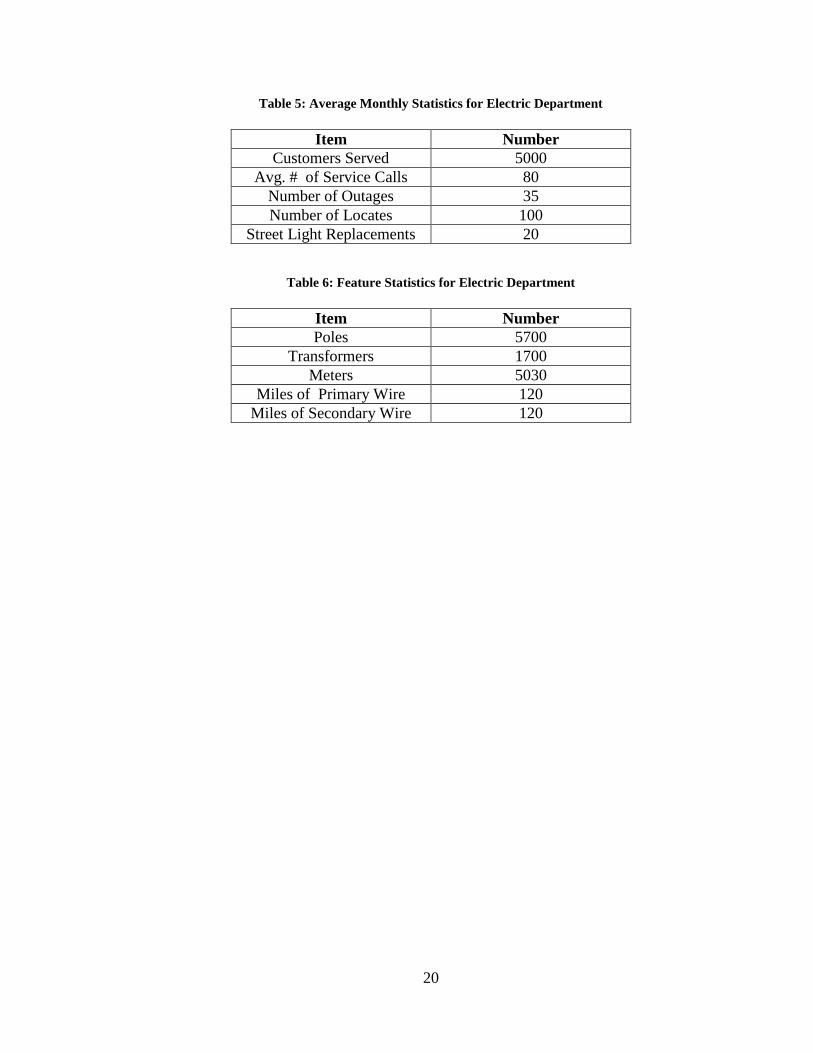
The statistics in table 5 show the average monthly number of items that occur on a
normal basis for the department. Table 6 lists some of the more important features in the
electric system data to give an idea of the size of the system.
The electric data is in CAD format with no coordinate system or scale. The
attributes for the electric features are in the form of labels on the CAD drawings. The
CAD data is updated on a daily basis by making the changes to the system drawings.
Work crews are given a work order with a printed out CAD map explaining what work
needs to be done. Once the work is completed, it is noted on the CAD drawing and work
order in the field. The work order and drawing are then given back to the CAD operator
to make changes in the CAD drawings. The Electric Department would like to have
access to parcel, water, and sewer data to help support the planning of new construction.
The electric GIS data will need to be updated on a daily basis. The department will use
one data maintainer and editor to perform the daily updates. The main goal for the
Electric Department is to have accurate and updated data on the electric system with easy
access to it.
20
Table 5: Average Monthly Statistics for Electric Department
Item Number
Customers Served 5000
Avg. # of Service Calls 80
Number of Outages 35
Number of Locates 100
Street Light Replacements 20
Table 6: Feature Statistics for Electric Department
Item Number
Poles 5700
Transformers 1700
Meters 5030
Miles of Primary Wire 120
Miles of Secondary Wire 120

21
CHAPTER 4
GEODATABASE DESIGN
The second phase of this project, geodatabase design, began with reviewing each
of the department’s existing CAD data structures. The feature classes were determined by
meeting with the departments on a number of occasions to decide which features should
be included in the system. The feature dataset figures and attribute field tables listed
below are for each department’s dataset. A number of the attribute fields noted in the
design were actually labels in the CAD data for the features. Some of the attribute fields
were added items that the departments would like to start keeping track of in the future.
The planimetric data (e.g., roads, buildings, parcels and bridges) that each
department uses was available from the Gordon County GIS Department. Aerial
photography from 2005 was also already in place for Gordon County and the City of
Calhoun. The spatial reference of each dataset is based on the existing planimetric and
aerial photography data. The coordinate system used for the geodatabase is the Georgia
West State Plane and the projection used is the Transverse Mercator. All the data sets will
be based on the State Plane Coordinate System.
Water Geodatabase Design
The water geodatabase design was developed based on the information gathered
during the needs assessment and the existing CAD data. The attributes for each of the
feature classes in the water geodatabase were determined by examining the existing CAD
layer labels. Attributes were added to the features in the areas where the department
wanted more information than what was available in the CAD drawings. Figure 3 shows

22
the layout of all the feature classes for the water dataset. Figure 4 shows the entity
relationship diagram. Tables 7 thru 18 describe the feature classes and attributes in detail.
Figure 3. Water Department Feature Dataset Design

23
Figure 4. Water Department ER Diagram

24
Table 7: Water Main Feature Class Design
Feature Class: Mains
Description: The network of pipes in which the water supply is delivered.
Data Source: City of Calhoun
Geometry Type: Polyline
Field Description
Objectid Internal feature number
DateCreate Date of creation
Material Material of the pipe
Diameter Diameter (inches) size of pipe
Globalid Universal unique identifier for data replication
Shape Internal geometry type
Comment Field user comments about pipe
Shape.len Length of pipe segment
Table 8: Pump Station Feature Class Design
Feature Class: Pump Stations
Description: Pump stations are used to pump water from different locations.
Data Source: City of Calhoun
Geometry Type: Point
Field Description
Objectid Internal feature number
Location General location description of pump station
Elevation Elevation of pump station
Pressure_z Pressure zone of station
Pump_Count Number of pumps at station
Average_fl Average flow at station
Peak_flow Peak flow at station
Globalid Universal unique identifier for data replication
Northing Northing coordinate location
Easting Easting coordinate location
Shape Internal geometry type

25
Table 9: Valve Feature Class Design
Feature Class: Valves
Description: Valves are used to regulate and control the flow of water.
Data Source: City of Calhoun
Geometry Type: Point
Field Description
Objectid Internal feature number
DateCreate Date of creation
Location General location description of valve
Condition Condition of valve
Elevation Elevation of valve
Type Type of valve
Diameter Diameter (inches) size of valve
Valvenumber Unique system id for valve
Northing Northing coordinate location
Easting Easting coordinate location
Method Method used to collect coordinates
Globalid Universal unique identifier for data replication
Comment Field user comments about valve
Shape Internal geometry type

26
Table 10: Hydrants Feature Class Design
Feature Class: Hydrants
Description: A source of water for fire protection that is located throughout
the water system.
Data Source: City of Calhoun
Geometry Type: Point
Field Description
Objectid Internal feature number
Hydr_id Fire department unique id number
Main_id Id number of water main connection
Number_ Street number location of hydrant
St_prefix Street prefix direction
Street Street name
St_type Type of street
Northing Northing coordinate location
Easting Easting coordinate location
Station Fire Station
District City district location
Year_ Year of install
Barrel_siz Size of barrel
Main_size Size of water main
Barrel_lengt Length of barrel
Main_type Material of water main
Class Hydrant pressure class
Not_in_srv Non service identifier
Notes Notes about hydrant
Owner Owner of hydrant
Globalid Universal unique identifier for data replication
Shape Internal geometry type
Testdate Date of last test
Static Amount of static pressure
Residual Residual reading of hydrant
Pitot Pitot gauge reading
Gpm Gallons per minute reading
Gpm_20 Gallons per minute reading @ 20 psi
Gpm_10 Gallons per minute reading @ 10 psi
Gpm_0 Gallons per minute reading @ 0 psi

27
Table 11: Tanks Feature Class Design
Feature Class: Tanks
Description: Tanks are a container for storing water for future supply.
Data Source: City of Calhoun
Geometry Type: Point
Field Description
Objectid Internal feature number
Location General location description of Tank
Capacity Capacity of tank in millions of gallons
Diameter Diameter of tank in feet
Height Height of tank in feet
Base_elevation Elevation at the base of the tank
Overflow_elevation Elevation at which the tank will overflow
Globalid Universal unique identifier for data replication
Northing Northing coordinate location
Easting Easting coordinate location
Shape Internal geometry type

28
Table 12: Backflow Fire Tap Feature Class Design
Feature Class: Backflow Fire Taps
Description: A device used to prevent contamination of water backflow from
fire sprinkler systems.
Data Source: City of Calhoun
Geometry Type: Point
Field Description
Objectid Internal feature number
Name Name to identify backflow fire tap
Testdate Date of last test
Data Data link indicator
Account Billing account number
Link Link to test data
Northing Northing coordinate location
Easting Easting coordinate location
Shape Internal geometry type
Globalid Universal unique identifier for data replication

29
Table 13: Backflow Point Feature Class
Feature Class: Backflow Points
Description: A device used to prevent contamination or pollution of water
backflow from service connection.
Data Source: City of Calhoun
Geometry Type: Point
Field Description
Objectid Internal feature number
Name Name to identify backflow
Testdate Date of last test
Data Data link indicator
Account Billing account number
Link Link to test data
Northing Northing coordinate location
Easting Easting coordinate location
Shape Internal geometry type
Globalid Universal unique identifier for data replication

30
Table 14: Laterals Feature Class Design
Feature Class: Laterals
Description: Laterals are the connecting pipes from the water main to the
residents or business.
Data Source: City of Calhoun
Geometry Type: Polyline
Field Description
Objectid Internal feature number
Linetype Type of lateral
Diameter Size of lateral
Material Lateral material
Shape Internal geometry type
Globalid Universal unique identifier for data replication
Comments Comments about the lateral
Shape.len Length of pipe segment
31
Table 15: Fittings Feature Class Design
Feature Class: Fittings
Description: Fittings are used in the water system where mains may intersect
or turn in another direction.
Data Source: City of Calhoun
Geometry Type: Point
Field Description
Objectid Internal feature number
DateCreate Date of creation
Location General location of fitting
Material Material type of fitting
Fittingtype Type of material
Globalid Universal unique identifier for data replication
Northing Northing coordinate location
Easting Easting coordinate location
Shape Internal geometry type
Comments Comments about the fittings
32
Table 16: Abandoned Water Line Feature Class Design
Feature Class: Abandoned Lines
Description: Mains that have been replaced or eliminated in the system.
Data Source: City of Calhoun
Geometry Type: Polyline
Field Description
Objectid Internal feature number
Datecreated Date the line was abandoned
Condition Condition of the line
Material Material of the line
Diameter Diameter size of line
Globalid Universal unique identifier for data replication
Shape Internal geometry type
Shape.len Length of pipe segment

33
Table 17: Water Meters Feature Class Design
Feature Class: Meters
Description: The device to measure the amount of water used.
Data Source: City of Calhoun
Geometry Type: Points
Field Description
Objectid Internal feature number
Id Old meter number
Mxu_num AMR meter number
Address Address of meter
Date_ Date of install
Creator Creator of meter feature
Installer Installer name
Retrofit Retrofit indicator value
Setter Setter indicator
Backflow Backflow meter indicator
Rightofway Rightofway indicator
Driveway Driveway indicator
Need_dirt Dirt indicator
New_lid New lid installed indicator
Install_ok Installation of meter correct indicator
Data_ok GPS data correction indicator
Boxset_ok Installation of box correct indicator
Programmed Meter programmed indicator
Gps Meter located indicator
Reading Meter reading
Comments Comments of installation
Comments2 Comments of activation
Globalid Universal unique identifier for data replication
Northing Northing coordinate location
Easting Easting coordinate location
Shape Internal geometry type
Phase1 Installation phase

34
Table 18: Leaks Feature Class Design
Feature Class: Leaks
Description: A leak is considered pipe damage causing the loss of water.
Data Source: City of Calhoun
Geometry Type: Points
Field Description
Objectid Internal feature number
Name Leak name or number identifier
Feat_Code Location of leak on pipe
Desc_ Description of leak
Northing Northing coordinate location
Easting Easting coordinate location
Elevation Elevation of leak
Workordernum Workorder number for leak
CrewName Crew who responded to leak
Date Date of leak reported
Comment Comments on leak
Globalid Universal unique identifier for data replication
Shape Internal geometry type
Sewer Geodatabase Design
The development of the sewer geodatabase was also developed based on the
existing CAD data and information that was obtained during the needs assessment.
Figure 5 shows the feature classes that make up the sewer dataset. Figure 6 shows the
entity relationship diagram for the sewer dataset. Tables 19 thru 28 describe the feature
classes and attributes in detail.

35
Figure 5. Sewer Department Feature Dataset Design

36
Figure 6. Sewer Department ER Diagram

37
Table 19: Manhole Feature Class Design
Feature Class: Manholes
Description: Manholes are access points to the sewer lines below the surface.
Data Source: City of Calhoun
Geometry Type: Points
Field Description
Objectid Internal feature number
Point_Name Unique id number
RimElevation Elevation of the rim
CollBy Person who located the manhole
DateColl Collection date
Date_obs Observation date
Elev_obs Observation elevation
RimDepth Depth of rim below or above surface
Location General location
Surface Surface material type
WallMat Inside wall material type
ChimneyMat Chimney material type
Exposed Manhole exposed indicator
CondOT Condition of outside top
CondRC Condition of ring and cover
CondC Condition of chimney
CondMW Condition of manhole wall
CondMB Condition of manhole bottom
DropMH Drop manhole indicator
Northing Northing coordinate location
Easting Easting coordinate location
LocationDescription Location description
Comments General comments about manhole
Globalid Universal unique identifier for data replication
Shape Internal geometry type

38
Table 20: Gravity Main Feature Class Design
Feature Class: Gravity Mains
Description: Network of pipes used to transport sewer throughout the system.
Data Source: City of Calhoun
Geometry Type: Polyline
Field Description
Objectid Internal feature number
CreationUser User who created the main in GIS
DateCreated Date added to GIS
Condition Condition of main
Material Material of upstream invert of pipe
UpstreamInvert Invert measurement on upstream of pipe
DownstreamInvert Invert measurement on downstream of pipe
Diameter Diameter of upstream
PercentSlope Slope percentage
DNSmat Material of downstream of pipe
DNSdiam Diameter of downstream
Comment General comments about pipe
Camera Camera indicator
CameraDate Date it was recorded
CameraNotes Notes from recording
MovieID Id of camera inspection recording
UpsEL Upstream elevation of pipe invert
DnsEL Downstream elevation of pipe invert
UpsMH Upstream manhole number
DnsMH Downstream manhole number
UpsMHel Upstream manhole rim elevation
DnsMHel Downstream manhole rim elevation
NeededChng Slope percentage change
slComments Slope comments
Globalid Universal unique identifier for data replication
Shape Internal geometry type
Shape.len Length of pipe segment

39
Table 21: Lift Station Feature Class Design
Feature Class: Lift Stations
Description: A station used to pump sewer from one location to another.
Data Source: City of Calhoun
Geometry Type: Point
Field Description
Objectid Internal feature number
Name Name of lift station
Globalid Universal unique identifier for data replication
Northing Northing coordinate location
Easting Easting coordinate location
Shape Internal geometry type
Table 22: Wet Well Feature Class Design
Feature Class: Wet_Wells
Description: An underground storage pit for the collection of sewer.
Data Source: City of Calhoun
Geometry Type: Point
Field Description
Objectid Internal feature number
Name Name of wet well
Globalid Universal unique identifier for data replication
Northing Northing coordinate location
Easting Easting coordinate location
Shape Internal geometry type

40
Table 23: Monitor Location Feature Class
Feature Class: Monitor Locations
Description: Locations of where monitor devices are installed to measure
sewer readings.
Data Source: City of Calhoun
Geometry Type: Point
Field Description
Objectid Internal feature number
CompanyName Name of company where monitor is located
Elevation Elevation of monitor
LocationNo Location Id number
Active Active monitor indicator
Depth Depth of monitor
Type Monitor type
PermitNo Permit number
Flume Flume indicator
Screens Screens indicator
MechScreens Mesh Screen Indicator
OnSiteTreatment Treatment indicator
PHAdjustment PH level adjustment
TempAdjustment Temperature level adjustment
Comments Comments about the monitor
Globalid Universal unique identifier for data replication
Northing Northing coordinate location
Easting Easting coordinate location
Shape Internal geometry type

41
Table 24: Service Lateral Feature Class Design
Feature Class: Service Laterals
Description: Laterals are the connecting pipes from the sewer main to the
residents or business.
Data Source: City of Calhoun
Geometry Type: Polyline
Field Description
Objectid Internal feature number
DateCreated Date added to GIS
Downstream Downstream depth of invert
DNSdiam Diameter size of lateral downstream
DNSmat Downstream material of pipe
Comment General comment on lateral
Distance Distance from manhole
Side Side location of lateral
Direction Direction of flow
Globalid Universal unique identifier for data replication
Shape Internal geometry type
Shape.len Length of pipe segment

42
Table 25: Clean Out Feature Class Design
Feature Class: Clean Outs
Description: Access points on the service lateral pipes used for maintenance.
Data Source: City of Calhoun
Geometry Type: Point
Field Description
Objectid Internal feature number
CleanoutType Type of cleanout
AccessDiameter Size of cleanout
Material Cleanout material
Globalid Universal unique identifier for data replication
Northing Northing coordinate location
Easting Easting coordinate location
Shape Internal geometry type
Table 26: Force Main Feature Class
Feature Class: Force Mains
Description: Sewer mains that transport sewer using force from lift station.
Data Source: City of Calhoun
Geometry Type: Polyline
Field Description
Objectid Internal feature number
Location General location description of force main
SubTypeCd Type of force main
Material Force main material
Depth Depth of force main
Diameter Size of force main
Globalid Universal unique identifier for data replication
Shape Internal geometry type
Shape.len Length of pipe segment

43
Table 27: Abandoned Line Feature Class
Feature Class: Abandoned Lines
Description: Sewer mains that have been replaced or eliminated in the system.
Data Source: City of Calhoun
Geometry Type: Polyline
Field Description
Objectid Internal feature number
SubtypeCD Type of abandoned line
Material Material type of line
Diameter Size of line
Globalid Universal unique identifier for data replication
Shape Internal geometry type
Shape.len Length of pipe segment
Table 28: Abandoned Point Feature Class Design
Feature Class: Abandoned Points
Description: Abandoned manholes or devices that are no longer used in the
sewer system.
Data Source: City of Calhoun
Geometry Type: Point
Field Description
Objectid Internal feature number
LocationDescription General location description
Globalid Universal unique identifier for data replication
Northing Northing coordinate location
Easting Easting coordinate location
Shape Internal geometry type

44
Electric Geodatabase Design
The electric geodatabase design was also created by reviewing the existing CAD
data and determining what feature classes and attributes needed to be added. Figure 7
shows the feature classes that make up the electric dataset. Figure 8 shows the entity
relationship diagram for the electric dataset. Tables 29 thru 45 show the feature classes
and attributes in detail.
Figure 7. Electric Department Feature Dataset Design

45
Figure 8. Electric Department ER Diagram

46
Table 29: Anchor Guy Feature Class Design
Feature Class: Anchor Guys
Description: A Tension cable used to add stability to the power pole.
Data Source: City of Calhoun
Geometry Type: Point
Field Description
Objectid Internal feature number
Comments General comments about the anchor guy
Subtypecd Anchor guy type
Rotationangle Angle rotation of the feature in GIS
Globalid Universal unique identifier for data replication
Northing Northing coordinate location
Easting Easting coordinate location
Shape Internal geometry type
Table 30: Span Guy Feature Class Design
Feature Class: Span Guys
Description: A tension cable that adds stability between two power poles.
Data Source: City of Calhoun
Geometry Type: Polyline
Field Description
Objectid Internal feature number
Comments General comments about the span guy
Globalid Universal unique identifier for data replication
Shape Internal geometry type
Shape.len Length of line segment

47
Table 31: Bus Bar Feature Class Design
Feature Class: Bus Bars
Description: A device that conducts electricity through a switchboard.
Data Source: City of Calhoun
Geometry Type: Point
Field Description
Objectid Internal feature number
Subtypecd Type of bus bar
Phasedesignation Phase the bus bar is on
Feederid Circuit id number
Globalid Universal unique identifier for data replication
Northing Northing coordinate location
Easting Easting coordinate location
Shape Internal geometry type
Shape.len Length of line segment

48
Table 32: Open Point Feature Class Design
Feature Class: Open Points
Description: Location of where two different circuits meet.
Data Source: City of Calhoun
Geometry Type: Point
Field Description
Objectid Internal feature number
Subtypecd Type of open point
Feederid Circuit id number
Feederid2 Second Circuit id number
Comments General comments about the open point
Phasedesignation Phase the open point is on
SurfaceStructureobjectid Id of the surface structure
Globalid Universal unique identifier for data replication
Northing Northing coordinate location
Easting Easting coordinate location
Shape Internal geometry type

49
Table 33: Surface Structure Feature Class Design
Feature Class: Surface Structures
Description: Objects that protect or enclose electric circuits and equipment.
Data Source: City of Calhoun
Geometry Type: Point
Field Description
Objectid Internal feature number
Comments General comments about the surface structure
Subtypecd Type of surface structure
Globalid Universal unique identifier for data replication
Northing Northing coordinate location
Easting Easting coordinate location
Shape Internal geometry type

50
Table 34: Transformer Feature Class Design
Feature Class: Transformers
Description: Transformers are used to transfer electricity from one circuit
to another usually changing the voltage and current in the process.
Data Source: City of Calhoun
Geometry Type: Point
Field Description
Objectid Internal feature number
Feederid Circuit id number
Comments General comments about the transformer
Phasedesignation Phase designation of the transformer
RatedKVA Rating of KVA
Supportstructureobjectid Object id of support structure
Type Transformer type
PhaseA PhaseA size
PhaseB PhaseB size
PhaseC PhaseC size
Phaseacolor PhaseA color for underground transformer
Phasebcolor PhaseB color for underground transformer
Phaseccolor PhaseC color for underground transformer
Globalid Universal unique identifier for data replication
Northing Northing coordinate location
Easting Easting coordinate location
Shape Internal geometry type

51
Table 35: Support Structure Feature Class Design
Feature Class: Support Structures
Description: Support structures (poles) are used to support the devices and
wire used to transport electricity.
Data Source: City of Calhoun
Geometry Type: Point
Field Description
Objectid Internal feature number
Comments General comments about the support structure
Owner Owner of the support structure
Class Class of support structure
Height Height of support structure
Assem1_1 Assembly device # 1 on support structure
Assem2_1 Assembly device # 2 on support structure
Assem3_1 Assembly device # 3 on support structure
Assem4_1 Assembly device # 4 on support structure
Assem5_1 Assembly device # 5 on support structure
Devices_1 Devices on support structure
Poleid Pole id number
Globalid Universal unique identifier for data replication
Northing Northing coordinate location
Easting Easting coordinate location
Shape Internal geometry type

52
Table 36: Switch Feature Class Design
Feature Class: Switches
Description: Switches are devices used to disconnect circuits or redirect
electricity.
Data Source: City of Calhoun
Geometry Type: Point
Field Description
Objectid Internal feature number
Subtypecd Type of switch
Feederid Circuit id the switch is on
Feederid2 Circuit id the switch is on
Operatingvoltage Operating volts of the switch
Comments General comments about the switch
Phasedesignation Phase that the switch is on
Normalposition_a Normal position of switch on phase A
Normalposition_b Normal position of switch on phase B
Normalposition_c Normal position of switch on phase C
Presentposition_a Present position on phase A
Presentposition_b Present position on phase B
Presentposition_c Present position on phase C
Supportstructureobjectid Object id of support structure the switch is on
Gangoperated Gang switch indicator
Globalid Universal unique identifier for data replication
Northing Northing coordinate location
Easting Easting coordinate location
Shape Internal geometry type

53
Table 37: Streetlight Feature Class Design
Feature Class: Streetlights
Description: Support structure that has a light attachment located along a
street.
Data Source: City of Calhoun
Geometry Type: Point
Field Description
Objectid Internal feature number
Subtypecd Type of street light
Comments General comments on street light
Lamptype Type of lamp
Wattage Wattage of lamp
Supportstructureobjectid Id of the support structure
Rotationangle Angle of rotation for feature
Globalid Universal unique identifier for data replication
Northing Northing coordinate location
Easting Easting coordinate location
Shape Internal geometry type

54
Table 38: Fuse Feature Class Design
Feature Class: Fuses
Description: A device used to protect distribution devices from damaging
currents.
Data Source: City of Calhoun
Geometry Type: Point
Field Description
Objectid Internal feature number
Subtypecd Type of fuse
Feederid Circuit id the fuse is on
Feederid2 Circuit id the fuse is on
Comments General comments on the fuse
Phasedesignation Phase that the fuse is on
Supportstructureobjectid Id of the support structure
Fusesize Size of fuse
Globalid Universal unique identifier for data replication
Northing Northing coordinate location
Easting Easting coordinate location
Shape Internal geometry type

55
Table 39: Electric Meter Feature Class Design
Feature Class: Electric Meters
Description: The device to measure the amount of electricity used.
Data Source: City of Calhoun
Geometry Type: Point
Field Description
Objectid Internal feature number
Man Meter manufacturer
Account_no Meter billing account number
Occupant Occupant code for the residence
Meter_no AMR meter number
Meter_data Meter data number
Name Name of residence
Srv_st_num Service street num
Srv_st Street name
Srv_unit Apartment unit number
Cycle_ Billing cycle number
Globalid Universal unique identifier for data replication
Northing Northing coordinate location
Easting Easting coordinate location
Shape Internal geometry type
GeoCode Account geocode indicator
Reading Meter reading

56
Table 40: Secondary OH Electric Feature Class Design
Feature Class: Secondary OH Lines
Description: Secondary overhead lines connect from the primary circuit to
residents or a business.
Data Source: City of Calhoun
Geometry Type: Polyline
Field Description
Objectid Internal feature number
Subtypecd Type of line
ConducterConfiguration Horizontal or vertical lines
Globalid Universal unique identifier for data replication
Shape Internal geometry type
WireSize Size of wire
Shape.len Length of line segment
Table 41: Secondary UDG Electric Feature Class Design
Feature Class: Secondary UDG Lines
Description: Secondary underground lines connect from the primary circuit to
residents or a business.
Data Source: City of Calhoun
Geometry Type: Polyline
Field Description
Objectid Internal feature number
Subtypecd Type of line
Totallen Total length of line
Globalid Universal unique identifier for data replication
Shape Internal geometry type
WireSize Size of wire
Shape.len Length of line segment

57
Table 42: Primary OH Electric Feature Class Design
Feature Class: Primary OH Lines
Description: The primary overhead lines are used to conduct electricity from the
substations throughout the system.
Data Source: City of Calhoun
Geometry Type: Polyline
Field Description
Objectid Internal feature number
Subtypecd Type of line
Comments General comments about primary line
Phasedesignation Primary line phase order
Feederid Circuit id the line is
Labletext Top or bottom line text for labels
ConducterConfiguration Horizontal or vertical lines
PhaseOrientation Phase direction of the lines
WireSize Size of wire
Globalid Universal unique identifier for data replication
Shape Internal geometry type
Shape.len Length of line segment

58
Table 43: Primary UDG Electric Feature Class Design
Feature Class: Primary UDG Lines
Description: The primary underground lines are used to conduct electricity
from underground structures throughout the system.
Data Source: City of Calhoun
Geometry Type: Polyline
Field Description
Objectid Internal feature number
Subtypecd Type of line
Comments General comments about primary line
Phasedesignation Primary line phase order
Feederid Circuit id the line is
WireSize Size of wire
Totallen Total length of line
Globalid Universal unique identifier for data replication
Shape Internal geometry type
Shape.len Length of line segment

59
Table 44: PF Correcting Equipment Feature Class Design
Feature Class: PF CorrectingEquipment
Description: Power factor equipment is used to help maintain the current of
electricity throughout the system.
Data Source: City of Calhoun
Geometry Type: Point
Field Description
Objectid Internal feature number
Subtypecd Type of correcting equipment
Feederid Circuit id the equipment is attached to
Comments General comments about the correcting equipment
SymbolRotation Angle of rotation of the feature
Phasedesignation Correcting equipment phase order
TotalKvar Total Kvar size
Supportstructureobjectid Id of the support structure
Globalid Universal unique identifier for data replication
Northing Northing coordinate location
Easting Easting coordinate location
Shape Internal geometry type
60
Table 45: Dynamic Protective Device Feature Class Design
Feature Class: Dynamic Protective Devices
Description: Dynamic protective devices are used to protect the over current of
electricity that occurs in the system.
Data Source: City of Calhoun
Geometry Type: Point
Field Description
Objectid Internal feature number
Subtypecd Type of protective device
Feederid Circuit id the device is on
Feederid2 Circuit id the device is on if more than one
Comments General comments about the protective device
SymbolRotation Angle of rotation of the feature
Phasedesignation Protective device phase order
Supportstructureobjectid Id of the support structure
Globalid Universal unique identifier for data replication
Northing Northing coordinate location
Easting Easting coordinate location
Shape Internal geometry type

61
CHAPTER 5
DATA DEVELOPMENT AND CONVERSION
The third phase of this project is data development and conversion. The City of
Calhoun and Gordon County have existing aerial photography that is tied to the Georgia
State Plane Coordinate System. The aerial photography overlaid with Gordon County’s
planimetric data serves as the base map foundation for the GIS. The Gordon County GIS
Department has already completed the majority of the basemap dataset work with the
construction of the parcel data and attributes associated with the data.
The City of Calhoun’s Engineering Department has already completed a number
of feature locations throughout the city. The department has a GPS base station installed
for locating utilities with RTK GPS. By using the RTK GPS, the features located are
highly accurate to within a few inches. Some of the features located by the Engineering
Department include wastewater manholes, utility poles, and street centerlines. The
features were located with RTK GPS on the Georgia State Plane Coordinate System. The
Sewer and Water Departments have already begun using the location data and aerial
photography. This data will be very helpful in referencing other data throughout the city
for the GIS.
Water System Data Conversion and Development
The existing CAD data for the water system is based on an assumed coordinate
system, which is not on a defined coordinate system. A field inventory of the valves and
hydrants was completed in order to accurately place the lines. The water line attributes
were populated by using the existing CAD data. The valve diameters were field verified

62
while doing the RTK GPS locations. By using the aerial photography, planimetrics, and
the RTK GPS valve and hydrant data, the water dataset was populated in GIS. A large
amount of the line locations came from meetings involving the water crews that actually
installed the lines or who have done repairs on the lines.
The water meters were located using a hand held GPS in which the data had to be
differentially corrected using post-processing software. The hand held GPS unit produced
accuracy within a foot compared to inches of the RTK GPS. The hand held unit was used
because of the obstruction of trees and bushes that are usually around meters. The RTK
GPS needs at least the visibility of 4 satellites in order to get a fixed location. The
locations of the meters were incorporated into the procedure of meter replacements for
the Automated Meter Reading (AMR) system. During the AMR project, each meter had
to be changed out with a new meter, and a GPS location was taken and attributes noted.
Figure 9 shows an example of the water CAD drawings the department has been
using for many years. The map displays water main locations with hydrants and valves.
The drawing was creating without using any scale. The GIS map in figure 10 shows the
newly acquired data in the same area on the State Plane Coordinate System. The GIS map
not only shows the water main, hydrant, and valve locations, but also the meter locations.
The backflow fire taps and backflow points were also added to the water dataset. The
backflow features allow the Water Department to keep track of testing dates and history
on each backflow location. Figure 11 shows the GIS symbology for figure 10 and the
entire water dataset. The GIS symbology remained close to the same as the CAD
mapping so everyone could easily read the maps.

63
Figure 9. Example Water Map in CAD Not to Scale

64
Figure 10. Example Water Map in GIS. Refer to Figure 50 for Symbology.

65
Water System Symbology
XW Leaks
4 WaterMeters
!( Tanks
l? Valves
" PumpStations
È
!ñ Hydrants
!R Fittings
#* BackflowFireTaps
#0 BackflowPoints
Abandoned Lines
Laterals
Main
<all other values>
Diameter
0
1
2
4
6
8
10
12
16
18
20
24
30
Figure 11. Water GIS Symbology
Sewer System Data Conversion and Development
The sewer data was much easier to convert and develop than the water because of
the size of the system. The sewer system only serves the residences within the city limits.
Around 35% of all sewer manholes were already located using RTK GPS and attributed
by the Engineering Department. Also a number of developers over the past few years
have submitted drawing plans on subdivisions in the State Plane Coordinate System
showing the location of the sewer installed.
A field inventory took place that located and attributed the remaining 65% of the
manholes. During the field inventory each manhole was located with RTK GPS which
provided accurate and precise location and elevation. The elevation data for each

66
manhole had to be accurate for modeling purposes in the future. The manhole covers
were removed and a measurement of the depth was taken. The material of the pipe and
condition of the manhole was also noted during this time.
The CAD map in figure 12 shows an example of a sewer drawing. The CAD
drawing displays the manholes and gravity mains. The CAD drawing was created without
any scale. Figure 13 shows an example of the same area in GIS. The GIS map not only
shows the manholes and gravity mains but also the lateral lines which are displayed in
yellow. The GIS symbology for figure 13 and all of the sewer dataset is shown in figure
14.
Figure 12. Example Sewer Map in CAD Not to Scale

67
Figure 13. Example Sewer Map in GIS. Refer to Figure 53 for Symbology.

68
Sewer System Symbology
!( Abandoned Points
!. Monitor Locations
") Lift Stations
!( Manholes
Abandoned Lines
Service Laterals
Force Mains
Gravity Mains
!( Clean Outs
" Wet Wells
Figure 14. Sewer System Symbology
Electric System Data Conversion and Development
The electric data like the water and sewer existed in CAD format only with
assumed coordinates. The attribute information for all the electric data was in the form of
labels in the CAD system. The data conversion began with georeferencing all the poles
and then applying the attributes based on the CAD data. The aerial photography provided
enough detail to pick out poles and lines in many of the areas. Poles had to be located by
GPS in the areas where they could not be identified from the aerial photography.
The development of the GIS began with adding each layer of data one at a time by
circuit. The electric system is made up of 3 substations and 18 different circuits. After the
poles where referenced and located, the other features were added. The feature classes
that make up the electric datasets are mostly attached to poles except for surface
structures and underground transformers. All of the features associated with the
underground lines were located in the field with GPS. The phasing of the primary lines
was field verified by visiting each of the three substations and tracing out the circuits. A

69
number of phasing errors were identified during this process and were changed in the
GIS.
Figure 15 shows an example of a CAD electric drawing. The CAD drawing was
drawn similar to the water and sewer with no scale. The map in figure 16 is an example
of the new GIS data developed for the same area. The symbology for figure 16 and the
entire electric dataset is shown in figure 17. The symbology remained as close to the old
cad drawings as possible for the field crews.
Figure 15. Example Electric CAD Map not to Scale

70
Figure 16. Example Electric Map in GIS. Refer to Figure 56 for Symbology.

71
Electric Symbology
Poles
Owner
dª AOP
!> CALNET
$ CCP
!= COC
! COJ
!H COP
!? COT
%L FGP
# FOP
!
<
GOP
'N MOP
"S NGP
'N SLP
%«-- STP
#V TOP
Transformers
") <all other values>
Type
# Single Phase Overhead
)#) Single Phase Underground
#
#
# Three Phase Overhead
« ««
Three Phase Overhead Pad
«)) Three Phase Underground
## Two Phase Overhead
Lights
!( <all other values>
Subtype
"J Catv
Siren
O Caution Light
"̂ Box Light
!C Tennis Light
!k Flood Light
!̂ Security Light
!l Sport Light
!̂ Streetlight
!² Traffic Light
Switches
") <all other values>
Subtype
"¶"¶ 600A-SBSW-N.O.
"¶"¶ 600A-SBSW-N.C.
"¶ 300A-SBSW-N.C.
"¶ 300A-SBSW_N.O.
é Gang Operated Switch-N.C.
"é Gang Operated Switch-N.O.
éu
u
In Line Switch-N.C.
é
u u In Line Switch-N.O.
é¶ Oil Breaker Switch-N.C.
é¶ Oil Breaker Switch-N.O.
!j Fibervaults
Dynamic Protective Devices
<all other values>
SubtypeCD
)¹ Single Phase Electronic recloser
¹¹¹ Three Phase Electronic Recloser
Capacitors
"¾ Capacitors
Subtype
"¾ Fixed Bank Capacitor
"¾ Series Capacitor
"¾ Shunt Reactor
"¾ Switched Bank Capacitor
# Meters
Fuses
!( <all other values>
Subtype, Phase Designation
!(!( Overhead Expulsion, AB
!( Underground Expulsion, A
!(!( Overhead Expulsion, BC
!(!(!( Underground Expulsion, ABC
!(!( Underground Expulsion, AB
!( Overhead Expulsion, C
!( Overhead Expulsion, B
!(!( Overhead Expulsion, AC
!(!(!( Overhead Expulsion, ABC
!( Overhead Expulsion, A
Open Points
« <all other values>
Subtype
«! Open Point
(¬ Closed Point
Surface Structures
<all other values>
Subtype
%Æ) Junction Box
Pedestal
°C° Secondary Pedestal
Òo Single Phase Primary Pedestal
ª)) Three Phase Primary Pedestal
Anchor Guys
<all other values>
Subtype
XW Sidewalk
n Standard
Jumpers
XY XY XY XY XY SpanGuys
SecOHElectricLineSegment
PriOHElectricLineSegment
B <all other values>
Subtype, Feeder ID
B 30, N6482
B 20, N6472
B 20, N1052
B 30, N1042
B 20, N1062
B 30, N1032
B 30, N1022
B 30, N1012
B 30, N6452
B 30, N6442
B 30, N6462
B 30, N6432
B 30, N6422
B 30, N6412
B 30, N7112
B 30, N7992
B 30,N7552
B 30, N7772
PrimaryUDG
<all other values>
Subtype, Feeder ID
20, N6472
20, N6482
20, N1052
20, N1042
20, N1062
20, N1032
20, N1022
20, N1012
20, N6452
20, N6442
20, N6462
20, N6432
20, N6422
20, N6412
20, N7112
20, N7992
20, N7552
20, N7772
SecondaryUDG
Figure 17. Electric GIS Symbology
Web Mapping Application and Development
One of the main goals for the Water, Sewer, and Electric Departments is to have
easy access to the GIS data. The web mapping application (http://www.cityofcalhoun-
ga.com/gis) provides the departments with the ability to locate, query, and analyze many
different datasets in the City of Calhoun. Utility crews are able to access the data in the
field from tablet computers and smartphones at any time. The mapping application can

72
only be viewed from a City of Calhoun networked computer. To gain access from outside
the city, a login and passcode are needed.
The development of the web mapping application began after the data from all the
departments were collected and converted. The application was built using ESRI’s
ArcGIS Server Enterprise Advance and Adobe’s Flex Builder software. The layers in the
mapping application are considered mapping services that are generated by ArcMap
documents. ArcMap documents were created for each department and consisted of data
from the geodatabase. The web application was created by following examples that were
provided by ESRI. Listed below are a few example uses of the web mapping application:
Locate a particular physical address and zoom to the location
Search for a water or electric meter by ID number
Businesses and residences can be searched for by utility account #
Display all city utility networks (Water, Electric, Telecommunications, and
Wastewater)
Ability to view attributes about a particular feature within the datasets (ex: pipe
size, transformer wattage, light type)
View parcel and zoning information for any location
Draw and highlight your own areas of interest using the application tools
Have the ability to get precise measurements using tools and the aerial maps
Figure 18 shows the initial opening screen of the web mapping application. Once
the user logins, the toolbar in the upper left hand corner of the screen (shown in figure

73
19) is used to navigate and display layers. The layer list shown in figure 20 provides the
ability to toggle layers on and off. There are other tools available from this website. The
address lookup tool is to locate the physical address of businesses and residences. Figure
21 shows a screenshot of this tool. The billing account number lookup tool allows the
user to enter the billing account number and displays the house or building it is associated
with. A screenshot of this tool is shown in figure 22. The web mapping application also
allows the user to display attribute tables for features. Figure 23 shows the water hydrant
attribute table. The search and identify tool shown in figure 24 allows the user to identify
and search any features within the system. Figure 25 shows an example of using the
identify tool on a sewer manhole. The draw tool in figure 26 allows the user to create
their own custom map by adding items such as points, lines, freehand lines, polygons,
freehand polygons, and text to the map. The printing tool shown in figure 27 allows the
user to print their own map and add items such as title, subtitle, and notes.

74
Figure 18. Web Mapping Application Initial Screen
Figure 19. Main Toolbar for Application

75
Figure 20. Layers List

76
Figure 21. Locate Address Tool

77
Figure 22. Billing Account Number Lookup Tool

78
Figure 23. Attribute Table Tool
Figure 24. Search and Identify Tool

79
Figure 25. Example Use of Search/Identify Tool
Figure 26. Draw and Measure Tool
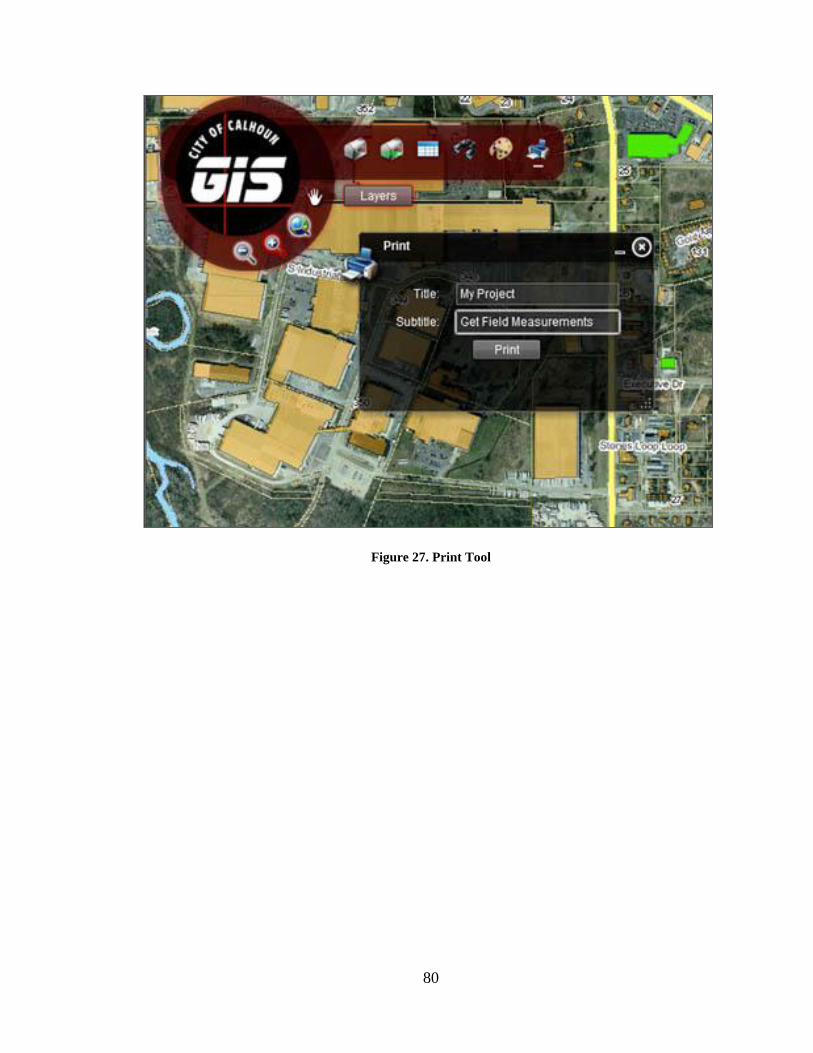
80
Figure 27. Print Tool

81
CHAPTER 6
ANALYSIS RESULTS AND DISCUSSION
The implementation and development of the utility GIS was completed in a three-
year time frame. The system is continuously being updated with new layers of data. The
development of the GIS is a never ending, ongoing project because of the applications,
tools, and analyses each department requests. The GIS today is being used by all
departments on a daily basis. The system has become a tool that the departments depend
on to carry out their daily functions and decision making. The GIS provides these
departments with the ability to analyze and manage their entire infrastructure. The system
provides each department with linked data from the billing, work order, and AMR
systems. The locations of the features are very accurate and precise compared to the old
CAD mapping techniques used. The data is now stored in a geodatabase which provides
an unlimited amount of information to be linked to the features in their infrastructure.
Compared to the old CAD system, the GIS has improved the efficiency of the
departments greatly by reducing the amount of time needed to carry out daily processes.
A few examples of the time saved by using the GIS are listed below by departments.
Water Department
The CAD drawings had no meter locations. The GIS now provides the department
with accurate location of all meters for replacement purposes.
Address lookup for work orders saves time for the work crews when responding
to a service call. The CAD system provided no physical address data.

82
Real time reading of meters allows the Electric and Water Departments to view
the reading by clicking on the meter in the GIS. Prior to the AMR and GIS
implementation, meter readers were used in the field to record readings.
The Water Department is now able to easily perform consumption analysis by
using the readings from the meters in GIS.
Water valve isolation of system when leaks occur was a huge problem before the
GIS was implemented. The location of the valves in the CAD drawings was not
accurate, which wasted a lot of time in the field trying to locate them.
Mapping of leaks in the GIS now provide the Water Department with the location
of future rehabilitation of certain pipes in the system.
Management of backflow testing for businesses was managed by a long paper
trail in the past. The GIS now provides the Water Department with locations of all
the backflows and links to the test results.
Utility locate requests are now being done mostly in the office using GIS instead
of in the field.
Sewer Department
Inflow and Infiltration project is managed based on data from GIS. The drainage
basins were developed by using a combination of elevation and feature data. The
department had no inflow and infiltration mapping in the past.
GIS provides the crews with physical address lookups for work orders. Prior to
GIS the crews had to use paper street maps with no house numbers.
Inspection videos are now attached to each pipe segment allowing quick access to
viewing.

83
The sewer CAD drawings had no locations of the service laterals in the system.
The GIS now has a number of service lateral locations that were identified by
reviewing the inspection videos.
The CAD drawings had no monitor manhole locations. The GIS has all monitor
manhole locations with data attached.
Utility locate requests are now being done mostly in the office using GIS instead
of in the field.
Electric Department
Daily mapping of work orders in the past with the CAD data was not accurate
which led to time wasted in the field. The GIS has provided the crews with
accurate mapping that can be relied upon in the field.
The department now has the ability to read the meters from the GIS instead of
having to read them in the field.
Measuring distances for proposed lines in the office instead of in the field has
saved the department a lot of time.
Physical address data in the GIS has helped the crews quickly identify the
location of outages.
Utility locate requests are now being done mostly in the office using GIS instead
of in the field saving time and resources.
The departments now have access to all utility datasets by using the web mapping
GIS. Figure 28 shows a screenshot of the web mapping application with the water layer
turned on. Figure 29 shows a screenshot of the web mapping application with the sewer
layer turned on. Figure 30 shows a screenshot of the web mapping application with the

84
electric layer turned on. The map in figure 31 shows the overall service area of the water
system. Figure 32 shows the overall service area for the sewer system. The map in figure
33 shows the overall service area for the electric system.
Figure 28. Water Layer GIS Application

85
Figure 29. Sewer Layer GIS Application
Figure 30. Electric Layer GIS Application

86
Figure 31. Overview of Calhoun Water System

87
Figure 32. Overview of Calhoun Sewer System

88
Figure 33. Overview of Calhoun Electric System

89
Challenges and Solutions
Overall the biggest challenge with the implementation was learning how each
department operates and how each of the utility systems works. Time was spent with
each of the departments’ field crews to learn exactly how they operate on a daily basis.
The electrical system was the most challenging because the system is made up of so
many components and these components had to be modeled in GIS.
Another challenge during the implementation was organizational issues and
coordination that occurred from the departments. Meetings had to be organized with each
department on a weekly basis to review the data conversion and status. Scheduling the
meetings with the departments in the beginning was challenging. Once the departments
started using the GIS more consistently, they came to realize the value of it. A meeting
with each department is now held weekly for input and ideas about the GIS.
Training issues were also a challenge in the beginning with each department.
Each of the departments is responsible for its own data. The data in most cases has to be
updated on a daily basis. The users needed to be trained on how to make edits using GIS.
The users had no prior experience using GIS software. Weekly meetings were held with
each department to cover the fundamentals of the GIS software. The free web courses
offered by ESRI were also used by the staff members to further their training.
Data inconsistency was also a challenge with the data editing. Wrong values were
entered into certain attribute fields. For example, the user enters a pole class number that
does not exist. Attribute domains were applied to all fields in the system to ensure the
consistency of the attribute values.
.

90
CHAPTER 7
CONCLUSION AND FUTURE ENHANCEMENTS
Conclusion
The focus of this research has been to review, explain, and show an example of
how a GIS was developed for the City of Calhoun utility departments. This research
showed how the GIS helped improve the efficiency within each of the utility departments
for the City of Calhoun. The implementation process outlined in this research can provide
other cities and municipalities with the knowledge and foundation to develop their own
GIS. This research can provide individuals with a reference to implement a utility GIS
from the beginning to the end. Using the GIS to manage the City of Calhoun’s utility data
has allowed more flexibility over the previous CAD system when analyzing data. The
management of the utility data has become much more efficient compared to previous
management with CAD. The utilities departments of the City of Calhoun have embraced
GIS and look forward to advancements to the system.
Future Enhancements
This research has shown how the GIS was implemented for the City of Calhoun
and how useful the system has become in such a short period of time. However, there are
more areas that will be addressed in the future to help the departments become even more
efficient.
One area that will be implemented in the near future is geometric networks for
each of the datasets. The geometric networks will ensure correct connectivity and

91
relationships between the features in each dataset. The geometric network will also allow
tracing capabilities throughout the system. This will help in areas like outage
management and water leaks. The geometric network tracing will help identify problem
areas and show what customers are affected by those problems.
Another area of enhancement will be the mobile hardware and applications
deployed in the field. Field crews are currently using ArcMap installed on a laptop in the
vehicles. The field crews have mentioned touch screen tablets with a more user friendly
GIS software to be used outside the vehicle while in the field.

92
References
Cannistra, J.R., 1999. Converting utility data for a GIS. American Water Works
Association Journal, 91(2), 55-64.
Croswell, P.L., 1991. Obstacles to GIS implementation and guidelines to increase the
opportunities for success. Urban and Regional Information Systems Association
Journal, 3(1): 43-56.
Environmental Systems Research Institute (ESRI), 2003. Shredding the Map: Building an
Enterprise Geographic Information System for Utilities [online]. Available from:
http://www.esricanada.com/documents/shredding-the-map.pdf [Accessed 10
October 2009].
Gordon County, 2008. Gordon County Detailed Profile [online]. Available from:
http://www.city-data.com/county/Gordon_County-GA.html [Accessed 30
September 2010].
Homer, W., 1997, Empowering Fields Crews with AM/FM [online]. Available from:
http://www.gisdevelopment.net/proceedings/gita/1997/fotf/fotf29pf.htm
[Accessed 17 October 2009].
Hughes, J., 2006. GIS combines Geography and information for effective utility
management. American Water Works Association Journal, 32(12), 10-11.
Pickford, P., 1997. The Data Capture Challenge – Innovative Solutions [online]
Available from:
http://www.gisdevelopment.net/proceedings/gita/1997/fotf/fotf32pf.htm
[Accessed 17 October 2009].
Shamsi, U.M., 2002. GIS Tools for Water, Wastewater, and Stormwater Systems. Reston,
Virginia: American Society of Civil Engineers.
Shamsi, U.M., 2005. GIS Applications for Water, Wastewater, and Stormwater Systems.
Boca Raton, Florida: Taylor and Francis.
Tomlinson, R., 2003.Thinking about GIS: Geographic Information System Planning for
Managers. Redlands, California: Environmental Systems Research Institute
(ESRI).
Uhrick, S. and Feinberg, D., 1997. Integrating GIS with Utility Information Management
Systems [online]. Available from:
http://www.gisdevelopment.net/proceedings/gita/1997/bepm/bepm20pf.htm
[Accessed 17 September 2009].

93
Zeiler, M., 1999. Modeling Our World: The ESRI Guide to Geodatabase Design.
Redlands, California: Environmental Systems Research Institute (ESRI).