Embed Size (px)
Citation preview
Implementing a Commercial Fisheries Bio-Sampling Program on Oahu and Maui: Hawaii’s
Bio-Sampling Program
December 2020
Western Pacific Regional Fishery Management Council
1164 Bishop St., Ste. 1400 Honolulu, Hawaiʻi, 96813
Western Pacific Regional Fishery Management Council ● www.wpcouncil.org
A technical report of the Western Pacific Regional Fishery Management Council 1164 Bishop Street, Suite 1400, Honolulu, HI 96813
Prepared by Cassandra Pardee and John Wiley, Poseidon Fisheries Research.
Cover Photo: Researchers remove gonads while providing outreach on the project to community
members at the Kōkua Fishing Tournament in April 2019 (Photo credit: Zachary Yamada)
© Western Pacific Regional Fishery Management Council 2020.
All rights reserved.
Published in the United States by the Western Pacific Regional Fishery Management Council
ISBN# 978-1-944827-79-3
Funding for this project was provided by the Western Pacific Regional Fishery Management Council through a cooperative agreement with the NOAA Coral Reef Conservation Program,
Award Number NA17NMF441025.1
Suggested Citation:
Pardee, C. and J. Wiley. 2020. Implementing a Commercial Fisheries Bio-Sampling Program on Oahu and Maui: Hawaii’s Biosampling Program. Western Pacific Regional Fishery Management Council, Honolulu, Hawaii.

HAWAII’S BIO-SAMPLING PROJECT
Through the Hawaii Bio-Sampling Program we have measured over 11,000
commercially caught reef fish from markets on Oahu and Maui. We have
also sampled over 1,000 fish from 9 species for longevity, growth and
reproduction studies. The goal of the Bio-Sampling project is to gather local
demography and catch data to better inform stock assessment scientists
and fishery managers.
Prepared by
Cassandra Pardee
& John Wiley Final Technical Report
DECEMBER
2020
Western Pacific Regional Fishery Management Council www.wpcouncil.org
Poseidon Fisheries Research 1
Table of Contents Introduction ..................................................................................................................................... 3
Methods........................................................................................................................................... 3
Market Sampling ........................................................................................................................ 3
Life-history sampling ................................................................................................................. 4
Age and Growth....................................................................................................................... 4
Reproduction ........................................................................................................................... 5
Mortality .................................................................................................................................. 6
Results & Discussion ...................................................................................................................... 7
Market Sampling ........................................................................................................................ 7
Life-History .............................................................................................................................. 10
Age......................................................................................................................................... 11
Reproduction ......................................................................................................................... 16
Mortality ................................................................................................................................ 20
Outreach & Trainings ................................................................................................................... 23
Acknowledgements ....................................................................................................................... 25
Works Cited .................................................................................................................................. 25
Appendix 1: Length Weight Relationships for Coral Reef Fish of Hawaii .............................. A1:1
Appendix 2: Outreach Material ................................................................................................ A2:1
Western Pacific Regional Fishery Management Council www.wpcounicl.org

Poseidon Fisheries Research 2
Table of Figures Figure 1: Percentage of number of fish sampled in the Oahu markets and Maui markets .......................... 7
Figure 2: Comparison of Mean Fork Length between Oahu and Maui markets for the five most
represented species. ....................................................................................................................................... 8
Figure 3: Comparison of market sampling data to 2018 CML catch reports. .............................................. 9
Figure 4: Pictographs of otoliths ................................................................................................................ 12
Figure 5: Sex specific relationship between sagittal otolith weight (g) and age for A) Acanthurus blochii,
B) Acanthurus dussumieri, C) Acanthurus olivaceus, and D) Acanthurus xanthopterus ........................... 13
Figure 6: Sex specific and combined von Bertalanffy growth curves for A) Acanthurus blochii, B)
Acanthurus dussumieri; C) Acanthurus olivaceus, and D) Acanthurus xanthopterus ................................ 14
Figure 7: Microscopic photographs of ovarian phases for Acanthurus olivaceus. .................................... 16
Figure 8: Female L50 and A50 for Acanthurus blochii, Acanthurus dussumieri; Acanthurus olivaceus, and
Acanthurus xanthopterus ............................................................................................................................ 18
Figure 9: Male L50 and A50 for Acanthurus blochii, Acanthurus dussumieri; Acanthurus olivaceus, and
Acanthurus xanthopterus ............................................................................................................................ 19
Figure 10: Mature female mean gonadosomatic index (GSI) per month for A) Acanthurus blochii, B)
Acanthurus dussumieri; C) Acanthurus olivaceus, and D) Acanthurus xanthopterus ................................ 20
Figure 11: Age based catch curve for A) Acanthurus blochii, B) Acanthurus dussumieri; C) Acanthurus
olivaceus, and D) Acanthurus xanthopterus ............................................................................................... 21
Figure 12: Plots displaying the pattern of residuals for single age-based catch curves for A) Acanthurus
blochii, B) Acanthurus dussumieri; C) Acanthurus olivaceus, and D) Acanthurus xanthopterus .............. 23
Figure 13: Photos of various tournaments and outreach events ................................................................. 24
Table of Tables Table 1: List of selected species for life history work ................................................................................. 4
Table 2: Sample size (N) and minimum, maximum and average FL (mm) for selected species. .............. 10
Table 3: Sample size (N) of otoliths currently aged .................................................................................. 11
Table 4: Summary of life-history traits for four commonly targeted Acanthuridae species of Hawaiʻi. ... 15
Table 5: Processed gonad samples for selected species. ............................................................................ 17
Table 6: Total mortality estimates for all four targeted Acanthurus species. ............................................. 22
Western Pacific Regional Fishery Management Council www.wpcounicl.org
Poseidon Fisheries Research 3
Introduction Hawaiʻi’s nearshore fishery (commercial and non-commercial catch) is valued between
10 to 16 million dollars (Grafeld et al. 2017). Aside from the estimated dollar value of the
fishery, the catch provides more than seven million meals annually (Grafeld et al. 2017). The
nearshore fishery is composed of many different coral reef associated species from multiple
families. Yet Hawaiʻi’s nearshore fishery, like most coral reef fisheries, is considered data poor
with relatively little information known about the growth and maturity of these commonly
caught species. Life history information is a critical component for data limited stock
assessments. In a recent Hawaiian stock assessment of 27 commonly targeted coral reef species,
11 species had inadequate or no published growth and maturity information (Nadon 2017). Aside
from missing life history information, the commercial catch is also missing catch length data,
which is a key component for data-limited stock assessments. The goals of the Bio-Sampling
project were to fill the gap of missing life history information for Hawaiʻi’s commonly targeted
nearshore species as well as attain size at catch data for multiple commercially targeted species.
Methods
Market Sampling Three Oahu fish vendors were surveyed on a weekly basis from August 2018-July 2019.
Three Maui fish vendors were surveyed from June 2019 - August 2019 and from October 2019-
November 2019. Sampling in Maui was less consistent due to lack of trained people; June-
August were sampled by two local University of Hawaiʻi Maui College students trained by PIs
and October-November were sampled by students from Kamehameha School- Maui Marine
Biology class.
Market sampling took place during normal operating hours. Participating markets were
paid $100 a month as an incentive for letting us count, measure, and weigh available reef
fish. Market sampling was conducted with a two-person team: one to measure fish, and one to
record the data. Species were confirmed to come from Hawaiian based fishermen and not
imported from other territories. Fish not easily identified were photographed or purchased and
taken to the lab for identification.
A maximum of 100 length and weight samples were taken each month for each
species based on market availability. When there were more than 20 fish of the same species at a
market, a random sample of 20 fish per species were chosen to measure. For each targeted
Western Pacific Regional Fishery Management Council www.wpcounicl.org
Poseidon Fisheries Research 4
species, fish were weighed to the nearest gram and measured to the nearest mm fork length (FL).
Additionally, market price (USD/pound) for each species was recorded each week.
Average commercial catch length was calculated based on the fork length measurements
from local markets. The length and weight measurements for each species was fitted using a
power function represented by W=aLb where weight (W) can be estimated given the length (L)
and the two parameters a and b (Schneider et al. 2000).
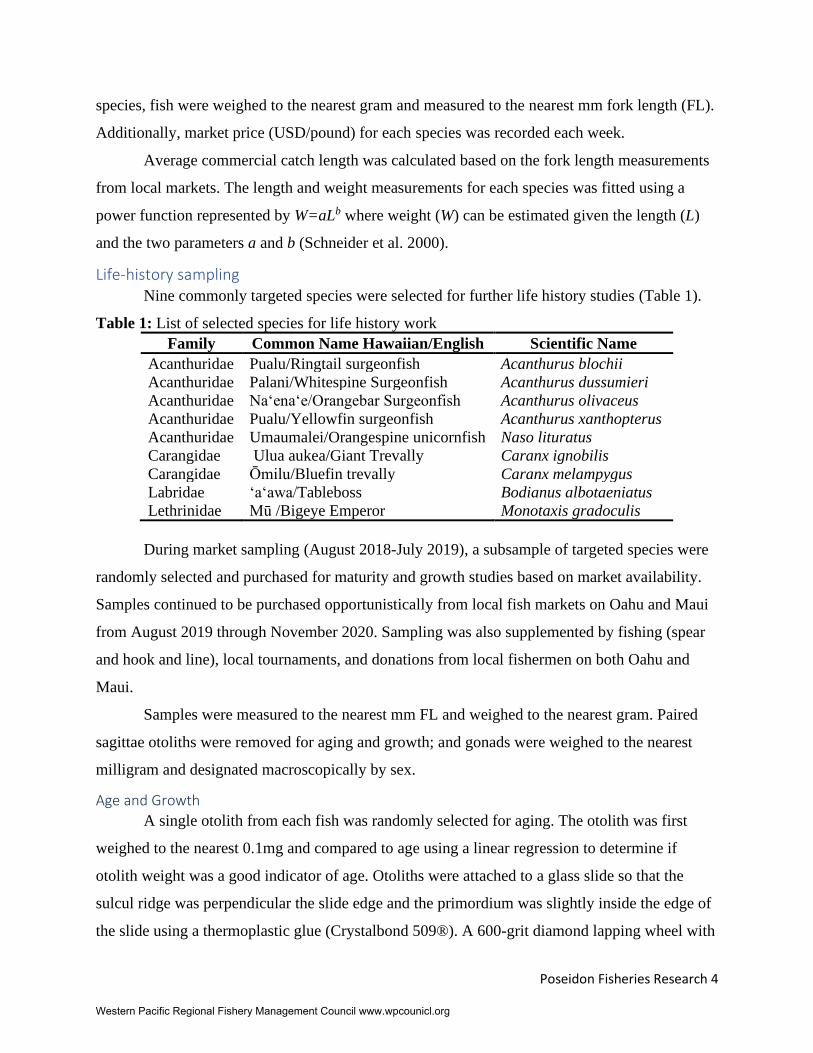
Life-history sampling Nine commonly targeted species were selected for further life history studies (Table 1).
Table 1: List of selected species for life history work
Family Common Name Hawaiian/English Scientific Name
Acanthuridae Pualu/Ringtail surgeonfish Acanthurus blochii
Acanthuridae Palani/Whitespine Surgeonfish Acanthurus dussumieri
Acanthuridae Naʻenaʻe/Orangebar Surgeonfish Acanthurus olivaceus
Acanthuridae Pualu/Yellowfin surgeonfish Acanthurus xanthopterus
Acanthuridae Umaumalei/Orangespine unicornfish Naso lituratus
Carangidae Ulua aukea/Giant Trevally Caranx ignobilis
Carangidae Ōmilu/Bluefin trevally Caranx melampygus
Labridae ʻaʻawa/Tableboss Bodianus albotaeniatus
Lethrinidae Mū /Bigeye Emperor Monotaxis gradoculis
During market sampling (August 2018-July 2019), a subsample of targeted species were
randomly selected and purchased for maturity and growth studies based on market availability.
Samples continued to be purchased opportunistically from local fish markets on Oahu and Maui
from August 2019 through November 2020. Sampling was also supplemented by fishing (spear
and hook and line), local tournaments, and donations from local fishermen on both Oahu and
Maui.
Samples were measured to the nearest mm FL and weighed to the nearest gram. Paired
sagittae otoliths were removed for aging and growth; and gonads were weighed to the nearest
milligram and designated macroscopically by sex.
Age and Growth
A single otolith from each fish was randomly selected for aging. The otolith was first
weighed to the nearest 0.1mg and compared to age using a linear regression to determine if
otolith weight was a good indicator of age. Otoliths were attached to a glass slide so that the
sulcul ridge was perpendicular the slide edge and the primordium was slightly inside the edge of
the slide using a thermoplastic glue (Crystalbond 509®). A 600-grit diamond lapping wheel with
Western Pacific Regional Fishery Management Council www.wpcounicl.org
Poseidon Fisheries Research 5
continuous water was used to grind down the otolith until it was in line with the slide edge. The
otolith was then removed with heat and flipped so that the newly ground side was attached to the
middle of the slide. The otolith was then ground down a second time until a thin (~180-220µm)
transverse section encompassing the core was produced. The section was then covered with
Crystalbond 509 to improve clarity of the annuli.
Sectioned otoliths were read on a stereomicroscope with reflected and transmitted light.
Annuli were identified as alternating translucent and opaque bands along the face of the section
and were counted along a consistent axis to estimate age in years. Annual periodicity of otolith
bands has been validated for 10 different species of acanthurids including A. olivaceus (Choat
and Axe 1996). Annuli for each specimen were counted on three separate occasions by at least
two different researchers. Final age was determined when at least two counts agreed. If three
counts differed by one presumed annulus, the middle age was assigned. A subsample of prepared
otoliths were sent to Dr. Brett Taylor for verification on annuli count.
For fish samples less than 100 mm, otoliths were prepared in the same fashion as above
and then further polished using a progression of lapping film (9.0, 3.0, and 1.0µm grit) to expose
daily growth increments. Age in daily growth increments beyond the settlement ring (Wilson and
McCormick 1999) was estimated as the mean of three independent and nonconsecutive age-
readings.
The Von Bertalanffy Growth Function (VBGF) was fitted to both sex-specific and
combined size-at-age data to estimate growth parameters using the least squares estimation. The
VBGF is represented by: 𝐿𝑡 = 𝐿∞[1 − 𝑒−𝐾(𝑡−𝑡0)], where Lt is the mean FL (mm) at age t (years),
𝐿∞ is the mean asymptotic FL, K is the growth coefficient describing the curvature towards 𝐿∞,
and t0 is the theoretical age at which the FL is equal to zero. Growth between the sexes were
compared using a likelihood ratio test (Kimura 1980).
Reproduction
A cross section of fresh gonad lobes were removed and stored in histological cassettes in
a 10% buffered formalin solution. Fixed sections of gonad material were imbedded in paraffin
wax and cut transversely at 6μm, then stained with hematoxylin and eosin (Sullivan-Brown et al.
2011) at either Hawaii Diagnostic Laboratories in Honolulu, Hawaii or John Burns School of
Medicine Histopathology Core Facility at University of Hawaiʻi Manoa. Prepared slides were
assessed under a compound microscope with transmitted light to determine the sex and level of
Western Pacific Regional Fishery Management Council www.wpcounicl.org
Poseidon Fisheries Research 6
reproductive development. Females were classified as: Immature, Developing, Spawning
Capable, Actively Spawning, Regressing, and Regenerating following the standardized
terminology of Brown-Peterson (2011). Males were classified as either Immature or Mature
based on the presence/absence of spermatozoa. A subsample of histology slides were verified by
Dr. Eva Schemmel who worked with us on the reproduction analysis for the surgeonfish species.
Size at maturity (L50) was estimated using a logistic regression analysis and fitting the FL
as the explanatory variable to the stage of maturity (immature 0, mature 1) as the binomial
response variable. The regression was fitted using a binomial GLM (R Core Team 2019).
Confidence intervals for size at maturity were derived by bootstrap resampling (1,000 iterations).
Reproductive investment with size was assessed through the gonadosomatic index:
𝐺𝑆𝐼 =𝑔𝑜𝑛𝑎𝑑 𝑤𝑒𝑖𝑔ℎ𝑡 (𝑔)
𝑔𝑜𝑛𝑎𝑑 𝑓𝑟𝑒𝑒 𝑏𝑜𝑑𝑦 𝑤𝑒𝑖𝑔ℎ𝑡 (𝑔)× 100
GSI was compared across collection months along with the frequency of spawning capable and
actively spawning females to identify the spawning season.
Mortality
Age-based catch curves (Ricker 1975), using age distributions of samples from markets
and tournaments, were applied to find the total mortality (Z). If a zero-value existed in an age
class, it was omitted from the catch-curve analysis. A line was fitted to the natural log of the
number of fish per age class versus the corresponding age starting when the fish had fully
entered the fishery. The absolute value of the slope of the fitted line represents Z.
Species from the Acanthuridae family were also tested for a biphasic mortality schedule,
which have previously been described for the genus Naso (N. unicornis and N. lituratus) from
multiple regions across the Pacific (Taylor et al. 2019; Pardee et al. 2020). A breakpoint analysis
was used to determine the optimal age at which mortality schedules shift. BIC and RSS were
compared for a normal mortality schedule (without breaks) and a biphasic mortality schedule
(with a single break) to determine which mortality type had the best fit for the age data. For the
biphasic mortality schedule, Z was calculated using a segmented analysis that generated a single
two-phase model joined at the optimized breakpoint age (Muggeo 2020).
We are currently in different stages of analysis for each of the nine species. Age, growth,
and reproduction methods will be the same for all species but as of December 2020 only A.
blochii, A. dussumieri, A. olivaceus, and A. xanthopterus have been completed.
Western Pacific Regional Fishery Management Council www.wpcounicl.org
Poseidon Fisheries Research 7
Results & Discussion
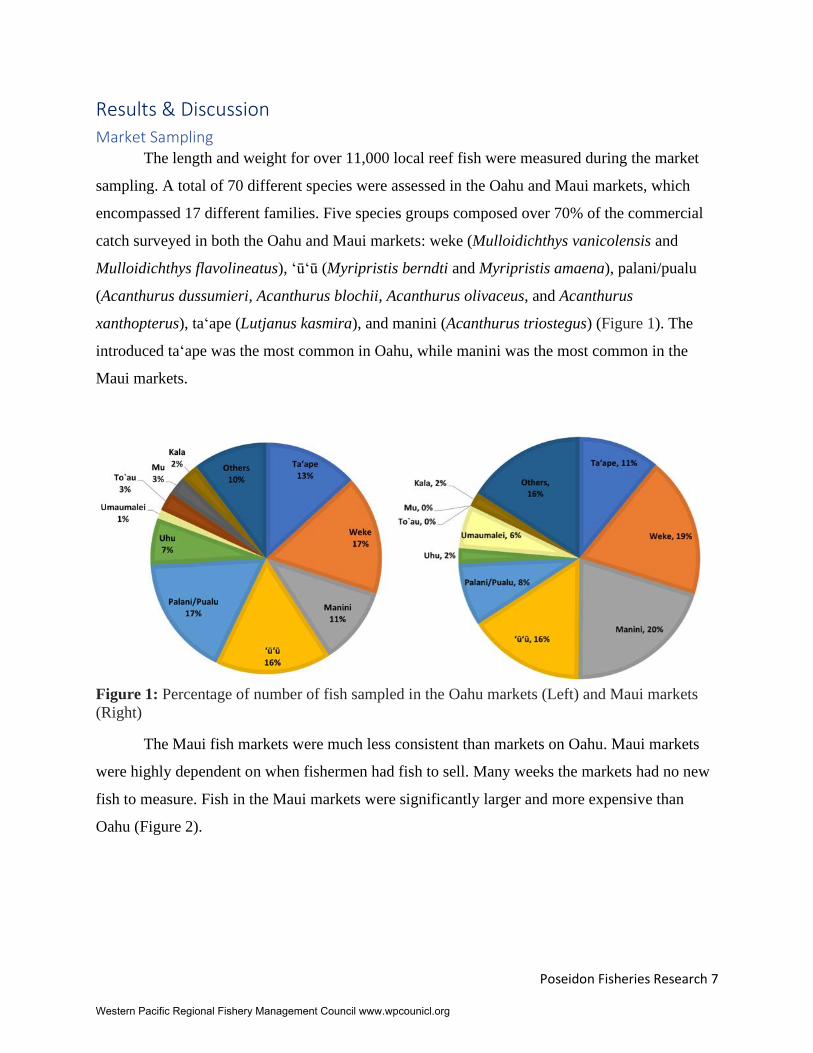
Market Sampling The length and weight for over 11,000 local reef fish were measured during the market
sampling. A total of 70 different species were assessed in the Oahu and Maui markets, which
encompassed 17 different families. Five species groups composed over 70% of the commercial
catch surveyed in both the Oahu and Maui markets: weke (Mulloidichthys vanicolensis and
Mulloidichthys flavolineatus), ʻūʻū (Myripristis berndti and Myripristis amaena), palani/pualu
(Acanthurus dussumieri, Acanthurus blochii, Acanthurus olivaceus, and Acanthurus
xanthopterus), taʻape (Lutjanus kasmira), and manini (Acanthurus triostegus) (Figure 1). The
introduced taʻape was the most common in Oahu, while manini was the most common in the
Maui markets.
Figure 1: Percentage of number of fish sampled in the Oahu markets (Left) and Maui markets
(Right)
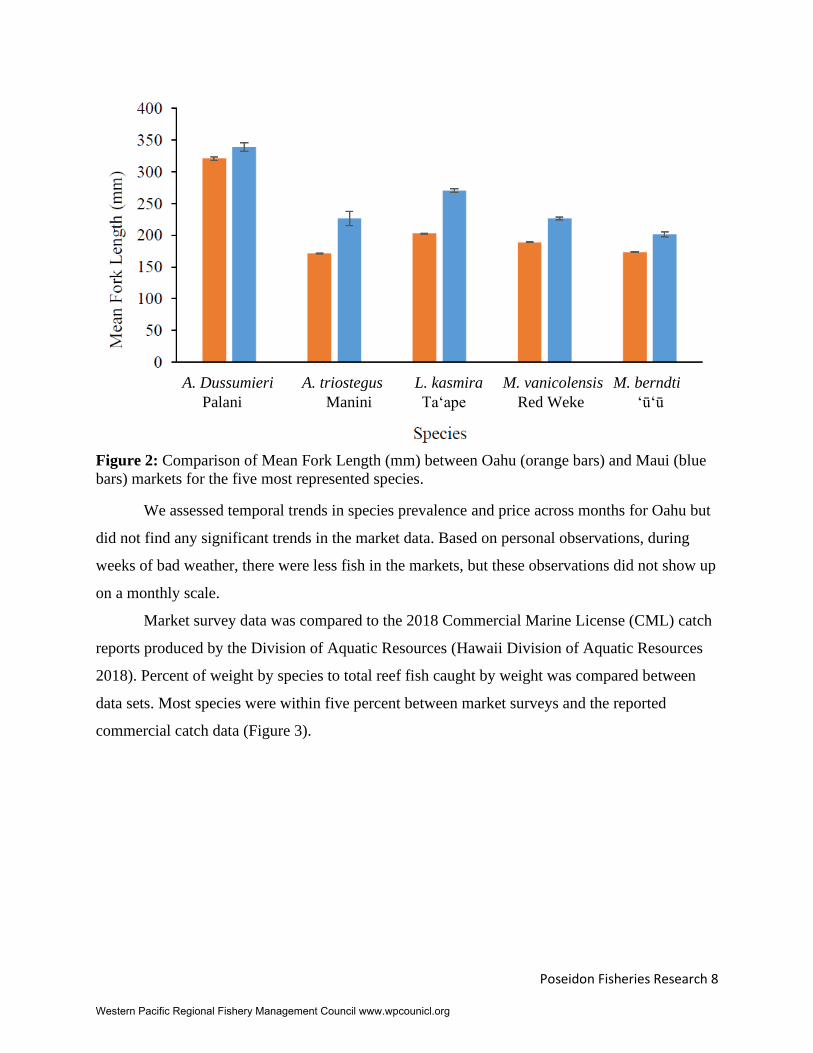
The Maui fish markets were much less consistent than markets on Oahu. Maui markets
were highly dependent on when fishermen had fish to sell. Many weeks the markets had no new
fish to measure. Fish in the Maui markets were significantly larger and more expensive than
Oahu (Figure 2).
Western Pacific Regional Fishery Management Council www.wpcounicl.org
Poseidon Fisheries Research 8
Figure 2: Comparison of Mean Fork Length (mm) between Oahu (orange bars) and Maui (blue
bars) markets for the five most represented species.
We assessed temporal trends in species prevalence and price across months for Oahu but
did not find any significant trends in the market data. Based on personal observations, during
weeks of bad weather, there were less fish in the markets, but these observations did not show up
on a monthly scale.
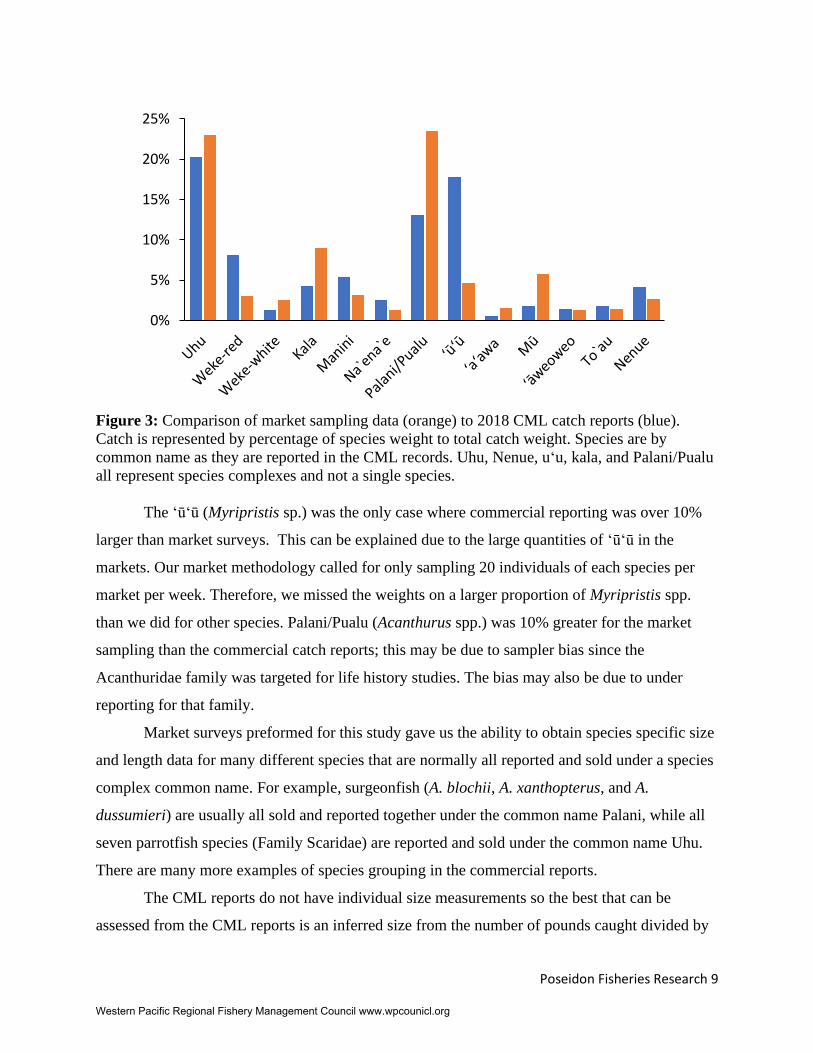
Market survey data was compared to the 2018 Commercial Marine License (CML) catch
reports produced by the Division of Aquatic Resources (Hawaii Division of Aquatic Resources
2018). Percent of weight by species to total reef fish caught by weight was compared between
data sets. Most species were within five percent between market surveys and the reported
commercial catch data (Figure 3).
A. Dussumieri A. triostegus L. kasmira M. vanicolensis M. berndti
Palani Manini Taʻape Red Weke ʻūʻū
Western Pacific Regional Fishery Management Council www.wpcounicl.org
Poseidon Fisheries Research 9
Figure 3: Comparison of market sampling data (orange) to 2018 CML catch reports (blue).
Catch is represented by percentage of species weight to total catch weight. Species are by
common name as they are reported in the CML records. Uhu, Nenue, uʻu, kala, and Palani/Pualu
all represent species complexes and not a single species.
The ʻūʻū (Myripristis sp.) was the only case where commercial reporting was over 10%
larger than market surveys. This can be explained due to the large quantities of ʻūʻū in the
markets. Our market methodology called for only sampling 20 individuals of each species per
market per week. Therefore, we missed the weights on a larger proportion of Myripristis spp.
than we did for other species. Palani/Pualu (Acanthurus spp.) was 10% greater for the market
sampling than the commercial catch reports; this may be due to sampler bias since the
Acanthuridae family was targeted for life history studies. The bias may also be due to under
reporting for that family.
Market surveys preformed for this study gave us the ability to obtain species specific size
and length data for many different species that are normally all reported and sold under a species
complex common name. For example, surgeonfish (A. blochii, A. xanthopterus, and A.
dussumieri) are usually all sold and reported together under the common name Palani, while all
seven parrotfish species (Family Scaridae) are reported and sold under the common name Uhu.
There are many more examples of species grouping in the commercial reports.
The CML reports do not have individual size measurements so the best that can be
assessed from the CML reports is an inferred size from the number of pounds caught divided by
0%
5%
10%
15%
20%
25%
Western Pacific Regional Fishery Management Council www.wpcounicl.org
Poseidon Fisheries Research 10
the number of pieces. Average catch size from this market sampling coupled with the local
demographic data gained from these studies will better inform stock assessment scientists and
local managers for future length-based stock assessments and management rules. Average
commercial catch size along with length weight relationships for 20 of the most observed species
can be found in Appendix 1.
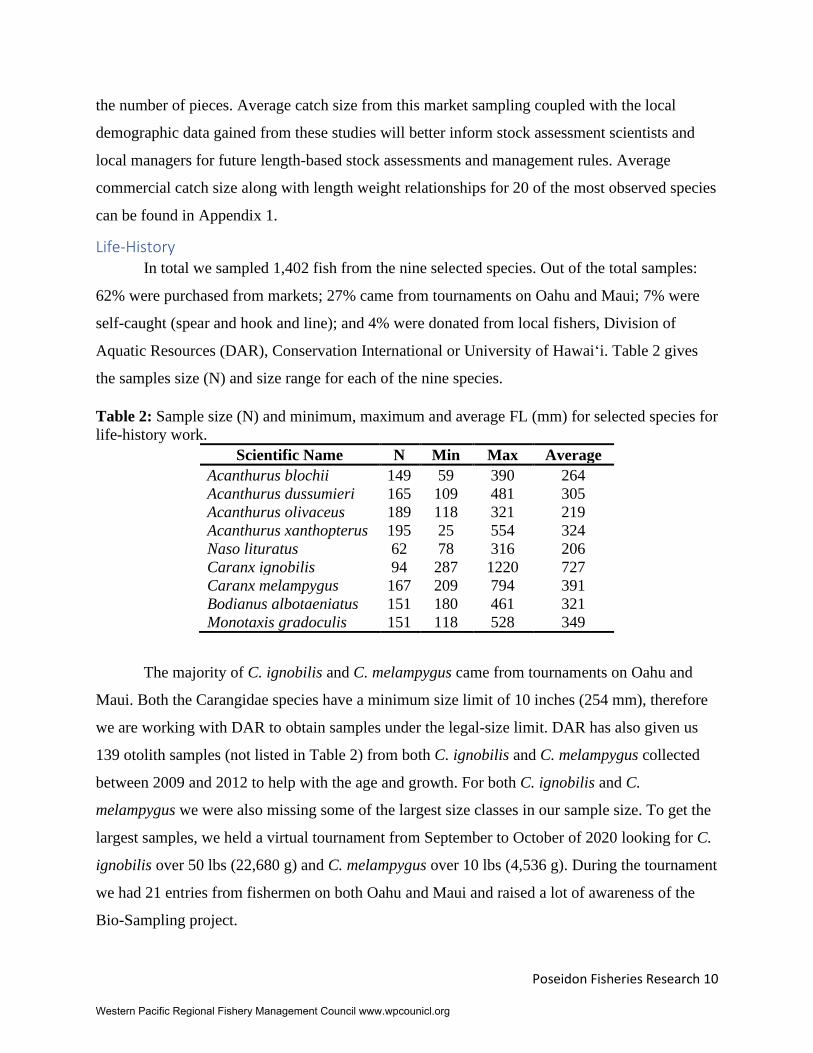
Life-History In total we sampled 1,402 fish from the nine selected species. Out of the total samples:
62% were purchased from markets; 27% came from tournaments on Oahu and Maui; 7% were
self-caught (spear and hook and line); and 4% were donated from local fishers, Division of
Aquatic Resources (DAR), Conservation International or University of Hawaiʻi. Table 2 gives
the samples size (N) and size range for each of the nine species.
Table 2: Sample size (N) and minimum, maximum and average FL (mm) for selected species for
life-history work.
Scientific Name N Min Max Average
Acanthurus blochii 149 59 390 264
Acanthurus dussumieri 165 109 481 305
Acanthurus olivaceus 189 118 321 219
Acanthurus xanthopterus 195 25 554 324
Naso lituratus 62 78 316 206
Caranx ignobilis 94 287 1220 727
Caranx melampygus 167 209 794 391
Bodianus albotaeniatus 151 180 461 321
Monotaxis gradoculis 151 118 528 349
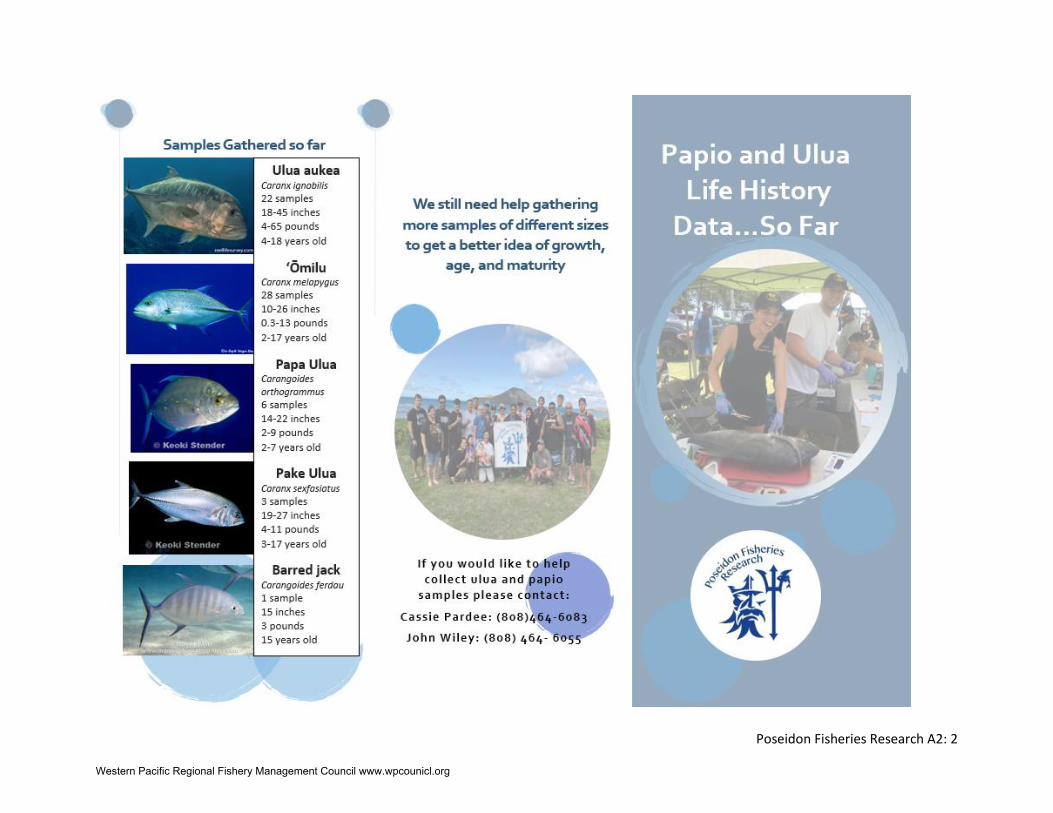
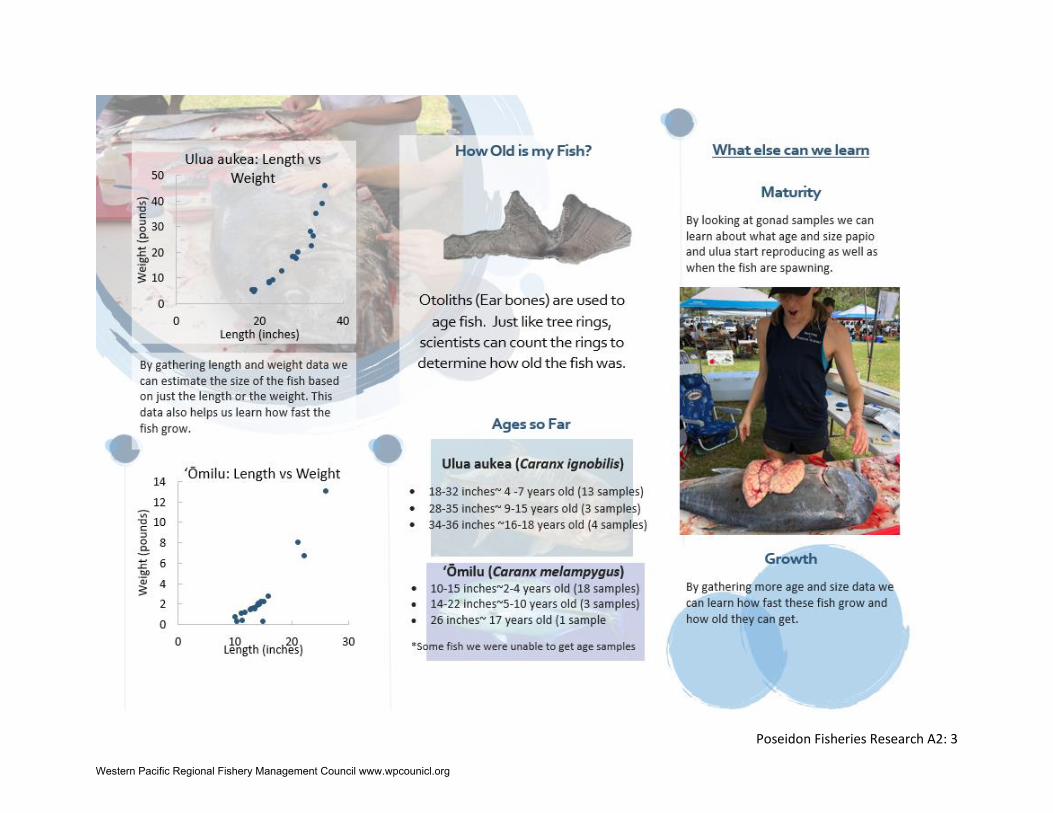
The majority of C. ignobilis and C. melampygus came from tournaments on Oahu and
Maui. Both the Carangidae species have a minimum size limit of 10 inches (254 mm), therefore
we are working with DAR to obtain samples under the legal-size limit. DAR has also given us
139 otolith samples (not listed in Table 2) from both C. ignobilis and C. melampygus collected
between 2009 and 2012 to help with the age and growth. For both C. ignobilis and C.
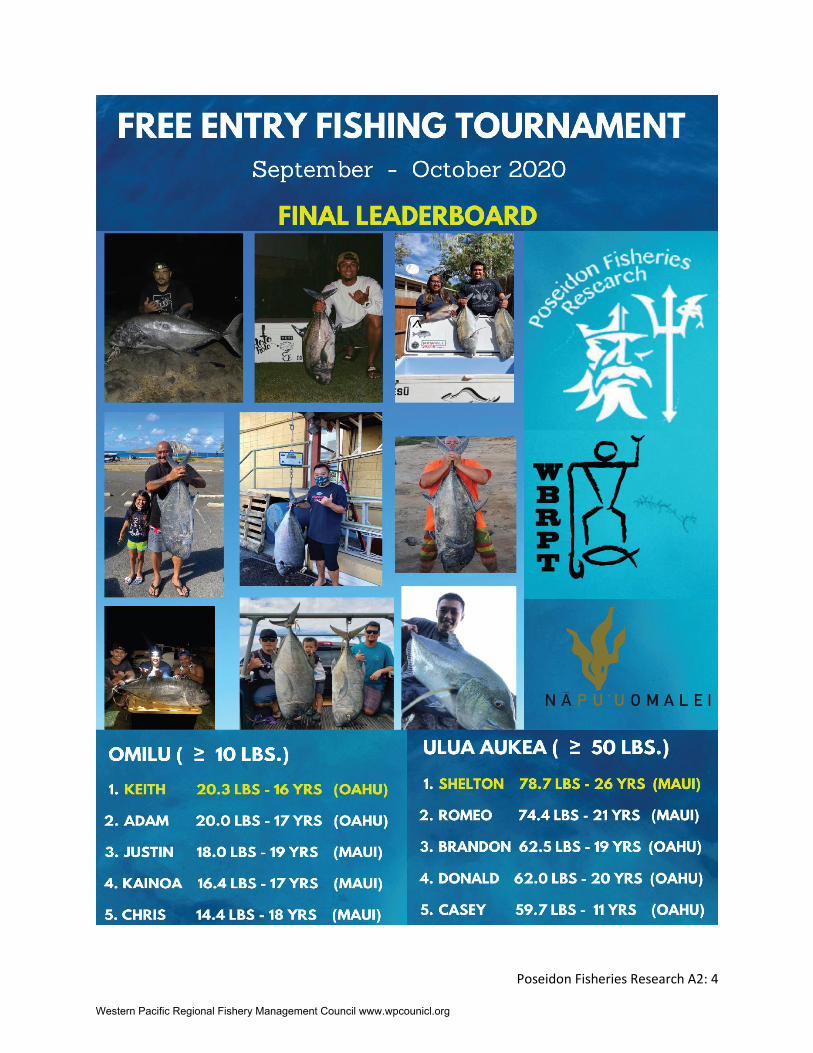
melampygus we were also missing some of the largest size classes in our sample size. To get the
largest samples, we held a virtual tournament from September to October of 2020 looking for C.
ignobilis over 50 lbs (22,680 g) and C. melampygus over 10 lbs (4,536 g). During the tournament
we had 21 entries from fishermen on both Oahu and Maui and raised a lot of awareness of the
Bio-Sampling project.
Western Pacific Regional Fishery Management Council www.wpcounicl.org
Poseidon Fisheries Research 11
Naso lituratus has the fewest collected samples to date. Sampling for N. lituratus did not
begin until January of 2020 but we hope to continue collecting more samples through fishermen
donations in the upcoming months to get to a minimum sample size of 100. There have been two
other demography studies of N. lituratus one from Guam and one from American Samoa (Taylor
et al. 2014; Pardee et al. 2020) that we hope to compare age and growth with in the future.
Aside from N. lituratus, these demographic studies will provide the first growth,
maturity, and longevity parameters for most of these species in Hawaiʻi. The four Acanthurid
studies only had one other age study from the Great Barrier Reef (GBR) with smaller sample
sizes and no published maturity information (Choat and Robertson 2002). The Carangids both
had a growth and maturity study done in Hawaiʻi the 1990’s but it had small samples sizes and
the age and growth was suspect (Sudekum et al. 1991). More recently a maximum age study for
C. ignobilis was published but it did not include growth parameters or maturity information
(Andrews 2020). There have been no growth, longevity, or maturity studies worldwide for both
the endemic B. albotaeniatus or the heavily targeted M. grandoculis.
Age
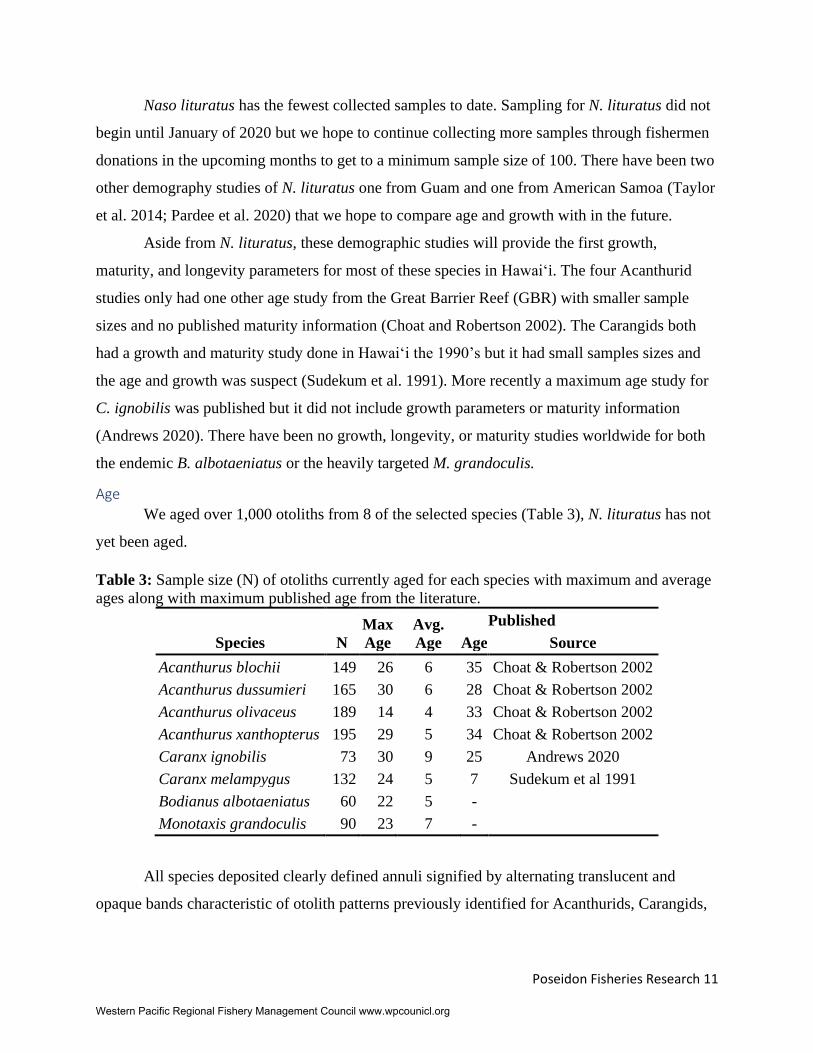
We aged over 1,000 otoliths from 8 of the selected species (Table 3), N. lituratus has not
yet been aged.
Table 3: Sample size (N) of otoliths currently aged for each species with maximum and average
ages along with maximum published age from the literature.
Species N
Max
Age
Avg.
Age
Published . .
Age Source
Acanthurus blochii 149 26 6 35 Choat & Robertson 2002
Acanthurus dussumieri 165 30 6 28 Choat & Robertson 2002
Acanthurus olivaceus 189 14 4 33 Choat & Robertson 2002
Acanthurus xanthopterus 195 29 5 34 Choat & Robertson 2002
Caranx ignobilis 73 30 9 25 Andrews 2020
Caranx melampygus 132 24 5 7 Sudekum et al 1991
Bodianus albotaeniatus 60 22 5 -
Monotaxis grandoculis 90 23 7 -
All species deposited clearly defined annuli signified by alternating translucent and
opaque bands characteristic of otolith patterns previously identified for Acanthurids, Carangids,
Western Pacific Regional Fishery Management Council www.wpcounicl.org
Poseidon Fisheries Research 12
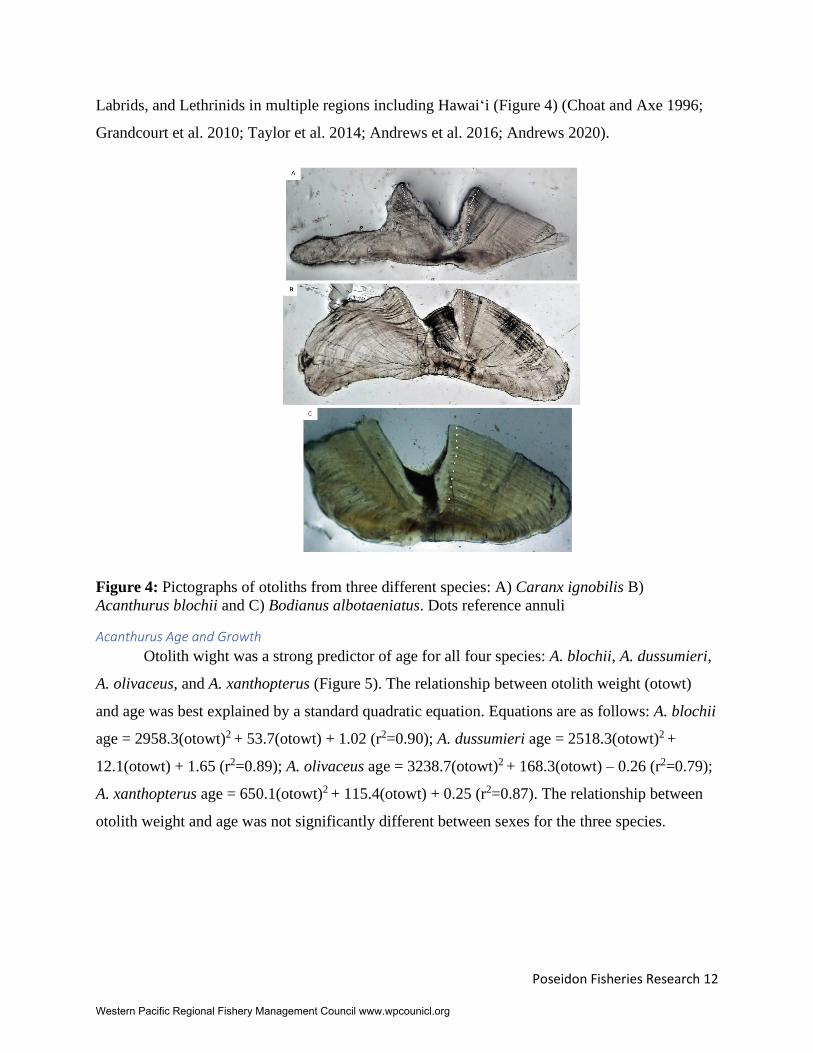
Labrids, and Lethrinids in multiple regions including Hawaiʻi (Figure 4) (Choat and Axe 1996;
Grandcourt et al. 2010; Taylor et al. 2014; Andrews et al. 2016; Andrews 2020).
Figure 4: Pictographs of otoliths from three different species: A) Caranx ignobilis B)
Acanthurus blochii and C) Bodianus albotaeniatus. Dots reference annuli
Acanthurus Age and Growth
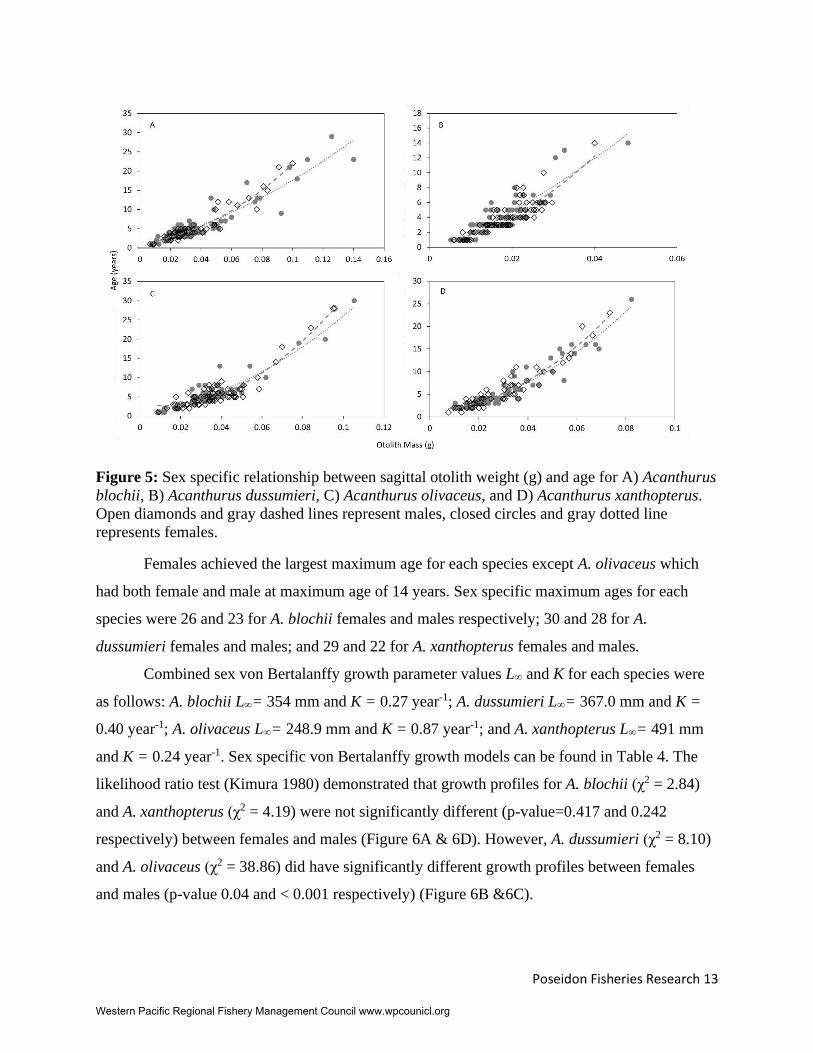
Otolith wight was a strong predictor of age for all four species: A. blochii, A. dussumieri,
A. olivaceus, and A. xanthopterus (Figure 5). The relationship between otolith weight (otowt)
and age was best explained by a standard quadratic equation. Equations are as follows: A. blochii
age = 2958.3(otowt)2 + 53.7(otowt) + 1.02 (r2=0.90); A. dussumieri age = 2518.3(otowt)2 +
12.1(otowt) + 1.65 (r2=0.89); A. olivaceus age = 3238.7(otowt)2 + 168.3(otowt) – 0.26 (r2=0.79);
A. xanthopterus age = 650.1(otowt)2 + 115.4(otowt) + 0.25 (r2=0.87). The relationship between
otolith weight and age was not significantly different between sexes for the three species.
Western Pacific Regional Fishery Management Council www.wpcounicl.org
Poseidon Fisheries Research 13
Figure 5: Sex specific relationship between sagittal otolith weight (g) and age for A) Acanthurus
blochii, B) Acanthurus dussumieri, C) Acanthurus olivaceus, and D) Acanthurus xanthopterus.
Open diamonds and gray dashed lines represent males, closed circles and gray dotted line
represents females.
Females achieved the largest maximum age for each species except A. olivaceus which
had both female and male at maximum age of 14 years. Sex specific maximum ages for each
species were 26 and 23 for A. blochii females and males respectively; 30 and 28 for A.
dussumieri females and males; and 29 and 22 for A. xanthopterus females and males.
Combined sex von Bertalanffy growth parameter values L∞ and K for each species were
as follows: A. blochii L∞= 354 mm and K = 0.27 year-1; A. dussumieri L∞= 367.0 mm and K =
0.40 year-1; A. olivaceus L∞= 248.9 mm and K = 0.87 year-1; and A. xanthopterus L∞= 491 mm
and K = 0.24 year-1. Sex specific von Bertalanffy growth models can be found in Table 4. The
likelihood ratio test (Kimura 1980) demonstrated that growth profiles for A. blochii (χ2 = 2.84)
and A. xanthopterus (χ2 = 4.19) were not significantly different (p-value=0.417 and 0.242
respectively) between females and males (Figure 6A & 6D). However, A. dussumieri (χ2 = 8.10)
and A. olivaceus (χ2 = 38.86) did have significantly different growth profiles between females
and males (p-value 0.04 and < 0.001 respectively) (Figure 6B &6C).
Western Pacific Regional Fishery Management Council www.wpcounicl.org

Poseidon Fisheries Research 14
Figure 6: Sex specific and combined von Bertalanffy growth curves for A) Acanthurus blochii,
B) Acanthurus dussumieri; C) Acanthurus olivaceus, and D) Acanthurus xanthopterus. Open
diamonds=males, closed circles = females, black triangles=unknown sex, gray lines represent
best fit growth curve for males (dashed) and females (dotted). Solid line represents combined
best fit curve for both sexes. See Table 4 for parameter estimates.
Three of the four Acanthurids studied in this project had similar longevities to those aged
in the Great Barrier Reef (GBR). Both Hawaiʻi and the GBR have similar sea-surface
temperatures which is a significant factor in determining the life-span of species (Munch and
Salinas 2009; Taylor et al. 2019). The main outlier in terms of longevity was A. olivaceus. The
maximum age calculated in this study for A. olivaceus was 14 years, half that of the other three
species and 21 years less than the estimate from the GBR. Based on longevities of other
Acanthurids from Hawaiʻi and around the Pacific, A. olivaceus may live longer than this study
found, but the oldest individuals may not have been captured during the sampling process.
Western Pacific Regional Fishery Management Council www.wpcounicl.org
Poseidon Fisheries Research 15
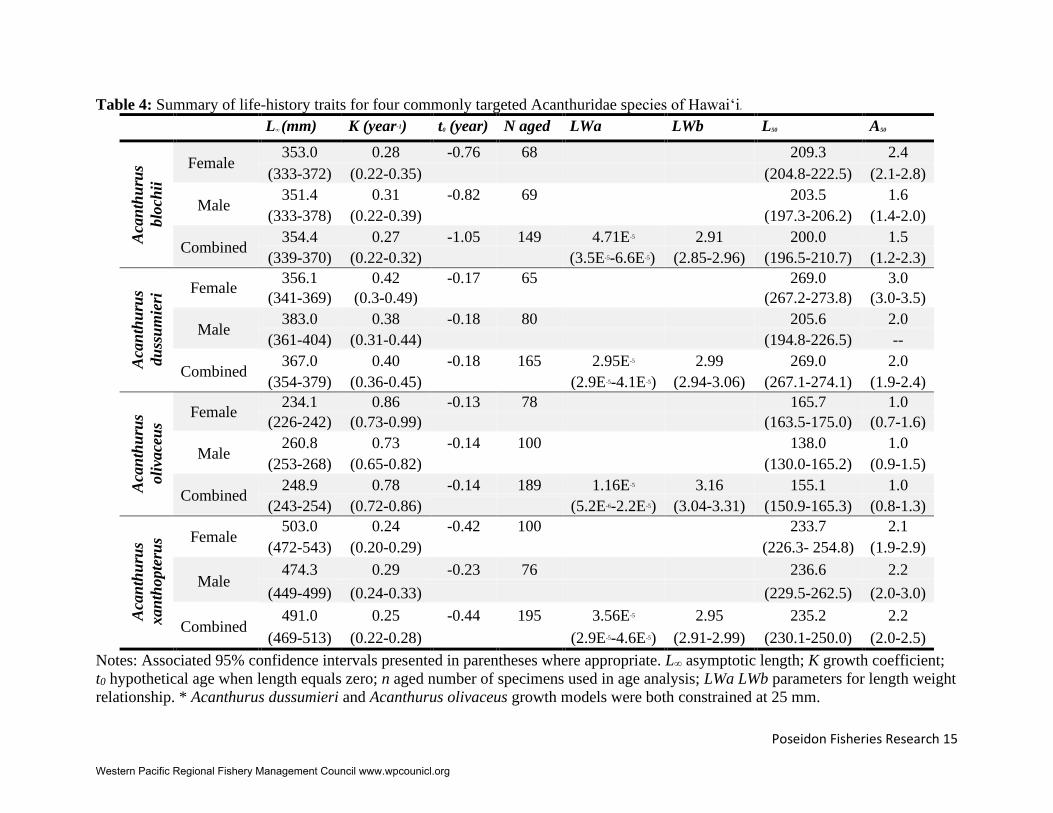
Table 4: Summary of life-history traits for four commonly targeted Acanthuridae species of Hawaiʻi. L∞ (mm) K (year-1) t0 (year) N aged LWa LWb L50 A50
Aca
nth
uru
s
blo
chii
Female
353.0 0.28 -0.76 68
209.3 2.4
(333-372) (0.22-0.35)
(204.8-222.5) (2.1-2.8)
Male 351.4 0.31 -0.82 69
203.5 1.6
(333-378) (0.22-0.39)
(197.3-206.2) (1.4-2.0)
Combined 354.4 0.27 -1.05 149 4.71E-5 2.91 200.0 1.5
(339-370) (0.22-0.32)
(3.5E-5-6.6E-5) (2.85-2.96) (196.5-210.7) (1.2-2.3)
Aca
nth
uru
s
du
ssu
mie
ri Female
356.1 0.42 -0.17 65
269.0 3.0
(341-369) (0.3-0.49)
(267.2-273.8) (3.0-3.5)
Male 383.0 0.38 -0.18 80
205.6 2.0
(361-404) (0.31-0.44)
(194.8-226.5) --
Combined 367.0 0.40 -0.18 165 2.95E-5 2.99 269.0 2.0
(354-379) (0.36-0.45)
(2.9E-5-4.1E-5) (2.94-3.06) (267.1-274.1) (1.9-2.4)
Aca
nth
uru
s
oli
vace
us
Female 234.1 0.86 -0.13 78
165.7 1.0
(226-242) (0.73-0.99)
(163.5-175.0) (0.7-1.6)
Male 260.8 0.73 -0.14 100
138.0 1.0
(253-268) (0.65-0.82)
(130.0-165.2) (0.9-1.5)
Combined 248.9 0.78 -0.14 189 1.16E-5 3.16 155.1 1.0
(243-254) (0.72-0.86)
(5.2E-6-2.2E-5) (3.04-3.31) (150.9-165.3) (0.8-1.3)
Aca
nth
uru
s
xan
thopte
rus Female
503.0 0.24 -0.42 100
233.7 2.1
(472-543) (0.20-0.29)
(226.3- 254.8) (1.9-2.9)
Male 474.3 0.29 -0.23 76
236.6 2.2
(449-499) (0.24-0.33)
(229.5-262.5) (2.0-3.0)
Combined 491.0 0.25 -0.44 195 3.56E-5 2.95 235.2 2.2
(469-513) (0.22-0.28)
(2.9E-5-4.6E-5) (2.91-2.99) (230.1-250.0) (2.0-2.5)
Notes: Associated 95% confidence intervals presented in parentheses where appropriate. L∞ asymptotic length; K growth coefficient;
t0 hypothetical age when length equals zero; n aged number of specimens used in age analysis; LWa LWb parameters for length weight
relationship. * Acanthurus dussumieri and Acanthurus olivaceus growth models were both constrained at 25 mm.
Western Pacific Regional Fishery Management Council www.wpcounicl.org
Poseidon Fisheries Research 16
A 2016 Hawaii stock assessment calculated the A. blochii stock to be overfished/
overfishing based on the Spawning Potential Ratio using average catch length and inferred life
history parameters from the GBR (Nadon 2017). However, average capture size used in the
assessment was set at 299 mm, 10 mm smaller than the average catch size this study found from
a year of market sampling. The assessment also used an L50 60 mm larger than what was
calculated in this study, and an L∞ 10 mm larger than this study. Using the localized data could
potentially change the stock status of A. blochii.
Reproduction
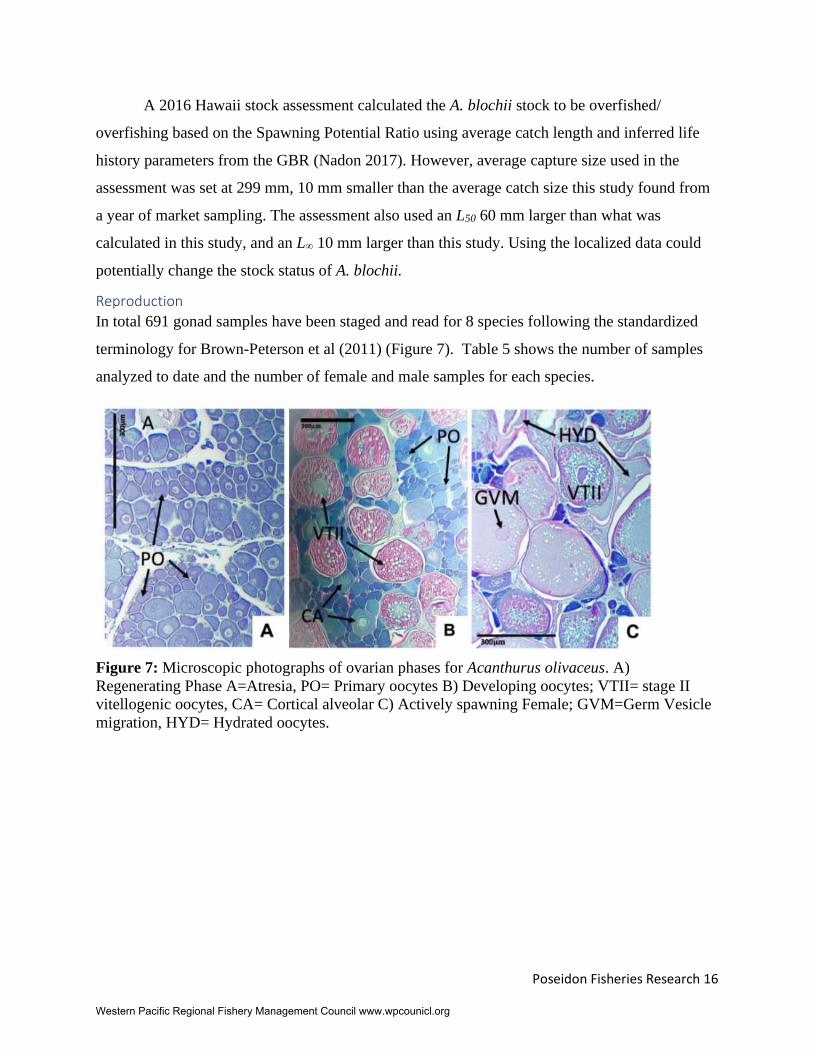
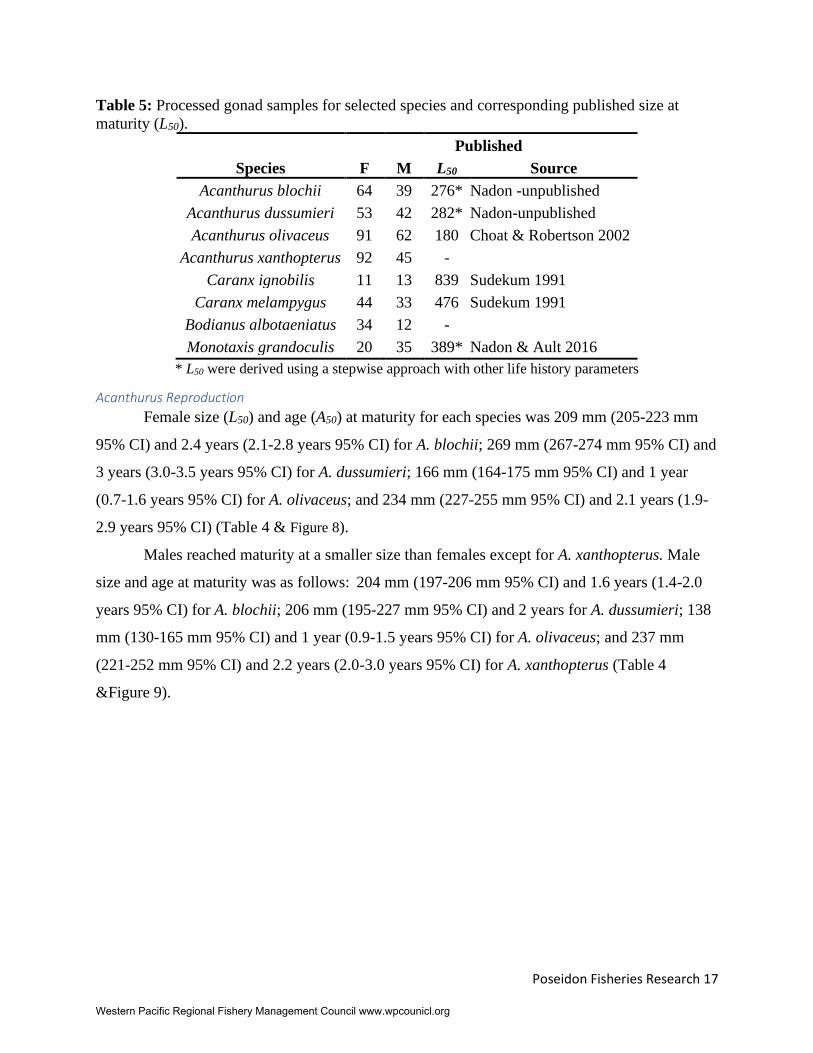
In total 691 gonad samples have been staged and read for 8 species following the standardized
terminology for Brown-Peterson et al (2011) (Figure 7). Table 5 shows the number of samples
analyzed to date and the number of female and male samples for each species.
Figure 7: Microscopic photographs of ovarian phases for Acanthurus olivaceus. A)
Regenerating Phase A=Atresia, PO= Primary oocytes B) Developing oocytes; VTII= stage II
vitellogenic oocytes, CA= Cortical alveolar C) Actively spawning Female; GVM=Germ Vesicle
migration, HYD= Hydrated oocytes.
Western Pacific Regional Fishery Management Council www.wpcounicl.org
Poseidon Fisheries Research 17
Table 5: Processed gonad samples for selected species and corresponding published size at
maturity (L50).
Species F M
Published . . .
L50 Source
Acanthurus blochii 64 39 276* Nadon -unpublished
Acanthurus dussumieri 53 42 282* Nadon-unpublished
Acanthurus olivaceus 91 62 180 Choat & Robertson 2002
Acanthurus xanthopterus 92 45 -
Caranx ignobilis 11 13 839 Sudekum 1991
Caranx melampygus 44 33 476 Sudekum 1991
Bodianus albotaeniatus 34 12 -
Monotaxis grandoculis 20 35 389* Nadon & Ault 2016
* L50 were derived using a stepwise approach with other life history parameters
Acanthurus Reproduction
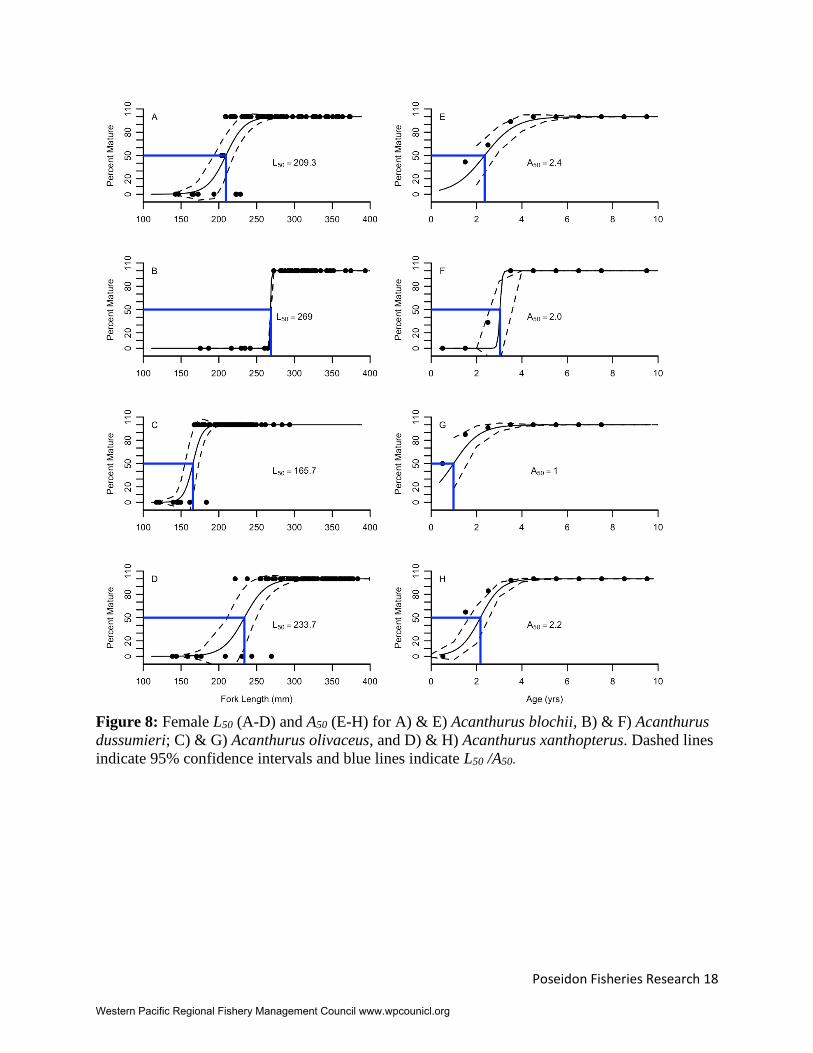
Female size (L50) and age (A50) at maturity for each species was 209 mm (205-223 mm
95% CI) and 2.4 years (2.1-2.8 years 95% CI) for A. blochii; 269 mm (267-274 mm 95% CI) and
3 years (3.0-3.5 years 95% CI) for A. dussumieri; 166 mm (164-175 mm 95% CI) and 1 year
(0.7-1.6 years 95% CI) for A. olivaceus; and 234 mm (227-255 mm 95% CI) and 2.1 years (1.9-
2.9 years 95% CI) (Table 4 & Figure 8).
Males reached maturity at a smaller size than females except for A. xanthopterus. Male
size and age at maturity was as follows: 204 mm (197-206 mm 95% CI) and 1.6 years (1.4-2.0
years 95% CI) for A. blochii; 206 mm (195-227 mm 95% CI) and 2 years for A. dussumieri; 138
mm (130-165 mm 95% CI) and 1 year (0.9-1.5 years 95% CI) for A. olivaceus; and 237 mm
(221-252 mm 95% CI) and 2.2 years (2.0-3.0 years 95% CI) for A. xanthopterus (Table 4
&Figure 9).
Western Pacific Regional Fishery Management Council www.wpcounicl.org
Poseidon Fisheries Research 18
Figure 8: Female L50 (A-D) and A50 (E-H) for A) & E) Acanthurus blochii, B) & F) Acanthurus
dussumieri; C) & G) Acanthurus olivaceus, and D) & H) Acanthurus xanthopterus. Dashed lines
indicate 95% confidence intervals and blue lines indicate L50 /A50.
Western Pacific Regional Fishery Management Council www.wpcounicl.org

Poseidon Fisheries Research 19
Figure 9: Male L50 (A-D) and A50 (E-H) for A) & E) Acanthurus blochii, B) & F) Acanthurus
dussumieri; C) & G) Acanthurus olivaceus, and D) & H) Acanthurus xanthopterus. Dashed lines
indicate 95% confidence intervals and blue lines indicate L50 /A50.
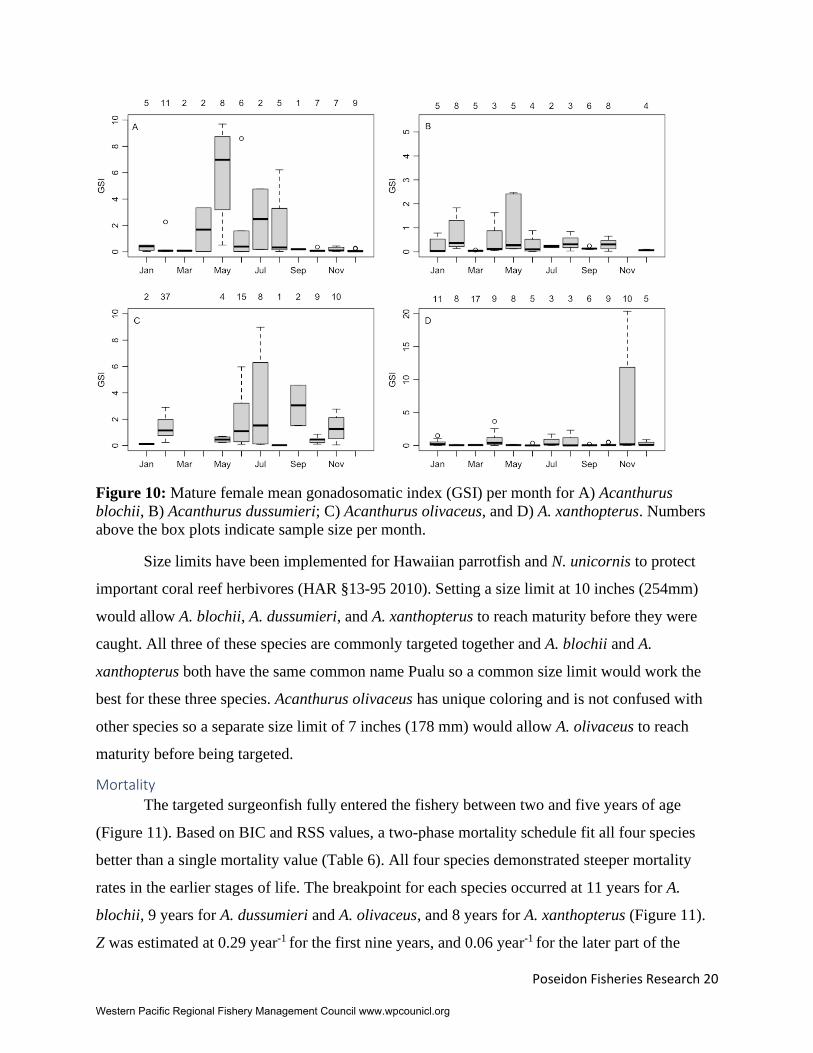
Spawning season was assessed for all four Acanthurids and was found to be highly
variable between and within species, with spawning activity occurring throughout the year
(Figure 10). Our sampling was unable to determine the spawning season of A. xanthopterus as
the GSI remained low throughout the year and we only had four histology samples that were
spawning capable or actively spawning.
Western Pacific Regional Fishery Management Council www.wpcounicl.org
Poseidon Fisheries Research 20
Figure 10: Mature female mean gonadosomatic index (GSI) per month for A) Acanthurus
blochii, B) Acanthurus dussumieri; C) Acanthurus olivaceus, and D) A. xanthopterus. Numbers
above the box plots indicate sample size per month.
Size limits have been implemented for Hawaiian parrotfish and N. unicornis to protect
important coral reef herbivores (HAR §13-95 2010). Setting a size limit at 10 inches (254mm)
would allow A. blochii, A. dussumieri, and A. xanthopterus to reach maturity before they were
caught. All three of these species are commonly targeted together and A. blochii and A.
xanthopterus both have the same common name Pualu so a common size limit would work the
best for these three species. Acanthurus olivaceus has unique coloring and is not confused with
other species so a separate size limit of 7 inches (178 mm) would allow A. olivaceus to reach
maturity before being targeted.
Mortality
The targeted surgeonfish fully entered the fishery between two and five years of age
(Figure 11). Based on BIC and RSS values, a two-phase mortality schedule fit all four species
better than a single mortality value (Table 6). All four species demonstrated steeper mortality
rates in the earlier stages of life. The breakpoint for each species occurred at 11 years for A.
blochii, 9 years for A. dussumieri and A. olivaceus, and 8 years for A. xanthopterus (Figure 11).
Z was estimated at 0.29 year-1 for the first nine years, and 0.06 year-1 for the later part of the
Western Pacific Regional Fishery Management Council www.wpcounicl.org
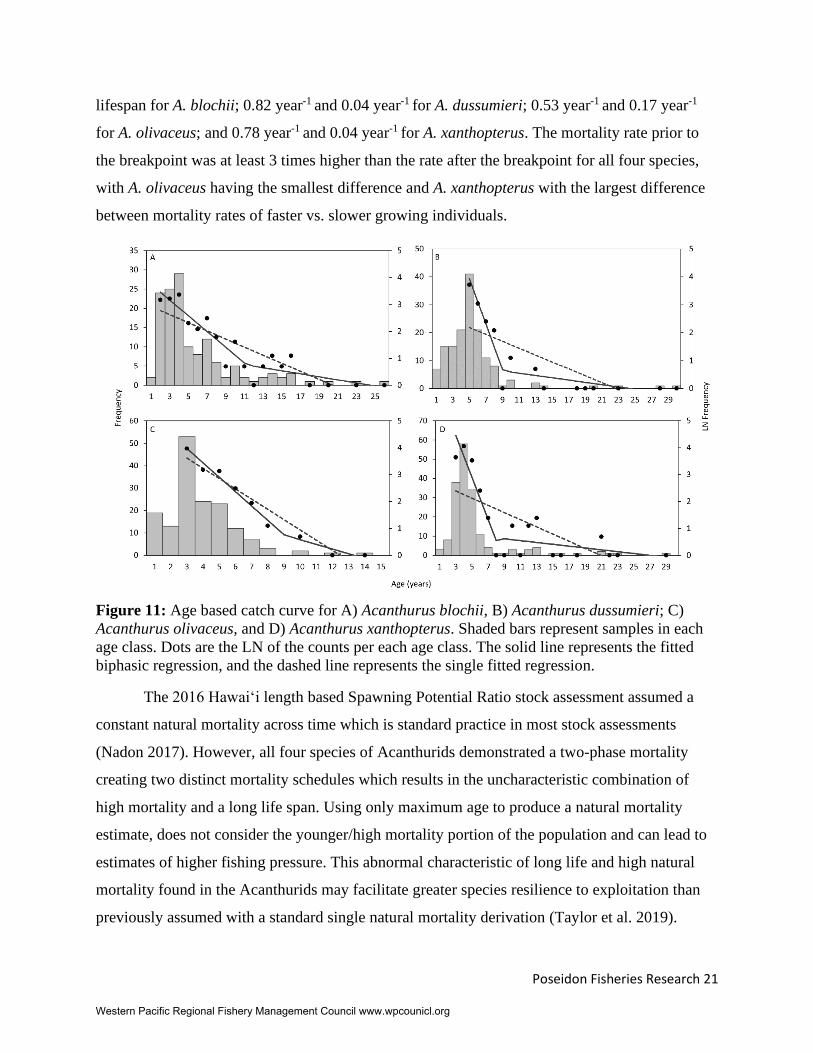
Poseidon Fisheries Research 21
lifespan for A. blochii; 0.82 year-1 and 0.04 year-1 for A. dussumieri; 0.53 year-1 and 0.17 year-1
for A. olivaceus; and 0.78 year-1 and 0.04 year-1 for A. xanthopterus. The mortality rate prior to
the breakpoint was at least 3 times higher than the rate after the breakpoint for all four species,
with A. olivaceus having the smallest difference and A. xanthopterus with the largest difference
between mortality rates of faster vs. slower growing individuals.
Figure 11: Age based catch curve for A) Acanthurus blochii, B) Acanthurus dussumieri; C)
Acanthurus olivaceus, and D) Acanthurus xanthopterus. Shaded bars represent samples in each
age class. Dots are the LN of the counts per each age class. The solid line represents the fitted
biphasic regression, and the dashed line represents the single fitted regression.
The 2016 Hawaiʻi length based Spawning Potential Ratio stock assessment assumed a
constant natural mortality across time which is standard practice in most stock assessments
(Nadon 2017). However, all four species of Acanthurids demonstrated a two-phase mortality
creating two distinct mortality schedules which results in the uncharacteristic combination of
high mortality and a long life span. Using only maximum age to produce a natural mortality
estimate, does not consider the younger/high mortality portion of the population and can lead to
estimates of higher fishing pressure. This abnormal characteristic of long life and high natural
mortality found in the Acanthurids may facilitate greater species resilience to exploitation than
previously assumed with a standard single natural mortality derivation (Taylor et al. 2019).
Western Pacific Regional Fishery Management Council www.wpcounicl.org
Poseidon Fisheries Research 22
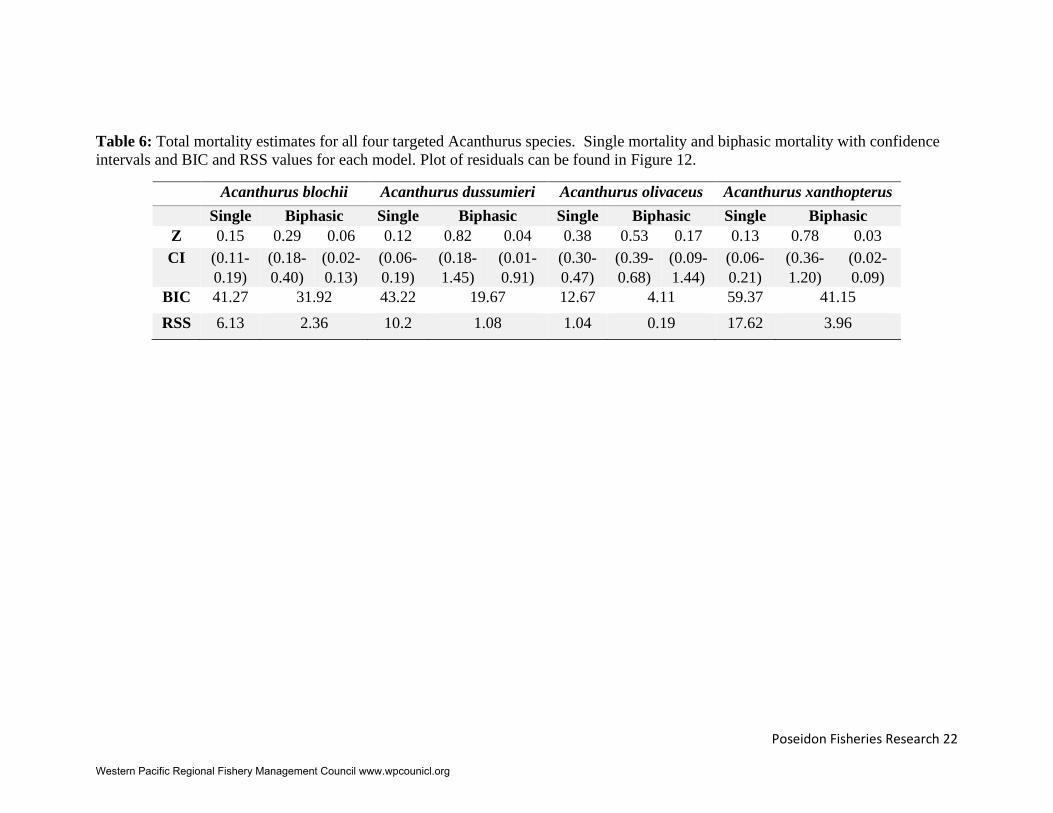
Table 6: Total mortality estimates for all four targeted Acanthurus species. Single mortality and biphasic mortality with confidence
intervals and BIC and RSS values for each model. Plot of residuals can be found in Figure 12.
Acanthurus blochii Acanthurus dussumieri Acanthurus olivaceus Acanthurus xanthopterus
Single Biphasic Single Biphasic Single Biphasic Single Biphasic
Z 0.15 0.29 0.06 0.12 0.82 0.04 0.38 0.53 0.17 0.13 0.78 0.03
CI (0.11-
0.19)
(0.18-
0.40)
(0.02-
0.13)
(0.06-
0.19)
(0.18-
1.45)
(0.01-
0.91)
(0.30-
0.47)
(0.39-
0.68)
(0.09-
1.44)
(0.06-
0.21)
(0.36-
1.20)
(0.02-
0.09)
BIC 41.27 31.92 43.22 19.67 12.67 4.11 59.37 41.15
RSS 6.13 2.36 10.2 1.08 1.04 0.19 17.62 3.96
Western Pacific Regional Fishery Management Council www.wpcounicl.org
Poseidon Fisheries Research 23
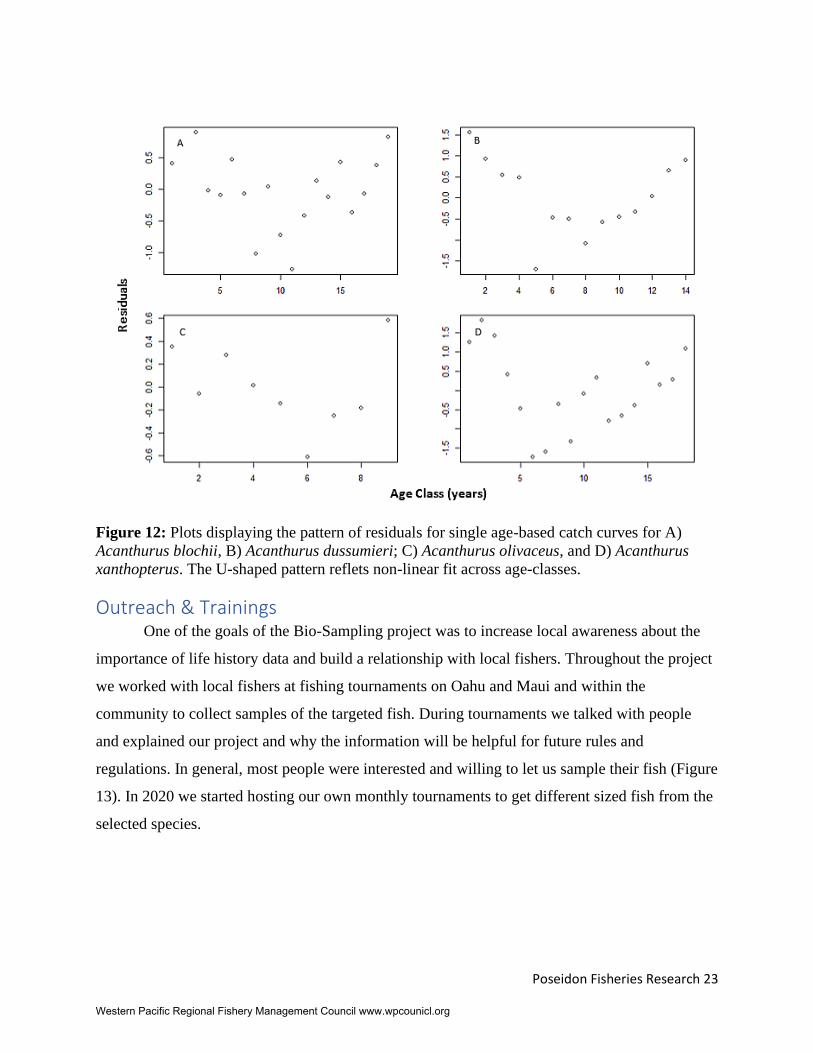
Figure 12: Plots displaying the pattern of residuals for single age-based catch curves for A)
Acanthurus blochii, B) Acanthurus dussumieri; C) Acanthurus olivaceus, and D) Acanthurus
xanthopterus. The U-shaped pattern reflets non-linear fit across age-classes.
Outreach & Trainings One of the goals of the Bio-Sampling project was to increase local awareness about the
importance of life history data and build a relationship with local fishers. Throughout the project
we worked with local fishers at fishing tournaments on Oahu and Maui and within the
community to collect samples of the targeted fish. During tournaments we talked with people
and explained our project and why the information will be helpful for future rules and
regulations. In general, most people were interested and willing to let us sample their fish (Figure
13). In 2020 we started hosting our own monthly tournaments to get different sized fish from the
selected species.
Western Pacific Regional Fishery Management Council www.wpcounicl.org

Poseidon Fisheries Research 24
Figure 13: Photos of various tournaments and outreach events
Aside from tournaments, we talked about our project and shared initial results by
speaking with different classes at Hawaii Pacific University (HPU) University of Hawaii (Manoa
and Maui), and a class at Kamehameha High School on Maui. We also talked at local fishing
clubs throughout Oahu; the Fishers Forum, had articles in Hawaii Fishing News, been on Keiki
Fishing Adventures, been on Go Fish with Mike Buck, and via social media on Facebook and
Instagram. Some of the outreach materials we produced can be found in Appendix 2.
Throughout this program we worked to build local capacity by training and mentoring
local college students. We trained 10 college students from HPU, UH Maui College and UH Hilo
College teaching students fish ID through market surveys, fish dissections, grinding and
analyzing otoliths for aging, and analyzing gonads for reproduction. We also worked with a high
Western Pacific Regional Fishery Management Council www.wpcounicl.org

Poseidon Fisheries Research 25
school Marine Biology class at Kamehameha School Maui to do market sampling and fish IDs
for us.
Acknowledgements Funding for this project was provided by the Western Pacific Regional Fishery
Management Council through its cooperative agreement with the NOAA Coral Reef
Conservation Program (Award No. NA17NMF4410251). Mahalo to the three fish markets on
Oahu: Da Fish Market in Waipahu, Rainbow Farm and Produce in Kalihi and Tamashiro Market
in Kalihi and the three fish markets on Maui: Oki’s Seafood Corner-Kahalui, Pacific Fish
Market-Wailuku, and Paradise Supermarket-Kahalui who allowed us to sample their catch.
Thanks to Matt Ramsey from Conservation International Hawaii for supplying small juvenile
samples for size at settlement. Thanks to Dr. Eva Schemmel and Dr. Brett Taylor for donating
your time and expertise in gonads and otoliths to ensure we were doing everything correctly.
Mahalo to all the fishers on Oahu and Maui who caught fish for us in this study, without your
support we would not have gotten the smaller immature sample sizes. And finally thank you to
all our HPU interns who helped us in the lab dissecting fish, preparing and aging otoliths, and
reading prepared gonad slides.
Works Cited Andrews AH (2020) Giant trevally (Caranx ignobilis) of Hawaiian Islands can live 25 years. Mar
Freshw Res 71:1367–1372
Andrews AH, DeMartini EE, Eble JA, Taylor BM, Lou DC, Humphreys RL (2016) Age and
growth of bluespine unicornfish ( Naso unicornis ): a half-century life-span for a keystone
browser, with a novel approach to bomb radiocarbon dating in the Hawaiian Islands. Can J
Fish Aquat Sci 73:1575–1586
Brown-Peterson NJ, Wyanski DM, Saborido-Rey F, Macewicz BJ, Lowerre-Barbieri SK (2011)
A standardized terminology for describing reproductive development in fishes. Mar Coast
Fish 3:52–70
Choat J, Axe L (1996) Growth and longevity in acanthurid fishes; an analysis of otolith
increments. Mar Ecol Prog Ser 134:15–26
Choat JH, Robertson DR (2002) Age-Based Studies on Coral Reef Fishes. Coral Reef Fishes:
dynamics and diversity in a comple ecosystem. Academic Press, San Diego, California,
USA, pp 57–80
Grafeld S, Oleson KLL, Teneva L, Kittinger JN (2017) Follow that fish: Uncovering the hidden
blue economy in coral reef fisheries. PLoS One 12:1–25
Grandcourt E, Al Abdessalaam TZ, Francis F, Al Shamsi A (2010) Age-based life history
parameters and status assessments of by-catch species (Lethrinus borbonicus, Lethrinus
Western Pacific Regional Fishery Management Council www.wpcounicl.org
Poseidon Fisheries Research 26
microdon, Pomacanthus maculosus and Scolopsis taeniatus) in the southern Arabian Gulf. J
Appl Ichthyol 26:381–389
Hawaii Division of Aquatic Resources (2018) Commercial Marine Landings Summary Trend
Report.
Hawaii Divison of Land and Natural Resources (2010) Title 13 Subtitle 4 Chapter 95: Rules
Regulating the Taking and Selling of Certain Marine Resources.
Kimura DK (1980) Likelihood methods for the von Bertalanffy Growth Curve. Fish Bull
77:765–776
Muggeo VM. (2020) segmented: Regression Models with Break-Ponts/ Change-Points
Estimation.
Munch SB, Salinas S (2009) Latitudinal variation in lifespan within species is explained by the
metabolic theory of ecology. Proc Natl Acad Sci 106:13860–13864
Nadon MO (2017) Stock assessment of the coral reef fishes of Hawaii, 2016. NOAA Technical
Memorandum, NMFS-PIFSC-60.
Ogle D, Wheeler P, Dinno A (2019) FSA: Fisheries Stock Analysis.
Pardee C, Taylor BM, Felise S, Ochavillo D, Cuetos-Bueno J (2020) Growth and maturation of
three commercially important coral reef species from American Samoa. Fish Sci
R Core Team (2019) R: A Language and Environment for Statistical Computing.
Ricker W (1975) Computation and interpretation of biological statistics of fish populations.
Schneider JC, Laarman PW, Gowing H (2000) Chapter 17: Length-Weight Relationships. In:
Schneider J.C. (eds) Manual of Fisheries survey methods II: with periodic updates.
Michigan Department of Natural Resources, Ann Arbor,
Sudekum AE, Parrish JD, Radtke RL, Ralston S (1991) Life History and Ecology of Large Jacks
in Undisturbed, Shallow, Oceanic Communities*. Fish Bull US 89:493–513
Sullivan-Brown J, Bisher ME, Burdine RD (2011) Embedding, serial sectioning and staining of
zebrafish embryos using JB-4 resin. Nat Protoc 6:46–55
Taylor BM, Choat JH, DeMartini EE, Hoey AS, Marshell A, Priest MA, Rhodes KL, Meekan
MG (2019) Demographic plasticity facilitates ecological and economic resilience in a
commercially important reef fish. J Anim Ecol 1–13
Taylor BM, Rhodes KL, Marshell a., McIlwain JL (2014) Age-based demographic and
reproductive assessment of orangespine Naso lituratus and bluespine Naso unicornis
unicornfishes. J Fish Biol 85:901–916
Wilson DT, McCormick MI (1999) Microstructure of settlement-marks in the otoliths of tropical
reef fishes. Mar Biol 134:29–41
Western Pacific Regional Fishery Management Council www.wpcounicl.org
Poseidon Fisheries Research A1: 1
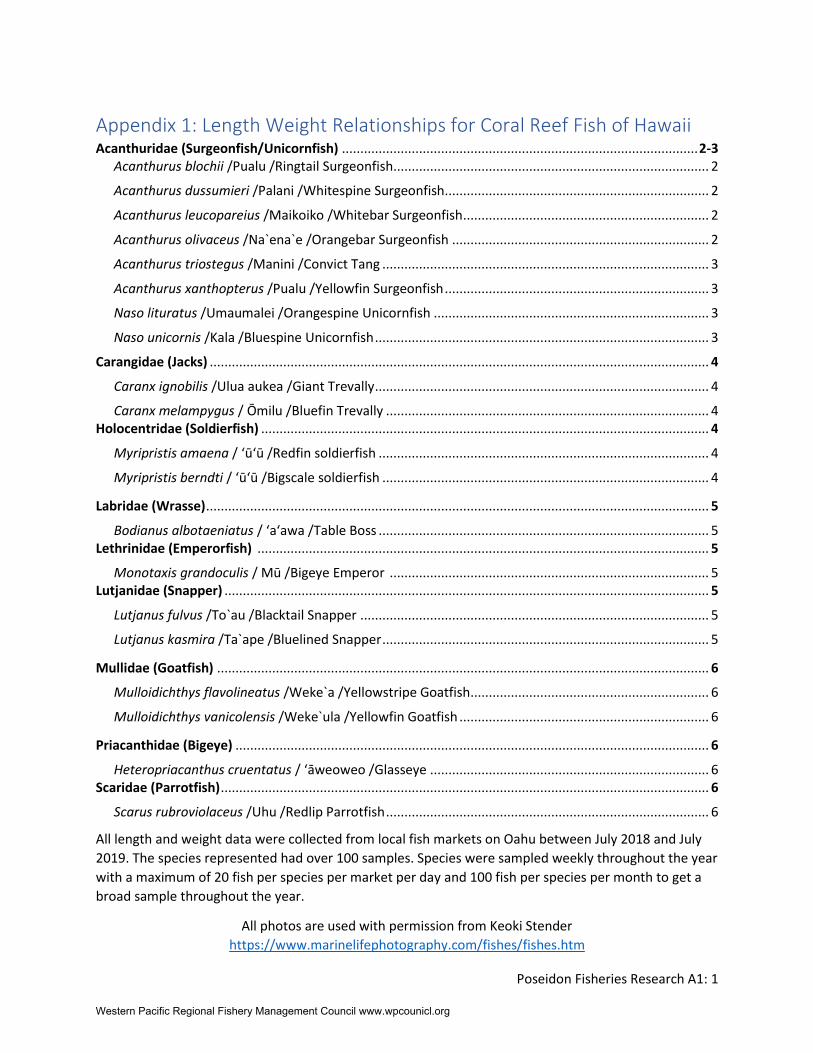
Appendix 1: Length Weight Relationships for Coral Reef Fish of Hawaii
All length and weight data were collected from local fish markets on Oahu between July 2018 and July
2019. The species represented had over 100 samples. Species were sampled weekly throughout the year
with a maximum of 20 fish per species per market per day and 100 fish per species per month to get a
broad sample throughout the year.
All photos are used with permission from Keoki Stender
https://www.marinelifephotography.com/fishes/fishes.htm
Acanthuridae (Surgeonfish/Unicornfish) ................................................................................................. 2-3 Acanthurus blochii /Pualu /Ringtail Surgeonfish ...................................................................................... 2
Acanthurus dussumieri /Palani /Whitespine Surgeonfish........................................................................ 2
Acanthurus leucopareius /Maikoiko /Whitebar Surgeonfish ................................................................... 2
Acanthurus olivaceus /Na`ena`e /Orangebar Surgeonfish ...................................................................... 2
Acanthurus triostegus /Manini /Convict Tang ......................................................................................... 3
Acanthurus xanthopterus /Pualu /Yellowfin Surgeonfish ........................................................................ 3
Naso lituratus /Umaumalei /Orangespine Unicornfish ........................................................................... 3
Naso unicornis /Kala /Bluespine Unicornfish ........................................................................................... 3
Carangidae (Jacks) ........................................................................................................................................ 4
Caranx ignobilis /Ulua aukea /Giant Trevally ........................................................................................... 4
Caranx melampygus / Ōmilu /Bluefin Trevally ........................................................................................ 4 Holocentridae (Soldierfish) .......................................................................................................................... 4
Myripristis amaena / ʻūʻū /Redfin soldierfish .......................................................................................... 4
Myripristis berndti / ʻūʻū /Bigscale soldierfish ......................................................................................... 4
Labridae (Wrasse) ......................................................................................................................................... 5
Bodianus albotaeniatus / ʻaʻawa /Table Boss .......................................................................................... 5 Lethrinidae (Emperorfish) ........................................................................................................................... 5
Monotaxis grandoculis / Mū /Bigeye Emperor ....................................................................................... 5 Lutjanidae (Snapper) .................................................................................................................................... 5
Lutjanus fulvus /To`au /Blacktail Snapper ............................................................................................... 5
Lutjanus kasmira /Ta`ape /Bluelined Snapper ......................................................................................... 5
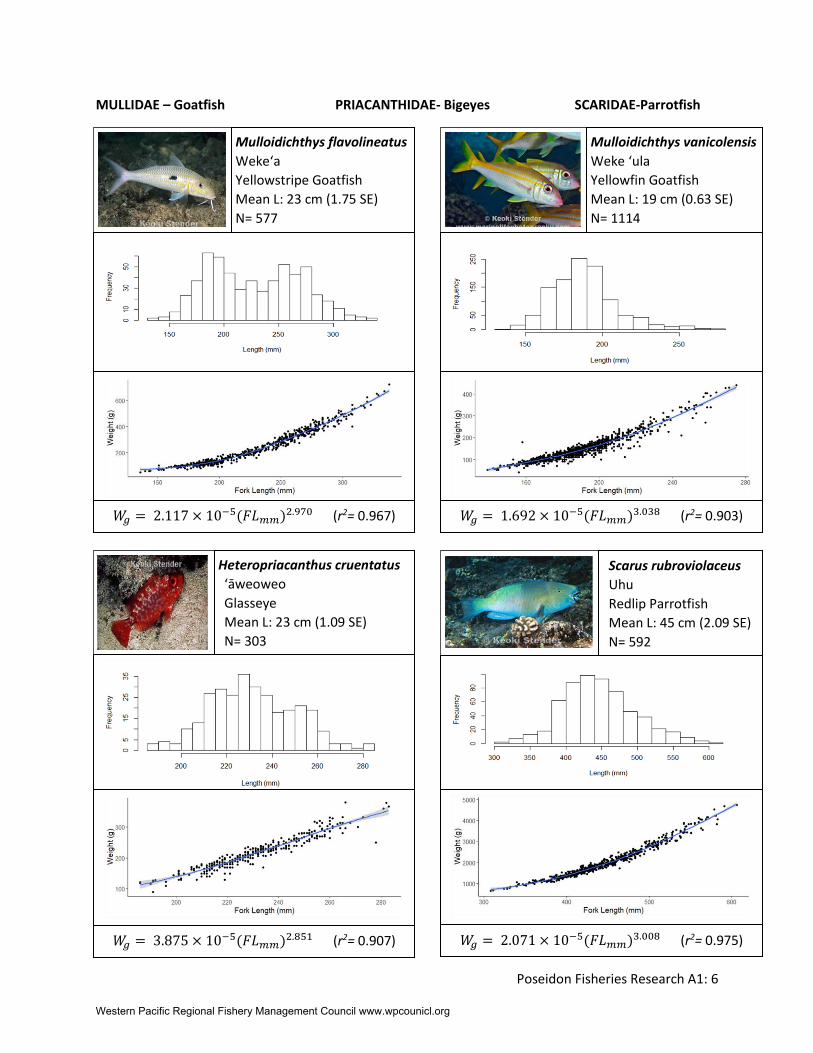
Mullidae (Goatfish) ...................................................................................................................................... 6
Mulloidichthys flavolineatus /Weke`a /Yellowstripe Goatfish................................................................. 6
Mulloidichthys vanicolensis /Weke`ula /Yellowfin Goatfish .................................................................... 6
Priacanthidae (Bigeye) ................................................................................................................................. 6
Heteropriacanthus cruentatus / ʻāweoweo /Glasseye ............................................................................ 6 Scaridae (Parrotfish) ..................................................................................................................................... 6
Scarus rubroviolaceus /Uhu /Redlip Parrotfish ........................................................................................ 6
Western Pacific Regional Fishery Management Council www.wpcounicl.org

Poseidon Fisheries Research A1: 2
ACANTHURIDAE- Surgeonfish/Unicornfish
ACANTHURIDAE -Surgeonfish/Unicornfish
Acanthurus dussumieri
Palani
Whitespine Surgeonfish
Mean L: 32 cm (SE 2.74)
N=272
Acanthurus blochii
Pualu
Ringtail Surgeonfish
Mean L: 31 cm (SE 2.40)
N=433
𝑊𝑔 = 4.706 × 10⁻⁵(𝐹𝐿𝑚𝑚)2.91 (r2= 0.917) 𝑊𝑔 = 2.953 × 10⁻⁵(𝐹𝐿𝑚𝑚)2.99 (r2= 0.977)
Acanthurus leucopareius
Maikoiko
Whitebar Surgeonfish
Mean L: 19 cm (SE 1.41)
N= 150
𝑊𝑔 = 8.592 × 10⁻⁶(𝐹𝐿𝑚𝑚)3.247 (r2= 0.891)
Acanthurus olivaceus
Na`ena`e
Orangebar Surgeonfish
Mean L: 22 cm (SE 1.92)
N= 237
𝑊𝑔 = 1.155 × 10⁻⁵(𝐹𝐿𝑚𝑚)3.157 (r2=0.943)
Western Pacific Regional Fishery Management Council www.wpcounicl.org
Poseidon Fisheries Research A1: 3
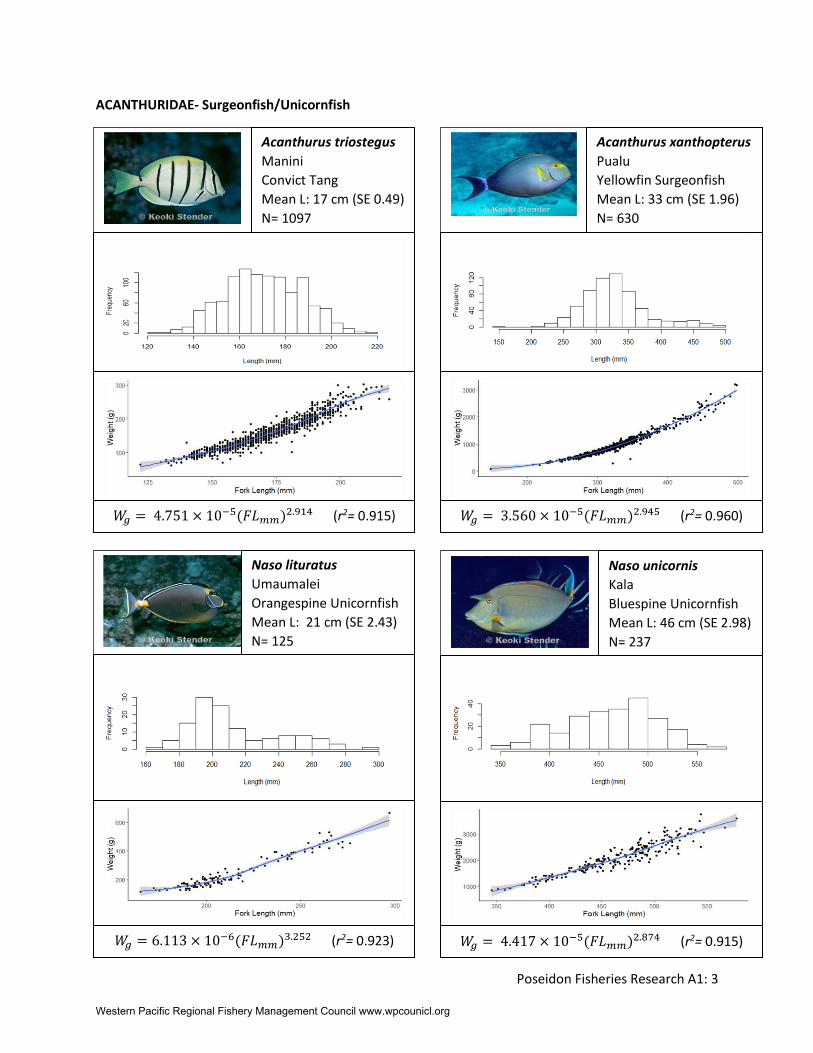
ACANTHURIDAE- Surgeonfish/Unicornfish
Acanthurus triostegus
Manini
Convict Tang
Mean L: 17 cm (SE 0.49)
N= 1097
𝑊𝑔 = 4.751 × 10⁻⁵(𝐹𝐿𝑚𝑚)2.914 (r2= 0.915)
Acanthurus xanthopterus
Pualu
Yellowfin Surgeonfish
Mean L: 33 cm (SE 1.96)
N= 630
𝑊𝑔 = 3.560 × 10⁻⁵(𝐹𝐿𝑚𝑚)2.945 (r2= 0.960)
Naso unicornis
Kala
Bluespine Unicornfish
Mean L: 46 cm (SE 2.98)
N= 237
𝑊𝑔 = 4.417 × 10⁻⁵(𝐹𝐿𝑚𝑚)2.874 (r2= 0.915)
Naso lituratus
Umaumalei
Orangespine Unicornfish
Mean L: 21 cm (SE 2.43)
N= 125
𝑊𝑔 = 6.113 × 10⁻⁶(𝐹𝐿𝑚𝑚)3.252 (r2= 0.923)
Western Pacific Regional Fishery Management Council www.wpcounicl.org
Poseidon Fisheries Research A1: 4
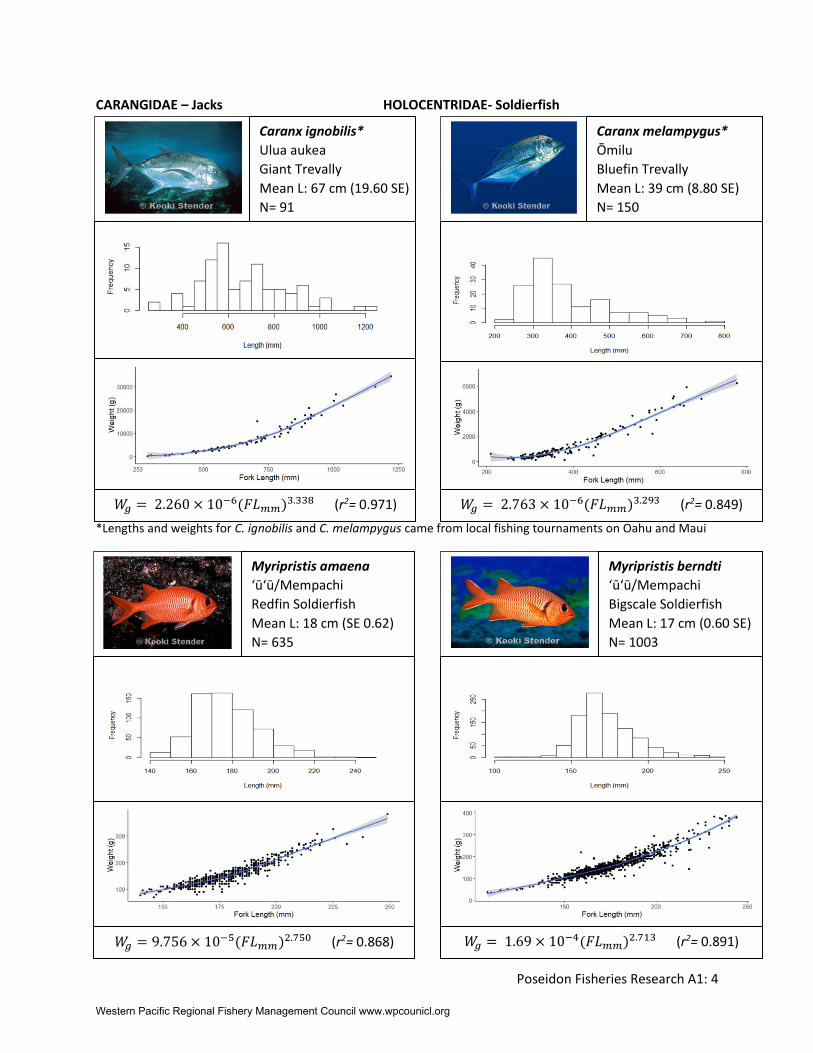
CARANGIDAE – Jacks HOLOCENTRIDAE- Soldierfish
*Lengths and weights for C. ignobilis and C. melampygus came from local fishing tournaments on Oahu and Maui
Caranx ignobilis*
Ulua aukea
Giant Trevally
Mean L: 67 cm (19.60 SE)
N= 91
𝑊𝑔 = 2.260 × 10⁻⁶(𝐹𝐿𝑚𝑚)3.338 (r2= 0.971)
Caranx melampygus*
Ōmilu
Bluefin Trevally
Mean L: 39 cm (8.80 SE)
N= 150
𝑊𝑔 = 2.763 × 10⁻⁶(𝐹𝐿𝑚𝑚)3.293 (r2= 0.849)
Myripristis berndti
ʻūʻū/Mempachi
Bigscale Soldierfish
Mean L: 17 cm (0.60 SE)
N= 1003
𝑊𝑔 = 1.69 × 10⁻⁴(𝐹𝐿𝑚𝑚)2.713 (r2= 0.891)
Myripristis amaena
ʻūʻū/Mempachi
Redfin Soldierfish
Mean L: 18 cm (SE 0.62)
N= 635
𝑊𝑔 = 9.756 × 10⁻⁵(𝐹𝐿𝑚𝑚)2.750 (r2= 0.868)
Western Pacific Regional Fishery Management Council www.wpcounicl.org
Poseidon Fisheries Research A1: 5
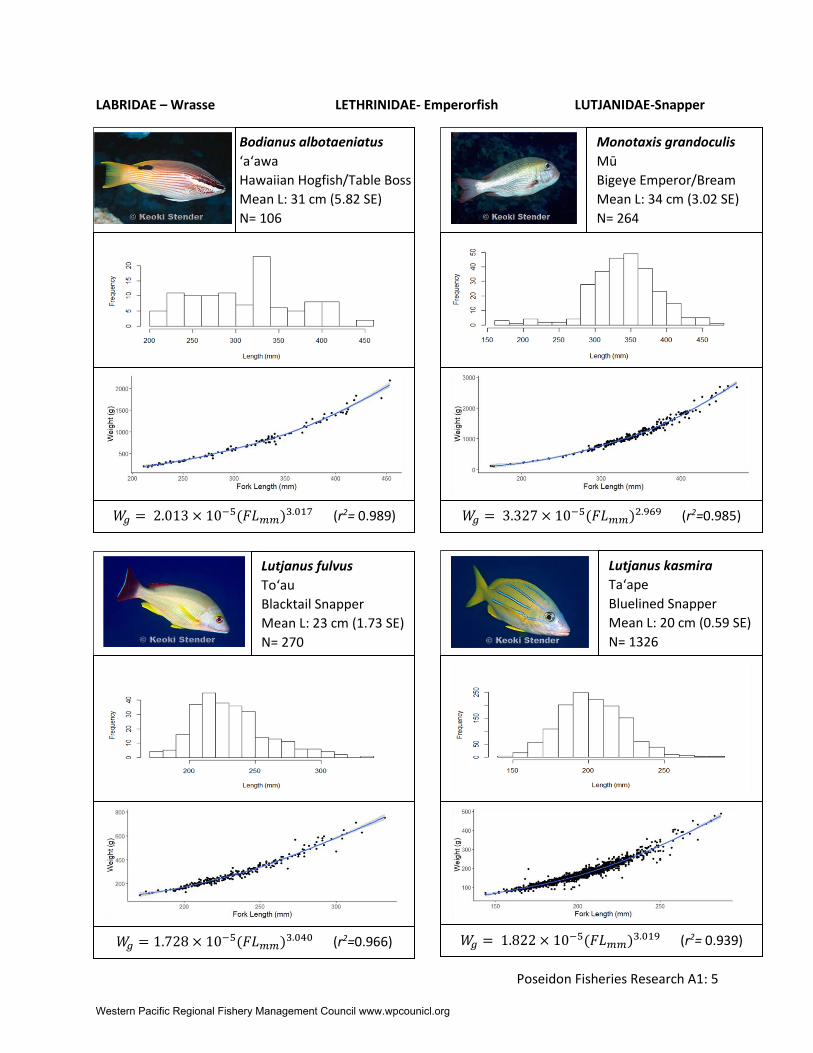
LABRIDAE – Wrasse LETHRINIDAE- Emperorfish LUTJANIDAE-Snapper
Bodianus albotaeniatus
ʻaʻawa
Hawaiian Hogfish/Table Boss
Mean L: 31 cm (5.82 SE)
N= 106
𝑊𝑔 = 2.013 × 10⁻⁵(𝐹𝐿𝑚𝑚)3.017 (r2= 0.989)
Monotaxis grandoculis
Mū
Bigeye Emperor/Bream
Mean L: 34 cm (3.02 SE)
N= 264
𝑊𝑔 = 3.327 × 10⁻⁵(𝐹𝐿𝑚𝑚)2.969 (r2=0.985)
Lutjanus kasmira
Taʻape
Bluelined Snapper
Mean L: 20 cm (0.59 SE)
N= 1326
𝑊𝑔 = 1.822 × 10⁻⁵(𝐹𝐿𝑚𝑚)3.019 (r2= 0.939)
Lutjanus fulvus
Toʻau
Blacktail Snapper
Mean L: 23 cm (1.73 SE)
N= 270
𝑊𝑔 = 1.728 × 10⁻⁵(𝐹𝐿𝑚𝑚)3.040 (r2=0.966)
Western Pacific Regional Fishery Management Council www.wpcounicl.org
Poseidon Fisheries Research A1: 6
MULLIDAE – Goatfish PRIACANTHIDAE- Bigeyes SCARIDAE-Parrotfish
Mulloidichthys flavolineatus
Wekeʻa
Yellowstripe Goatfish
Mean L: 23 cm (1.75 SE)
N= 577
𝑊𝑔 = 2.117 × 10⁻⁵(𝐹𝐿𝑚𝑚)2.970 (r2= 0.967)
Mulloidichthys vanicolensis
Weke ʻula
Yellowfin Goatfish
Mean L: 19 cm (0.63 SE)
N= 1114
𝑊𝑔 = 1.692 × 10⁻⁵(𝐹𝐿𝑚𝑚)3.038 (r2= 0.903)
Scarus rubroviolaceus
Uhu
Redlip Parrotfish
Mean L: 45 cm (2.09 SE)
N= 592
𝑊𝑔 = 2.071 × 10⁻⁵(𝐹𝐿𝑚𝑚)3.008 (r2= 0.975)
Heteropriacanthus cruentatus
ʻāweoweo
Glasseye
Mean L: 23 cm (1.09 SE)
N= 303
𝑊𝑔 = 3.875 × 10⁻⁵(𝐹𝐿𝑚𝑚)2.851 (r2= 0.907)
Western Pacific Regional Fishery Management Council www.wpcounicl.org

Poseidon Fisheries Research A2: 1
Appendix 2: Outreach Material
Western Pacific Regional Fishery Management Council www.wpcounicl.org
Poseidon Fisheries Research A2: 2
Western Pacific Regional Fishery Management Council www.wpcounicl.org
Poseidon Fisheries Research A2: 3 Western Pacific Regional Fishery Management Council www.wpcounicl.org
Poseidon Fisheries Research A2: 4
Western Pacific Regional Fishery Management Council www.wpcounicl.org