Embed Size (px)
Citation preview

Implementation of the Particle & Precursor Tagging Methodology (PPTM) for the CMAQ Modeling System: Sulfur
& Nitrogen Tagging5th Annual CMAS Conference
Friday Center, UNC-Chapel Hill, NC17 October 2006
Tom Myers, Sharon Douglas & Jay HaneyICF International, San Rafael, CA

Presentation Outline
Conceptual overview of PPTM
Implementation of PPTM for sulfur and nitrogen in the CMAQ model
Testing & example results
S tagging application for pulp & paper sector
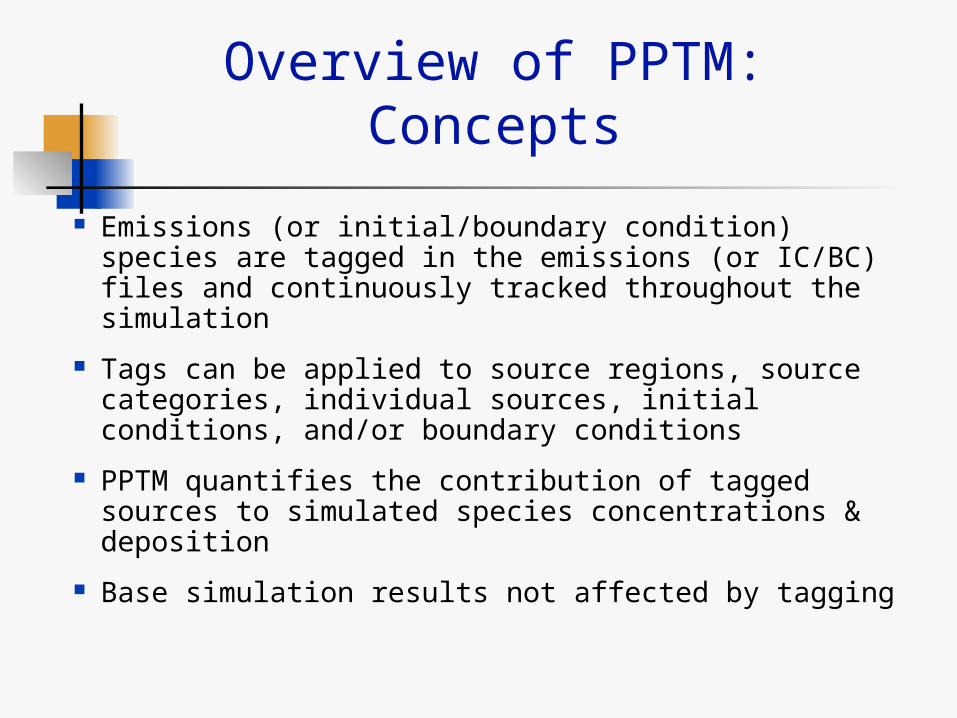
Overview of PPTM: Concepts
Emissions (or initial/boundary condition) species are tagged in the emissions (or IC/BC) files and continuously tracked throughout the simulation
Tags can be applied to source regions, source categories, individual sources, initial conditions, and/or boundary conditions
PPTM quantifies the contribution of tagged sources to simulated species concentrations & deposition
Base simulation results not affected by tagging

Overview of PPTM: Concepts
Within the model, tagging is accomplished by the addition of duplicate species (e.g., SO2_t1, SO2_t2)
Tagged species have the same properties and are subjected to the same processes (e.g., advection, chemical transformation, deposition) as the actual species
Mercury (Hg), sulfur (S), and nitrogen (N) tagging completed; tagging for elemental carbon (EC) and organic carbon (OC) under development/testing

Example Uses of PPTM for Sulfur and Nitrogen
Determine the contribution of SO2 emissions from an individual source, group of sources, or source category (e.g., electric generating units (EGUs), pulp and paper facilities) to sulfate and overall PM2.5 concentrations
Quantify/compare the contribution of NOx emissions from transportation sources, area sources (e.g., wood burning stoves) & offroad sources (e.g., IC engines, construction equipment)

Implementation of PPTM for CMAQ: Sulfur & Nitrogen
CMAQ version 4.5
Tagged S elements include: SO2, ASO4I, ASO4J, SULF (for internal tracking)
Tagged N species include: ANH4I, ANH4J, ANO3I, ANO3J, NO, NO2, NO3,
N2O5, HNO3, HONO, PNA, PAN, NTR, NH3

Implementation of PPTM for CMAQ: Sulfur & Nitrogen
Key considerations/assumptions: Linear processes simulated directly Potentially non-linear processes calculated
for total species and apportioned to tags Additional terms from some processes
saved to ensure proper allocation Gas-phase chemistry routines have
additional production & loss terms added; NO, NO2, NO3, N2O5 changes apportioned based on NOx totals for each tag
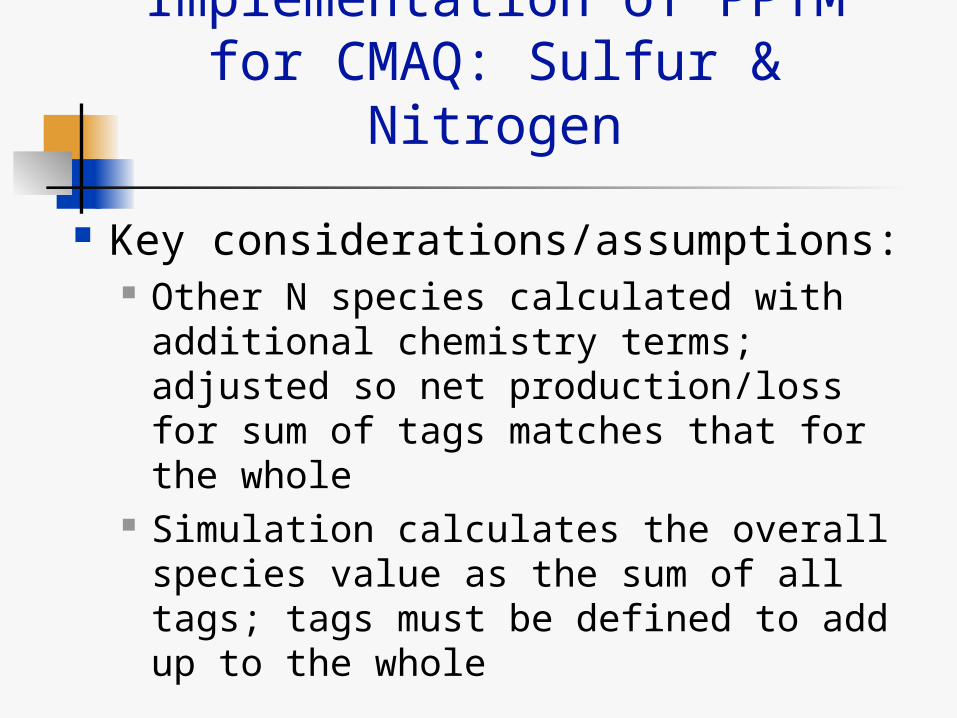
Implementation of PPTM for CMAQ: Sulfur & Nitrogen
Key considerations/assumptions: Other N species calculated with
additional chemistry terms; adjusted so net production/loss for sum of tags matches that for the whole
Simulation calculates the overall species value as the sum of all tags; tags must be defined to add up to the whole

Implementation of PPTM for CMAQ: Sulfur & Nitrogen
CPU requirements increased by approximately 15% for 3 S tags and 50% for 3 N tags
Documentation/user’s guide available from EPA or ICF as follows:
Douglas, S., T. Myers and Y. Wei. 2006. “ Implementation of
Sulfur and Nitrogen Tagging in the Community Multiscale Air Quality (CMAQ) Model.” Prepared for EPA, OAQPS, Research Triangle Park, NC. ICF International, San Rafael, California (06-076).

Example Sulfur Tagging Results

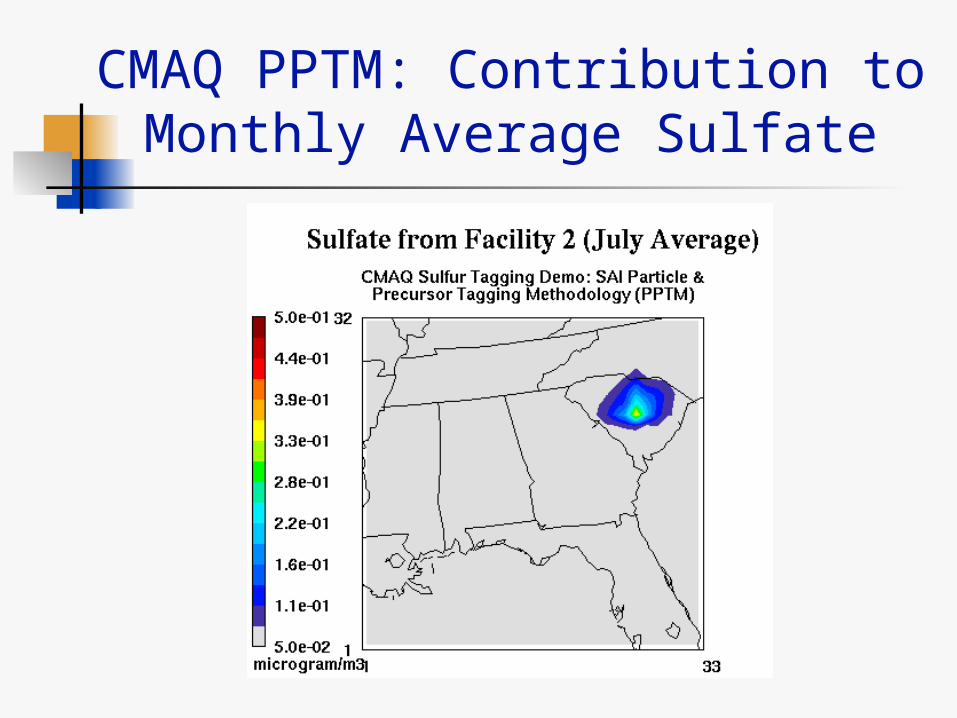
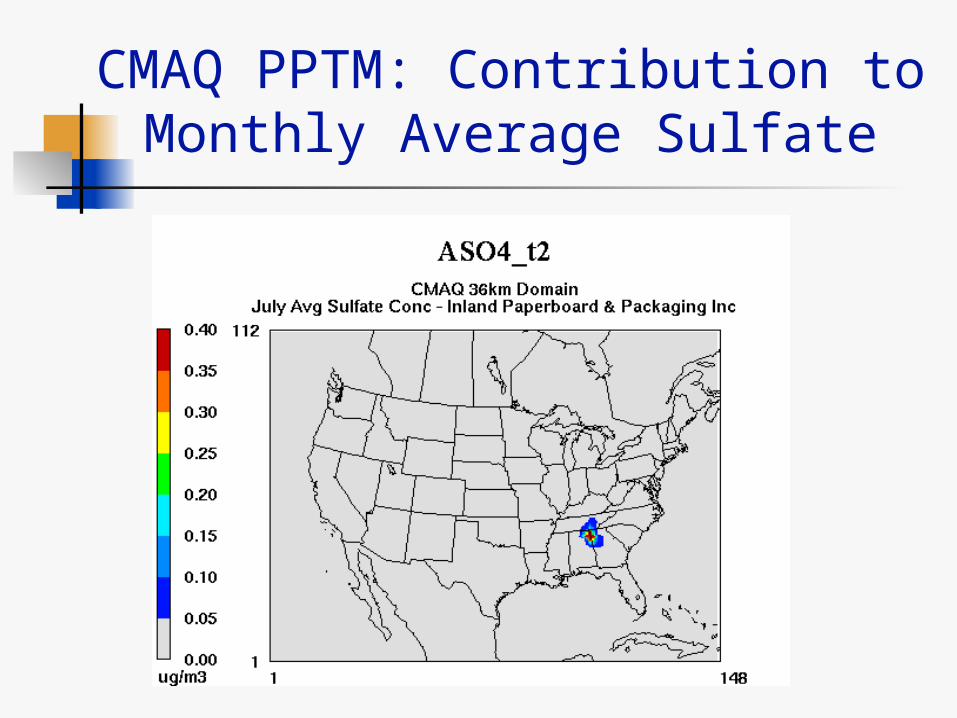
CMAQ PPTM: Contribution to Monthly Average Sulfate
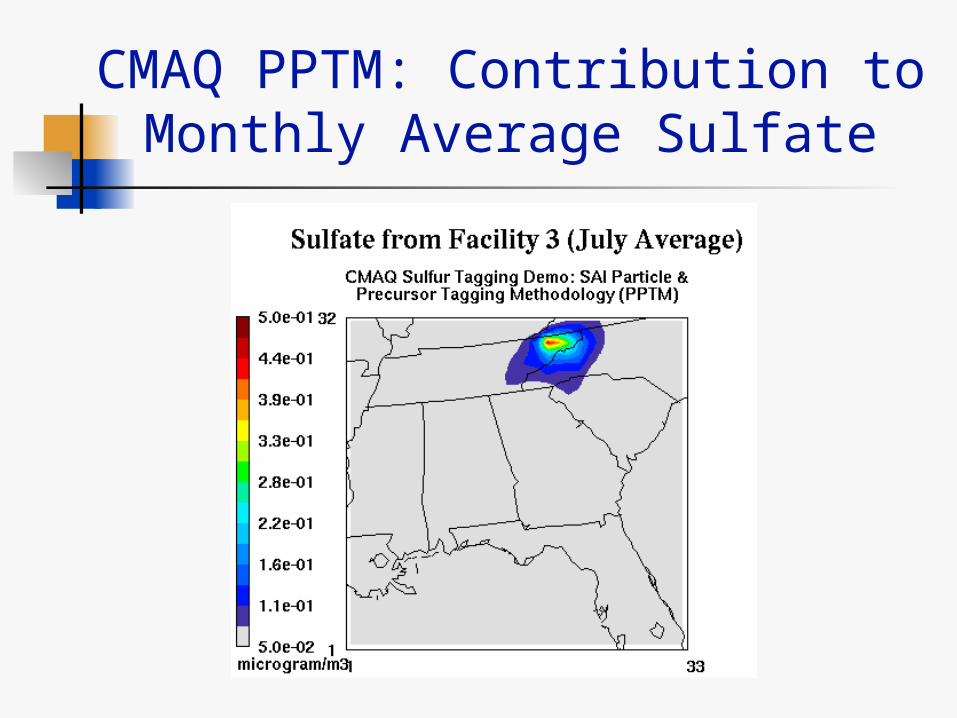
CMAQ PPTM: Contribution to Monthly Average Sulfate
CMAQ PPTM: Contribution to Monthly Average Sulfate
0
0.05
0.1
0.15
0.2
Great Smoky Mountains
Facility_1 Facility_2 Facility_3
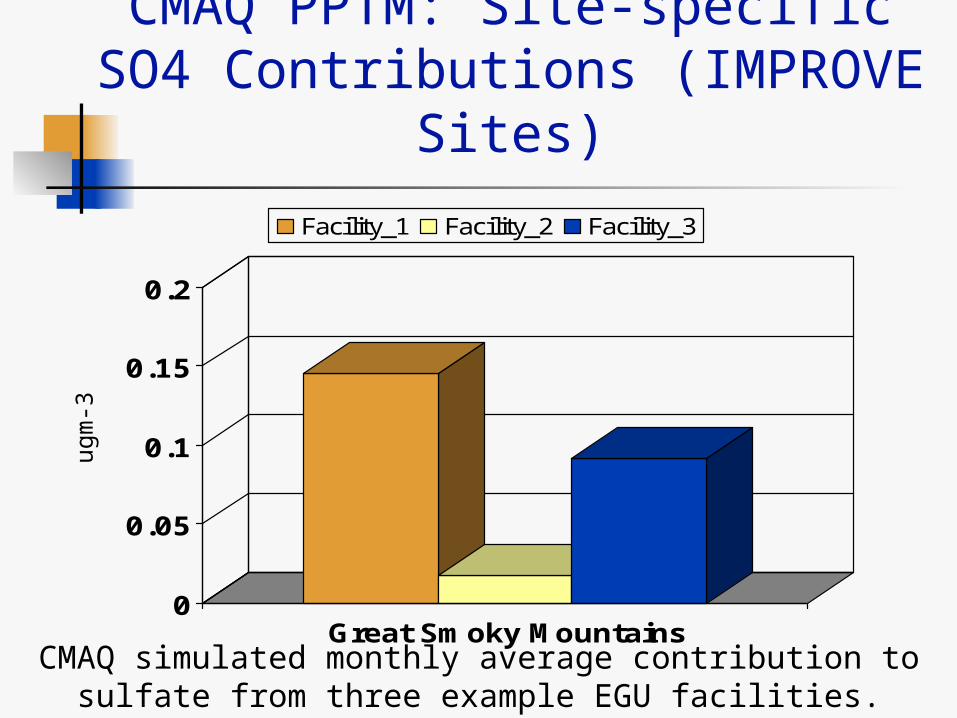
CMAQ PPTM: Site-specific SO4 Contributions (IMPROVE Sites)
ugm
-3
CMAQ simulated monthly average contribution to sulfate from three example EGU facilities.

Sulfur Tagging Application for the Pulp & Paper Sector
Based on CAIR 2010 modeling & emission inventory
1 month simulation period (July)(Annual simulation ongoing)
Tags applied for 10 pulp & paper sources and IC/BCs

CMAQ PPTM: Monthly Average Sulfate for July 2010
CMAQ PPTM: Contribution to Monthly Average Sulfate

CMAQ PPTM: Contribution to Monthly Average Sulfate

0
0.05
0.1
0.15
0.2
Great Smoky Mountains
Tag 1 Tag 2 Tag 3 Tag 4 Tag 5Tag 6 Tag 7 Tag 8 Tag 9 Tag 10
CMAQ PPTM: Site-specific SO4 Contributions (IMPROVE Sites)
ugm
-3
CMAQ simulated monthly average contribution to sulfate from regional pulp & paper facilities.

0
0.1
0.2
0.3
0.4
Chattanooga
Tag 1 Tag 2 Tag 3 Tag 4 Tag 5Tag 6 Tag 7 Tag 8 Tag 9 Tag 10
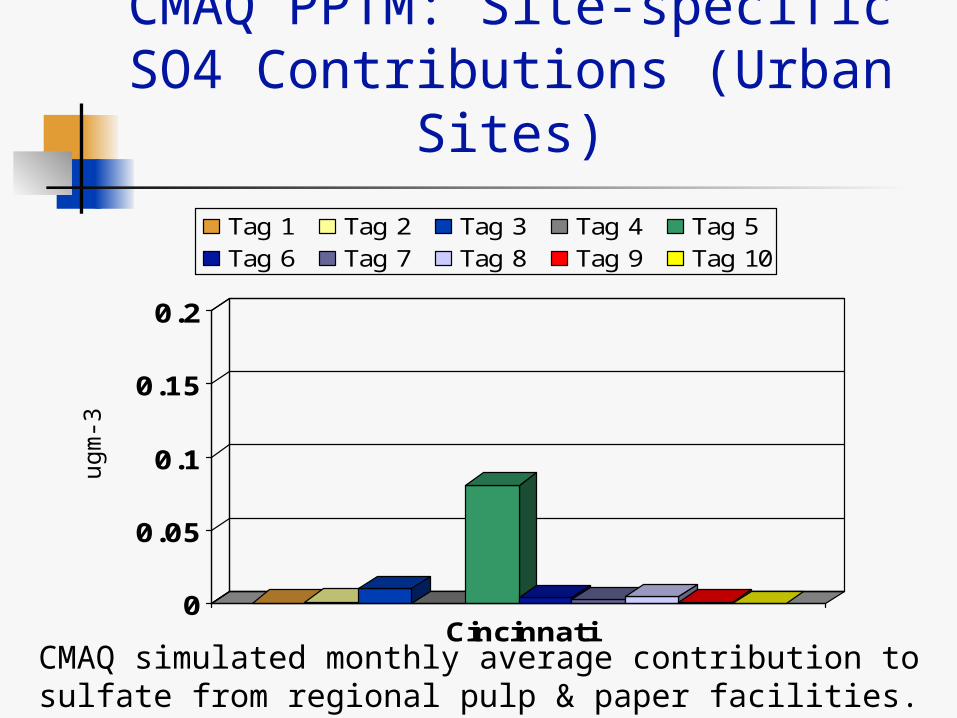
CMAQ PPTM: Site-specific SO4 Contributions (Urban Sites)
ugm
-3
CMAQ simulated monthly average contribution to sulfate from regional pulp & paper facilities.
0
0.05
0.1
0.15
0.2
Cincinnati
Tag 1 Tag 2 Tag 3 Tag 4 Tag 5Tag 6 Tag 7 Tag 8 Tag 9 Tag 10
CMAQ PPTM: Site-specific SO4 Contributions (Urban Sites)
ugm
-3
CMAQ simulated monthly average contribution to sulfate from regional pulp & paper facilities.
Example Nitrogen Tagging Results

0
1
2
3
4
5
6
ugm
-3 (
x 1
0-2
)
EGU Non-EGU Other Total Base Diff
-2
0
2
4
6
8
10
12
14
ppm
(x 1
0-4
)
EGU Non-EGU Other Total Base Diff
Example CMAQ PPTM Nitrogen Tagging Results: Great Smoky
Mtns
0
2
4
6
8
10
ugm
-3 (
x 1
0-1
)
EGU Non-EGU Other Total Base Diff
NH4
NO3
NOx
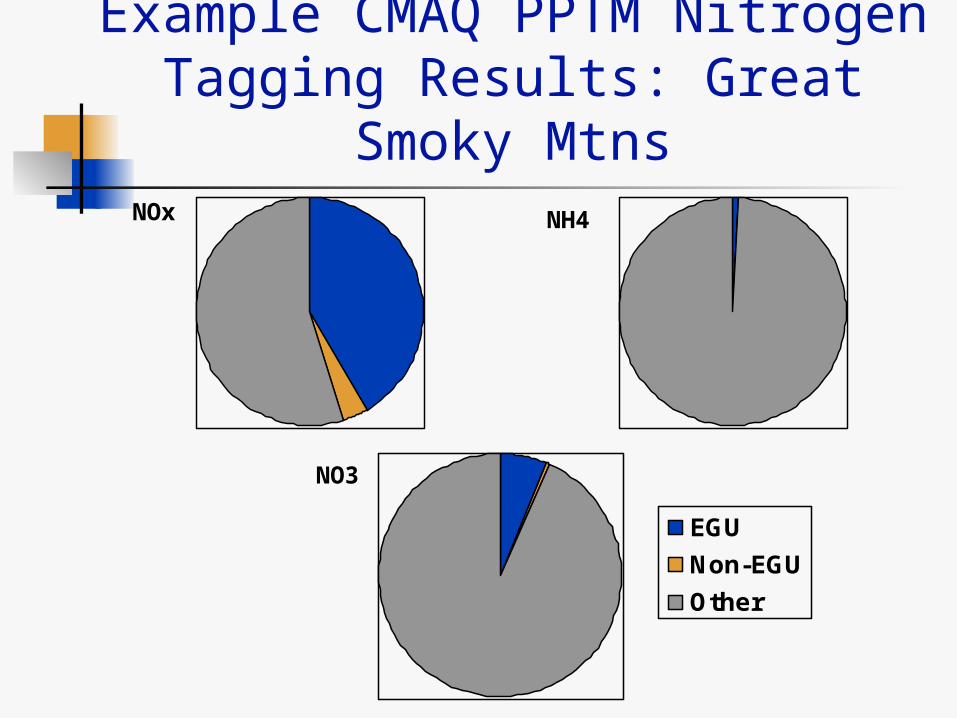
EGU
Non-EGU
Other
Example CMAQ PPTM Nitrogen Tagging Results: Great Smoky
MtnsNH4
NO3
NOx
Summary of CMAQ PPTM Status and Next Steps
PPTM has been successfully implemented in the CMAQ model for S, N (and Hg) and quantifies the contribution of tagged sources to simulated PM
Application & interpretation of results is straightforward (no hidden assumptions)
Initial test results indicate that numerical effects (uncertainties) are small, compared to contribution estimates
Next steps include Complete implementation for OC & EC Add OPTM (for ozone)


![Ppt a7.pptm [autoguardado]](https://img.dokumen.tips/doc/110x75/559076de1a28abd6118b4787/ppt-a7pptm-autoguardado.jpg)
![Ppt81.pptm [autosaved]](https://img.dokumen.tips/doc/110x75/549d0ef9b47959cf318b48f7/ppt81pptm-autosaved.jpg)

![Ppt1.pptm [salvo automaticamente]](https://img.dokumen.tips/doc/110x75/559076941a28abdb118b4756/ppt1pptm-salvo-automaticamente.jpg)
![ppt89.pptm [Autosaved]](https://img.dokumen.tips/doc/110x75/577dabf71a28ab223f8d41ad/ppt89pptm-autosaved.jpg)
![Ppt31.pptm [autoguardado]](https://img.dokumen.tips/doc/110x75/55995a031a28abd50a8b465a/ppt31pptm-autoguardado.jpg)
![Vincetitovikingo....pptm [autoguardado]](https://img.dokumen.tips/doc/110x75/559076251a28abed118b46f6/vincetitovikingopptm-autoguardado.jpg)


![Ppt185.pptm [autoguardado]](https://img.dokumen.tips/doc/110x75/5593309c1a28abaf7f8b4576/ppt185pptm-autoguardado.jpg)


![Ppt311.pptm [autosaved]](https://img.dokumen.tips/doc/110x75/554dda07b4c905d10e8b5003/ppt311pptm-autosaved.jpg)


![Ppt b620.pptm [autoguardado]](https://img.dokumen.tips/doc/110x75/58a487831a28ab58738b5dcb/ppt-b620pptm-autoguardado.jpg)
![Ppt50.pptm [autoguardado]](https://img.dokumen.tips/doc/110x75/58a688181a28ab94238b71a7/ppt50pptm-autoguardado-58ac9fc61153c.jpg)
![Ppt805 pptm [autosaved]](https://img.dokumen.tips/doc/110x75/568c3a781a28ab0235a654c0/ppt805-pptm-autosaved.jpg)
![Ppt5 f64.pptm [autoguardado]](https://img.dokumen.tips/doc/110x75/55c8a804bb61eb92098b480a/ppt5-f64pptm-autoguardado-55c9e2de736bb.jpg)
![Ppt a27.pptm [autosaved]](https://img.dokumen.tips/doc/110x75/559e92581a28ab173d8b45b7/ppt-a27pptm-autosaved.jpg)
![Ppt2913.pptm [autoguardado]](https://img.dokumen.tips/doc/110x75/55808cebd8b42a08768b472a/ppt2913pptm-autoguardado.jpg)


