Embed Size (px)
Citation preview
Implementation of Remedial Action Scheme for Frequency Stability in TNB
CEPSI 2016 1
IMPLEMENTATION OF REMEDIAL ACTION SCHEME FOR
FREQUENCY STABILITY IN TNB
Ahmad Zuhdi Muhamad Zamani
Tenaga Nasional Berhad
Engineering Department, Transmission Division
Level 19, Dua Sentral
Jalan Tun Sambathan, Kuala Lumpur
Nik Sofizan Nik Yusuf
Tenaga Nasional Berhad
Engineering Department, Transmission Division
Level 19, Dua Sentral
Jalan Tun Sambathan, Kuala Lumpur
ABSTRACT
One of major challenges to utilities in meeting rapid demand growth is in putting up infrastructures such as
building new power plants, substations and transmission lines. This is mainly due to economic factors and public
protest. As a result, transmission grid suffers stress and grid operations would be pushed to the limit.
This paper discusses the Remedial Action Scheme (RAS) implemented in Tenaga Nasional Berhad (TNB) to
mitigate the risk of frequency instability due to large generation loss by automatically initiating fast active power
compensation from HVDC and Hydro plants as well as Event Based Load Shedding (EBLS) scheme. EBLS scheme
calculates in real time the optimum quantum and location of load to be shed to maintain or regain the stability of
the power grid. The algorithm for the optimum quantum calculation takes into consideration the active power
reserve margin of HVDC and hydro plants, power flow in the network and preset priority of the load.
The Remedial Action Scheme integrates overload protection based on Dynamic Line Rating, adaptive load
shedding, HVDC and hydro plants control system in a single wide area protection, control and automation system.
The system consists of distributed automation processors named Real Time Application Platform (RTAP), control
intelligent electronic devices, Remote Terminal Units (RTU) as well as fast communication protocols between all
the equipment. The RAS has operated several times and prevented the power grid from frequency instability.
KEYWORDS: Remedial Action Scheme (RAS), Special Protection Scheme (SPS), System Integrity
Protection Scheme (SIPS), Transmission, Wide Area Protection, Real Time Application Platform (RTAP)
1. Introduction
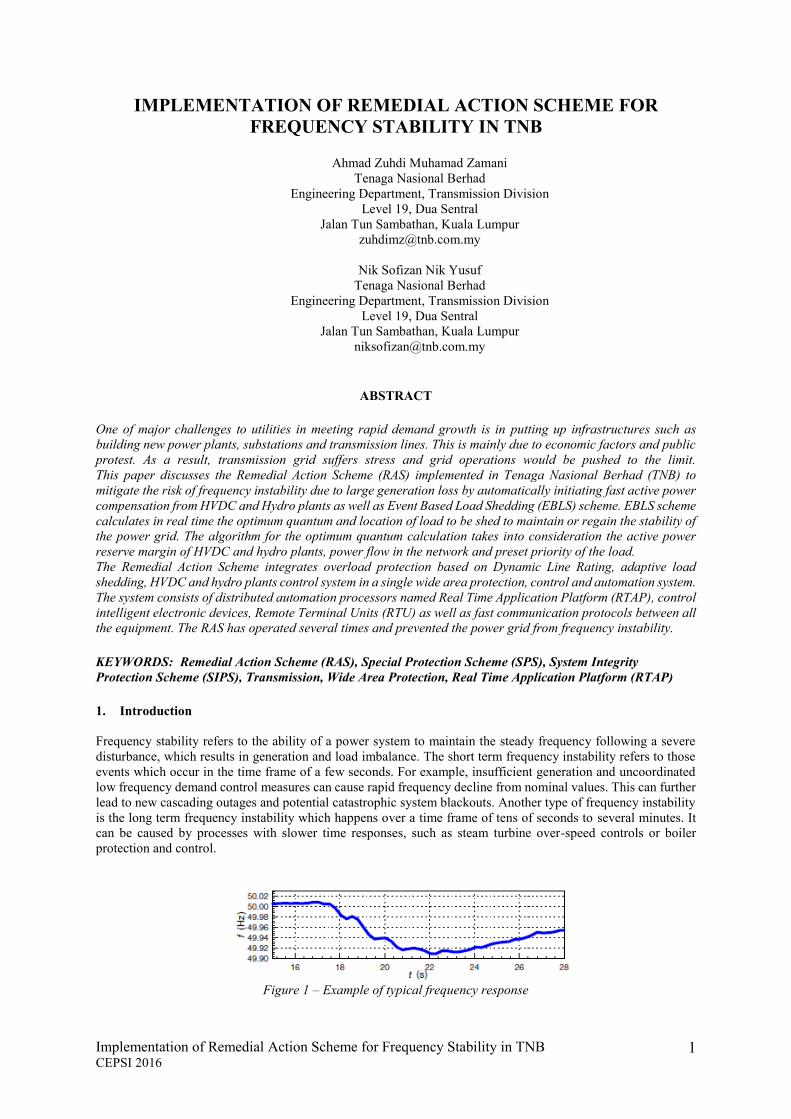
Frequency stability refers to the ability of a power system to maintain the steady frequency following a severe
disturbance, which results in generation and load imbalance. The short term frequency instability refers to those
events which occur in the time frame of a few seconds. For example, insufficient generation and uncoordinated
low frequency demand control measures can cause rapid frequency decline from nominal values. This can further
lead to new cascading outages and potential catastrophic system blackouts. Another type of frequency instability
is the long term frequency instability which happens over a time frame of tens of seconds to several minutes. It
can be caused by processes with slower time responses, such as steam turbine over-speed controls or boiler
protection and control.
Figure 1 – Example of typical frequency response
Implementation of Remedial Action Scheme for Frequency Stability in TNB
CEPSI 2016 2
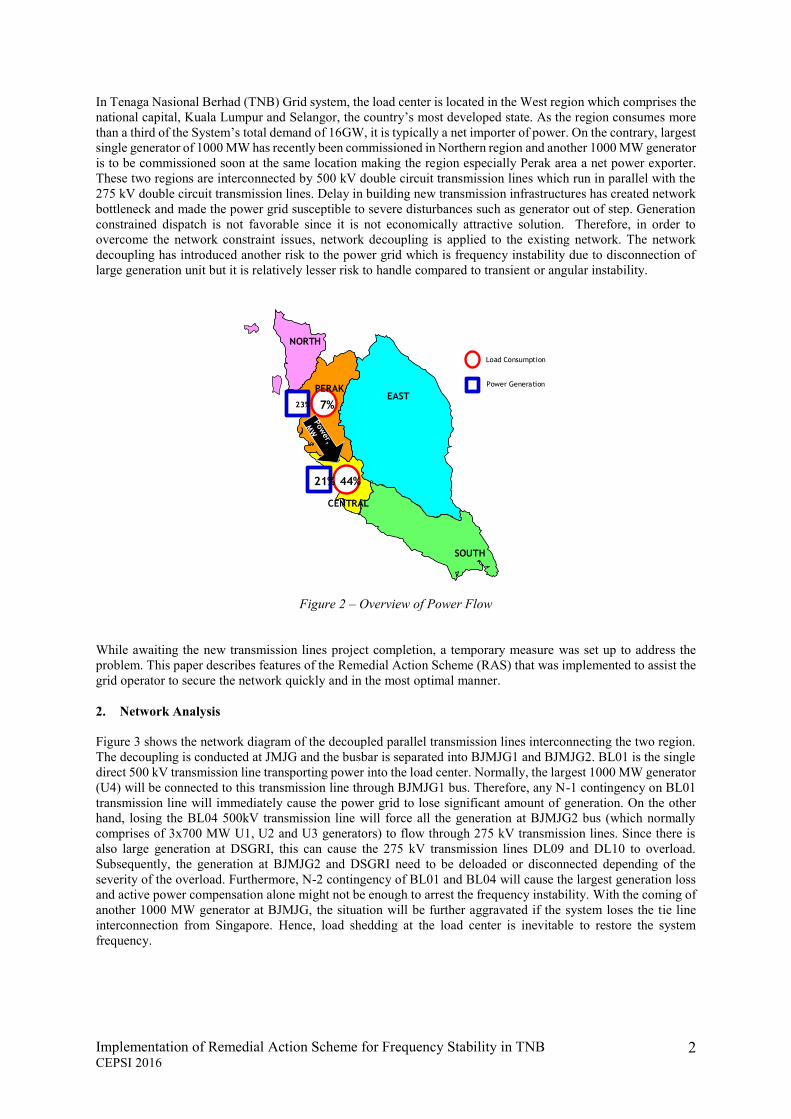
In Tenaga Nasional Berhad (TNB) Grid system, the load center is located in the West region which comprises the
national capital, Kuala Lumpur and Selangor, the country’s most developed state. As the region consumes more
than a third of the System’s total demand of 16GW, it is typically a net importer of power. On the contrary, largest
single generator of 1000 MW has recently been commissioned in Northern region and another 1000 MW generator
is to be commissioned soon at the same location making the region especially Perak area a net power exporter.
These two regions are interconnected by 500 kV double circuit transmission lines which run in parallel with the
275 kV double circuit transmission lines. Delay in building new transmission infrastructures has created network
bottleneck and made the power grid susceptible to severe disturbances such as generator out of step. Generation
constrained dispatch is not favorable since it is not economically attractive solution. Therefore, in order to
overcome the network constraint issues, network decoupling is applied to the existing network. The network
decoupling has introduced another risk to the power grid which is frequency instability due to disconnection of
large generation unit but it is relatively lesser risk to handle compared to transient or angular instability.
44%21%
7%23%EAST
SOUTH
NORTH
PERAK
CENTRAL
Load Consumption
Power Generation
Figure 2 – Overview of Power Flow
While awaiting the new transmission lines project completion, a temporary measure was set up to address the
problem. This paper describes features of the Remedial Action Scheme (RAS) that was implemented to assist the
grid operator to secure the network quickly and in the most optimal manner.
2. Network Analysis
Figure 3 shows the network diagram of the decoupled parallel transmission lines interconnecting the two region.
The decoupling is conducted at JMJG and the busbar is separated into BJMJG1 and BJMJG2. BL01 is the single
direct 500 kV transmission line transporting power into the load center. Normally, the largest 1000 MW generator
(U4) will be connected to this transmission line through BJMJG1 bus. Therefore, any N-1 contingency on BL01
transmission line will immediately cause the power grid to lose significant amount of generation. On the other
hand, losing the BL04 500kV transmission line will force all the generation at BJMJG2 bus (which normally
comprises of 3x700 MW U1, U2 and U3 generators) to flow through 275 kV transmission lines. Since there is
also large generation at DSGRI, this can cause the 275 kV transmission lines DL09 and DL10 to overload.
Subsequently, the generation at BJMJG2 and DSGRI need to be deloaded or disconnected depending of the
severity of the overload. Furthermore, N-2 contingency of BL01 and BL04 will cause the largest generation loss
and active power compensation alone might not be enough to arrest the frequency instability. With the coming of
another 1000 MW generator at BJMJG, the situation will be further aggravated if the system loses the tie line
interconnection from Singapore. Hence, load shedding at the load center is inevitable to restore the system
frequency.

Implementation of Remedial Action Scheme for Frequency Stability in TNB
CEPSI 2016 3
DBTRK1
DSGRI1
U1U4 U3 U2
1 x 1000MW
BJMJG1
3 x 700MW
BJMJG2
BATWR2
BBTRK1
BKPAR1DKULN1
DKPAR1
BL01
BL04
BL05 BL06
DL11 DL12
GB1 GB2 GB3
3 x 650MW
DATWR1
DL09 DL10
U5
1 x 1000MW (Coming)
BL02BL14BL13
Figure 3 – Network Diagram of 500kV and 275kV System
Dynamic system simulation was conducted to assess the situation accurately. Worst case scenarios where
maximum power at and from the Northern region to the load center were simulated under various contingencies.
Figure 4 – Generator Machine Angles

Implementation of Remedial Action Scheme for Frequency Stability in TNB
CEPSI 2016 4
Figure 4 depicts all the generator angles in the TNB power grid following the N-2 BL01 and BL04 contingency.
It can be seen that without decoupling of the busbar, generator out of step condition is detected less than 2 seconds
after the 500 kV transmission lines are loss. Generators in the central and south regions deviated from the eastern
and northers regions. Therefore, network decoupling is required to ensure generator out of step condition is
prevented.
Figure 5 – Loss of Generation
Figure 5 above shows the frequency response of the system upon losing 1400 MW and 1700 MW generation
respectively. The frequency will drop rapidly until Under Frequency Load Shedding (UFLS) Stage 1 is triggered
at 49.3 Hz. Load shedding is not desirable when active power compensation from HVDC and hydro plants can be
utilized. Figure 6 below shows that larger quantum of UFLS is required to prevent from losing the tie line at
frequency reaching 49.1. This happens in the event of losing who BJMJG. The implementation of Event Based
Load Shedding (EBLS) will prevent larger quantum of load shedding by the UFLS.
Figure 6 – Loss of Generation and Tie Line

Implementation of Remedial Action Scheme for Frequency Stability in TNB
CEPSI 2016 5
Figure 7 – Transmission Lines and Transformers Overloading
Transmission lines and transformers overloading following N-1 BL04 contingency can be seen in Figure 7. The
worst overload is 153% on the 275kV ATWR-BGJH lines. Therefore, generation shedding at JMJG and SGRI is
required to mitigate the overload on 275kV lines and transformers. This generation shedding will cause the
frequency to drop and active power compensation is needed to restore the frequency. Figure 8 below illustrate the
power system frequency response upon 1 unit of JMJG at 2s, 30s and 40s respectively.
Figure 8 – Frequency Response
Implementation of Remedial Action Scheme for Frequency Stability in TNB
CEPSI 2016 6
3. Remedial Action Scheme (RAS) System Features
The Remedial Action Scheme is a solution for the frequency instability and network overloading problem. It
consists of the following features:
Generation Deficiency Compensation (GDC)
Overload Protection based on Dynamic Line Rating (DLR)
Event Based Load Shedding (EBLS)
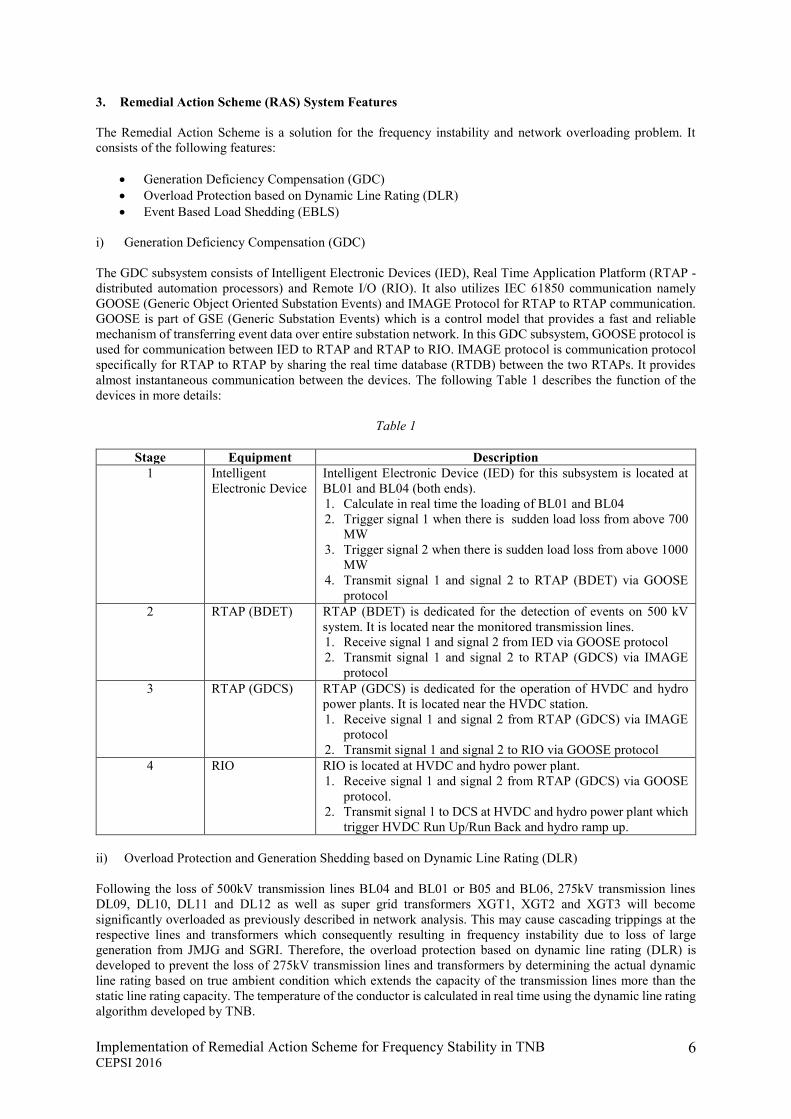
i) Generation Deficiency Compensation (GDC)
The GDC subsystem consists of Intelligent Electronic Devices (IED), Real Time Application Platform (RTAP -
distributed automation processors) and Remote I/O (RIO). It also utilizes IEC 61850 communication namely
GOOSE (Generic Object Oriented Substation Events) and IMAGE Protocol for RTAP to RTAP communication.
GOOSE is part of GSE (Generic Substation Events) which is a control model that provides a fast and reliable
mechanism of transferring event data over entire substation network. In this GDC subsystem, GOOSE protocol is
used for communication between IED to RTAP and RTAP to RIO. IMAGE protocol is communication protocol
specifically for RTAP to RTAP by sharing the real time database (RTDB) between the two RTAPs. It provides
almost instantaneous communication between the devices. The following Table 1 describes the function of the
devices in more details:
Table 1
Stage Equipment Description
1 Intelligent
Electronic Device
Intelligent Electronic Device (IED) for this subsystem is located at
BL01 and BL04 (both ends).
1. Calculate in real time the loading of BL01 and BL04
2. Trigger signal 1 when there is sudden load loss from above 700
MW
3. Trigger signal 2 when there is sudden load loss from above 1000
MW
4. Transmit signal 1 and signal 2 to RTAP (BDET) via GOOSE
protocol
2 RTAP (BDET) RTAP (BDET) is dedicated for the detection of events on 500 kV
system. It is located near the monitored transmission lines.
1. Receive signal 1 and signal 2 from IED via GOOSE protocol
2. Transmit signal 1 and signal 2 to RTAP (GDCS) via IMAGE
protocol
3 RTAP (GDCS) RTAP (GDCS) is dedicated for the operation of HVDC and hydro
power plants. It is located near the HVDC station.
1. Receive signal 1 and signal 2 from RTAP (GDCS) via IMAGE
protocol
2. Transmit signal 1 and signal 2 to RIO via GOOSE protocol
4 RIO RIO is located at HVDC and hydro power plant.
1. Receive signal 1 and signal 2 from RTAP (GDCS) via GOOSE
protocol.
2. Transmit signal 1 to DCS at HVDC and hydro power plant which
trigger HVDC Run Up/Run Back and hydro ramp up.
ii) Overload Protection and Generation Shedding based on Dynamic Line Rating (DLR)
Following the loss of 500kV transmission lines BL04 and BL01 or B05 and BL06, 275kV transmission lines
DL09, DL10, DL11 and DL12 as well as super grid transformers XGT1, XGT2 and XGT3 will become
significantly overloaded as previously described in network analysis. This may cause cascading trippings at the
respective lines and transformers which consequently resulting in frequency instability due to loss of large
generation from JMJG and SGRI. Therefore, the overload protection based on dynamic line rating (DLR) is
developed to prevent the loss of 275kV transmission lines and transformers by determining the actual dynamic
line rating based on true ambient condition which extends the capacity of the transmission lines more than the
static line rating capacity. The temperature of the conductor is calculated in real time using the dynamic line rating
algorithm developed by TNB.

Implementation of Remedial Action Scheme for Frequency Stability in TNB
CEPSI 2016 7
Therefore, the overload time can be prolonged until the conductor temperature reaches the preset value. Should
the overloading condition persists, controlled generation shedding will be executed either by deloading or tripping
the generators. The selection of generators to be shed or tripped is determined optimally by taking into
consideration the percentage of overload at the transmission lines and each generator’s loading. Therefore,
frequency instability can be prevented. The following Table 2 explained the normal step by step procedure of how
this advance protection works:
Table 2
Stage Equipment Description
1 Intelligent
Electronic
Device (IED)
Intelligent Electronic Device (IED) for this subsystem is located at DL09, DL10,
DL11 and DL12 (both ends) and XGT1, XGT2 and XGT3 (HV and LV).
It measures the total loading of the four lines and send it to RTAP (DDET) for
Conductor Temperature Computation (CTC) via MMS protocol.
The IEDs also transmit the severity of the overloading condition based on the
following characteristic via GOOSE protocol:
Element Loading Level Characteristic
49L Low overload level
I >110%
Time delayed Definite Time
Overcurrent
49H High overload level
I > 150%,
Time delayed Definite Time
Overcurrent
For transformer, the IEDs monitor the winding temperature alarm and transmit the
alarm to RTAP (DDET) once activated via GOOSE protocol.
2 RTAP
(DDET)
RTAP (DDET) is dedicated for the detection of events on 275 kV system. It is
located near the monitored transmission lines.
It calculates initial conductor temperature at DL09, DL10, DL11 and DL12 lines
based on the followings:
load current
ambient temperature
solar radiation
estimated wind speed and angle at critical tower span
The Conductor Temperature Computation (CTC) which is 49M element predicts
the time it takes for the transmission lines conductor to reach certain values before
tripping of generator unit is inevitable. Its function will be elaborated more.
Element Loading Level Characteristic
49M Medium overload level
130% < I < 150%
Conductor Temperature
Computation
RTAP (DDET) will determine whether the overload condition is due to N-1 BL04
loss by receiving the tripping signal of BL04 or BL01 from RTAP (BDET). RTAP
(DDET) subsequently compares the information from RTAP (BDET), IEDs and
its CTC and sends control signal to RTAP (JGSS) and RTAP (SGSS) at the JMJG
and SGRI power plants whether to trip or deload generator units based on the
severity of overload determined previously.

Implementation of Remedial Action Scheme for Frequency Stability in TNB
CEPSI 2016 8
3 RTAP (JGSS)
RTAP (SGSS)
RTAP (JGSS) and RTAP (SGSS) are dedicated for the control and monitoring of
the JMJG and SGRI power plants respectively. It is located near the power plants.
Both RTAPs create generation shedding table which automatically selects the most
optimum generators based on the severity of the transmission lines overload given
by RTAP (DDET) or that are armed manually by the control center.
Based on the information received from RTAP (DDET) and the generator selected,
it will send control signal to the selected generators whether to deload or trip via
GOOSE protocol.
5 RIO RIO is also located at JMJG and SGRI power plant.
1. Receive deload or trip signal from RTAP (JGSS) or RTAP (SGSS) via
GOOSE protocol
2. Transmit deload or trip signals to DCS at JMJG or SGRI power plant.
The following Figure 9 illustrates the response action of the overload protection system according to loading
level:
49L
49M
49H
5S
30m
Initiate Load Shedding
Initiate Alarm and Load Reduction
Initiate Load Shedding
Initiate Load Shedding
60s
Figure 9 – Response Action
Legends:
Element Loading Level Characteristic
49L Low overload level
I >100%
Time delayed Definite Time
Overcurrent
49M Medium overload level
100% < I < 150%
Conductor Temperature
Computation
49H High overload level
I > 150%,
Time delayed Definite Time
Overcurrent
The 49M element is a Conductor Temperature Computation (CTC) type which is Dynamic Line Rating (DLR)
using measurement of some or all of the followings:
Ambient temperature
Solar radiation
Wind speed and
Wind angle
The 49M is based on Inverse Time characteristic. As the degree of overload increases, the allowable overload
duration decreases. The general relationship between overload rate and allowable duration is shown in the
following graph:

Implementation of Remedial Action Scheme for Frequency Stability in TNB
CEPSI 2016 9
Figure 10 – Inverse Time Characteristic
iii) Event Based Load Shedding Scheme (EBLS)
With the coming of another 1000 MW generator (U5) at JMJG and another 1200 MW generation power plants in
the further northern region, GDC scheme might not be sufficient to arrest the frequency instability upon N-2 BL01
and BL04 contingency. The situation will be further aggravated if the tie line connecting Malaysian and Singapore
power grid trips on overload. Therefore, load shedding in the load center must be done in order to prevent UFLS
from operated. This is because the load shedding quantum for UFLS is a lot more than EBLS. Based on the
simulation conducted, the load shedding quantum will be a lot less if the load shedding is operated faster (upon
detection of N-2 contingency) and before the tie line trips on overload. EBLS involves in total 28 132kV
substations in central and southern regions with total combined load of approximately 1500 MW. It is divided
into 3 preset groups depending on the contingencies and power flow. The following Table 3 describes the function
of the devices in more details:
Table 3
Stage Equipment Description
1 Intelligent
Electronic Device
Intelligent Electronic Device (IED) for this subsystem is located at 28
substations in central and southern region.
1. Calculate in real time the loading of the substation
2. Send the loading data to RTAP (EBLS) via MMS protocol
3. Receive tripping signal from RTAP (EBLS) if its loading is
selected and energize the trip coil.
2 RTAP (EBLS) RTAP (EBLS) is dedicated for the control and monitoring of all 28
132 kV substations involved.
1. Receive 500 kV contingency signals from RTAP (BDET) via
GOOSE protocol as previously described in GDC subsystem
2. Receive loading data from IEDs at 28 substations via MMS
protocol
3. Calculate the optimum number of load based on the given
quantum and loading data.
4. Preset the loads into 3 groups of operation using selection
algorithm.
5. Send tripping signal to the selected load following contingency
via GOOSE protocol.

Implementation of Remedial Action Scheme for Frequency Stability in TNB
CEPSI 2016 10
4. System Implementation
The overall system architecture of this frequency stability remedial action scheme named E-ATTEND
(Enhanced Ayer Tawar Tripping and Deloading) which consists of the Detection part, Calculation part and
Control part as shown in figure below:
ATWR_BDET_RTAP1
LAN 5
BTRK
BRTK_BL05_IED9
BRTK_BL06_IED10
LAN 5
KPAR_HVXGT4_IED31
KPAR_HVXGT5_IED33
LAN 5
KPAR
PGAUPGAU_RBCK_
HIED1
PI Historian
COIT_SMGT_PORTAL
CONTROL ROOM
ATWR
COIT_SMGT_RTAP13
PLTG
ATWR_BDET_RTAP2 ATWR_DDET_RTAP3
LAN 23
ATWR_DDET_RTAP4
LAN 24
BRTK_HVXGT6_IED43
BRTK_HVXGT7_IED45BRTK_HVXGT8_IED51
JMJG
JMJG_BL01_IED1
JMJG_BL02_IED2
LAN 5
JMJG_U4_IED37
JMJG_BL13_IED35
JMJG_BL14_IED36
BTRK
BTRK_BL01_IED7
BTRK_BL04_IED8
LAN 6
BTRK_LVXGT6_IED44
BTRK_LVXGT7_IED46BTRK_LVXGT8_IED52
ATWR_BL13_IED3
ATWR_BL02_IED4
ATWR_BL14_IED5
ATWR_LVXGT1_IED26ATWR_LVXGT2_IED28ATWR_LVXGT3_IED30
KPAR
KPAR_BL05_IED11
KPAR_BL06_IED12
LAN 6
KPAR_LVXGT4_IED32
KPAR_LVXGT5_IED34
LAN 6
ATWR_BL04_IED6
ATWR_HVXGT1_IED25
ATWR_HVXGT2_IED27
ATWR_HVXGT3_IED29
BTRK
BTRK_DL11_IED17
BTRK_DL12_IED18
LAN 23
BGJH
BGJH_DL15_IED39
BGJH_DL16_IED40
LAN 23
JJNG
JJNG_DL07_IED21
JJNG_DL08_IED22
LAN 23
SGRI
SGRI_DL09_IED13
SGRI_DL10_IED14
LAN 23
PAPN
PAPN_EL17_IED47
PAPN_EL18_IED48
LAN 23
ATWR_DL07_IED23
ATWR_DL08_IED24
KULN
KULN_DL11_IED19
KULN_DL12_IED20
LAN 24
BTRK
BTRK_DL15_IED41
BTRK_DL16_IED42
LAN 24
BJGH
BGJH_DL09_IED15
BGJH_DL10_IED16
LAN 24
PKID
PKID_EL17_IED49
PKID_EL18_IED50
LAN 24
NLDC
NLDC_SMGT_RTAP12
CORPORATE
NETWORK
COIT_SMGT_RTAP17
NEXGATE
DATA
CENTRE
Figure 11 – Overall System Architecture
The lower part of the architecture depicts the detection part while the upper part represents the control part. The
philosophical architecture for this scheme required every functional devices such as IED, RTAP and
communication LAN must have at least one redundancy. Communication is very crucial in the operation of this
scheme whereby 3 LAN connection is used to connect all the RTAPs. Meanwhile, each substation and power
plants also have their own internal LAN for communication to the RTAP. LAN 3 specifically is used as
monitoring LAN to gather all the information in this scheme and feeding it to the control center. All the
information is also recorded in the historian server and can be reviewed at any time. Access to the system is
controlled using special portal for protection against cyber security threats. Not included in the picture is the
architecture of Event Based Load Shedding Scheme which comes later after the second 1000 MW generator (U5)
at JMJG is commissioned.
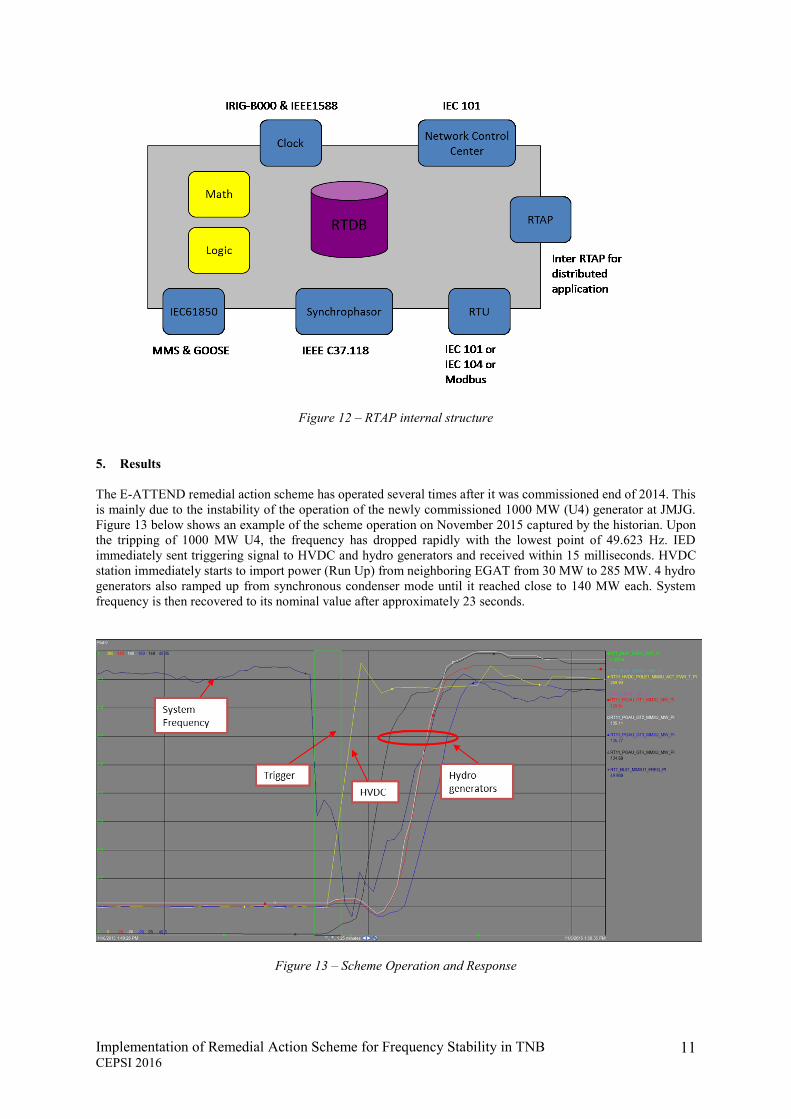
The key success factor for this project is the Real Time Application Platform (RTAP). RTAP is TNB own
distributed processing unit developed in house by TNB Research group. The RTAP supports interface to other
Intelligent Electronic Devices (IED) using IEC61850, IEEEC37.118, IEC870-5-101 and Modbus protocols.
RTAP to RTAP communication enables the formation of distributed system architecture. RTAP also supports
formation of user defined algorithm and programmable logics which make it flexible to provide solution to power
system problem. All the algorithms that are applied to the RAS system such as Conductor Temperature Calculation
(CTC), Generation Deficiency Compensation (GDC) selection, and Event Based Load Shedding (EBLS) selection
run in RTAP mathematical engine. Figure 12 below illustrates the block diagram of RTAP internal structure.
Implementation of Remedial Action Scheme for Frequency Stability in TNB
CEPSI 2016 11
Figure 12 – RTAP internal structure
5. Results
The E-ATTEND remedial action scheme has operated several times after it was commissioned end of 2014. This
is mainly due to the instability of the operation of the newly commissioned 1000 MW (U4) generator at JMJG.
Figure 13 below shows an example of the scheme operation on November 2015 captured by the historian. Upon
the tripping of 1000 MW U4, the frequency has dropped rapidly with the lowest point of 49.623 Hz. IED
immediately sent triggering signal to HVDC and hydro generators and received within 15 milliseconds. HVDC
station immediately starts to import power (Run Up) from neighboring EGAT from 30 MW to 285 MW. 4 hydro
generators also ramped up from synchronous condenser mode until it reached close to 140 MW each. System
frequency is then recovered to its nominal value after approximately 23 seconds.
Figure 13 – Scheme Operation and Response

Implementation of Remedial Action Scheme for Frequency Stability in TNB
CEPSI 2016 12
6. Conclusions
The E-ATTEND project is considered a highly successful remedial action scheme (RAS) solution to manage
constraints in TNB’s grid system. The scheme has operated several times since its commissioning in 2014 and
saved the grid system from frequency instability problem or unnecessary load shedding. Therefore, the reliability
of the scheme is proven. In terms of cost savings, the returns of investment (ROI) of this project took only several
months given the fact that it has released the cheap generation that is previously supposed to be curtailed due to
N-2 contingency. In addition, by preventing unnecessary UFLS operation, the scheme has not just save TNB from
revenue loss, but also its image as the biggest utility company in Malaysia. Even though, in this case the system
serves as a temporary measure before the line upgrading project is completed, this same concept can be applied
elsewhere where contingencies beyond (N-1) is involved. This is so as no utilities would expand their transmission
networks to withstand contingencies beyond (N-1) as it would be very costly. New transmission projects can also
be deferred thus saving CAPEX cost in the long run.
In conclusion, the remedial action scheme (RAS) discussed in this paper is an invaluable tool to TNB in terms of
short term solution to operational issues; on the other hand the potential applications are limitless and can be
expended to be one of the options for planning the grid expansion. The Grid System Operator (GSO) now is able
to operate the power grid more cost effectively and therefore boosts confidence among the TNB top management
to adopt more RAS in the future.
References
[1] B. Hoseinzadeh, F. Faria Da Silva, and C. L. Bak, “Power system stability using decentralized under
frequency and voltage load Shedding,” PES Gen. Meet. Conf. Expo. 2014 IEEE, pp. 1–5, 2014.
[2] P. Kundur, Power system stability and control. 1994.
[3] P. Kundur, J. Paserba, V. Ajjarapu, G. Andersson, a Bose, C. Canizares, N. Hatziargyriou, D. Hill, a
Stankovic, C. Taylor, T. Van Cutsem, and V. Vittal, “Definition and classification of power system
stability,” IEEE Trans. Power Syst., vol. 19, pp. 1387–1401, 2004.
[4] P. Kundur, J. Paserba, V. Ajjarapu, G. Andersson, A. Bose, T. Van Cutsem, C. Canizares, N.
Hatziargyriou, D. Hill, V. Vittal, A. Stankovic, and C. Taylor, “Definition and Classification of Power
System Stability IEEE/CIGRE Joint Task Force on Stability Terms and Definitions,” IEEE Trans.
Power Syst., vol. 19, no. 3, pp. 1387–1401, 2004.
[5] M. A. Mustafa, N. S. N. Yusuf, V. V Terzija, and S. Member, “Development of Wide Area Monitoring
and Control Applications in Malaysia,” pp. 1–8, 2009.
[6] A. Saffarian and M. Sanaye-Pasand, “Enhancement of power system stability using adaptive
combinational load shedding methods,” IEEE Trans. Power Syst., vol. 26, no. 3, pp. 1010–1020, 2011.
[7] J. A. Short, D. G. Infield, and L. L. Freris, “Stabilization of grid frequency through dynamic demand
control,” IEEE Trans. Power Syst., vol. 22, no. 3, pp. 1284–1293, 2007.
[8] J. Tang, J. Liu, F. Ponci, and A. Monti, “Adaptive load shedding based on combined frequency and
voltage stability assessment using synchrophasor measurements,” IEEE Trans. Power Syst., vol. 28, no.
2, pp. 2035–2047, 2013.
[9] D. Trudnowski, M. Donnelly, and E. Lightner, “Power-system frequency and stability control using
decentralized intelligent loads,” in Proceedings of the IEEE Power Engineering Society Transmission
and Distribution Conference, 2006, pp. 1453–1459.
[10] Tokyo Electric Power Company (2008), Technical Support on the Application of Overload Protection
Scheme, (Internal Report).
[11] TNB Working Group on Overload Protection (2008), Guide on Overloading of TNB Transmission
Lines EG310808-OHL_OVERLOAD, (Internal Report).